
Ecosystem Resistance and Resilience after Dry and Wet Events across Central Asia Based on Remote Sensing Data
1
Ecology Postdoctoral Research Station, Xinjiang University, Urumqi 830046, China
2
College of Geography and Remote Sensing Sciences, Xinjiang University, Urumqi 830046, China
3
Xinjiang Key Laboratory of Oasis Ecology, Xinjiang University, Urumqi 830046, China
4
Key Laboratory of Smart City and Environment Modelling of Higher Education Institute, Xinjiang University, Urumqi 830046, China
5
School of Environment and Planning, Liaocheng University, Liaocheng 252000, China
*
Author to whom correspondence should be addressed.
Remote Sens. 2023, 15(12), 3165; https://doi.org/10.3390/rs15123165
Submission received: 4 May 2023
/
Revised: 6 June 2023
/
Accepted: 16 June 2023
/
Published: 18 June 2023
(This article belongs to the Special Issue Exploring the Variations and Interplay of Drought and Heatwaves: Uncovering the Associated Mechanisms and Impacts)
Abstract
:Climate change forecasts indicate that the frequency and intensity of extreme climate events will increase in the future; these changes will have important effects on ecosystem stability and function. An important arid region of the world, Central Asia has ecosystems that are extremely vulnerable to extreme weather events. However, few studies have investigated the resistance and resilience of this region’s ecosystems to extreme weather events. In this study, first, the extreme drought/wet threshold was calculated based on the 113-year (1901–2013) standardized precipitation–evapotranspiration index (SPEI); second, moderate resolution imaging spectroradiometer (MODIS) remote sensing data were applied to calculate ecosystem water use efficiency (WUE) and quantify ecosystem resistance and resilience after different extreme climate events; and finally, differences in the changes of various ecosystem types before and after climate events were assessed. The results showed the following: (1) The average SPEI was 0.073, and the thresholds of extreme wetness and drought were 0.91 and −0.67, respectively. Central Asia experienced extreme wet periods in 2002 and 2003 and a drought period in 2008. (2) Suitable wetness levels can increase the resistance of an ecosystem; however, continuous wetness reduces ecosystem resistance, as does drought. Wet areas had strong resilience after wet events, and arid areas had strong resilience after drought events. (3) During both wet and drought years, the transition between shrubland and grassland caused changes in ecosystem resistance and resilience. These findings are important for understanding the impact of future climate change on ecosystem stability.
1. Introduction
Extreme climate events have received extensive attention in environmental science, ecology, hydrology, meteorology, geography, and agriculture [1,2,3,4] and are the most destructive natural events in the global economy and ecology [5].As reported by the Intergovernmental Panel on Climate Change (IPCC), the frequency and intensity of global drought events will increase in the context of global increased temperature and decreased precipitation [6]. Drought events usually cause major changes in the carbon–water cycle in an ecosystem, especially in arid areas with weak ecosystem stability [7,8]. Central Asia is a typical arid area. Studies have reported that a serious drought occurred in Central Asia in 2008 [9,10]. The grassland in northwestern Kazakhstan (KAZ) is in arid or severely arid areas. The grassland has been degraded on a large scale [9]. The 2008 drought event makes Central Asia an important case study of drought resistance changes in arid ecosystems. However, it is unclear whether extending the time period of climate observations would reveal the 2008 drought event in Central Asia as an extreme drought event. Therefore, an in-depth study of long-term climate change in the region to quantify the threshold climate conditions reached by extreme events is necessary.
When extreme climate (drought/wet) events occur, the ecosystem undergoes a series of responses to the environmental stresses, which include actively maintaining ecosystem functions and diversity [1], avoiding the boundaries of potential threats to the ecosystem, maintaining the original state by strengthening resistance mechanisms, and evolving in response to and adapting to adverse conditions [11]. However, the sensitivity of an ecosystem varies in terms of biological and physical processes, and the factors influencing sensitivity often depend on the type of ecosystem and other environmental factors [12]. In the study of ecosystem stability in stressful conditions, two important indicators are used: ecosystem resistance and resilience [13,14]. Resistance involves the persistence of ecosystem stability, especially the maintenance of ecological function and sensitivity to external disturbances, and it includes maintaining certain necessary changes. Resilience is expressed in two ways in ecology. The first refers to the rate at which an ecosystem recovers to a certain state or reaches an equilibrium state after a temporary disturbance. This type of resilience is called ecosystem stability or ecosystem resilience, of which an important indicator is ecosystem recovery time [15,16,17]. The second way resilience is expressed is as the elasticity of changes in ecosystem structure and the relationships within the system; ecosystems have the ability to absorb changes and maintain their core structures and functional attributes (such as biodiversity, biomass, or ecosystem services) [18]. Resilience and recovery time can be used to measure the rate of ecosystem recovery after adversity, which is determined by the unique attributes of the ecosystem. Much research has been conducted on ecosystem resistance and resilience [13,14,19,20]. However, most stressful events are drought events, and few studies have investigated changes in ecosystem stability after extreme wet events or compared post-event ecosystem stability between drought and wet events. Studying ecosystem stability changes post drought and wet events may help us understand the response processes of ecosystems under future climate changes.
Water use efficiency (WUE) is related to the biological and physical processes of an ecosystem [21,22]. WUE is defined as the ratio of ecosystem carbon uptake to water loss. According to this definition, ecosystem WUE controls the carbon-water cycle of an ecosystem, and its value can reflect the stability of an ecosystem in a stressful environment. In recent years, scholars applied remote sensing data to analyze the spatial and temporal changes in WUE [23], concluded the response mechanism of ecosystems WUE to drought [24], and examined the influence factors of the WUE [25]. Resistance was calculated based on WUE by Sparkle L. Malone and others to reflect the changes in California’s forest ecosystem during the extreme drought in 2009 [20]. In a previous study, resistance and resilience were calculated based on WUE and analyzed for changes after extreme drought in Africa [14]. In this paper, remote sensing data are used to calculate WUE, and ecosystem resistance is quantified to determine the resistance and recovery characteristics of ecosystems experiencing different climate events.
The resistance and resilience of ecosystems usually have certain thresholds [26,27,28]. When a stressful climate event causes these thresholds to be exceeded, ecosystem structure changes, which usually causes the evolution or degradation of the ecosystem [24,29,30]. L. Turnbull et al. concluded that the conversion of grassland to shrubland caused by shrub intrusion into grassland is the main form of land degradation in semi-arid areas [31]. Walker et al. found that once the resilience of grassland is exceeded, a catastrophic bifurcation threshold is passed, and the ecosystem structure shifts to a shrubland-dominated state [32]. However, there are few studies on the changes in ecosystem structure in fragile arid areas in Central Asia. Therefore, accurately assessing changes in the structure of Central Asian ecosystems after different climate events will help us understand the dynamics of ecosystem succession under future climate changes.
Central Asia is a typical arid and semi-arid region of the world [33]. The ecosystems of this region are becoming increasingly fragile due to climate change and human activities [34,35,36,37]. Previous studies have focused on the response of ecosystems to drought events, but little has been reported on the response of ecosystems to wetness events, especially in Central Asia. So, what are the mechanisms of Central Asian ecosystem stability in response to wetness events? Is it consistent with the response mechanism after a drought event? Based on this, we evaluated changes in climate factors in a long-term time series of the entire Central Asian region, quantified 15-year (2000–2014) ecosystems (forest, shrubland, grassland, and cropland ecosystems) WUE, and then calculated the deviation between normal year WUE and extreme climate event WUE. We then evaluated the WUE response to drought as calculated by remote sensing data and measured the resistance and resilience of Central Asian ecosystems to extreme weather events. The objectives of this paper are to (1) determine the thresholds of extreme dry and wet climate events and analyze the temporal and spatial changes under drought in Central Asia, (2) quantify the WUE of ecosystems and assess their resistance to and recovery from different climate events, (3) evaluate the changes in ecosystem resistance and resilience under different dry and wet conditions, and (4) evaluate the structural changes of ecosystems from before to after extreme climate events and the impacts of climate events on these changes. We try to establish a remote sensing calculation process for extreme climate event thresholds, analyze the response mechanism of ecosystem stability under extreme climate events in arid areas, and provide a reliable method for ecosystem research in large-scale data-scarce areas. At the same time, the traditional research methods of ecosystem response to climate change were improved, and the changes in ecosystem structure, function, and stability under different climatic events were systematically and comprehensively analyzed in arid areas, which reduced the uncertainty of ecosystem response mechanism research on temporal and spatial scales.
2. Materials and Methods
2.1. Study Area
Central Asia includes Kazakhstan (KAZ), Turkmenistan (TKM), Uzbekistan (UZB), Kyrgyzstan (KGZ), Tajikistan (TJK), and the Xinjiang Uygur Autonomous Region of China (CHN) [38]. KAZ has the largest area (2.727 million km2), and KGZ has the smallest (0.142 million km2). The altitude gradually increases from west to east and then decreases in the two basins of CHN. The climate changes from semi-arid to arid from north to south, and temperature increases gradually from north to south. The main land cover types in the study area in 2001 were grassland (56.81%), desert (32.90%), farmland (4.78%), water bodies (2.18%), and sparse shrubland (1.68%) (Figure 1).
2.2. Data Sources
The gross primary productivity (GPP) and evapotranspiration (ET) data from the moderate resolution imaging spectroradiometer (MODIS) were applied to calculate WUE, with a spatial resolution of 1 km. The data are freely available from http://www.ntsg.umt.edu (accessed on 30 May 2018). The MODIS GPP product (MOD17A3) and the MODIS ET product (MOD16A3) are widely used in research at global and regional scales [39,40,41]. The accuracy of the data products has been verified by flux tower vorticity-related data, and good results have been obtained [42,43,44]. We also downloaded the 2000–2014 land cover type climate modeling grid (CMG) product (MCD12C1) to analyze changes in ecosystem structure.
The standardized precipitation-evapotranspiration index (SPEI) can be used to quantify the severity of drought and has been used in different disciplines to monitor and analyze drought. The freely available SPEI data used in this study were obtained from the Global SPEI database (https://spei.csic.es/ (accessed on 15 June 2019)), with a time span of 1901–2013, and a spatial resolution of 0.5 degrees. The SPEI value for each pixel is calculated from the difference in monthly precipitation and potential evapotranspiration from the Climatic Research Unit of the University of East Anglia. The estimation of potential evapotranspiration is based on the FAO-56 Penman–Monteith. The SPEI has the characteristics of multiple time scales, which can provide a time scale of 1–48 months [45,46]. Referring to the research of predecessors, we selected the 12-month SPEI to represent the drought state of the whole year [47,48]. A positive SPEI value indicates a wet state, and a negative SPEI value indicates a drought state. The drought classification of the SPEI is shown in Table 1 and is adapted from the classification used by the National Bureau of Statistics of the United States Drought Mitigation Center (http://droughtmonitor.unl.edu (accessed on 1 March 2022).
2.3. Determination of Extreme Climate Events
To date, most scholars have used global and regional spatial scales and decades, centennial time scale climate records, time series, and frequentist statistics to define indicators of and then study extreme and abnormal climate events [49,50,51,52]. The usual method is to use the 5th and 95th percentiles of the observed data to calculate the index, which is defined as the extreme event index [52,53,54]. In this study, the SPEI values of Central Asia from 1901 to 2013 were analyzed. Observations below the 5th percentile represent extreme drought events, and those above the 95th percentile represent extreme wet events.
2.4. Calculation of Ecosystem Resistance and Resilience
Previous studies have shown that differences in the definition and classification of WUE mainly involve differences in the determination of carbon acquisition. The indexes used for carbon absorption are net primary productivity (NPP), GPP, aboveground NPP (ANPP), and net ecosystem productivity (NEP) [23,55,56].Among them, GPP is used most frequently and has proven to be reliable. In this study, the ratio of GPP to ET was used to calculate WUE, as shown below:
WUE = GPP/ET
With reference to the research of Ruppert J C [14], resistance was calculated as follows:
where WUEclimate event is the WUE of a specific climatic year, such as a wet year or a dry year, and WUEnormal is the average WUE of the study area in a nonspecific climatic year (2000, 2001, 2004, 2005, 2006, 2007, 2009, 2010, 2011, 2012, 2013, 2014). An unspecified climate was defined as the absence of drought or wet events for two consecutive years. A negative resistance value indicates a decrease in resistance, and a positive value indicates an increase; more extreme negative or positive values indicate low or high resistance, respectively. Similar to the calculation of resistance, we defined recovery as follows:
where WUEpre refers to the WUE of the year before the climate event, i.e., a drought event or wet event, and WUEpost is the WUE after the climate event. A resilience value higher than 100% indicates that resilience increased compared to its level in the previous year; a value less than 100% indicates a decrease. The years before and after the climate event were required to be within normal levels.
2.5. Changes in Land Cover Types
To distinguish whether a change in ecosystem structure after a climate event was a normal change or a change due to the climate event, we conducted the following experimental procedures: (1) Calculate the change in the area of each land cover type from before to after the climate event. (2) Determine the transformation of the main land cover types by calculating the conversion matrix of land cover types before and after the climate event. (3) Compare the land cover changes after the climate event to evaluate the impact of climate events on ecosystem structure.
3. Results
3.1. Temporal and Spatial Changes in SPEI
Based on the statistics of the SPEI for Central Asia over a period of 113 years, we found that the frequency distribution curve of the SPEI had a high degree of fit with the normal distribution (Figure 2a). The SPEI box plot shows that the average value was 0.073, the median value was 0.050, the 95th percentile was 0.91, the 5th percentile was −0.67, and the maximum and minimum values were 1.27 and −0.95, respectively (Figure 2b).
The average SPEI in 1909, 1936, 1944, 1955, and 1975 exceeded the 5% threshold, so these years were considered extreme drought years. In 1958, 1969, 1987, 2002, and 2003, the SPEI exceeded the 95% threshold; these years were considered extremely wet years according to previous research [13,57,58]. Beginning in 2000, the SPEI increased rapidly; after 2004, the SPEI declined until 2008, which was a dry year. After 2008, the SPEI fluctuated around the average value (Figure 3a). Regarding the monthly changes in the SPEI between 2000 and 2013, the SPEI was high from January to July 2002 and low in August, September, and October 2002. From November 2002 to December 2003, the SPEI was high relative to the value in other years, which means that Central Asia was relatively wet in 2002 and 2003. From January to December 2008, the SPEI was less than 0, and the year was relatively dry (Figure 3b). Therefore, 2002 and 2003 provided us with a good opportunity to study how arid areas respond to extremely wet events, and 2008 could be used as a drought year for research.
In 2002, there were no moderate or extremely arid areas; only 0.18% of the area experienced a mild drought, and the moderately wet areas accounted for 46.42% of the study area and were distributed in the northern CHN region, southern KAZ, and eastern UZB and TKM. KGZ was in an extremely wet state; only 25.06% of the study area was in a nonwet state, mainly in the northeastern and northwestern regions (Figure 4a). In 2003, almost the entire study area was in a wet state; only 15.43% of the area was normal or mildly arid, mainly in northern KAZ, the Altay region of CHN, and southern TKM (Figure 4b). In 2008, 14.21% of the area was in a wet state, mainly in western KAZ (Figure 4c), and 57.45% was in an arid state (Figure 4d), mainly in eastern KAZ, northern CHN, and most of UZB and TKM.
3.2. Quantification of Ecosystem Resistance and Resilience
To measure ecosystem resistance, we calculated the difference between the normal annual average WUE and wet period (2002, 2003) WUE and then constructed a map of the spatial distribution of ecosystem resistance during the study period. Figure 5 shows that the ecosystems in the study area experienced a wet period in 2002, and areas with resistance less than 0 accounted for 52.63% of the total study area, mainly in northern and northwestern KAZ, KGZ, TJK, and Ili River valley areas in northern CHN. These areas experienced periods of extreme wetness, and the ecosystems in these areas had weak resistance. Areas with resistance greater than 0 accounted for 47.37% of the total area and were distributed mainly in southern KAZ, TKM, UZB, and Piedmont oasis areas in southern CHN. The wet area in 2003 was greater than that in 2002, and the area with an ecosystem resistance of less than 0 accounted for 79.49% of the study area and was distributed mainly in KAZ, KGZ, TJK, and the Ili River Valley in northern CHN. The area with resistance greater than 0 accounted for 20.51% of the total study area and was mainly distributed in TKM, UZB, and the oasis region of southern CHN. In summary, in 2002 and 2003, Central Asia experienced a wet period, but the wet area in 2003 was greater than that in 2002. By comparing ecosystem resistance between the two periods, we found that the ecosystem resistance in 2003 was lower than that in 2002. Therefore, as the wet area and intensity of wetness increased during the wet period, ecosystem resistance appeared to decline.
Central Asia experienced a dry year in 2008. A total of 94.73% of the study area had an ecosystem resistance less than 0, whereas only 5.27% of the total area had a resistance greater than 1, distributed mainly in the Yili Valley of CHN. The distribution maps of ecosystem resistance in 2002, 2003, and 2008 revealed that ecosystem resistance in arid areas declined during periods of extreme wetness and drought.
Ecosystem resilience can characterize the restoration status of an ecosystem after a disturbance event. Figure 6a shows that after the two extremely wet years of 2002 and 2003, the area with ecosystem resilience greater than 1 accounted for 38.69% of the total area; regions with this level of resilience were distributed mainly in northwestern KAZ and the Ili River Valley in CHN, eastern UZB and parts of KGZ. After two consecutive years of extremely wet events, the WUE of these regions was higher than that before the events. The spatial distribution of resilience after the drought event in the study area was obtained by comparing the WUE in 2009 with that in 2007. Figure 6b shows that 32.28% of the study area had a resilience greater than 1, in regions distributed mainly in UZB and TKM, northern KAZ, the edge of the Gurbantunggut Desert in northern CHN, and the piedmont oasis in southern CHN. These areas have an arid climate. From these findings, we conclude that the arid areas had stronger resilience after drought than the wet regions.
3.3. The Relationships between Drought Intensity and Ecosystem Resistance and Resilience
Figure 7a shows that in 2002, ecosystem resistance increased with an increasing degree of climate wetness. The resistances in slightly wet, moderately wet, and extremely wet areas were all greater than 0, which indicates that moderate wetness helped increase the resistance of ecosystems in arid regions. In 2003, ecosystem resistance was less than 0 under different drought degrees, which means that during the continuous wet period, the ecosystem resistance in arid areas declined, and resistance was low in both extremely wet and extremely arid areas.
Figure 7b shows that during the drought period in 2008, ecosystem resistance was less than 0 under different drought conditions, which means that ecosystem resistance was weak during the drought period, and resistance decreased with decreasing drought. These results show that in the dry period, the wetter the area, the weaker the resistance to drought. In addition, ecosystem resistance in the extremely arid area was weak.
Figure 8a shows that after two consecutive years of wetness (2002–2003), ecosystem resilience in Central Asia was less than 1 and increased with increasing wetness. After the drought year (2008), the resilience of the ecosystem decreased with increasing wetness; moreover, resilience was low in extreme drought areas (Figure 8b).
In summary, in the first year of extreme wetness, ecosystem resistance was strong, and it increased with increasing wetness; however, in the second year of extreme wetness, resistance began to decline. Only in arid areas was resistance strong for the two consecutive years. Ecosystem resilience was less than 1 after a wet event. Ecosystem resistance was weak during drought periods and decreased with increasing wetness. After drought events, ecosystem resilience increased with increasing drought.
3.4. Changes in Land Cover Types during Drought and Wet Periods
Based on the MODIS land use data for 2001 and 2004, we analyzed the changes in land use from before to after the extremely wet period and obtained the land use area transfer matrix and area change table for these two years. Table 2 shows that the forest area decreased: the areas of evergreen broadleaf forest, deciduous needleleaf forest, deciduous broadleaf forest, and mixed forest decreased by 2 km2, 41 km2, 1427 km2, and 1036 km2, respectively. The shrubland area increased by 3892 km2, the area of grassland increased by 12,652 km2, the area of barren land decreased by 25,638 km2, and the areas of water bodies and wetlands increased by 894 km2 and 150 km2, respectively. Overall, in the wet period, the greatest decreases occurred in the areas of barren land, and the greatest increases occurred in the grassland areas.
Table 3 shows that the largest changes occurred in the grassland, barren land, and cropland areas. The increase in grassland area was mainly due to conversion from desert, cropland, and open shrubland. The area that changed from desert to grassland was 23,328 km2, and the area that changed from cropland to grassland was 16,836 km2. The area of open shrubland that changed to grassland was 4509 km2. The reduction in the desert area was mainly due to conversion to grassland, snow, and open shrubland, representing areas of 23,328 km2, 9967 km2, and 3837 km2, respectively. The reduction in cropland area was mainly due to conversion to grassland, corresponding to an area of 16,836 km2. In summary, from 2001 to 2004, the main changes in land cover type in Central Asia were a reduction in barren land area and an increase in grassland area resulting from the transformation of barren land.
The changes in land cover types in Central Asia from 2007 to 2009, before and after the drought, were analyzed. As presented in Table 4, the overall forest area decreased; the area of the evergreen needleleaf forest increased by 29 km2, whereas that of the evergreen broadleaf forest did not change. The areas of deciduous needleleaf forest, deciduous broadleaf forest, and mixed forest decreased by 12 km2, 223 km2, and 217 km2, respectively. The area of open shrubland increased by 7929 km2. The grassland area decreased by 9996 km2, the cropland area decreased by 4559 km2, the desert area increased by 1966 km2, and the areas of water bodies and wetlands decreased by 827 km2 and 548 km2, respectively. As a whole, Central Asia experienced a period of drought. The areas of water bodies, grassland, and wetland exhibited greater relative decreases, whereas the areas of shrubland, ice and snow, and desert exhibited greater relative increases.
Table 5 shows that the greatest decreases occurred in the grassland was mainly due to conversion to barren land, cropland, open shrubland, and savanna, representing an area of 16,241 km2, 9689 km2, 9661 km2, 1094 km2, respectively. The reduction in cropland area was mainly due to conversion to grassland, corresponding to an area of 14,239 km2. The largest increased area occurred in the open shrubland; the increased area was mainly due to transfer from grassland, corresponding to an area of 9661 km2. Overall, the greatest decreases occurred in the grassland area from 2007 to 2009, and the greatest increases occurred in the open shrubland areas.
4. Discussion
4.1. Climate Change in Central Asia
Water is the main limiting factor for plant growth and ecosystem productivity in terrestrial ecosystems, and different biological communities have different sensitivities to water stress [59,60]. Central Asia is the world’s largest nonzonal arid area. Studies have shown that in the past 100 years, the climate in Central Asia has been warming at a rate more than twice that of the Northern Hemisphere [61]. In this study, we found a trend of the climate towards wet over the past 20 years; in particular, extremely wet periods were observed in 2002 and 2003. This result is consistent with previous studies: the climate in Central Asia changed from a warm, dry type to a warm wet type [62,63]. The change in westerly circulation may be the main factor driving the changes in dry and wet conditions in the arid region of Central Asia [63]. We also observed that the drought event in 2008 did not reach the threshold of an extreme drought event. This result is consistent with a previous study [64]. We regarded 2002 and 2003 as extremely wet events and 2008 as drought event to study the changes in ecosystem stability after dry and wet events.
4.2. Ecosystem Resistance
Ecosystem resistance in Central Asia differed between 2002 and 2003. In this study, strong ecosystem resistance was observed in 2002, and resistance increased with increasing environmental wetness. The main reason for these findings is that the vegetation in arid areas can show vigorous growth once sufficient water to support vegetation growth is obtained because it has a high photosynthetic capacity [65,66]. However, when extremely wet events occurred for two consecutive years (with a higher wetness level in 2003 than in 2002), we found that ecosystem resistance began to decrease. Ecosystem resistance decreased with increasing wetness in 2003. This pattern was different from that observed in 2002, in which continuous extremely wet events similarly reduced ecosystem resistance. A possible reason for this phenomenon is that the water used for photosynthesis was in surplus, and the maximum amount of water required for photosynthesis had been reached [67,68]. Excess water flows into the soil or is intercepted by the canopy. A high-temperature environment increases evapotranspiration, resulting in a decrease in WUE, which may also be a reason for the decline in resistance. In addition, during rainy weather, light intensity is decreased, which limits photosynthesis. The inability to use more water leads to a decline in resistance. This observation shows that as water resources become abundant, the productivity of an ecosystem will increase at the same time as the evapotranspiration of the ecosystem. Previous studies have shown that with increasing precipitation, biomass and NPP usually increase and that the WUE of the ecosystem increases at the same time; these three variables exhibit similar distributions of temporal and spatial changes [69]. These findings are consistent with only the results for 2002 in this study; they are inconsistent with the results for 2003. Another possible reason for the difference is that the continuous wet years promoted the conversion of open shrubland to grasslands. In a previous study in Central Asia, the WUE of shrubland was found to be higher than that of grassland [10]. Therefore, the overall WUE during the wet period was lower than that during normal years. This phenomenon is another reason for the decline in ecosystem resistance in Central Asia. In 2002, as the degree of wetness increased, ecosystem resistance showed an increasing trend. Under mild, moderate, and extremely wet conditions, ecosystem resistance was greater than 1; after two consecutive years of wetness, ecosystem resistance decreased as the degree of wetness increased. These findings further show that adequate wetness increases the resistance of an ecosystem, but continuous extremely wet events reduce it.
In 2008, Central Asia experienced a drought event in which regional resistance in 93.13% of the study area was less than 0, and it was less than −1 in southeastern TKM and greater than 1 only in high mountain areas. These findings indicate that resistance to drought is weak in Central Asia. Studies have shown that the WUE of an ecosystem is negatively correlated with drought during a drought period in Central Asia [10]. Drought significantly reduces ecosystem WUE and has an obvious legacy effect [65,70,71,72,73]. In this study, ecosystem resistance increased with increasing drought intensity. This finding is consistent with the previous finding that WUE increased with increasing drought intensity [27] and explains why drought resistance was higher in arid areas. However, resistance did not reach a maximum but declined under extreme drought conditions, with the weakest resistance observed in southeastern TKM. Furthermore, the increase in shrubland areas and the decrease in grassland areas after drought events are additional reasons for the higher WUE and drought resistance in arid areas than in other areas. Therefore, resistance was weak under drought conditions in Central Asia but showed an increasing trend with increasing intensity of environmental drought except in extreme drought environments.
4.3. Ecosystem Resilience
Ecosystem resilience was weak in most areas after extreme wet and drought events. We found that the regions with ecosystem resilience greater than 1 were distributed mainly in northwestern KAZ, Ili River Valley in CHN, and KGZ after a wet event (Figure 5). A common characteristic of these areas is that grassland is the main coverage type; grassland vegetation can grow very well under sufficient water conditions, which may be the main reason for the greater resilience in these areas than in other areas. In general, an arid ecosystem will not recover quickly in the second year after a drought event due to legacy effects [10]. The areas with higher ecosystem resilience were located in the oasis on the edge of the Tarim Basin in CHN, the oasis on the edge of the Junggar Basin, and most of TKM and UZB. Common characteristics of these areas are irrigated farmland and frequent human activities. After a drought event, humans respond by altering irrigation methods, irrigation water volume, or crop types to ensure food security and economic development [74,75]. After a wet event, ecosystem resilience tends to increase with increasing wetness, which means that the wetter an area is, the more easily it can adapt to an extremely wet event. This property may be an adaptive strategy that the vegetation in this environment has evolved. After a drought event, ecosystem resilience increases with increasing drought. The area of shrubland in Central Asia increased in 2009 compared with that in 2007, whereas the areas of grassland and forest decreased, which also contributed to the increase in ecosystem resilience. In summary, the vegetation in wet areas was better able to adapt to wet climate events and had stronger resilience after wet events, whereas the vegetation in arid areas was better able to adapt to arid climate events and had stronger resilience after drought events.
4.4. The Impacts of Climatic Conditions on Ecosystem Land Cover Types
In this study, differences in land cover types between 2001 and 2004 and between 2007 and 2009 were analyzed to reveal the impact of wet (drought) events on ecosystem structure. The main change in land cover was the increase in grassland area after an extremely wet event. The transfer matrix indicated that the grassland was mainly wasteland. There are huge seed banks in the wasteland soil in arid areas, and most of them are seed banks of short-lived herbaceous plants [76]. A characteristic of such plants is their ability to start their life cycle when sufficient soil moisture becomes available [77]. Figure 3 shows that in 2002 and 2003, there were extremely wet periods in Central Asia, which resulted in sufficient soil moisture in the desert and stimulated the growth of a large number of herbaceous plants. A similar trend was observed in the desert area of the present study after extremely wet events. The grassland area decreased in 2009 compared with that in 2007, and the transfer matrix indicated that the decrease in grassland area was due mainly to conversion into shrubland. In arid and semi-arid regions, bush forest intrusion into grassland is the main form of land degradation [78,79]. The transition from grassland to the bush has a nonlinear threshold dynamic [80], and the dynamics of the grassland-to-bush transition conform to the threshold concept [31]. The concepts of threshold and catastrophe theory apply because both entail a sudden change across a defined boundary. Considering the catastrophic consequences, one of the most important ecosystem characteristics is resilience, which refers to systems that absorb disturbances and reorganize when changes occur to maintain largely the same functions, structure, identity, and feedback [81]. Therefore, once a semi-arid grassland’s resilience is exceeded and a catastrophic bifurcation occurs, the ecosystem will transition to a shrub-dominated state. This explains why grassland was transformed mainly into shrubland when drought occurred in 2008. Increased anthropogenic activities can also interfere with the resilience and resilience of ecosystems in Central Asia. Such as grassland destruction [82,83] and desertification [84,85] caused by overgrazing, reducing the resistance and resilience of ecosystems. Central Asia is a typical alpine–oasis–desert system [86], where rivers originate and flow through the oasis. The increase of anthropogenic activities in the middle reaches leads to the transformation of the downstream ecosystem to a desert [87], and the most typical is the Central Asian Aral Sea Crisis [88,89], the resistance and resilience of ecosystems are reduced. Therefore, in the context of the increasing frequency and intensity of drought under future climate change, climate disturbances will cause the system to cross the threshold and transform into another state. This means that it is not feasible to restore degraded ecosystems without large amounts of intervention and economic investment.
4.5. Research Limitations
We used remote sensing image data to assess climate change in Central Asia and address changes in ecosystem resistance and resilience characteristics under different climate events. The spatial resolution of satellite remote sensing images is one limitation of this study. Another limitation lies in the lack of ground truth data for verification purposes. This study also lacks information on the relationship between water demand and carbon uptake. The normal climatic threshold range of the ecosystem was not quantified, and we do not know precisely the time at which an ecosystem begins to experience water limitations. These issues warrant attention in our future research. The parameters used in the calculation of MODIS productivity data were the same for all land use types; however, there are differences among different ecosystem types. We could not distinguish the areas dominated by C3 and C4 vegetation; however, the water shortage sensitivities of C3 and C4 plants differ in arid areas. We did not exclude the effects of wildfires and human logging in the calculation of resilience. Despite these limitations, this study used remote sensing technology to calculate long-term climate change sequences and to investigate the stability of Central Asia ecosystems under different climate events.
5. Conclusions
We studied changes in ecosystem WUE caused by drought to improve our understanding of ecosystem resistance under drought conditions. This study suggests that remote sensing data products and open-source data can be used to monitor the resistance and resilience of ecosystems in response to drought. Our analysis establishes a framework to use these sources of information to understand differences in ecosystem responses to drought at large spatial scales. The difference between an extreme weather event WUE and a normal year WUE can indicate the expected resistance of an ecosystem in response to climate. ΔWUE is an important indicator of the fragility of an ecosystem. The availability of resources leads to changes in the structure and functional landscape of the entire ecosystem. Over the period of 113 years, the average SPEI was 0.073, the extremely wet threshold was 0.91, and the extreme drought threshold was −0.67. Central Asia experienced extremely wet events in 2002 and 2003 and a drought in 2008. Sufficient wetness can increase ecosystem resistance, whereas continuous wetness reduces ecosystem resistance; drought also reduces ecosystem resistance. After a wet event, the wet area had stronger resilience than the arid area, whereas, after a drought event, the arid area had stronger resilience than the wet area. In the wet and dry years, conversion between shrubland and grassland was the main reason for the changes in ecosystem resistance and resilience. Previous literature concerning ecosystem responses to climate change has mostly been conducted over a one-year period, we analyzed the change process of ecosystems during climate events for two consecutive years, and we comprehensively analyzed the changes in the structural and functional stability of ecosystems. These findings are important for understanding the impacts of climate change on ecosystem stability. In future studies, we will focus on the time lag/cumulative effects of climate events to determine precisely the time at which an ecosystem begins to experience drought or wetness.
Author Contributions
J.D. and J.Z. conceived and designed this study, J.Z. carried out the analyses and wrote the paper; S.H. contributed to the discussion and manuscript refinement. B.L. made important contributions to the figures. All authors have read and agreed to the published version of the manuscript.
Funding
This work was supported by the National Natural Science Foundation of China (Nos. 32260287 and 41961059), the Doctoral Research Start-up Fund Project of Xinjiang University (No. 620320025), and the Sino-German interdisciplinary joint program for innovative talent training funded by the China Scholarship Council (CSC, No. 201807015008).
Data Availability Statement
The gross primary productivity (GPP) and evapotranspiration (ET) and land cover type climate modeling grid (CMG) product (MCD12C1) data were downloaded from http://www.ntsg.umt.edu (accessed on 30 May 2018); the Global SPEI database were downloaded from https://spei.csic.es/ (accessed on 15 June 2019).
Conflicts of Interest
The authors declare no conflict of interest.
References
- Allen, C.D.; Macalady, A.K.; Chenchouni, H.; Bachelet, D.; McDowell, N.; Vennetier, M.; Kitzberger, T.; Rigling, A.; Breshears, D.D.; Hogg, E.T. A global overview of drought and heat-induced tree mortality reveals emerging climate change risks for forests. For. Ecol. Manag. 2010, 259, 660–684. [Google Scholar] [CrossRef] [Green Version]
- Brando, P.M.; Nepstad, D.C.; Davidson, E.A.; Trumbore, S.E.; Ray, D.; Camargo, P. Drought effects on litterfall, wood production and belowground carbon cycling in an Amazon forest: Results of a throughfall reduction experiment. Philos. Trans. R. Soc. B Biol. Sci. 2008, 363, 1839–1848. [Google Scholar] [CrossRef]
- Mishra, A.K.; Singh, V.P. A review of drought concepts. J. Hydrol. 2010, 391, 202–216. [Google Scholar] [CrossRef]
- Zou, J.; Ding, J.; Welp, M.; Huang, S.; Liu, B. Using MODIS data to analyse the ecosystem water use efficiency spatial-temporal variations across Central Asia from 2000 to 2014. Environ. Res. 2019, 182, 108985. [Google Scholar] [CrossRef]
- Westerling, A.L.; Hidalgo, H.G.; Cayan, D.R.; Swetnam, T.W. Warming and earlier spring increase western US forest wildfire activity. Science 2006, 313, 940–943. [Google Scholar] [CrossRef] [PubMed] [Green Version]
- Zhou, S.; Zhang, Y.; Park Williams, A.; Gentine, P. Projected increases in intensity, frequency, and terrestrial carbon costs of compound drought and aridity events. Sci. Adv. 2019, 5, eaau5740. [Google Scholar] [CrossRef] [PubMed] [Green Version]
- Gampe, D.; Zscheischler, J.; Reichstein, M.; O’Sullivan, M.; Smith, W.K.; Sitch, S.; Buermann, W. Increasing impact of warm droughts on northern ecosystem productivity over recent decades. Nat. Clim. Chang. 2021, 11, 772–779. [Google Scholar] [CrossRef]
- Obladen, N.; Dechering, P.; Skiadaresis, G.; Tegel, W.; Keßler, J.; Höllerl, S.; Kaps, S.; Hertel, M.; Dulamsuren, C.; Seifert, T.; et al. Tree mortality of European beech and Norway spruce induced by 2018–2019 hot droughts in central Germany. Agric. For. Meteorol. 2021, 307, 108482. [Google Scholar] [CrossRef]
- Zhi, L.; Chen, Y.; Fang, G.; Li, Y. Multivariate assessment and attribution of droughts in Central Asia. Sci. Rep. 2017, 7, 1316. [Google Scholar] [CrossRef] [Green Version]
- Zou, J.; Ding, J.; Welp, M.; Huang, S.; Liu, B. Assessing the Response of Ecosystem Water Use Efficiency to Drought During and after Drought Events across Central Asia. Sensors 2020, 20, 581. [Google Scholar] [CrossRef] [Green Version]
- Vargas, C.A.; Lagos, N.A.; Lardies, M.A.; Duarte, C.; Manríquez, P.H.; Aguilera, V.M.; Broitman, B.; Widdicombe, S.; Dupont, S. Species-specific responses to ocean acidification should account for local adaptation and adaptive plasticity. Nat. Ecol. Evol. 2017, 1, 84. [Google Scholar] [CrossRef] [PubMed] [Green Version]
- Donohue, I.; Petchey, O.L.; Montoya, J.M.; Jackson, A.L.; Mcnally, L.; Viana, M.; Healy, K.; Lurgi, M.; O’Connor, N.E.; Emmerson, M.C. On the dimensionality of ecological stability. Ecol. Lett. 2013, 16, 421–429. [Google Scholar] [CrossRef] [PubMed]
- Hoover, D.L.; Knapp, A.K.; Smith, M.D. Resistance and resilience of a grassland ecosystem to climate extremes. Ecology 2016, 95, 2646–2656. [Google Scholar] [CrossRef] [Green Version]
- Ruppert, J.C.; Harmoney, K.; Henkin, Z.; Snyman, H.A.; Sternberg, M.; Willms, W.; Linstädter, A. Quantifying drylands’ drought resistance and recovery: The importance of drought intensity, dominant life history and grazing regime. Glob. Chang. Biol. 2015, 21, 1258–1270. [Google Scholar] [CrossRef]
- Donohue, I.; Hillebrand, H.; Montoya, J.M.; Petchey, O.L.; Pimm, S.L.; Fowler, M.S.; Healy, K.; Jackson, A.L.; Lurgi, M.; Mcclean, D. Navigating the complexity of ecological stability. Ecol. Lett. 2016, 19, 1172–1185. [Google Scholar] [CrossRef] [PubMed] [Green Version]
- Hashimoto, T.; Stedinger, J.R.; Loucks, D.P. Reliability, Resiliency, and Vulnerability Criteria for Water Resource System Performance Evaluetion. Water Resour. Res. 1982, 18, 14–20. [Google Scholar] [CrossRef] [Green Version]
- Pimm, S. The complexity and stability of ecosystems. Nature 1985, 315, 635–636. [Google Scholar] [CrossRef]
- Cumming, G.S.; Collier, J. Change and Identity in Complex Systems. Ecol. Soc. 2005, 53, 585–607. [Google Scholar] [CrossRef] [Green Version]
- Carnicer, J.; Coll, M.; Ninyerola, M.; Pons, X.; Sánchez, G.; Peñuelas, J. Widespread crown condition decline, food web disruption, and amplified tree mortality with increased climate change-type drought. Proc. Natl. Acad. Sci. USA 2011, 108, 1474–1478. [Google Scholar] [CrossRef] [Green Version]
- Malone, S.L.; Tulbure, M.G.; Pérez-Luque, A.J.; Assal, T.J.; Bremer, L.L.; Drucker, D.P.; Hillis, V.; Varela, S.; Goulden, M.L. Drought resistance across California ecosystems: Evaluating changes in carbon dynamics using satellite imagery. Ecosphere 2016, 7, e01561. [Google Scholar] [CrossRef]
- Jassal, R.S.; Black, T.A.; Spittlehouse, D.L.; Brümmer, C.; Nesic, Z. Evapotranspiration and Water Use Efficiency in Different-Aged Pacific Northwest Douglas-Fir Stands. Agric. For. Meteorol. 2009, 149, 1168–1178. [Google Scholar] [CrossRef]
- Guo, Y.; Han, R.L.; Liang, Z.S. Effect of soil drought on growth and water use efficiency characteristics of four native gramineous grasses in Loess Plateau. Acta Prataculturae Sin. 2010, 19, 21–30. [Google Scholar]
- Tang, X.; Li, H.; Desai, A.R.; Nagy, Z.; Luo, J.; Kolb, T.E.; Olioso, A.; Xu, X.; Yao, L.; Kutsch, W. How is water-use efficiency of terrestrial ecosystems distributed and changing on Earth? Sci. Rep. 2014, 4, 7483. [Google Scholar] [CrossRef] [PubMed] [Green Version]
- Yang, Y.; Guan, H.; Batelaan, O.; McVicar, T.R.; Long, D.; Piao, S.; Liang, W.; Liu, B.; Jin, Z.; Simmons, C.T. Contrasting responses of water use efficiency to drought across global terrestrial ecosystems. Sci. Rep. 2016, 6, 23284. [Google Scholar] [CrossRef] [Green Version]
- Zhang, T.; Peng, J.; Liang, W.; Yang, Y.; Liu, Y. Spatial–temporal patterns of water use efficiency and climate controls in China’s Loess Plateau during 2000–2010. Sci. Total Environ. 2016, 565, 105–122. [Google Scholar] [CrossRef]
- Lu, X.; Zhuang, Q. Evaluating evapotranspiration and water-use efficiency of terrestrial ecosystems in the conterminous United States using MODIS and AmeriFlux data. Remote Sens. Environ. 2010, 114, 1924–1939. [Google Scholar] [CrossRef]
- Ponce-Campos, G.E.; Moran, M.S.; Huete, A.; Zhang, Y.; Bresloff, C.; Huxman, T.E.; Eamus, D.; Bosch, D.D.; Buda, A.R.; Gunter, S.A. Ecosystem resilience despite large-scale altered hydroclimatic conditions. Nature 2013, 494, 349. [Google Scholar] [CrossRef]
- Zhu, Q.; Jiang, H.; Peng, C.; Liu, J.; Wei, X.; Fang, X.; Liu, S.; Zhou, G.; Yu, S. Evaluating the effects of future climate change and elevated CO2 on the water use efficiency in terrestrial ecosystems of China. Ecol. Model. 2011, 222, 2414–2429. [Google Scholar] [CrossRef]
- Emmerich, W.E. Ecosystem Water Use Efficiency in a Semiarid Shrubland and Grassland Community. Rangel. Ecol. Manag. 2007, 60, 464–470. [Google Scholar] [CrossRef]
- Hooper, D.U.; Chapin, F.S.; Ewel, J.J.; Hector, A.; Inchausti, P.; Lavorel, S.; Lawton, J.H.; Lodge, D.M.; Loreau, M.; Naeem, S. Effects of Biodiversity on Ecosystem Functioning: A Consensus of Current Knowledge. Ecol. Monogr. 2005, 75, 3–35. [Google Scholar] [CrossRef]
- Turnbull, L.; Wainwright, J.; Brazier, R.E. A conceptual framework for understanding semi-arid land degradation: Ecohydrological interactions across multiple-space and time scales. Ecohydrology 2010, 1, 23–34. [Google Scholar] [CrossRef] [Green Version]
- Walker, B.; Hollin, C.S.; Carpenter, S.R.; Kinzig, A. Resilience, Adaptability and Transformability in Social-ecological Systems. Ecol. Soc. 2004, 85, 3438–3447. [Google Scholar] [CrossRef]
- Deng, H.; Chen, Y. Influences of recent climate change and human activities on water storage variations in Central Asia. J. Hydrol. 2016, 544, 46–57. [Google Scholar] [CrossRef]
- Karnieli, A.; Gilad, U.; Ponzet, M.; Svoray, T.; Mirzadinov, R.; Fedorina, O. Assessing land-cover change and degradation in the Central Asian deserts using satellite image processing and geostatistical methods. J. Arid Environ. 2008, 72, 2093–2105. [Google Scholar] [CrossRef]
- Siegfried, T.; Bernauer, T.; Guiennet, R.; Sellars, S.; Robertson, A.W.; Mankin, J.; Bauer-Gottwein, P.; Yakovlev, A. Will climate change exacerbate water stress in Central Asia? Clim. Chang. 2012, 112, 881–899. [Google Scholar] [CrossRef]
- Sommer, R.; Glazirina, M.; Yuldashev, T.; Otarov, A.; Ibraeva, M.; Martynova, L.; Bekenov, M.; Kholov, B.; Ibragimov, N.; Kobilov, R. Impact of climate change on wheat productivity in Central Asia. Agric. Ecosyst. Environ. 2013, 178, 78–99. [Google Scholar] [CrossRef]
- Wright, C.K.; De Beurs, K.M.; Henebry, G.M. Land surface anomalies preceding the 2010 Russian heat wave and a link to the North Atlantic oscillation. Environ. Res. Lett. 2014, 9, 124015. [Google Scholar] [CrossRef]
- Han, Q.; Luo, G.; Li, C.; Shakir, A.; Wu, M.; Saidov, A. Simulated grazing effects on carbon emission in Central Asia. Agric. For. Meteorol. 2016, 216, 203–214. [Google Scholar] [CrossRef]
- Kim, H.W.; Hwang, K.; Mu, Q.; Lee, S.O.; Choi, M. Validation of MODIS 16 global terrestrial evapotranspiration products in various climates and land cover types in Asia. KSCE J. Civ. Eng. 2012, 16, 229–238. [Google Scholar] [CrossRef]
- Turner, D.P.; Ritts, W.D.; Cohen, W.B.; Gower, S.T.; Running, S.W.; Zhao, M.; Costa, M.H.; Kirschbaum, A.A.; Ham, J.M.; Saleska, S.R. Evaluation of MODIS NPP and GPP products across multiple biomes. Remote Sens. Environ. 2006, 102, 282–292. [Google Scholar] [CrossRef]
- Zscheischler, J.; Mahecha, M.D.; Von Buttlar, J.; Harmeling, S.; Jung, M.; Rammig, A.; Randerson, J.T.; Schölkopf, B.; Seneviratne, S.I.; Tomelleri, E. A few extreme events dominate global interannual variability in gross primary production. Environ. Res. Lett. 2014, 9, 035001. [Google Scholar] [CrossRef] [Green Version]
- Liu, Y.; Xiao, J.; Ju, W.; Zhou, Y.; Wang, S.; Wu, X. Water use efficiency of China’s terrestrial ecosystems and responses to drought. Sci. Rep. 2015, 5, 13799. [Google Scholar] [CrossRef] [PubMed] [Green Version]
- Velpuri, N.M.; Senay, G.B.; Singh, R.K.; Bohms, S.; Verdin, J.P. A comprehensive evaluation of two MODIS evapotranspiration products over the conterminous United States: Using point and gridded FLUXNET and water balance ET. Remote Sens. Environ. 2013, 139, 35–49. [Google Scholar] [CrossRef]
- Zhao, M.; Heinsch, F.A.; Nemani, R.R.; Running, S.W. Improvements of the MODIS terrestrial gross and net primary production global data set. Remote Sens. Environ. 2005, 95, 164–176. [Google Scholar] [CrossRef]
- Vicente-Serrano, S.M.; Beguería, S.; López-Moreno, J. A multi-scalar drought index sensitive to global warming: The Standardized Precipitation Evapotranspiration Index–SPEI. J. Clim. 2010, 23, 1696–1718. [Google Scholar] [CrossRef] [Green Version]
- Beguería, S.; Vicente-Serrano, S.M.; Angulo-Martínez, M. A Multiscalar Global Drought Dataset: The SPEIbase: A New Gridded Product for the Analysis of Drought Variability and Impacts. Bull. Am. Meteorol. Soc. 2010, 91, 1351–1356. [Google Scholar] [CrossRef] [Green Version]
- Wei, X.; He, W.; Zhou, Y.; Ju, W.; Xiao, J.; Li, X.; Liu, Y.; Xu, S.; Bi, W.; Zhang, X. Global assessment of lagged and cumulative effects of drought on grassland gross primary production. Ecol. Indic. 2022, 136, 108646. [Google Scholar] [CrossRef]
- Yang, S.; Meng, D.; Xiaojuan, L.I.; Xinling, W.U. Multi-scale responses of vegetation changes relative to the SPEI meteorological drought index in North China in 2001–2014. Acta Ecol. Sin. 2018, 38, 1028–1039. [Google Scholar] [CrossRef]
- Avotniece, Z.; Rodinov, V.; Lizuma, L.; Briede, A.; Kļaviņš, M. Trends in the frequency of extreme climate events in Latvia. Baltica 2010, 23, 135–148. [Google Scholar]
- Colombo, A.F.; Etkin, D.; Karney, B.W. Climate Variability and the Frequency of Extreme Temperature Events for Nine Sites across Canada: Implications for Power Usage. J. Clim. 1999, 12, 2490–2502. [Google Scholar] [CrossRef]
- Grotjahn, R.; Black, R.; Leung, R.; Wehner, M.F.; Barlow, M.; Bosilovich, M.; Gershunov, A.; Gutowski, W.J.; Gyakum, J.R.; Katz, R.W. North American extreme temperature events and related large scale meteorological patterns: A review of statistical methods, dynamics, modeling, and trends. Clim. Dyn. 2016, 46, 1151–1184. [Google Scholar] [CrossRef] [Green Version]
- Zwiers, F.W.; Alexander, L.V.; Hegerl, G.C.; Knutson, T.R.; Kossin, J.P.; Naveau, P.; Nicholls, N.; Schär, C.; Seneviratne, S.I.; Zhang, X. Climate Extremes: Challenges in Estimating and Understanding Recent Changes in the Frequency and Intensity of Extreme Climate and Weather Events. In Climate Science for Serving Society; Asrar, G.R., Hurrell, J.W., Eds.; Springer: Dordrecht, The Netherlands, 2013. [Google Scholar] [CrossRef]
- Kharin, V.V.; Zwiers, F.W.; Zhang, X.; Hegerl, G.C. Changes in Temperature and Precipitation Extremes in the IPCC Ensemble of Global Coupled Model Simulations. J. Clim. 2007, 20, 1419–1444. [Google Scholar] [CrossRef] [Green Version]
- Wehner, M.F.; Smith, R.L.; Bala, G.; Duffy, P. The effect of horizontal resolution on simulation of very extreme US precipitation events in a global atmosphere model. Clim. Dyn. 2009, 34, 241–247. [Google Scholar] [CrossRef] [Green Version]
- Vanloocke, A.; Twine, T.E.; Zeri, M.; Bernacchi, C.J. A regional comparison of water use efficiency for miscanthus, switchgrass and maize. Agric. For. Meteorol. 2012, 164, 82–95. [Google Scholar] [CrossRef]
- Zhang, X.; Moran, M.S.; Zhao, X.; Liu, S.; Zhou, T.; Ponce-Campos, G.E.; Liu, F. Impact of prolonged drought on rainfall use efficiency using MODIS data across China in the early 21st century. Remote Sens. Environ. 2014, 150, 188–197. [Google Scholar] [CrossRef]
- Grafton, R.Q.; Doyen, L.; Béné, C.; Borgomeo, E.; Wyrwoll, P.R. Realizing resilience for decision-making. Nature 2019, 2, 907–913. [Google Scholar] [CrossRef] [Green Version]
- Smith, M.D. An ecological perspective on extreme climatic events: A synthetic definition and framework to guide future research. J. Ecol. 2011, 99, 656–663. [Google Scholar] [CrossRef]
- Liu, Y.; Zhou, R.; Wen, Z.; Khalifa, M.; Zheng, C.; Ren, H.; Zhang, Z.; Wang, Z. Assessing the impacts of drought on net primary productivity of global land biomes in different climate zones. Ecol. Indic. 2021, 130, 108146. [Google Scholar] [CrossRef]
- Geng, G.; Zhou, H.; Wang, T. Assessing the relationship between drought and vegetation dynamics in northern China during 1982–2015. Theor. Appl. Climatol. 2022, 148, 467–479. [Google Scholar] [CrossRef]
- Chen, F.; Wang, J.; Jin, L.; Zhang, Q.; Li, J.; Chen, J. Rapid warming in mid-latitude central Asia for the past 100 years. Front. Earth Sci. China 2009, 3, 42. [Google Scholar] [CrossRef]
- Shi, Y.; Shen, Y.; Kang, E.; Li, D.; Ding, Y.; Zhang, G.; Hu, R. Recent and future climate change in northwest China. Clim. Chang. 2007, 80, 379–393. [Google Scholar] [CrossRef]
- Chen, F.H.; Huang, W.; Jin, L.Y.; Chen, J.H.; Wang, J.S. Spatiotemporal precipitation variations in the arid Central Asia in the context of global warming. Sci. China Earth Sci. 2011, 54, 10. [Google Scholar] [CrossRef]
- Jung, M.; Reichstein, M.; Ciais, P.; Seneviratne, S.I.; Sheffield, J.; Goulden, M.L.; Bonan, G.; Cescatti, A.; Chen, J.; De Jeu, R. Recent decline in the global land evapotranspiration trend due to limited moisture supply. Nature 2010, 467, 951. [Google Scholar] [CrossRef] [PubMed] [Green Version]
- Sankaran, M. Droughts and the ecological future of tropical savanna vegetation. J. Ecol. 2019, 107, 1531–1549. [Google Scholar] [CrossRef] [Green Version]
- Sibret, T.; Verbruggen, W.; Peaucelle, M.; Verryckt, L.T.; Bauters, M.; Combe, M.; Boeckx, P.; Verbeeck, H. High photosynthetic capacity of Sahelian C3 and C4 plants. Photosynth. Res. 2021, 147, 161–175. [Google Scholar] [CrossRef]
- Gherardi, L.A.; Sala, O.E. Enhanced precipitation variability decreases grass- and increases shrub-productivity. Proc. Natl. Acad. Sci. USA 2015, 112, 12735–12740. [Google Scholar] [CrossRef] [Green Version]
- Zhang, Y.; Hong, S.; Liu, D.; Piao, S. Susceptibility of vegetation low-growth to climate extremes on Tibetan Plateau. Agric. For. Meteorol. 2023, 331, 109323. [Google Scholar] [CrossRef]
- Zhongmin, H.; Guirui, Y.; Jiangwen, F.; Huaping, Z.; Shaoqiang, W.; Shenggong, L. Precipitation-use efficiency along a 4500-km grassland transect. Glob. Ecol. Biogeogr. 2010, 19, 842–851. [Google Scholar] [CrossRef]
- Cuddington, K. Legacy effects: The persistent impact of ecological interactions. Biol. Theory 2011, 6, 203–210. [Google Scholar] [CrossRef]
- Huxman, T.E.; Smith, M.D.; Fay, P.A.; Knapp, A.K.; Shaw, M.R.; Loik, M.E.; Smith, S.D.; Tissue, D.T.; Zak, J.C.; Weltzin, J.F. Convergence across biomes to a common rain-use efficiency. Nature 2004, 429, 651–654. [Google Scholar] [CrossRef]
- Monger, C.; Sala, O.E.; Duniway, M.C.; Goldfus, H.; Meir, I.A.; Poch, R.M.; Throop, H.L.; Vivoni, E.R. Legacy effects in linked ecological–soil–geomorphic systems of drylands. Front. Ecol. Environ. 2015, 13, 13–19. [Google Scholar] [CrossRef] [PubMed] [Green Version]
- Ma, M.; Wang, Q.; Liu, R.; Zhao, Y.; Zhang, D. Effects of climate change and human activities on vegetation coverage change in northern China considering extreme climate and time-lag and -accumulation effects. Sci. Total Environ. 2023, 860, 160527. [Google Scholar] [CrossRef]
- Qiu, R.; Li, X.; Han, G.; Xiao, J.; Ma, X.; Gong, W. Monitoring drought impacts on crop productivity of the U.S. Midwest with solar-induced fluorescence: GOSIF outperforms GOME-2 SIF and MODIS NDVI, EVI, and NIRv. Agric. For. Meteorol. 2022, 323, 109038. [Google Scholar] [CrossRef]
- Chai, Q.; Gan, Y.; Zhao, C.; Xu, H.-L.; Waskom, R.M.; Niu, Y.; Siddique, K.H.M. Regulated deficit irrigation for crop production under drought stress. A review. Agron. Sustain. Dev. 2015, 36, 3. [Google Scholar] [CrossRef] [Green Version]
- Guo, T.; Tian, C.; Chen, C.; Duan, Z.; Zhu, Q.; Sun, L.Z. Growth and carbohydrate dynamic of perennial ryegrass seedlings during PEG-simulated drought and subsequent recovery. Plant Physiol. Biochem. 2020, 154, 85–93. [Google Scholar] [CrossRef]
- Ye, C.; Sun, J.; Liu, M.; Xiong, J.; Zong, N.; Hu, J.; Huang, Y.; Duan, X.; Tsunekawa, A. Concurrent and Lagged Effects of Extreme Drought Induce Net Reduction in Vegetation Carbon Uptake on Tibetan Plateau. Remote Sens. 2020, 12, 2347. [Google Scholar] [CrossRef]
- Cheng, X.; An, S.; Chen, J.; Li, B.; Liu, Y.; Liu, S. Spatial relationships among species, above-ground biomass, N, and P in degraded grasslands in Ordos Plateau, northwestern China. J. Arid Environ. 2007, 68, 652–667. [Google Scholar] [CrossRef]
- Krull, E.S.; Skjemstad, J.O.; Burrows, W.H.; Bray, S.G.; Wynn, J.G.; Bol, R.; Spouncer, L.; Harms, B. Recent vegetation changes in central Queensland, Australia: Evidence from delta C-13 and C-14 analyses of soil organic matter. Geoderma 2005, 126, 241–259. [Google Scholar] [CrossRef]
- Scheffer, M.; Carpenter, S.R. Catastrophic regime shifts in ecosystems: Linking theory to observation. Trends Ecol. Evol. 2003, 18, 648–656. [Google Scholar] [CrossRef]
- Walker, B.H.; Meyers, J.A. Thresholds in Ecological and Social–Ecological Systems: A Developing Database. Ecol. Soc. 2004, 9, 3438–3447. [Google Scholar] [CrossRef]
- Chen, T.; Bao, A.; Jiapaer, G.; Guo, H.; Zheng, G.; Jiang, L.; Chang, C.; Tuerhanjiang, L. Disentangling the relative impacts of climate change and human activities on arid and semiarid grasslands in Central Asia during 1982–2015. Sci. Total Environ. 2018, 653, 1311–1325. [Google Scholar] [CrossRef]
- Huang, X.; Luo, G.; Han, Q. Temporospatial patterns of human appropriation of net primary production in Central Asia grasslands. Ecol. Indic. Integr. Monit. Assess. Manag. 2018, 91, 555–561. [Google Scholar] [CrossRef]
- Jiang, L.; Bao, A.; Jiapaer, G.; Guo, H.; Zheng, G.; Gafforov, K.; Kurban, A.; De Maeyer, P. Monitoring land sensitivity to desertification in Central Asia: Convergence or divergence? Sci. Total Environ. 2019, 658, 669–683. [Google Scholar] [CrossRef]
- Li, S.; He, S.; Xu, Z.; Liu, Y.; von Bloh, W. Desertification process and its effects on vegetation carbon sources and sinks vary under different aridity stress in Central Asia during 1990–2020. Catena 2023, 221, 106767. [Google Scholar] [CrossRef]
- Huang, W.; Duan, W.; Chen, Y. Unravelling lake water storage change in Central Asia: Rapid decrease in tail-end lakes and increasing risks to water supply. J. Hydrol. 2022, 614, 128546. [Google Scholar] [CrossRef]
- Ren, Y.; Li, Z.; Li, J.; Dashtseren, A.; Li, Y.; Altanbagana, M. Comparative analysis of driving forces of land use/cover change in the upper, middle and lower reaches of the Selenga River Basin. Land Use Policy 2022, 117, 106118. [Google Scholar] [CrossRef]
- Li, Q.; Li, X.; Ran, Y.; Feng, M.; Nian, Y.; Tan, M.; Chen, X. Investigate the relationships between the Aral Sea shrinkage and the expansion of cropland and reservoir in its drainage basins between 2000 and 2020. Int. J. Digit. Earth 2021, 14, 661–677. [Google Scholar] [CrossRef]
- Zan, C.; Liu, T.; Huang, Y.; Bao, A.; Yan, Y.; Ling, Y.; Wang, Z.; Duan, Y. Spatial and temporal variation and driving factors of wetland in the Amu Darya River Delta, Central Asia. Ecol. Indic. 2022, 139, 108898. [Google Scholar] [CrossRef]
Figure 1.
Land cover types in the study area in 2001. The numbers in the figure denote the following: (1) evergreen needleleaf forest; (2) evergreen broadleaf forest; (3) deciduous needleleaf forest; (4) deciduous broadleaf forest; (5) mixed forest; (6) closed shrubland; (7) open shrubland; (8) woody savanna; (9) savanna; (10) grassland; (11) permanent wetland; (12) cropland; (13) urban and built-up land; (14) cropland/natural vegetation mosaic; (15) permanent snow and ice; (16) barren land; and (17) water bodies.
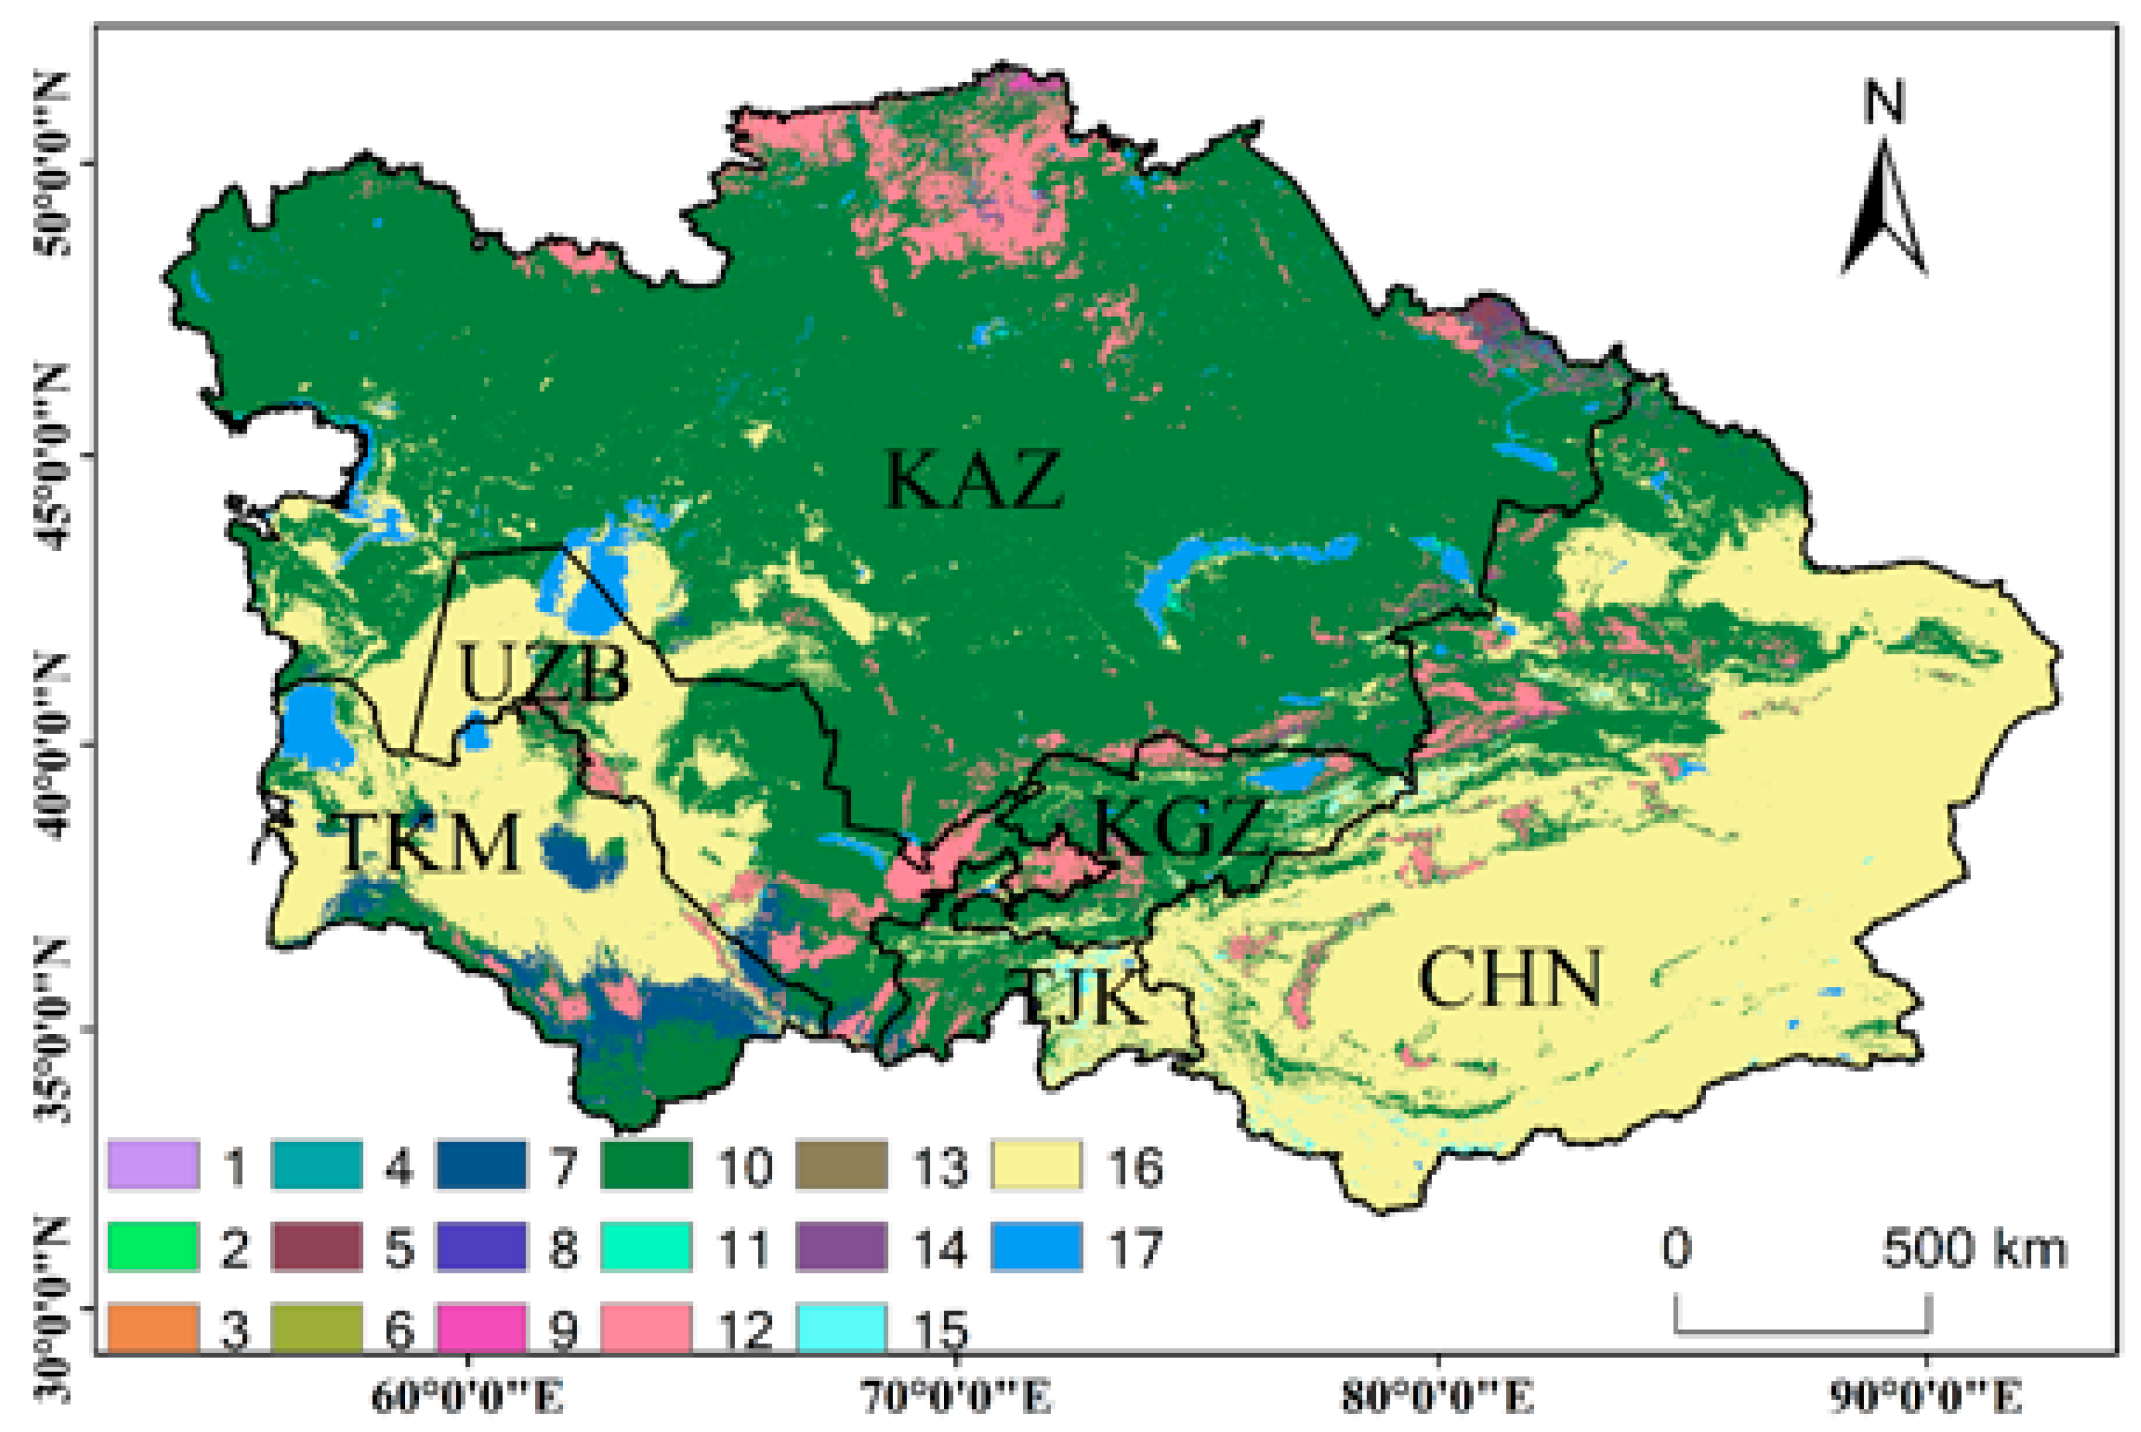
Figure 2.
SPEI statistics for Central Asia from 1901 to 2013. (a) SPEI frequency distribution from 1901 to 2013. (b) SPEI box diagram from 1901 to 2013.
Figure 2.
SPEI statistics for Central Asia from 1901 to 2013. (a) SPEI frequency distribution from 1901 to 2013. (b) SPEI box diagram from 1901 to 2013.

Figure 3.
Changes in the SPEI in Central Asia: (a) SPEI changes from 1901 to 2013. The blue box represents the study period. (b) monthly SPEI changes from 2000 to 2013. The green box represents the period of extreme wetness in 2002 and 2003, and the red box represents the period of drought in 2008.
Figure 3.
Changes in the SPEI in Central Asia: (a) SPEI changes from 1901 to 2013. The blue box represents the study period. (b) monthly SPEI changes from 2000 to 2013. The green box represents the period of extreme wetness in 2002 and 2003, and the red box represents the period of drought in 2008.

Figure 4.
Spatial distribution of the SPEI in Central Asia in 2002 (a), 2003 (b), and 2008 (c); (d) shows the percentages of drought classification areas in different years. The white pixels represent areas with no data.
Figure 4.
Spatial distribution of the SPEI in Central Asia in 2002 (a), 2003 (b), and 2008 (c); (d) shows the percentages of drought classification areas in different years. The white pixels represent areas with no data.

Figure 5.
Spatial distribution of resistance in Central Asia in 2002 (a), 2003 (b), 2008 (c); (d) shows the percentages of the resistance classification areas in different years.
Figure 5.
Spatial distribution of resistance in Central Asia in 2002 (a), 2003 (b), 2008 (c); (d) shows the percentages of the resistance classification areas in different years.

Figure 6.
Spatial distribution of resilience after extreme wetting (a) and drought (b) events in Central Asia.
Figure 6.
Spatial distribution of resilience after extreme wetting (a) and drought (b) events in Central Asia.

Figure 7.
Changes in ecosystem resistance with drought intensity in 2002, 2003 (a), and 2008 (b).

Figure 8.
Changes in ecosystem resilience with drought intensity (a) Extreme wet period, 2002–2003, (b) drought period, 2008.
Figure 8.
Changes in ecosystem resilience with drought intensity (a) Extreme wet period, 2002–2003, (b) drought period, 2008.


Table 1.
Drought classification based on the SPEI.
| SPEI | Drought Classification |
|---|---|
| ≤−2.0 | Extreme drought |
| −2.0–−1.0 | Moderate drought |
| −1.0–−0.5 | Mild drought |
| −0.5–0.5 | Normal |
| 0.5–1.0 | Mild wet |
| 1.0–2.0 | Moderate wet |
| ≥2.0 | Extreme wet |
Table 2.
Changes in land cover types from 2001 to 2004, unit: km2.
| Land Cover Types | Abbreviation | Area in 2001 | Area in 2004 | Change Area | Percentages of Change (%) |
|---|---|---|---|---|---|
| Evergreen Needleleaf forest | CL.1 | 1374.00 | 1426.00 | 52.00 | 3.78 |
| Evergreen Broadleaf forest | CL.2 | 12.00 | 10.00 | −2.00 | −16.67 |
| Deciduous Needleleaf forest | CL.3 | 206.00 | 165.00 | −41.00 | −19.90 |
| Deciduous Broadleaf Forest | CL.4 | 3299.00 | 1872.00 | −1427.00 | −43.26 |
| Mixed Forest | CL.5 | 10,407.00 | 9371.00 | −1036.00 | −9.95 |
| Closed Shrublands | CL.6 | 406.00 | 425.00 | 19.00 | 4.68 |
| Open Shrublands | CL.7 | 94,815.00 | 98,688.00 | 3873.00 | 4.08 |
| Woody Savannas | CL.8 | 6421.00 | 7827.00 | 1406.00 | 21.90 |
| Savannas | CL.9 | 14,151.00 | 13,616.00 | −535.00 | −3.78 |
| Grassland | CL.10 | 3,204,181.00 | 3,216,833.00 | 12,652.00 | 0.39 |
| Permanent Wetland | CL.11 | 9971.00 | 10,121.00 | 150.00 | 1.50 |
| Croplands | CL.12 | 269,326.00 | 270,230.00 | 904.00 | 0.34 |
| Urban and Built-up Lands | CL.13 | 21,551.00 | 21,574.00 | 23.00 | 0.11 |
| Cropland/Natural Vegetation Mosaics | CL.14 | 389.00 | 312.00 | −77.00 | −19.79 |
| Permanent Snow and Ice | CL.15 | 25,159.00 | 33,942.00 | 8783.00 | 34.91 |
| Barren | CL.16 | 1,855,576.00 | 1,829,938.00 | −25,638.00 | −1.38 |
| Water Bodies | CL.17 | 122,960.00 | 123,854.00 | 894.00 | 0.73 |
Table 3.
Transition matrix of the areas of different land cover types in Central Asia from 2001 to 2004, unit: km2.
Table 3.
Transition matrix of the areas of different land cover types in Central Asia from 2001 to 2004, unit: km2.
| CL.1 | CL.2 | CL.3 | CL.4 | CL.5 | CL.6 | CL.7 | CL.8 | CL.9 | CL.10 | CL.11 | CL.12 | CL.13 | CL.14 | CL.15 | CL.16 | CL.17 | |
| CL.1 | 1220 | 0 | 0 | 0 | 5 | 0 | 0 | 63 | 2 | 50 | 33 | 0 | 0 | 0 | 0 | 1 | 0 |
| CL.2 | 0 | 10 | 0 | 0 | 0 | 0 | 0 | 0 | 0 | 0 | 0 | 0 | 0 | 0 | 2 | 0 | 0 |
| CL.3 | 0 | 0 | 88 | 1 | 1 | 0 | 0 | 47 | 10 | 48 | 10 | 0 | 0 | 0 | 0 | 1 | 0 |
| CL.4 | 0 | 0 | 0 | 1807 | 137 | 71 | 0 | 662 | 265 | 354 | 0 | 1 | 0 | 2 | 0 | 0 | 0 |
| CL.5 | 63 | 0 | 68 | 39 | 9162 | 0 | 0 | 761 | 142 | 155 | 14 | 0 | 0 | 0 | 2 | 1 | 0 |
| CL.6 | 0 | 0 | 0 | 4 | 0 | 317 | 0 | 40 | 19 | 26 | 0 | 0 | 0 | 0 | 0 | 0 | 0 |
| CL.7 | 0 | 0 | 0 | 0 | 0 | 0 | 89,908 | 2 | 2 | 4509 | 0 | 11 | 0 | 0 | 29 | 352 | 2 |
| CL.8 | 58 | 0 | 8 | 8 | 40 | 24 | 4 | 5383 | 368 | 474 | 10 | 0 | 0 | 6 | 25 | 12 | 1 |
| CL.9 | 4 | 0 | 0 | 7 | 6 | 0 | 5 | 369 | 11,369 | 2341 | 31 | 10 | 1 | 7 | 0 | 1 | 0 |
| CL.10 | 44 | 0 | 1 | 6 | 15 | 13 | 4919 | 486 | 1349 | 3,167,638 | 1315 | 17,706 | 19 | 32 | 27 | 10,326 | 285 |
| CL.11 | 37 | 0 | 0 | 0 | 5 | 0 | 0 | 11 | 35 | 895 | 8515 | 2 | 0 | 0 | 0 | 157 | 314 |
| CL.12 | 0 | 0 | 0 | 0 | 0 | 0 | 13 | 0 | 2 | 16,836 | 1 | 252,451 | 2 | 18 | 0 | 2 | 1 |
| CL.13 | 0 | 0 | 0 | 0 | 0 | 0 | 0 | 0 | 0 | 0 | 0 | 0 | 21,551 | 0 | 0 | 0 | 0 |
| CL.14 | 0 | 0 | 0 | 0 | 0 | 0 | 0 | 3 | 53 | 40 | 0 | 46 | 0 | 247 | 0 | 0 | 0 |
| CL.15 | 0 | 0 | 0 | 0 | 0 | 0 | 2 | 0 | 0 | 100 | 2 | 0 | 0 | 0 | 23,875 | 1131 | 49 |
| CL.16 | 0 | 0 | 0 | 0 | 0 | 0 | 3837 | 0 | 0 | 23,328 | 86 | 3 | 1 | 0 | 9967 | 1,817,546 | 808 |
| CL.17 | 0 | 0 | 0 | 0 | 0 | 0 | 0 | 0 | 0 | 39 | 104 | 0 | 0 | 0 | 15 | 408 | 122,394 |
Table 4.
Changes in the areas of different land cover types from 2007 to 2009, unit: km2.
| Land Cover Types | Abbreviation | Area in 2007 | Area in 2009 | Change Area | Percentages of Change (%) |
|---|---|---|---|---|---|
| Evergreen Needleleaf forest | CL.1 | 1617.00 | 1646.00 | 29.00 | 1.79 |
| Evergreen Broadleaf forest | CL.2 | 10.00 | 10.00 | 0.00 | 0.00 |
| Deciduous Needleleaf forest | CL.3 | 182.00 | 170.00 | −12.00 | −6.59 |
| Deciduous Broadleaf Forest | CL.4 | 1468.00 | 1245.00 | −223.00 | −15.19 |
| Mixed Forest | CL.5 | 8965.00 | 8748.00 | −217.00 | −2.42 |
| Closed Shrublands | CL.6 | 284.00 | 309.00 | 25.00 | 8.80 |
| Open Shrublands | CL.7 | 106,585.00 | 114,514.00 | 7929.00 | 7.44 |
| Woody Savannas | CL.8 | 8818.00 | 9162.00 | 344.00 | 3.90 |
| Savannas | CL.9 | 14,253.00 | 14,004.00 | −249.00 | −1.75 |
| Grassland | CL.10 | 3,197,295.00 | 3,187,299.00 | −9996.00 | −0.31 |
| Permanent Wetland | CL.11 | 9776.00 | 9228.00 | −548.00 | −5.61 |
| Croplands | CL.12 | 272,627.00 | 268,068.00 | −4559.00 | −1.67 |
| Urban and Built-up Lands | CL.13 | 21,606.00 | 21,623.00 | 17.00 | 0.08 |
| Cropland/Natural Vegetation Mosaics | CL.14 | 343.00 | 371.00 | 28.00 | 8.16 |
| Permanent Snow and Ice | CL.15 | 37,184.00 | 43,477.00 | 6293.00 | 16.92 |
| Barren | CL.16 | 1,835,808.00 | 1,837,774.00 | 1966.00 | 0.11 |
| Water Bodies | CL.17 | 123,383.00 | 122,556.00 | −827.00 | −0.67 |
Table 5.
Transition matrix of the areas of land cover types in Central Asia from 2007 to 2009, unit: km2.
Table 5.
Transition matrix of the areas of land cover types in Central Asia from 2007 to 2009, unit: km2.
| CL.1 | CL.2 | CL.3 | CL.4 | CL.5 | CL.6 | CL.7 | CL.8 | CL.9 | CL.10 | CL.11 | CL.12 | CL.13 | CL.14 | CL.15 | CL.16 | CL.17 | |
| CL.1 | 1524 | 0 | 0 | 0 | 2 | 0 | 0 | 15 | 0 | 60 | 16 | 0 | 0 | 0 | 0 | 0 | 0 |
| CL.2 | 0 | 10 | 0 | 0 | 0 | 0 | 0 | 0 | 0 | 0 | 0 | 0 | 0 | 0 | 0 | 0 | 0 |
| CL.3 | 2 | 0 | 140 | 0 | 2 | 0 | 0 | 26 | 1 | 10 | 1 | 0 | 0 | 0 | 0 | 0 | 0 |
| CL.4 | 0 | 0 | 0 | 1163 | 81 | 7 | 0 | 155 | 32 | 30 | 0 | 0 | 0 | 0 | 0 | 0 | 0 |
| CL.5 | 41 | 0 | 14 | 17 | 8549 | 0 | 0 | 302 | 23 | 17 | 2 | 0 | 0 | 0 | 0 | 0 | 0 |
| CL.6 | 0 | 0 | 0 | 1 | 0 | 240 | 0 | 19 | 3 | 21 | 0 | 0 | 0 | 0 | 0 | 0 | 0 |
| CL.7 | 0 | 0 | 0 | 0 | 0 | 0 | 103,864 | 7 | 1 | 923 | 0 | 13 | 0 | 0 | 9 | 1768 | 0 |
| CL.8 | 44 | 0 | 10 | 52 | 83 | 31 | 1 | 7970 | 232 | 385 | 2 | 0 | 0 | 7 | 1 | 0 | 0 |
| CL.9 | 3 | 0 | 3 | 9 | 11 | 8 | 1 | 375 | 12,590 | 1211 | 12 | 3 | 3 | 23 | 0 | 1 | 0 |
| CL.10 | 23 | 0 | 2 | 3 | 20 | 22 | 9661 | 279 | 1094 | 3,159,968 | 138 | 9689 | 13 | 20 | 113 | 16,241 | 9 |
| CL.11 | 9 | 0 | 1 | 0 | 0 | 0 | 0 | 8 | 18 | 1037 | 8611 | 1 | 0 | 0 | 9 | 69 | 13 |
| CL.12 | 0 | 0 | 0 | 0 | 0 | 0 | 11 | 0 | 5 | 14,239 | 1 | 258,346 | 1 | 24 | 0 | 0 | 0 |
| CL.13 | 0 | 0 | 0 | 0 | 0 | 0 | 0 | 0 | 0 | 0 | 0 | 0 | 21,606 | 0 | 0 | 0 | 0 |
| CL.14 | 0 | 0 | 0 | 0 | 0 | 0 | 0 | 6 | 4 | 22 | 0 | 14 | 0 | 297 | 0 | 0 | 0 |
| CL.15 | 0 | 0 | 0 | 0 | 0 | 1 | 3 | 0 | 0 | 13 | 0 | 0 | 0 | 0 | 33,930 | 3220 | 17 |
| CL.16 | 0 | 0 | 0 | 0 | 0 | 0 | 973 | 0 | 1 | 9200 | 110 | 2 | 0 | 0 | 9400 | 1,815,852 | 270 |
| CL.17 | 0 | 0 | 0 | 0 | 0 | 0 | 0 | 0 | 0 | 163 | 335 | 0 | 0 | 0 | 15 | 623 | 122,247 |
Disclaimer/Publisher’s Note: The statements, opinions and data contained in all publications are solely those of the individual author(s) and contributor(s) and not of MDPI and/or the editor(s). MDPI and/or the editor(s) disclaim responsibility for any injury to people or property resulting from any ideas, methods, instructions or products referred to in the content. |
© 2023 by the authors. Licensee MDPI, Basel, Switzerland. This article is an open access article distributed under the terms and conditions of the Creative Commons Attribution (CC BY) license (https://creativecommons.org/licenses/by/4.0/).
Share and Cite
MDPI and ACS Style
Zou, J.; Ding, J.; Huang, S.; Liu, B. Ecosystem Resistance and Resilience after Dry and Wet Events across Central Asia Based on Remote Sensing Data. Remote Sens. 2023, 15, 3165. https://doi.org/10.3390/rs15123165
AMA Style
Zou J, Ding J, Huang S, Liu B. Ecosystem Resistance and Resilience after Dry and Wet Events across Central Asia Based on Remote Sensing Data. Remote Sensing. 2023; 15(12):3165. https://doi.org/10.3390/rs15123165
Chicago/Turabian StyleZou, Jie, Jianli Ding, Shuai Huang, and Bohua Liu. 2023. "Ecosystem Resistance and Resilience after Dry and Wet Events across Central Asia Based on Remote Sensing Data" Remote Sensing 15, no. 12: 3165. https://doi.org/10.3390/rs15123165
Note that from the first issue of 2016, this journal uses article numbers instead of page numbers. See further details here.