Article

The Mean Moment of Inertia for Irregularly Shaped Phobos and Its Application to the Constraint for the Two-Layer Interior Structure for the Martian Moon

1
School of Physics and Electronic Science, Guizhou Normal University, Guiyang 550025, China
2
State Key Laboratory of Information Engineering in Surveying, Mapping and Remote Sensing, Wuhan University, Wuhan 430079, China
*
Author to whom correspondence should be addressed.
Remote Sens. 2023, 15(12), 3162; https://doi.org/10.3390/rs15123162
Submission received: 22 April 2023 / Revised: 31 May 2023 / Accepted: 10 June 2023 / Published: 17 June 2023
(This article belongs to the Special Issue Planetary Geodesy and Geophysics of Asteroid: Data and Modeling)

Abstract

:
The interior structure of Phobos has been the subject of debate in recent years, with the moment of inertia being a determining factor. To study this structure, we modeled Phobos with a two-layer structure and calculated its mean density and moment of inertia using updated gravity coefficients of degree-2 and forced libration amplitudes. By minimizing the misfit between modeled and derived moment of inertia, and observed and modeled mean density, we determined the frequency distribution for estimated parameters, including the core radius rc, core density ρc, and density ρm of the outer layer. Our results indicate that the optimized core radius is around 8.2 km for our models, along with a core density compromise of approximately 2500 kg·m−3, and an outer layer density of around 1400 kg·m−3. These values have remarkable sensitivity to the misfit function, implying a higher density likely inside Phobos compared to the outer layer. Given that the large core density was associated with ice content, it suggested that the fractional ice content in the outer layer is approximately 11% with a rock density of 2200 kg·m−3, while the content in the core is lower at 2.4% with a rock density of 3000 kg·m−3. The methodology introduced in this study can be further used to study the interior structure of irregularly shaped asteroids.

1. Introduction

Phobos is a natural satellite of Mars and is the larger of the two Martian satellites, with Deimos being the smaller one. Phobos has an irregularly shaped surface with a mean radius close to 11 km, as reported by Willner et al. [1]. Phobos’ surface is heavily cratered, with many craters spread over its surface, likely suggesting its feature of a relatively old satellite [2]. The dominant feature of the body is Stickney, which is the largest crater on the moon with a diameter of approximately 9.5 km [3]. The origin of Phobos and its composition are not yet fully understood [4,5]. It likely originated from a recycling process in which the progenitors from the impacting process perhaps were destroyed into a Roche interior ring and re-accreted several times [6]. To understand the formation of Phobos, it is crucial to examine its interior structure. By analyzing its structure, we can gain insight into its origin and evolutionary history.
While radar data can provide some information on the interior structure of Phobos, a direct exploration of the moon is crucial to accurately determine its moment of inertia. The moment of inertia is closely related to the density distribution inside Phobos. However, there has been no direct measurement of Phobos, except for a few measurements obtained during flybys of orbiters approaching Mars. As a result, the interior structure of Phobos remains an open issue. To determine the origin of Phobos, the Japan Aerospace Exploration Agency (JAXA) plans to carry out a direct survey of the Martian Moons eXploration (MMX) mission in 2024 [7,8]. Prior to the MMX mission, numerous studies attempted to detect the interior structure of Phobos [1,4,9,10,11,12]. Recently, Le Maistre et al. [13] investigated the likely interior structure of Phobos by analyzing its tidal response to Mars, while Dmitrovskii et al. [14] attempted to study this subject by analyzing the tidal bulge height.
In addition to the research mentioned above, another way to explore the interior structure of Phobos is to consider its mean density and moment of inertia. This approach was used in the past by Sohl et al. [15] to determine the composition and structure of the Martian interior. Their method involved modeling both the moment of inertia and bulk density of the nearly spherical Mars. By comparing the difference between the observed and modeled moment of inertia and the misfit between the observed and modeled mean density, they were able to estimate the density distribution as well as the interior structure of Mars. Yan et al. [16] used a similar method to identify the size and composition of the lunar core. Based on the precession rate from InSight [17], we recently used a similar method to investigate the potential size and density of the Martian inner core [18]. Similarly, this method could be applied to small celestial bodies by estimating the mean density and moment of inertia and comparing them with modeled values. However, it should be noted that this approach is quite challenging for small celestial bodies with irregular shapes, such as asteroids and moons of planets. Most small bodies in the real world are irregularly shaped and do not achieve quasi-hydrostatic equilibrium. Therefore, the method proposed by Sohl et al. [15] needs to be updated to include the case of irregular shapes.
We thus deduced an expression to calculate the moment of inertia and mean density for bodies with irregular shapes. Using the updated method, we estimated the likely structure of Phobos by considering the recent degree-2 gravity coefficients as well as the forced libration amplitude of Phobos. The updated gravity coefficients of degree-2 were derived from MEX Doppler-tracking data by Yang et al. [19]. The forced libration amplitudes of Phobos were updated in recent studies by Burmeister et al. [12] and Lainey et al. [11]. We used these updated values of degree-2 gravity coefficients and libration amplitudes to deduce the moment of inertia for Phobos. By comparing this deduced value and our modeled moments of inertia, we can gain insight into the distribution of mass and the interior structure of Phobos. Due to the lack of information on Phobos’ interior structure, it has been previously assumed to be homogeneous. However, other models have proposed a multilayer structure based on density and forced libration observations [10] or a rubble pile composition that includes voids and/or water ice [1,19,20,21].
To validate our method, the interior structure of Phobos was modeled here as a two-layered structure with varying densities. The positive density gradient in our study indicates that the density of the core was greater than that of the outer layer. Conversely, the negative gradient suggests that the density of the core was lower than that of the outer layer. If Phobos had multiple layers inside, then the density distribution inside the moon would be continuous, and the estimated densities of the two-layer model would be represented as mean values. Additionally, an approximate zero density gradient indicates a homogeneous interior structure within Phobos. The two-layer model discussed here is thus applicable in cases where a density gradient exists and can account for the case where Phobos has a continuous density distribution. This paper is structured as follows. In Section 2, we present two models, each consisting of two layers. In Section 3, we describe our methodology of the moment of inertia and misfit function. In Section 4 and Section 5, we present the results and discussion. Finally, Section 6 summarizes the conclusions.

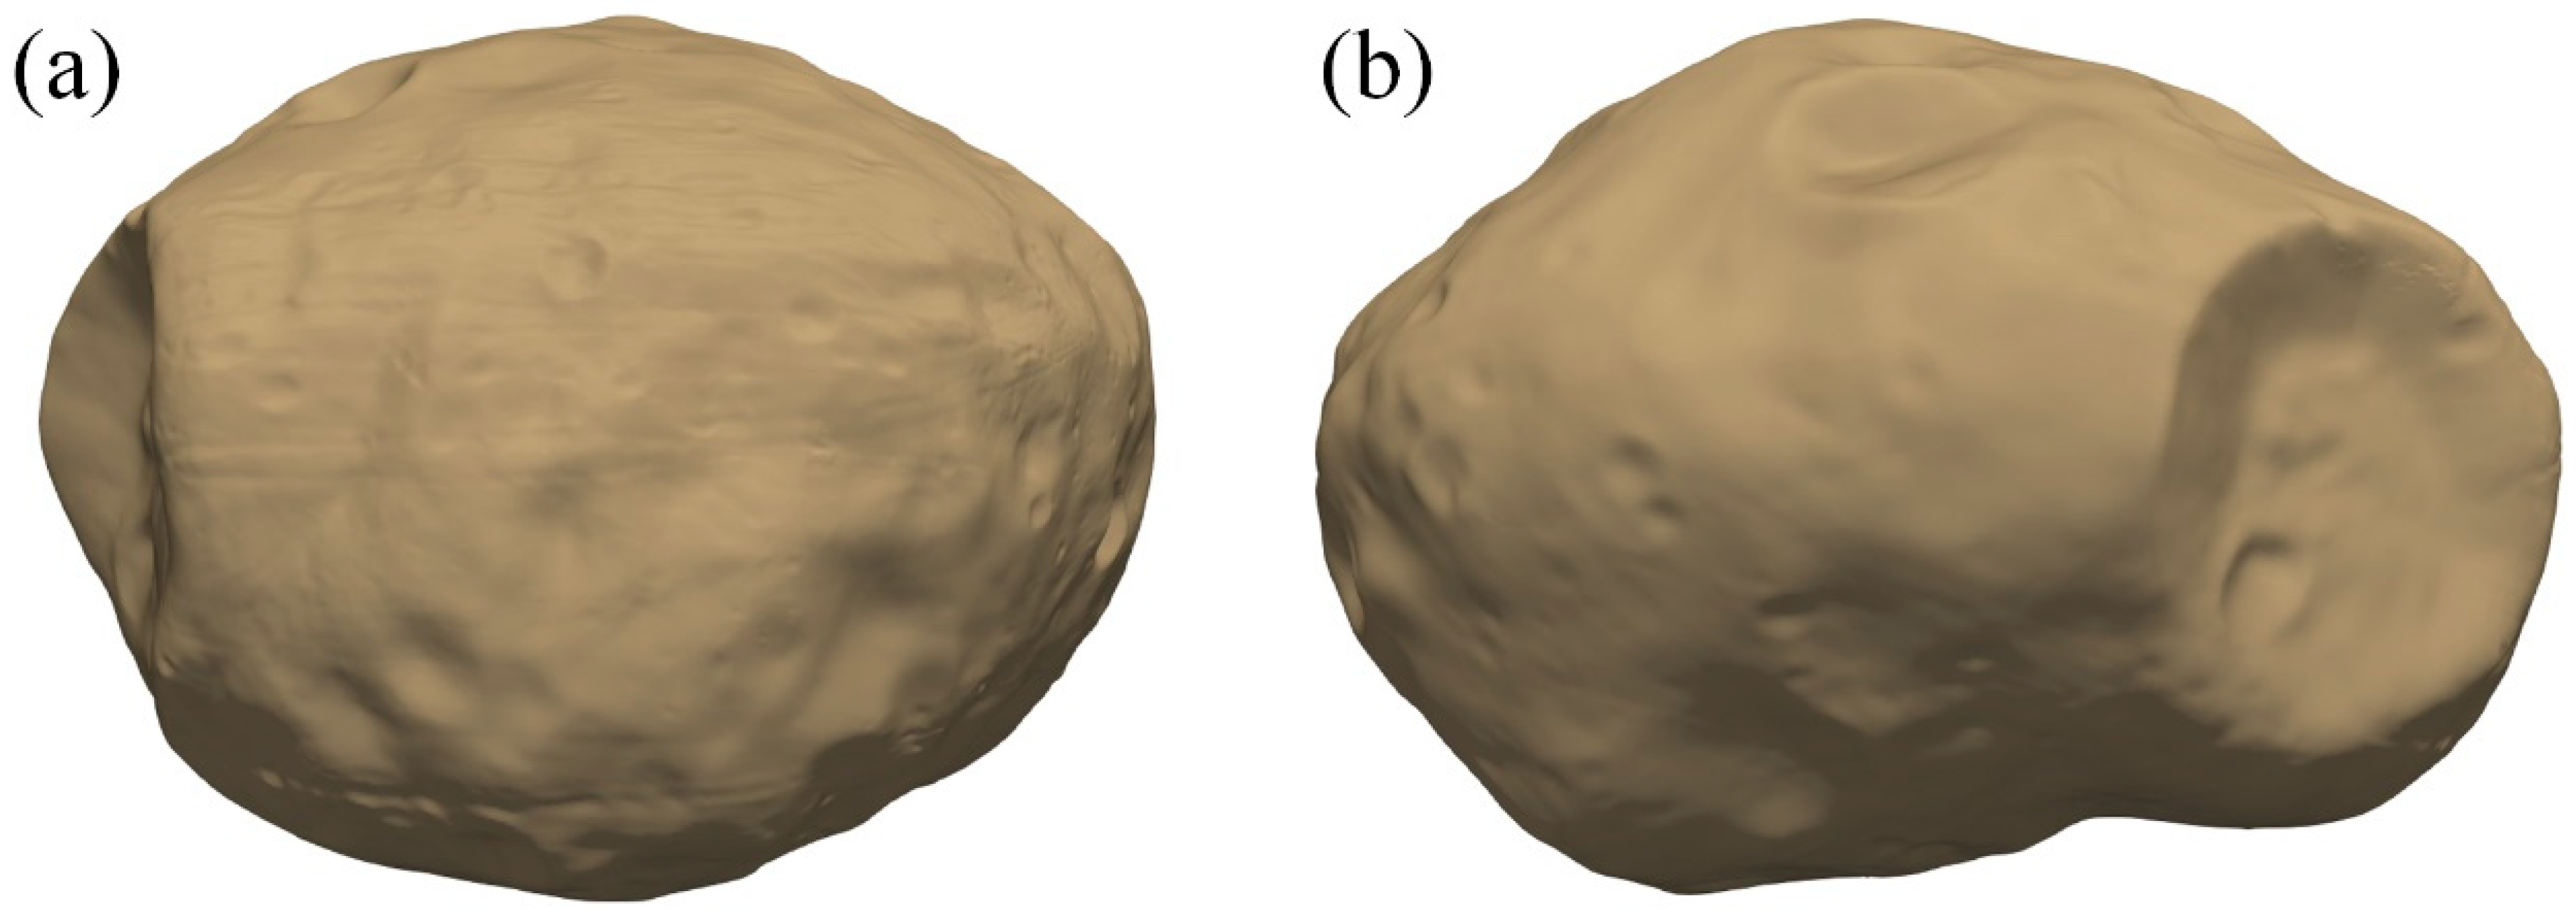
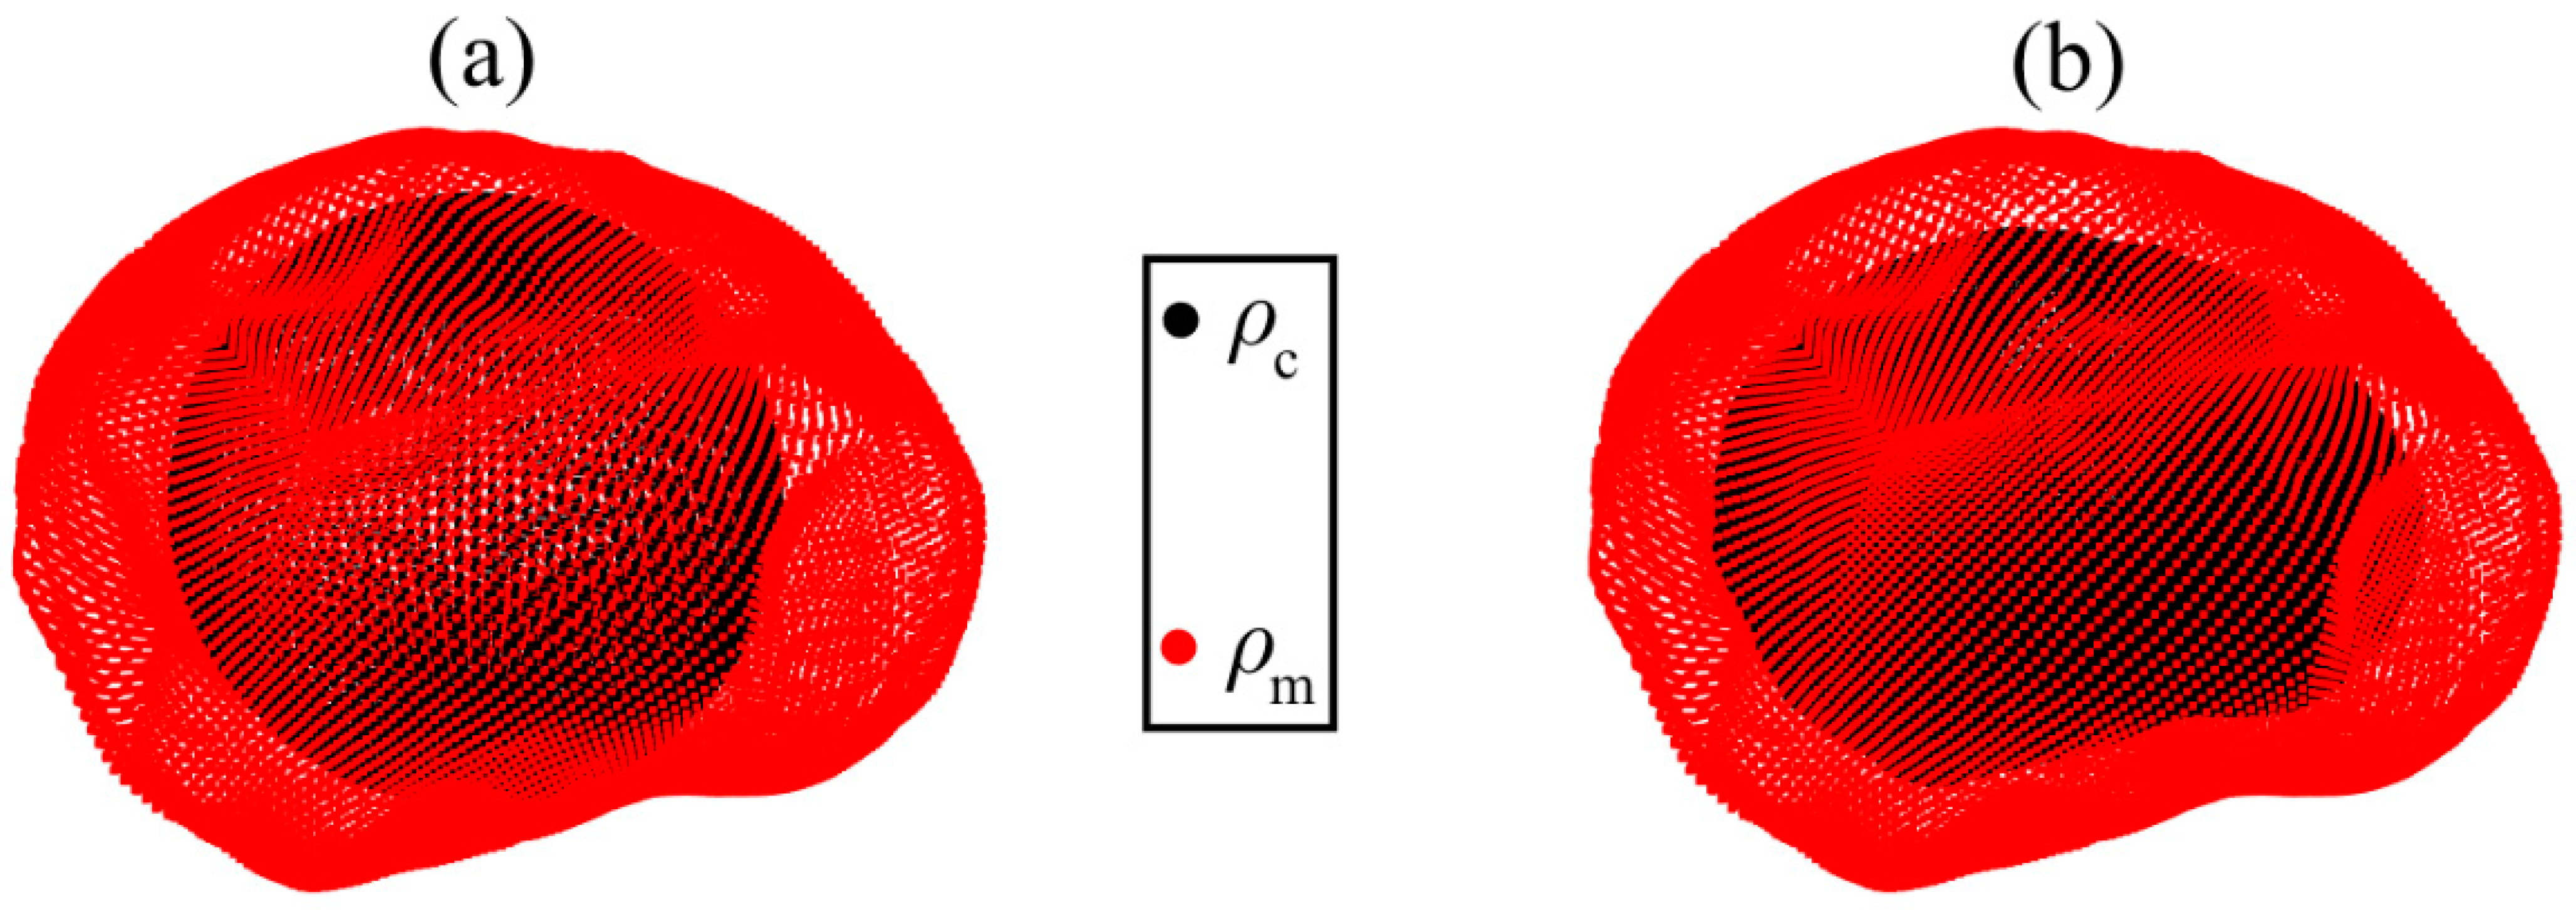
2. Shape of Phobos and Its Two-Layer Model

The Phobos shape model was first derived as an ellipsoidal model by Thomas in 1989 [22]. Then, Simonelli et al. [23] generated a shape model with 2 × 2 degree grid spacing. Using image data from the European Mars Express Mission, Willner et al. [10] derived a shape model expanded with a spherical harmonic function close to degree and order 17. Subsequently, Willner et al. [1] used stereo images from Mars Express and Viking Orbiter to derive a global digital terrain model (DTM) with 100 m/pixel resolution. This DTM is widely used in Phobos gravity forward modeling and surface properties research [13,19,24,25]. The DTM derived by Willner et al. [1], which is available online [26], is shown in Figure 1. Phobos is tidally locked to Mars, which means that the same side of Phobos always faces Mars. This side is known as the sub-Mars side, which is shown in Figure 1a. The leading side of Phobos is the side that faces forward in its orbit around Mars, in the direction of its movement. This side of Phobos is displayed in Figure 1b.
Recent studies on the interior structure of Phobos have considered the possibility that the density of its interior may vary with depth [13,14,27]. Studies have also suggested that a two-layer model, with a solid core and an outer layer composed of rock and ice, is appropriate to explain the gravity coefficients of low degrees [21,28]. We opted for a two-layer model when estimating Phobos’ internal structure for several reasons. Firstly, the limited constraint information available for Phobos makes multi-layer models highly uncertain. Secondly, given the small volume of Phobos, it is unlikely that large-scale differentiation processes occurred in its interior. Finally, we accounted for Phobos’ irregular shape when calculating its mean moment of inertia. Models with more than three layers would increase complexity and hinder the estimation of model parameters. Therefore, based on these considerations, we only used a two-layer model to estimate Phobos’ mean moment of inertia. The two-layer models are shown in Figure 2. Our two-layer model assumed that Phobos is composed of an inner solid core with a density of ρc, and an outer layer that is likely a mixture of rock and ice with a density of ρm. The black areas in the diagrams represent the solid cores, while the areas between the red outer shapes and the black areas represent the outer layers. Figure 2a shows Model-I with a spherical core, which is commonly considered a simplified internal structure of celestial bodies. Figure 2b displays Model-II with an irregularly shaped core that has a shape similar to the surface of Phobos. This model considers the core’s irregular shape to result from impacts or other geological processes. We used rc here as the radius of the core of Model-I in Figure 2a and considered the same sign as the mean radius of the core of Model-II in Figure 2b. It should be noted that the difference between the core density ρc and the density of the outer layer ρm cannot fully prove the differentiation of Phobos. An alternative possibility is that Phobos has a continuous density distribution, where the density gradually changes from the core to the outer layer. In the case of a continuous density distribution, the estimated density of the core ρc and the density ρm of the outer layer would be mean values, and the corresponding radius of the core rc would also be a mean value. This means that there would not be a sharp boundary between the core and the outer layer, but instead a gradual transition zone.

3. Theory and Method
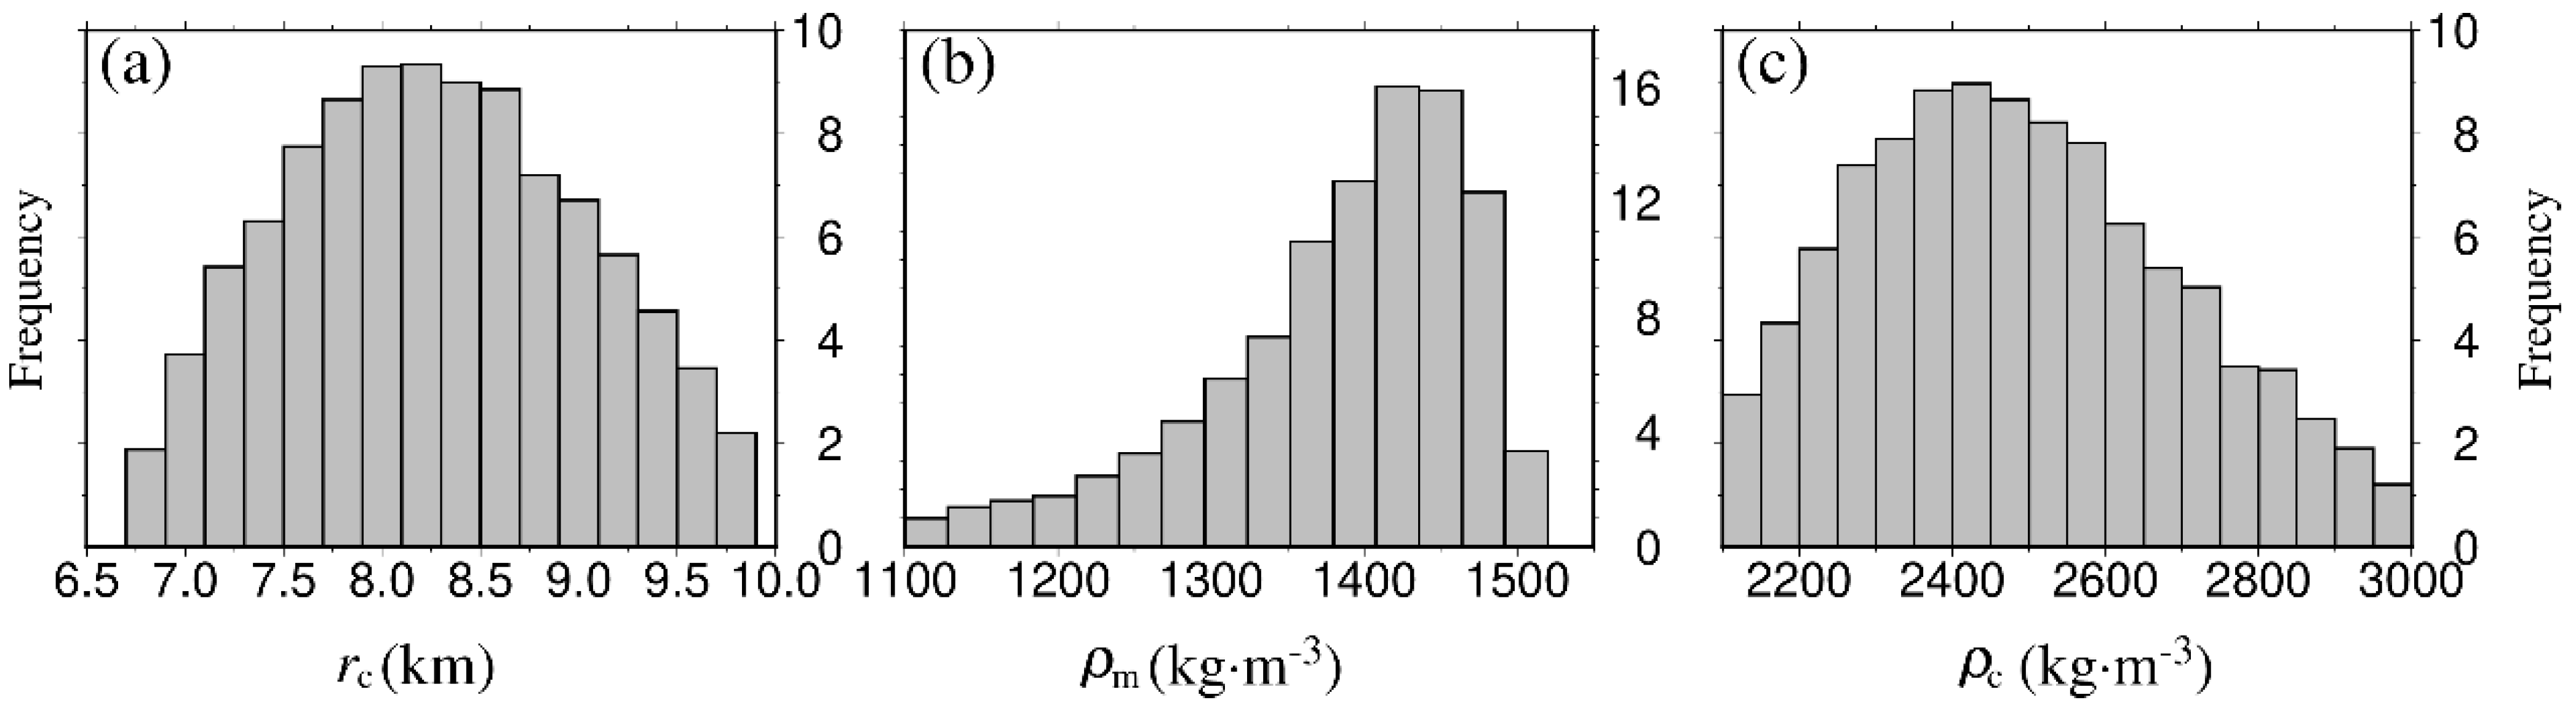
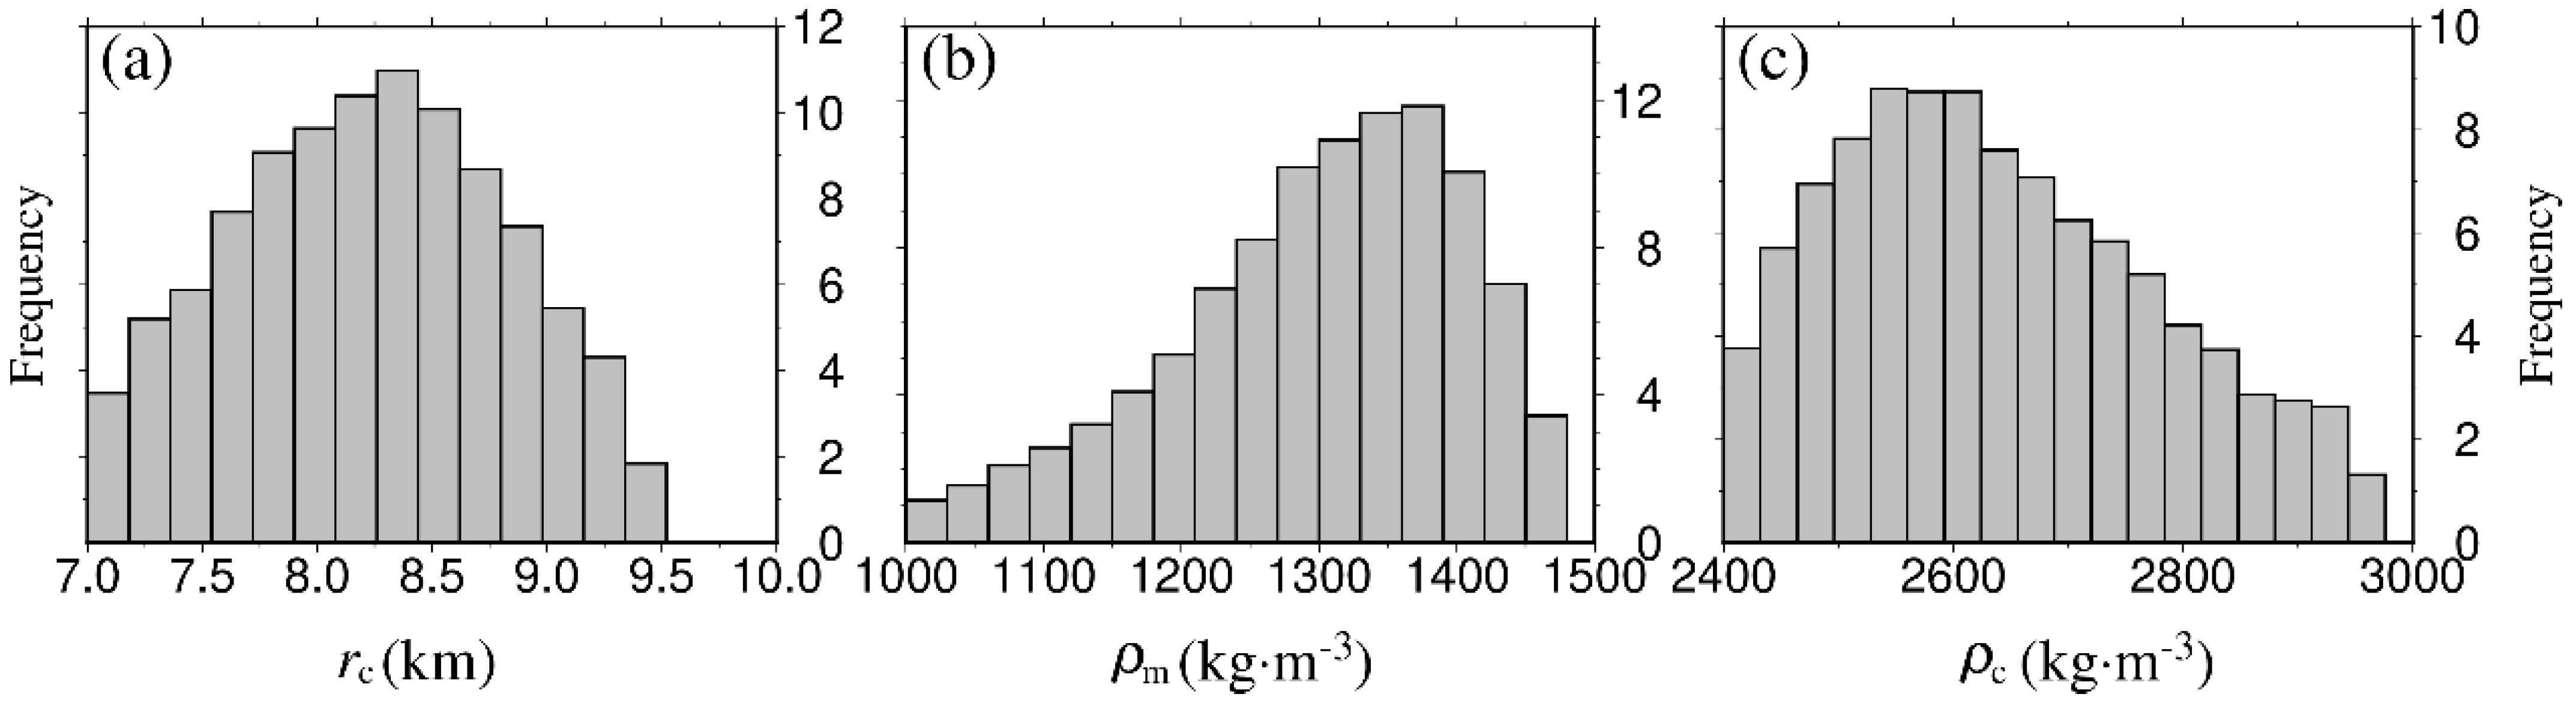
To explore the interior structure, it is needed to derive the moment of inertia with respect to gravity coefficients. According to previous studies [13,27,29], we can obtain the relations as follows:
A M R 2 = I M R 2 + C 2 , 0 3 + 2 C 2 , 2 , B M R 2 = I M R 2 + C 2 , 0 3 2 C 2 , 2
C M R 2 = I M R 2 2 C 2 , 0 3 ,   I = A + B + C 3
where A, B, and C are the main moments of inertia with ABC, and their mean value is represented by I. M and R represent the mass and the mean radius of Phobos, respectively. C2,0 and C2,2 denote the unnormalized gravity coefficients of degree-2, which were provided by recent studies [19]. Even with only Equation (1), it is yet impossible to determine the mean moment of inertia. The relative moment of inertia γ can be considered, which is associated with the forced libration amplitude θA. According to the study of Willner et al. [10], the relations are written as follows:
γ = B A C ,   γ = 1 3 1 2 e θ A
where e represents the orbital eccentricity of Phobos. The related parameters are shown in Table 1. According to Equations (1) and (2), the derived mean moment of inertia factor I/MR2 is written as follows:
I M R 2 = 2 3 C 2 , 0 + 12 C 2 , 2 1 2 e θ A
To detect the likely structure, we also need to calculate the modeled moment of inertia Imod as well as the modeled bulk density ρ m o d of Phobos. For Model-I in Figure 2a, we can derive the expression as follows:
I mod = ρ m 0 π 0 2 π 0 r p r 4 sin 3 θ d r d ϕ d θ ρ m 0 π 0 2 π 0 r c r 4 sin 3 θ d r d ϕ d θ + ρ c 0 π 0 2 π 0 r c r 4 sin 3 θ d r d ϕ d θ
ρ ¯ mod = ρ m + ρ c ρ m 4 π r c 3 3 V
where rp is the radius of a certain point on the surface of Phobos. θ and φ denote the colatitude and longitude of the point. The expression for Model-II in Figure 2b can be written as follows:
I mod = ρ m 0 π 0 2 π 0 r p r 4 sin 3 θ d r d ϕ d θ ρ m 0 π 0 2 π 0 r c R r p r 4 sin 3 θ d r d ϕ d θ + ρ c 0 π 0 2 π 0 r c R r p r 4 sin 3 θ d r d ϕ d θ
ρ ¯ mod = ρ m + ρ c ρ m r c R 3
It can be found that the estimation of Imod in Equations (4) and (6) can be quite complex due to the integrals. Regarding specific values of ρm and ρc, they remain constant and can be extracted directly from the integrals. We can first store the integral for certain densities. Here, we calculate the integral with Phobos mean density ρ as follows:
I 0 = ρ ¯ 0 π 0 2 π 0 r p r 4 sin 3 θ d r d ϕ d θ
Then, Equations (4) and (6) can be written as follows:
I mod = ρ m ρ ¯ I 0 + ρ c ρ m 8 15 π r c 5
I mod = ρ m ρ ¯ + ρ c ρ m ρ ¯ r c R 5 I 0
Considering Equations (5)–(10), we used the joint inversion of mean density and mean moment of inertia to calculate the misfit function f as follows:
f = ρ ¯ mod ρ ¯ 2 + I mod I 2
The appropriate parameters can be found by minimizing the misfit values according to Equation (11). Using Equations (5)–(11), the influence of the estimated parameter x on the misfit function f can be assessed according to the sensitivity function S(f, x), which is written as follows:
S f ,   x = Δ f / f Δ x / x = f x x f
The estimated parameter x includes the core radius rc, the core density ρc, and the outer layer density ρm. The best values for these parameters are those that result in misfit values close to zero, as a close-to-zero misfit indicates a good fit between the model and observed data. In cases where there is noise in the measured parameters, it may not be possible to achieve misfit values close to zero. In this situation, a threshold value of f < 0.1 was used as the inversion condition. The frequency distribution of these parameters can provide useful information about their optimized values [15,16].
To constrain the interior structure of Phobos, the estimated parameters (e.g., rc, ρc, and ρm) were sampled using an equal probability distribution. The frequency distribution of these parameters was obtained using the same threshold f < 0.1. By analyzing the frequency distribution, the interior structure of Phobos can be better understood and constrained. It is important to note that Equation (8) is nonlinear, which can make parameter estimation challenging. The particle swarm optimization (PSO) method simulates the social behavior of birds, bees, or schools of fish, and performs well in solving nonlinear problems with multiple parameters [32]. We considered the PSO method to estimate the optimized parameters of Phobos.

4. Results

For Model-I shown in Figure 2a, utilizes Equations (3), (5), (9), and (11) to estimate optimized parameters through a joint inversion of mean density and mean moment of inertia. Similarly, Equations (3), (7), (10), and (11) were considered to perform the inversion for Model-II in Figure 2b. Our study involved multiple experiments and comparisons, which showed that the frequency distribution of more than 1500 particles remained consistent. We further tested the case of more than 1000 iterations and confirmed that the resulting frequency distribution was the same as the case of 1000 iterations. We thus considered the PSO method with a population size of 1500 particles and 1000 iterations in our study. To ensure the stability of the frequency distribution, the PSO calculation was performed close to 10,000 times. By repeating the PSO calculation multiple times to reduce the impact of random noise on the results, we can obtain a more reliable estimation for the optimized parameters.
We used the fixed values in Table 1 to calculate the moment of inertia by using Equation (3), and obtained the frequency distribution of different parameters. The libration amplitudes provided by Oberst et al. [31] and Lainey et al. [11] are capable of generating normally distributed parameters, while the libration amplitudes provided by Burmeister et al. [11] cannot. The outcomes derived from the libration amplitudes provided by Oberst et al. [31] and Lainey et al. [11] are comparable due to the similar values of libration amplitudes. Therefore, we present the outcomes obtained by using the libration amplitudes provided by Lainey et al. [11] in Figure 3 and Figure 4.
Figure 3 and Figure 4 describe the frequency distributions of various parameters for the two models, Model-I and Model-II. In Figure 3a and Figure 4a, the core radius rc is the parameter being analyzed. It is found that the radius mainly centers around 8.2 km and fluctuates from approximately 7 to 10 km. Figure 3b and Figure 4b display the frequency distributions for the outer-layer density, denoted as ρm. In Figure 3b, the density ranges from 1127 to 1452 kg·m−3, with an optimized value of 1439 kg·m−3. Meanwhile, in Figure 4b, the density ranges from 1000 to 1427 kg·m−3, with a likely value of 1340 kg·m−3. The core density in Figure 3c centers around 2423 kg·m−3, varying from 2127 to 2985 kg·m−3. Figure 4c indicated that the core density is between 2425 and 2990 kg·m−3, with an optimized value near 2573 kg·m−3. These estimated parameters are also listed in Table 2.
If the estimated parameters are not sensitive to the misfit function, their optimized values will be meaningless. Therefore, we used Equation (12) to estimate the sensitivities for these estimated parameters based on the optimized values listed in Table 2. The results indicate that changes in the parameters could affect the misfit function, with a sensitivity of approximately −4.6 for the core radius for Model-I and −5.8 for Model-II. The outer layer density also has a sensitivity of around −6.2 for Model-I and close to −4.5 for Model-II. Both models have similar sensitivities for the core density, with values of −2.3 for Model-I and −2.4 for Model-II. Additionally, the core density has the lowest absolute value of sensitivity among all the parameters. However, a 1% increase in core density for Model-II would decrease the sensitivity of S2(f, ρc) by 2.4%. Overall, the estimated parameters are sensitive to changes in the misfit function. These inversed parameters are thus reliable in this study.

5. Discussion

Based on the optimized parameters in Table 1, we proposed a set of estimated parameter values. The core of Phobos is likely to have a size of approximately 8.2 km with a corresponding density of around 2500 kg·m−3. Additionally, the remaining density of the outer layer is close to 1400 kg·m−3. Our results nearly agree with a previous study by Willner et al. [10], in which they constructed a two-layer model with a 5 km thick outer layer with a density of 1600 kg·m−3 and found the remaining core with a bulk density close to 2800 kg·m−3. Our results also indicate a similar distribution of increased density as the model proposed by Dmitrovskii et al. [14], which presents two possible scenarios: one with a positive density gradient, and the other with discrete layers exhibiting increasing density with depth. In addition, even though the study of Guo et al. [21] demonstrated that Phobos’ core density was lower than that of its outer layer, they also discovered instances where the core density (ρc = 2200 kg·m−3) was greater than that the outer layer (ρm = 1810 kg·m−3). Our findings suggest that an increasing interior density with depth is a likely configuration for Phobos.
Regarding the origin of Phobos, a giant impact [33,34] resulting in primitive ring-moon recycling evolution [35] has been proposed. The water ice content is likely related to the process of re-accretion. Using the optimized radius and densities in this study, we speculated the fractional water ice content. It should be noted that the densities of the core and outer layer represent the average values for the corresponding layers. Moreover, they are the bulk densities for the respective layers. The regolith density of Phobos was observed to be approximately 1600 kg·m−3 [36], but the thickness of the regolith remains undetermined [21]. The numerical study demonstrated the regolith thickness to be close to tens of kilometers [20]. Considering that our models indicate an outer layer thickness of approximately 3 km and the regolith was formed due to small-impact erosion followed by re-accretion, it is likely that the rock density in the outer layer exceeds the observed regolith density of 1600 kg·m−3. Assuming an outer layer porosity of 30% [37] and a density of 930 kg·m−3 for water ice, we used a potential rock density of 2200 kg·m−3 to estimate the fractional water ice content, which was found to be approximately 11%. The mean value of rock density and the estimated content of water ice are close to previous studies [38,39]. Additionally, we used the potential rock density of carbonaceous compositions (~3000 kg·m−3) and a lower porosity of 15% than the outer layer to estimate the water ice content in the core. It was found that the fractional water ice content is around 2.4%, which is significantly lower than that of the outer layer. This result shows that the distribution of bulk density aligns with the likely formation of Phobos, providing a valuable reference for examining the interior structure of small bodies with irregular shapes.

6. Conclusions

The interior structure of Phobos has been a topic of debate in recent years, with the moment of inertia playing a crucial role in determining the density distribution inside the moon. New gravity coefficients of degree-2 were derived for Phobos from MEX Doppler-tracking data, along with updated forced libration amplitudes. Using the low-degree coefficients of gravity and the forced libration amplitudes, we determined the moment of inertia for Phobos. Before estimating its interior structure, two models with a two-layer interior structure were introduced, one consisting of a spherical core (Model-I) and another with an irregularly shaped surface similar to Phobos’ surface (Model-II). The estimated parameters for these models included the core radius rc, the core density ρc, and the density ρm of the outer layer. Based on these parameters, we derived the modeled moment of inertia and mean densities for the two models.
To speculate on the potential structure of Phobos, we considered the estimated parameters to be normally distributed and employed a joint inversion of mean density and mean moment of inertia using the PSO method. By minimizing the misfit between the derived and modeled moment of inertia as well as the observed and modeled mean density of Phobos, we obtained the frequency distribution for the estimated parameters. The results showed that the optimized radius of the core was around 8.2 km for both models, with a compromised core density of approximately 2500 kg·m−3 and an outer layer density of around 1400 kg·m−3.
We also tested the sensitivity of the estimated parameters on the misfit function and found that they were reliable. Finally, using the compromised values, we speculated on the possible water ice content of Phobos. The results indicated a fractional water ice content in the outer layer of approximately 11% with a rock density of 2200 kg·m−3, while the content in the core was lower at 2.4% with a rock density of 3000 kg·m−3. Compared with previous studies of similar methods, our methodology takes into account the irregular shape of celestial bodies. Consequently, our models are more suitable for estimating the internal structure of small celestial bodies by leveraging the mean moment of inertia and mean density. This work can serve as a reference for constraining the interior structure of irregularly shaped asteroids.

Author Contributions

Conceptualization, Z.Z.; Methodology, Z.Z.; Investigation, L.P.; Data curation, Q.W.; Writing—original draft, Z.Z.; Writing—review & editing, Z.Z. and J.Y. supervision, project administration, and funding acquisition, J.Y. All authors have read and agreed to the published version of the manuscript.

Funding

This research was supported by the National Natural Science Foundation of China under Grants 42030110 and 41874010.

Data Availability Statement

The shape model of Phobos is available at https://pds-geosciences.wustl.edu/mex/mex-msa-hrsc-5-refdr-phobos-maps-v1/mexhrs_5001/data/dtm/, accessed on 19 April 2023.

Acknowledgments

The authors would like to thank the PDS project, which provided the shape model of Phobos.

Conflicts of Interest

The authors declare no conflict of interest.

References

  1. Willner, K.; Shi, X.; Oberst, J. Phobos’ shape and topography models. Planet. Space Sci. 2014, 102, 51–59. [Google Scholar] [CrossRef] [Green Version]
  2. Schmedemann, N.; Kneisslm, T.; Ivanov, B.A.; Michael, G.G.; Wagner, R.J.; Neukum, G.; Ruesch, O.; Hiesinger, H.; Krohn, K.; Roatsch, T.; et al. The cratering record, chronology and surface ages of (4) Vesta in comparison to smaller asteroids and the ages of HED meteorites. Planet. Space Sci. 2014, 103, 104–130. [Google Scholar] [CrossRef] [Green Version]
  3. Syal, M.B.; Rovny, J.; Owen, J.M.; Miller, P. Excavating Stickney crater at Phobos. Geophys. Res. Lett. 2016, 43, 595–601. [Google Scholar]
  4. Matsumoto, K.; Hirata, N.; Ikeda, H.; Kouyama, T.; Senshu, H.; Yamamoto, K.; Noda, H.; Miyamoto, H.; Araya, A.; Araki, H.; et al. MMX geodesy investigations: Science requirements and observation strategy. Earth Planets Space 2021, 73, 226. [Google Scholar] [CrossRef]
  5. Poggiali, G.; Matsuoka, M.; Barucci, M.A.; Brucato, J.R.; Beck, P.; Fornasier, S.; Doressoundiram, A.; Merlin, F.; Alberini, A. Phobos and Deimos surface composition: Search for spectroscopic analogues Get access Arrow. Mon. Not. R. astron. Soc. 2022, 516, 465–476. [Google Scholar] [CrossRef]
  6. Hesselbrock, A.J.; Minton, D.A. An ongoing satellite–ring cycle of Mars and the origins of Phobos and Deimos. Nat. Geosci. 2017, 10, 266–269. [Google Scholar] [CrossRef]
  7. Usui, T.; Bajo, K.; Fujiya, W.; Furukawa, Y.; Koike, M.; Miura, Y.N.; Sugahara, H.; Tachibana, S.; Takano, Y.; Kuramoto, K. The Importance of Phobos Sample Return for Understanding the Mars-Moon System. Space Sci. Rev. 2020, 216, 49. [Google Scholar] [CrossRef]
  8. Kuramoto, K.; Kawakatsu, Y.; Fujimoto, M.; Araya, A.; Barucci, M.A.; Genda, H.; Hirata, N.; Ikeda, H.; Imamura, T.; Helbert, J.; et al. Martian moons exploration MMX: Sample return mission to Phobos elucidating formation processes of habitable planets. Earth Planets Space 2022, 74, 12. [Google Scholar] [CrossRef]
  9. Duxbury, T.C. The figure of Phobos. Icarus 1989, 78, 169–180. [Google Scholar] [CrossRef]
  10. Willner, K.; Oberst, J.; Hussmann, H.; Giese, B.; Hoffmann, H.; Matz, K.D.; Roatsch, T.; Duxbury, T. Phobos control point network, rotation, and shape. Earth Planet. Sc. Lett. 2010, 294, 541–546. [Google Scholar] [CrossRef]
  11. Lainey, V.; Pasewaldt, A.; Robert, V.; Rosenblatt, P.; Jaumann, R.; Oberst, J.; Roatsch, T.; Willner, K.; Ziese, R.; Thuillot, W. Mars moon ephemerides after 14 years of Mars Express data. Astron. Astrophys. 2021, 650, A64. [Google Scholar] [CrossRef]
  12. Burmeister, S.; Willner, K.; Schmidt, V.; Oberst, J. Determination of Phobos’ rotational parameters by an inertial frame bundle block adjustment. J. Geodesy. 2018, 92, 963–973. [Google Scholar] [CrossRef]
  13. Le Maistre, S.; Rivoldini, A.; Rosenblatt, P. Signature of Phobos’ interior structure in its gravity field and libration. Icarus 2019, 321, 272–290. [Google Scholar] [CrossRef]
  14. Dmitrovskii, A.A.; Khan, A.; Boehm, C.; Bagheri, A.; Driel, M.V.C. Constraints on the interior structure of Phobos from tidal deformation modeling. Icarus 2022, 372, 114714. [Google Scholar] [CrossRef]
  15. Sohl, F.; Schubert, G.; Spohn, T. Geophysical constraints on the composition and structure of the Martian interior. J. Geophys. Res. Planet. 2005, 110, E12008. [Google Scholar] [CrossRef] [Green Version]
  16. Yan, J.; Xu, L.; Li, F.; Matsumoto, K.; Rodriguez, J.A.P.; Miyamoto, H.; Dohm, J.M. Lunar core structure investigation: Implication of GRAIL gravity field model. Adv. Space Res. 2015, 55, 1721–1727. [Google Scholar] [CrossRef]
  17. Kahan, D.S.; Folkner, W.M.; Buccino, D.R.; Dehant, V.; Le Maistre, S.; Rivoldini, A.; Van Hoolst, T.; Yseboodt, M.; Marty, J.C. Mars precession rate determined from radiometric tracking of the Insight Lander. Planet. Space Sci. 2021, 199, 105208. [Google Scholar] [CrossRef]
  18. Zhong, Z.; Wen, Q.; Liang, J. Constraining the size and density composition of the Martian core by using second-order potential coefficient and recent precession rate of gravity field model. Acta Phys. Sin. 2023, 72, 029601. [Google Scholar] [CrossRef]
  19. Yang, X.; Yan, J.G.; Andert, T.; Ye, M.; Pätzold, M.; Hahn, M.; Jin, W.T.; Li, F.; Barriot, J.P. The second-degree gravity coefficients of Phobos from two Mars Express flybys. Mon. Not. R. Astron. Soc. 2019, 490, 2007–2012. [Google Scholar] [CrossRef]
  20. Beitz, E.; Blum, J.; Parisi, M.G.; Trigo-Rodríguez, J. The collisional evolution of undifferentiated asteroids and the formation of chondritic meteroroids. Astrophys. J. 2016, 824, 12. [Google Scholar] [CrossRef] [Green Version]
  21. Guo, X.; Yan, J.; Andert, T.; Yang, X.; Pätzold, M.; Hahn, M.; Ye, M.; Liu, S.; Li, F.; Barriot, J.P. A lighter core for Phobos? Astron. Astrophys. 2021, 651, A110. [Google Scholar] [CrossRef]
  22. Thomas, P.C. The shapes of small satellites. Icarus 1989, 77, 248–274. [Google Scholar] [CrossRef]
  23. Simonelli, D.P.; Thomas, P.C.; Carcich, B.T.; Veverka, J. The generation and use of numerical shape models for irregular solar system objects. Icarus 1993, 103, 49–61. [Google Scholar] [CrossRef]
  24. Wang, Y.; Wu, X. Analysis of Phobos’ dynamical environment considering effects of ephemerides and physical libration. Mon. Not. R. Astron. Soc. 2020, 497, 416–434. [Google Scholar] [CrossRef]
  25. Mueller, N.; Piqueux, S.; Lemmon, M.; Maki, J.; Lorenz, R.D.; Grott, M.; Spohn, T.; Smrekar, S.E.; Knollenberg, J.; Hudson, T.L.; et al. Near Surface Properties of Martian Regolith Derived From InSight HP3-RAD Temperature Observations During Phobos Transits. Geophys. Res. Lett. 2021, 48, e2021GL093542. [Google Scholar] [CrossRef]
  26. Available online: https://pds-geosciences.wustl.edu/mex/mex-msa-hrsc-5-refdr-phobos-maps-v1/mexhrs_5001/data/dtm/ (accessed on 19 April 2023).
  27. Bagheri, A.; Khan, A.; Efroimsky, M.; Kruglyakov, M.; Giardini, D. Dynamical evidence for Phobos and Deimos as remnants of a disrupted common progenitor. Nat. Astron. 2021, 5, 539–543. [Google Scholar] [CrossRef]
  28. Guo, X.; Yan, J.G.; Yang, X.; Liu, L.; Chen, Y.H.; Barriot, J.P. Simulation of Phobos gravity field estimation from Tianwen-1 flybys and implications for the modelling of Phobos’ internal structure. Mon. Not. R. Astron. Soc. 2023, 520, 925–934. [Google Scholar] [CrossRef]
  29. Rambaux, N.; Castillo-Rogez, J.C.; Le Maistre, S.; Rosenblatt, P. Rotational motion of Phobos. Astron. Astrophys. 2012, 548, A14. [Google Scholar] [CrossRef] [Green Version]
  30. Jacobson, R.A. The orbits and masses of the Martian satellites and the libration of Phobos. Astron. J. 2010, 139, 668. [Google Scholar] [CrossRef]
  31. Oberst, J.; Zubarev, A.; Nadezhdina, I.; Shishkina, L.; Rambaux, N. The Phobos geodetic control point network and rotation model. Planet. Space Sci. 2014, 102, 45–50. [Google Scholar] [CrossRef]
  32. Zhong, Z.; Yan, J.; Jin, S.; Zhu, M.; Rodriguez, J.A.P.; Zhu, H.; Li, Y. Selenophysical parameter inversion in the Lunar Southern Hemisphere Highland based on mutant particle swarm optimization. Phys. Earth Planet. In. 2019, 292, 55–66. [Google Scholar] [CrossRef]
  33. Rosenblatt, P.; Charnoz, S.; Dunseath, K.M.; Terao-Dunseath, M.; Trinh, A.; Hyodo, R.; Genda, H.; Toupin, S. Accretion of Phobos and Deimos in an extended debris disc stirred by transient moons. Nat. Geosci. 2016, 9, 581–583. [Google Scholar] [CrossRef] [Green Version]
  34. Canup, R.; Salmon, J. Origin of Phobos and Deimos by the impact of a Vesta-to-Ceres sized body with Mars. Sci. Adv. 2018, 4, eaar6887. [Google Scholar] [CrossRef] [PubMed] [Green Version]
  35. Ćuk, M.; Minton, D.A.; Pouplin, J.L.L.; Wishard, C. Evidence for a Past Martian Ring from the Orbital Inclination of Deimos. Astrophys. J. Lett. 2020, 896, L28. [Google Scholar] [CrossRef]
  36. Busch, M.W.; Ostro, S.J.; Benner, L.A.M.; Giorgini, J.D.; Magri, C.; Howell, E.S.; Nolan, M.C.; Hine, A.A.; Campbell, D.B.; Shapiro, I.I.; et al. Arecibo radar observations of Phobos and Deimos. Icarus 2007, 186, 581–584. [Google Scholar] [CrossRef]
  37. Pätzold, M.; Andert, T.P.; Tyler, G.L.; Asmar, S.W.; Häusler, B.; Tellmann, S. Phobos mass determination from the very close flyby of Mars Express in 2010. Icarus 2014, 229, 92–98. [Google Scholar] [CrossRef]
  38. Macke, R.J.; Consolmagno, G.J.; Britt, D.T. Density, porosity, and magnetic susceptibility of carbonaceous chondrites. Meteorit. Planet. Sci. 2011, 46, 1842–1862. [Google Scholar] [CrossRef]
  39. Trigo-Rodríguez, J.M.; Rimola, A.; Tanbakouei, S.; Soto, V.C.; Lee, M. Accretion of water in carbonaceous chondrites: Current evidence and implications for the delivery of water to early Earth. Space Sci. Rev. 2019, 215, 18. [Google Scholar] [CrossRef] [Green Version]
Figure 1. Shape of Phobos. (a) shows the sub-Mars side, and (b) displays the leading side of Phobos.
Remotesensing 15 03162 g001
Figure 2. The two-layer model of Phobos. The red shape signifies its irregular outer shape and the black sphere denotes its interior core with a density ρc. The area between the red outer shape and the black sphere represents the outer layer with a density ρm. (a) shows Model-I with a spherical core that has a radius of rc close to 8.2 km, and (b) displays Model-II with an irregularly shaped core with a mean radius of rc close to 8.2 km. The shape of the core shown in subfigure (b) resembles the surface of Phobos.
Remotesensing 15 03162 g002
Figure 3. Frequency distribution of Model-I. (a) shows the frequency distribution for the core radius, (b) displays the frequency distribution for the core density, and (c) exhibits the frequency distribution for the density of the outer layer.
Remotesensing 15 03162 g003
Figure 4. Frequency distribution of Model-II. (a) shows the frequency distribution for the core radius, (b) displays the frequency distribution for the core density, and (c) exhibits the frequency distribution for the density of the outer layer.
Remotesensing 15 03162 g004
Table 1. Values of the related parameters of Phobos.
NumberParametersValues
1Mass M [19](1.060261 ± 0.001124) × 1016 kg
2Volume V [1]5742 ± 35 km3
3Mean radius R [1]~11.1 km
4Mean density ρ [19]1846 ± 11 kg·m−3
5Orbital eccentricity e [30]0.01511°
6Libration amplitude θA−1.09° ± 0.10° observed by Oberst et al. [31]
−1.143° ± 0.025° observed by Burmeister et al. [12]
−1.09° ± 0.01° from Phobos ephemeris [11]
7Unnormalized gravity coefficients of degree-2 [19]C2,0 = −0.1378 ± 0.0348, C2,2 = 0.0166 ± 0.0153
8Core radius rc0–10 km
9Core density ρc1000–3000 kg·m−3
10The outer layer density ρm1000–3000 kg·m−3
Table 2. The optimized parameters inversed for Phobos and their sensitivities to the misfit function.
Targetrc (km)ρm (kg·m−3)ρc (kg·m−3)
Estimated parameters for Model-I 8.2 1.3 + 1.7 1439 339 + 75 2423 296 + 562
Estimated parameters for Model-II 8.2 1.0 + 1.1 1340 340 + 87 2573 148 + 417
Sensitivities S1(f, x) of various optimized parameters for Model-I−4.6−6.2−2.3
Sensitivities S2(f, x) of various optimized parameters for Model-II−5.8−4.5−2.4
Disclaimer/Publisher’s Note: The statements, opinions and data contained in all publications are solely those of the individual author(s) and contributor(s) and not of MDPI and/or the editor(s). MDPI and/or the editor(s) disclaim responsibility for any injury to people or property resulting from any ideas, methods, instructions or products referred to in the content.

