
Identifying Ecological Security Patterns Meeting Future Urban Expansion in Changsha–Zhuzhou–Xiangtan Urban Agglomeration, China

1
College of Resources, Hunan Agricultural University, Changsha 410128, China
2
School of Surveying and Geo-Informatics, Shandong Jianzhu University, Jinan 250101, China
3
Hunan Institute of Microbiolog, Changsha 410128, China
4
Survey and Design Institute of Xiangtan City, Xiangtan 411100, China
*
Author to whom correspondence should be addressed.
Remote Sens. 2023, 15(12), 3141; https://doi.org/10.3390/rs15123141
Submission received: 23 April 2023
/
Revised: 31 May 2023
/
Accepted: 12 June 2023
/
Published: 16 June 2023
Abstract
:Ecological security patterns (ESPs) provide a solution for balancing the conflicts between ecological conservation and socio-economic development and maintaining sustainable regional development. Identifying sustainable ESPs should be a matter given attention to in order to meet future urban expansion needs. Based on multi-source eco-environmental datasets and remote sensing (RS) containing the history of land-use patterns, our study incorporated future land-use patterns into the ESP identification framework to reduce the potential impact of future urban expansion on the identified ESPs (i.e., ecological corridors and nodes) and to reserve space for future urban development from an urban development perspective. Considering the Changsha–Zhuzhou–Xiangtan (CZX) urban agglomeration, the results show that 57 corridors are extracted, within which 36 key corridors are mainly distributed in the Lukou and Wangcheng districts and Xiangtan and Changsha counties; an additional 21 potential corridors are mainly distributed in the urban built-up area and these corridors connect to Xiangjiang River or its tributary. In addition, 18 pinch points were identified, mainly located adjacent to the Xiangjiang River, Liuyang River, and Laodao River; 9 barrier points are distributed at the junctions of the main roads. A comparison of ESP identification with and without simulated land-use patterns showed the incorporation of future land-use patterns favoured sustainable ESP construction. Furthermore, we discuss the rationality and application of ESP identification from an urban development perspective and emphasize the trade-off between future land-use patterns and ecological conservation, better reflecting the forward-looking thinking of spatial planning.

1. Introduction
Rapid urbanization has been one of the prominent features of human social development in China over the past four decades [1,2,3,4]. Urbanization is a double-edged sword. It has created wealth on a massive scale for humans and has facilitated convenience for human lifestyles. At the same time, it has put pressure on the human–environment balance and threatened the urban ecosystem (i.e., waste of urban land, environmental pollution, biodiversity loss, and ecosystem services degradation) [5,6,7,8,9]. The human–environment tension tells us to slow down rapid urbanization in the urban eco-system to achieve sustainable urban development and has become a hot issue of widespread concern worldwide. To strengthen ecological protection and actively respond to eco-environmental effects caused by disorderly urban expansion, the commonly used practices in urban containment policies (i.e., green infrastructure, urban growth boundaries, and ecological networks) have attracted significant attention, within which ecological networks are commonly discussed [3,10].
Ecological security patterns (ESPs) establish a common ecological network, effectively improving regional landscape connectivity, enhancing human well-being, achieving ecological security, and coordinating the conflicts between ecological conservation and socio-economic development [11,12,13]. Specifically, they can provide solutions to solve regional ecological problems and can be embedded in spatial planning to achieve sustainable land utilization and sustainable regional development based on the integrity of ecosystem structures and processes [14]. A common ESP network generally includes ecological sources, corridors, and nodes [15,16,17]; these three components are interwoven to accelerate the flow and communications of ecosystem services. Its key goal is to provide the most ecological services with the least land consumption.
ESPs, originating from the concept of land health in 1941 [18], were used to deal with the problems of ecosystem health and ecological risk widely spreading worldwide and applied in biodiversity conservation management [19]. Subsequently, researchers [11,12] reinterpreted ecological security by expanding the concept of landscape ecology and pointing out that ESPs define a landscape-specific configuration where they support the integration of the landscape by giving priority to the protection of a few key ecological elements. Since the proposal of ESPs, they have been widely applied in assessments of ecosystem functions and processes [11,12], evaluations of the synergistic relationship between biodiversity and ecosystem services [20], ecological restorations [21,22], and policy implementations related to ecological security [23,24]. Moreover, ESPs have served on different scales, involving provinces [12], regions [17,25], cities [26,27], and counties [28]. The areas involved have been characterized by rapid urbanization [13,29], arid climates [30], semi-arid climates [31,32], and geological disaster areas [33]. Circuit theory, the minimum cumulative resistance (MCR) model, and the multi-criteria quantitative method are common methods for ESPs’ identification [30,34].
Currently, a dominant research paradigm has been widely applied in ESP identification: identification of ecological sources, construction of the ecological resistance of the surface, and extraction of ecological corridors and nodes [15,16,17,31,35]. Ecological sources refer to conservation priority areas or patches which provide multiple ecosystem services and prevent ecosystem degradation [36]. Directly selecting habitat patches by land-use type and indirect ecological indicator evaluation (i.e., ecosystem services’ importance and ecological sensitivity) are common methods used to identify ecological resources [16,37,38]. As a key step in identifying ESPs, ecological corridors can link the isolated and scattered ecological resources, maintaining the flow of ecosystem services and enabling the diffusion, migration, and communication of species. Circuit theory overcomes the defects of the MCR model in its difficulty with identifying the corridor widths and pinch points of corridors and has been widely applied in identifying landscape connectivity and ESPs [12,39,40,41,42]. Its construction determines the accuracies of ecological corridors and nodes and plays an important role in identifying ESPs. Determining the ecological resistance of the surface, as the preparation step for the extraction of ecological corridors and nodes, reflects the relative difficulty encountered when species travel in a horizontal spatial direction, depending largely on the land-use types and underlying artificial disturbances [12,16]. Existing studies [13,16,43] usually construct the ecological resistance of the surface by setting resistance coefficients for different land-use types, terrain, traffic communication, and socio-economic conditions, among which the land-use types play a key role. However, the obvious problem is that the ESPs are constructed based on the present rather than the future land-use patterns, ignoring temporal variations in the impacts of anthropogenic and natural factors on the ESPs. Due to the fact that urban expansion is irreversibly linked with economic growth and increasing population, the identified ESPs (i.e., ecological corridors and nodes) will certainly be impacted by future urban expansion, especially given the rapid expansion of urban agglomeration, which is not conducive to the long-term stability of ESPs [26,44,45]. For example, when the ESPs are constructed for a city, the continuous urban expansion may impact the identified ecological corridors and nodes, leading to the constructed ESPs becoming useless. Thus, it is necessary to expand the ESPs identified from an urban development perspective and consider the future land-use patterns in order to improve our understanding of the ecosystem dynamics and develop effective measures for long-term, sustainable landscape conservation.
Simulating urban expansion and assessing its encroachment are processes needed to fill the knowledge gap about incorporating future urban expansion into ESP identification. Cellular automata (CA) is one of the models often used in simulating urban expansion. CA-based models have been widely applied in urban management, eco-environment protection, and spatial planning [46,47,48,49,50,51]. Taking Changsha–Zhuzhou–Xiangtan (CZX) urban agglomeration as a case study, our study incorporated simulated land-use pattern in the ESPs’ identification to emphasize the coordination between future urban expansion and ecological conservation, based on the common dominant research paradigm of ESP identification. Specifically, the importance of ecological protection considering the importance of ecological function and eco-environmental sensitivity was first quantified according to the national guidelines of MEP (2015) [52] and identified the outline of ecological sources (see Section 4.2 for details). Second, the existing planning documents and technical guidelines [53,54] in China show that spatial planning is, in general, planned up to 2035. Thus, a CA-based model (see Section 4.1 for details) was used to simulate future urban expansion in 2035 in the CZX urban agglomeration. The corresponding results were used to revise the ecological resistance of the surface. Third, circuit theory was used to extract the ecological corridors, nodes, and pinch points based on the revised ecological resistance of the surface (see Section 4.3 for details). Finally, a pre-processing operation was used to classify and grade the ecological corridors, nodes, and pinch points by judging by prior knowledge and experience. Identifying ESPs considering future urban expansion reflects the forward-looking thinking emphasized in spatial planning, contributing to sustainable ESP construction. Identified ESPs reduce the potential impact of future urban expansion on ESPs, in order to reserve space for future urban development and to further meet the increasing rapid urban development requirement.
2. Study Area and Data Processing
The CZX urban agglomeration, as the important part of urban agglomeration in the middle reaches of the Yangtze River, is an important economic centre and transportation hub in central China. According to the Regional Planning Improvement of Changsha–Zhuzhou–Xiangtan Urban Agglomeration (2008–2020) (https://code.fabao365.com/law_502682_1.html (accessed on 27 September 2009)), CZX urban agglomerations contain thirteen districts and two counties, namely, Wangcheng, Changsha county, Kaifu, Furong, Yuelu, Tianxin, Yuhua, Yuhu, Yuetang, Shifeng, Hetang, Lusong, Tianyuan, Lukou, and Xiangtan county (Figure 1), with a total area of approximately 8615.5 km2. During the past four decades, CZX urban agglomerations underwent a remarkable urban expansion and will continue to expand in the future. Rapid urbanization will bring about an increase in urban land and a decrease in non-built-up land; it is necessary to construct the ESPs to slow the eco-environmental threats of urbanization.
In our study, the data includes land-use data, climate data, environmental data, and other data. Table 1 shows the corresponding data sources and their details. Inverse distance weighting interpolated yearly precipitation, soil pH, and soil salinity. The coarse data was resampled into 30 m resolution using the cubic resample method.
3. Methodology
The framework of the ESPs’ identification from an urban development perspective is shown in Figure 2. Firstly, urban expansion in CZX urban agglomerations in 2035 was simulated by integrating the Markov chains forecasting method and the CA model. The Markov chains forecasting method was used to predict the urban use demand; the CA model was used to simulate land-use patterns by allocating the newly added urban land. Secondly, the importance of ecological protection is derived from the sum of the importance of ecological function and the eco-environmental sensitivity, and is classified into three grades: generally important, relatively important, and extremely important. The areas labelled with the “extremely important” grade were selected as ecological resources. Thirdly, the ecological resistance of the surface is reconstructed by incorporating the future urban expansion map and configuring the resistance coefficients and their weights (see Table 2 for details). Finally, circuit theory was used to extract the ecological corridors, nodes, and pinch points, constructing the ESPs (see Section 3.2.3 for details).
3.1. Cellular Automata Modelling
Several computer-based approaches, including CA and agent-based models, have been applied in simulating urban expansion, among which CA has been widely used for simulating urban expansion based on complex system theory. A common CA model usually consists of four factors: development potential, neighbourhood effects, constraint, and stochastic factor [47]. The detailed formulation is as follows:
where pij is the total probability of transforming from non-urban to urban land at the location (i,j); and (pl)ij, , , and are the development potential, neighbourhood effects, constraint, and stochastic factor at the location (i,j), respectively.
The variable (pl)ij is used to assess the complex relationship between the urban expansion and driving factors, such as the proximity to important urban junctions and traffic networks, as well as the physical factors (Equation (2)). The common mining methods included logistics regression [56] and artificial neural networks [47], as well as random forest [51] and other deep learning algorithms [57].
where f represents the selecting mining method; and xn is the nth driving factor. Logistics regression model, a common machine learning model, can be used to fit the relationships between independent variables and dependent variables and there are widely applied mining transition rules which can be applied to fit the relationship between urban expansion and the driving factors in CA models, which are called the Logistics-CA; the details are referred to in Chen [57]. In our study, referring to the existing studies [47,48,49], eight driving factors, specifically the traffic network variables (i.e., the distances to the railway, motorway, primary way, secondary way, and tertiary way), physical factors (i.e., slope and DEM), and proximity variables (i.e., the distances to the administrative centre and water bodies), were selected to calculate the urban development potential.
The neighbourhood development density was used to evaluate the magnitude of neighbourhood effects; the equation is as follows:
where Con(*) is the predefined condition function, with Con(*) returning 1 if a neighbourhood cell belongs to urban land, and otherwise, returning 0. N is the size of Moore’s neighbourhood. In our study, the size of Moore’s neighbourhood was set to 5.
Some cells must keep initial states due to their special function in the urban expansion simulation; the formulation is as follows:
where the rule of predefined condition function is that Con(Sij = constraint) returns 0 if a cell is within the constraint areas, and otherwise, it returns 1. In our study, water bodies and parks were configured as the constraint.
A stochastic function is proposed to quantify the uncertainties, and its formulation is as follows [58]:
where is a stochastic variable (0~1); and is the stochastic disturbance factor. In our study, the value was set to 3.
The pij determines the priority from non-urban to urban land in the CA simulation. The number of iterations was configured as 100. Thus, the number of the target conversion cells configured for an iteration was 1/100 of the total demand cells. Then, the number of target conversion cells determines the number of non-urban cells. The simulated urban land pattern is achieved until the cumulative number of urban cells reaches the number of total demand cells. Additionally, Cohen’s kappa coefficient (Kappa) and figure of merit (FoM) were used to validate the model’s performance [47].
Speaking generally, CA models are bottom-up models that simulate the future land-use pattern by assessing a pixel’s transition probability and setting transition rules from a local perspective. However, some macro-scale demands addressed by a series of top-down models (i.e., Markov chain models, historical trend extrapolations, complex multi-sector models, Forrester models, and system dynamics) are incorporated into CA models to interact and feedback loops to simulate land-use patterns, wherefore the Markov chains forecasting method can be used to predict future land-use change trends based on the historical land-use pattern and has been widely incorporated into CA models to simulate land-use patterns. In our study, the Markov chains forecasting method is selected to predict the urban use demand in the CZX urban agglomerations in 2035 and configure the CA model’s macro-scale demand. Its formula is as follows:
where S(T) and S(T0) represent the land-use state matrix at T and T0, respectively. Pij is the transition probability transformation matrix from land-use type i to land-use type j, which is derived from the historical land-use pattern.
3.2. ESP Identification
3.2.1. Identifying Ecological Resources
Ecological sources can provide the main habitat for maintaining the survival and dispersal of species, which is the foundation of ESP identification. Indirect ecological indicators evaluation is a method commonly used to identify ecological resources. Our study selected the importance of ecological function and eco-environmental sensitivity in order to identify the ecological sources based on the analytic hierarchy procedure and natural breakpoint method. Specifically, the importance of ecological protection, which is the sum of the importance of an ecological function and the eco-environmental sensitivity, was used to extract ecological resources. It was divided into three grades, based on the natural breakpoint method: generally important, relatively important, and extremely important. The areas labelled as extremely important were selected for alternative ecological resources. Then, these raster-formatted resources were converted into vector-format with ArcGIS pro 2.8 software, and small patches (<1 km2) were removed.
- (1)
- Importance of ecological function
Ecological function refers to the capacity for benefitting human survival and development, derived from the ecological environment’s condition and the utility formed by the ecosystem and its ecological process. Referring to MEP 2015 [52], four indicators, specifically, water conservation, soil retention, carbon sequestration, and biodiversity conservation, were selected to measure the importance of ecological function in our study. The details are as follows:
- Water conservation
Water conservation manifests in the ability to provide water ecosystem service and regulate the water cycle. The water balance equation is usually used to evaluate water conservation services [17]. The equation is as follows:
where WC is the water conservation (m3); Pi, Ri, ETi, and Ai are the yearly mean rainfall (mm), quickly flow (mm), evapotranspiration (mm), and area (km2) at the ist ecosystem type, respectively; and j is the number of ecosystem types.
- 2.
- Soil retention
The reduction of water erosion provides soil retention utility through its unique structure. The Revised Universal Soil Loss Equation (RUSLE) is used to quantify the soil retention utility; the formulation is as follows [59]:
where SC is the soil retention (t·hm−2·yr−1); Ap and Ar are the potential soil retention and the actual soil retention, respectively; R, K, LS, and C are rainfall retention, soil erodibility, topography, and vegetation cover, respectively. The detailed calculations for R, K, and LS are derived from MEP 2015 [52].
- 3.
- Carbon sequestration
Carbon sequestration reflects the green plants’ ability to capture carbon dioxide through photosynthesis and store carbon in their tissues. Vegetation net primary productivity (NPP) is an indicator measuring the carbon sequestration service, and the formulation is as follows [60]:
where APAR(x,t) is the active photosynthetic radiation absorbed by pixel x in the tst month (gC·m−2·month−1); and ε(x,t) is the actual light energy utilization of pixel x in the tst month (gC·MJ−1).
- 4.
- Biodiversity conservation
Biodiversity conservation reflects the ability to maintain the diversity of genes, species, and ecosystems. The habitat quality module in InVEST software was used to calculate the richness of biodiversity, and the equation is as follows [7]:
where is the habitat quality of natural habitats at the pixel x; Hx is a value ranging from 0 to 1 which represents the habitat suitability at the pixel x; Dx represents the degradation at the pixel x; K is the half-saturation constant, the default value is 2.5; and z is the scaling parameter, the default value is 0.5.
Referring to the existing studies [3,17,49], the identical weight and normalization (0~1) for water conservation, soil retention, carbon sequestration, and biodiversity conservation are used in calculating the importance of ecological function. Eco-environmental sensitivity refers to the sensitivity of an ecosystem to the disturbance of natural and human activities in a region.
- (2)
- Eco-environmental sensitivity
Eco-environmental sensitivity refers to the disturbance level of human activities on the natural environment. Referring to MEP 2015 [52], four indicators, specifically, water contamination, soil erosion, soil PH, and soil salinity, were selected to measure the eco-environmental sensitivity in our study. The details are as follows:
- Water contamination
An indicator system, including the proximity to water bodies, land-use types, and vegetation cover, was built to evaluate the water contamination, and the formulation was as follows:
where WPS is the water contamination; and D is the distance from the water bodies. The smaller the distance is, the higher the threat to the water body. The 100 m buffer zones within 1 km are assigned to an interval of 0.1~1 with an interval of 0.1; LUCC is the land-use types. Industrial and mining land, urban-rural residential areas, residential areas, traffic land, cultivated land, unused land, grassland, forest land, and water are assigned to 1, 0.9, 0.8, 0.7, 0.5, 0.3, 0.2, 0.1, and 0.1, respectively; C is the vegetation cover factor.
- 2.
- Soil erosion
Soil erosion refers to hydraulic erosion and wind erosion, usually related to precipitation, soil erodibility, slope, slope length, and vegetation cover. The formulation is as follows [17]:
where SSi is the soil erosion sensitivity index at pixel i, which can be assessed by the combination of rainfall erosivity (Ri), soil edibility (Ki), slope length and slope (LSi), and vegetation cover (Ci).
- 3.
- Soil PH and soil salinity
Soil pH and soil salinity were interpolated by inverse distance weight by the survey data derived from the National Science & Technology Infrastructure (http://www.cnern.org.cn/data/meta?id=40176 (accessed on 1 July 2019)) in China.
3.2.2. Constructing the Ecological Resistance of the Surface
Ecological resistance of the surface measures the resistance or difficulty of communication and migration of a species from one ecological resources area to another, characterizing the influence of landscape heterogeneity according to ecological flow. It is influenced by land-use type, human disturbance, and vegetable cover. In our study, the simulated land-use pattern (see Section 3.1 for details), slope, DEM, NDVI, and proximity to a road are configured as resistance factors. Prior experiences and previous studies [61,62] determined the weights for the resistance factors. Table 2 shows the resistance factors and their weights. The ecological-resistance values of the surfaces were weighted by resistance factors using the overlay analysis method.
3.2.3. Extracting Ecological Corridors and Nodes
Ecological corridors are the main channels for species flow, energy exchange, seed dispersal, and ecological diffusion between ecological sources. They can fall into key and potential corridors. The least-cost paths between the source patches were calculated based on the identified ecological resources and the constructed ecological-resistance values of the surfaces. The key corridor is the least-cost path between adjacent source patches; the potential corridor is the possible path of each patch to all surrounding resource patches. The ecological corridor is key to maintaining biodiversity, landscape connectivity, and ecosystem integrity. Additionally, some key nodes (i.e., pinch points and barriers) are also embedded in the ecological corridors, wherein a pinch point is a high-flow key node and takes top priority in maintaining landscape connectivity. However, a barrier point will impede the flow of ecosystem services between ecological resources, and improving the habitat quality of barrier points contributes to the acceleration of ecosystem flow. The encroachment of urban expansion upon the ecological corridors should be avoided in order to protect key ecological corridors and patches, and especially to eliminate the negative effects affecting ecosystem connectivity and maintain the flow of ecosystem services and communication of species among multiple ecological sources.
Circuit theory was used to identify the ecological corridors in heterogeneous landscapes. Similar to electrical circuit theory, the ecological resources are viewed as the circuit theory’s focal nodes and the ecological resistance of the surface is regarded as the conductive surface. Where low resistances are assigned to the landscape, this will help keep the ecosystem flowing, and vice versa. Ohm’s Law points out the relationship between voltage, current and resistance in a circuit in physics, and the formulation is as follows [12,17]:
where I is the current through the conductor, V is the current voltage, and Reff is the current resistance. Each pixel assigned to resistance is mathematically expressed as a node in a two-dimensional space connected to its neighbourhood. Here, each ecological resource area was collapsed into a node. Based on Kirchhoff’s circuit laws, the current and voltage were evaluated in such a configuration. Our study selected Linkage Mapper Tools (https://www.circuitscape.org/ (accessed on 1 July 2019)) to identify the ecological corridors.
4. Results and Analysis
4.1. Land-Use Pattern in 2035
The historical urban use patterns between 2010 to 2019 were used to validate the Logistics–CA’s performance and applicability in CZX urban agglomeration. The performance (Kappa = 0.85; FoM = 19.01%) showed that the Logistic–CA model can simulate urban expansion in the CZX urban agglomeration. The Markov chain model was used to predict the demand for future urban development in the CZX urban agglomeration in 2035 based on an urban-history development trajectory. The future land-use pattern in the CZX urban agglomeration in 2035 was determined using the Logistic–CA model with the same parameters as the study performed on urban expansion simulation during 2010–2019. To quantify the spatial uncertainty of simulated results, we performed 100 simulations during the future urban dynamics simulation, and the overlaid analyses of all simulated results generated the spatial probability of future urban land development appearing at each pixel. The results (Table 3 and Figure 3) show that urban land areas in 2035 increased by 576.62 km2 compared with 2019, an increase of 71.03%. The newly added urban areas will mainly be focused on Changsha county (99.78 km2), the Wangcheng district (68.23 km2), the Yuelu district (56.50 km2), and the Yuhu district (29.74 km2). In general, CZX urban agglomeration will develop along the Xiangjiang River, showing the urban composition development of Changsha, Zhuzhou, and Xiangtan. Those results also manifest that it is necessary to consider future urban dynamics in ESP identification.
4.2. Spatial Distribution of Ecological Resources
4.2.1. Evaluation of the Importance of Ecological Function
Figure 4 shows the detailed results for the evaluation of the importance of ecological function. Water conservation areas labelled with “important” grades are mainly distributed in northeast Changsha county and southern Xiangtan county due to the high conservation capability of the water bodies and abundant rainfall in those areas. The distribution of high-importance of soil retention is concentrated in the Yulu district, the Shifeng district, and southern Xiangtan county. The highest carbon-sequestration areas lie far beyond the urban limits and respond to the spatial distribution of the forest land patterns due to abundant precipitation, high vegetation cover, and fewer human activities. The overall biodiversity is high and shows a spatial agglomeration, mainly distributed in mountainous areas with a high vegetation cover. High importance of ecological function is mainly located in those areas with less human disturbance, higher herbaceous vegetation with high water quality, and in open areas; these are concentrated in Changsha and Xiangtan counties.
4.2.2. Evaluation of Eco-Environmental Sensitivity
Figure 5 shows the detailed results for the evaluation of eco-environmental sensitivity. Serious water contamination areas are mainly located in the Furong, Yutang, and Shifeng districts near the Xiangjiang River with human disturbance. Soil erosion sensitivity is concentrated in the Chifeng, Lusong, and Hetang districts and south Xiangtan county, areas with significant relief amplitude, low vegetation cover rate, and heavy rainfall. The soil PH and salinity decrease from the northeast to the southwest and influence plant growth. Generally, the high eco-environmental sensitivity areas are mainly scattered in northeast Changsha county, the Shifeng district, and the Hetang district.
4.2.3. Identification of Ecological Resources
Figure 6 shows the identified ecological resources. These areas consist mainly of forest land, cropland, and grassland, encompassing 33 patches, accounting for 17.7% of the study area (1529 km2), wherein the forest land and cropland are dominant, accounting for 77.01% and 22.08% of the total area of ecological sources, respectively. The ecological sources are mainly distributed among northeast Changsha county, the Lusong district, the western Yuelu district, and south Xiangtan county. These areas are rich in forest resources and have abundant precipitation, high vegetation cover, and fewer human activities. Moreover, some forest parks and nature reserves are distributed in these areas. However, the Furong, Tianxin, and Yuhu districts have no ecological resources, due to intense human activities.
4.3. Spatial Patterns of Resistance Surface, Ecological Corridors, and Ecological Nodes
4.3.1. Spatial Distribution of Surface Ecological Resistance Values
The simulated land-use pattern in 2035 was used for calculating the ecological resistance of the surface. The resistance value (0~100) was determined by experiential knowledge (See Table 2 for details). However, the resistance value of urban land was set to 700 to emphasize the influence of urban land on ESP identification (See Table 2 for details). The identification of ESPs should avoid areas with a high potential for urban development, in order to forestall potential conflicts between future urban development and ecological conservation, a tactic which reflects the forward-looking thinking emphasized in spatial planning. Figure 7 shows the constructed ecological resistance levels for the surfaces. The highest-resistance areas are mainly distributed in the main urban centres and surrounding areas of Changsha, Zhuzhou, and Xiangtan. These areas have an intensity of constructed land, poor vegetation cover, intense human activities, and aggregation of production activities, hampering the flow of ecosystem services and communication of species among multiple ecological sources.
4.3.2. Spatial Patterns of Ecological Corridors and Ecological Nodes
Figure 8a shows the identified ecological corridors and nodes in the CZX urban agglomeration using a cost–distance threshold (100 km). Results show that there are 57 corridors in the study area, with a total length of 710.20 km and an average length of 12.50 km. These corridors, composed mainly of three land-use types, namely, forest land, cropland, and grassland, include the 36 key corridors and 21 potential corridors. The 36 key corridors, with a total length of 266.50 km, are mainly distributed in the Lukou and Wangcheng districts and Xiangtan and Changsha counties. These areas are far away from urban areas. They have a low intensity of human disturbance, which makes it easier to maintain ecosystem flows and species migration and shows good landscape connectivity. The 21 potential corridors, with a total length of 443.7 km, are mainly located in the urban built-up areas and these corridors connect to Xiangjiang River or its tributary. These corridors are more resistant than is the key corridor, and easily influenced by urban expansion and human disturbance. Thus, they deserve more attention in ecological protection and restoration.
The 18 pinch points were identified using the natural breakpoints method, based on the amount of current through the conductor (i.e., ecological network) (Figure 8a). These points, a total of 20.30 km2 in area, are mainly located adjacent to the Xiangjiang River, Liuyang River, and Laodao River. Additionally, they link several ecological corridors and become “bottlenecks” affecting landscape connectivity, which plays a key role in facilitating energy flow and communication between ecological resources. Thus, we must practice a strict land management system and engage measures to protect these river areas in spatial planning. Furthermore, the Barrier Mapper tool was used to identify the barrier points using the moving window search method (200 m search radius). There are nine barrier points in the CZX urban agglomeration, a total of 23.40 km2 of area, mostly distributed among the junction of the two main roads (i.e., East Second Ring Road and national road G319) and another important urban junction (i.e., Changsha South Railway Station), with some also located on construction land near roads. These areas impede the flow of species and material exchanges in the urban agglomeration due to the intensity of human population distribution. We have suggested that green infrastructure (i.e., greenbelts) should be constructed to maintain the flow of ecosystem services and material exchanges at the identified barrier points. Some barrier points are distributed in the urban fringe areas, such as Chihu and Guihuatang villages in Xiangtan county. These areas are dominated by cropland. Thus, reconverting the cropland into forest land should be implemented to reduce the resistance of the ecosystem exchanges, accelerate the flow and communication of ecosystem services, and maintain biodiversity, landscape connectivity, and ecosystem integrity.
The identified ESPs in our study without a future land-use pattern (i.e., the present land-use pattern) are shown in Figure 8b. We found 60 corridors, including the 43 key and 17 potential corridors, in the study area, with a total length of 655.5 km. The ESPs’ delineated in our study, with and without future land-use patterns, were compared, as shown in Figure 8. The analysis found that the corridors within urban areas exhibited some spatial and quantitative differences, and that the identified ESPs will likely be threatened by urban expansion (See Figure 8a for details). Besides, compared to the ESPs with a future land-use pattern (Figure 8a), the total length of key corridors decreased by 69.10 km, and the potential corridors increased by 123.80 km. The total length of the corridors (i.e., key and potential corridors) was increased by 54.70 km, an 8.34% increase.
5. Discussion
5.1. Implications of ESP Identification for Urban Development Perspectives
The basic concept of existing ESP identification lies in coordinating the conflicts between urban development and ecological conservation. However, existing studies focused on ESP identification are from the current perspective, ignoring temporal variations in the impacts of anthropogenic and natural factors. Specifically, ESPs’ identifications based on the current perspective usually were used to coordinate the conflicts between the present land-use pattern and ecological conservation. A problem that cannot be ignored is that the process needs to pay attention to the impacts of future urban expansion on the identification of ESPs, especially in the rapid expansion of urban agglomeration. Additionally, studies [49,63] show that urban expansion is a principal driver of land-use change, affecting the integrity of ecological systems and the flow and communication of ecosystem services. The ESPs identified based on the present land-use pattern strictly restricted the extent of urban expansion in advance. However, urban expansion is irreversible, given economic growth and increasing population. The identified ESPs (i.e., ecological corridors and nodes) will certainly be impacted by future urban expansion, especially by the rapid expansion of urban agglomeration. Once the ESPs are identified, the analysis faces a new problem, namely, that the currently identified ESPs will be threatened by increasingly rapid urban expansion and the requirements of urban development, whereas the ESP identification from the urban development perspective proposed in this study proposes an innovation in the traditional ESP identification, one which corresponds to the forward-looking thinking emphasized in spatial planning. Specifically, we simulate the hotspots of urban development in advance using the Logistics–CA model and view these hotspots as potential urban development spaces. In such an operation, the identified ecological corridors will avoid these hotspots, and the identified ESPs can also reserve areas for future urban development. A lack of future urban land patterns in ESP identification has led to the problem that the ability to coordinate the conflicts between urban development and ecological conservation will weaken with fast-changing urban development. Urban land is the primary driver of land-use change and the key land for spatial planning. Incorporating the future urban land pattern into ESP identification can reserve space for future urban development and improve their applicability. Theoretically, ESP identification from the urban development perspective can reduce the potential impact of future urban expansion upon ESPs (i.e., ecological corridors and nodes), adapting to urban development trends while reducing the encroachments upon high-quality agricultural production and ecological land, better reflecting the implications of spatial planning.
Compared to the ESPs determined without a future land-use pattern, the total length of corridors (i.e., key and potential corridors) is decreased by 54.70 km. A decrease in the total length of corridors and the corresponding distances of species migrations will decrease the resistance to the communication and migration of a species from one ecological resource area to another. Additionally, the key corridors in the black circle in Figure 8b also are more easily threatened by future urban expansion, due to their proximity to the potential urban development areas. Incorporating the future land-use pattern into ESP identification will avoid potential urban-development areas, and the identified ecological corridors will therefore not easily be affected by the urban expansion caused by fast-changing urban development (See Figure 8a for details). This analysis further validates the necessity and effectiveness of considering future land-use patterns in ESP identification.
5.2. Limitations and Future Research Directions
ESP identification is essential and effective in maintaining ecosystem integrity and in supporting the flow and communication of species. Our study provides an innovation upon traditional ESP identification from an urban development perspective and makes an appeal that identified ESPs balance the conflicts between future land-use patterns and ecological conservation, one reflecting the forward-looking thinking emphasized in spatial planning. However, limitations still exist in our study. Firstly, more ways can be explored to employ the technique of ESP identification from an urban development perspective, enriching its theoretical framework and expanding its applications. For example, whether the simulated land-use pattern can incorporate ecological source-identification and the extraction of ecological corridors and nodes to optimize the ESPs is a question to be explored in future studies. Secondly, the incorporation of multiple elements (such as economic flow, population flow, etc.) and the improved accuracy of the CA model contribute to the ESPs’ identification. Future studies will further explore this. Thirdly, multi-scenario land-use patterns have reduced the uncertainty of future urban development trajectories. They were incorporated into the ESPs framework to improve the accuracy and application of the identified ESPs. Fourthly, the width of the ecological corridor affects its ecological function directly. The rationality and the corresponding viability of the configured width (100 km) in our study (see Section 4.3.2 for details) need to be validated. Thus, determining the optimal width should be explored in future studies. Fifthly, our study dedicates a significant portion of the paper to validating the methodological rationality of ESP identification within spatial confines. Future studies will propose suggestions for ecological conservation based on the identified ESPs in the CZX urban agglomerations. Additionally, more cases (i.e., urban agglomeration studies) should be used to validate the rationality of the proposed ESP process of identification in future studies. Sixthly, the sensitivity analysis for some factors (e.g., soil PH and soil salinity) and the surface ecological resistance weights are ignored. Future studies will further explore their impact on ESP identification. Finally, a set of indicators incorporated within the standard guidelines [52] was difficult to match to the corresponding dataset, due to data availability. This will bring about some biases in evaluating the importance of ecological function and eco-environmental sensitivity.
6. Conclusions
ESP identification can assist in coordinating the conflicts between ecological conservation and socio-economic development, weakening the threat of urban development to ecological space. Currently, studies focus on ESP identification from the current perspective, ignoring temporal variations in the impacts of anthropogenic and natural factors, and resulting in the ESPs’ decreased ability to coordinate the conflicts between urban development and ecological conservation with fast-changing urban development. To construct sustainable ESPs, our study constructed ESPs from an urban development perspective based on multi-source eco-environmental datasets and RS revealing the history of land-use patterns. The results show 57 corridors (36 key and 21 potential corridors) in the CZX urban agglomeration. Within this set, 36 key corridors, with a total length of 266.5 km, are mainly distributed in the Lukou and Wangcheng districts and Xiangtan and Changsha counties; 21 potential corridors, with a total length of 443.7 km, are mainly located in the urban built-up area and adjacent to the river passing through the city. A total of 18 pinch points, amounting to 20.3 km2 of area, were identified, mainly located adjacent to the Xiangjiang River, Liuyang River, and Laodao River. A total of nine barrier points, covering 23.4 km2 of area, are mostly distributed at the junction of the two main roads. We have suggested the construction of green infrastructure (i.e., greenbelts) and that a measure reconverting the cropland into forest land should be implemented to maintain the flow of ecosystem services and material exchanges at the identified barrier points. A comparison of ESP identification with and without future urban land patterns showed that the total length of corridors (i.e., both key and potential corridors) of constructed ESPs based on the urban development perspective is comparatively decreased by 54.70 km, an 8.34% decrease, which will decrease the resistance to communication and migration of species from one ecological resource area to another. Additionally, this can also avoid the potential urban development areas and the identified ecological corridors that are not easily affected by the urban expansion caused by fast-changing urban development. We also have discussed the rationality and application of ESP identification from an urban development perspective and appealed to the forward-looking thinking emphasized in spatial planning in ESP identification (see Section 5.1 for details). Future research should explore more technology implementation in ESP identification from the urban development perspective. More suggestions for ecological conservation based on the identified ESPs should be proposed to balance the conflicts between urban development and ecological conservation and assist in spatial planning at the urban agglomeration scale. The conceptual and methodological advancements of this study are applicable to other cities/urban agglomerations in their attempts to assist in the identification of ESPs.
Author Contributions
Conceptualization, W.W. and F.S.; methodology, B.L. and W.W.; software, B.L. and F.S.; validation, W.W., B.L., Z.J., S.C. and F.S.; formal analysis, W.W. and B.L.; investigation, W.W.; resources, W.W.; data curation, B.L., S.C. and W.W.; writing—original draft preparation, W.W. and B.L.; writing—review and editing, W.W.; visualization, B.L. and W.W.; supervision, W.W. and F.S.; project administration, W.W. and F.S.; funding acquisition, W.W. and F.S. All figures have been processed by the authors of the paper. All authors have read and agreed to the published version of the manuscript.
Funding
This study was supported by National Natural Science Foundation of China (42201470), the Natural Science Foundation of Shandong Province (ZR2021QD105), and the Scientific Research Fund of the Hunan Provincial Education Department (22B0230).
Data Availability Statement
The datasets used and/or analysed during the current study are available from the corresponding author on reasonable request.
Conflicts of Interest
The authors declare no conflict of interest.
References
- Hoekstra, A.Y.; Wiedmann, T.O. Humanity’s unsustainable environmental footprint. Science 2014, 344, 1114–1117. [Google Scholar] [CrossRef]
- Liu, X.; Huang, Y.; Xu, X.; Li, X.; Li, X.; Ciais, P.; Lin, P.; Gong, K.; Ziegler, A.D.; Chen, A.; et al. High-spatiotemporal-resolution mapping of global urban change from 1985 to 2015. Nat. Sustain. 2020, 3, 564–570. [Google Scholar] [CrossRef]
- Wang, W.; Jiao, L.; Zhang, W.; Jia, Q.; Su, F.; Xu, G.; Ma, S. Delineating urban growth boundaries under multi-objective and constraints. Sustain. Cities Soc. 2020, 61, 102279. [Google Scholar] [CrossRef]
- Yu, B. Ecological effects of new-type urbanization in China. Renew. Sustain. Energy Rev. 2021, 135, 110239. [Google Scholar] [CrossRef]
- Bren D Amour, C.; Reitsma, F.; Baiocchi, G.; Barthel, S.; Güneralp, B.; Erb, K.; Haberl, H.; Creutzig, F.; Seto, K.C. Future urban land expansion and implications for global croplands. Proc. Natl. Acad. Sci. USA 2017, 114, 8939–8944. [Google Scholar] [CrossRef] [Green Version]
- van Vliet, J. Direct and indirect loss of natural area from urban expansion. Nat. Sustain. 2019, 2, 755–763. [Google Scholar] [CrossRef]
- Ren, Q.; He, C.; Huang, Q.; Shi, P.; Zhang, D.; Güneralp, B. Impacts of urban expansion on natural habitats in global drylands. Nat. Sustain. 2022, 5, 869–878. [Google Scholar] [CrossRef]
- Simkin, R.D.; Seto, K.C.; McDonald, R.I.; Jetz, W. Biodiversity impacts and conservation implications of urban land expansion projected to 2050. Proc. Natl. Acad. Sci. USA 2022, 119, e2117297119. [Google Scholar] [CrossRef]
- Li, G.; Fang, C.; Li, Y.; Wang, Z.; Sun, S.; He, S.; Qi, W.; Bao, C.; Ma, H.; Fan, Y.; et al. Global impacts of future urban expansion on terrestrial vertebrate diversity. Nat. Commun. 2022, 13, 1628. [Google Scholar] [CrossRef]
- Bai, Y.; Wong, C.P.; Jiang, B.; Hughes, A.C.; Wang, M.; Wang, Q. Developing China’s Ecological Redline Policy using ecosystem services assessments for land use planning. Nat. Commun. 2018, 9, 3034. [Google Scholar] [CrossRef] [Green Version]
- Yu, K. Security patterns and surface model in landscape ecological planning. Landsc. Urban Plan. 1996, 36, 1–17. [Google Scholar] [CrossRef]
- Peng, J.; Yang, Y.; Liu, Y.; Hu, Y.; Du, Y.; Meersmans, J.; Qiu, S. Linking ecosystem services and circuit theory to identify ecological security patterns. Sci. Total Environ. 2018, 644, 781–790. [Google Scholar] [CrossRef] [Green Version]
- Peng, J.; Zhao, S.; Dong, J.; Liu, Y.; Meersmans, J.; Li, H.; Wu, J. Applying ant colony algorithm to identify ecological security patterns in megacities. Environ. Modell. Softw. 2019, 117, 214–222. [Google Scholar] [CrossRef] [Green Version]
- Zhang, Y.; Yu, B.; Muhammad Aqeel, A. Ecological security pattern for the landscape of mesoscale and microscale land: A case study of the Harbin city center. J. Environ. Eng. Landsc. 2015, 3, 192–201. [Google Scholar]
- Li, Z.; Li, M.; Xia, B. Spatio-temporal dynamics of ecological security pattern of the Pearl River Delta urban agglomeration based on LUCC simulation. Ecol. Indic. 2020, 114, 106319. [Google Scholar] [CrossRef]
- Wei, Q.; Halike, A.; Yao, K.; Chen, L.; Balati, M. Construction and optimization of ecological security pattern in Ebinur Lake Basin based on MSPA-MCR models. Ecol. Indic. 2022, 138, 108857. [Google Scholar] [CrossRef]
- Jia, Q.; Jiao, L.; Lian, X.; Wang, W. Linking supply-demand balance of ecosystem services to identify ecological security patterns in urban agglomerations. Sustain. Cities Soc. 2023, 92, 104497. [Google Scholar] [CrossRef]
- Rapport, D.J. Ecosystems not optimized: A reply. J. Aquat. Ecosyst. Health 1993, 2, 57. [Google Scholar] [CrossRef]
- Hess, G.R.; Fischer, R.A. Communicating clearly about conservation corridors. Landsc. Urban Plan. 2001, 55, 195–208. [Google Scholar] [CrossRef]
- Cheng, F.; Liu, S.; Hou, X.; Wu, X.; Dong, S.; Ana, C. The effects of urbanization on ecosystem services for biodiversity conservation in southernmost Yunnan Province, Southwest China. J. Geogr. Sci. 2019, 29, 1159–1178. [Google Scholar] [CrossRef] [Green Version]
- Buting, H.; Ping, R.; Quanzhi, Y.; Ling, W. Ecological function regionalization in the Upper Yangtze River. J. Ecol. Rural. Environ. 2019, 35, 1009–1019. (In Chinese) [Google Scholar]
- Wang, Z.; Luo, K.; Zhao, Y.; Lechner, A.M.; Wu, J.; Zhu, Q.; Sha, W.; Wang, Y. Modelling regional ecological security pattern and restoration priorities after long-term intensive open-pit coal mining. Sci. Total Environ. 2022, 835, 155491. [Google Scholar] [CrossRef] [PubMed]
- Lv, L.; Zhang, B.; Xie, X.; Luo, H. China’s energy ecological security impact assessment and policy recommendations. Res. Environ. Sci. 2018, 31, 1819–1826. [Google Scholar]
- Cui, X.; Deng, W.; Yang, J.; Huang, W.; de Vries, W.T. Construction and optimization of ecological security patterns based on social equity perspective: A case study in Wuhan, China. Ecol. Indic. 2022, 136, 108714. [Google Scholar] [CrossRef]
- Ghosh, S.; Das Chatterjee, N.; Dinda, S. Urban ecological security assessment and forecasting using integrated DEMATEL-ANP and CA-Markov models: A case study on Kolkata Metropolitan Area, India. Sustain. Cities Soc. 2021, 68, 102773. [Google Scholar] [CrossRef]
- Hou, W.; Zhou, W.; Li, J.; Li, C. Simulation of the potential impact of urban expansion on regional ecological corridors: A case study of Taiyuan, China. Sustain. Cities Soc. 2022, 83, 103933. [Google Scholar] [CrossRef]
- Qiao, Q.; Zhen, Z.; Liu, L.; Luo, P. The construction of ecological security pattern under rapid urbanization in the Loess Plateau: A case study of Taiyuan city. Remote Sens. 2023, 15, 1523. [Google Scholar] [CrossRef]
- Macmillan, R.A.; Moon, D.E.; Coupé, R.A. Automated predictive ecological mapping in a Forest Region of B.C., Canada, 2001–2005. Geoderma 2007, 140, 353–373. [Google Scholar] [CrossRef]
- Chen, J.; Wang, S.; Zou, Y. Construction of an ecological security pattern based on ecosystem sensitivity and the importance of ecological services: A case study of the Guanzhong Plain urban agglomeration, China. Ecol. Indic. 2022, 136, 108688. [Google Scholar] [CrossRef]
- Wang, Y.; Pan, J. Building ecological security patterns based on ecosystem services value reconstruction in an arid inland basin: A case study in Ganzhou District, NW China. J. Clean. Prod. 2019, 241, 118337. [Google Scholar] [CrossRef]
- Li, S.; Xiao, W.; Zhao, Y.; Lv, X. Incorporating ecological risk index in the multi-process MCRE model to optimize the ecological security pattern in a semi-arid area with intensive coal mining: A case study in northern China. J. Clean. Prod. 2020, 247, 119143. [Google Scholar] [CrossRef]
- Lin, L.; Wei, X.; Luo, P.; Wang, S.; Kong, D.; Yang, J. Ecological security patterns at different spatial scales on the Loess Plateau. Remote Sens. 2023, 15, 1011. [Google Scholar] [CrossRef]
- Peng, J.; Guo, X.; Hu, Y.; Liu, Y. Constructing ecological security patterns in mountain areas based on geological disaster sensitivity: A case study in Yuxi city, Yunnan province, China. Chin. J. Appl. Ecol. 2017, 28, 627–635. (In Chinese) [Google Scholar]
- Wei, H.; Zhu, H.; Chen, J.; Jiao, H.; Li, P.; Xiong, L. Construction and optimization of ecological security pattern in the Loess Plateau of China based on the Minimum Cumulative Resistance (MCR) model. Remote Sens. 2022, 14, 5906. [Google Scholar] [CrossRef]
- Gurrutxaga, M.; Lozano, P.J.; Del Barrio, G. GIS-based approach for incorporating the connectivity of ecological networks into regional planning. J. Nat. Conserv. 2010, 18, 318–326. [Google Scholar] [CrossRef]
- Yang, Y.; Feng, Z.; Wu, K.; Lin, Q. How to construct a coordinated ecological network at different levels: A case from Ningbo city, China. Ecol. Inform. 2022, 70, 101742. [Google Scholar] [CrossRef]
- Li, Y.; Lin, J.; Su, X. An early warning method on ecological risk and its application to improve landscape ecological security pattern regulation. Geogr. Res. 2017, 36, 485–494. (In Chinese) [Google Scholar]
- Dai, L.; Liu, Y.; Luo, X. Integrating the MCR and DOI models to construct an ecological security network for the urban agglomeration around Poyang Lake, China. Sci. Total Environ. 2020, 754, 141868. [Google Scholar] [CrossRef]
- Mcrae, B.H.; Beier, P. Circuit theory predicts gene flow in plant and animal populations. Proc. Natl. Acad. Sci. USA 2007, 104, 19885–19890. [Google Scholar] [CrossRef] [Green Version]
- An, Y.; Liu, S.; Sun, Y.; Shi, F.; Beazley, R. Construction and optimization of an ecological network based on morphological spatial pattern analysis and circuit theory. Landsc. Ecol. 2021, 36, 2059–2076. [Google Scholar] [CrossRef]
- Zhang, Y.; Zhao, Z.; Fu, B.; Ma, R.; Yang, Y.; Lv, Y.; Wu, X. Identifying ecological security patterns based on the supply, demand and sensitivity of ecosystem service: A case study in the Yellow River Basin, China. J. Environ. Manag. 2022, 315, 115158. [Google Scholar] [CrossRef] [PubMed]
- Fan, F.; Wen, X.; Feng, Z.; Gao, Y.; Li, W. Optimizing urban ecological space based on the scenario of ecological security patterns: The case of central Wuhan, China. Appl. Geogr. 2022, 138, 102619. [Google Scholar] [CrossRef]
- Saura, S.; Pascual-Hortal, L. A new habitat availability index to integrate connectivity in landscape conservation planning: Comparison with existing indices and application to a case study. Landsc. Urban Plan. 2007, 83, 91–103. [Google Scholar] [CrossRef]
- Li, L.; Huang, X.; Wu, D.; Yang, H. Construction of ecological security pattern adapting to future land use change in Pearl River Delta, China. Appl. Geogr. 2023, 154, 102946. [Google Scholar] [CrossRef]
- Li, Y.; Liu, W.; Feng, Q.; Zhu, M.; Yang, L.; Zhang, J.; Yin, X. The role of land use change in affecting ecosystem services and the ecological security pattern of the Hexi Regions, Northwest China. Sci. Total Environ. 2023, 855, 158940. [Google Scholar] [CrossRef]
- Liu, X.; Liang, X.; Li, X.; Xu, X.; Ou, J.; Chen, Y.; Li, S.; Wang, S.; Pei, F. A future land use simulation model (FLUS) for simulating multiple land use scenarios by coupling human and natural effects. Landsc. Urban Plan. 2017, 168, 94–116. [Google Scholar] [CrossRef]
- Wang, W.; Jiao, L.; Dong, T.; Xu, Z.; Xu, G. Simulating urban dynamics by coupling top-down and bottom-up strategies. Int. J. Geogr. Inf. Sci. 2019, 33, 2259–2283. [Google Scholar] [CrossRef]
- Hu, J.; Yan, D.; Wang, W. Estimating carbon stock change caused by multi-scenario land-use structure in Urban Agglomeration. Sustainability 2023, 15, 5503. [Google Scholar] [CrossRef]
- Wang, W.; Jiao, L.; Jia, Q.; Liu, J.; Mao, W.; Xu, Z.; Li, W. Land use optimization modelling with ecological priority perspective for large-scale spatial planning. Sustain. Cities Soc. 2021, 65, 102575. [Google Scholar] [CrossRef]
- Liang, X.; Guan, Q.; Clarke, K.C.; Liu, S.; Wang, B.; Yao, Y. Understanding the drivers of sustainable land expansion using a patch-generating land use simulation (PLUS) model: A case study in Wuhan, China. Comput. Environ. Urban Syst. 2021, 85, 101569. [Google Scholar] [CrossRef]
- Liang, X.; Guan, Q.; Clarke, K.C.; Chen, G.; Guo, S.; Yao, Y. Mixed-cell cellular automata: A new approach for simulating the spatio-temporal dynamics of mixed land use structures. Landsc. Urban Plan. 2021, 205, 103960. [Google Scholar] [CrossRef]
- MEP. Guidelines for the Delineation of Ecological Protection Red Lines (MEP No. 56, 2015). 2015. Available online: https://www.mee.gov.cn/gkml/hbb/bwj/201505/W020150519635317083395.pdf (accessed on 30 May 2015). (In Chinese)
- China’s State Council. Several Opinions on Establishing Territorial Spatial Planning System and Supervising for Implementation. 2019. Available online: http://www.gov.cn/zhengce/2019-05/23/content_5394187.htm (accessed on 23 May 2019). (In Chinese)
- Department of Natural Resources of Hunan Province. Technical Guide for Evaluation of Resource and Environment Carrying and Territory Spatial Development Suitability in Hunan. 2019. Available online: https://www.ciyew.com/spatial_planning/3047-3521.html (accessed on 30 April 2019). (In Chinese)
- Yang, J.; Huang, X. The 30 m annual land cover dataset and its dynamics in China from 1990 to 2019. Earth Syst. Sci Data 2021, 13, 3907–3925. [Google Scholar] [CrossRef]
- Chen, Y.; Li, X.; Liu, X.; Ai, B. Modeling urban land-use dynamics in a fast developing city using the modified logistic cellular automaton with a patch-based simulation strategy. Int. J. Geogr. Inf. Sci. 2014, 28, 234–255. [Google Scholar] [CrossRef]
- Xing, W.; Qian, Y.; Guan, X.; Yang, T.; Wu, H. A novel cellular automata model integrated with deep learning for dynamic spatio-temporal land use change simulation. Comput. Geosci. 2020, 137, 104430. [Google Scholar] [CrossRef]
- Li, X.; Gar-Onyeh, A. Neural-network-based cellular automata for simulating multiple land use changes using GIS. Int. J. Geogr. Inf. Sci. 2002, 16, 323–343. [Google Scholar] [CrossRef]
- Wang, W.; Ye, L.; Yang, K.; Wang, G.; Su, F. Analysis on spatial characteristics of soil erosion in Erhai river basin based on GIS and RUSLE. Hubei Agric. Sci. 2015, 54, 6. (In Chinese) [Google Scholar]
- Zhong, J.; Liu, J.; Jiao, L.; Lian, X.; Xu, Z.; Zhou, Z. Assessing the comprehensive impacts of different urbanization process on vegetation net primary productivity in Wuhan, China, from 1990 to 2020. Sustain. Cities Soc. 2021, 75, 103295. [Google Scholar] [CrossRef]
- Wang, H.; Ma, X.; Du, Y. Constructing ecological security patterns based on ecological service importance and ecological sensitivity in Guangdong. Acta Ecol. Sin. 2021, 41, 1705–1715. (In Chinese) [Google Scholar]
- Li, Q.; Zhou, Y.; Yi, S. An integrated approach to constructing ecological security patterns and identifying ecological restoration and protection areas: A case study of Jingmen, China. Ecol. Indic. 2022, 137, 108723. [Google Scholar] [CrossRef]
- Ouyang, X.; Xu, J.; Li, J.; Wei, X.; Li, Y. Land space optimization of urban-agriculture-ecological functions in the Changsha-Zhuzhou-Xiangtan Urban Agglomeration, China. Land Use Policy 2022, 117, 106112. [Google Scholar] [CrossRef]
Figure 1.
Location of Changsha–Zhuzhou–Xiangtan urban agglomerations, China.
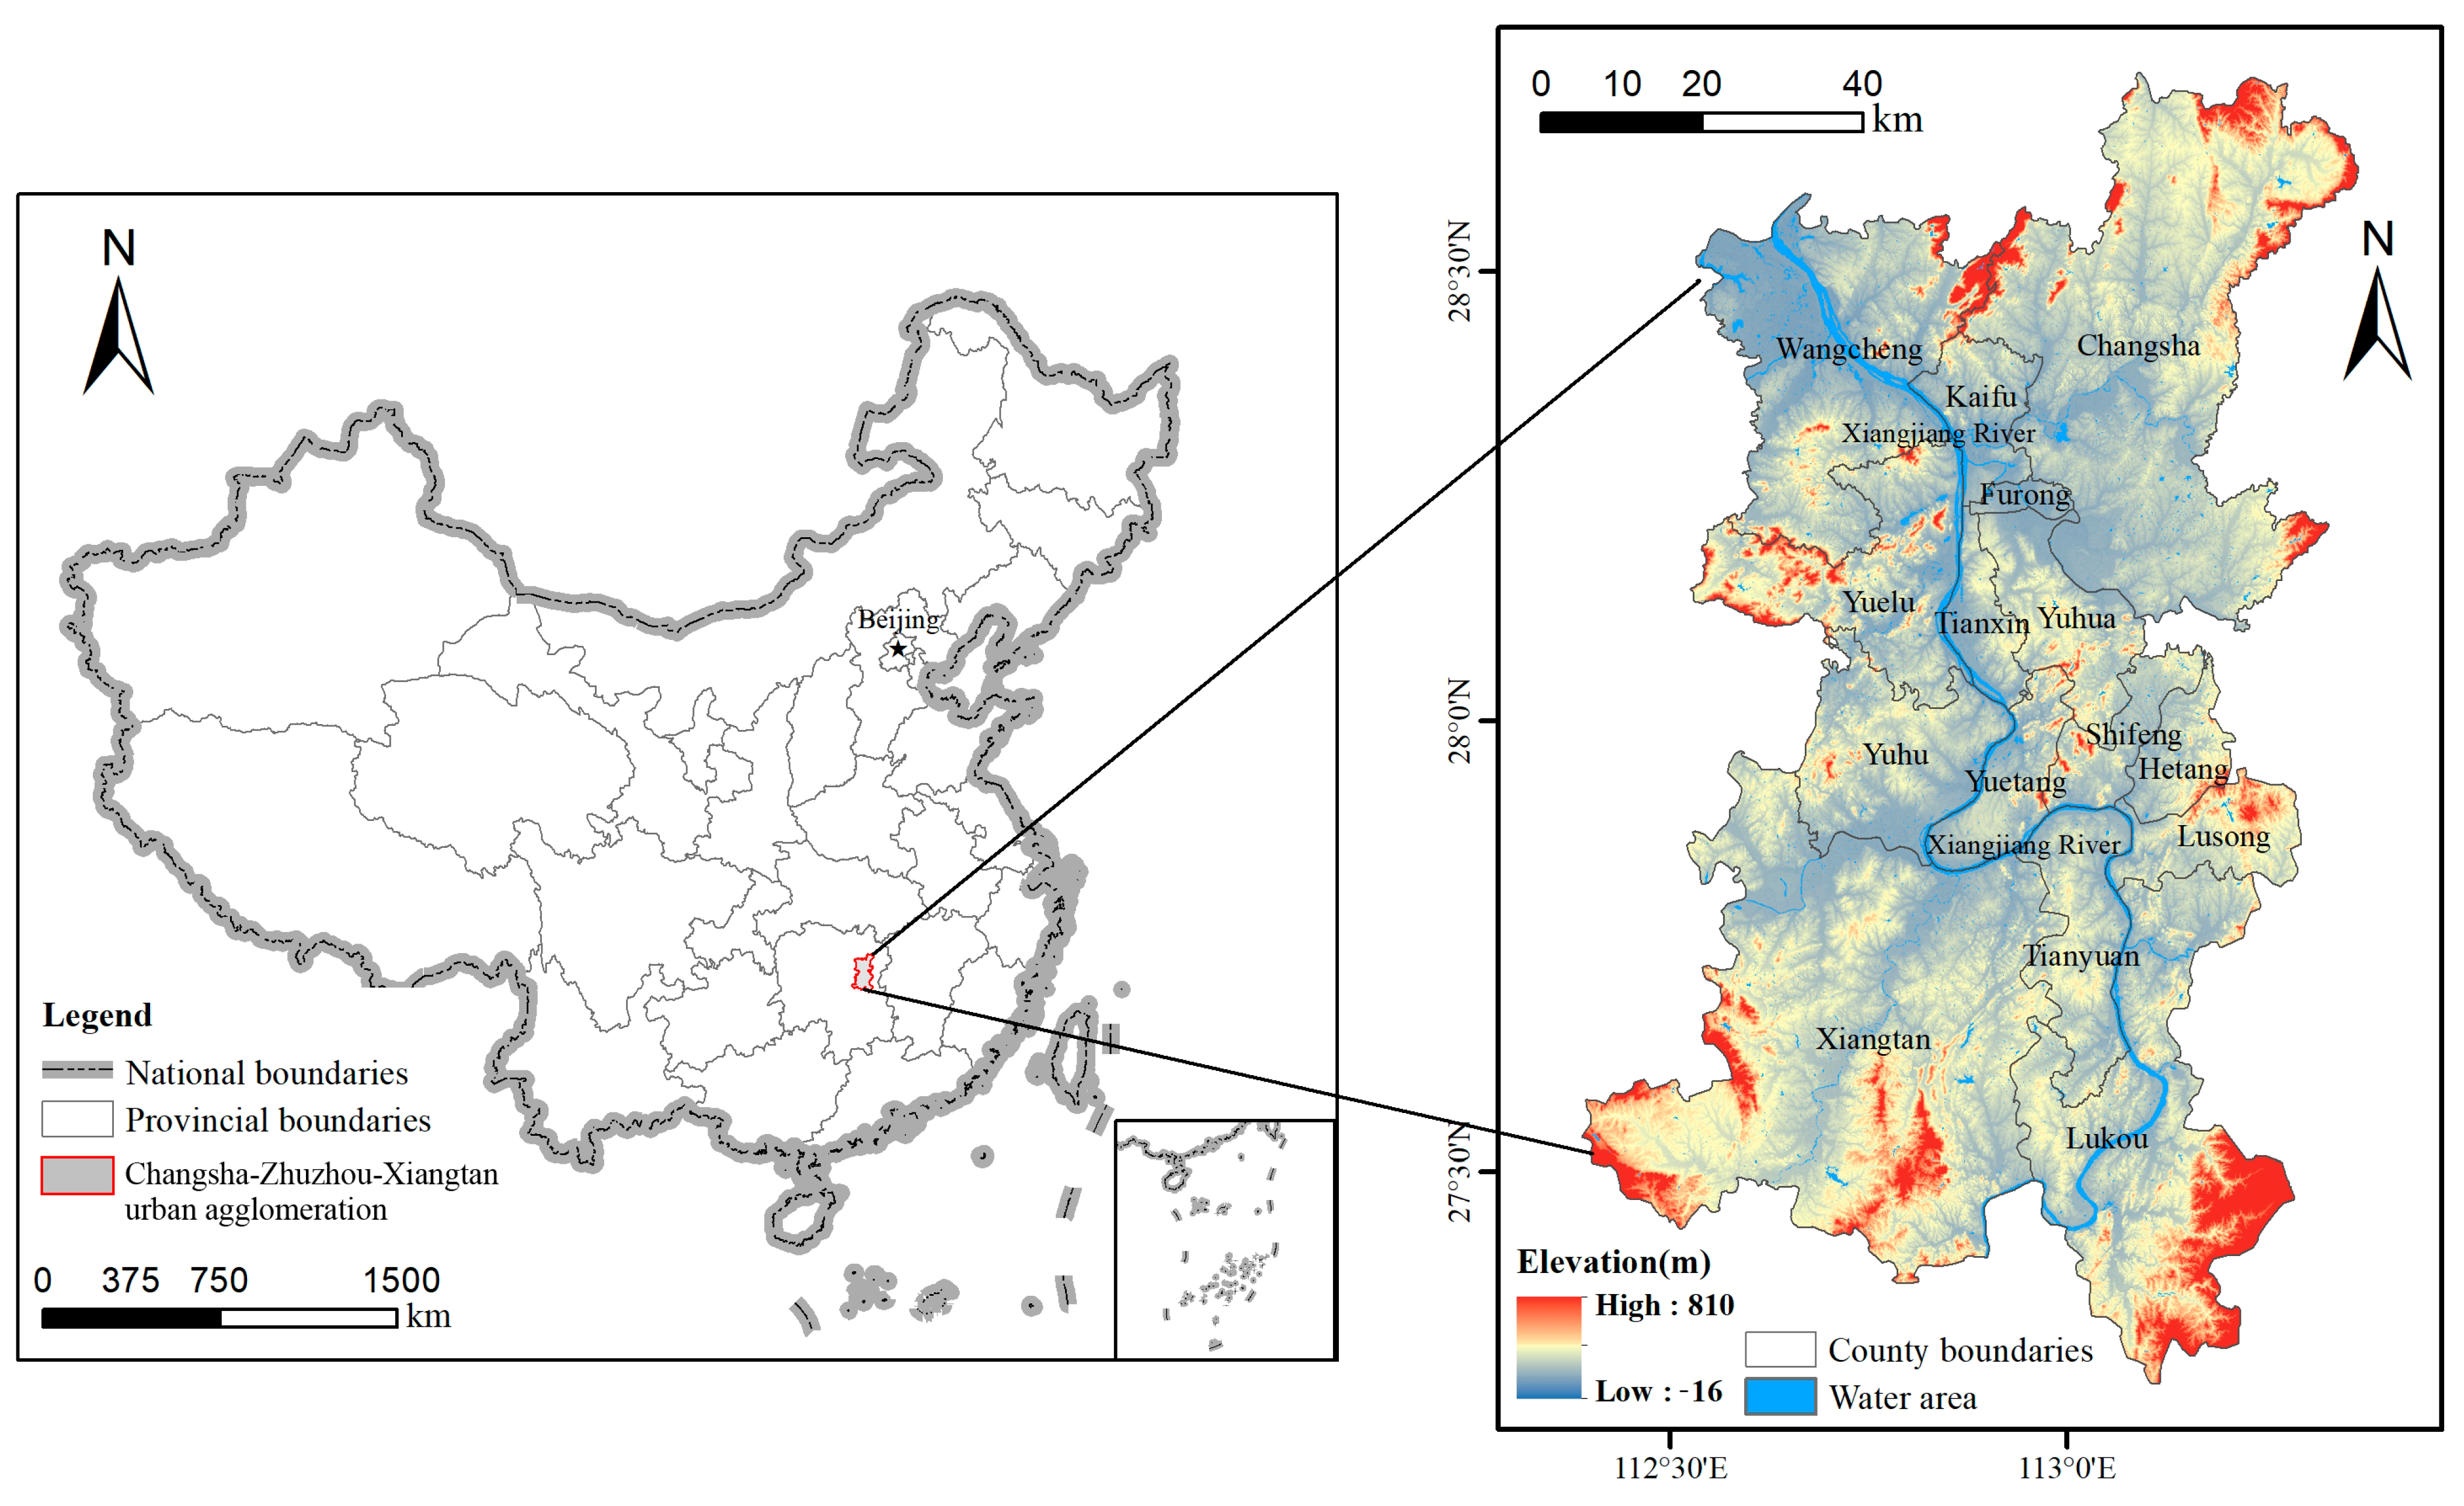
Figure 2.
Our framework for ESP identification.
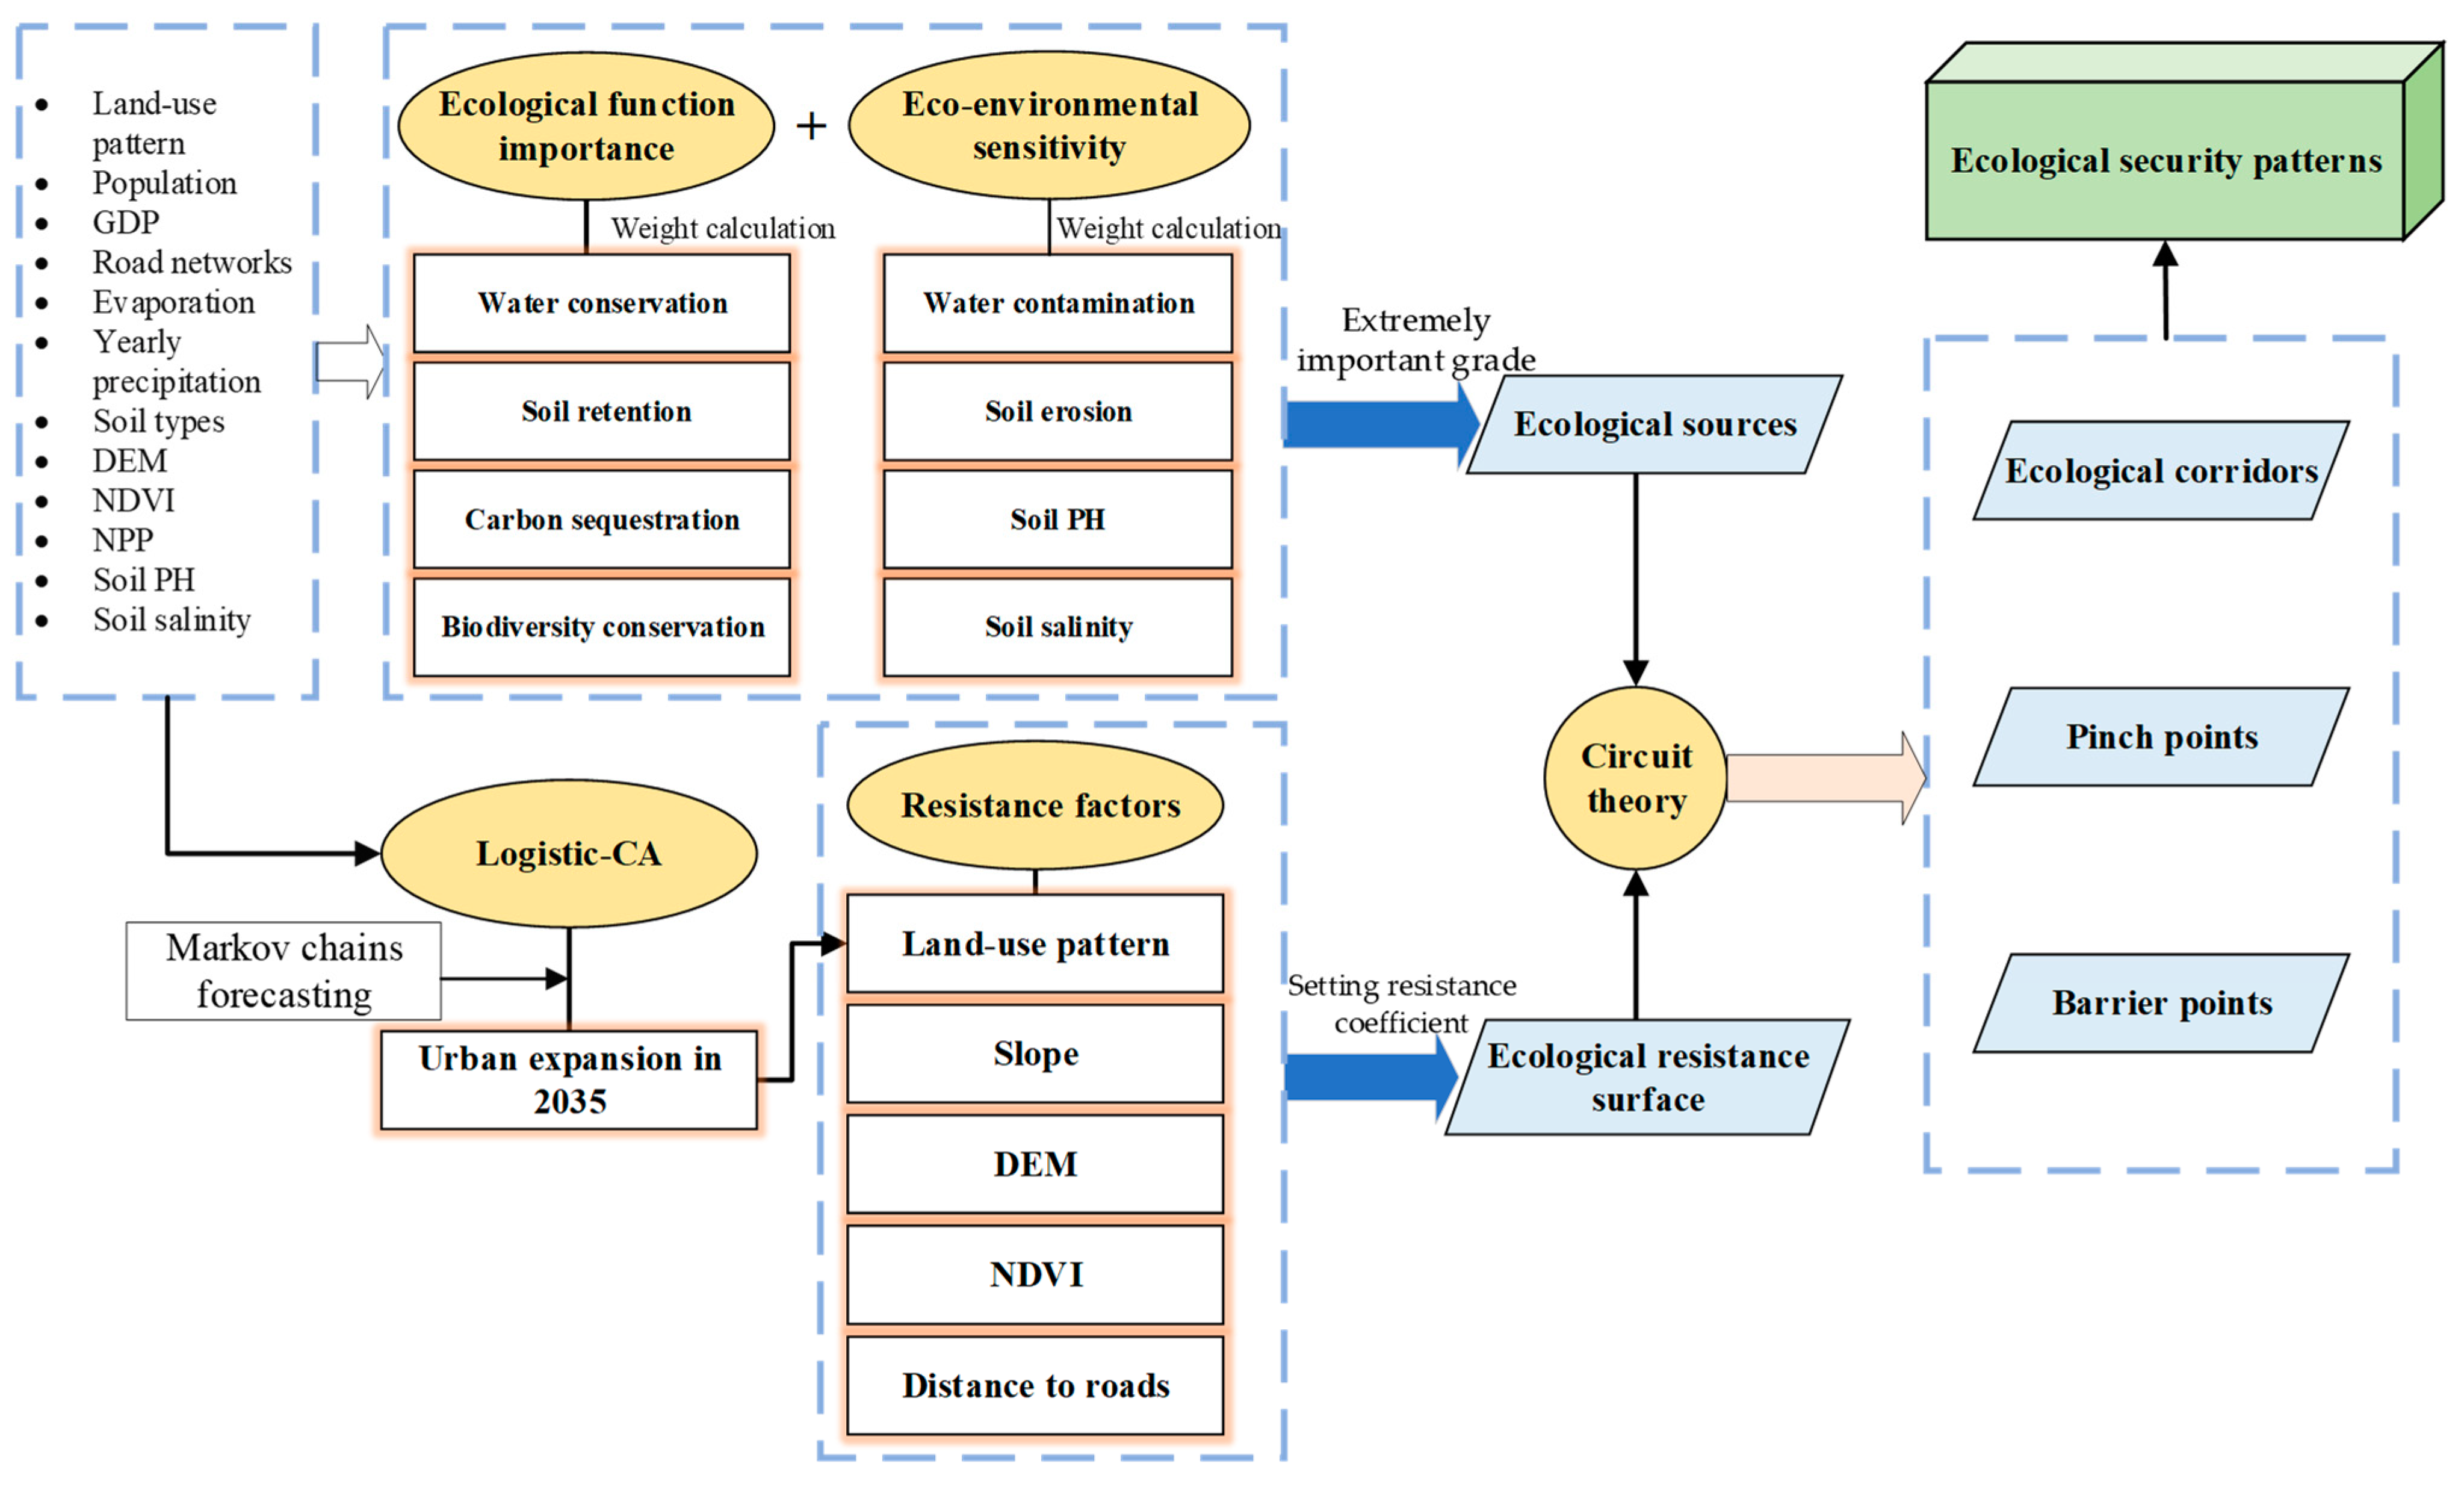
Figure 3.
Land-use pattern in the CZX urban agglomeration: (a) the actual land-use pattern in 2019, (b) the simulated land-use pattern in 2035, and (c) the land-use change from 2019 to 2035.
Figure 3.
Land-use pattern in the CZX urban agglomeration: (a) the actual land-use pattern in 2019, (b) the simulated land-use pattern in 2035, and (c) the land-use change from 2019 to 2035.
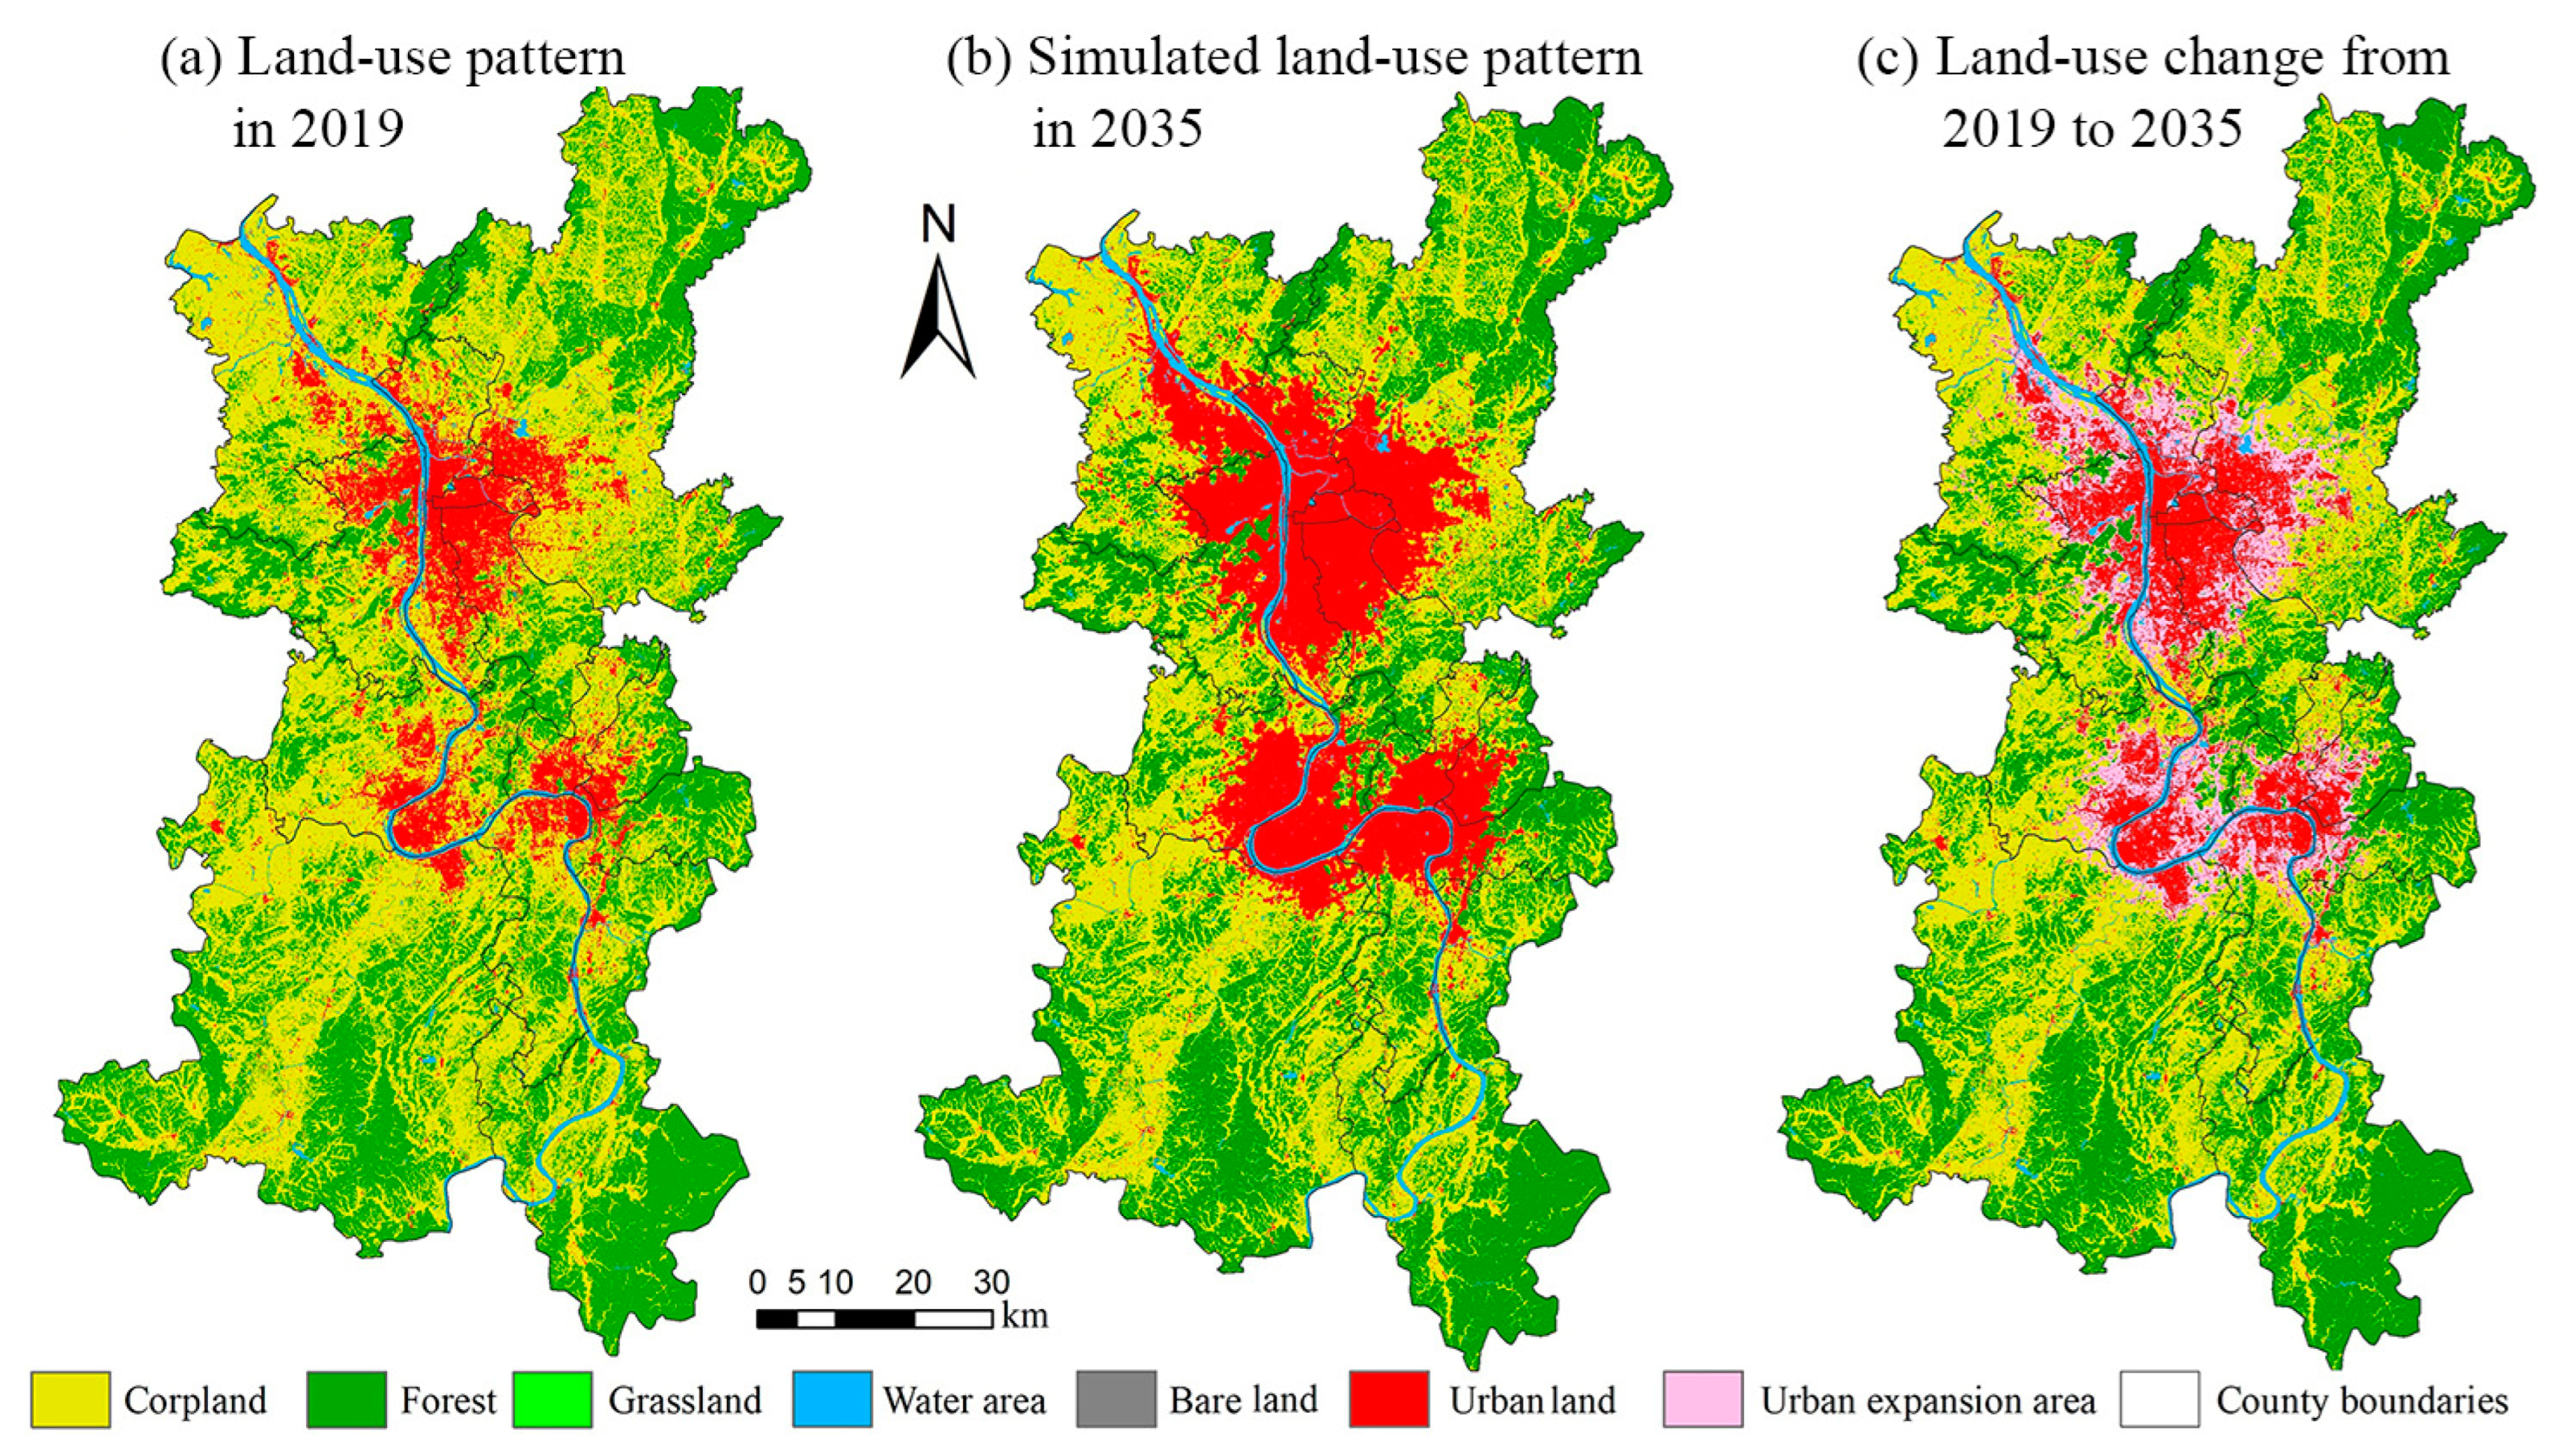
Figure 4.
Importance of ecological function in the CZX urban agglomeration: (a) water conservation; (b) soil retention; (c) carbon sequestration; (d) biodiversity; and (e) importance of ecological function.
Figure 4.
Importance of ecological function in the CZX urban agglomeration: (a) water conservation; (b) soil retention; (c) carbon sequestration; (d) biodiversity; and (e) importance of ecological function.

Figure 5.
Eco-environmental sensitivity in the CZX urban agglomeration: (a) water contamination; (b) soil erosion; (c) soil PH; (d) soil salinity; and (e) ecological sensitivity.
Figure 5.
Eco-environmental sensitivity in the CZX urban agglomeration: (a) water contamination; (b) soil erosion; (c) soil PH; (d) soil salinity; and (e) ecological sensitivity.

Figure 6.
Distribution of identified ecological resources.
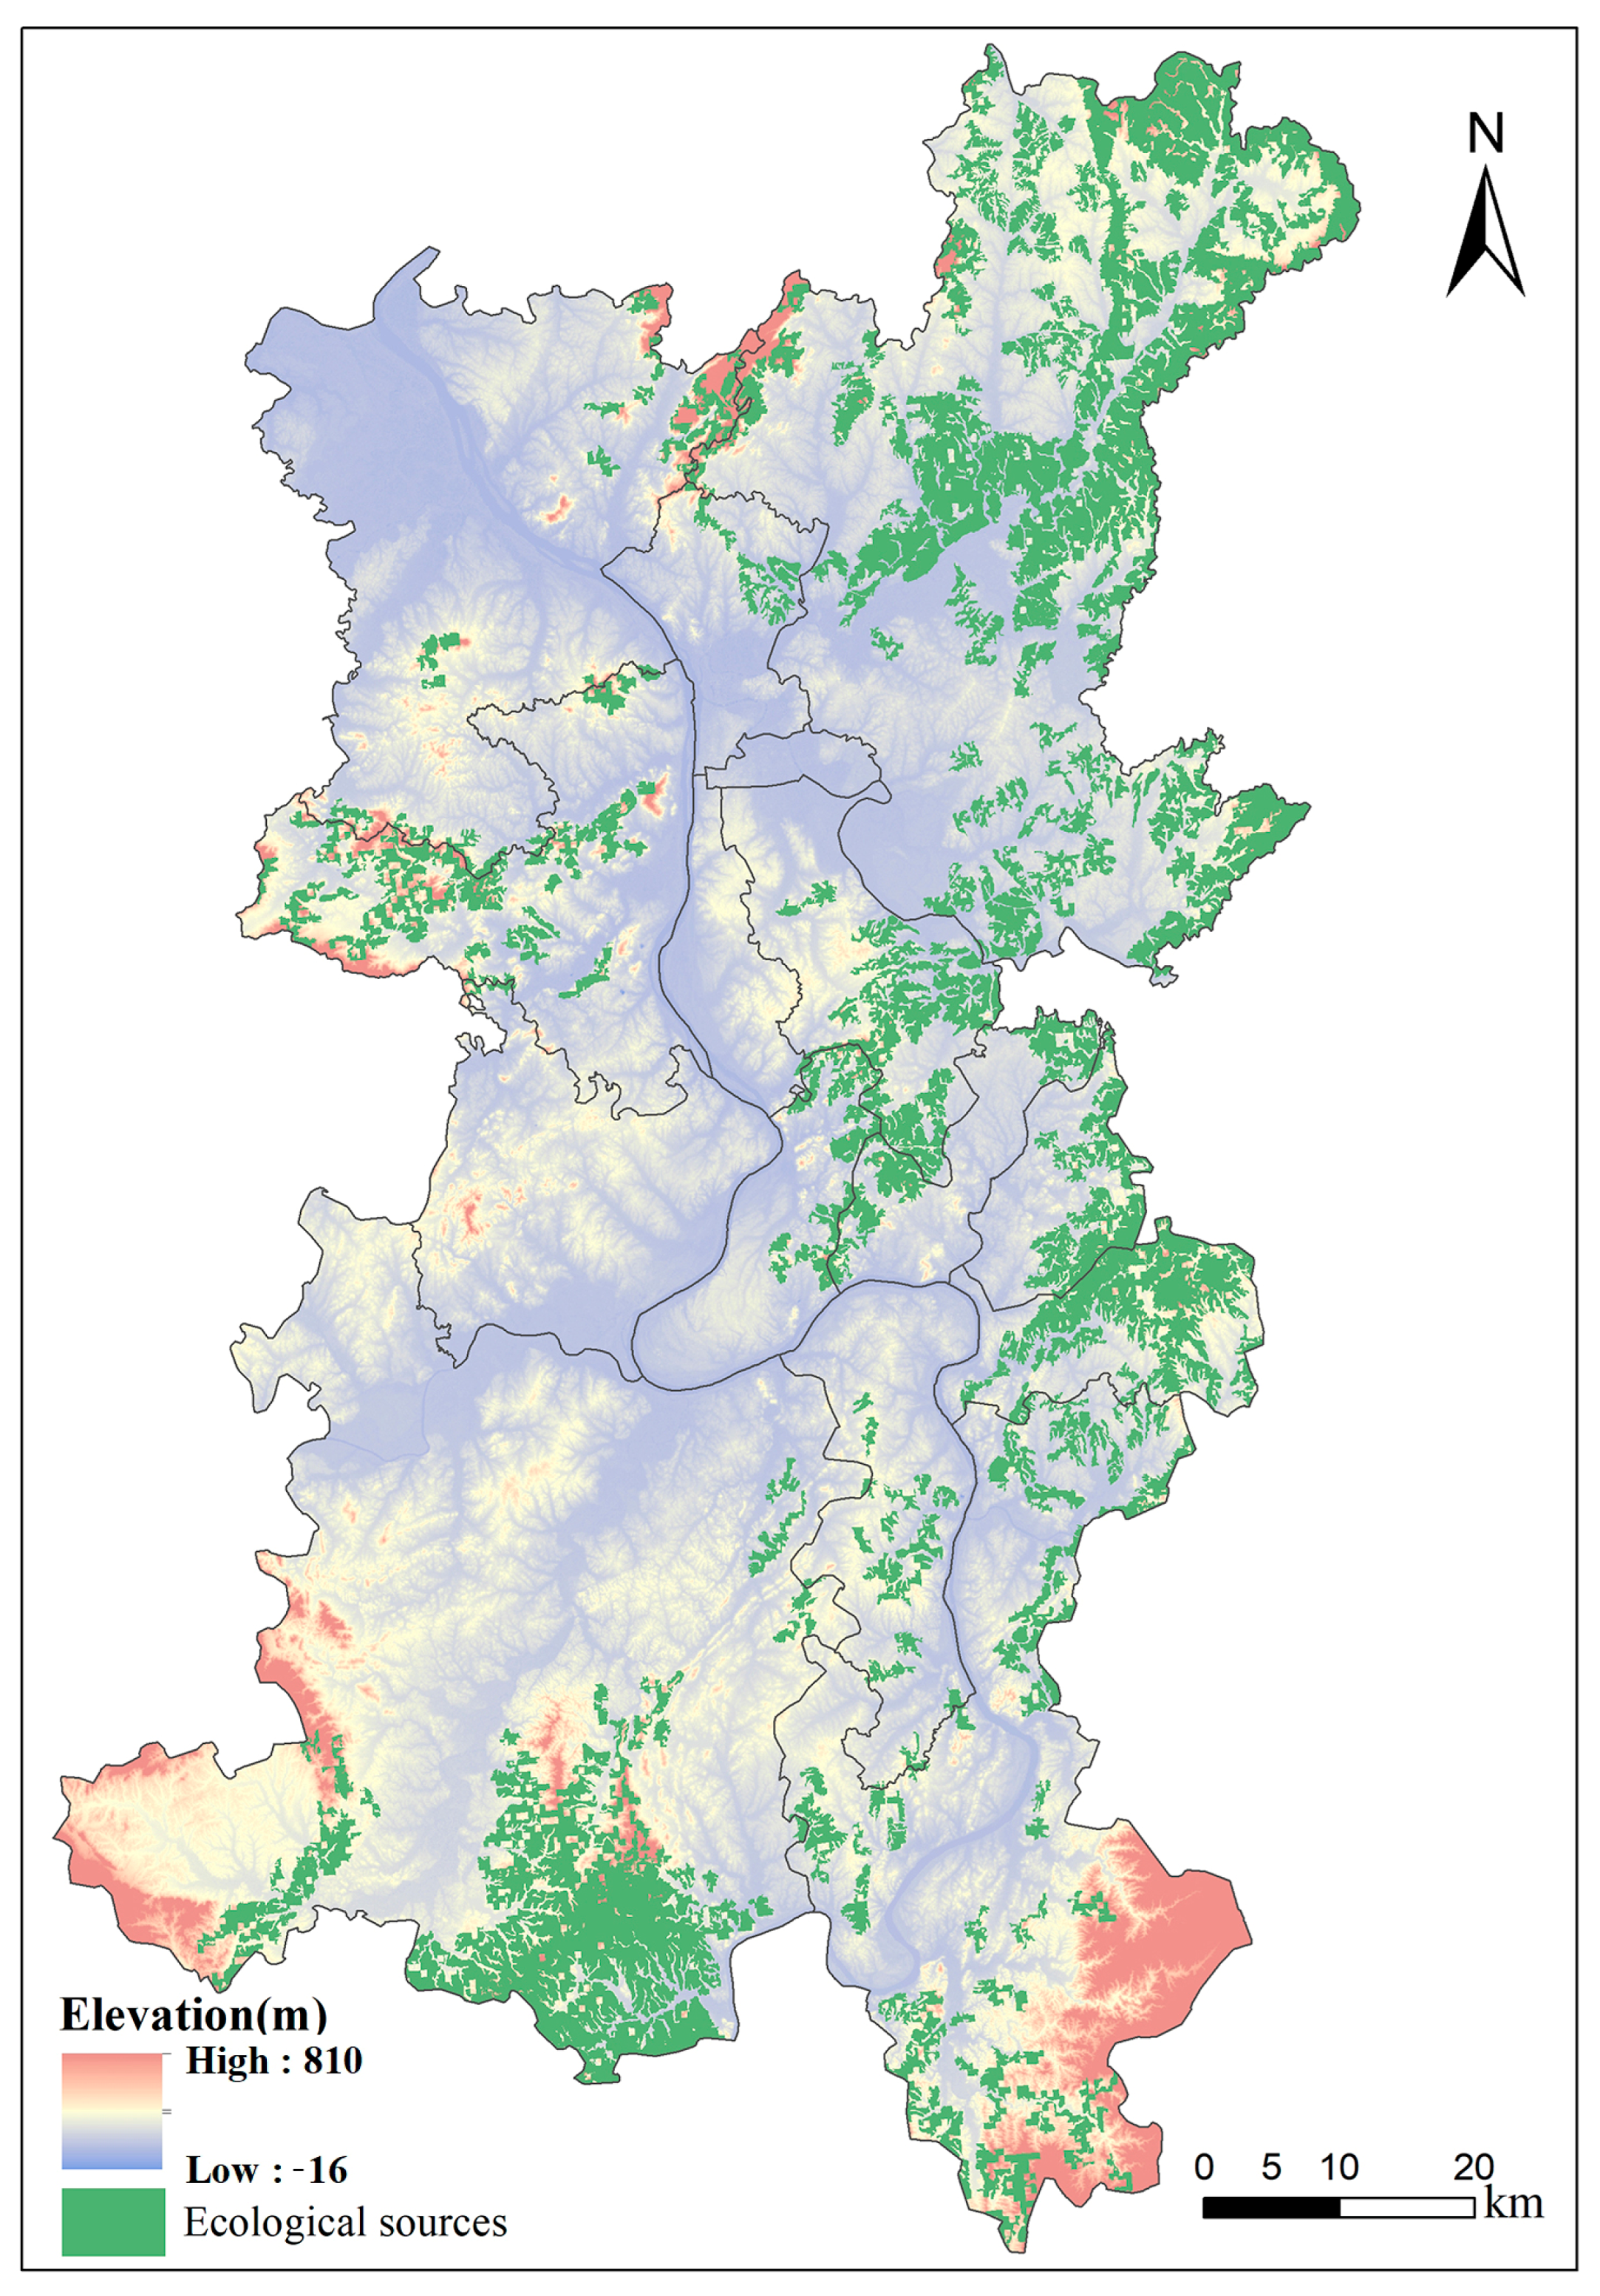
Figure 7.
Ecological resistance levels of the surface in the CZX urban agglomeration.
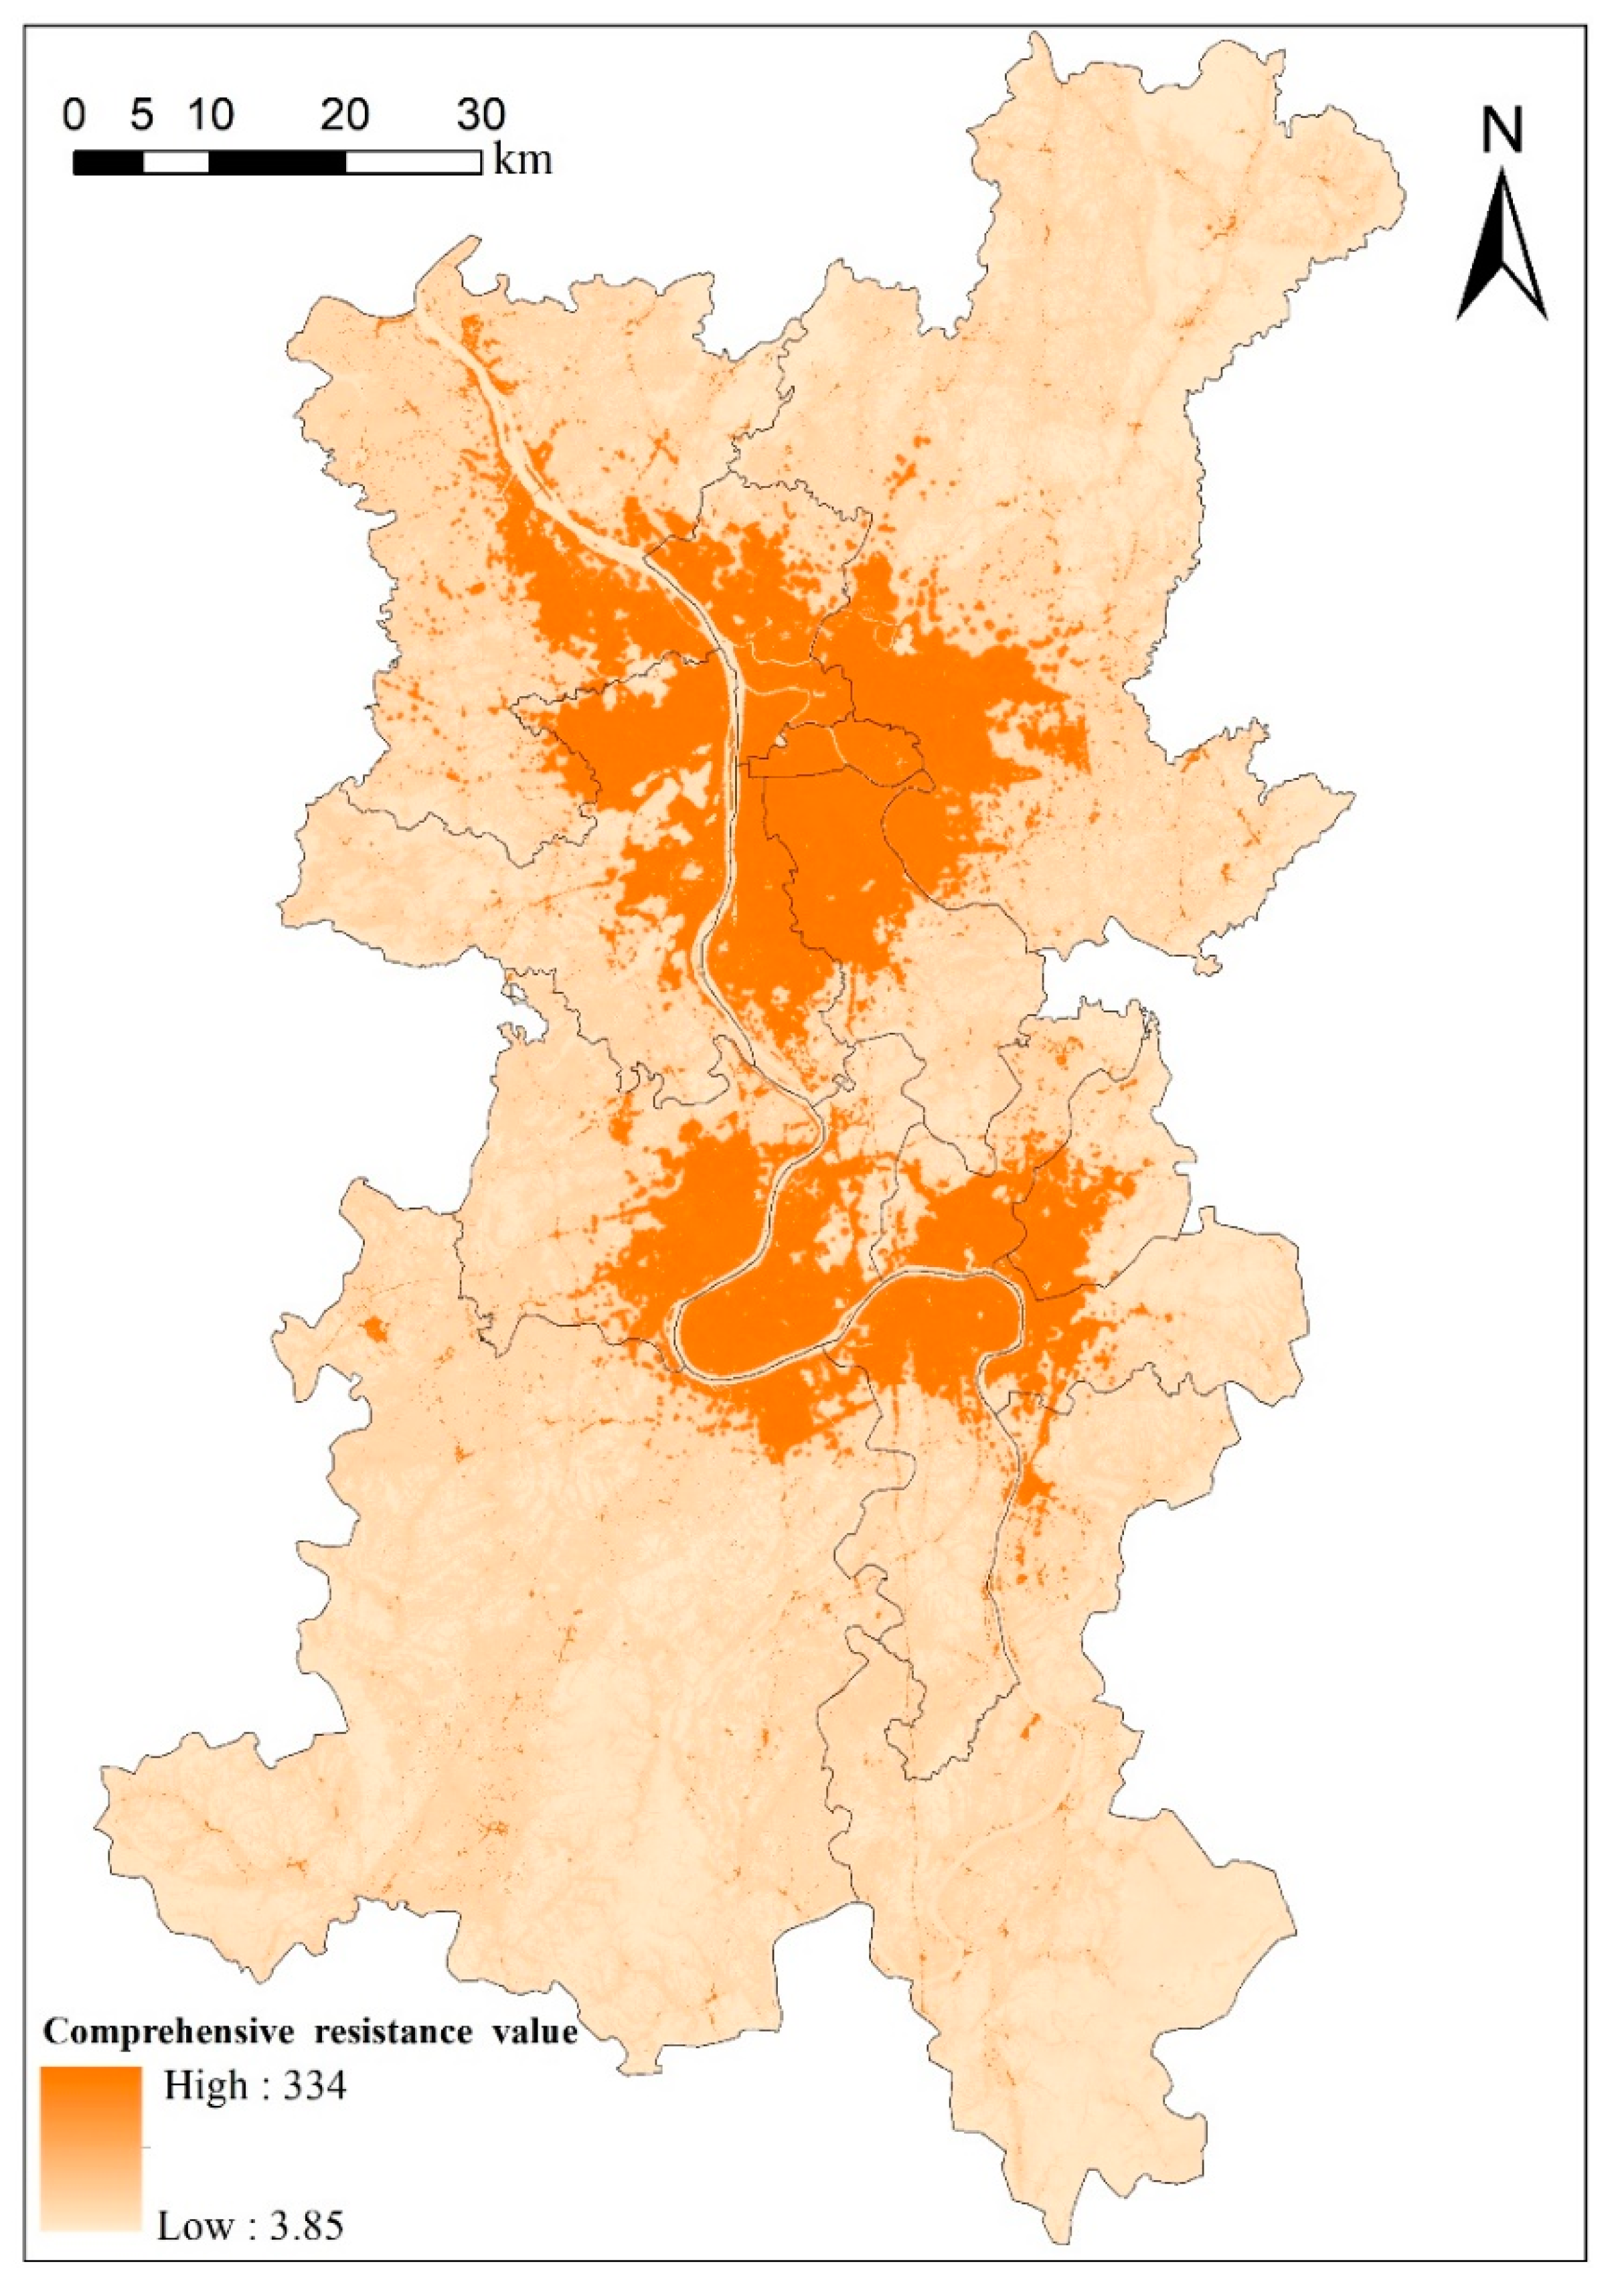
Figure 8.
Ecological corridors and nodes in CZX urban agglomeration based on (a) a future land-use pattern and (b) a present land-use pattern.
Figure 8.
Ecological corridors and nodes in CZX urban agglomeration based on (a) a future land-use pattern and (b) a present land-use pattern.


Table 1.
Data types and the corresponding scale and sources.
| Data Types | Spatial Scale | Data Sources |
|---|---|---|
| Land-use pattern (2000, 2010, 2015, and 2019) | 30 m | Derived from Yang [55] (https://zenodo.org/record/5816591#.YvueF8iVX04 (accessed on 9 August 2022)) |
| Population (2010) | 1 km | Resource and Environment Data Cloud Platform (http://www.resdc.cn/ (accessed on 2 August 2003)) |
| GDP (2010) | 1 km | |
| Road networks (2010) | 1:100,000 | Open-street Map (www.openstreetmap.org/ (accessed on 1 July 2004)) |
| Evaporation (ET) (2010 and 2019) | 1 km | National Science & Technology Infrastructure (http://www.cnern.org.cn/ (accessed on 1 July 2019)) |
| Yearly precipitation (2010 and 2019) | N/A | National meteorological science data center (http://data.cma.cn/ (accessed on 29 September 2015)) |
| Soil types (2019) | 1:1,000,000 | Geographic Data Sharing Infrastructure, College of Urban and Environmental Science, Peking University (http://geodata.pku.edu.cn (accessed on 25 December 2018)) |
| Digital elevation model (DEM) (2009) | 30 m | Geospatial Data Cloud (http://www.gscloud.cn/ (accessed on 20 December 210)) |
| Normalized difference vegetation index (NDVI) (2010 and 2019) | 1 km | |
| Net primary productivity (NPP) (2010 and 2019) | 500 m | Derived from Google Earth Engine (GEE) (https://earthengine.google.com/ (accessed on 25 December 2017)) |
| Soil PH (1995~2011) | N/A | National Science & Technology Infrastructure (http://www.cnern.org.cn/data/meta?id=40176 (accessed on 1 July 2019)) |
| Soil salinity (1995~2011) | ||
| Administrative boundaries (2019) | 1:100,000 | Geospatial Data Cloud (http://www.gscloud.cn/ (accessed on 20 December 210)) |
Notes: N/A represents that the format of the data is point vector shape, or attribute shape without spatial information.
Table 2.
Resistance factors and their weights.
| Resistance Indicator | Classification | Resistance Value | Weight | Resistance Indicator | Classification | Resistance Value | Weight |
|---|---|---|---|---|---|---|---|
| Land-use types | Forest land | 1 | 0.4 | Distance to roads | [0, 200] | 100 | 0.15 |
| Water bodies | 10 | (200, 400] | 80 | ||||
| Grassland | 30 | (400, 800] | 60 | ||||
| Bare land | 50 | (800, 1600] | 40 | ||||
| Cropland | 100 | (1600, 3200] | 20 | ||||
| Urban land | 700 | (3200, +∞) | 1 | ||||
| Slope | [0, 6] | 1 | 0.15 | DEM | [0, 25] | 1 | 0.15 |
| (6, 15] | 40 | (25, 50] | 40 | ||||
| (15, 25] | 60 | (50, 100] | 60 | ||||
| (25, 35] | 80 | (100, 300] | 80 | ||||
| (35, 90] | 100 | (300, +∞) | 100 | ||||
| [0, 0.3] | 100 | ||||||
| (0.3, 0.5] | 80 | ||||||
| NDVI | (0.5, 0.65] | 60 | 0.15 | ||||
| (0.65, 0.75] | 40 | ||||||
| (0.75, 1] | 1 |
Table 3.
Urban built-up area of the districts of the CZX urban agglomeration in 2019 and 2035 (km2).
Table 3.
Urban built-up area of the districts of the CZX urban agglomeration in 2019 and 2035 (km2).
| District/County | Urban Built-Up Areas (2019) | Urban Built-Up Areas (2035) | Newly-Added Urban Areas |
|---|---|---|---|
| Furong | 33.85 | 41.16 | 7.31 |
| Tianxin | 57.78 | 88.03 | 30.25 |
| Yuelu | 89.54 | 146.04 | 56.50 |
| Kaifu | 56.68 | 105.79 | 49.11 |
| Yuhua | 86.93 | 116.67 | 29.74 |
| Wangcheng | 69.81 | 138.04 | 68.23 |
| Changsha county | 109.96 | 209.74 | 99.78 |
| Hetang | 26.95 | 48.87 | 21.92 |
| Lusong | 18.17 | 37.11 | 18.93 |
| Shifeng | 36.99 | 55.90 | 18.91 |
| Tianyuan | 47.40 | 86.74 | 39.34 |
| Lukou | 17.40 | 19.47 | 2.07 |
| Yuhu | 59.12 | 114.49 | 55.36 |
| Yuetang | 59.56 | 113.97 | 54.41 |
| Xiangtan county | 41.66 | 66.40 | 24.74 |
| Overall | 811.83 | 1388.45 | 576.62 |
Disclaimer/Publisher’s Note: The statements, opinions and data contained in all publications are solely those of the individual author(s) and contributor(s) and not of MDPI and/or the editor(s). MDPI and/or the editor(s) disclaim responsibility for any injury to people or property resulting from any ideas, methods, instructions or products referred to in the content. |
© 2023 by the authors. Licensee MDPI, Basel, Switzerland. This article is an open access article distributed under the terms and conditions of the Creative Commons Attribution (CC BY) license (https://creativecommons.org/licenses/by/4.0/).
Share and Cite
MDPI and ACS Style
Wang, W.; Li, B.; Su, F.; Jiang, Z.; Chen, S. Identifying Ecological Security Patterns Meeting Future Urban Expansion in Changsha–Zhuzhou–Xiangtan Urban Agglomeration, China. Remote Sens. 2023, 15, 3141. https://doi.org/10.3390/rs15123141
AMA Style
Wang W, Li B, Su F, Jiang Z, Chen S. Identifying Ecological Security Patterns Meeting Future Urban Expansion in Changsha–Zhuzhou–Xiangtan Urban Agglomeration, China. Remote Sensing. 2023; 15(12):3141. https://doi.org/10.3390/rs15123141
Chicago/Turabian StyleWang, Weilin, Bin Li, Fei Su, Zhenfeng Jiang, and Shulu Chen. 2023. "Identifying Ecological Security Patterns Meeting Future Urban Expansion in Changsha–Zhuzhou–Xiangtan Urban Agglomeration, China" Remote Sensing 15, no. 12: 3141. https://doi.org/10.3390/rs15123141
Note that from the first issue of 2016, this journal uses article numbers instead of page numbers. See further details here.