
Tree Species Diversity Mapping—Success Stories and Possible Ways Forward


Institute of Geomatics, Department of Landscape, Spatial and Infrastructure Sciences, University of Natural Resources and Life Sciences Vienna (BOKU), Peter-Jordan-Straße 82, 1190 Vienna, Austria
*
Author to whom correspondence should be addressed.
Remote Sens. 2023, 15(12), 3074; https://doi.org/10.3390/rs15123074
Submission received: 6 May 2023
/
Revised: 26 May 2023
/
Accepted: 6 June 2023
/
Published: 12 June 2023
(This article belongs to the Special Issue Mapping Tree Species Diversity)
Abstract
:The special issue “Tree species diversity mapping” presents research focused on the remote assessment of tree species diversity, using different sensor modalities and platforms. The special issue thereby recognizes that the continued loss of biodiversity poses a great challenge to humanity. Precise and regularly updated baseline information is urgently needed, which is difficult, using field inventories, especially on a large scale. On such scales, remote sensing methods excel. The work presented in the special issue demonstrates the great potential of Earth Observation (EO) for addressing knowledge gaps, as EO provides rich (spectral) information at high revisit frequencies and spatial resolutions. Many tree species can be distinguished well using optical data, in particular, when simultaneously leveraging both the spectral and temporal dimensions. A combination with other sensor modalities can further improve performance. EO approaches are, however, limited by the availability of high-quality reference information. This complicates the task as the collection of field data is labor and time-consuming. To mitigate this limiting factor, resources should be better shared amongst the community. The reliance on in situ data also highlights the need to focus research on the extraction of more permanent (i.e., species-inherent) properties. In this respect, we identify and discuss some inherent limitations of current approaches regarding tree species discrimination. To this end, we offer a more fundamental view on tree species classification based on physical principles. To provide both a summary of the special issue and some stimulating thoughts about possible future research directions, we structured the present communication into four parts. We first introduce the need for biodiversity information, followed by a summary of all 19 articles published within the special issue. The articles are ordered by the number of species investigated. Next, we provide a short summary of the main outputs. To stimulate further research and discussion within the scientific community, we conclude this communication by offering a more fundamental view on tree species classification based on EO data and its biophysical foundations. In particular, we purport that species can possibly be more robustly identified if we classify/identify them in the biophysical feature space and not in the spectral-temporal feature space. This involves the creation and inversion of so-called physically-based radiative transfer models (RTM), which take hyper/multispectral observations together with their observation geometry (as well as other priors), and project these into biophysical variables such as chlorophyll content and LAI etc. The perceived advantage of such an approach is that the generalizability (and scalability) of EO based classifications will increase, as the temporal trajectory of species in the biophysical parameter space is probably more robust compared to the sole analysis of spectral data, which—amongst other perturbing factors—also depend on site/time specific illumination geometry.
1. Introduction
The IPBES report on Biodiversity and Ecosystem Services depicts an alarming and shocking picture of the Earth [1]. With accelerating rates of species extinction, our environment is declining globally at unprecedented rates. Transformative economic and societal change is necessary, and will involve far-reaching alterations and actions at both local and global levels. This issue was recently discussed at UN Biodiversity Conference COP15 in Montréal [2]. To cope with the pace of global change, amongst many other activities, a rapid increase in knowledge about species numbers, compositions, and conditions is required, as well as species interactions and environments [1]. This information should possibly be condensed into quantitative measures of biodiversity [3].
Remote sensing provides the only feasible way to cost-effectively and repeatedly measure and monitor land cover changes on large scale—while at the same time, allowing a user to look as far back as the start of the space age, in the 1970s [4,5]. Today’s sensors on platforms such as satellites, aircraft, and UAV provide a wide range of observational capability in terms of spatial, temporal, and spectral resolutions. Machine learning approaches and computational capacity are improving quickly, offering huge potential for improved data analysis, including “big data” and the development of powerful monitoring systems. First efforts were undertaken to bridge gaps between Earth observation (EO) scientists on one hand, and ecologists etc. on the other hand [3]. A first set of comprehensive essential biodiversity variables (EBVs) and how they can be monitored by EO technique were defined [4,6,7].
2. Overview of Contributions
The special issue “Mapping Tree Species Diversity” aimed to collect scientific research covering the following themes:
- biodiversity of forests, with respect to classical species diversity;
- the mapping of changes in diversity;
- the floristic composition of forests;
- invasive species;
- the functional diversity of forests.
In total, the special issue includes one review and 17 research articles. Despite the limited number of studies, a wide range of different ecoregions could be covered. The studies were conducted on all continents except Antarctica. With six studies each, there is a focus on Europe and Asia, followed by Africa with three studies. One study each was performed in North America, South America, and Oceania. As a result of the broad geographical coverage, a relatively wide range of plant species and climatic zones were examined, from boreal and temperate forests to tropical forests. It is also exciting that numerous studies were carried out in forests that are subject to a certain protection category, from biosphere parks to nature reserves and national parks, which shows the increasing interest in monitoring such areas with EO data.
Most studies focused on the separation and classification of tree species or tree species groups, using optical data from different platforms and sensors (Table 1). The review paper summarized the current knowledge of LiDAR for tree species classification. Two studies investigated the advantages of combining optical data with LiDAR and one with SAR data. Most studies used spectral signatures or resultant spectral indices as discriminative features, either derived from single scenes or multiple images. In addition to the well-established Landsat and Sentinel-2 (S2) satellites, which provide high quality data free of charge, commercial satellites with higher spatial resolution such as Worldview (WV)-2/3 or Gaofen-1/2, were also used. Textural measures, and approaches borrowed from computer vision, were used in the case of very high-resolution (sub-meter) data recorded by aircraft and unmanned aerial vehicles (UAV). To separate and classify tree species, Random Forest (RF) and Support Vector Machine (SVM) algorithms were most often used, in particular when using (orbital) remote sensing data with metric to hecto-metric ground sampling distance (GSD). A few neural network approaches were used when UAV data was analyzed.
The review paper on LiDAR [8] pointed out that LiDAR data are currently often used for the separation of only a few (2–4) tree species. In addition to geometry, the use of the full-waveform and intensity features improves the classification performances. The authors concluded that combinations with other data sources from the spectral domain are promising, but also challenging.
Lu et al. [9] mapped Faidherbia albida, often used in Senegal’s agroforestry systems, using multi-spectral S2 time series. The “reversed” phenology of this species, compared to many other species in the region, did not show the expected clear signal. This was explained by the spectral contribution of the herbaceous layer. Nevertheless, especially with data from the senescence phase, the species could be detected very well, and thus, a good data basis for management activities could be established.
Pearse et al. [10] highlighted the potential of deep learning approaches for the mapping of one specific species (Metrosideros excelsa) based on RGB data from drones. Distinctive phenological features like red flowers facilitate the recognition of the species but are not mandatory. Higher spectral resolution and image quality would be helpful to distinguish more species.
Tian and Fu [11] showed the possibility of EO data, in particular Landsat scenes, for largescale mapping of the boreal forest cover in Siberia. They analyzed changes in the cover of broadleaved and coniferous trees between 1985 and 2015. The quality of the 2015 map was validated by using very high resolution (VHR) data (Gaofan-2).
Next to the separation of coniferous and broadleaved trees; the main aim in the study of Krzystek et al. [12] was the mapping of standing dead trees which were separated in snags and among trees with crowns. Dead trees are often important habitats for fauna and flora, and therefore, often a driver for biodiversity in forests. The work highlighted the potential of ALS data for individual tree crown (ITC) approaches and the detection of standing deadwood in a nature protected area (national parks) on the border Germany and Czech Republic.
Well-executed topographic corrections are a prerequisite for the optimum analysis of high-quality EO data. Dong et al. [13] found that the overall accuracy of classifications models for four tree species in a mountainous area in the Shandong Province, China can be improved by 4–13 percentage points by using better-suited topographic correction methods. The use of vegetation indices (VI) can further reduce the influence of the topography and can therefore improve the classification.
Egli and Höpke [14] analyzed UAV data acquired at different daytimes for tree species classification with a convolutional neural network (CNN) and found that the models are independent from illumination conditions. In contrast, the spatial resolution of the input data has a strong impact on the classification accuracy. Decreasing the GSD/resolution through resampling degraded the model results, however, the classification accuracy of a human interpreter dropped much faster and earlier than the CNN models.
Xu et al. [15] analyzed the influence of the spatial resolution on tree species classification in northeast China. They analyzed NDVI time series obtained by monthly data from four different sensors with spatial resolution between 4 to 30 m for the separation of four species. The 10 m data sets outperformed the other data sets. The use of additional metrics describing the land surface phenology (LSP) improved the models. The study showed that phenological parameters were not independent from spatial resolution.
Yan et al. [16] used WV-3 data with the four standard bands to distinguish tree species in a park landscape in Beijing, China by using an ITC approach. They pointed out the importance of high quality crown delineation for achieving good accuracies which is more complicated in natural forests. The CNN outperformed traditional classifiers such as RF and SVM while not needing a separate feature extraction step.
Kovačević et al. [17] used multi-temporal S2 data and analyzed different vegetation types for the entire geography of Serbia. Their approach is based on a probability classification model that considers the temporal information of the data sets and a spatial-temporal aggregation. The authors also highlighted the challenges regarding reference data for the classes of interest in terms of occurrence, recognizability, and demarcation.
Takahashi Miyoshi et al. [18] used UAV-borne hyperspectral data for their ITC approach in a study site in the Brazilian Atlantic forest. They found some differences in the interpretability of the three flights, which were done in June/July of three consecutive years. Different phenological stages and illumination conditions have an influence on the models. They found that the added value of multi-temporal data has to be investigated in detail with a more extensive reference data set.
Jackson and Adam [15] analyzed a WV-2 scene in a study area on Mount Kenia. They highlighted the importance of the Red, RedEdge, and NIR bands for the separation of the tree species. They used under and oversampling to generate a more balanced data set which improved the classification accuracy slightly.
Varin et al. [20] combined WV-3 and LiDAR data to analyze ITC. Transferring the canopy delineation done on the LiDAR canopy height model (CHM) to the WV-3 scene was challenging. The different spatial resolutions of the bands, especially the SWIR bands, also complicate the analyses. Therefore, they concluded that the 8-band data is preferable to the 16-band dataset. They also mentioned the problem of trees which were either not seen (too small crown and/or located in the understory) or species which were not considered in the reference data set.
Wan et al. [21] combined LiDAR data, aerial images, and S2 time series data in an hilly forest in China. They found the data with higher spatial resolution were more important for the species classification. However, the highest accuracies were achieved with the fusion approach using all data sets.
Lechner et al. [22] tested the combination of S2 and S1 data for the classification of 12 tree species in a biosphere reserve in Austria. A dense S1 time series (SAR) was able to separate coniferous species quite well and also improved mono-temporal S2 models. However, considerably higher accuracies were achieved by a multi-temporal S2 data set. In this case, additional SAR data could not further increase the accuracy.
Immitzer et al. [23] analyzed, for the same study site, an extensive multi-temporal S2 data set covering several years to identify the most important dates and bands to distinguish 12 tree species. They showed the high importance of the Red band for the separation of species in the coniferous group, the SWIR band for the broadleaved trees, and the NIR for the separation between these two tree species groups. VIs further improved the model performance when added to the spectral signatures. Spectral data sets with at least 5–7 scenes, covering the main phenological stages such as spring, summer, and autumn, led to very good results.
Karasiak et al. [24] used multi-temporal, 4-band Formosat-2 data from several years for tree species classification. The results showed that the usage of multi-temporal data improves the model performance; however, the best dates for optical data acquisition varied between years. They also tested different validation approaches and emphasized the importance of the number and quality of reference samples.
Chaurasia et al. [25] used hyperspectral data to produce species abundance maps and analyzed the intra- and inter-species spectral diversity for three test sites in India. They found higher spectral diversity within abundant species and attributed this to improved adaptation of these species to local conditions. Changes in species diversity over climatic gradients were also observed, which can be important with respect to climate change.
3. Summary of Main Outputs and Findings
The work presented in this special issue re-confirmed a number of findings. For example, no noticeable issues were reported in separating coniferous and broadleaved trees, thus confirming many previous studies [26,27]. The main features permitting this separation were located in the NIR, as in this spectral region the spectral differences are largest (Figure 1).
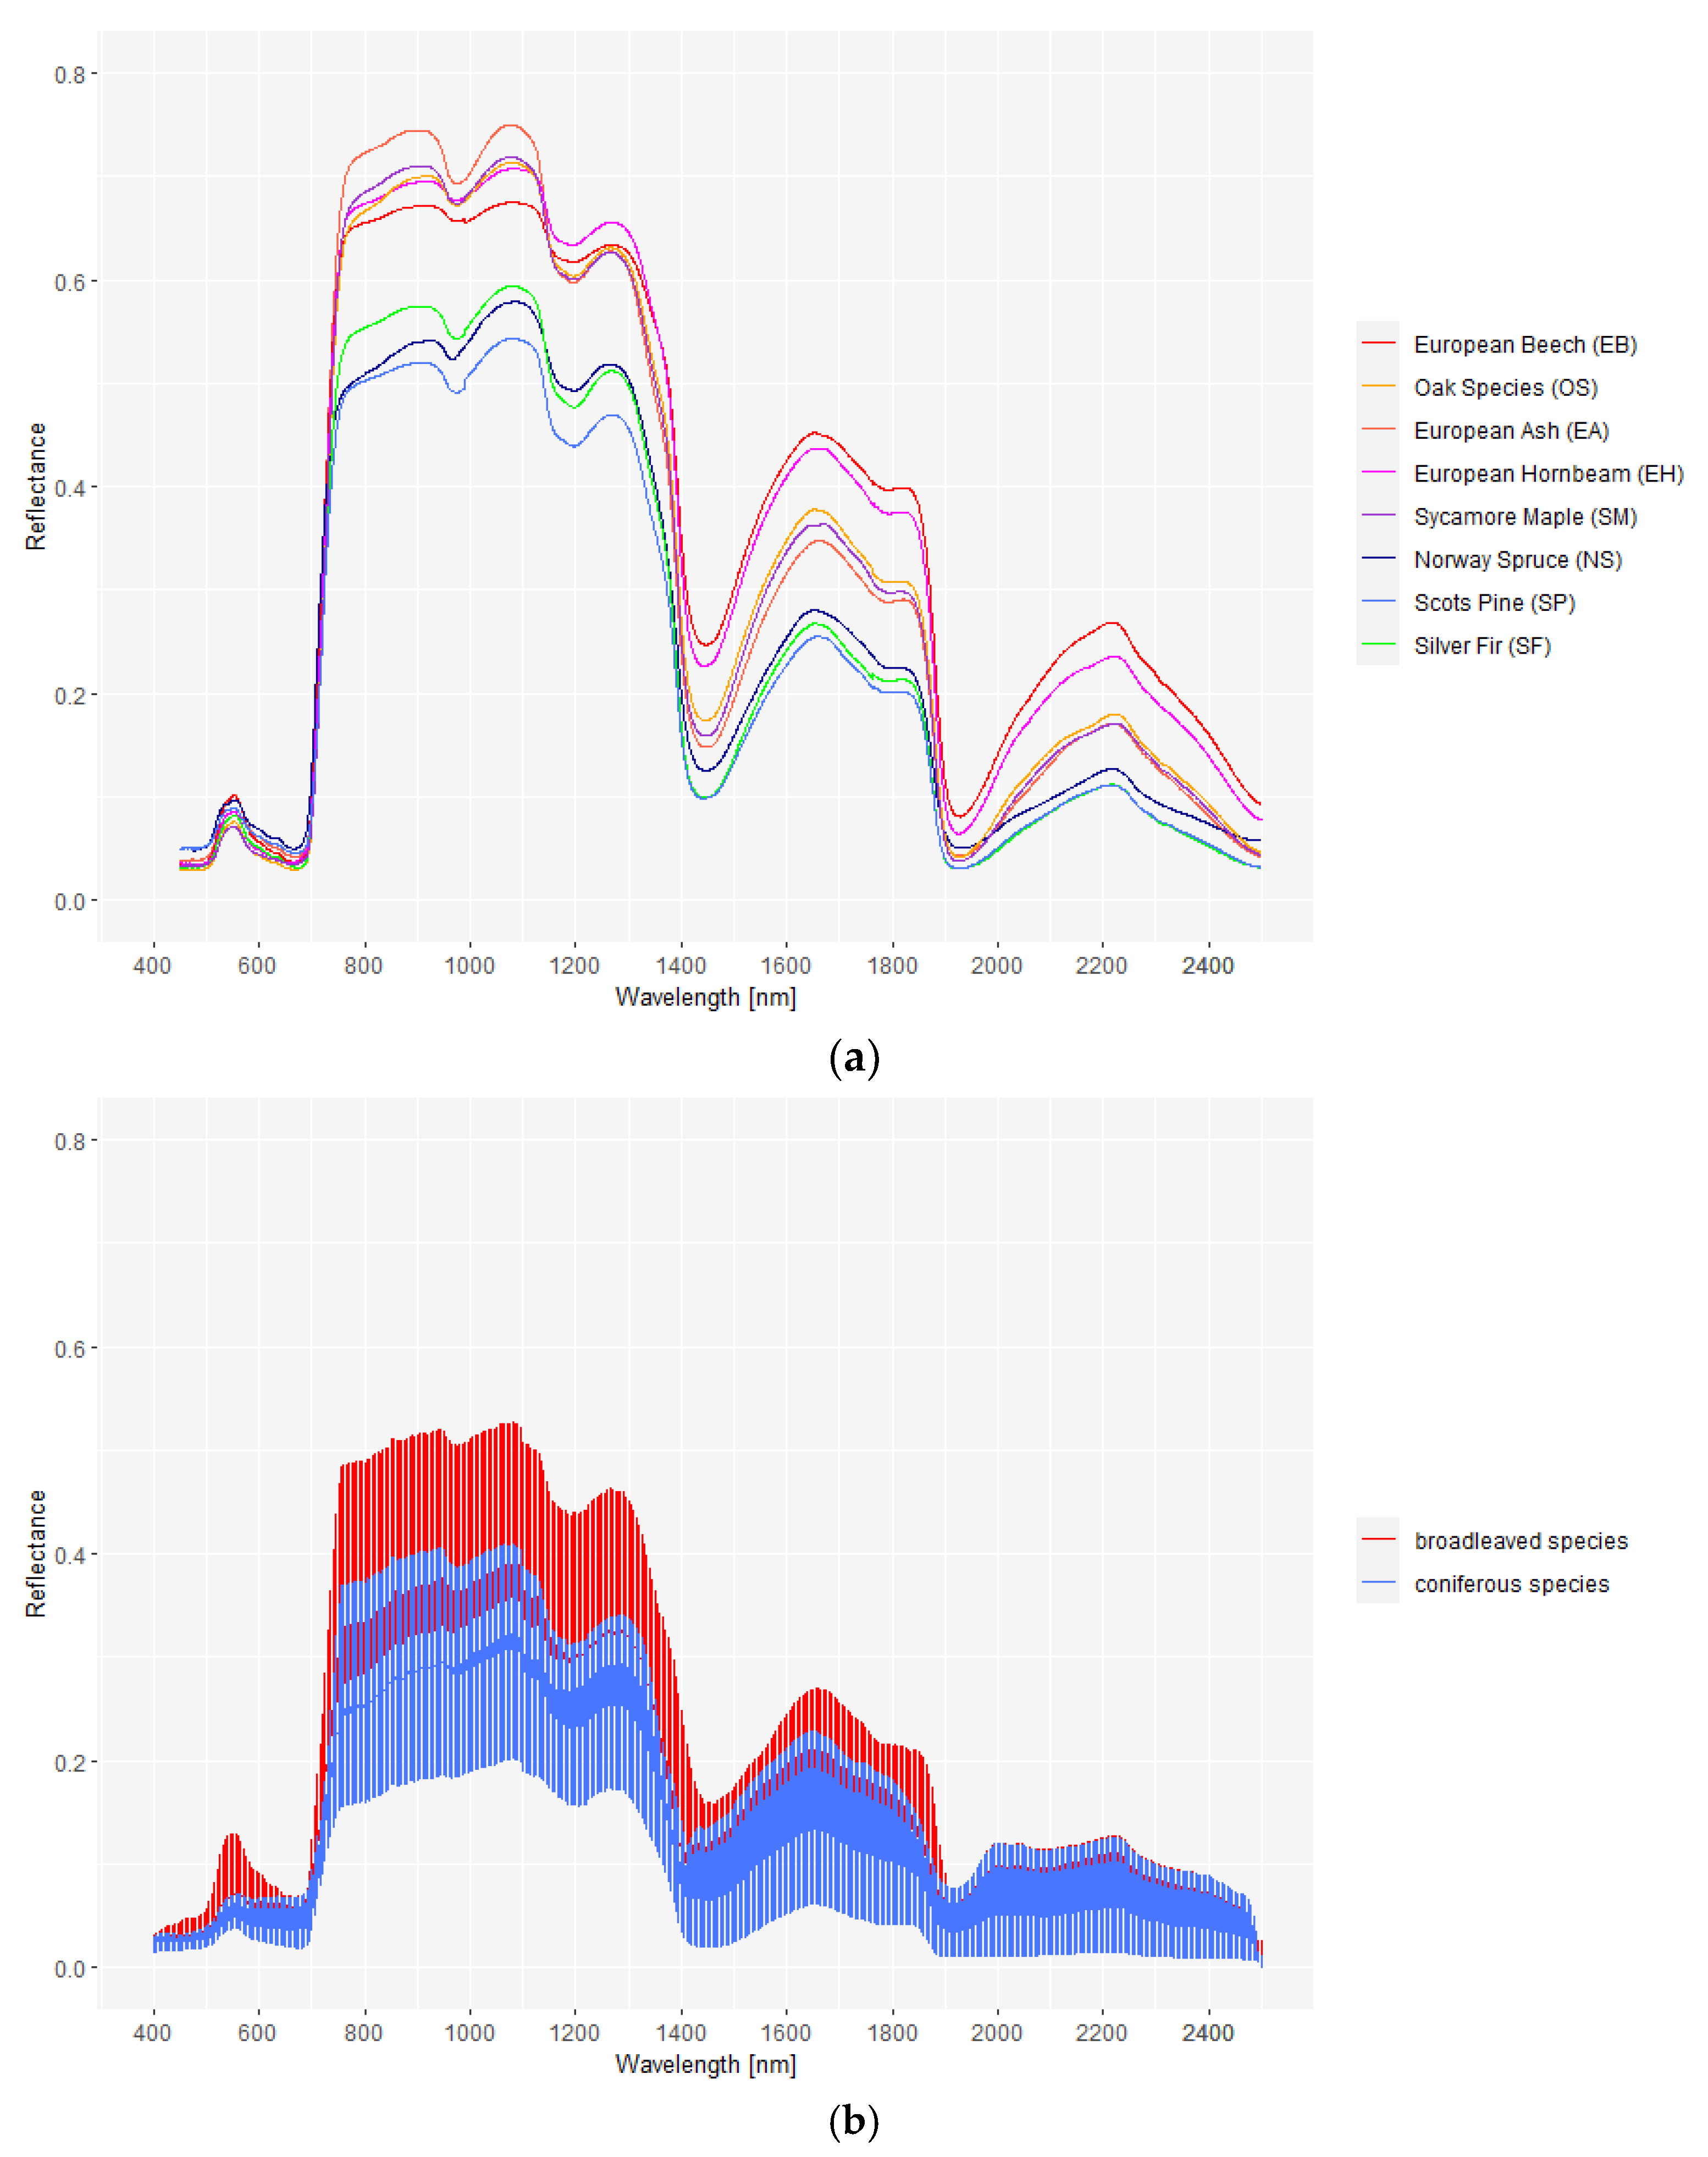
This points to an overwhelming impact of leaf optical properties, and in particular, leaf anatomy (Figure 2a) [29,30]. Indeed, both empirical and physically-based leaf optical properties models have demonstrated that the difference in leaf anatomy is the main trait that makes needle leaves much less reflective in the NIR compared to leaves from broadleaved trees [31]. All other conditions being identical, simulations using the forest radiative transfer model INFORM [32,33] confirm this (Figure 2b).
Within the two broad tree species groups (broadleaved/coniferous trees), some species can be distinguished relatively well, while others are more difficult to separate [26,34,35]. For example, some species are usually sufficiently separable in the VIS-NIR-SWIR optical domain, while others are spectrally too similar to be distinguished. This overlap in spectral signatures persists throughout the growing season and points to three main effects:
- Between several tree species, often only very small inter-class differences in leaf biochemical and structural properties exist, leading to very similar leaf optical properties (Figure 2a).
- Most species exhibit a relatively large intra-class variability of canopy properties [34,36]. Intra-class variability exist, for example in terms of differences in tree age, stem density, growth form, and crown closure [37,38,39]. Additional intra-class variability results from changes in weather and growth conditions.
- Even for relatively closed forests, the canopy reflectance is heavily impacted by the optical properties of the forest floor, specifically, the type and amount of understory vegetation [38,40,41]. This induces a large range of “background noise”, thus “widening” the spectral signature recorded by the sensor [42,43,44].
Figure 2.
Impact of leaf/needle optical properties on canopy signatures. (a) Mean spectral signatures of leaves/needles from seven Central European tree species measured in the laboratory with an ASD FieldSpec Pro FR spectrometer following the method presented in Einzmann et al. [45]. Species and colors are identical to Figure 1. (b) Simulations of forest canopy reflectance using the INFORM radiative transfer model. For the simulations (n = 5000), leaf optical properties typical for broadleaved species (red) and coniferous species (blue) were used. Other INFORM parameters were randomly selected and kept identical for the two classes, so that solely differences resulting from the leaf optical properties are shown.
Together, it is not surprising that the sometimes very strong and persistent overlap of spectral-temporal signatures between two or more tree species cannot be untangled—independent of which classifier is used [26,46,47,48].
With respect to the sole use of spectral vegetation indices (VI), the situation is even worse, as spectral indices are only simple (equivariant) arithmetic combinations of 2–3 spectral bands (e.g., with an infinite number of band combinations leading to the same VI value). VIs should, therefore, never replace the spectral signatures, but should instead be added to the predictive feature set, for example to provide some “correction” for undesired factors of spectral variation [23].
In the same line of thinking, it is also unsurprising that accuracies obtained from a limited band setting are usually not able to perform as well as using the full spectral resolution [49]. Similar observations have been reported (Figure 3) when comparing single-frequency SAR data in two polarizations to multi-spectral optical sensors [22].
As expected, spectral observations over multiple time steps facilitate species identification. As we will show later, multi-temporal (optical) time series inherently capture and analyze the temporal (co)variation of the canopies’ structural characteristics and biochemical composition. Analyzing such time series offer, therefore, strong improvements compared to single date analyses. Similar findings were reported in other studies [50,51,52,53].
As active sensor modalities, such as LiDAR and SAR, react primarily to canopy properties not/less strongly impacting the spectral signatures recorded by optical sensors (e.g., structural canopy properties other than LAI), the combination of optical data with the active devices is generally beneficial. Similar findings have been reported in [27,54]. However, the improvement is usually not overly strong, as the active data is often very noisy (in particular, SAR) and/or focusing on a single vegetation trait (e.g., 3D structure/clumping in the case of LiDAR). For the same reason, neither SAR nor LiDAR alone were able to achieve the accuracies which can be achieved with optical (time series) data, confirming the conclusion of the review paper by Fassnacht et al. [46]. The research studies in our special issue also confirmed the importance of representative and comprehensive field samples [46]. When reference data are collected, foremost attention should be put on samples near the decision boundaries in the respective feature space, as pointed out by Foody et al. [55]. Indeed, the “difficult cases” matter most when dividing the feature space into thematic classes [56]. Compared to overly cleaned and curated data for training and evaluation, these data generate more reliable error statistics. Several studies [47,50,57] highlighted the fact that auxiliary variables such as altitude can help to improve the performance of tree species classification models. Consequently, a representative distribution of reference data for each class has to be ensured. Unlike spectral measurements, variables such as altitude are not a true explanatory variable for actual occurrence of a species. A comprehensive summary of the main findings and conclusions of our special issue, major limits, and possible amendments, is provided in Figure 4.
4. A More Fundamental View Going Forward: Use of Physically-Based Approaches
The studies published in this special issue have in common the proposal of data-driven machine-learning based approaches, in which the classification is performed in the spectral-temporal feature space (e.g., based on spectral signatures and other spectral/temporal metrics). We argue that this is possibly contributing to the reported difficulties, as spectral-temporal features are not easily transferable across space and time, depend on observation conditions, and are not necessarily species-inherent. As an alternative approach, we propose instead, working in the feature space of biophysical variables retrieved using appropriate forest RTMs. In our opinion, this has not yet been investigated enough.
To illustrate our statement, let us assume deca-metric, multi/hyper-spectral optical EO data such as Landsat, S2, or EnMAP, where individual trees are not resolved. For simplicity, we also ignore possible atmospheric perturbations and calibration issues in the EO data. In this case, and under a more fundamental physical view, spectral signatures of trees under a given illumination/observation geometry and at a given acquisition date (t), are the expression of the biochemical composition and structural settings of the trees within the IFOV of the sensor (see also discussion of Baret & Buis [58] with respect to agricultural crops). If we denote the biochemical properties of the trees as Θbio, the canopy structural properties as Θstruc, background properties as Θbg, and observation and illumination geometry as Θview, this can be expressed as:
R(λ,t) = f(Θbiot, Θstruct, Θbgt, Θviewt).
Important biochemical and structural variables are listed in Table 2. Note that the tree-related variables themselves (short: Θtree = Θbio + Θstruc), and their temporal (co)evolution within and across seasons, are the result of the growth and development of the respective genotype under the historical/current environmental setting and management practices (time-dependent notation here omitted for sake of clarity):
Θtree = f(gene, environment).
In this context, it is also worth noting that the “growth form or habitus”, i.e., the phenotypical expression of the genotype leading to the trees we literally see with our eyes (Figure 5 right—examples of bark, branching, leaf form, growth form) is fundamentally different compared to EO measurements. When we observe tree species with our eyes, we tend to characterize and differentiate them based on leaf form, fruits and reproductive organs, bark structure, habitus, tree growth form etc. (Equation (3)). The spectral signatures of trees are predominantly influenced by factors other than the mentioned plant traits (Equation (2)), unless specifically examining high-resolution data from centimeter-level UAV and LiDAR analysis.
Human discernible plant traits (pheno-type) = f(gene, environment)

Table 2.
Important biochemical and structural properties of trees. These biochemical and structural variables determine the spectral signature of a tree canopy. In bold, the spectrally most important variables. Note that understory/background variables are not included here.
Table 2.
Important biochemical and structural properties of trees. These biochemical and structural variables determine the spectral signature of a tree canopy. In bold, the spectrally most important variables. Note that understory/background variables are not included here.
| Biochemical Properties | Structural Properties | ||
|---|---|---|---|
| Micro-Scale | Macro-Scale | Meso-Scale | |
| Chlorophyll A + B content | Leaf structure | Leaf Area Index | Crown size |
| Leaf water thickness | Leaf hairing | Leaf angle distribution | Gap size distribution/gap fraction |
| Protein content | Waxing | Leaf clumping/ arrangement | Crown shape |
| Dry matter content/specific leaf area | Tree branching | Stem density | |
| Other photosynthetic pigment content | Leaf size | ||
| Non-photosynthetic pigment content | Leaf form | ||
Using remote sensing data at deca-metric spatial resolution, we thus capture a completely different expression of the tree’s geno-type, compared to computer/human vision and centi-metric resolution UAV/LiDAR systems (Table 3).
From the above it is also evident that the link of tree species to the biochemical and structural properties (Θtree) is inherently closer than the link to direct use of spectral signatures, as the latter relation is shaped by external factors (Θbg and Θview) and subjected to a strong time factor that limits generalization over large geographic regions. In botany and human vision, on the other hand, one recognizes (more or less) permanent and species-inherent properties (Table 4) that allow a trained observer to correctly classify many different tree species as the observed traits are relatively invariant. Unfortunately, the remote sensing literature is very short on attempts to retrieve the species-inherent co-evolution of biochemical and structural properties (Θtree), even though this would potentially lead to a more generalizable pattern.
In our opinion, this idea amounts to more than a simple hypothesis. Indeed, the fact that simple classifications of time series of spectral data are successful (at least to some degree), provides strong evidence that such species-inherent structural/biochemical pattern do indeed exist.
The relationships between the fundamental properties and the spectral signatures have already been formalized and modeled using various kinds of RTMs (e.g., [31,59]). Existing formalizations are mainly based on analytical expressions (e.g., SCOPE [60]), 3D geometric-optical models (e.g., FLIM [61]), and mixtures of both (e.g., INFORM [32]; PARAS [62,63]). In addition, ray-tracing models such as DART track the path of individual photons as they interact with the canopy elements, where the canopy is discretized into voxels with specific optical properties [64]. RTMs can be readily inverted using a panoply of methods such as look-up-tables, numerical optimization, predictive equations, Bayesian approaches and neural networks (e.g., [58,62,65]).
Existing radiative transfer models have definitively ample room for improvement, as highlighted by systematic but irregular evaluations against each other, and some natural and synthetic benchmark datasets (e.g., RAMI [31]). However, with some effort the models can certainly be improved so that the biophysical and biochemical traits can be derived with sufficient accuracy, using remotely sensed data. This seems to be a more plausible path towards robust and generalized models, compared to the current data-driven approaches. Indeed, as trees are living organisms embedded in their respective biotic/abiotic environment, the spectral signatures will change over the course of the season and evolve as trees age, as both the biochemical composition and the structural setting change/evolve. Hence, instead of “viewing” the classification task in the wavelength and reflectance space, (Figure 6a) one should, in our opinion, view species “living” in the space of Θbio and Θstruc (Figure 6b).
Hence, from a physics-based deduction, as well as from an empirical inference, we strongly believe that this under-researched area needs to be exploited in order to make EO data analysis more generalizable across large geographic regions and more transferable across time and space. This is needed not only for the classical applications of remote sensing and biodiversity research, but also for more efficient implementations of financial instruments such as nature-based solutions (NBS). The latter rely heavily on robust and cost-efficient monitoring-reporting-verification (MRV) for supporting the development of (voluntary) carbon markets, which progressively integrate attempts to protect/enhance biodiversity.
Author Contributions
The entire paper development (conceptualization, visualization and writing) was done by both authors together, M.I. and C.A. All authors have read and agreed to the published version of the manuscript.
Funding
This research received no external funding.
Data Availability Statement
Not applicable.
Acknowledgments
The authors thank Katja Berger for valuable inputs.
Conflicts of Interest
The authors declare no conflict of interest.
References
- IPBES Global Assessment Report on Biodiversity and Ecosystem Services of the Intergovernmental Science-Policy Platform on Biodiversity and Ecosystem Services; IPBES Secretariat: Bonn, Germany, 2019.
- UNEP UN Biodiversity Conference (COP 15). Available online: http://www.unep.org/un-biodiversity-conference-cop-15 (accessed on 26 March 2023).
- Pettorelli, N.; Safi, K.; Turner, W. Satellite Remote Sensing, Biodiversity Research and Conservation of the Future. Phil. Trans. R Soc. B 2014, 369, 20130190. [Google Scholar] [CrossRef] [PubMed]
- Skidmore, A.K.; Pettorelli, N.; Coops, N.C.; Geller, G.N.; Hansen, M.; Lucas, R.; Mücher, C.A.; O’Connor, B.; Paganini, M.; Pereira, H.M.; et al. Agree on Biodiversity Metrics to Track from Space. Nature 2015, 523, 403–405. [Google Scholar] [CrossRef] [PubMed] [Green Version]
- Dash, J.; Ogutu, B.O. Recent Advances in Space-Borne Optical Remote Sensing Systems for Monitoring Global Terrestrial Ecosystems. Prog. Phys. Geogr. Earth Environ. 2016, 40, 322–351. [Google Scholar] [CrossRef]
- Pettorelli, N.; Wegmann, M.; Skidmore, A.; Mücher, S.; Dawson, T.P.; Fernandez, M.; Lucas, R.; Schaepman, M.E.; Wang, T.; O’Connor, B.; et al. Framing the Concept of Satellite Remote Sensing Essential Biodiversity Variables: Challenges and Future Directions. Remote Sens. Ecol. Conserv. 2016, 2, 122–131. [Google Scholar] [CrossRef]
- Vihervaara, P.; Auvinen, A.-P.; Mononen, L.; Törmä, M.; Ahlroth, P.; Anttila, S.; Böttcher, K.; Forsius, M.; Heino, J.; Heliölä, J.; et al. How Essential Biodiversity Variables and Remote Sensing Can Help National Biodiversity Monitoring. Glob. Ecol. Conserv. 2017, 10, 43–59. [Google Scholar] [CrossRef]
- Michałowska, M.; Rapiński, J. A Review of Tree Species Classification Based on Airborne LiDAR Data and Applied Classifiers. Remote Sens. 2021, 13, 353. [Google Scholar] [CrossRef]
- Lu, T.; Brandt, M.; Tong, X.; Hiernaux, P.; Leroux, L.; Ndao, B.; Fensholt, R. Mapping the Abundance of Multipurpose Agroforestry Faidherbia Albida Trees in Senegal. Remote Sens. 2022, 14, 662. [Google Scholar] [CrossRef]
- Pearse, G.D.; Watt, M.S.; Soewarto, J.; Tan, A.Y.S. Deep Learning and Phenology Enhance Large-Scale Tree Species Classification in Aerial Imagery during a Biosecurity Response. Remote Sens. 2021, 13, 1789. [Google Scholar] [CrossRef]
- Tian, L.; Fu, W. Bi-Temporal Analysis of Spatial Changes of Boreal Forest Cover and Species in Siberia for the Years 1985 and 2015. Remote Sens. 2020, 12, 4116. [Google Scholar] [CrossRef]
- Krzystek, P.; Serebryanyk, A.; Schnörr, C.; Červenka, J.; Heurich, M. Large-Scale Mapping of Tree Species and Dead Trees in Šumava National Park and Bavarian Forest National Park Using Lidar and Multispectral Imagery. Remote Sens. 2020, 12, 661. [Google Scholar] [CrossRef] [Green Version]
- Dong, C.; Zhao, G.; Meng, Y.; Li, B.; Peng, B. The Effect of Topographic Correction on Forest Tree Species Classification Accuracy. Remote Sens. 2020, 12, 787. [Google Scholar] [CrossRef] [Green Version]
- Egli, S.; Höpke, M. CNN-Based Tree Species Classification Using High Resolution RGB Image Data from Automated UAV Observations. Remote Sens. 2020, 12, 3892. [Google Scholar] [CrossRef]
- Xu, K.; Zhang, Z.; Yu, W.; Zhao, P.; Yue, J.; Deng, Y.; Geng, J. How Spatial Resolution Affects Forest Phenology and Tree-Species Classification Based on Satellite and Up-Scaled Time-Series Images. Remote Sens. 2021, 13, 2716. [Google Scholar] [CrossRef]
- Yan, S.; Jing, L.; Wang, H. A New Individual Tree Species Recognition Method Based on a Convolutional Neural Network and High-Spatial Resolution Remote Sensing Imagery. Remote Sens. 2021, 13, 479. [Google Scholar] [CrossRef]
- Kovačević, J.; Cvijetinović, Ž.; Lakušić, D.; Kuzmanović, N.; Šinžar-Sekulić, J.; Mitrović, M.; Stančić, N.; Brodić, N.; Mihajlović, D. Spatio-Temporal Classification Framework for Mapping Woody Vegetation from Multi-Temporal Sentinel-2 Imagery. Remote Sens. 2020, 12, 2845. [Google Scholar] [CrossRef]
- Takahashi Miyoshi, G.; Imai, N.N.; Garcia Tommaselli, A.M.; Antunes de Moraes, M.V.; Honkavaara, E. Evaluation of Hyperspectral Multitemporal Information to Improve Tree Species Identification in the Highly Diverse Atlantic Forest. Remote Sens. 2020, 12, 244. [Google Scholar] [CrossRef] [Green Version]
- Jackson, C.M.; Adam, E. Machine Learning Classification of Endangered Tree Species in a Tropical Submontane Forest Using WorldView-2 Multispectral Satellite Imagery and Imbalanced Dataset. Remote Sens. 2021, 13, 4970. [Google Scholar] [CrossRef]
- Varin, M.; Chalghaf, B.; Joanisse, G. Object-Based Approach Using Very High Spatial Resolution 16-Band WorldView-3 and LiDAR Data for Tree Species Classification in a Broadleaf Forest in Quebec, Canada. Remote Sens. 2020, 12, 3092. [Google Scholar] [CrossRef]
- Wan, H.; Tang, Y.; Jing, L.; Li, H.; Qiu, F.; Wu, W. Tree Species Classification of Forest Stands Using Multisource Remote Sensing Data. Remote Sens. 2021, 13, 144. [Google Scholar] [CrossRef]
- Lechner, M.; Dostálová, A.; Hollaus, M.; Atzberger, C.; Immitzer, M. Combination of Sentinel-1 and Sentinel-2 Data for Tree Species Classification in a Central European Biosphere Reserve. Remote Sens. 2022, 14, 2687. [Google Scholar] [CrossRef]
- Immitzer, M.; Neuwirth, M.; Böck, S.; Brenner, H.; Vuolo, F.; Atzberger, C. Optimal Input Features for Tree Species Classification in Central Europe Based on Multi-Temporal Sentinel-2 Data. Remote Sens. 2019, 11, 2599. [Google Scholar] [CrossRef] [Green Version]
- Karasiak, N.; Dejoux, J.-F.; Fauvel, M.; Willm, J.; Monteil, C.; Sheeren, D. Statistical Stability and Spatial Instability in Mapping Forest Tree Species by Comparing 9 Years of Satellite Image Time Series. Remote Sens. 2019, 11, 2512. [Google Scholar] [CrossRef] [Green Version]
- Chaurasia, A.N.; Dave, M.G.; Parmar, R.M.; Bhattacharya, B.; Marpu, P.R.; Singh, A.; Krishnayya, N.S.R. Inferring Species Diversity and Variability over Climatic Gradient with Spectral Diversity Metrics. Remote Sens. 2020, 12, 2130. [Google Scholar] [CrossRef]
- Immitzer, M.; Atzberger, C.; Koukal, T. Tree Species Classification with Random Forest Using Very High Spatial Resolution 8-Band WorldView-2 Satellite Data. Remote Sens. 2012, 4, 2661–2693. [Google Scholar] [CrossRef] [Green Version]
- Waser, L.T.; Rüetschi, M.; Psomas, A.; Small, D.; Rehush, N. Mapping Dominant Leaf Type Based on Combined Sentinel-1/-2 Data—Challenges for Mountainous Countries. ISPRS J. Photogramm. Remote Sens. 2021, 180, 209–226. [Google Scholar] [CrossRef]
- Maschler, J.; Atzberger, C.; Immitzer, M. Individual Tree Crown Segmentation and Classification of 13 Tree Species Using Airborne Hyperspectral Data. Remote Sens. 2018, 10, 1218. [Google Scholar] [CrossRef] [Green Version]
- Lukeš, P.; Stenberg, P.; Rautiainen, M.; Mõttus, M.; Vanhatalo, K.M. Optical Properties of Leaves and Needles for Boreal Tree Species in Europe. Remote Sens. Lett. 2013, 4, 667–676. [Google Scholar] [CrossRef]
- Hosgood, B.; Jacquemoud, S.; Andreoli, G.; Verdebout, J.; Pedrini, G.; Schmuck, G. Leaf Optical Properties Experiment 93 (LOPEX93); Report EUR 16095 EN; European Commission Joint Research Center: Brussels, Belgium, 1994; pp. 1–46. [Google Scholar]
- Widlowski, J.-L.; Mio, C.; Disney, M.; Adams, J.; Andredakis, I.; Atzberger, C.; Brennan, J.; Busetto, L.; Chelle, M.; Ceccherini, G.; et al. The Fourth Phase of the Radiative Transfer Model Intercomparison (RAMI) Exercise: Actual Canopy Scenarios and Conformity Testing. Remote Sens. Environ. 2015, 169, 418–437. [Google Scholar] [CrossRef]
- Atzberger, C. Development of an Invertible Forest Reflectance Model: The INFOR-Model. Decade Trans-Eur. Remote Sens. Coop. 2000, 14, 39–44. [Google Scholar]
- Schlerf, M.; Atzberger, C. Inversion of a Forest Reflectance Model to Estimate Structural Canopy Variables from Hyperspectral Remote Sensing Data. Remote Sens. Environ. 2006, 100, 281–294. [Google Scholar] [CrossRef]
- Modzelewska, A.; Kamińska, A.; Fassnacht, F.E.; Stereńczak, K. Multitemporal Hyperspectral Tree Species Classification in the Białowieża Forest World Heritage Site. For. Int. J. For. Res. 2021, 94, 464–476. [Google Scholar] [CrossRef]
- Immitzer, M.; Vuolo, F.; Atzberger, C. First Experience with Sentinel-2 Data for Crop and Tree Species Classifications in Central Europe. Remote Sens. 2016, 8, 166. [Google Scholar] [CrossRef]
- Hovi, A.; Raitio, P.; Rautiainen, M. A Spectral Analysis of 25 Boreal Tree Species. Silva Fenn. 2017, 51, 7753. [Google Scholar] [CrossRef] [Green Version]
- Leckie, D.G.; Walsworth, N.; Gougeon, F.A. Identifying Tree Crown Delineation Shapes and Need for Remediation on High Resolution Imagery Using an Evidence Based Approach. ISPRS J. Photogramm. Remote Sens. 2016, 114, 206–227. [Google Scholar] [CrossRef]
- Rautiainen, M.; Lukeš, P.; Homolová, L.; Hovi, A.; Pisek, J.; Mõttus, M. Spectral Properties of Coniferous Forests: A Review of In Situ and Laboratory Measurements. Remote Sens. 2018, 10, 207. [Google Scholar] [CrossRef] [Green Version]
- Rautiainen, M.; Stenberg, P.; Nilson, T.; Kuusk, A. The Effect of Crown Shape on the Reflectance of Coniferous Stands. Remote Sens. Environ. 2004, 89, 41–52. [Google Scholar] [CrossRef]
- Jensen, R.R.; Hardin, P.J.; Hardin, A.J. Classification of Urban Tree Species Using Hyperspectral Imagery. Geocarto Int. 2012, 27, 443–458. [Google Scholar] [CrossRef]
- Shang, X.; Chisholm, L.A. Classification of Australian Native Forest Species Using Hyperspectral Remote Sensing and Machine-Learning Classification Algorithms. IEEE J. Sel. Top. Appl. Earth Obs. Remote Sens. 2014, 7, 2481–2489. [Google Scholar] [CrossRef]
- Gao, L.; Darvishzadeh, R.; Somers, B.; Johnson, B.A.; Wang, Y.; Verrelst, J.; Wang, X.; Atzberger, C. Hyperspectral Response of Agronomic Variables to Background Optical Variability: Results of a Numerical Experiment. Agric. For. Meteorol. 2022, 326, 109178. [Google Scholar] [CrossRef]
- Rautiainen, M.; Mõttus, M.; Heiskanen, J.; Akujärvi, A.; Majasalmi, T.; Stenberg, P. Seasonal Reflectance Dynamics of Common Understory Types in a Northern European Boreal Forest. Remote Sens. Environ. 2011, 115, 3020–3028. [Google Scholar] [CrossRef]
- Eriksson, H.M.; Eklundh, L.; Kuusk, A.; Nilson, T. Impact of Understory Vegetation on Forest Canopy Reflectance and Remotely Sensed LAI Estimates. Remote Sens. Environ. 2006, 103, 408–418. [Google Scholar] [CrossRef]
- Einzmann, K.; Ng, W.; Immitzer, M.; Bachmann, M.; Pinnel, N.; Atzberger, C. Method Analysis for Collecting and Processing In-Situ Hyperspectral Needle Reflectance Data for Monitoring Norway Spruce. Photogramm.-Fernerkund.-Geoinf. 2014, 2014, 351–367. [Google Scholar] [CrossRef]
- Fassnacht, F.E.; Latifi, H.; Stereńczak, K.; Modzelewska, A.; Lefsky, M.; Waser, L.T.; Straub, C.; Ghosh, A. Review of Studies on Tree Species Classification from Remotely Sensed Data. Remote Sens. Environ. 2016, 186, 64–87. [Google Scholar] [CrossRef]
- Nasiri, V.; Beloiu, M.; Asghar Darvishsefat, A.; Griess, V.C.; Maftei, C.; Waser, L.T. Mapping Tree Species Composition in a Caspian Temperate Mixed Forest Based on Spectral-Temporal Metrics and Machine Learning. Int. J. Appl. Earth Obs. Geoinf. 2023, 116, 103154. [Google Scholar] [CrossRef]
- Dalponte, M.; Ørka, H.O.; Gobakken, T.; Gianelle, D.; Næsset, E. Tree Species Classification in Boreal Forests with Hyperspectral Data. IEEE Trans. Geosci. Remote Sens. 2013, 51, 2632–2645. [Google Scholar] [CrossRef]
- Ghosh, A.; Fassnacht, F.E.; Joshi, P.K.; Koch, B. A Framework for Mapping Tree Species Combining Hyperspectral and LiDAR Data: Role of Selected Classifiers and Sensor across Three Spatial Scales. Int. J. Appl. Earth Obs. Geoinf. 2014, 26, 49–63. [Google Scholar] [CrossRef]
- Grabska, E.; Hostert, P.; Pflugmacher, D.; Ostapowicz, K. Forest Stand Species Mapping Using the Sentinel-2 Time Series. Remote Sens. 2019, 11, 1197. [Google Scholar] [CrossRef] [Green Version]
- Pflugmacher, D.; Rabe, A.; Peters, M.; Hostert, P. Mapping Pan-European Land Cover Using Landsat Spectral-Temporal Metrics and the European LUCAS Survey. Remote Sens. Environ. 2019, 221, 583–595. [Google Scholar] [CrossRef]
- Xi, Y.; Ren, C.; Tian, Q.; Ren, Y.; Dong, X.; Zhang, Z. Exploitation of Time Series Sentinel-2 Data and Different Machine Learning Algorithms for Detailed Tree Species Classification. IEEE J. Sel. Top. Appl. Earth Obs. Remote Sens. 2021, 14, 7589–7603. [Google Scholar] [CrossRef]
- Hemmerling, J.; Pflugmacher, D.; Hostert, P. Mapping Temperate Forest Tree Species Using Dense Sentinel-2 Time Series. Remote Sens. Environ. 2021, 267, 112743. [Google Scholar] [CrossRef]
- Dalponte, M.; Bruzzone, L.; Gianelle, D. Tree Species Classification in the Southern Alps Based on the Fusion of Very High Geometrical Resolution Multispectral/Hyperspectral Images and LiDAR Data. Remote Sens. Environ. 2012, 123, 258–270. [Google Scholar] [CrossRef]
- Foody, G.M.; Pal, M.; Rocchini, D.; Garzon-Lopez, C.X.; Bastin, L. The Sensitivity of Mapping Methods to Reference Data Quality: Training Supervised Image Classifications with Imperfect Reference Data. ISPRS Int. J. Geo-Inf. 2016, 5, 199. [Google Scholar] [CrossRef] [Green Version]
- Fowler, J.; Waldner, F.; Hochman, Z. All Pixels Are Useful, but Some Are More Useful: Efficient in Situ Data Collection for Crop-Type Mapping Using Sequential Exploration Methods. Int. J. Appl. Earth Obs. Geoinf. 2020, 91, 102114. [Google Scholar] [CrossRef]
- Hościło, A.; Lewandowska, A. Mapping Forest Type and Tree Species on a Regional Scale Using Multi-Temporal Sentinel-2 Data. Remote Sens. 2019, 11, 929. [Google Scholar] [CrossRef] [Green Version]
- Baret, F.; Buis, S. Estimating Canopy Characteristics from Remote Sensing Observations: Review of Methods and Associated Problems. In Advances in Land Remote Sensing; Liang, S., Ed.; Springer: Dordrecht, The Netherlands, 2008; pp. 173–201. ISBN 978-1-4020-6449-4. [Google Scholar]
- Ross, J. The Radiation Regime and Architecture of Plant Stands; Springer Science & Business Media: Berlin/Heidelberg, Germany, 1981; ISBN 978-90-6193-607-7. [Google Scholar]
- Van der Tol, C.; Verhoef, W.; Timmermans, J.; Verhoef, A.; Su, Z. An Integrated Model of Soil-Canopy Spectral Radiances, Photosynthesis, Fluorescence, Temperature and Energy Balance. Biogeosciences 2009, 6, 3109–3129. [Google Scholar] [CrossRef] [Green Version]
- Rosema, A.; Verhoef, W.; Noorbergen, H.; Borgesius, J.J. A New Forest Light Interaction Model in Support of Forest Monitoring. Remote Sens. Environ. 1992, 42, 23–41. [Google Scholar] [CrossRef]
- Schraik, D.; Varvia, P.; Korhonen, L.; Rautiainen, M. Bayesian Inversion of a Forest Reflectance Model Using Sentinel-2 and Landsat 8 Satellite Images. J. Quant. Spectrosc. Radiat. Transf. 2019, 233, 1–12. [Google Scholar] [CrossRef]
- Rautiainen, M. The Spectral Signature of Coniferous Forests: The Role of Stand Structure and Leaf Area Index. Doctroal thesis, University of Helsinki, Helsinki, Finland, 2005. [Google Scholar]
- Gastellu-Etchegorry, J.P.; Martin, E.; Gascon, F. DART: A 3D Model for Simulating Satellite Images and Studying Surface Radiation Budget. Int. J. Remote Sens. 2004, 25, 73–96. [Google Scholar] [CrossRef]
- Kimes, D.S.; Knyazikhin, Y.; Privette, J.L.; Abuelgasim, A.A.; Gao, F. Inversion Methods for Physically-Based Models. Remote Sens. Rev. 2000, 18, 381–439. [Google Scholar] [CrossRef]
Figure 1.
Mean spectral signatures of tree crowns from seven Central European tree species using airborne HySpex imaging spectrometer data. Species with reddish lines are broadleaved species; green and blue lines indicate coniferous species. The data used for this illustration was also used in the work of Maschler et al. [28].
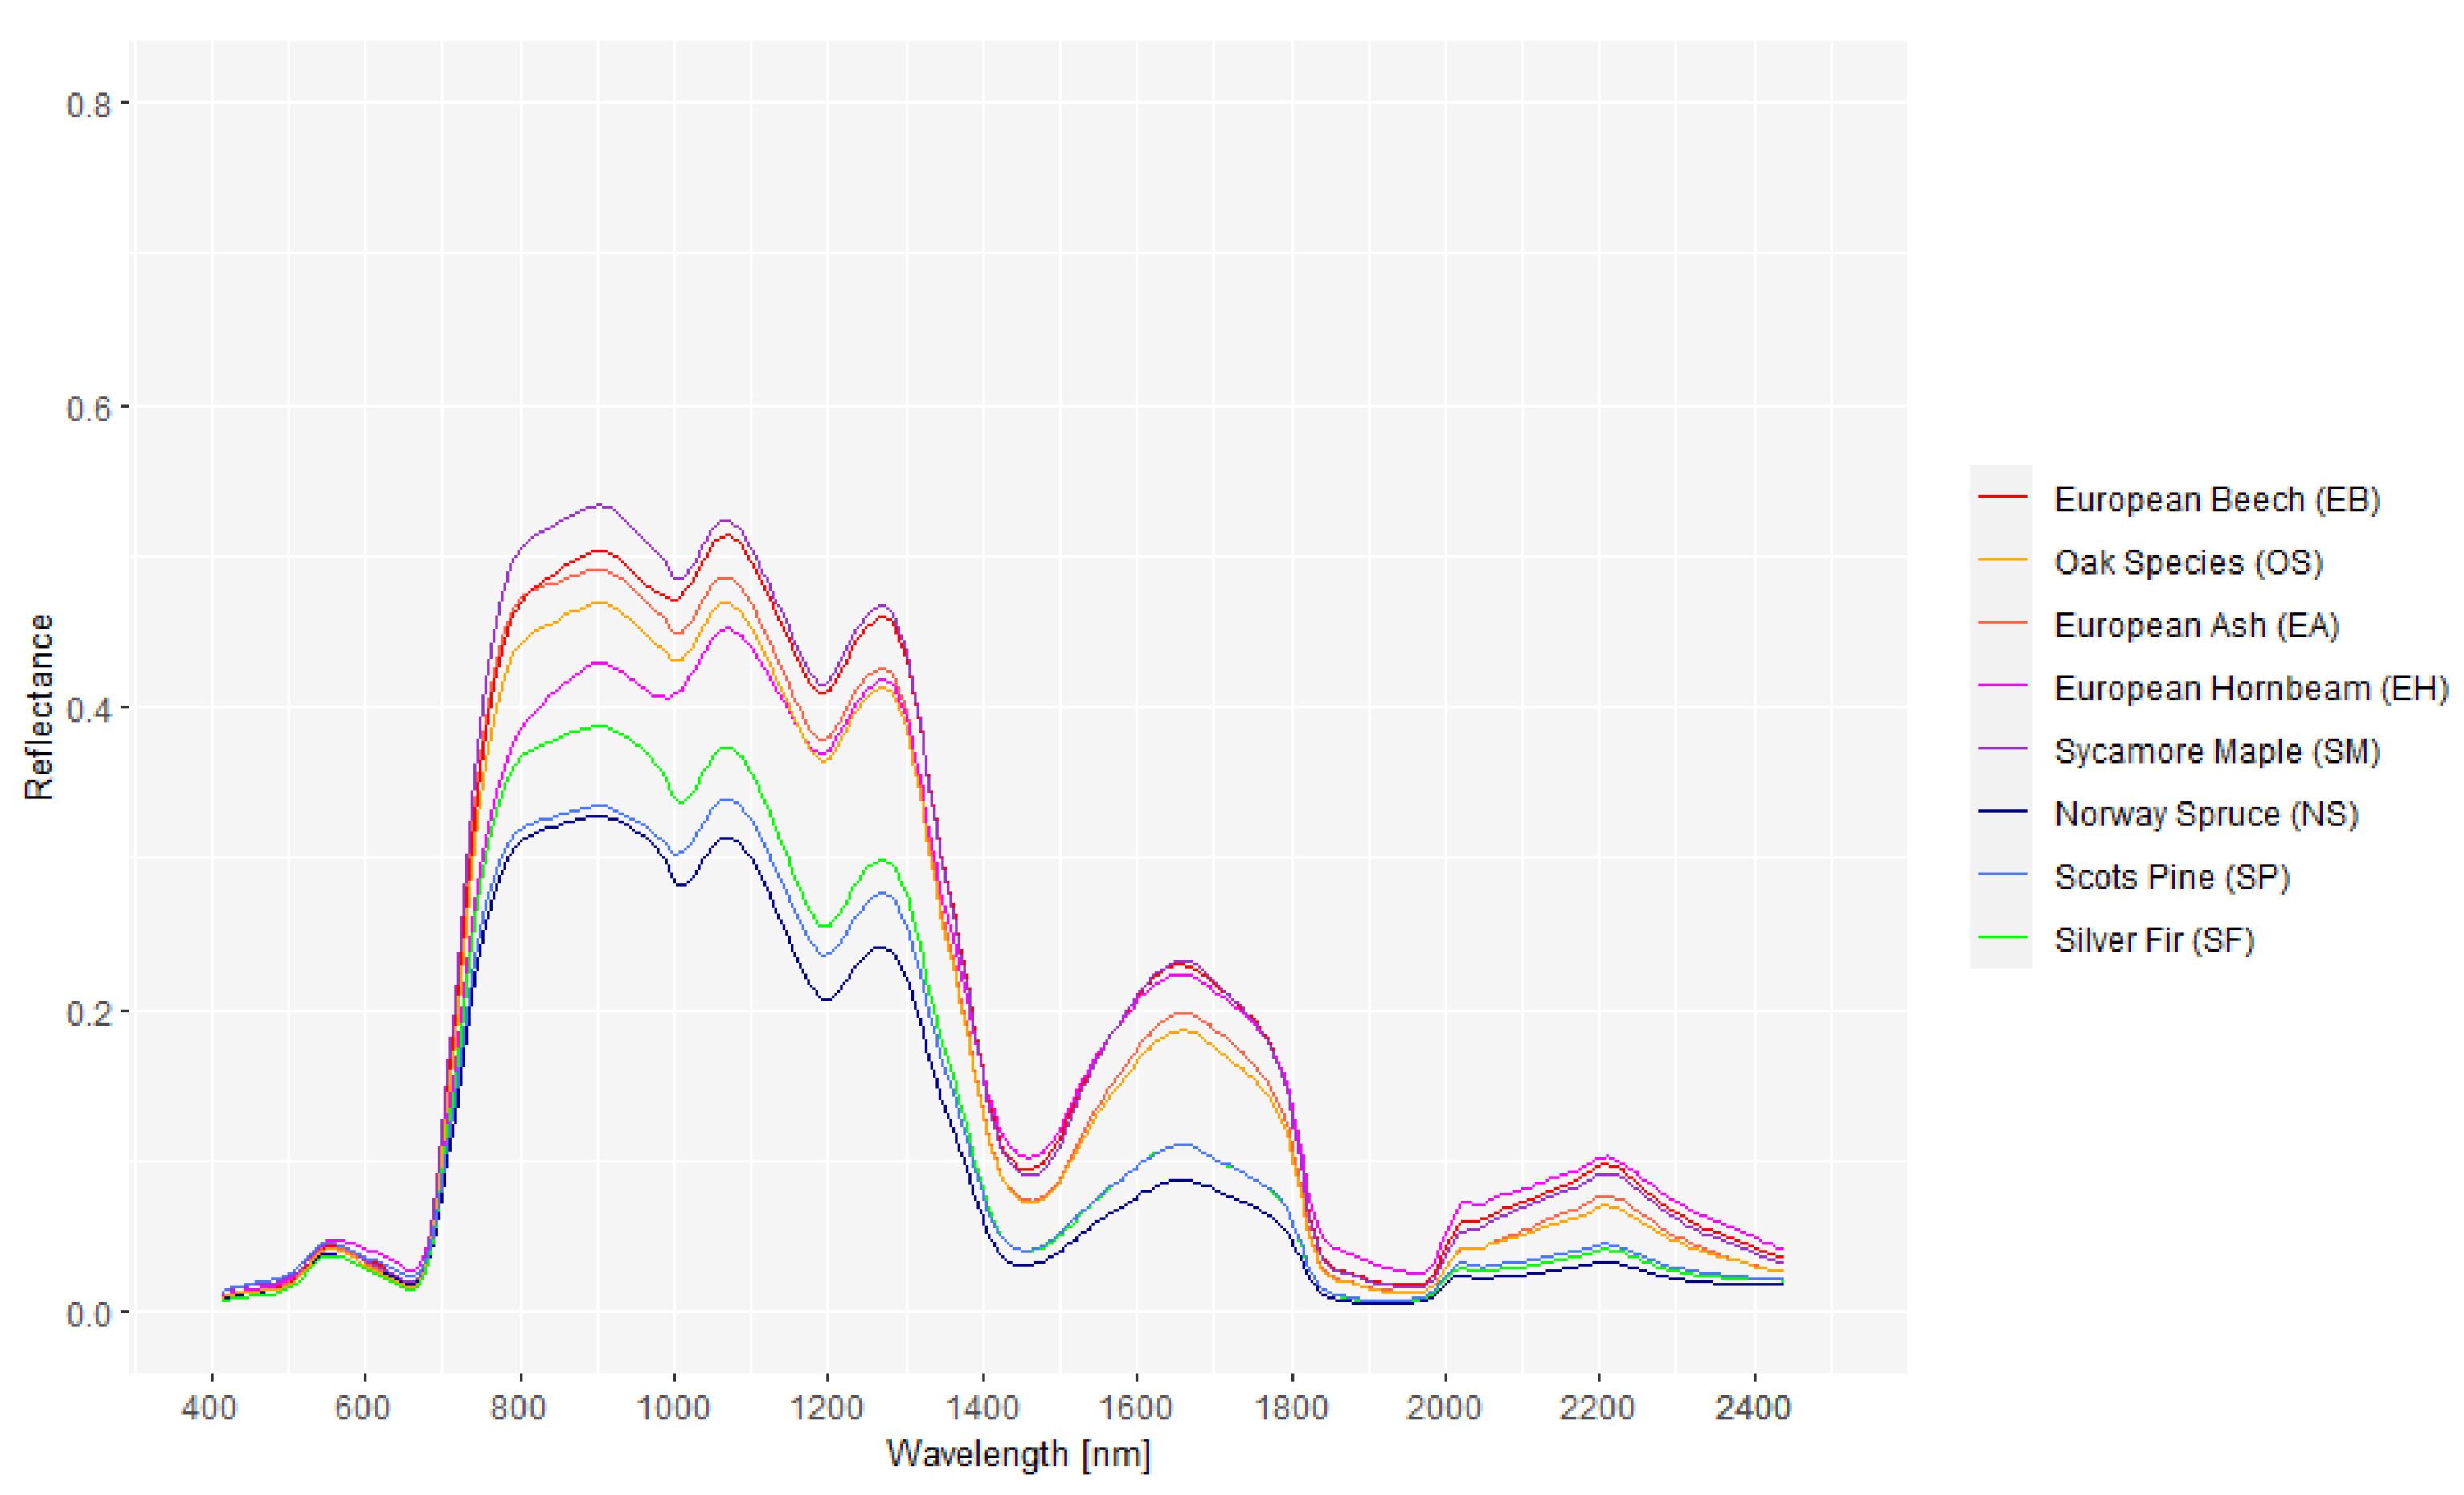
Figure 3.
Overall classification accuracy for 12 tree species based on Sentinel-2 (S2) and Sentinel-1 (S1) data: mono-temporal S2 data, two seasonal selections using the three worst and the three best-performing S2 triples, and all available S2 data—alone and in combination with S1 phenological data (adapted from Lechner et al. [22]).
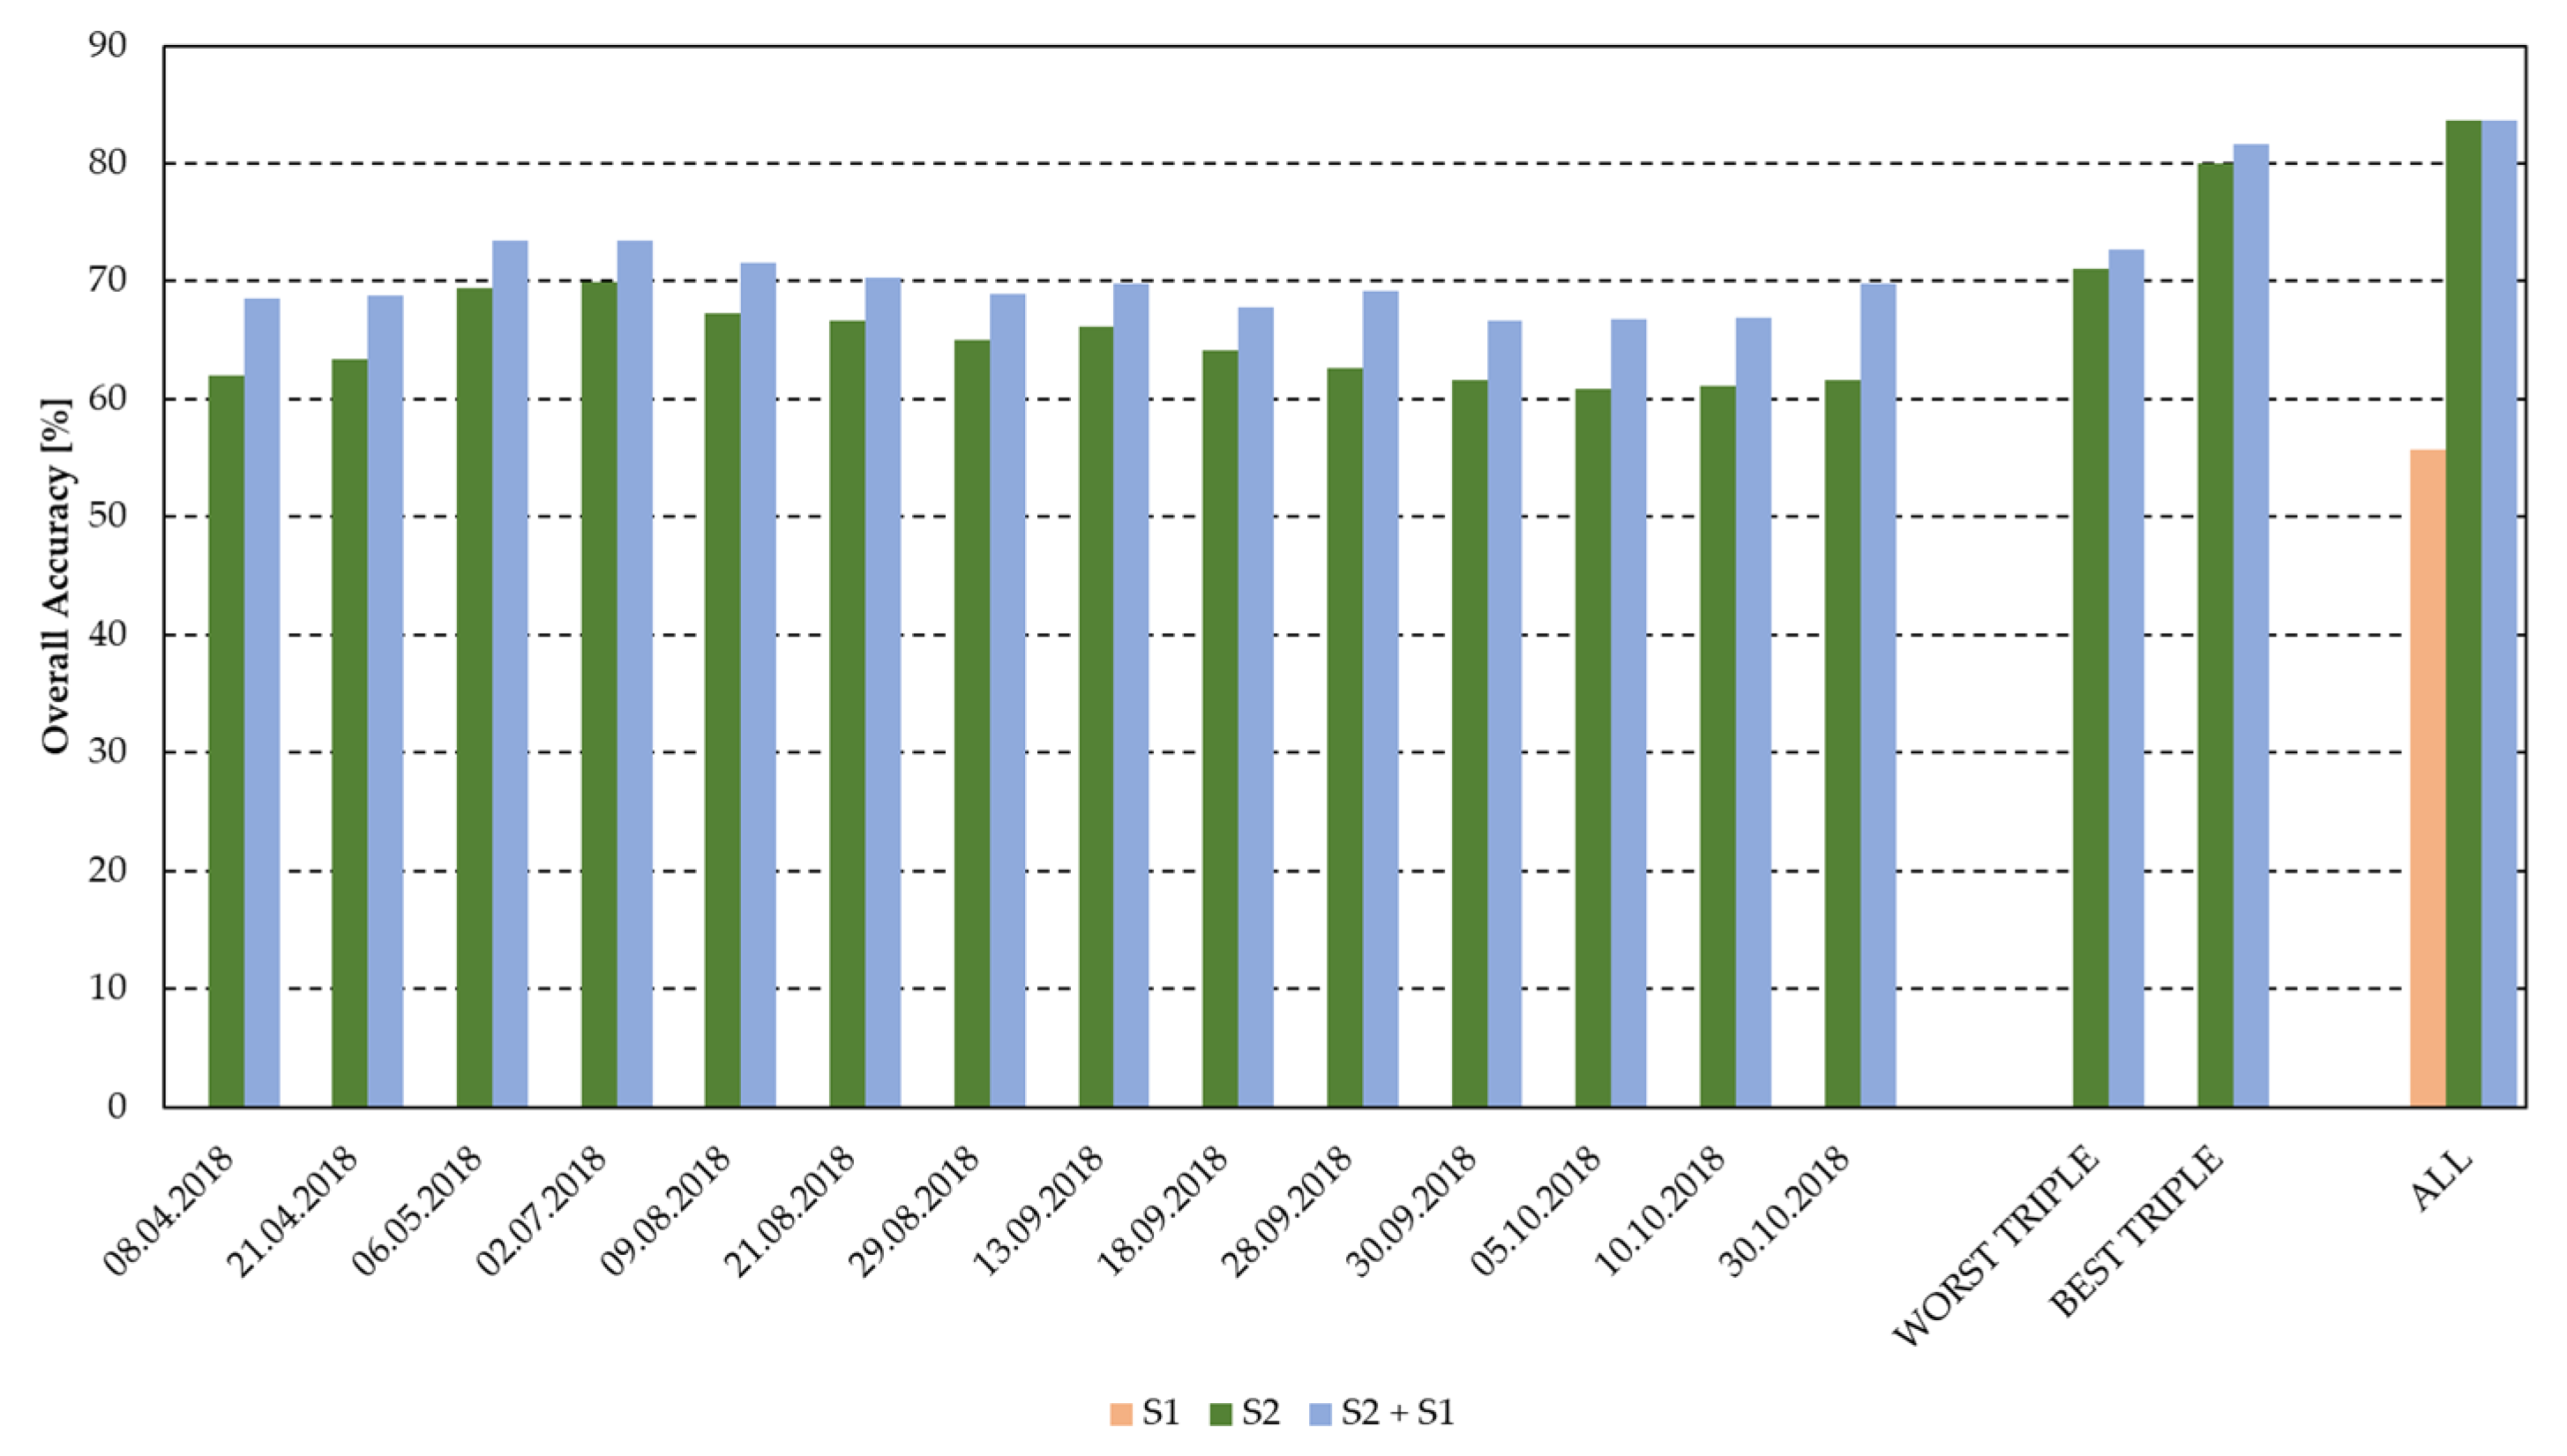
Figure 4.
Summary of the special issue “Tree species diversity mapping”: main findings and conclusions, limits, and possible amendments.
Figure 4.
Summary of the special issue “Tree species diversity mapping”: main findings and conclusions, limits, and possible amendments.
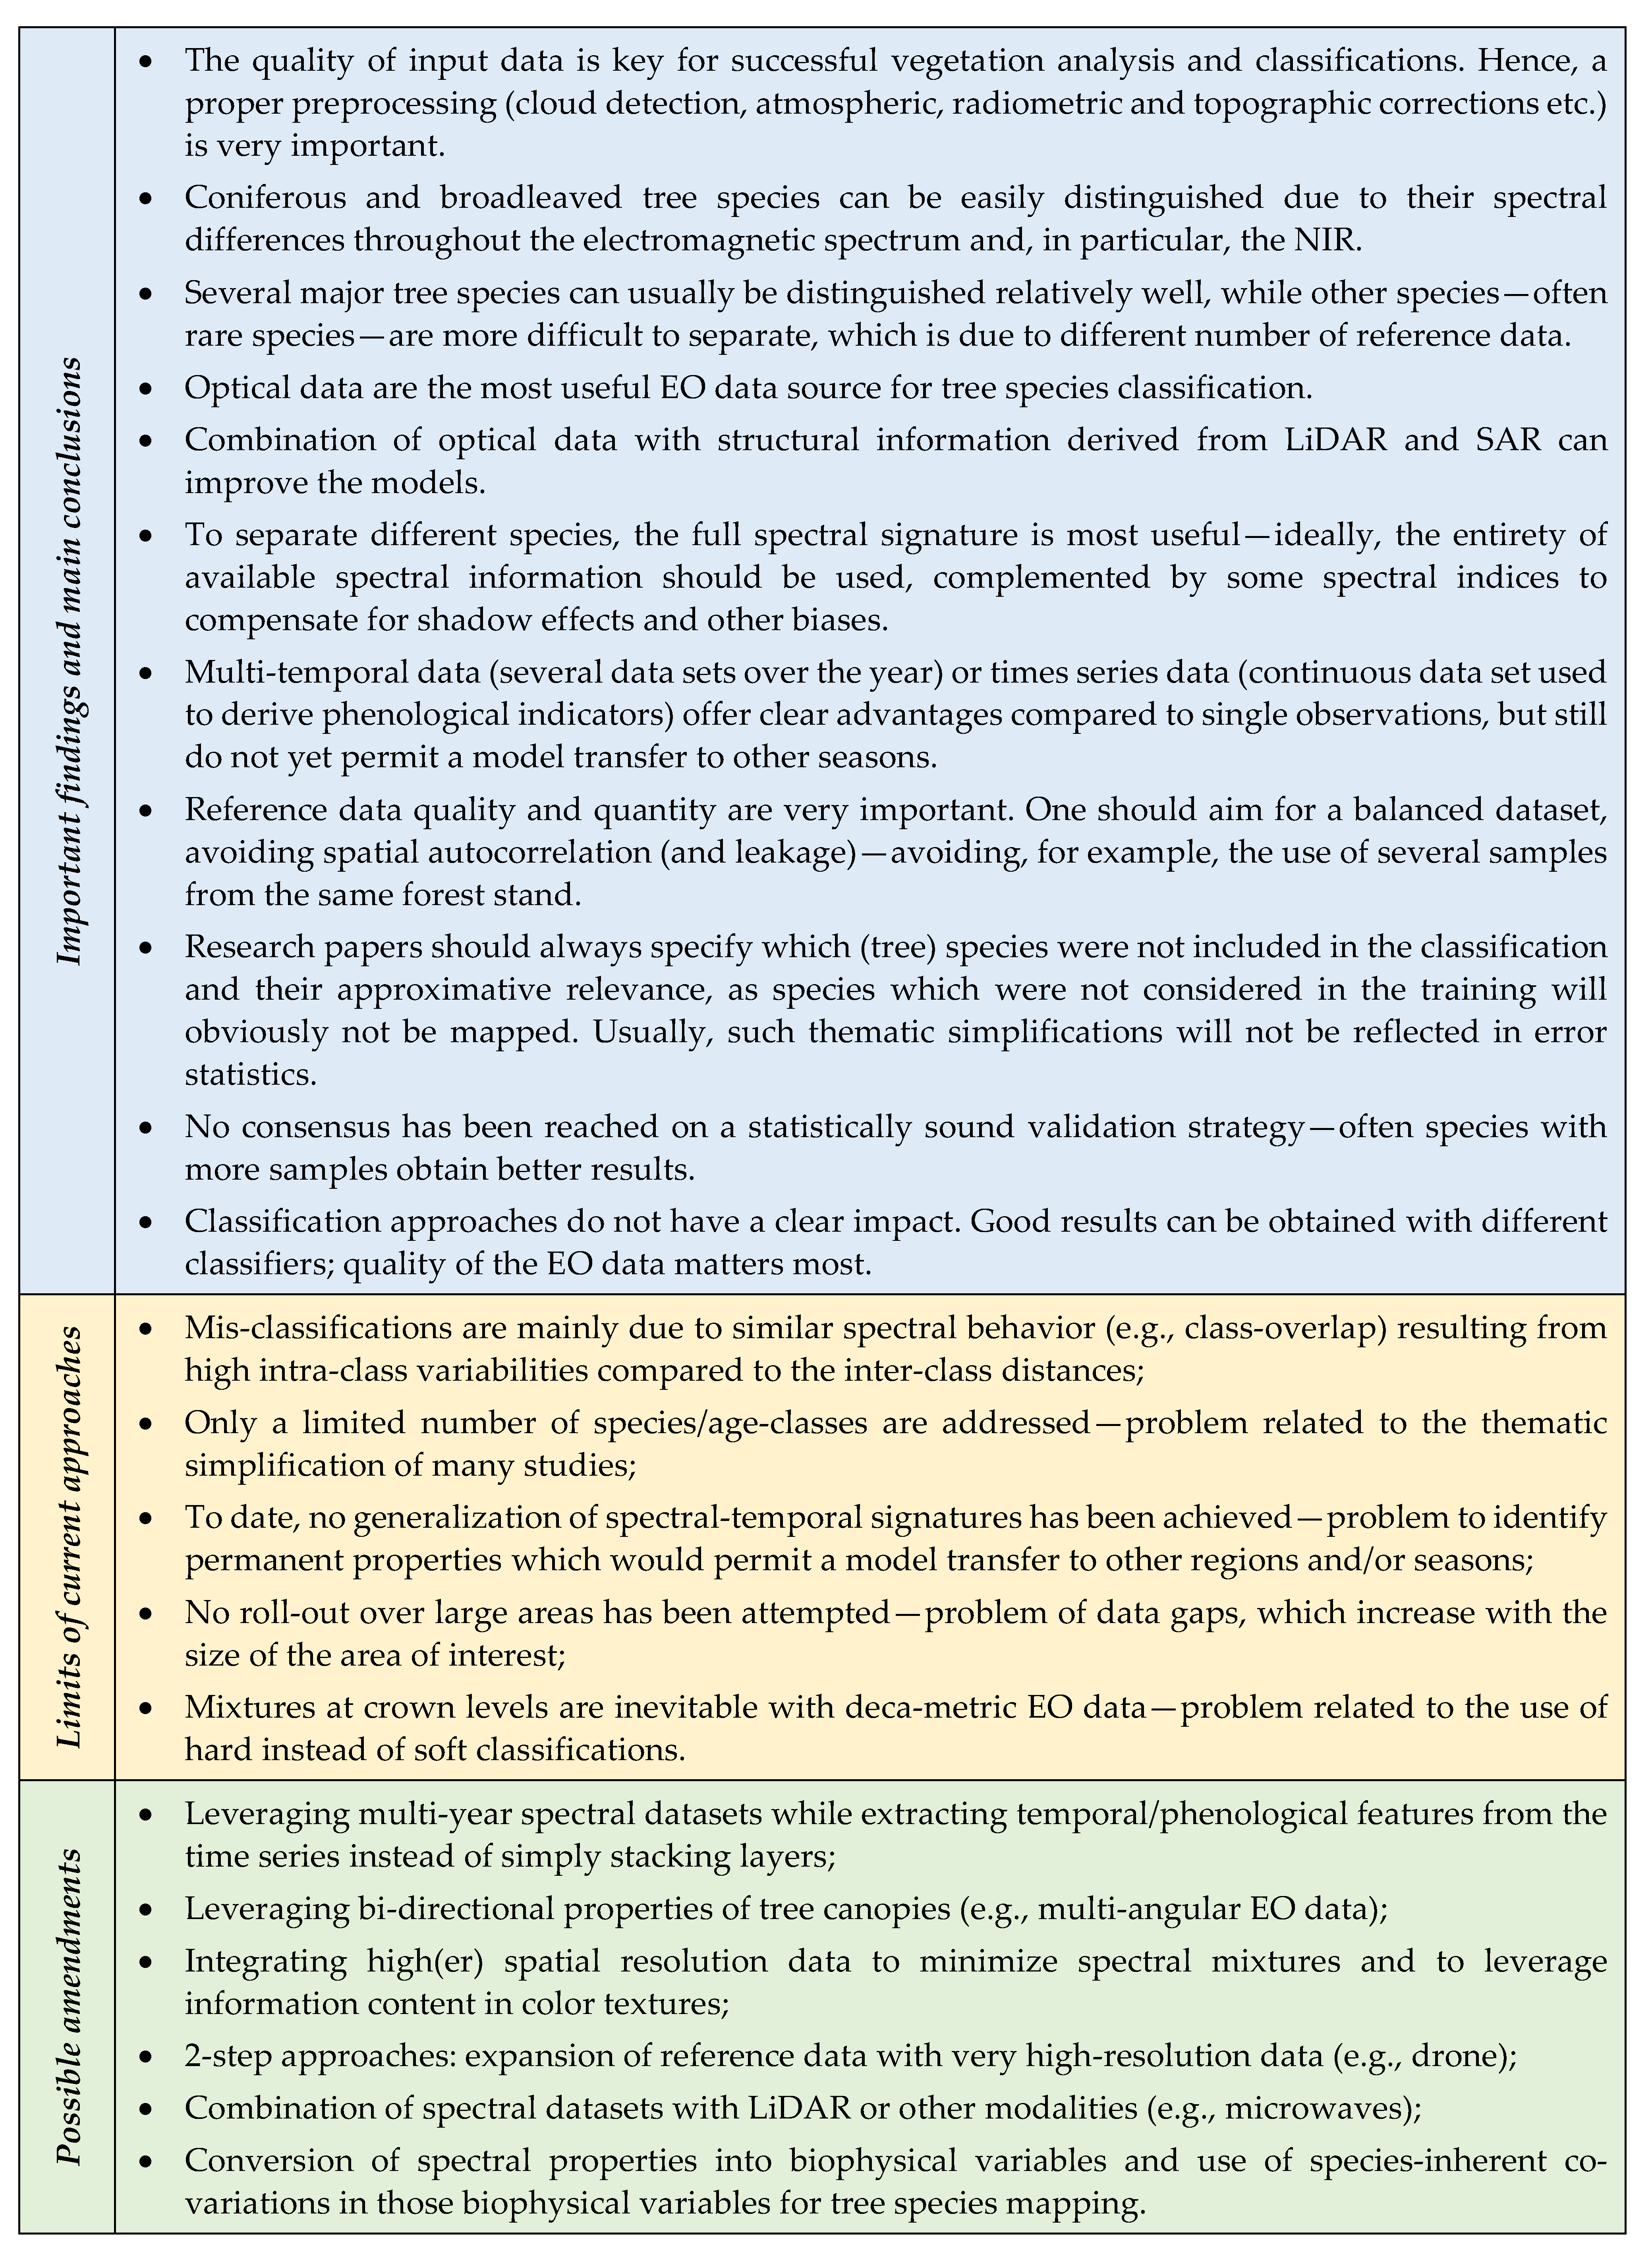
Figure 5.
Tree species identification using (space-borne) EO measurements and human vision. Note the fundamental differences resulting from the different perspectives: features that we literally see from the ground (and partly from UAV and terrestrial sensors) (bottom right) and the spectral-temporal signatures that we measure from space (top right).
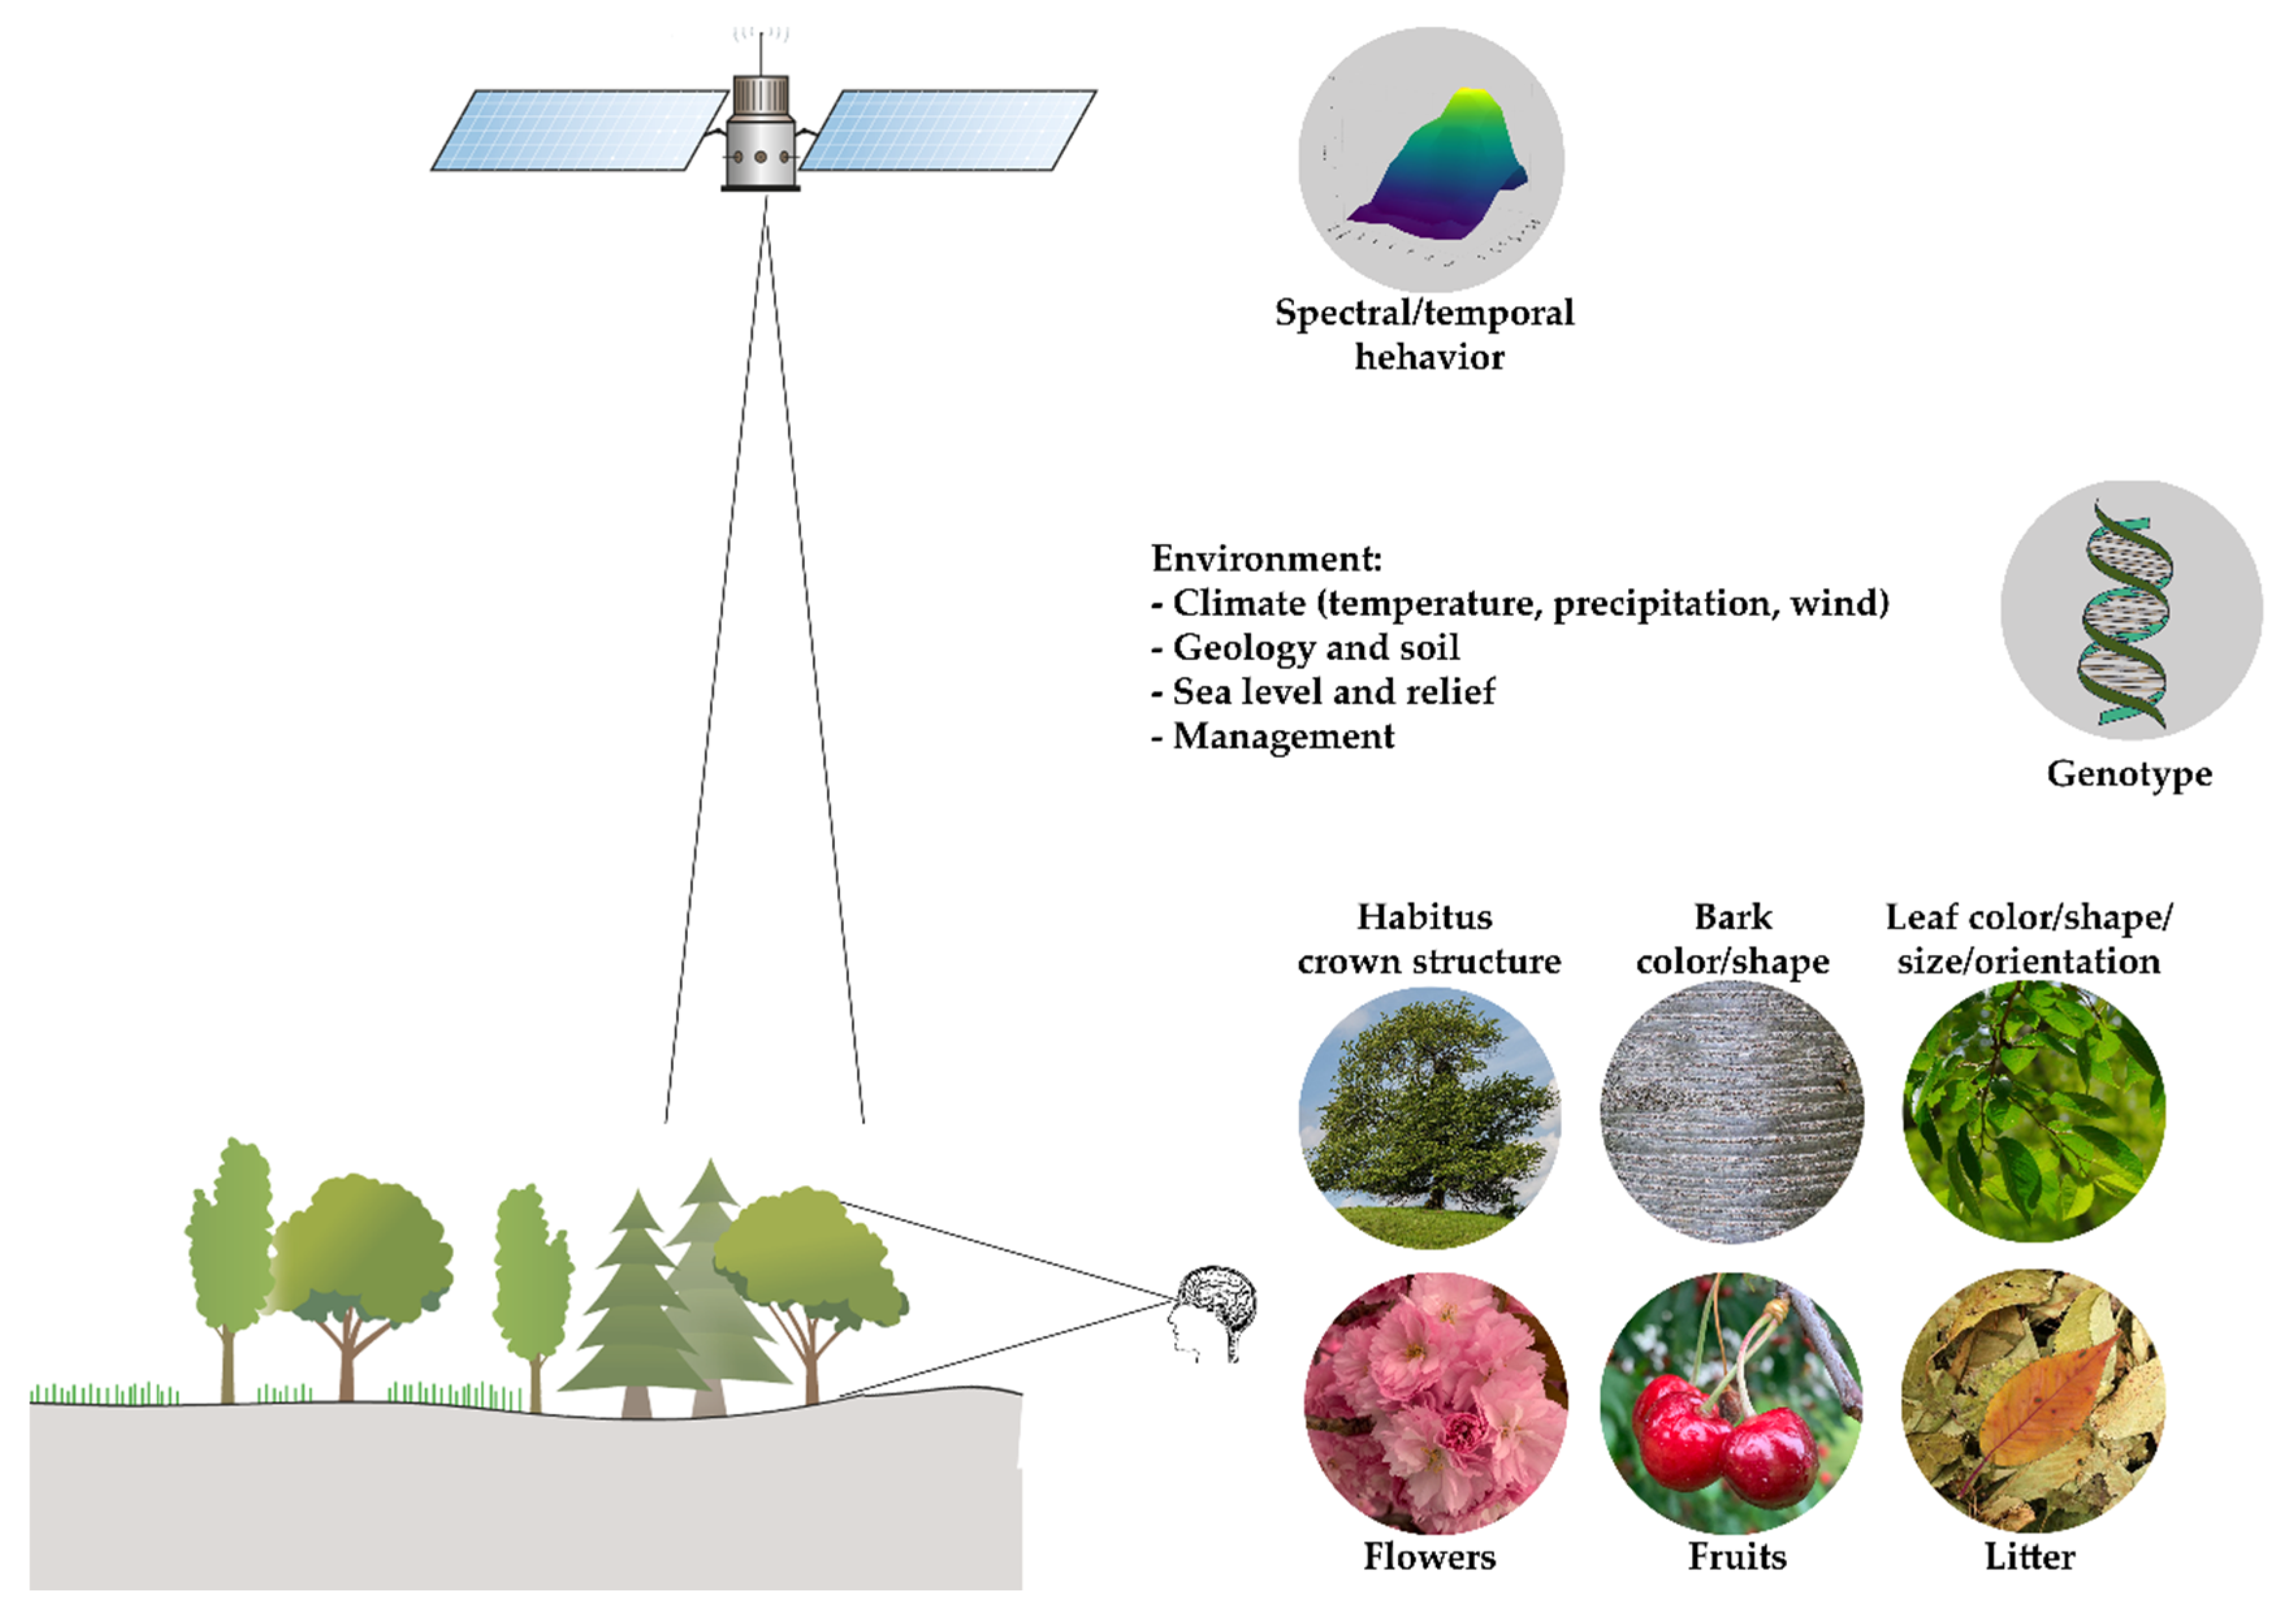
Figure 6.
Illustration of two hypothetical species (black and green) “living” in two different feature spaces over the course of a growing season (t1 to t12): (a) shown in the 3-dimensional Red, NIR and SWIR feature space; (b) temporal co-evolution of species in the 3-dimensional feature space of Leaf area index (LAI), Chlorophyll A + B (Cab) and Water content (Cw).
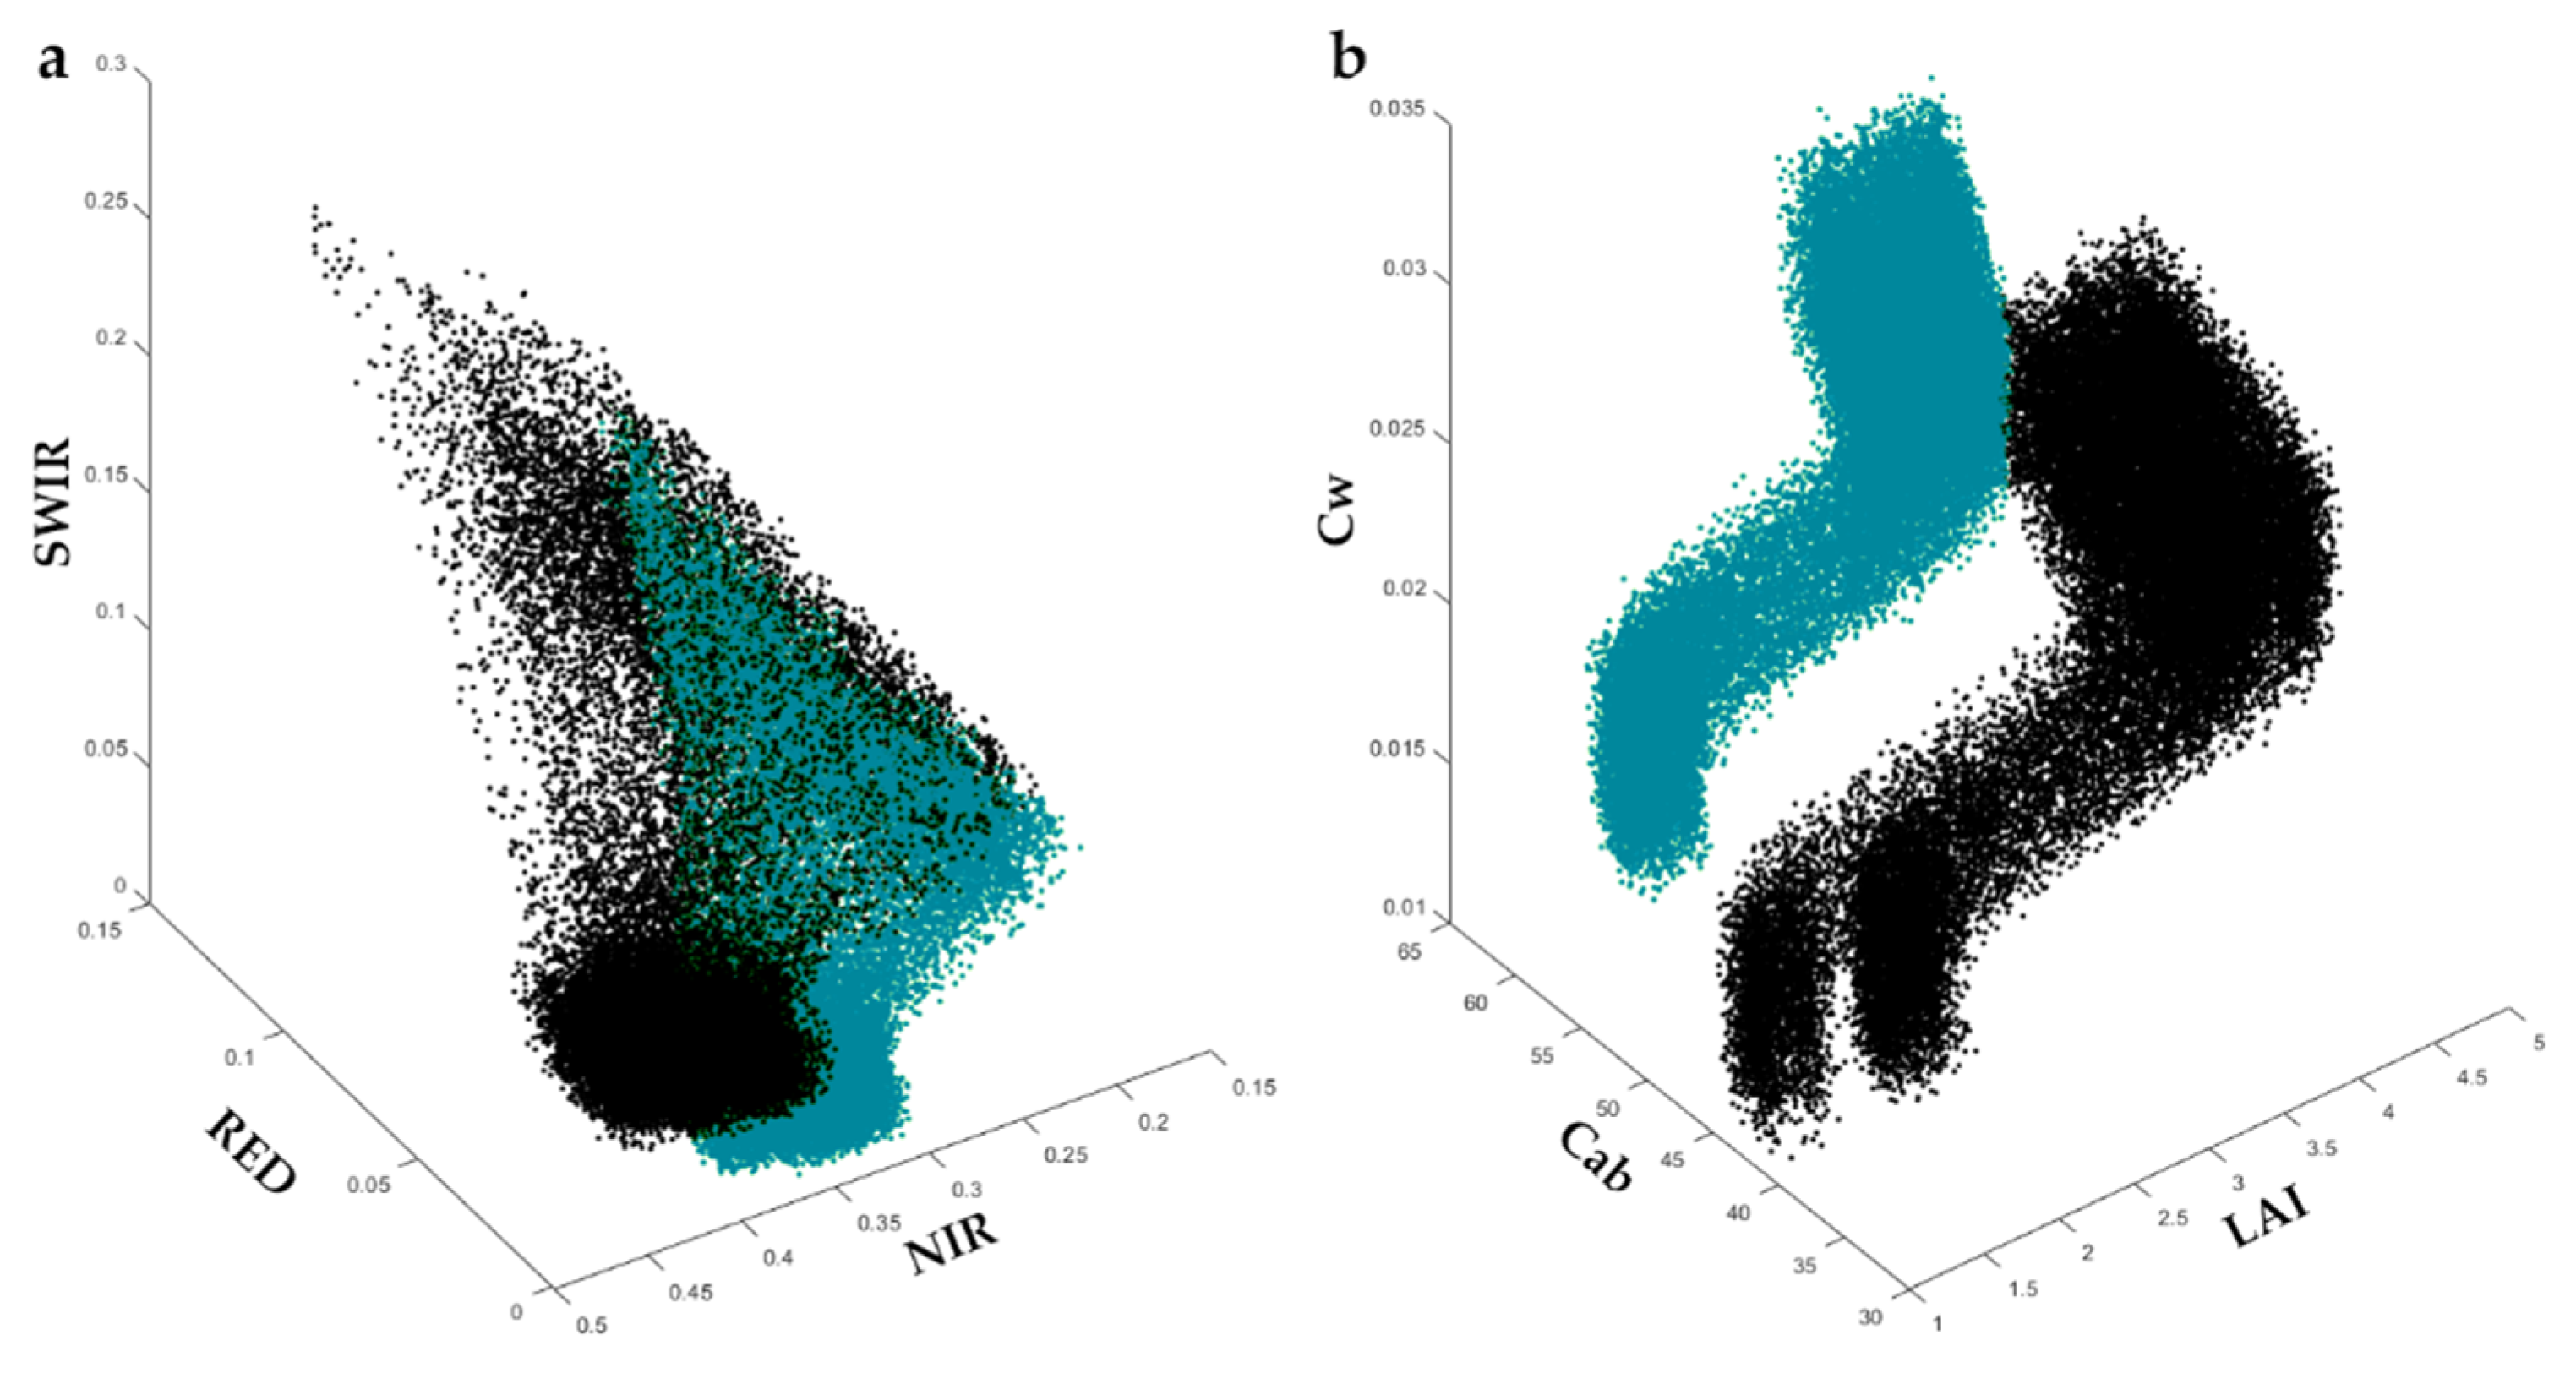
Table 1.
Summary of the contributions to the special issue about tree species diversity mapping describing the used data, location of the study, number of species considered (used for the order of the table), used classifier, and achieved accuracy (GSD: ground sampling distance, MS: multispectral, HS: hyperspectral, LS: Landsat, S1: Sentinel-1, S2: Sentinel-2, WV: WorldView, UAV: unmanned aerial vehicle, ANN: artificial neural network, CNN convolutional neural network, RF: random forest, SVM: support vector machine; OA: overall accuracy).
| Data Type | Platform | Sensor | Spectral Bands | GSD | Temporal Coverage | Location | Number of Species * | Classifier | OA (%) | Ref. |
|---|---|---|---|---|---|---|---|---|---|---|
| LiDAR | Review study | 60–80 | [8] | |||||||
| MS | Satellite | S2 | 10 | 10 m | Multi- temporal | Senegal | 1 | ANN | 91 | [9] |
| RGB | Airplane | Different aerial cameras | 3 | 0.1 cm | Bi- temporal | New Zealand | 1 | CNN & XGBoost | 83 | [10] |
| MS | Satellite | LS | 6 | 30 m | Multi- temporal | Russia | 2 | RF | 90 | [11] |
| MS + LiDAR | Airplane + Helicopter | Xp-w/a|DMCIII; RIEGL LMS Q 680i | 4 | 55 pts/m², 0.17/0.095 m | Mono- temporal | Germany | 2–4 | RF | 87–98 | [12] |
| MS | Satellite | LS8 | 6 | 30 m | Multi- temporal | China | 4 | RF | 79 | [13] |
| RGB | UAV | RGB camera | 3 | 0.003–0.5 m | Serval flights | Germany | 4 | CNN | 92 | [14] |
| MS | Satellite | Gaofen-1&2, S2, LS8 | 2 (NDVI) | 4, 10, 16, 30 m | Multi- temporal | China | 4 | RF | 85 | [15] |
| MS | Satellite | WV-3 | 4 | 0.4 m | Mono- temporal | China | 6 | CNN, SVM, RF | 83 | [16] |
| MS | Satellite | S2 | 10 | 10 m | Multi- temporal | Serbia | 8 | RF | 83 | [17] |
| HS | UAV | 25 | 0.1 m | 3 flights in 3 years | Brazil | 8 | RF | 50 | [18] | |
| MS | Satellite | WV-2 | 8 | 0.5 m | Mono- temporal | Kenya | 8 | RF, SVM | 70–73 | [19] |
| MS | Satellite | WV-3 | 16 | 0.3 cm | Mono- temporal | Canada | 11 | SVM, RF | 75 | [20] |
| MS + LiDAR | Satellite + Airplane | S2, RGB, RIEGL LMS-Q680 | 3 + 10 | 3.6 pts/m², 0.12 m, 10 m | Mono-/multi- temporal | China | 11 | SVM, RF | 90–94 | [21] |
| MS + SAR | Satellite | S2, S1 | 10 | 10 m | Multi- temporal | Austria | 12 | RF | 84 | [22] |
| MS | Satellite | S2 | 10 | 10 m | Multi- temporal | Austria | 12 | RF | 89 | [23] |
| MS | Satellite | Formosat-2 | 4 | 8 m | Multi- temporal | France | 13 | SVM | 48–60 | [24] |
| HS | Airplane | AVIRIS | 366 | 4 m | Mono- temporal | India | 20 | SVM | 86 | [25] |
* Sometimes, species were grouped into broader “classes”.
Table 3.
Simplified enumeration of main traits and approaches used for the identification of tree species using different sensor modalities from laboratory (genetics) to satellite-based Earth Observation. In the right-most column, our recommendation for future research.
Table 3.
Simplified enumeration of main traits and approaches used for the identification of tree species using different sensor modalities from laboratory (genetics) to satellite-based Earth Observation. In the right-most column, our recommendation for future research.
| Genetics | Botany & Human Vision | Computer Vision | LiDAR | EO Current | EO Recommended |
|---|---|---|---|---|---|
| DNS analysis | Leaf shape & size | Crown structure | Point-cloud derived metrics | Spectral-temporal features | Biophysical variables (Table 2) extracted using RTM |
| Bark structure & color | Crown shape | Crown shape | Supervised classification in spatial-spectral-temporal feature space | Learning of the temporal co-evolution of derived biochemical & structural variables | |
| Fruits and flowers | Branching | Branching pattern | |||
| Branching pattern | |||||
| Habitus/growth form |
Table 4.
Important plant traits for human visual recognition of tree species.
| Individual Tree | Tree Components |
|---|---|
| Habitus/crown form/shape | Size, shape, color, orientation of leaves/needles |
| Crown structure/branching | Structure and color of bark |
| Color, shape, size, orientation of flowers | |
| Color, shape, size, orientation of fruits |
Disclaimer/Publisher’s Note: The statements, opinions and data contained in all publications are solely those of the individual author(s) and contributor(s) and not of MDPI and/or the editor(s). MDPI and/or the editor(s) disclaim responsibility for any injury to people or property resulting from any ideas, methods, instructions or products referred to in the content. |
© 2023 by the authors. Licensee MDPI, Basel, Switzerland. This article is an open access article distributed under the terms and conditions of the Creative Commons Attribution (CC BY) license (https://creativecommons.org/licenses/by/4.0/).
Share and Cite
MDPI and ACS Style
Immitzer, M.; Atzberger, C. Tree Species Diversity Mapping—Success Stories and Possible Ways Forward. Remote Sens. 2023, 15, 3074. https://doi.org/10.3390/rs15123074
AMA Style
Immitzer M, Atzberger C. Tree Species Diversity Mapping—Success Stories and Possible Ways Forward. Remote Sensing. 2023; 15(12):3074. https://doi.org/10.3390/rs15123074
Chicago/Turabian StyleImmitzer, Markus, and Clement Atzberger. 2023. "Tree Species Diversity Mapping—Success Stories and Possible Ways Forward" Remote Sensing 15, no. 12: 3074. https://doi.org/10.3390/rs15123074
Note that from the first issue of 2016, this journal uses article numbers instead of page numbers. See further details here.