Article

Global Cloudiness and Cloud Top Information from AVHRR in the 42-Year CLARA-A3 Climate Data Record Covering the Period 1979–2020

by
Karl-Göran Karlsson
*,
Abhay Devasthale
and
Salomon Eliasson
The Swedish Meteorological and Hydrological Institute (SMHI), Folkborgsvagen 17, 602 10 Norrkoping, Sweden
*
Author to whom correspondence should be addressed.
Remote Sens. 2023, 15(12), 3044; https://doi.org/10.3390/rs15123044
Submission received: 28 April 2023 / Revised: 2 June 2023 / Accepted: 8 June 2023 / Published: 10 June 2023
(This article belongs to the Special Issue Satellite-Based Cloud Climatologies)

Abstract

:
This paper investigates the quality of global cloud fraction and cloud-top height products provided by the third edition of the CM SAF cLoud, Albedo and surface RAdiation dataset from the AVHRR data (CLARA-A3) climate data record (CDR) produced by the EUMETSAT Climate Monitoring Satellite Application Facility (CM SAF). Compared with with CALIPSO–CALIOP cloud lidar data and six other cloud CDRs, including the predecessor CLARA-A2, CLARA-A3 has improved cloud detection, especially over ocean surfaces, and improved geographical variation and cloud detection efficiency. In addition, CLARA-A3 exhibits remarkable improvements in the accuracy of its global cloud-top height measurements. For example, in tropical regions, previous underestimations for high-level clouds are reduced by more than 2 km. By taking advantage of more realistic descriptions of global cloudiness, this study attempted to estimate trends in the observable fraction of low-level clouds, acknowledging their importance in producing a net climate cooling effect. The results were generally inconclusive in the tropics, mainly due to the interference of El Nino modes during the period under study. However, the analysis found small negative trends over oceanic surfaces outside the core tropical region. Further studies are needed to verify the significance of these results.

1. Introduction

The longest space-based observation series from a passive meteorological multispectral imager is that recorded by the Advanced Very High Resolution Radiometer (AVHRR, [1]). The TIROS-N satellite, launched in a sun synchronous polar orbit in October 1978, was the first to carry this sensor. The sensor has subsequently been onboard many NOAA and EUMETSAT MetOp satellites, with the very last sensor onboard MetOp-C launched in November 2018. Consequently, the sensor has enabled the observation of clouds, aerosols, and the earth’s surface for more than 44 years. It is anticipated that the mission will continue for several more years, and that it may even complete a fifth decade of observations.
An observation series based on one practically unchanged sensor (with only minor exceptions) spanning almost five decades is a great asset for environmental and climate studies. This is true even though obtaining accurate climate-quality observations from the AVHRR is challenging because the sensor was not originally designed for climate studies and cannot accurately depict trends. The uniquely long period of observation and the global coverage at high spatial resolution could still be of interest for studies of climate variability and the monitoring of medium-to-large global changes as well as changes in the geographic distribution of certain environmental parameters on the earth’s surface.
This paper focuses on cloud observations from the AVHRR. The description and evolution of global cloudiness in climate models remains the largest uncertainty in climate scenarios and predictions [2,3,4,5,6]. In particular, the description of low-level cloudiness in tropical and sub-tropical regions, which is responsible for a large part of the cooling effect from the reflection of solar radiation back into space, is critical here. It is critical because changes in the amount of low-level clouds may easily contribute significantly to either a positive or a negative feedback effect on the global radiation budget [2].
Estimations of global cloud conditions and their changes over time derived from AVHRR data are available in several earlier studies [7,8,9,10]. These earlier studies indicate a negative trend in global cloud cover [10]. However, it has been challenging to establish details concerning the contribution of different cloud levels to overall changes, mainly because the AVHRR mostly only observes the highest cloud layers. Additionally, the previously studied time series were too short to estimate trends adequately. In this paper, we will present results from the third edition of the Climate Monitoring Satellite Application Facility (CM SAF [11]) cLoud, Albedo and surface RAdiation dataset from the AVHRR data, abbreviated CLARA-A3 [12]. The data record incorporates several cloud products, surface and top-of-atmosphere radiation products, and surface albedo products (for access and a complete description, see the Data Availability Statement section). However, here we focus only on the global distribution of cloudiness, the observable contribution of vertical cloud levels, and the associated cloud-top height information. The improvement in the temporal coverage compared with the predecessor CLARA-A2 is quite significant, with an extension in time from 34 years to 42 years. CLARA-A3 now incorporates AVHRR observations from its very introduction (1979) to the year 2020, which means that both the start and the end of the time series have been extended compared with those of CLARA-A2. Additionally, the CLARA-A3 data series is extended continuously by the ongoing production of so-called Interim Climate Data Records (ICDRs), which means that the complete data record up to the present (2023) covers 44 years rather than 42 years.
This paper describes the main improvements in cloudiness and cloud-top information in CLARA-A3 compared with its predecessor, CLARA-A2. We will also repeat inter-comparisons with similar data records (as in [10]) and take a closer look at possible regional differences and trends in absolute values. It is also of particular interest here to have a preliminary look at possible changes in low-level cloudiness at low and middle latitudes, bearing in mind its importance for the earth’s radiation balance.
In Section 2, we describe the methods and reference datasets used to evaluate the achievements of the new CLARA edition. We also introduce a method for evaluating the distribution and the potential changes in the contribution of low-level clouds. After that, results are given in Section 3, and this will be followed by a discussion in Section 4 and our conclusions in Section 5.

2. Data and Methods

2.1. Cloud Fraction and Cloud-Top Height Products in CLARA-A3

The global monthly mean cloudiness parameter belongs to the Cloud Fractional Cover (CFC) product of the CLARA-A3 data record. It is calculated from the binary cloud masks from all AVHRR overpasses in a month by averaging the results in a 0.25° regular latitude–longitude grid. The binary cloud masks are derived from thresholding cloud probabilities at 50%, provided by the cloud probability product, CMAPROB. CMAPROB is computed using naïve Bayesian theory and trained using the data from the cloud lidar instrument CALIOP (Cloud-Aerosol Lidar with Orthogonal Polarization) on the CALIPSO (Cloud-Aerosol Lidar and Infrared Pathfinder Satellite Observations) satellite recorded between 2006 and 2016 (for full details, see [13]).
The corresponding cloud-top height product (denoted CTO) is based on monthly averaged CTO products from every AVHRR overpass. Cloud-top geometrical heights (CTH), as well as cloud-top pressures (CTP) and cloud-top temperatures (CTT), were estimated via infrared AVHRR channels by an artificial neural network (ANN), also trained using data from the CALIPSO–CALIOP sensor. The method is described in detail in [14].
Combining the cloud mask and CTP information makes estimating the gross relative contributions of the various vertical cloud layers to the total cloud cover possible. Thus, the CFC product includes information on the observable (i.e., not obscured by higher clouds) contribution of low-level, medium-level, and high-level clouds using the classical International Satellite Cloud Climatology (ISCCP) subdivisions of these three cloud layers which refer to cloud-top pressure levels of 680 hPa and 440 hPa.

2.2. Detailed Evaluation of Global Cloudiness and Cloud Detection Sensitivity from CALIPSO

A detailed evaluation of the CLARA-A2 cloud mask was previously performed using cloud information from the CALIOP cloud lidar on the CALIPSO satellite [15]. This was based on information derived from globally collocated AVHRR and CALIPSO–CALIOP measurements and CALIOP cloud masks and cloud optical thickness products. In addition to estimating traditional validation scores (i.e., mean error or bias, hit rate, and Hanssen–Kuipers skill (KSS) score, all of which are explained in [16]), the study defined a cloud detection sensitivity parameter (CDS) for evaluating cloud detection efficiency as a function of the geographical position on the earth. In other words, CDS describes the smallest cloud optical thickness for which the probability of detection by the CLARA-A2 cloud mask is still equal to or better than 50%. This was estimated in an equal-area global grid, thus providing information on how cloud detection efficiency varied with the geographical position on the earth. We repeat this validation study here, but now for CLARA-A3, to see the extent to which the validation scores and CDS values have changed. The basic validation scores for CLARA-A3 were estimated using independent results from 2010, since collocation data from this year were not used to train the cloud-masking method. However, the entire matchup dataset from 2006 to 2016 was used to estimate the CDS parameter to enable results with global coverage on a coarse-resolution grid.

2.3. Detailed Evaluation of Cloud-Top Height Information from CALIPSO

Regarding the CLARA-A3 cloud mask, a detailed evaluation of the cloud top information (i.e., the CTH product) from 2010 was performed using the globally collocated AVHRR and CALIPSO–CALIOP information. These results were compared with the corresponding results from CLARA-A2. The validation scores used (which are defined in [16]) were the mean error (bias), the mean absolute error (MAE), and the bias-corrected root mean square error (bc-RMSE). Results were also given separately for the three vertical cloud layers (low-level, medium-level, and high-level clouds).
We can expect the CTH accuracy results to depend upon cloud thickness and whether multi-layer clouds exist. To illustrate this, we complement the overall results with results obtained under certain special conditions (e.g., single-layer clouds, multi-layer clouds, opaque clouds, and semi-transparent clouds).

2.4. Comparison of CLARA-A3 Results and Other Cloud Climate Data Records

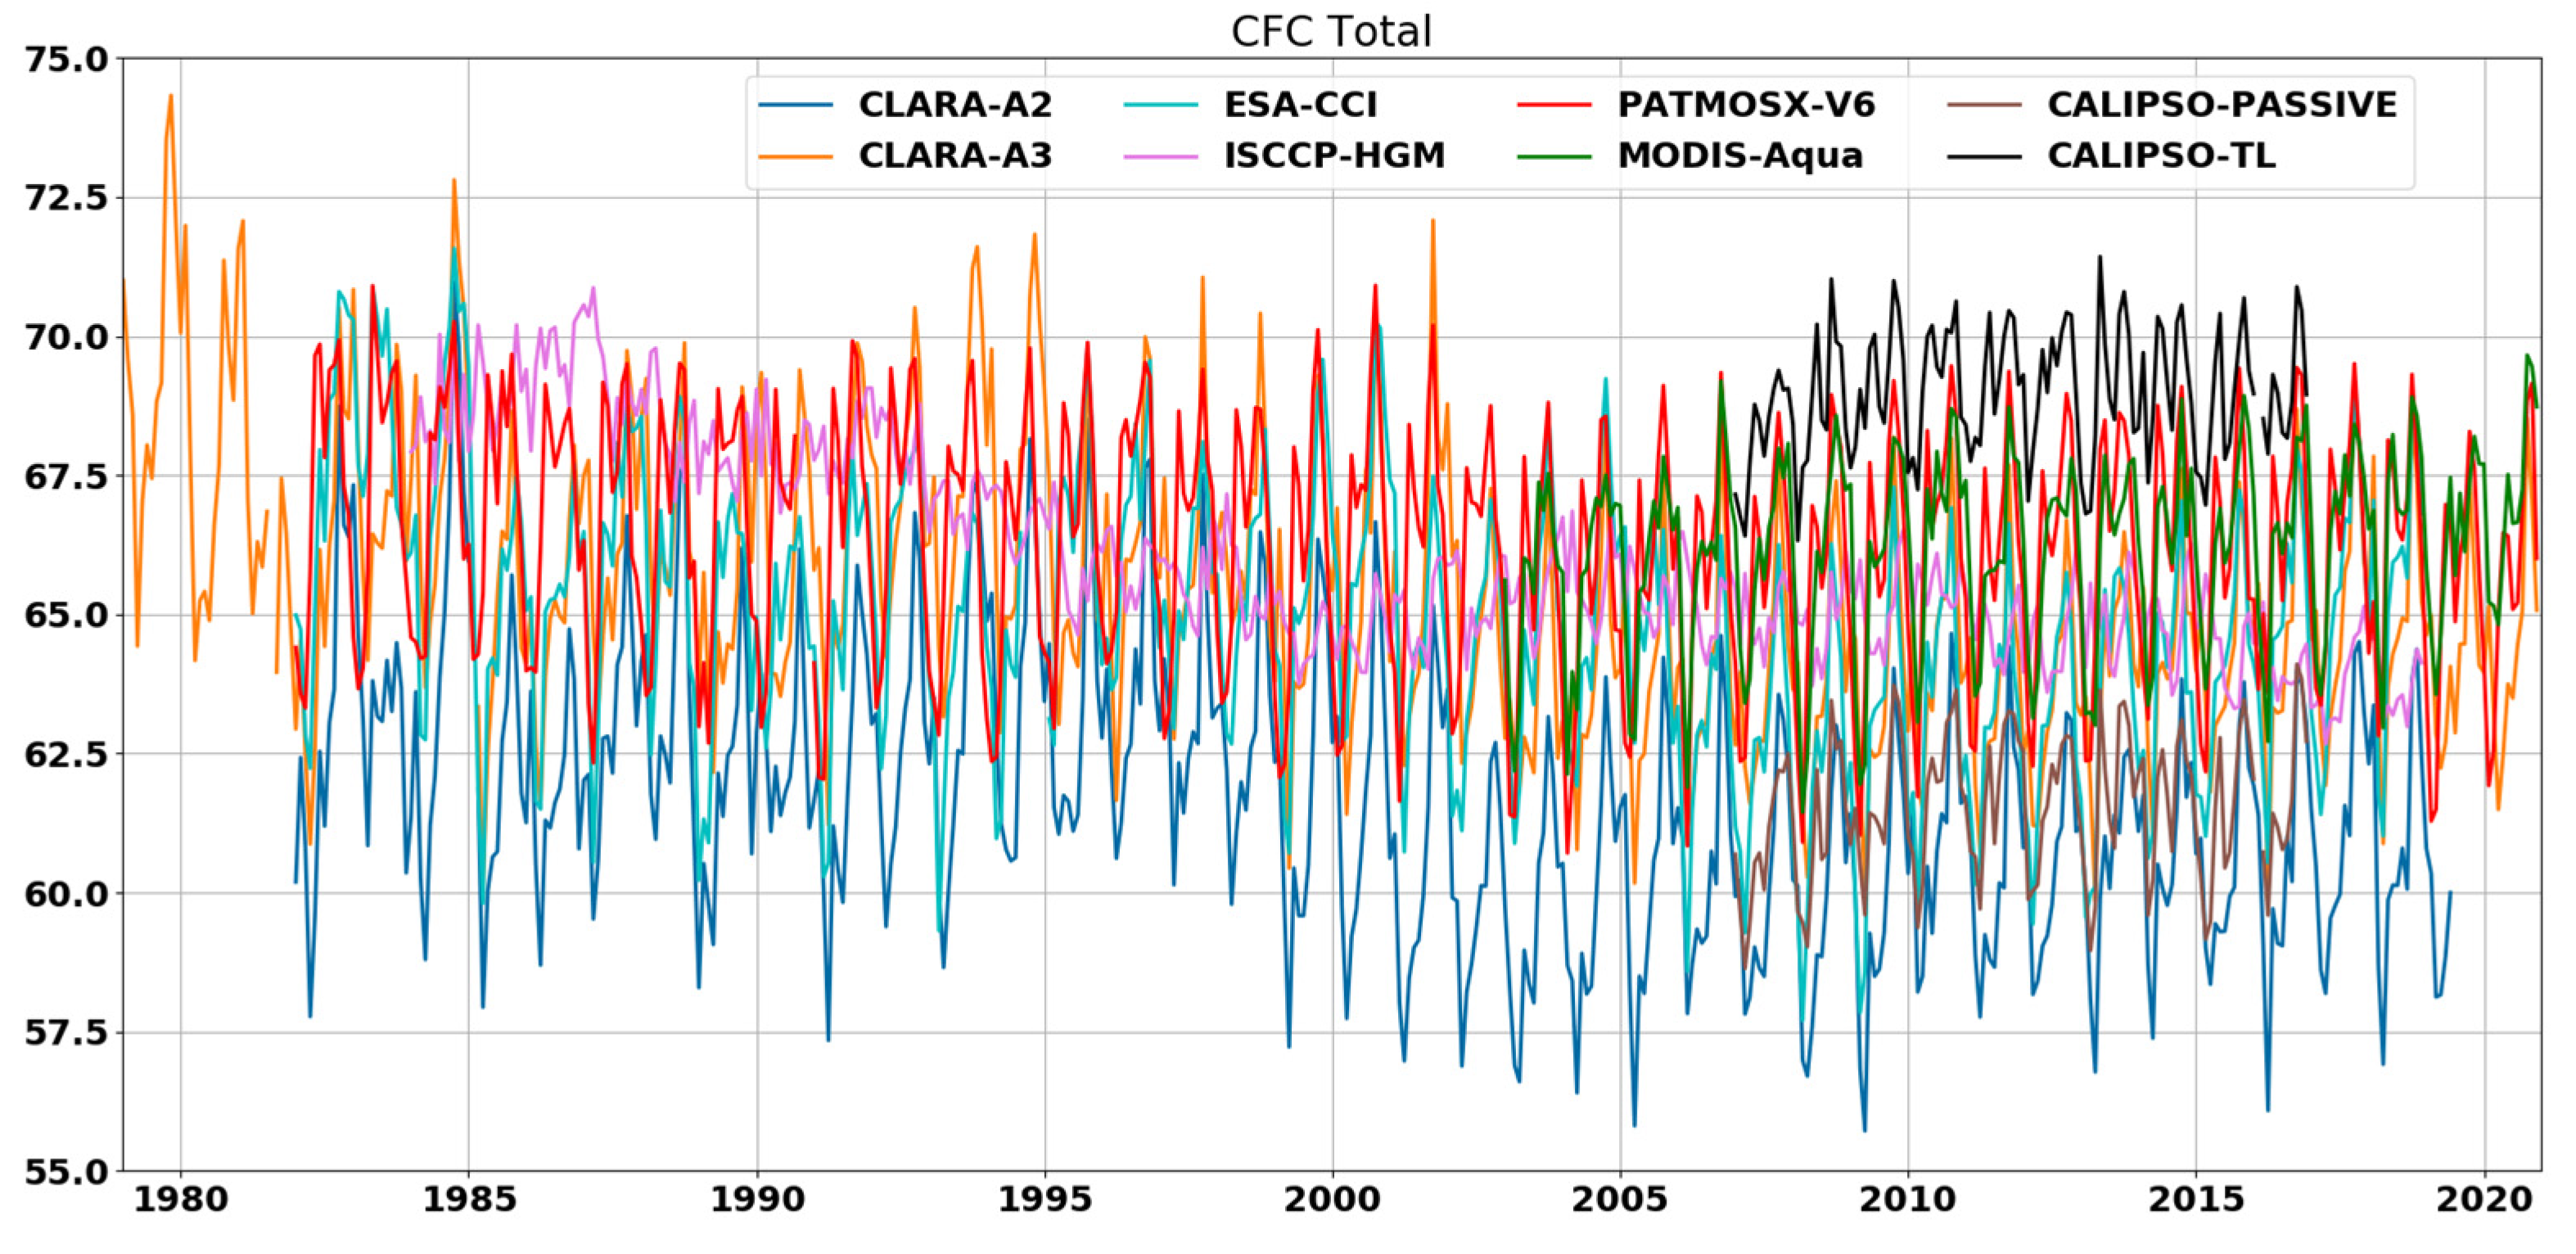
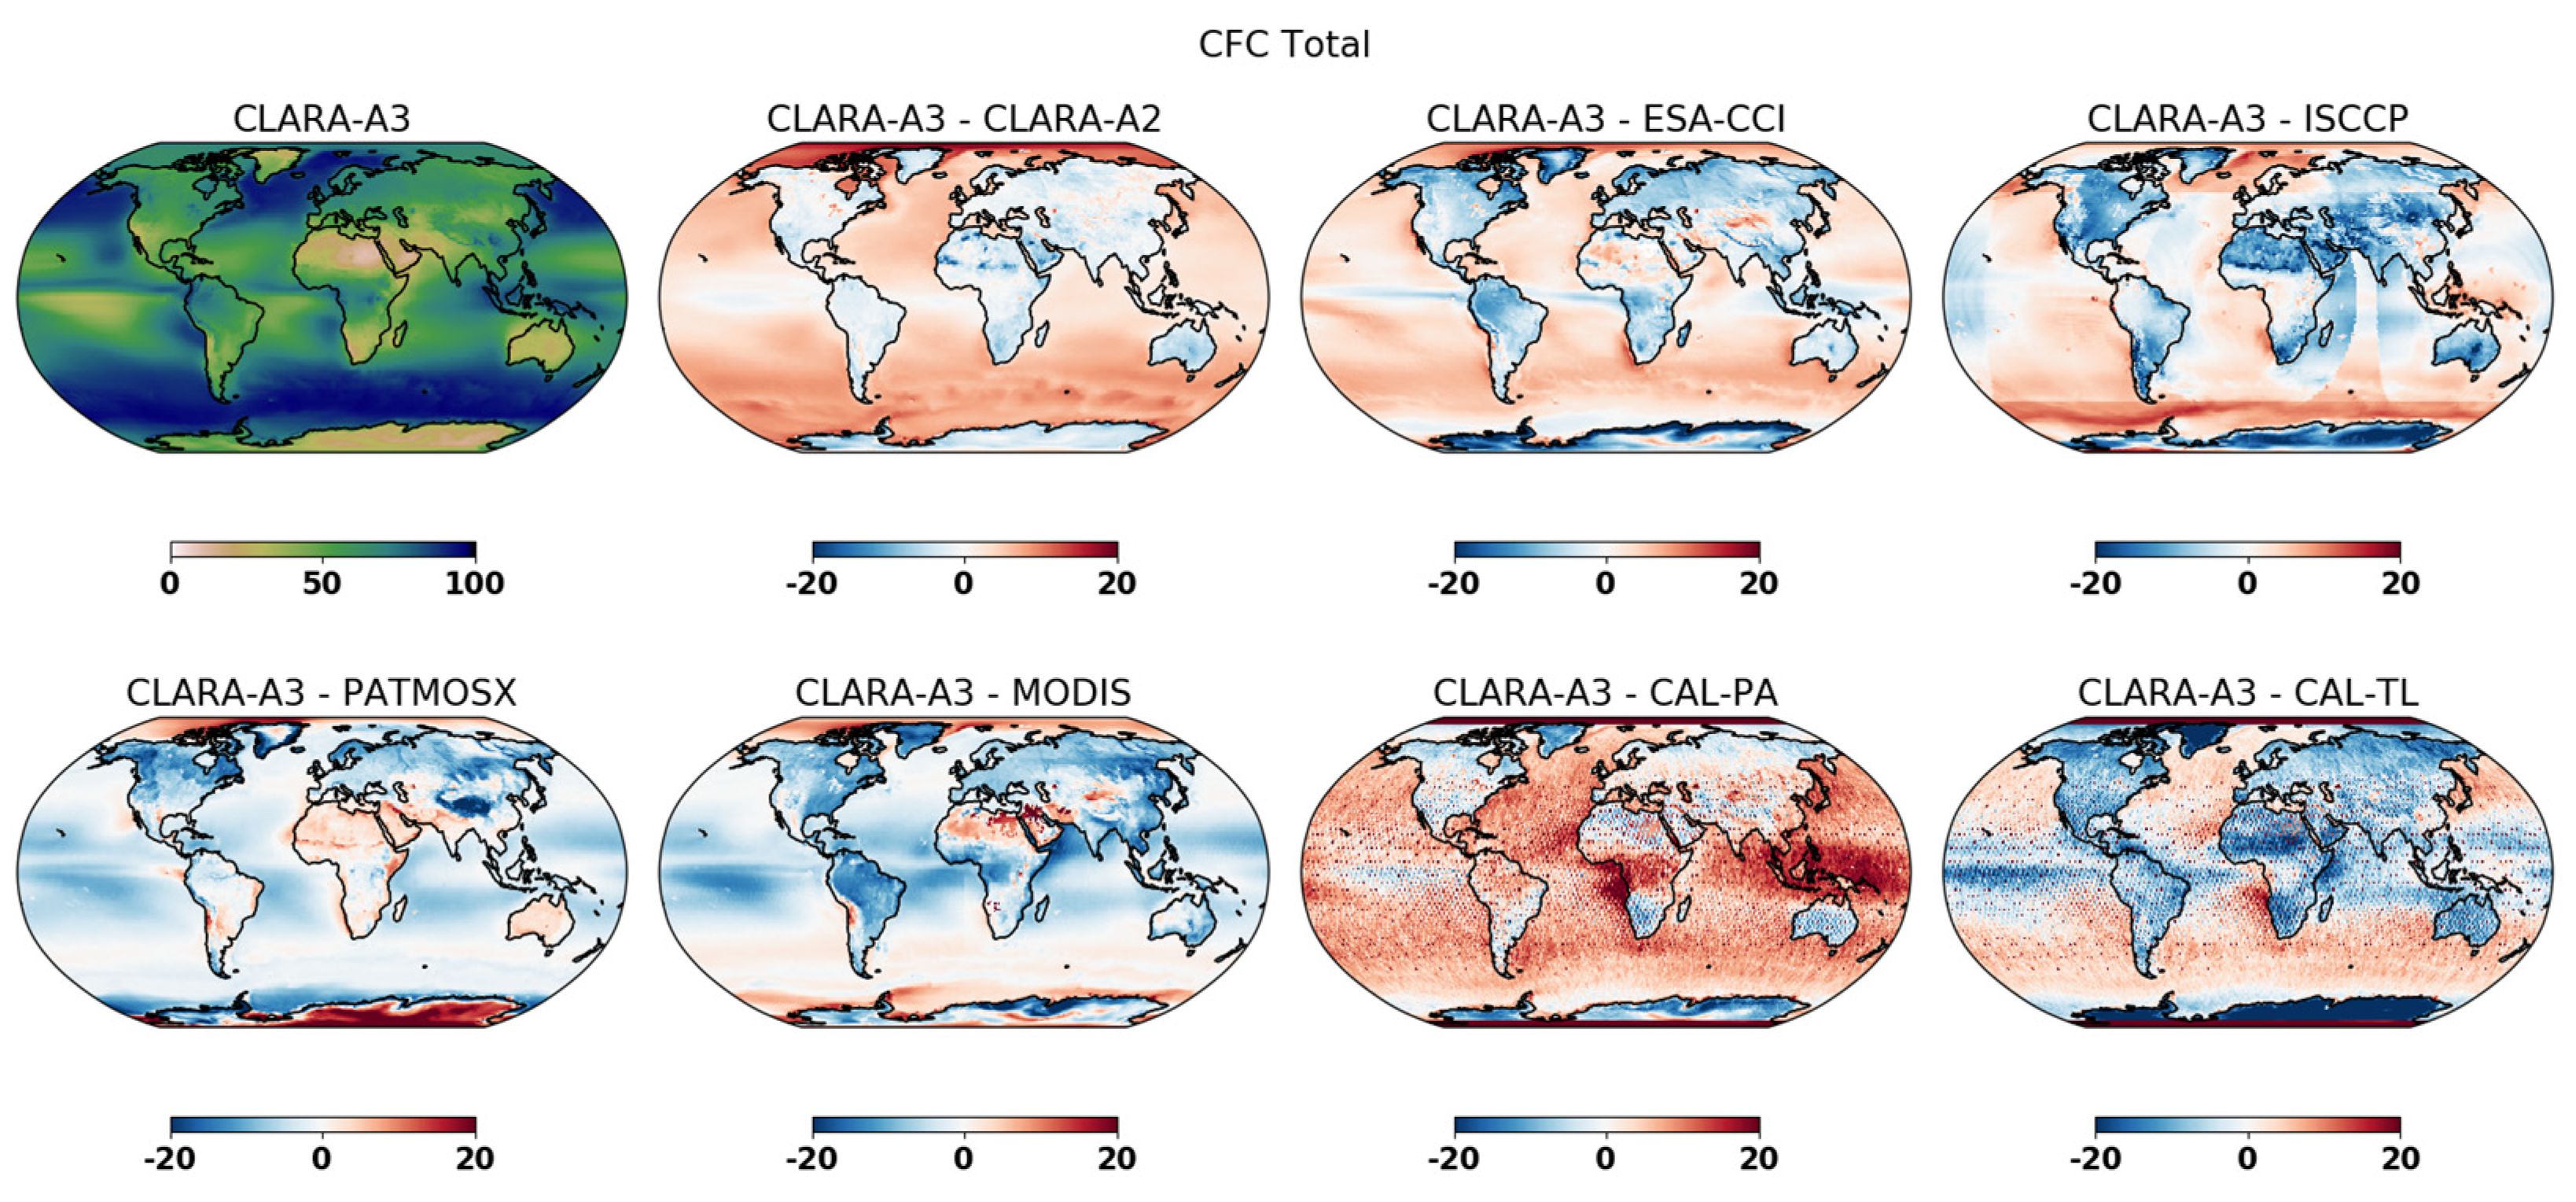
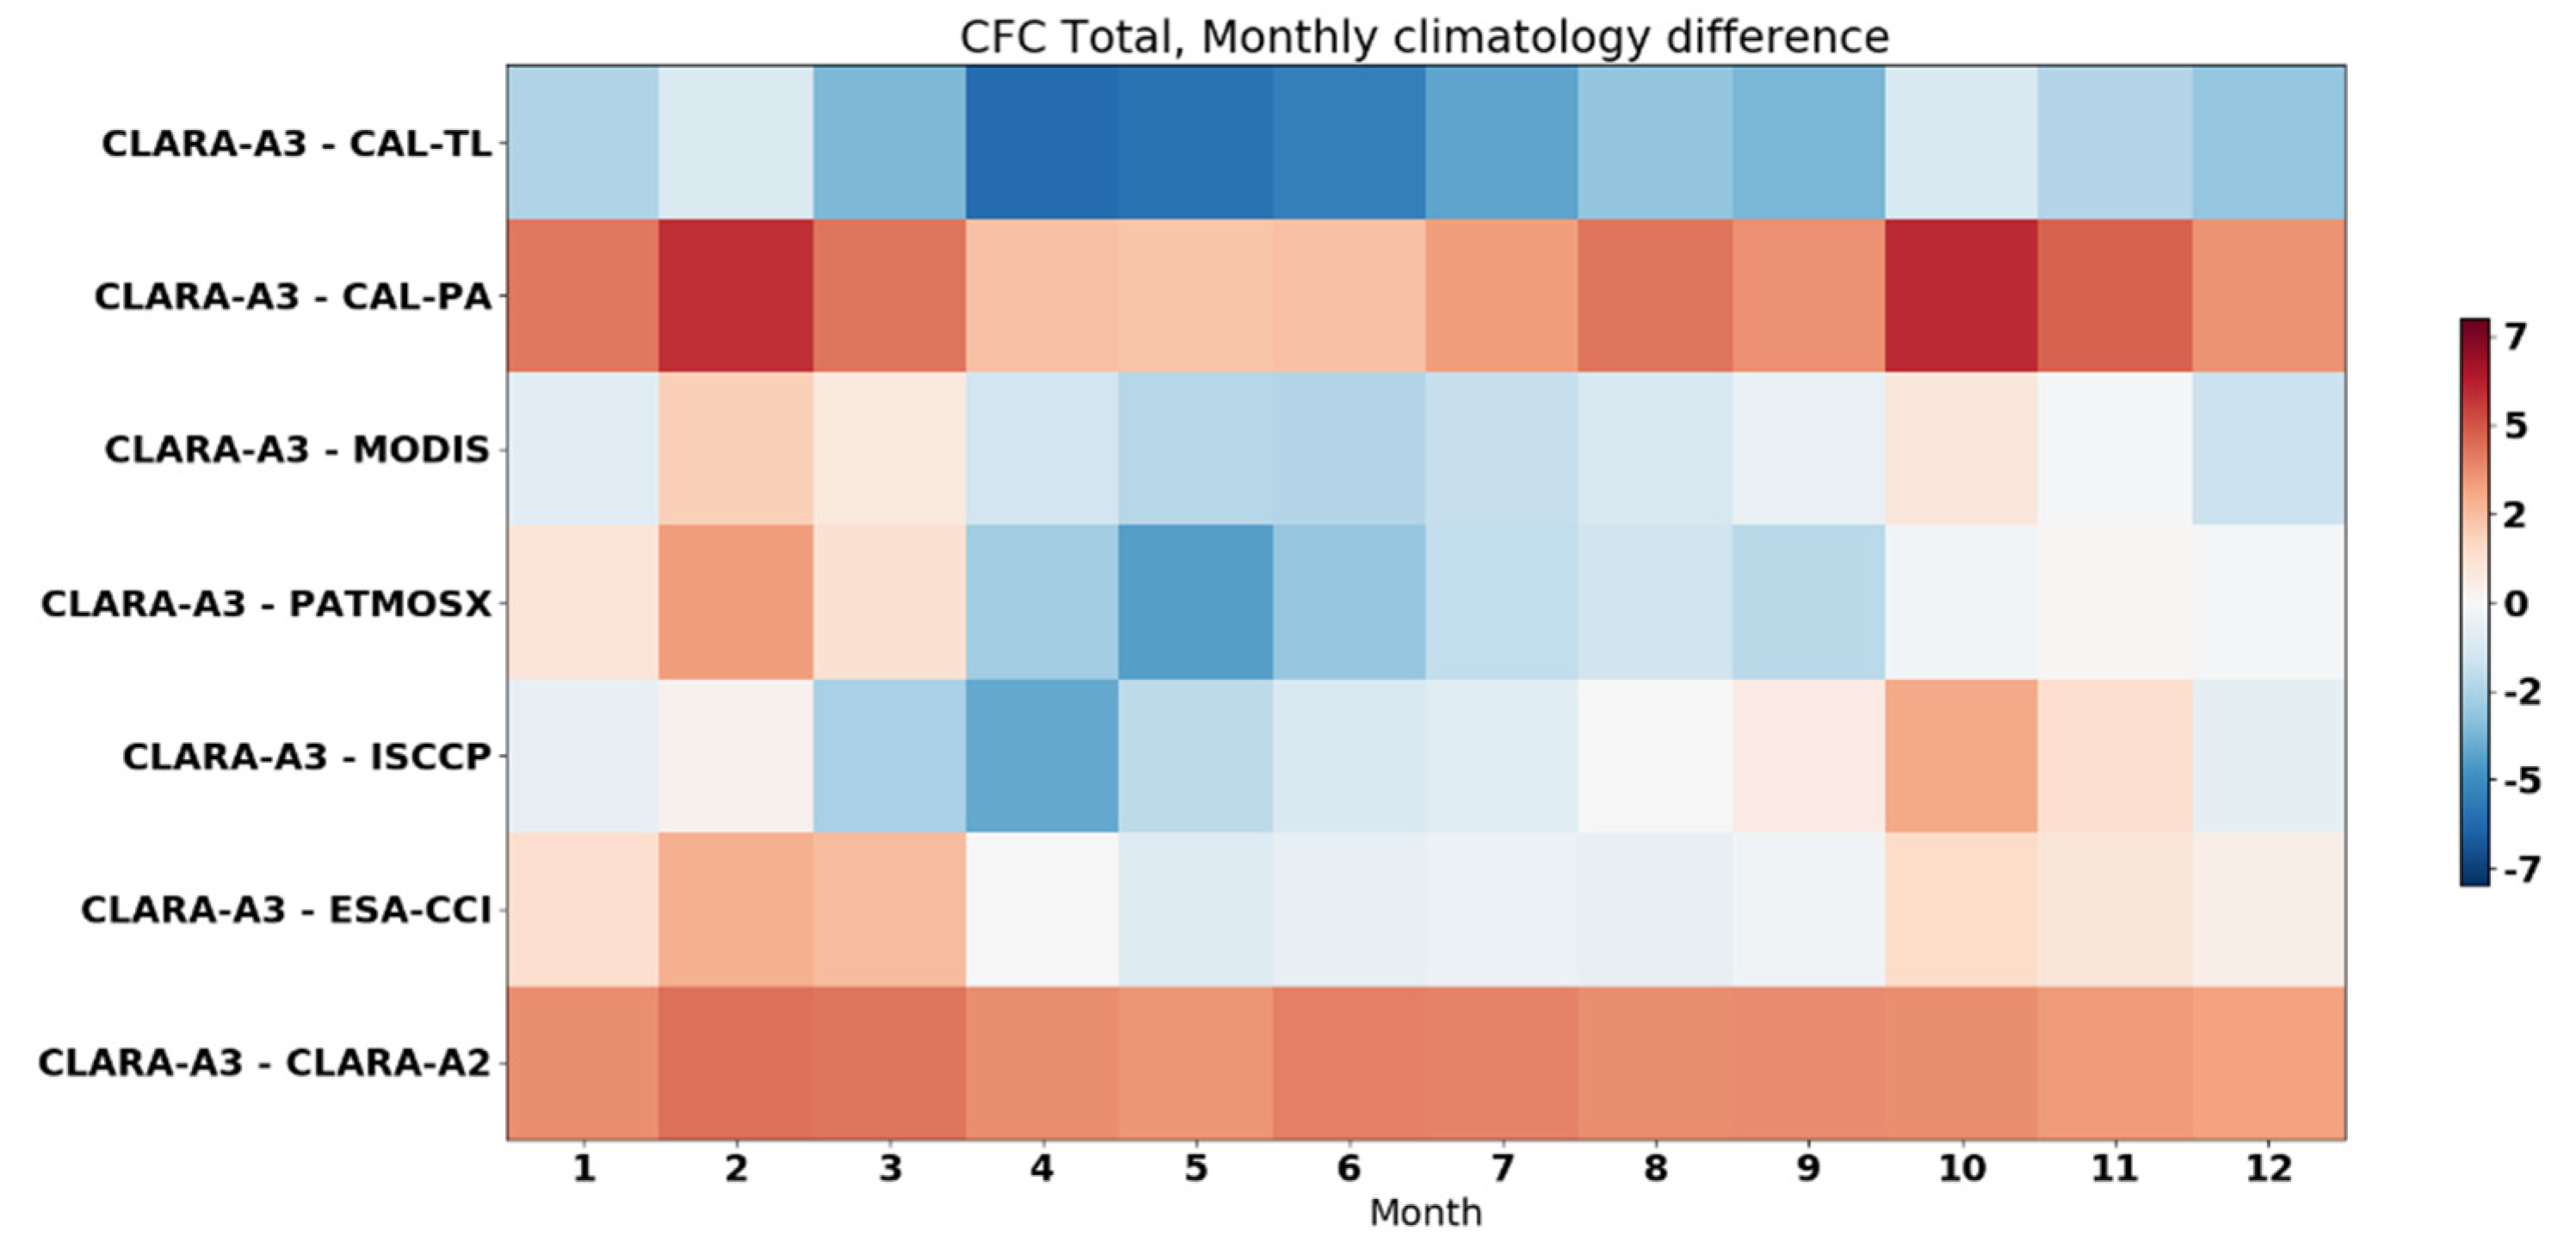
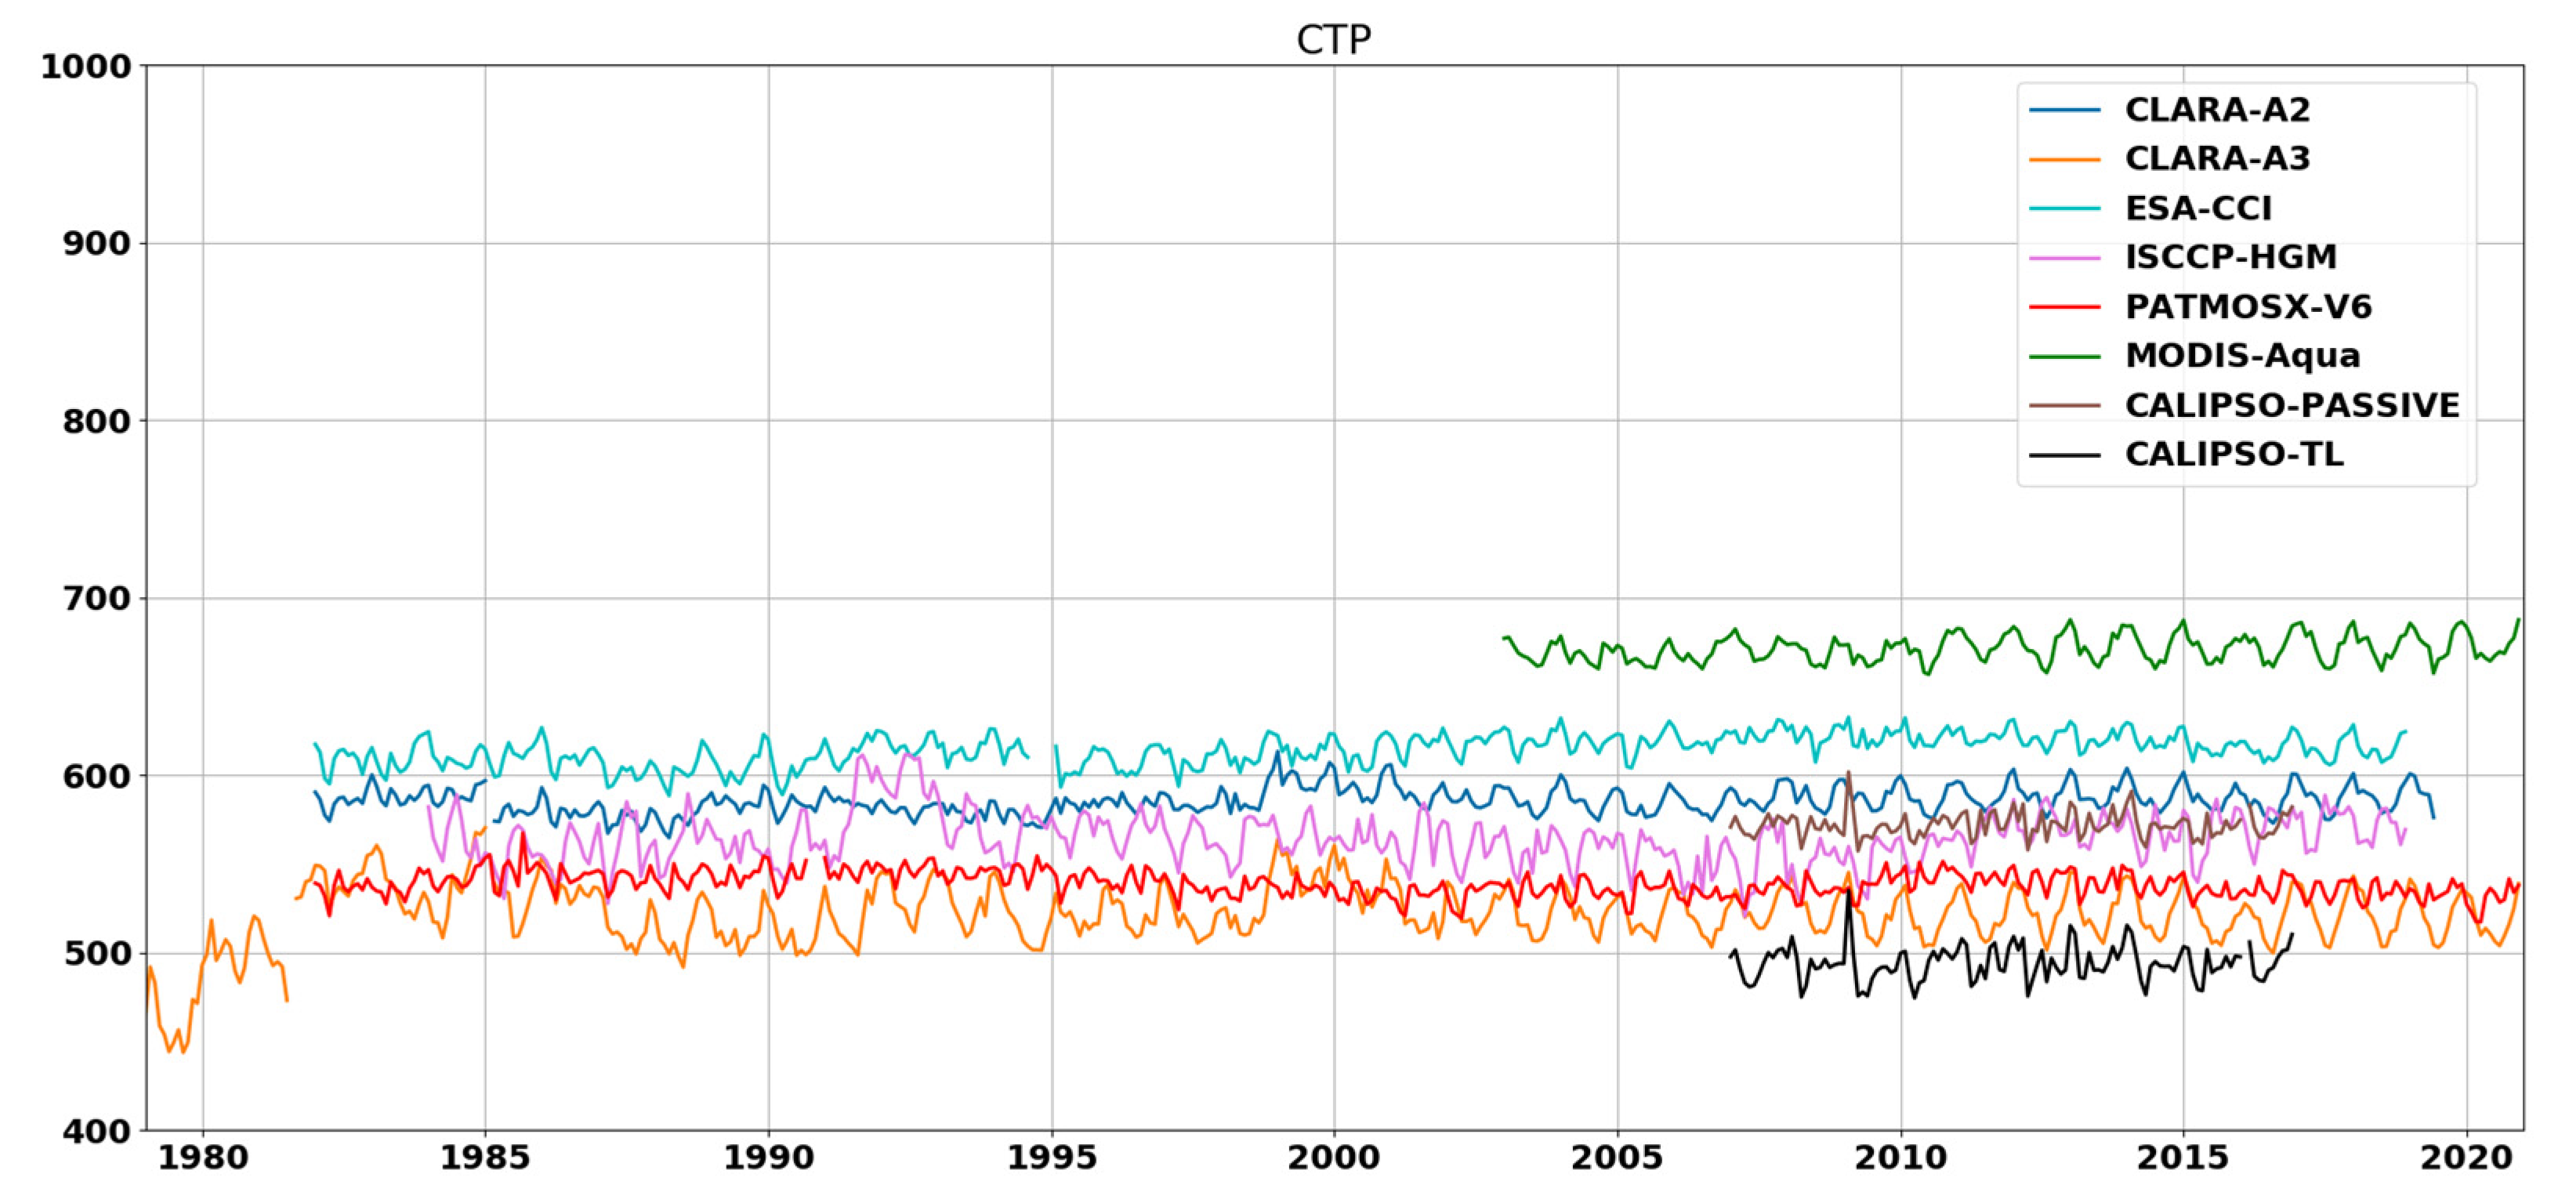
Several other satellite-based global cloud climatologies exist, and we have here compared CLARA-A3 CFC and CTP monthly mean values with results from the most up-to-date versions of the following data records:
ISCCP-HGM: The International Satellite Cloud Climatology Project (ISCCP) H-Series has provided a cloud CDR with monthly gridded results since 1983 [17,18]. Here, we used the ISCCP-HGM product as it provided the Level-3 monthly means. At the time of this evaluation, the ISCCP-HGM CDR (v01r00) data from 1983 through June 2017 were available, and a corresponding ICDR, including data through December 2018 (covering a total of 35 years), was also available.
PATMOS-x: This evaluation used the latest version (v06r00) of the PATMOS-x cloud CDR [9]. The daily Level-2b data are available at 0.1 × 0.1-degree resolution for each AVHRR-carrying satellite (separate data are available for the ascending and descending nodes). Note that an official Level-3 PATMOS-x product based on this latest version is unavailable. Therefore, we computed monthly Level-3 aggregations using a 50% threshold on the Level-2b cloud probability data to facilitate a fair comparison. The PATMOS-x version 6 data used here cover the period 1982–2020 (39 years).
ESA-CCI: The AVHRR-based cloud CDR (Version 3) derived in the framework of the ESA Climate Change Initiative [8] was also used in this evaluation. It covers the period from 1982 through 2018 (37 years) and includes only the data collected by the prime satellites carrying the AVHRR sensors. The Level-3 monthly CDR is available at 0.5 × 0.5-degree resolution.
MODIS: This study used the Level-3 monthly 1 × 1-degree cloud property products from the latest Collection 6.1 [19] derived from MODIS, onboard the Aqua satellite (product MYD08_M3). They cover the period from 2003 through 2020 (18 years).
CALIPSO–CALIOP: This study used version 1.00 of the CALIOP lidar Level-3 cloud product (1 × 1 degrees) derived for the Global Energy and Water Cycle Experiment (GEWEX) Cloud Assessment [20]. It reports different flavors of cloud property statistics. Two flavors, namely TopLayer and Passive, were used here. The TopLayer flavor provides cloud descriptions of the uppermost tropospheric cloud layer that the CALIOP sensor can see. These include sub-visual thin cirrus clouds that typically lie below the detection limit of passive sensors such as AVHRR. The Passive flavor, on the other hand, uses an optical depth threshold of 0.3 to provide cloud statistics to facilitate comparisons with the passive sensors. The data from this CALIPSO Level-3 GEWEX product covering 2007 through 2016 (10 years) were analyzed. Note that the dataset is defined using the same CALIOP Level 2 products used in [15].
Consequently, we carried out inter-comparisons of different climate data records in the same manner as in [10], but with more recent versions of the data records and several additional CDRs.

2.5. Evaluating Potential Changes in Low-Level Cloud Contributions at Low and Middle Latitudes

Deducing changes in low-level cloudiness from AVHRR data is not trivial; an accurate estimation of low-level cloudiness is impossible because of obscuring clouds at higher levels. Thus, the estimated amount of low-level clouds will always be an underestimate of the true amount. However, one has to consider that the cooling effect caused by low-level clouds is most significant when upper-layer clouds are absent. If higher clouds are present, especially if these are high and thin cirrus clouds, reflected sunlight and thermal radiation emitted from the low-level clouds might be absorbed by these higher clouds, and this can actually lead to a warming instead of a cooling of the system. Thus, to really see a significant cooling effect, we need to study cases in which low-level clouds are present and upper-level clouds are absent. During daytime, such cases lead to large amounts of solar radiation being reflected back into space, and most of this thermal radiation may radiate into space without significantly interacting with the atmosphere and clouds. This leads to a sizeable cooling effect.
Consequently, the contribution of low-level clouds to the total cloud cover is important, even if we cannot correctly depict all low-level clouds. Therefore, we will look at the geographical distribution and temporal evolution of the observable low-level cloud fraction over the CLARA-A3 period. Since the cooling effects should be most prominent at low- and mid-latitude areas (where the solar radiation input and the thermal radiation output are high), we have focused on these regions. In addition, we have separated land and ocean areas to see whether there are specific regions (e.g., oceanic marine stratocumulus areas) that have experienced more visible changes.

3. Results

3.1. Detailed Evaluation of Global and Regional Cloudiness from CALIPSO–CALIOP Data

Table 1 shows the validation results for CLARA-A3 based on collocated data from AVHRR and CALIPSO–CALIOP for 2010. This year was chosen since the data from this year were excluded from the training of the CMAPROB cloud-masking method. The Cloud Layer product (CLAY) version 4.20 [20,21] was used, and results were computed from the best complete matches (i.e., entire global orbits) between afternoon orbit satellites (i.e., NOAA-18 and NOAA-19) and the CALIPSO satellite. The best match here means a matchup with a minimum 5 min time difference between the observations of the two satellites. More details on the collocation procedure are given in [15]. To avoid including too many regional details while still enabling the identification of some regional variations, we show the overall results in Table 1 for four geographically fixed zonal regions, each region including contributions from both hemispheres (as defined in [13] and [15]): polar (above latitude 75°), high-latitude (latitude interval 45–75°), sub-tropical (latitude interval 10–45°), and tropical (within latitude 10°, here representing only the innermost part of the tropical region).
The validation scores in Table 1 clearly show how the cloud detection efficiency varies over the different regions. About 11% of all the CALIOP-detected clouds appear undetected globally, but most of the missed clouds belong to the tropical and polar regions. In the tropical region, an abundance of very thin cirrus clouds exists, and a large fraction of them are not detectable (i.e., subvisible) by AVHRR. In contrast, the problem in the polar region is that thick clouds may also be missed in the polar winter due to the absence of visible information and frequent near-surface temperature inversions. This explains the rather poor results for the polar region. It is noteworthy, however, that the results for the polar summer are much better and are almost comparable with results for the high-latitude region.
Table 2 shows the corresponding results obtained for CLARA-A2 [15] based on all available AVHRR–CALIOP matchups from 2006–2015. The cloud-masking method of CLARA-A2 was not trained using CALIOP data, which means that results from this period obtained using CALIOP data should describe the overall performance well. However, the CLARA-A2 validation effort limited the observation time difference to 3 min.
Comparing Table 2 with Table 1, we note an improvement in all scores globally and for almost all regions. Only for the tropical region do the bias and hit rate scores appear slightly worse. On the other hand, the bias and KSS show clear improvements. Our experience is that the KSS gives very robust information on product quality since it is less dependent on the actual distribution of clear and cloudy cases in the reference dataset. For this reason, we conclude that improvements can be seen over all parts of the globe since the KSS is higher in all regions. The polar region, however, is still challenging, as is indicated by its relatively poor scores.
It should be mentioned that the changed matchup tolerance between the CALIOP and AVHRR measurements, i.e., changing from 3 min for the CLARA-A2 validation in [15] to 5 min for the CLARA-A3 validation in the current study, had only a marginal effect on the results. This can be deduced by comparing these results with the CLARA-A3 prototyping results in [13], for which a 3 min tolerance was used. These results are largely repeated here.

3.2. Investigating the Cloud Detection Sensitivity (CDS) Parameter

The standard validation results above, based on a comparison with the binary CALIOP cloud mask, do not account for the fact that some CALIOP-detected clouds are subvisible to the AVHRR. By also considering the CALIOP-estimated optical thickness of clouds, it is possible to estimate the CDS parameter, as is explained in Section 2.2 and in [15]. Furthermore, by collecting a large number of AVHRR–CALIOP matchups globally, it is possible to estimate how this parameter varies geographically. Figure 1 shows the CDS parameter for CLARA-A3 calculated from almost 44 million matchups collected in the period 2006–2016.
Figure 1 clearly illustrates how much the cloud detection efficiency depends on the distinction between ocean and land surfaces. The AVHRR performs cloud detection over ice-free ocean surfaces very well, and, in many areas (i.e., over medium- and high-latitude oceans), almost as well as the cloud mask of the CALIOP cloud lidar. In some locations, the CDS values even fall below 0.05, meaning that the CLARA-A3 cloud mask is almost identical to the CALIOP unfiltered cloud mask. However, over tropical oceans, where the numbers of sub-visible cirrus clouds are high, the CDS values are consequently higher (i.e., in the interval 0.1–0.2).
Cloud detection over land surfaces is significantly less efficient, as is shown in Figure 1. The lower efficiency is due to the considerably higher land surface reflectance in the visible AVHRR channels which makes it harder to distinguish between clouds and land surfaces compared to detecting clouds over ocean surfaces. In particular, discerning the conditions over high-latitude areas with frequent snow- and ice-cover during the dark winter season is problematic. This problem is further enhanced by cold surface temperatures and surface temperature inversions which often make it difficult to distinguish clouds from the earth’s surface based exclusively on the information obtained from the infrared AVHRR channels. However, we emphasize that the results obtained over snow- and ice-covered surfaces during the polar summer are significantly better than those shown in Figure 1.
Figure 2 shows the differences in the CLARA-A3 CDS values compared with the corresponding results for CLARA-A2.
Although the global mean CDS slightly improves from 0.225 to 0.217 for CLARA-A3, the changes occur over a variety of different geographical regions. The good detection performance over the ice-free ocean has improved even further, especially over the Southern Ocean around the Antarctic continent, and over the Arctic Ocean. On the other hand, the results over land surfaces are essentially unchanged, and in some places (e.g., over Antarctica and Greenland), we even see some degradation (although the relative changes are small when Figure 2 is compared with Figure 1).

3.3. Results from Comparisons of CLARA-A3 Cloud Fraction Results with Other Cloud Climate Data Records

Figure 3 shows the CLARA-A3 cloud fraction results compared with six other CDRs (introduced in Section 2.4), including the results from the predecessor CLARA-A2, over the entire period 1979–2020.
According to all of the CDRs, the global mean CFC is close to 65% and fairly stable, even though we see a small negative trend when excluding seasonal variation. Only the ISCCP-HGM CDR gives a trend exceeding −1%/decade. A characteristic seasonal variation in global cloudiness, linked to the asymmetric distribution of land and ocean in the two hemispheres, is seen in most of the data records. The northern hemisphere has more land areas in tropical and sub-tropical regions than the southern hemisphere, and this leads to more convective cloudiness forming in the northern hemisphere (e.g., over India and Indonesia) during the monsoon periods and the passages of the Inter-Tropical Convergence Zone (ITCZ). The cloudiness maximum normally occurs between July and October in the northern hemisphere, slightly after the summer solstice.
Comparing CLARA-A3 with CLARA-A2, we note a general increase of about 2–3% in the estimated global cloudiness. This indicates that the CLARA-A3 results are improved compared with the CALIPSO–CALIOP observations, as is shown by the HR and bias scores in Table 1 and Table 2. The CLARA-A3 values now fall between the CALIPSO-PASSIVE and CALIPSO-TL results in Figure 3, in contrast to the CLARA-A2 results, which are even lower than the CALIPSO-PASSIVE results. This means that a large number of the very thin clouds additionally detected in the CALIPSO-TL dataset are now also detected in the CLARA-A3 dataset.
The differences observed in the geographical distribution of CFC between CLARA-A3 and the other datasets in Figure 3 are shown in Figure 4. Again, we note that, in general, more clouds are detected over ocean surfaces compared with CLARA-A2 (second panel from the left in the upper row). Over land, the changes are small or slightly negative.
Even if the best agreement is seen with PATMOS-x in Figure 3, there are still some regional differences (e.g., over Antarctica and over northern hemisphere land surfaces at high latitudes or in mountainous regions). The largest regional differences are seen in the MODIS and ISCCP data records. The boundaries between individual geostationary satellites and the boundaries between geostationary and polar satellites show up in the ISCCP results. CFC over land areas is obviously higher in the ISCCP and MODIS data records than in the CLARA-A3 data record. In addition, more clouds were detected over tropical and sub-tropical oceans in the MODIS data than in the CLARA-A3 data.
It is encouraging that the CLARA-A3 CFC is generally higher than the CALIPSO-Passive CFC and lower than the CALIPSO-TL CFC (as is indicated in Figure 3). Thus, a substantial number of clouds with an optical thickness lower than 0.3 are now detected in CLARA-A3.
The comparison results can be studied more thoroughly by looking at how the different CDRs relate to each other on average during each month of the year (Figure 5). This reveals some further details. For example, the differences in the number of clouds in CLARA-A3 compared with CLARA-A2 are more or less the same, regardless of the month. In contrast, the comparison with the CALIPSO-TopLevel results show a pronounced annual cycle, with the highest (negative) difference in the spring and early summer months of the northern hemisphere. Since cloud detection depends on how optically thin clouds are (as was explained earlier), this indicates that in spring and early summer there is a global abundance of very thin or subvisible clouds which the AVHRR has difficulty detecting. The reason for this abundance of thin clouds is discussed further in Section 4.

3.4. Detailed Evaluation of Cloud-Top Heights from CALIPSO–CALIOP Data

In this section, we show the validation results for cloud-top height from 2010 compared with the previous results for CLARA-A2 from the period 2006–2015.
Table 3 shows comparisons with the collocated CALIPSO–CALIOP detected cloud (i.e., the uppermost cloud layer), regardless of how optically thin the CALIOP-detected cloud layer is. The results are subdivided into three vertical cloud levels. The corresponding results for CLARA-A2 are given in Table 4.
It is clear from Table 3 and Table 4 that the results have improved significantly for CLARA-A3. The total bias is reduced to less than half of that for CLARA-A2. The improvement comes mainly from the much more accurate estimation of CTH for high-level clouds (i.e., the cloud tops are now more than 2 km higher than in CLARA-A2), but also from a reduction in the general overestimation of CTH for low-level clouds observed in CLARA-A2. The spread of the results has also improved, as is indicated by the reduced RMSE values.
The results shown in Table 3 are based on all common cloudy cases for CLARA-A3 and CALIPSO–CALIOP in 2010 observed by the NOAA-18 and NOAA-19 satellites. This means that cases of thin multi-layered clouds are also included. To obtain a more accurate idea of how well the CLARA-A3 CTH estimation works for individual cloud layers, we show in Table 5 the results for cases with exclusively single-layered clouds detected by the CALIOP cloud lidar. The results improve further with a near-zero bias for the total dataset and a reduction in all difference scores and all vertical levels. For example, the large improvement for high-level clouds shows that the CLARA-A3 CTH algorithm can also provide reasonable CTH estimations for very thin and high cloud layers.
Finally, to whether the CTH estimation for optically thick clouds also works satisfactorily, we compiled separate results for cases in which single cloud layers had an integrated optical thickness larger than 0.4. The results are shown in Table 6. As was expected, removing semi-transparent cloud layers improves most validation scores even further. The precision scores (i.e., MAE and RMSE) show particular improvement, indicating more robust results with smaller variability.

3.5. Results from Comparisons of CLARA-A3 Cloud-Top Pressure Results with Other Cloud Climate Data Records

Figure 6 shows the CLARA-A3 cloud top results (i.e., cloud-top pressure, CTP) compared with six other CDRs plus CLARA-A2. In accordance with the results presented in the previous section, the CLARA-A3 mean CTP values are significantly lower (indicating a higher CTH) than those of CLARA-A2. The difference of roughly −75 hPa is fairly constant over the whole period. The CTP values are fairly constant over the whole period for all of the CDRs, but mutual differences exist for most of them. The most remarkable feature is the high CTP values of the MODIS–Aqua CDR. However, a large part of this discrepancy is the result of the cloud-conservative approach used when calculating MODIS Level 3 products. This means that not all of the detected clouds are included in the Level-3 calculations, and thus many of the thinnest upper-level clouds are likely excluded. PATMOS-x shows the best agreement with CLARA-A3, but with a seasonal variation. The results of both of these CDRs lie between the results of the CALIPSO-PASSIVE and CALIPSO-TL data records.
CLARA-A3 is the only CDR with CTP estimations from the early TIROS-N and NOAA-6 satellites, but these results appear to be outliers in the CTP series. The reason for this is not currently understood and requires further study. However, since the CFC results appear fairly reasonable for these satellites in Figure 3, and since the CTP results of the other satellites with the original AVHRR/1 sensor do not stand out either, we suspect that there were some infrared calibration problems (e.g., a cold bias) affecting these two early satellites.
Geographical CTP differences between the CDRs are shown in Figure 7. We note the general decrease in CLARA-A3 CTP values compared with those of CLARA-A2, except for the regions with large marine stratocumulus near the west coasts of the continents, where changes are positive (second panel from the left in the upper row). This agrees well with the improvements deduced from CALIPSO–CALIOP comparisons (Table 3, Table 4 and Table 5). Changes are most prominent in the tropical and sub-tropical regions where now we even see mean CTP values for CLARA-A3 below 200 hPa. the best agreement is found with PATMOS-x, while most of the other CDRs generally show higher (ESA-CCI and ISCCP) or much higher (MODIS) CTP values. The results for CALIPSO-PASSIVE and CALIPSO-TL support the earlier conclusion that CLARA-A3 can now detect a substantial number of clouds optically thinner than 0.3. These clouds are often very high and are most prominently seen in the tropical region. The CTP values for these clouds retrieved from CLARA-A3 are also reasonable (i.e., they are located between the two CALIPSO variants).
As with the CFC results, we can look at the annual variation in CTP comparison results in Figure 8. Here, we do not see as much variation over the course of the year as ws seen in the case of CFC. We again conclude (assuming CALIPSO-TopLayer results to be the best reference for global cloud altitudes) that the CLARA-A3 results have improved considerably compared with those of CLARA-A2, and that they are now clearly better than the CALIPSO-Passive flavor. We can also see that CLARA-A3 and PATMOS-x have very similar results, with only small differences in the course of the year. The MODIS results stand out as being very different from those of CLARA-A3, but this probably has more to do with sampling and Level-3 averaging issues than with any clear weakness in the retrieval method (as was mentioned earlier).

3.6. Results from Studies on Potential Changes in Low-Level Cloud Contributions

The demonstrated improvements in cloud detection and cloud-top height assignment shown by CLARA-A3 strengthen the prospects of conducting studies concerning changes and trends in the contribution of clouds from different vertical levels. We will give just one example here regarding the contribution from low-level clouds (introduced in Section 2.5). Figure 9 shows the overall trends in observable CFC contributions (% per decade) of low-level clouds.
It is clear that the period under study is too short to permit the removal of the influence of typical El Nino/Southern Oscillation (ENSO) signatures on cloudiness in the tropical regions. Apparently, El Nino episodes were somewhat more frequent in the second half of the CLARA-A3 period, as is shown by the enhanced positive trend in the eastern part of the Pacific Ocean and the South Atlantic Ocean between South America and southern Africa. However, when discarding the core tropical region and the polar regions (where wintertime cloud detection is unreliable), we can see a small negative trend in the observable fraction of low-level clouds. The results for the various latitudinal zones (between 75° North and 75° South) are summarized in Table 7, and these results are also separated into land and ocean portions.
Typical El Nino-related features (positive trends) can be seen in the tropical zone and, to some extent, in the sub-tropical south zone (indifferent to slightly negative trends), but in all other zones, the trends are negative. The largest negative trends (all of which were found to be statistically significant) are found over oceans in the two middle latitude zones and in the sub-tropical north zone. Here, we have trends of approximately −0.5% per decade or 2% over the full period. Such a change is interesting and likely to have some impact on the radiation budget in these regions, especially in the sub-tropical north region, with high incoming solar radiation fluxes and high outgoing longwave radiation fluxes. It is noteworthy in this context that cloud detection is also most efficient over these regions with very low CDS values (according to Figure 1). In other words, the CFC values are more certain here than in other regions of the world where cloud detection is less efficient due to higher surface reflectances and colder surface temperatures. Thus, the trend estimations should be most reliable here, even if other factors (for example, variations in observation frequency and orbital drift effects) may influence the results.

4. Discussion

Validation studies of cloud detection efficiency and cloud-top height information have revealed further improvements in the new CLARA-A3 CDR compared with its predecessor, CLARA-A2. This improvement is mainly due to CLARA-A3 capitalizing on the high-quality information on clouds obtained from CALIOP on the CALIPSO satellite, which has provided invaluable input for the training of the cloud detection and cloud top retrieval systems. It has facilitated a shift from the traditional binary cloud-masking method to a new probabilistic approach. Even if improvements in cloud detection efficiency are not dramatic (compared with the results presented in [15]), other advantages are evident in this simple validation of an interpreted binary cloud mask. For example, access to cloud probabilities allows users to utilize cloud information in a stricter mode (i.e., in a clear conservative or cloud conservative mode) for applications that are very sensitive to cloud masking errors. This has enabled safer downstream processing of other CLARA-A3 products such as surface radiation budget components and surface albedo (as is explained in [12]). This detailed evaluation of the improved cloud detection sensitivity (CDS) parameter also has positive implications for other applications. The underlying method relies on calculating the probability of detection (POD) of a cloud with a specific optical thickness. Since these statistics are geolocated, it is possible to express POD as a function of optical depth and location anywhere on earth. These POD lookup tables form the basis of the CFMIP Observation Simulator Package (COSP) simulators for the CLARA data record ([22]), which can be used in climate model inter-comparisons. This simulator, initially developed for CLARA-A2, has now been updated to be valid for the new CLARA-A3 edition.
The motivation for defining the CDS parameter came mainly from the observation that the cloud detection limits of cloud screening methods have for a long time taken a very simple form, most often that of a fixed optical thickness threshold (e.g., cloud optical thickness 0.3, as used in the COSP ISCCP simulator [23]). However, it is obvious that the ability to detect clouds in satellite imagery depends to a large extent on the properties of the underlying surfaces. One should therefore expect quite substantial variability in the effectiveness of cloud detection, and our ambition was to find a measure that would describe this variation. We found it useful to use the optical depth value above which a majority (50%) of clouds are detected. Consequently, we observed that the CDS parameter should not be interpreted as a definitive limit above (or below) which all clouds are detected (or not detected). This situation (i.e., when the POD values go quickly from 0% to 100% when passing the optical thickness threshold of the CDS parameter) only occurs occasionally for locations with very low CDS values. In contrast, for locations with very high CDS values, there is normally only a gradual increase (or decrease) in POD values for increasing (or decreasing) cloud optical thicknesses. Therefore, the best way of describing the overall cloud detection ability at a particular location is to use the full range (or full profile) of the POD values as a function of cloud optical thicknesses. This has been applied in the CLARA-A3 simulator [22]. The long operation time of the CALIPSO satellite (much longer than the nominally expected lifetime) enabled the estimation of the CDS parameter globally with a fine horizontal resolution. This enabled the compilation of a large enough number of AVHRR/CALIOP collocations.
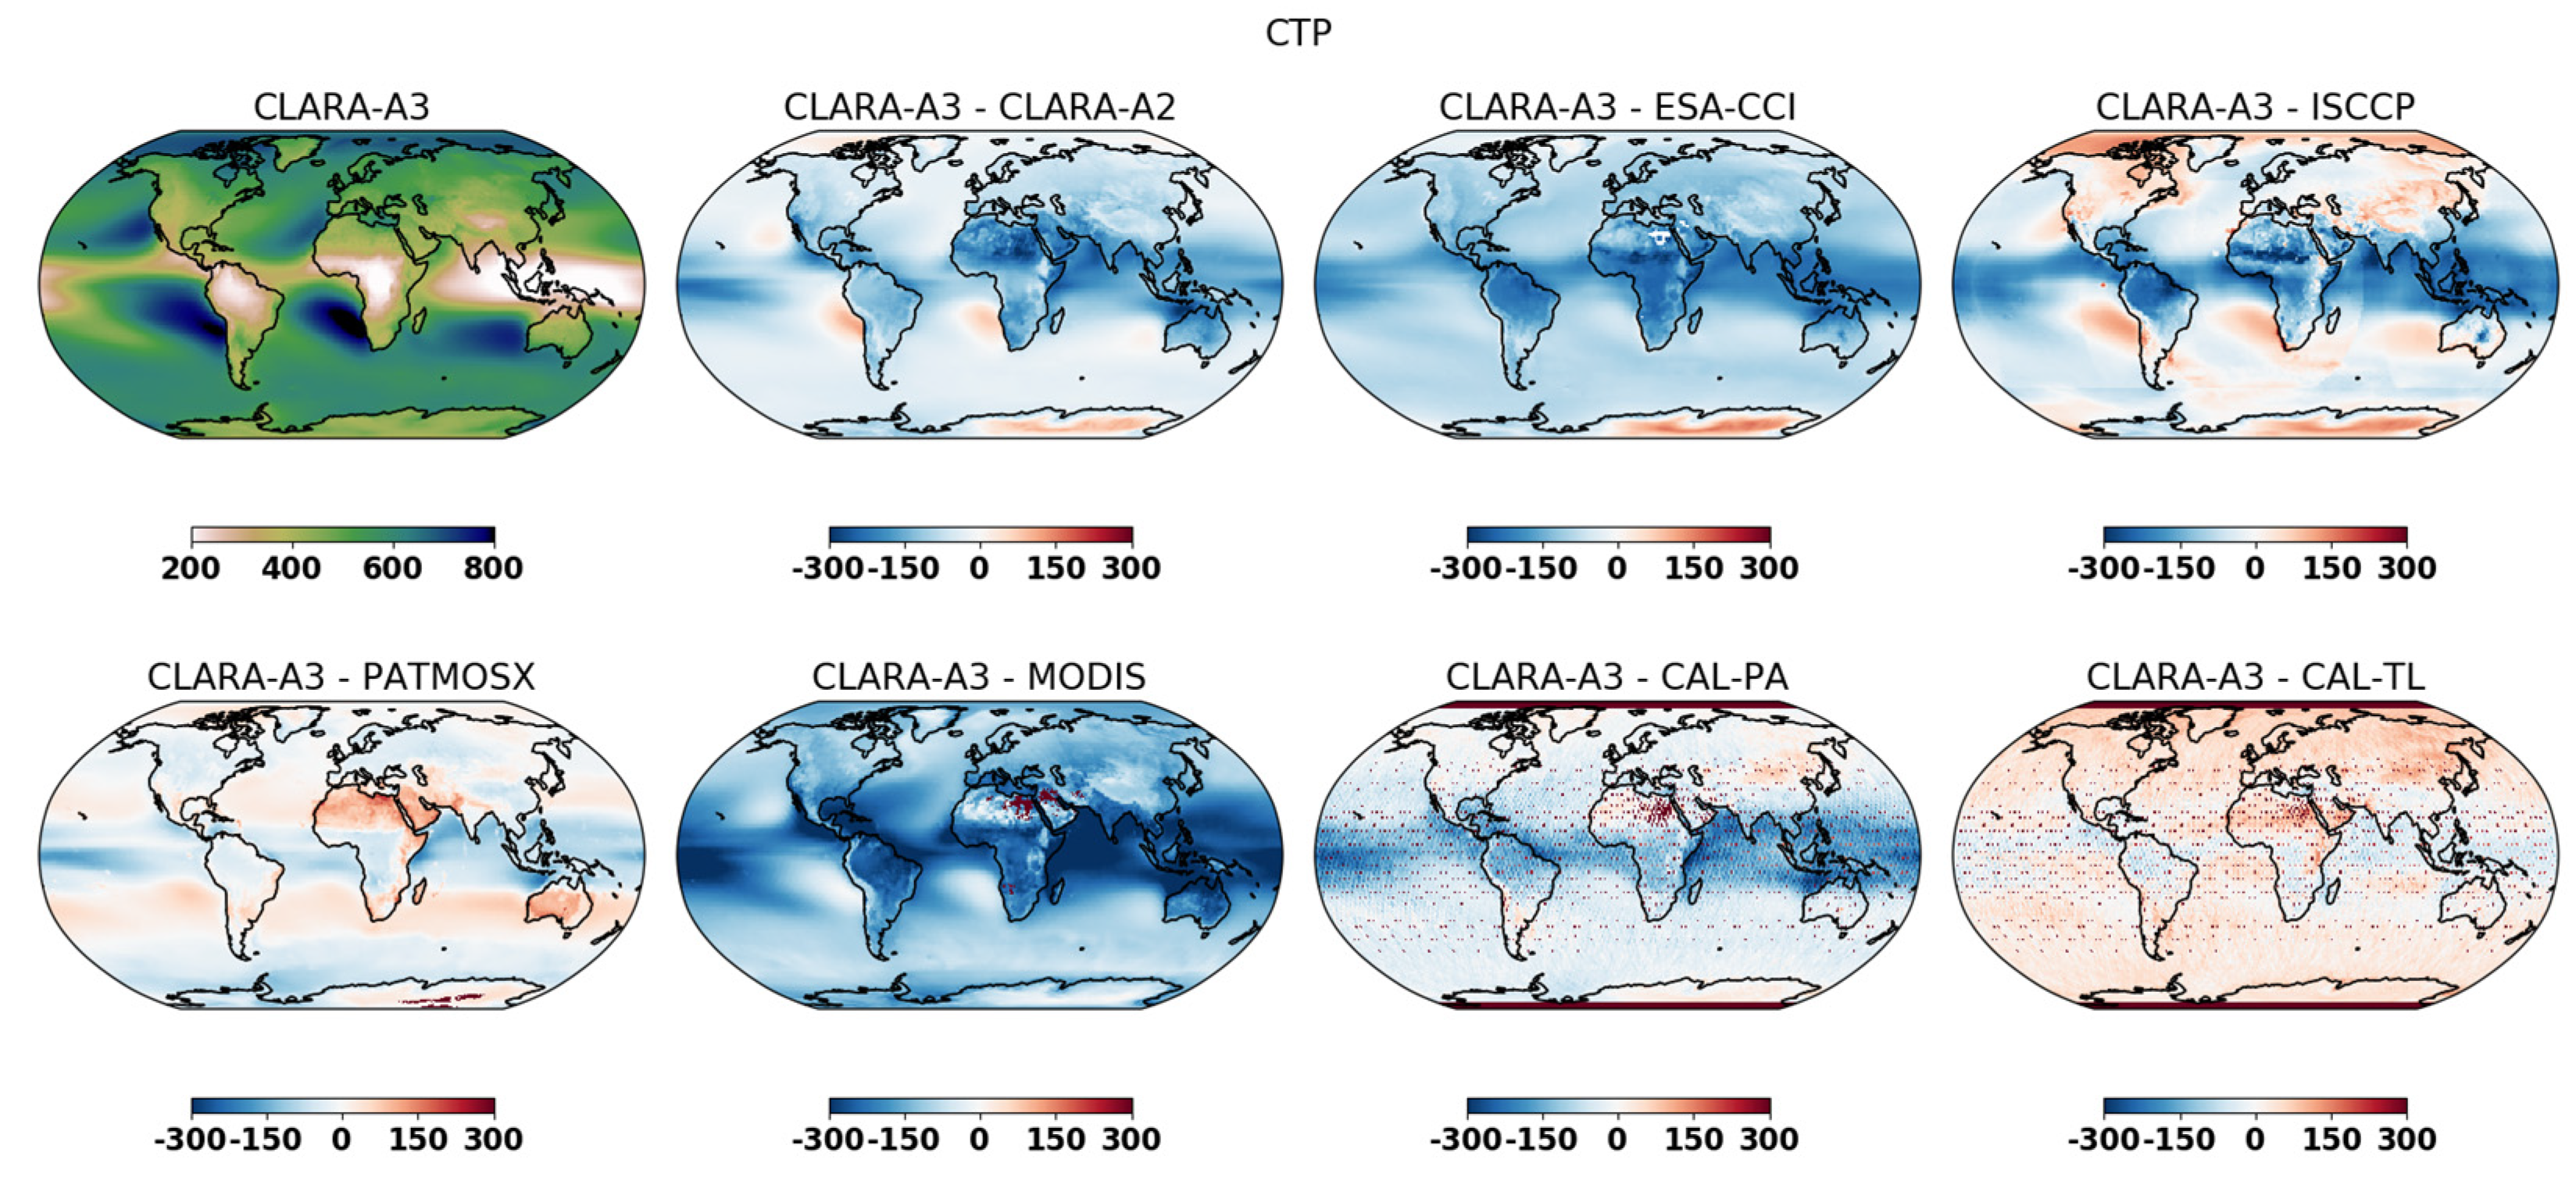
This evaluation of CFC and CTP parameters using plots of global averages and global difference distributions reveals many noteworthy features which require further investigation to be fully understood. However, for the globally averaged CFC parameter, we may conclude that the different CDRs have reached a better agreement on global cloudiness than in previous evaluations [10,24]. The range of the spread of CFC values has decreased, and there is now a stronger indication of relatively stable global CFC values with only a minimal negative trend over four decades. Questions remain concerning the first two satellites in the series, the Tiros-N and NOAA-6 satellites. Their CFC values are somewhat high (and reinforce previously found negative trends if included in the calculations), and their CTP values are much lower than those of the other satellites. The indication of a cold bias can be seen in the 11 µm channel of the Tiros-N AVHRR when compared with the corresponding HIRS channels ([25] The cold bias could explain the overestimated CFC and the underestimated CTP results. The seasonal variation in the CFC values (i.e., high values in the late summer or early autumn in the northern hemisphere) can be explained by the asymmetric distribution of land cover in the two hemispheres. This leads to excessive CFC values in the northern hemisphere linked to summer monsoons over India, Indonesia, and northern Africa. However, it is still uncertain how much of this variation can also be attributed to problems in cloud detection, e.g., to the underestimation of CFC during the polar winter, which primarily affects the South Pole region. Unfortunately, the CALIPSO–CALIOP observations cannot be used to verify this in the central parts of polar areas. The seasonal variation in the CTP parameter is more marked for some CDRs, especially CLARA-A3 and MODIS. Surprisingly, the PATMOS-x CDR does not show the same seasonal variation in CTP values. We suspect that his is because the new PATMOS-x CRD merges the results from the AVHRR and HIRS. Adding HIRS data probably improves the cloud detection capability of PATMOS-x, but the coarser resolution may lead to somewhat smoother results (despite applying a method to enhance the spatial resolution of the HIRS data). More studies are needed to confirm this. Here, we can only conclude that including HIRS data does not seem to lead to significantly better results than those obtained with CLARA-A3. The new ANN-based retrieval method in CLARA-A3 appears to have found additional, previously unused information in the AVHRR data that can be used for CTP retrieval.
The improvements in CFC and CTP product quality evident in CLARA-A3 triggered an attempt to estimate potential trends in the observable CFC contribution of low-level clouds. Any changes here could lead to substantial changes in the radiation balance at the earth’s surface and at the top of the atmosphere. However, the results are not conclusive because ENSO cycles heavily influence cloudiness in large regions where low-level clouds often occur. Nevertheless, a noteworthy mean negative trend of about −0.5% per decade over ocean surfaces in sub-tropical and mid-latitude regions exists. Further studies must be undertaken to determine the significance of these results and remove additional uncertainties. Such uncertainties include whether the presence of optically thin or optically thick clouds affect the changes in the observable fraction of low-level clouds. Investigating this requires revisiting all of the original level-2 products, since these include the necessary information on cloud optical thickness. However, this also necessitates separating cloudiness data according to nighttime and daytime conditions. Finally, further studies must also involve the surface and top of atmosphere radiation products in the CLARA-A3 CDR to determine the effects and trends of these radiation products. The radiation contribution from low-level clouds is only one of many factors contributing to the radiation budget. However, one should investigate whether the possible negative trend in low-level cloudiness over ocean surfaces found here is also accompanied by increasing trends in incoming solar radiation at the surface and decreasing trends in outgoing reflected solar radiation at the top of the atmosphere.

5. Conclusions

This study investigated the quality of global cloudiness (cloud fraction) and cloud-top height information in the CLARA-A3 CDR. Compared with its predecessor, CLARA-A2, we observed clear improvements in the detection of very thin clouds over most oceanic areas, particularly those in the tropical region, and over the Arctic Ocean. For land areas, the improvements were marginal, but the switch to a probabilistic approach has facilitated the use of cloud information when processing additional radiation and surface albedo products in the CLARA-A3 CDR.
The most prominent improvement was that observed in the CLARA-A3 cloud-top height product, which has significantly reduced the previous systematic underestimation of cloud-top altitudes. For high-level clouds, the improvement is better than 2 km when compared with the CALIOP cloud lidar. In addition, the tendency to overestimate the cloud tops of low-level clouds has been reduced. These improvements in the basic cloud products have improved the overall description of the three-dimensional distribution and the temporal evolution of global cloudiness, even if descriptions of the vertical extension of clouds is limited exclusively to describing the upper cloud boundary.
For demonstration purposes, and to capitalize on these improvements, we finally looked at the changes in the observable fraction of low-level clouds over the 42-year CLARA-A3 period. These clouds are though to play an essential role in a net cooling effect on the earth’s climate. The results are inconclusive since there are still visible features linked to the influence of ENSO modes. However, outside of the core tropical region and the polar areas (where cloud detection is still a challenge), a negative trend of about −0.5% per decade in low-level cloudiness was found over oceanic areas. Further studies are required to verify these findings, and these studies should incorporate additional cloud optical thickness information and consider the results of the CLARA-A3 surface and top-of-atmosphere radiation budget products.

Author Contributions

Conceptualization, K.-G.K.; methodology, K.-G.K. and A.D.; formal analysis, K.-G.K., A.D. and S.E.; writing—original draft preparation, K.-G.K.; writing—review and editing, K.-G.K., A.D. and S.E. All authors have read and agreed to the published version of the manuscript.

Funding

This work was performed within the EUMETSAT CM SAF framework and all authors acknowledge the financial support of the EUMETSAT member states.

Data Availability Statement

The data record DOI for CLARA-A3 is 10.5676/EUM_SAF_CM/CLARA_AVHRR/V003. Data and associated documentation (scientific references, algorithm theoretical basis documents, validation reports, and user manuals) are available through the following link: https://doi.org/10.5676/EUM_SAF_CM/CLARA_AVHRR/V003, (accessed on 7 June 2023). All intellectual property rights of the CM SAF CLARA-A3 products belong to EUMETSAT. The use of these products is granted to every interested user free of charge. If you wish to use these products, EUMETSAT’s copyright credit must be shown by displaying the words “copyright (year) EUMETSAT” on each of the products used.

Acknowledgments

The CALIOP V4.20 data were obtained from the NASA Langley Research Center Atmospheric Science Data Center at https://asdc.larc.nasa.gov/project/CALIPSO (accessed on 7 June 2023).

Conflicts of Interest

The authors declare no conflict of interest.

References

  1. Advanced Very High Resolution Radiometer. Available online: https://www.sciencedirect.com/topics/earth-and-planetary-sciences/advanced-very-high-resolution-radiometer (accessed on 2 January 2023).
  2. Klein, S.A.; Hall, A.; Norris, J.R.; Pincus, R. Low-Cloud Feedbacks from Cloud-Controlling Factors: A Review. Surv. Geophys. 2017, 38, 1307–1329. [Google Scholar] [CrossRef] [Green Version]
  3. Zelinka, M.D.; Zhou, C.; Klein, S.A. Insights from a refined decomposition of cloud feedbacks. Geophys. Res. Lett. 2016, 43, 9259–9269. [Google Scholar] [CrossRef]
  4. Ceppi, P.; Brient, F.; Zelinka, M.D.; Hartmann, D.L. Cloud feedback mechanisms and their representation in global climate models. WIREs Clim. Change 2017, 8, e465. [Google Scholar] [CrossRef]
  5. Wang, C.; Soden, B.J.; Yang, W.; Gabriel, A.; Vecchi, G.A. Compensation Between Cloud Feedback and Aerosol-Cloud Interaction in CMIP6 Models. Geoph. Res. Lett. 2021, 48, e2020GL091024. [Google Scholar] [CrossRef]
  6. Palmer, T. Short-term tests validate long-term estimates of climate change. Nature 2020, 582, 185–186. [Google Scholar] [CrossRef] [PubMed]
  7. Karlsson, K.-G.; Anttila, K.; Trentmann, J.; Stengel, M.; Fokke Meirink, J.; Devasthale, A.; Hanschmann, T.; Kothe, S.; Jääskeläinen, E.; Sedlar, J.; et al. CLARA-A2: The second edition of the CM SAF cloud and radiation data record from 34 years of global AVHRR data. Atmos. Chem. Phys. 2017, 17, 5809–5828. [Google Scholar] [CrossRef] [Green Version]
  8. Stengel, M.; Stapelberg, S.; Sus, O.; Finkensieper, S.; Würzler, B.; Philipp, D.; Hollmann, R.; Poulsen, C.; Christensen, M.; McGarragh, G. Cloud_cci Advanced Very High Resolution Radiometer post meridiem (AVHRR-PM) dataset version 3: 35-year climatology of global cloud and radiation properties. Earth Syst. Sci. Data 2020, 12, 41–60. [Google Scholar] [CrossRef] [Green Version]
  9. Foster, M.J.; Phillips, C.; Heidinger, A.K.; Borbas, E.E.; Li, Y.; Menzel, W.P.; Walther, A.; Weisz, E. PATMOS-x Version 6.0: 40 Years of Merged AVHRR and HIRS Global Cloud Data. J. Clim. 2022, 36, 1143–1160. [Google Scholar] [CrossRef]
  10. Karlsson, K.-G.; Devasthale, A. Inter-Comparison and Evaluation of the Four Longest Satellite-Derived Cloud Climate Data Records: CLARA-A2, ESA Cloud CCI V3, ISCCP-HGM, and PATMOS-x. Remote Sens. 2018, 10, 1567. [Google Scholar] [CrossRef] [Green Version]
  11. EUMETSAT CM SAF. Available online: www.cmsaf.eu (accessed on 2 January 2023).
  12. Karlsson, K.-G.; Stengel, M.; Meirink, J.F.; Riihelä, A.; Trentmann, J.; Akkermans, T.; Stein, D.; Devasthale, A.; Eliasson, S.; Johansson, E.; et al. CLARA-A3: The third edition of the AVHRR-based CM SAF climate data record on clouds, radiation and surface albedo covering the period 1979 to 2023. Earth Syst. Sci. Data Discuss. 2023. In Review. [Google Scholar] [CrossRef]
  13. Karlsson, K.-G.; Johansson, E.; Håkansson, N.; Sedlar, J.; Eliasson, S. Probabilistic Cloud Masking for the Generation of CM SAF Cloud Climate Data Records from AVHRR and SEVIRI Sensors. Remote Sens. 2020, 12, 713. [Google Scholar] [CrossRef] [Green Version]
  14. Håkansson, N.; Adok, C.; Thoss, A.; Scheirer, R.; Hörnquist, S. Neural network cloud top pressure and height for MODIS. Atmos. Meas. Tech. 2018, 11, 3177–3196. [Google Scholar] [CrossRef] [Green Version]
  15. Karlsson, K.-G.; Håkansson, N. Characterization of AVHRR global cloud detection sensitivity based on CALIPSO-CALIOP cloud optical thickness information: Demonstration of results based on the CM SAF CLARA-A2 climate data record. Atmos. Meas. Tech. 2018, 11, 633–649. [Google Scholar] [CrossRef] [Green Version]
  16. Karlsson, K.-G.; Johansson, E. On the optimal method for evaluating cloud products from passive satellite imagery using CALIPSO-CALIOP data: Example investigating the CM SAF CLARA-A1 dataset. Atmos. Meas. Tech. 2013, 6, 1271–1286. [Google Scholar] [CrossRef] [Green Version]
  17. Rossow, W.B. 2022: History of the International Satellite Cloud Climatology Project. WCRP Report 6/2022; World Climate Research Programme (WCRP): Geneva, Switzerland, 2022; p. 87. [Google Scholar] [CrossRef]
  18. Young, A.H.; Knapp, K.R.; Inamdar, A.; Hankins, W.; Rossow, W.B. The International Satellite Cloud Climatology Project H-Series climate data record product. Earth Syst. Sci. Data 2018, 10, 583–593. [Google Scholar] [CrossRef] [Green Version]
  19. Platnick, S.; Meyer, K.G.; King, M.D.; Wind, G.; Amarasinghe, N.; Marchant, B.; Arnold, G.T.; Zhang, Z.; Hubanks, P.A.; Holz, R.E.; et al. The MODIS Cloud Optical and Microphysical Products: Collection 6 Updates and Examples from Terra and Aqua. IEEE Trans. Geosci. Remote Sens. 2017, 55, 502–525. [Google Scholar] [CrossRef] [PubMed] [Green Version]
  20. CALIPSO Science Team, NASA/LARC/SD/ASDC: CALIPSO/CALIOP Level 2, Lidar 5 km Cloud Layer Product, V4-20 [Data Set]. NASA Langley Atmospheric Science Data Center DAAC. Available online: https://asdc.larc.nasa.gov/project/CALIPSO/CAL_LID_L2_05kmCLay-Standard-V4-20_V4-20 (accessed on 7 June 2023).
  21. Available online: https://asdc.larc.nasa.gov/project/CALIPSO/CAL_LID_L3_GEWEX_Cloud-Standard-V1-00_V1-00 (accessed on 7 June 2023).
  22. Eliasson, S.; Karlsson, K.-G.; Willén, U. A simulator for the CLARA-A2 cloud climate data record and its application to assess EC-Earth polar cloudiness. Geosci. Model Dev. 2020, 13, 297–314. [Google Scholar] [CrossRef] [Green Version]
  23. Jakob, C.; Klein, S.A. The role of vertically varying cloud fraction in the parametrization of microphysical processes in the ECMWF model. Q. J. R. Meteorol. Soc. 1999, 125, 941–965. [Google Scholar] [CrossRef]
  24. Stubenrauch, C.J.; Rossow, W.B.; Kinne, S.; Ackerman, S.; Cesana, G.; Chepfer, H.; Di Girolamo, L.; Getzewich, B.; Guignard, A.; Heidinger, A.; et al. Assessment of global cloud datasets from satellites: Project and Database initiated by the GEWEX Radiation Panel. Bull. Am. Meteorol. Soc. 2013, 23, 1031–1049. [Google Scholar] [CrossRef]
  25. EUMETSAT: PyGAC AVHRR FDR Release 1, EUMETSAT Validation Report. EUMETSAT. EUM/OPS/DOC/22/1282616, Version v1F. 2023. Available online: http://www.eumetsat.int (accessed on 7 June 2023).
Figure 1. Geographical distribution of the cloud detection sensitivity parameter (called “Detection Limit” in the figure) in an equal-area 300 km resolution Fibonacci grid. The CDS is the lowest cloud optical thickness for which the probability of detection is still equal to or higher than 50%. The color legend indicates the global mean CDS. The white color = 0.217.
Remotesensing 15 03044 g001
Figure 2. Geographical distribution of CDS differences between CLARA-A3 and CLARA-A2 (called “Detection Limit Difference” in the figure) in an equal-area 300 km resolution Fibonacci grid. Note that improvements in CDS values result in negative differences.
Remotesensing 15 03044 g002
Figure 3. Global cloudiness or cloud fractional cover (CFC) over the CLARA-A3 period 1979–2020. The CLARA-A3 results are compared with those of six other CDRs (described in Section 2.4) and the results from CLARA-A2.
Remotesensing 15 03044 g003
Figure 4. Global distribution of CFC (%) for CLARA-A3 (upper leftmost panel) and CFC differences between CLARA-A3 and all other CDRs in Figure 3. Differences have been calculated exclusively using data from the common periods of the respective data records.
Remotesensing 15 03044 g004
Figure 5. Mean CFC differences between CLARA-A3 and the other investigated CDRs as a function of month.
Remotesensing 15 03044 g005
Figure 6. Global mean cloud-top pressure (CTP, hPa) over the CLARA-A3 period from 1979 to 2020. CLARA-A3 results are compared with six other CDRs (described in Section 2.4) as well as previous results from CLARA-A2.
Remotesensing 15 03044 g006
Figure 7. Global distribution of CTP (hPa) for CLARA-A3 (upper leftmost panel) and CTP differences between CLARA-A3 and all other CDRs in Figure 6. Differences have been calculated exclusively using data from the common periods of the respective data records.
Remotesensing 15 03044 g007
Figure 8. Mean CTP differences between CLARA-A3 and the other investigated CDRs as a function of month.
Remotesensing 15 03044 g008
Figure 9. Geographical distribution of overall trends in the observable CLARA-A3 CFC contributions of low-level clouds (% per decade) from 1979 to 2020.
Remotesensing 15 03044 g009
Table 1. Summary of CALIOP validation scores for CLARA-A3. The table shows mean error (bias), hit rate (HR), and Hansen-Kuipers skill score (KSS) as global and regional (zonal) averages for independent validation data for the NOAA-18 and NOAA-19 satellites in 2010.
Area/RegionNumber of MatchupsBias (%)HR (%)KSS
Global7,040,474−11.482.10.68
Tropical786,829−18.078.80.67
Sub-Tropical2,778,030−8.384.80.72
High-Latitude2,497,471−8.485.10.69
Polar978,144−22.769.70.49
Table 2. Summary of CALIOP validation scores for CLARA-A2 (as reported by Karlsson and Håkansson, 2018). The table shows mean error (bias), hit rate (HR), and Kuipers skill score (KSS) as global and regional (zonal) averages for all validation data for the NOAA-18 and NOAA-19 satellites in the period 2006–2015.
Area/RegionNumber of MatchupsBias (%)HR (%)KSS
Global23,305,814−13.180.20.65
Tropical2,311,711−14.779.20.63
Sub-Tropical8,370,135−8.383.80.70
High-Latitude8,606,165−11.483.10.68
Polar3,984,770−26.267.00.47
Table 3. Summary of cloud-top height (CTH) validation scores for CLARA-A3 compared with CALIPSO–CALIOP uppermost cloud layers. The table shows the mean error (bias), mean absolute error (MAE), and root mean squared error (RMSE) for the NOAA-18 and NOAA-19 satellites during 2010.
Cloud LayersNumber of MatchupsBias (m)MAE (m)RMSE (m)
All clouds3,891,277−90416653238
Low-level clouds1,152,6902234301059
Medium-level clouds547,311649301620
High-level clouds2,191,276−173924984168
Table 4. Summary of cloud-top height (CTH) validation scores for CLARA-A2 compared with CALIPSO–CALIOP uppermost cloud layers. The table shows the mean error (bias) and root mean squared error (RMSE) for the NOAA-18 and NOAA-19 satellites during the period 2006–2015. Observe that the mean absolute error was not calculated in the CLARA-A2 study.
Cloud LayersNumber of MatchupsBias (m)MAE (m)RMSE (m)
All clouds13,221,285−2132-4302
Low-level clouds3,513,247561-1388
Medium-level clouds1,850,485−352-1578
High-level clouds7,068,344−4235-5713
Table 5. Summary of cloud-top height (CTH) validation scores for CLARA-A3 compared with those for CALIPSO–CALIOP for exclusively single-layered clouds. The table shows the mean error (bias) and root mean squared error (RMSE) for the NOAA-18 and NOAA-19 satellites during 2010.
Cloud LayersNumber of MatchupsBias (m)MAE (m)RMSE (m)
All clouds1,955,783−499292095
Low-level clouds927,6542444271069
Medium-level clouds301,1202667411441
High-level clouds727,009−55416463080
Table 6. Summary of cloud-top height (CTH) validation scores for CLARA-A3 compared with those for CALIPSO–CALIOP for exclusively single-layered clouds with a cloud optical thicknesses above 0.4. The table shows the mean error (bias) and root mean squared error (RMSE) for the NOAA-18 and NOAA-19 satellites during 2010.
Cloud LayersNumber of MatchupsBias (m)MAE (m)RMSE (m)
All clouds1,681,1662076251229
Low-level clouds835,583177368925
Medium-level clouds272,9282906511285
High-level clouds572,6552129871550
Table 7. Overall trends in observable CFC contribution from low-level clouds (% per decade) over the CLARA-A3 period (1979–2020) sub-divided into latitudinal bands and land and ocean portions. Statistically significant trends (calculated using Mann–Kendall tests) are marked with (X).
Latitudinal ZoneTotal (%/Decade)Land (%/Decade)Ocean (%/Decade)
Middle Latitudes North (45–75°N)−0.414 (X)−0.263 (X)−0.451 (X)
Sub-Tropical North (10–45°N)−0.355 (X)−0.224−0.456 (X)
Tropical (10°S–10°N)+0.116+0.111+0.151
Sub-Tropical South (10–45°S)−0.066−0.169−0.060
Middle Latitudes South (45–75°S)−0.541 (X)−0.114−0.591 (X)
Disclaimer/Publisher’s Note: The statements, opinions and data contained in all publications are solely those of the individual author(s) and contributor(s) and not of MDPI and/or the editor(s). MDPI and/or the editor(s) disclaim responsibility for any injury to people or property resulting from any ideas, methods, instructions or products referred to in the content.

