

Surface Soil Moisture Retrieval of China Using Multi-Source Data and Ensemble Learning
College of Hydrology and Water Resources, Hohai University, Nanjing 210098, China
*
Author to whom correspondence should be addressed.
Remote Sens. 2023, 15(11), 2786; https://doi.org/10.3390/rs15112786
Submission received: 19 April 2023
/
Revised: 20 May 2023
/
Accepted: 24 May 2023
/
Published: 26 May 2023
(This article belongs to the Special Issue Advances in Remote Sensing of Ecohydrology)
Abstract
:Large-scale surface soil moisture (SSM) distribution is very necessary for agricultural drought monitoring, water resource management, and climate change research. However, the current large-scale SSM products have relatively coarse spatial resolution, which limits their application. In this study, we estimate the 1 km daily SSM in China based on ensemble learning using a multi-source data set including in situ soil moisture measurements from 2980 meteorological stations, MODIS Surface Reflectance products, SMAP (Soil Moisture Active Passive) soil moisture products, ERA5-Land dataset, SRTM DEM and soil texture. Among them, in situ measurements are used as independent variables, and other data are used as dependent variables. In order to improve the spatio-temporal completeness of SSM, the missing value in SMAP soil moisture products were reconstructed using the Discrete Cosine Transformation-penalized Partial Least Square (DCT-PLS) method to provide spatially complete background field information for soil moisture retrieval. The results show that the reconstructed soil moisture value has high quality, and the DCT-PLS method can fully utilize the three-dimensional spatiotemporal information to fill the data gaps. Subsequently, the performance of four ensemble learning models of random forest (RF), extremely randomized trees (ERT), extreme gradient boosting (XGBoost), and light gradient boosting machine (LightGBM) for soil moisture retrieval was evaluated. The LightGBM outperformed the other three machine learning models, with a correlation coefficient (R2) of 0.88, a bias of 0.0004 m³/m³, and an unbiased root mean square error (ubRMSE) of 0.0366 m³/m³. The high correlation between the in situ soil moisture and the predicted values at each meteorological station further indicate that LightGBM can well capture the temporal variation of soil moisture. Finally, the model was used to map the 1 km daily SSM in China on the first day of each month from May to October 2018. This study can provide some reference and help for future long-term daily 1 km surface soil moisture mapping in China.

1. Introduction
Surface soil moisture (SSM) is an important parameter in meteorology, hydrology, agronomy, etc., and it affects global water and energy budgets by controlling the redistribution of rainfall into infiltration, runoff, soil infiltration, and evapotranspiration [1]. Accurate estimation of soil moisture is very important, which can be used for agricultural irrigation scheduling, rainfall estimation, and flood forecasting [2]. In addition, soil moisture can also enhance our understanding of the land–atmosphere energy exchange process to help us further improve physical models such as hydrology and climate [3].
Up to now, soil moisture observation methods mainly include in situ observations, remote sensing observations, and land surface modeling. Conventional in situ observations have high observation accuracy, but the high time and cost make it difficult to monitor soil moisture in large areas. The high temporal and spatial heterogeneity of soil moisture due to the influence of climate type, land cover, topography and other factors indicates that large-scale soil moisture monitoring is necessary [4]. Remote sensing technology, which has the advantages of fast timeliness, wide monitoring range, and long-term dynamic monitoring, solves the shortcomings of traditional methods and provides an effective method for obtaining large-scale soil moisture information [5]. So far, many methods of soil moisture estimation at different spatial and temporal scales have been developed, including the methods based on the global scale [6,7], the watershed scale [8,9] and the field scale [10,11]. In addition, these methods can also be classified into optical-based methods, thermal-infrared-based methods, and microwave-based methods depending on the sensors used. Optical methods (wavelengths between 350 and 2500 nm) mainly use the optical reflectance characteristics of soil [12] or calculate related SSM indices [13,14] to retrieve soil moisture. However, optical signals are easily affected by clouds and vegetation. Meanwhile, most of the existing methods are based on empirical models, making it difficult to apply them on a large scale. The thermal infrared methods (wavelength between 3500 and 14,000 nm) mainly use thermal inertia or combines thermal infrared data and optical vegetation index data for the estimation of soil moisture [15]. The methods of combining optical and thermal infrared data have been widely used, including the triangulation method [16] and the trapezoidal method [17]. However, due to the influence of spatial heterogeneity, constructing an accurate feature space often requires some very complicated parameters. Microwave methods (wavelength between 5 and 1000 mm) are divided into active microwave methods and passive microwave methods, which have become the most important means of remote sensing quantitative inversion of soil moisture. Satellite sensors that have been used for soil moisture retrieval include Soil Moisture Ocean Salinity (SMOS) [18], Advanced Microwave Scanning Radiometer 2 (AMSR2) [19], Soil Moisture Active Passive (SMAP) [20], and Microwave Radiation Imager (MWRI) onboard the Fengyun-3D (FY-3D) satellite [21]. In addition, soil moisture data sets can also be obtained based on land surface models or data assimilation systems. Soil moisture products currently available based on these methods include the Global Land Data Assimilation System (GLDAS) soil moisture data [22], the China Meteorological Administration Land Data Assimilation System (CLDAS) soil moisture data [2], ERA5-Land dataset [23], SMAP Level-4 (L4) surface, and root zone soil moisture data [24]. The biggest advantage of land surface model estimation of soil moisture is that the average soil moisture of each layer can be obtained. However, it usually has a coarse spatial resolution and cannot provide finer soil moisture information, which limits its application. Moreover, the model structure, meteorological forcing data, and model parameters also make the soil moisture obtained using the land surface model have some uncertainties [25].
Each method has its own advantages and disadvantages, but it is difficult to meet the needs of practical applications. At present, many studies have produced spatially complete soil moisture products with fine spatial resolution by integrating multi-source observation data and model output data. Jin et al. [26] proposed a Geographically Weighted Area-To-Area Regression Kriging (GWATARK) algorithm to spatially downscale the passive microwave remote sensing data, and combined the result with microwave assimilated soil moisture data to obtain the time-continuous 1 km soil moisture product of the Qinghai-Tibet Plateau. Djamai et al. [27] combined the DISaggregation based on Physical And Theoretical scale Change (DISPATCH) and the Canadian Land Surface Scheme (CLASS) to estimate the soil moisture with a spatial resolution of 1 km under cloudy weather. Long et al. [28] integrated CLDAS soil moisture data, quality remotely sensed LST, and other surface variables into a random forest model to obtain spatially complete daily-scale soil moisture data in the North China Plain. These studies both proved the potential of multi-source data integration to obtain spatially complete and time-continuous soil moisture.
In the past few decades, machine learning has been widely used in the field of soil moisture due to its excellent nonlinear fitting ability, especially ensemble learning, which reduces variance or bias through the integration of multiple machine learning models to improve the predictive ability of the model [29]. Wei et al. [30] used the random forest algorithm to downscale the SMAP soil moisture data of the Iberian Peninsula based on MODIS optical thermal infrared data, and the results showed that RF could make a good improvement on SMAP. Zhang et al. [31] integrated in situ measurement data, reanalysis data, and remote sensing data to estimate soil moisture based on RF and XGBoost. The results showed that XGBoost was slightly better than RF. Das et al. [29] used three ensemble learning methods of bagging, boosting, and stacking to invert surface soil moisture in semi-arid areas. The stacking method improved the prediction of the model by reducing model overfitting and the deviation of each base learner. These studies demonstrate the reliability of soil moisture estimation using ensemble learning methods. However, the performance of ensemble learning models is limited by the accuracy of the training dataset, the accuracy of soil moisture products can be better improved by integrating high-precision ground measurement data [31]. So far, the existing research focuses more on the regional scale, and there are few studies on the retrieval of large-scale soil moisture in China. Meanwhile, the studies involving the Chinese region only used a small number of Chinese regional in situ measurements to construct and evaluate these models, which cannot strongly prove the performance of the model in the Chinese region.
In order to better take advantage of the high accuracy of in situ measurements, the soil moisture data of 2980 stations provided by the China Meteorological Administration and some auxiliary data were combined to generate spatially continuous and highly accurate 1 km surface soil moisture products. The specific content include: (1) using in situ measurements as the target variable, remote sensing data and reanalysis data as auxiliary variables, based on random forest, extreme random tree, XGBoost, and LightGBM to retrieve the soil moisture in China; (2) comparing the performance of the four models; and (3) identifying the most important covariates for soil moisture estimation. The results of this study are helpful for monitoring of spatially continuous surface soil moisture and water resources management in China.
2. Materials and Methods
2.1. Data Source and Preprocess
2.1.1. Remote Sensing Datasets
Table 1 lists the information on the satellite observation data used in this study. Visible and thermal infrared data were obtained using the Aqua MODIS eight-day reflectance product (MYD09A1) from the Level-1 and Atmosphere Archive & Distribution System (LAADS) Distributed Active Archive Center (DAAC) and TRIMS LST from the National Tibetan Plateau Data Center (TPDC), respectively. The pixels with the highest quality in MYD09A1 were selected through the quality control file to calculate Normalized Vegetation Index (NDVI), Distance Drought Index (DDI), and Normalized Difference Water Index (NDWI) in China. The Savitzky-Golay (S-G) filter was used to eliminate the noise in the data. Subsequently, these filtered data are interpolated using the spline method to obtain daily values. The TRIMS LST data adopt a satellite thermal infrared remote sensing-reanalysis data integration method based on a new surface temperature time decomposition model [32]. This method makes full use of the high-frequency component, low-frequency component, and spatial correlation of surface temperature provided by satellite thermal infrared remote sensing and reanalysis data, and finally reconstructs a high-quality all-weather surface temperature dataset. In addition, the input data of this method are Aqua MODIS LST products, so TRIMS LST and MYD09A1 match in time (01:30, 13:30).
Passive microwave products are from NASA National Snow and Ice Data Center (NSIDC) SMAP L3 Version-8 soil moisture product. The data are obtained from the observation of the L-band (1.41 GHz) radiometer mounted on the SMAP satellite, which provides daily soil moisture products of 0–5 cm on the soil surface, with a spatial resolution of 36 km. Soil moisture is retrieved from the data of two different orbits, namely SMAP AM (the descending orbit data at 6:00 AM local time) and SMAP PM (the ascending orbit data at 6:00 PM local time). Although the SMAP soil moisture data have a relatively coarse spatial resolution, it can still provide information about the average soil moisture conditions over a large area [31]. Therefore, we also use it as the input variable of the model in this study. Meanwhile, pixels with high quality flags are preserved based on quality control files. Due to the orbit of the satellite and the influence of the earth’s rotation, the soil moisture data provided by SMAP is always striped. It is difficult to obtain the soil moisture data of the entire China region on the same day. Therefore, we used Discrete Cosine Transformation-penalized Partial Least Square (DCT-PLS) [38] to interpolate the missing areas of SMAP data (Section 2.2.1). Previously, Zhang et al. [39] used the DCT-PLS method to reconstruct AMSR2 (Advance b d Microwave Scanning Radiometer 2) soil moisture data. The results showed that this method better capture the spatial distribution characteristics of soil moisture, and the reconstructed data improve the availability of soil moisture products.
2.1.2. ERA5-Land Reanalysis Data
ERA5-Land soil moisture data come from the European Center for Medium-Range Weather Forecasts (ECMWF), which is a replay of the land part of the ERA5 climate reanalysis [23]. Compared with ERA, ERA5-Land has a higher spatio-temporal resolution. The development of ERA5-Land is not coupled with the atmospheric module of the ECMWF Integrated Forecast System (IFS), so it can be updated quickly without data assimilation [40]. The ERA5 provides hourly soil moisture products with a spatial resolution of 0.1° × 0.1° at the depths of 0–7 cm, 7–28 cm, 28–100 cm, and 100–289 cm. Zhang et al. [31] generated accurate surface soil moisture products on a global scale based on the ERA5-Land reanalysis data. Therefore, the soil moisture of 0–7 cm was selected for the training and verification of the model in this study, and the average value of the soil moisture at 13:00 and 14:00 was calculated every day to match the time of other data. In addition, the accuracy of ERA5 soil moisture data was evaluated based on the in situ measurements before inversion to ensure the reliability of ERA5 soil moisture data in China.
2.1.3. Topographic Data
This study used DEM data (https://lpdaac.usgs.gov/, accessed on 18 April 2023) with a spatial resolution of 90 m from NASA’s SRTM (Shuttle Radar Topography Mission) to provide relevant topographic information for soil moisture inversion. The data cover 80% of the land area except Antarctica and the land near the North Pole, which is incomparable to the elevation data obtained using conventional ground measurement methods. The SRTM DEM has been widely used in the field of soil moisture [26,29,30].
2.1.4. Soil Properties Data
The dataset of soil hydraulic and thermal parameters of Sun Yat-Sen University Land-Air Interaction Research Group (http://globalchange.bnu.edu.cn/, accessed on 18 April 2023) provides various depths (0–5 cm, 5–15 cm, 15–30 cm, 30–60 cm, 60–100 cm, 100–200 cm) soil hydraulic and thermal parameter data in China. The dataset uses the multiple PTFs (Pedotransfer functions) method to develop global high-resolution soil characteristic data based on the GSDE and Soil Grids soil component database [41], which is better than the traditional lookup table methods in capturing spatial heterogeneity. We extracted the sand, silt, and clay data of 0–5 cm to construct the model in this study.
2.1.5. In Situ Measurements
The soil moisture data measured at 2980 meteorological stations from the National Meteorological Information Center was used to train and validate the soil moisture model. These stations automatically monitor soil moisture at depths of 0–10 cm, 10–20 cm, 20–30 cm, 30–40 cm, 40–50 cm, 50–60 cm, 60–80 cm, and 80–100 cm. The distribution of stations covers the whole of China (Figure 1), and most of them are distributed in the North China Plain and the Sichuan Basin, while the stations in the Qinghai-Tibet Plateau and Xinjiang are relatively sparse. We mainly used the data at the depth of 0–10 cm from May to October 2018 for model training and verification. In addition, the daily soil moisture measurements at 13:00 and 14:00 were also averaged to match the transit time (13:30) of the MODIS Aqua satellite in the Chinese region.
2.2. Model Design
2.2.1. Data Reconstruction Method
DCT-PLS was originally used to smooth missing data in one or more dimensions to reduce experimental noise and small-scale information [38]. The algorithm is mainly based on the residual sum of squares and the penalty term in the penalized least squares method to balance the fidelity and roughness of the data. Garcia [38] et al. showed that for data with equal intervals, penalized least squares regression can be performed using DCT. Compared with the traditional left matrix division, this method has lower computational complexity. In addition, the reconstruction of missing data can be achieved by assigning the weight value of missing data to 0 (w = 0). The principle of DCT-PLS is briefly introduced below; for details, please refer to Garcia [38] et al.
The main objective of the DCT-PLS method is to minimize
where and represent the predicted value of the model and the original values, respectively. represents the weight matrix specifying the weight values of different positions. denotes the Euclidean norm. controls the degree of smoothness, and as increases, the smoothness of increases accordingly. represents a tridiagonal square matrix. When dealing with data with uniform spatial distribution, can be expressed as
The result after minimizing is
where , which is the hat matrix. and is the identity matrix. The final solution of this formula can be expressed using DCT and IDCT as
where represents the iteration value of . represents the filter tensor, and the three-dimensional filter tensor can be expressed as
where and is the component along the dimension and the number of elements along the dimension.
The accuracy of the DCT-PLS method depends on the selection of smoothing parameters, and a high value will easily lead to the loss of high-frequency components, so the value of should be small enough when constructing the model. To further improve the accuracy of the algorithm, we also chronologically integrated the SMAP AM and PM data for reconstruction.
2.2.2. Machine Learning Models
The four models used in this study, including RF, ERT, XGBoost, and LightGBM, belong to ensemble learning. The ensemble learning model improves the robustness and accuracy of the model by integrating the results of multiple machine learning model. A large number of empirical and theoretical studies have shown that ensemble models usually achieve higher accuracy than single models [42]. The necessary condition for the ensemble learning model to achieve better results than an individual learner is that each base learner has good performance and is independent of each other. The following is divided into two parts to briefly introduce the four ensemble methods used in this research.
- (1)
- RF and ERT
RF and ERT have a similar structure, that is, they both use decision trees as the base model. RF integrates multiple base learners based on Bagging (Boost Aggregation). The steps of the Bagging method [43] are as follows. Firstly, a specific proportion of training samples is randomly selected from the original training samples. Secondly, multiple “weak learners” are trained based on multiple sets of training samples. Finally, the results of each “weak learner” are predicted by averaging or voting to make predictions. Unlike RF, ERT uses all samples to train decision trees. In addition, ERT selects the split nodes of the tree in a completely random way. ERT model, which combine randomization of cut-point and attributes with ensemble averaging, is able to reduce variance more robustly than the weaker randomization schemes used by other methods [44].
- (2)
- XGBoost and LightGBM
XGBoost and LightGBM mainly improve the performance of the model through boosting. Boosting aims to fit multiple “weak learners” in an iterative manner, reducing bias by assigning larger weights to observations in the dataset that were poorly handled with previous models [29]. Both are implemented based on Gradient Boosting Decision Trees (GBDT). Compared with the GBDT algorithm, XGBoost [45] adds a regularization term to the objective function to prevent overfitting, and performs second-order Taylor expansion on the objective function to improve calculation accuracy. Furthermore, XGBoost improves the operating efficiency of the algorithm through technologies such as Column Block for Parallel Learning, cache-aware prefetching algorithm, Block Compression, and Block Sharding. As for LightGBM [46], GBDT-based gradient-based one-side sampling (GOSS) and exclusive feature bundling (EFB), were developed to improve the operating efficiency and accuracy of the model. LightGBM excludes a large part of data instances with small gradients to reduce the number of samples by using the GOSS algorithm, while using the EFB algorithm to bundle mutually exclusive features to reduce the number of features.
2.2.3. Retrieval Model Design
In this paper, we used NDVI, NDWI, DDI, LST, soil properties data (sand, silt, and clay), surface soil moisture background field information (surface soil moisture data provided by SMAP and ERA5-Land reanalysis data) and in situ measurements as the input data of the four models. Among these data, the in situ measurements were used as independent variables, and other data were used as dependent variables. Before the construction of the model, we first evaluated the reliability of ERA5 and SMAP soil moisture data based on the in situ measurements. The SMAP soil moisture data were also reconstructed using the DCT-PLS method to provide the temporal and spatial continuous soil moisture background field information. After that, all dependent variables were resampled to 1 km resolution. In addition, according to the longitude, latitude, and time information of these sites, these corresponding dependent variables were extracted to form input data set. Then, the input data set was divided into training set and validation set according to the ratio of 4:1. The hyperparameters of the four models were optimized using the grid search method and 10-fold cross-validation technology during the training phase. In addition, we also adopted the early stopping method to optimize the number of trees in the models of XGBoost and LightGBM to avoid overfitting. Finally, the results of the four models in the training phase and the validation phase were evaluated based on the in situ measurements to obtain the most accurate soil moisture at 1 km. In this study, all models were implemented in the python3.8 environment with the help of third-party libraries such as numpy, pandas, scikit-learn, xgboost, lightgbm, etc. Figure 2 shows the specific flowchart of soil moisture retrieval in this study.
2.3. Evaluation Metrics
To fully evaluate the performance of DCT-PLS and the four machine learning models, four performance metrics including coefficient of determination (R2), bias, root mean squared error (RMSE), and the unbiased RMSE (ubRMSE) are used. The details of the formula are as follows:
where, and represent the estimated value and observed value, respectively, and n represents the number of observed values.
3. Results
3.1. Evaluation of Soil Moisture Products before and after Reconstitution
We evaluated the accuracy of original SMAP and ERA5 soil moisture data with in situ SSM measurements at 2980 meteorological stations during March–October in 2018 (Figure 3). All evaluation results were carried out at a spatial resolution of 36 km, in which the ERA5 soil moisture data were resampled to 36 km by using the nearest neighbor method. In addition, the grid-based soil moisture data were compared with the average from all interior stations. Only grids containing more than four meteorological stations was used to evaluate. As shown in Figure 3, ERA5 soil moisture data are slightly better than SMAP soil moisture data in terms of correlation coefficient and deviation, with a correlation coefficient of 0.51 and an ubRMSE of 0.0862 m3/m3. The ERA5 soil moisture product has a higher wet bias. In general, both products show a high correlation with the in situ measurements. However, due to the influence of different spatial scales and measurement depths, the soil moisture data of ERA5 and SMAP cannot completely match the measured values. Compared with SMAP soil moisture products, ERA5 products do not have more obvious advantages. The inversion of SMAP soil moisture is more susceptible in areas of high organic layer and high vegetation [47]. Meanwhile, the ERA5 data are also affected by the model structure and parameters, which may not be able to effectively capture the heterogeneity of soil moisture in the irrigation area. Therefore, it is both reliable and necessary to integrate data from multiple sources for soil moisture retrieval.
Before the reconstruction of SMAP soil moisture data, the fraction of missing data of SMAP AM and PM in the whole of China in 2018 was calculated (Figure 4a). The fraction of missing data varies from 58% to 100% (white areas represent completely missing regions). It can be found that the lack of data in the entire Qinghai-Tibet Plateau region is large, with an average missing rate of 91%. The reason for this phenomenon is that there is a lot of permafrost in the Qinghai-Tibet Plateau, which makes remote sensing inversion of soil moisture more difficult. In addition, due to the influence of factors such as water bodies and dense vegetation, there are also different data missing rates in other regions. In particular, the data for the entire Hainan Province and Taiwan Province are completely missing. The main reason is that these areas belong to the tropical and subtropical monsoon climate, and the vegetation is very lush, making it difficult for the L-band to directly penetrate the vegetation to directly invert the surface soil moisture.
Before reconstruction, 20% of the pixels in the SMAP data set were randomly selected as null values, and the accuracy of the algorithm was evaluated by comparing the values of these pixels before and after reconstruction. The correlation coefficient (R2) of the original value of the verification pixel and the predicted value of the algorithm was calculated to be 0.95. The results show that DCTPLS has good accuracy and robustness in reconstructing missing SMAP data. Figure 3b shows the correlation coefficient (R2) for different validation pixels. The pixels in most areas have high correlation coefficients, and the correlation coefficients of about 75% of the pixels are greater than 0.80. The western part of the Qinghai-Tibet Plateau has a lower correlation coefficient due to the high rate of data missing. In addition, since the algorithm process involves discrete cosine transform, the smooth output on the boundary may be slightly distorted [38], resulting in a relatively low correlation coefficient at the eastern coastal boundary.
Taking the soil moisture data of China on 26 August 2018 as an example, we compared the SMAP data before and after reconstruction (Figure 5). It can be found that the original SMAP data present an obvious striped distribution, and there are no data in nearly half of the areas. Therefore, it is necessary to integrate SMAP AM and PM data for reconstruction to provide more relevant spatiotemporal information. The reconstructed SMAP data well showed the spatial variation trend of soil moisture. The correlation coefficient (R2) of 0.96 also indicates the validity of the reconstruction results. Figure 6 shows the temporal variation of predicted values and observations for pixels with different fraction of missing data (60% and 70%). The two pixels are located in southern China (25°N, 105°E) and northern China (34°N, 113°E), respectively. In two distinct regions, the predicted curves nearly overlap the observed curves. The reconstructed data reproduced the change in soil moisture over time very well.
Figure 7 further evaluated the reconstruction results of SMAP soil moisture data based on the in situ measurements. Figure 7a shows that the reconstructed SSM corresponding to missing data regions obtained a 0.077 m3/m3 ubRMSE and a correlation coefficient of 0.58 against the in situ measurements. The DCT-PLS method can well reconstruct the soil moisture in the data missing area. Similarly, the reconstruction of all SMAP soil moisture data also further improved the accuracy of the original SMAP data, with a correlation coefficient of 0.56 and an unbiased root mean square error of 0.0782 m3/m3 (Figure 7b). The reconstructed SMAP accuracy is better than the original SMAP accuracy (Figure 3a). In general, the reconstructed SMAP soil moisture data can provide complete and continuous background field information for the construction of subsequent machine learning models.
3.2. Retrieval and Evaluation of 1 km Surface Soil Moisture
Based on the split training set and validation set, we calculated four metrics (R2, bias, RMSE, ubRMSE) to evaluate the performance of different machine learning models. Figure 8 shows the scatterplots of the four machine learning models during the training and validation phases. During the training phase, RF and ERT had similar results, with a correlation coefficient (R2) of 0.98 for both and RMSEs of 0.0158 m3/m3 and 0.0155 m3/m3. Since the deviations of both are close to 0, the calculated ubRMSE results are consistent with RMSE. The XGBoost model had the lowest prediction accuracy, with R2 and RMSE of 0.92 and 0.0302 m3/m3, respectively. Contrary to the results in the training phase, XGBoost and LightGBM achieve better results than RF and ERT in the validation phase. Among the four models, LightGBM shows the best performance in the validation phase (R2 = 0.88, RMSE = 0.0366 m3/m3).
In the validation phase, the accuracy of the four models decreased to varying degrees. In terms of correlation coefficients, the values of RF and ERT are reduced by 12% and 15%, respectively, and the values of XGBoost and LightGBM are both reduced by about 6%. Compared with XGBoost and LightGBM, RF and ERT have obvious overfitting phenomenon, that is, there is a large difference in model evaluation parameters between the training data set and the verification data set. This may be due to the fact that the training set obtained by using the random sampling method cannot fully reflect the properties of the entire data set when training the model, resulting in overfitting [29]. In addition, the slopes of all four models were less than 1, indicating that the models underestimated at high soil moisture values and overestimated at low soil moisture values. Overall, the four models showed excellent performance in soil moisture prediction. The better performance in the validation phase and less overfitting suggest the better robustness of LightGBM. In addition, LightGBM can take less time to train and validate than the other three models.
Since LightGBM achieved good results in estimating soil moisture, we further calculated the R and ubRMSE of each station based on the results of LightGBM (Figure 9) to evaluate the ability of the soil moisture predicted using the model to capture the temporal dynamic changes of soil moisture. It is easy to find that most stations exhibit high R values, especially in the North China Plain and the Sichuan Basin. There are some lower R values in the Xinjiang Uygur Autonomous Region, the Northeast Plain, and the southern regions. The specific reason may be that the distribution of stations in these areas is relatively sparse. Figure 9b shows the spatial distribution of ubRMSE values at different stations. For the convenience of representation, the color bar of Figure 9b is opposite to that of Figure 9a, red represents low values with high accuracy, and blue represents high values with low accuracy. The average ubRMSE of all stations in the entire China region is 0.0313 m3/m3. In the whole of China, Beijing, Shandong Province, and other regions have lower ubRMSE values. Areas with sparse stations such as Xinjiang Uygur Autonomous Region and Qinghai-Tibet Plateau also have low values of ubRMSE. The ubRMSE values in the Sichuan Basin is relatively high, partly because the soil moisture in this area varies greatly, and there is a deviation in the amplitude of the predicted soil moisture waveform, which leads to a relatively large ubRMSE values [48]. On the whole, the soil moisture predictions of most stations have satisfactory accuracy, and LightGBM can well capture the dynamic changes of soil moisture in time.
In order to further evaluate the effectiveness of 1 km surface soil moisture retrieval, the spatial distribution maps of 1 km soil moisture in China on the first day of each month from May to October 2018 were mapped (Figure 10). Compared with the SMAP soil moisture data, the 1 km surface soil moisture products retrieved in this study show more detailed information on the spatial distribution of soil moisture. Consistent with the spatial distribution trend of SMAP soil moisture (Figure 5b), high soil moisture values were distributed in the Northeast Plain, the Jianghuai region, the Yangtze River Basin, and the western Qinghai-Tibet Plateau. Low values mainly occurred in Xinjiang Uygur Autonomous Region, Inner Mongolia Autonomous Region, and Gansu Province.
3.3. Relative Importance of Features
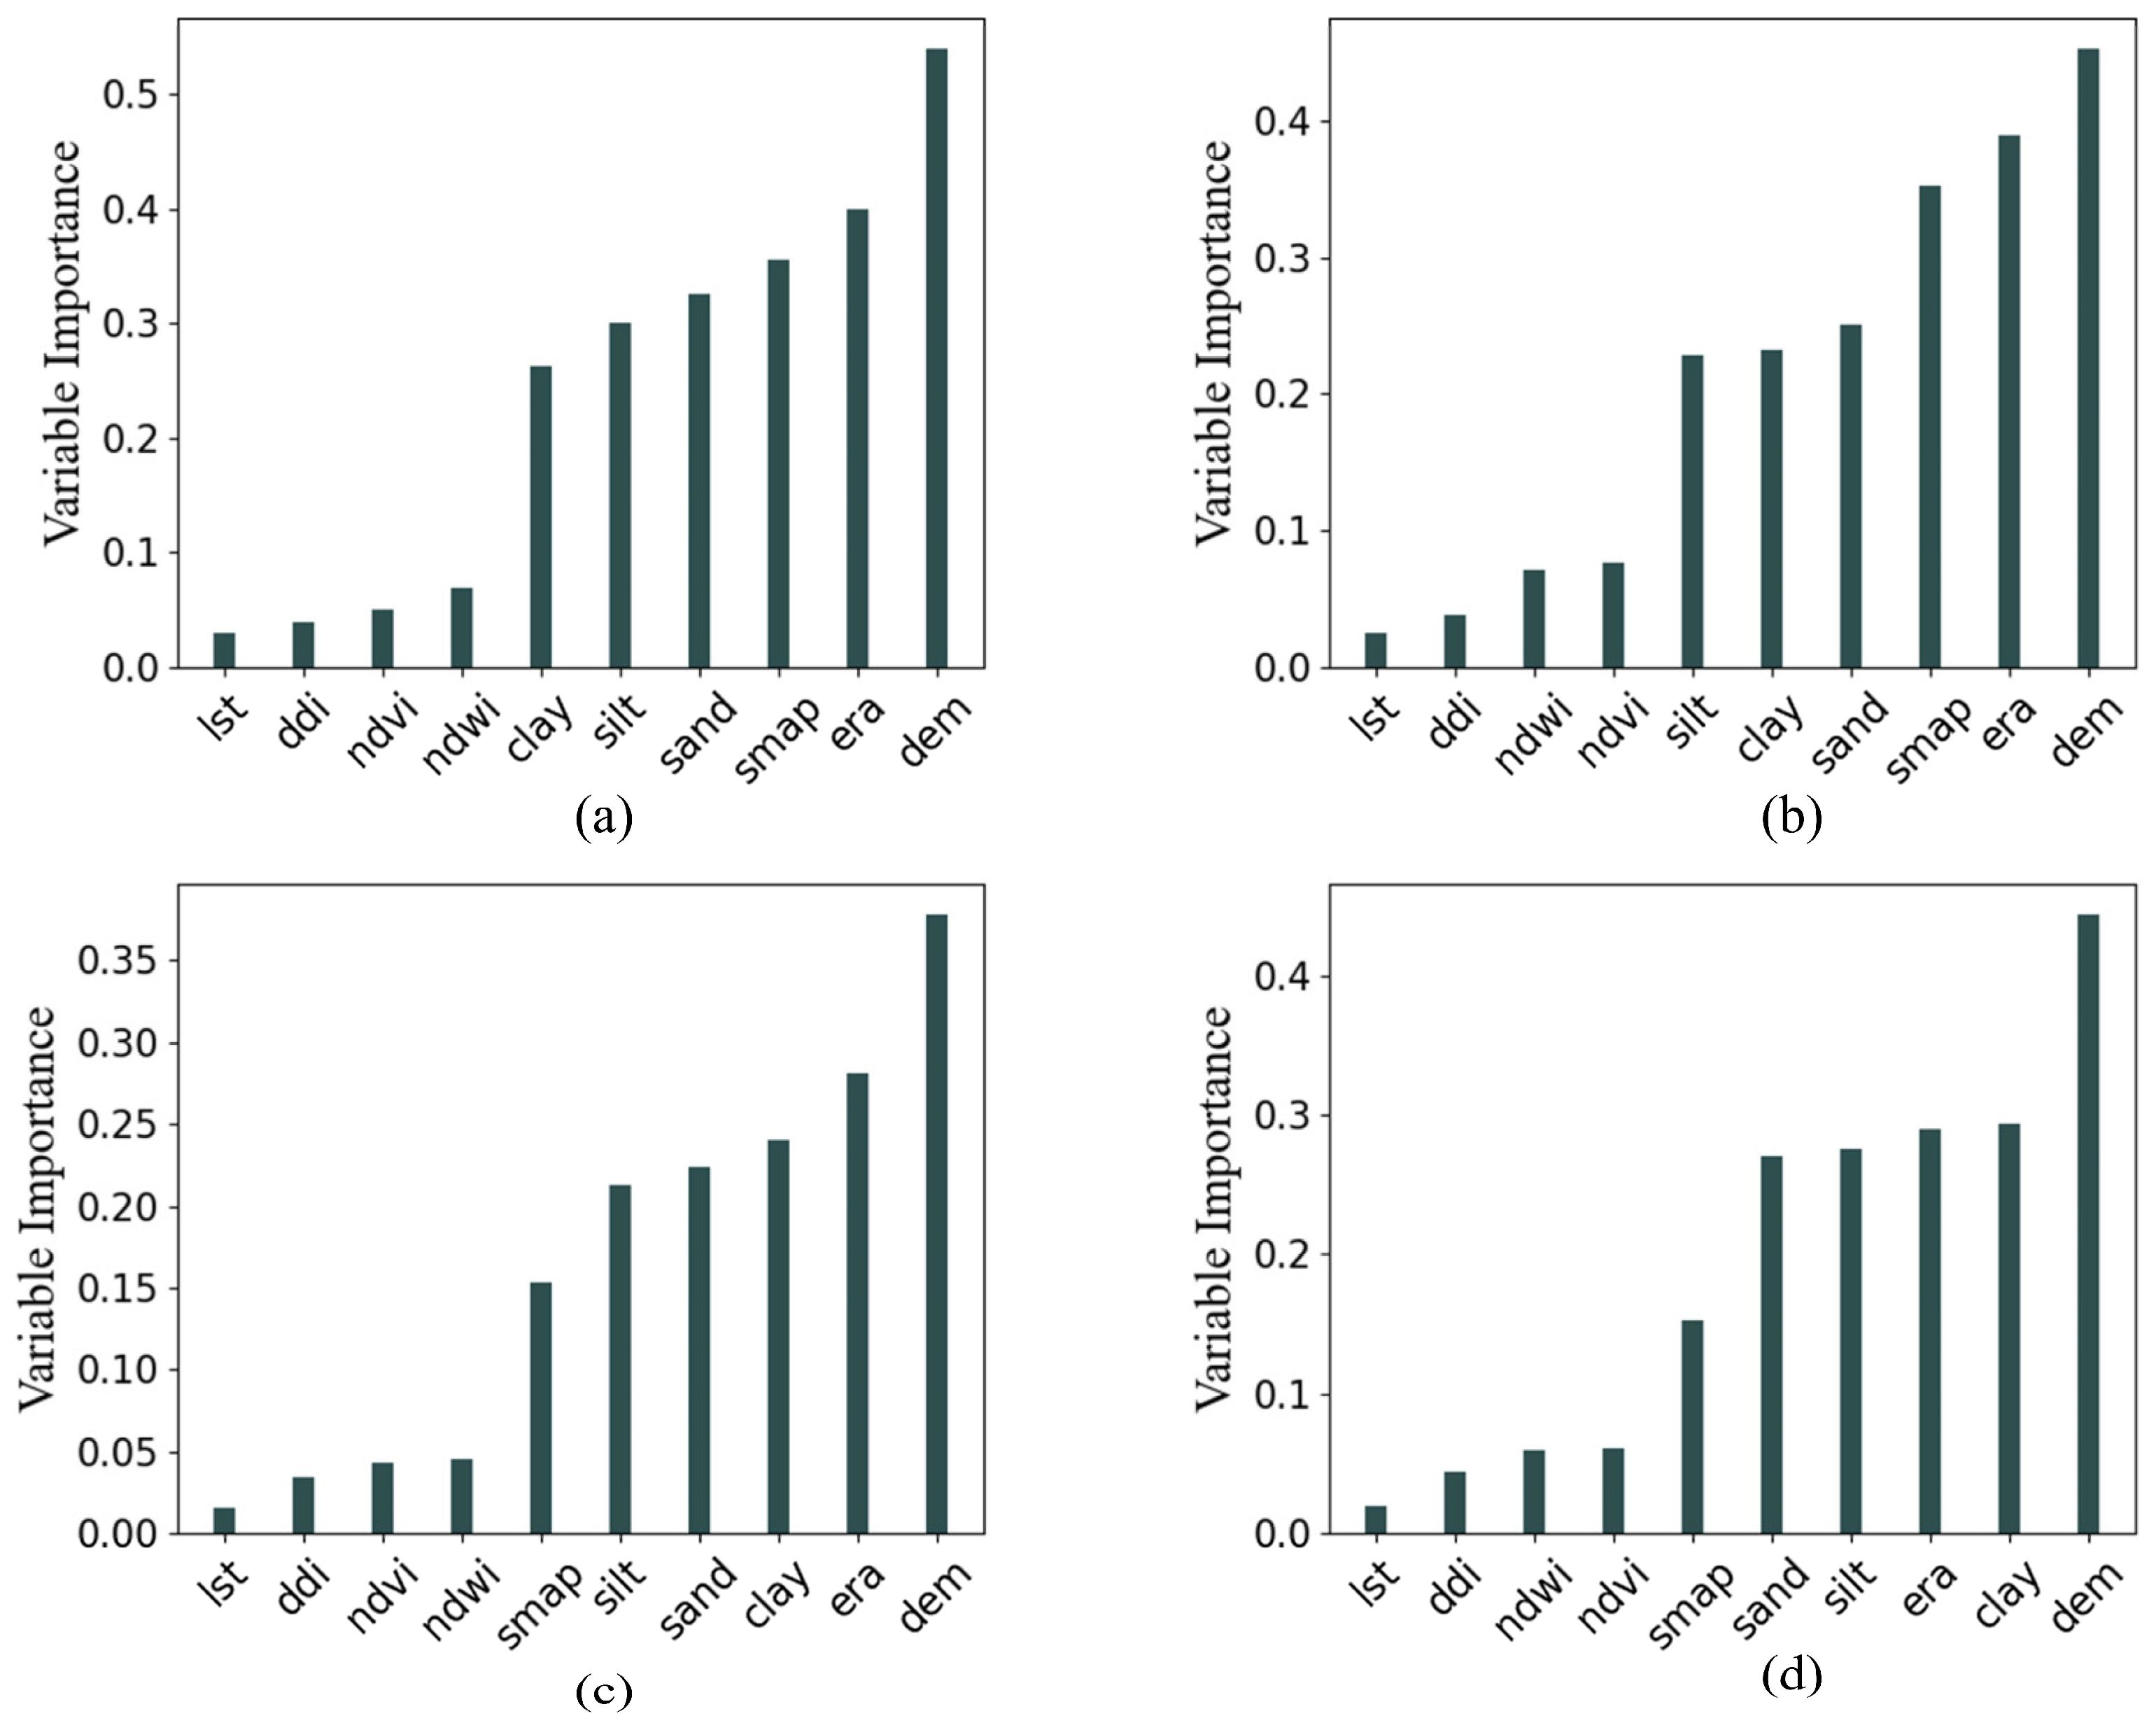
Figure 11 shows the feature permutation importance of four machine learning models, calculated using the validation data in 2018. Compared with impurity-based feature importance, permutation feature importance does not favor high cardinality features with particularly low repetition rate and can be calculated based on the validation set [49]. It should be noted that the importance of all input features in this study is calculated at a spatial resolution of 1 km. Among the four machine learning models, DEM is the most important feature variable. In the process of training the models, the input of DEM data can provide relevant terrain information. Terrain characterization parameters such as slope, aspect, and flow can be derived from DEM. Affected by various factors, differences in altitude lead to differences in evapotranspiration and rainfall patterns, which affect changes in soil moisture [50]. High importance scores of DEM in ensemble learning inversion of soil moisture was also found in previous studies [31,51]. It is worth noting that the feature importance score of DEM is higher than that of SMAP data and ERA5 data. This may be attributed to the high correlation between SMAP data as well as ERA5 data. Because they are all input into the models as soil moisture background field. The feature importance score is mainly calculated based on the drop in prediction accuracy when the predictor variables are randomly arranged. Therefore, when two variables are highly correlated, their importance may decrease. In addition, the coarse spatial resolution of SMAP and ERA is also one of the reasons for its reduced importance. Meanwhile, soil texture data such as clay, sand, and silt also have high feature importance scores among the four models. LST, DDI, NDVI, and NDWI are all at the bottom of the importance score, which may be attributed to the limited role of vegetation on the 1 km scale [52].
4. Discussion
This study mainly obtained the 1 km surface soil moisture in China by integrating data sets from multiple sources and using machine learning methods. The final soil moisture not only has a significant improvement in accuracy, but also can show more detailed information in space. Before inversion, we first evaluated two important input variables, including SMAP and ERA5 SSM data. The results show that the accuracy of SMAP data is slightly better than that of ERA5 data. However, affected by different factors, the two types of data show different performances in different aspects. Among them, the ERA5 data are mainly affected by the model structure and parameters, which may not be able to effectively capture the heterogeneity of soil moisture in the irrigation area [48]. SMAP cannot also achieve accurate retrieval of soil moisture in areas with high vegetation coverage. Therefore, it is necessary to integrate the two data to achieve complementary advantages.
In addition, the quality of input data has an important impact on the training of machine learning models. In the study, we used DCT-PLS and spline methods to reconstruct and interpolate SMAP soil moisture data and MODIS vegetation index to obtain spatially complete data. As empirical methods, their accuracy depends on the number of samples. For regions with a high missing data rate, the predicted results may not be accurate, especially the Qinghai-Tibet Plateau. This will affect the robustness of the model, although we still achieved high accuracy in the Qinghai-Tibet Plateau region. Therefore, increasing the sample size of data or adopting other physical models to improve the accuracy of input data is one of the main directions in the future. Meanwhile, it is also possible to directly obtain high-quality vegetation index data by developing a surface albedo algorithm with high temporal and spatial resolution. Up to now, many studies have reconstructed daily surface reflectance data through multi-source data fusion methods or time series analysis methods [53,54,55]. These methods performed the spatiotemporal reconstruction of missing surface reflectance data efficiently. Compared with the original data, the reconstructed data have good consistency in both spatial pattern and time variation.
Finally, this study also compared the capabilities of four different machine learning methods for soil moisture retrieval in China. The LightGBM model is the optimal model for large-scale soil moisture retrieval in China. The efficient algorithm of the LightGBM model can provide a certain basis for the inversion of large-scale soil moisture in long-term series. However, the relationship between soil moisture and auxiliary variables is often non-stationary in space. This limitation will affect the predictability of surface parameters such as soil moisture in complex land–atmosphere interaction regions, leading to significant uncertainty in the prediction of soil moisture [56]. Therefore, future work can focus on dividing the whole of China into different regions by integrating different indicators, and constructing corresponding machine learning models in different regions for soil moisture inversion, so as to further improve the stability of the model.
5. Conclusions
In this study, we retrieve the daily soil moisture in China with a spatial resolution of 1 km based on ensemble learning by integrating multi-source remote sensing data (surface reflectance, LST, SMAP SM), reanalysis data (ERA5 SM), auxiliary data (DEM, soil texture), and in situ soil moisture data. Furthermore, the performance of four ensemble learning models RF, ERT, XGBoost, and LightGBM in retrieval of soil moisture was evaluated to obtain the final 1 km surface soil moisture product. The main findings of the study are as follows:
- (1)
- Among the four ensemble learning models, LightGBM shows the best performance. The R2, bias, and ubRMSE between the soil moisture predicted using LightGBM and the validation data set were 0.88, 0.0004 m³/m³, and 0.0366 m³/m³, respectively. Compared with RF and ERT, LightGBM shows less overfitting. Meanwhile, the lower computational cost (faster speed and less memory consumption) makes it more suitable for inversion of large-scale soil moisture.
- (2)
- The LightGBM model can well capture the temporal variation and spatial distribution trend of soil moisture. The average value of the correlation coefficient and ubRMSE between the predicted value of the model and the in situ measurements of each station are 0.075 and 0.0313 m³/m³, respectively. Meanwhile, compared with the SMAP data, the obtained 1 km soil moisture product can show more detailed information on the spatial distribution of soil moisture.
- (3)
- Among all covariates, elevation was identified as the most important feature. Soil texture, SMAP SM, and ERA SM also exhibit relatively high importance on the construction of the soil moisture model. NDVI, NDWI, DDI, and LST had the least impact on soil moisture prediction.
In general, it is entirely feasible to apply this method to 1 km daily soil moisture retrieval in China. This methodological framework shows promise in the production of long-term series soil moisture data sets in China in the future, and the product is significant in the fields of agriculture, water resource management, and climate change.
Author Contributions
Methodology, Z.Y. and Q.H.; Validation, Z.Y.; Formal analysis, Z.Y.; Data curation, Z.Y. and Q.H.; Writing—original draft, Z.Y.; Writing—review & editing, Q.H.; Supervision, S.M., F.W. and M.Y.; Project administration, Q.H.; Funding acquisition, Q.H. All authors have read and agreed to the published version of the manuscript.
Funding
This study was supported by the National Key R&D Program of China (Grant No. 2021YFB3900601).
Data Availability Statement
Not applicable.
Acknowledgments
The authors would like to thank the reviewers and editors for their valuable comments and suggestions.
Conflicts of Interest
The authors declare no conflict of interest.
References
- Ali, I.; Greifeneder, F.; Stamenkovic, J.; Neumann, M.; Notarnicola, C. Review of machine learning approaches for biomass and soil moisture retrievals from remote sensing data. Remote Sens. 2015, 7, 16398–16421. [Google Scholar] [CrossRef]
- Shi, C.; Xie, Z.; Qian, H.; Liang, M.; Yang, X. China land soil moisture EnKF data assimilation based on satellite remote sensing data. Sci. China Earth Sci. 2011, 54, 1430–1440. [Google Scholar] [CrossRef]
- Rodríguez-Fernández, N.; Al Bitar, A.; Colliander, A.; Zhao, T. Soil moisture remote sensing across scales. Remote Sens. 2019, 11, 190. [Google Scholar] [CrossRef]
- Leng, P.; Li, Z.L.; Duan, S.B.; Gao, M.F.; Huo, H.Y. First results of all-weather soil moisture retrieval from an optical/thermal infrared remote-sensing-based operational system in China. Int. J. Remote Sens. 2019, 40, 2069–2086. [Google Scholar] [CrossRef]
- Cashion, J.; Lakshmi, V.; Bosch, D.; Jackson, T.J. Microwave remote sensing of soil moisture: Evaluation of the TRMM microwave imager (TMI) satellite for the Little River Watershed Tifton.; Georgia. J. Hydrol. 2005, 307, 242–253. [Google Scholar] [CrossRef]
- Zhao, L.; Yang, Z.L. Multi-sensor land data assimilation: Toward a robust global soil moisture and snow estimation. Remote Sens. Environ. 2018, 216, 13–27. [Google Scholar] [CrossRef]
- Yao, P.; Lu, H.; Shi, J.; Zhao, T.; Yang, K.; Cosh, M.H.; Short Gianotti, D.J.; Entekhabi, D.A. long term global daily soil moisture dataset derived from AMSR-E and AMSR2 (2002–2019). Sci. Data 2021, 8, 1–16. [Google Scholar] [CrossRef]
- Baatz, R.; Bogena, H.R.; Franssen, H.J.H.; Huisman, J.A.; Qu, W.; Montzka, C.; Vereecken, H. Calibration of a catchment scale cosmic-ray probe network: A comparison of three parameterization methods. J. Hydrol. 2014, 516, 231–244. [Google Scholar] [CrossRef]
- Vivoni, E.R.; Gebremichael, M.; Watts, C.J.; Bindlish, R.; Jackson, T.J. Comparison of ground-based and remotely-sensed surface soil moisture estimates over complex terrain during SMEX04. Remote Sens. Environ. 2008, 112, 314–325. [Google Scholar] [CrossRef]
- Jonard, F.; Weihermuller, L.; Jadoon, K.Z.; Schwank, M.; Vereecken, H.; Lambot, S. Mapping field-scale soil moisture with L-band radiometer and ground-penetrating radar over bare soil. IEEE Trans. Geosci. Remote Sens. 2011, 49, 2863–2875. [Google Scholar] [CrossRef]
- Bhogapurapu, N.; Dey, S.; Homayouni, S.; Bhattacharya, A.; Rao, Y.S. Field-scale soil moisture estimation using sentinel-1 GRD SAR data. Adv. Space Res. 2022, 70, 3845–3858. [Google Scholar] [CrossRef]
- Whiting, M.L.; Li, L.; Ustin, S.L. Predicting water content using Gaussian model on soil spectra. Remote Sens. Environ. 2004, 89, 535–552. [Google Scholar] [CrossRef]
- Schnur, M.T.; Xie, H.; Wang, X. Estimating root zone soil moisture at distant sites using MODIS NDVI and EVI in a semi-arid region of southwestern USA. Ecol. Inform. 2010, 5, 400–409. [Google Scholar] [CrossRef]
- Benabdelouahab, T.; Balaghi, R.; Hadria, R.; Lionboui, H.; Minet, J.; Tychon, B. Monitoring surface water content using visible and short-wave infrared SPOT-5 data of wheat plots in irrigated semi-arid regions. Int. J. Remote Sens. 2015, 36, 4018–4036. [Google Scholar] [CrossRef]
- Claps, P.; Laguardia, G. Assessing spatial variability of soil water content through thermal inertia and NDVI. In Remote Sensing for Agriculture, Ecosystems, and Hydrology V; SPIE: Bellingham, WA, USA, 2004; Volume 5232, pp. 378–387. [Google Scholar]
- Wang, S.; Garcia, M.; Ibrom, A.; Jakobsen, J.; Josef Köppl, C.; Mallick, K.; Looms, M.C.; Bauer-Gottwein, P. Mapping root-zone soil moisture using a temperature–vegetation triangle approach with an unmanned aerial system: Incorporating surface roughness from structure from motion. Remote Sens. 2018, 10, 1978. [Google Scholar] [CrossRef]
- Tian, J.; Deng, X.; Su, H. Intercomparison of two trapezoid-based soil moisture downscaling methods using three scaling factors. Int. J. Digit. Earth 2019, 12, 485–499. [Google Scholar] [CrossRef]
- Kerr, Y.H.; Waldteufel, P.; Wigneron, J.P.; Martinuzzi, J.A.M.J.; Font, J.; Berger, M. Soil moisture retrieval from space: The Soil Moisture and Ocean Salinity (SMOS) mission. IEEE Trans. Geosci. Remote Sens. 2001, 39, 1729–1735. [Google Scholar] [CrossRef]
- Imaoka, K.; Kachi, M.; Fujii, H.; Murakami, H.; Hori, M.; Ono, A.; Igarashi, T.; Nakagawa, K.; Oki, T.; Honda, Y.; et al. Global Change Observation Mission (GCOM) for monitoring carbon, water cycles, and climate change. Proceedings of the IEEE 2010, 98, 717–734. [Google Scholar] [CrossRef]
- Entekhabi, D.; Njoku, E.G.; O’Neill, P.E.; Kellogg, K.H.; Crow, W.T.; Edelstein, W.N.; Entin, J.K.; Goodman, S.D.; Jackson, T.C.; Johnson, J.; et al. The soil moisture active passive (SMAP) mission. Proc. IEEE 2010, 98, 704–716. [Google Scholar] [CrossRef]
- Kang, C.S.; Zhao, T.; Shi, J.; Cosh, M.H.; Chen, Y.; Starks, P.J.; Collins, C.H.; Wu, S.; Sun, R.; Zheng, J. Global soil moisture retrievals from the Chinese FY-3D microwave radiation imager. IEEE Trans. Geosci. Remote Sens. 2020, 59, 4018–4032. [Google Scholar] [CrossRef]
- Rodell, M.; Houser, P.R.; Jambor, U.E.A.; Gottschalck, J.; Mitchell, K.; Meng, C.J.; Arsenault, K.; Cosgrove, B.; Radakovich, J.; Bosilovich, M.; et al. The global land data assimilation system. Bull. Am. Meteorol. Soc. 2004, 85, 381–394. [Google Scholar] [CrossRef]
- Muñoz-Sabater, J.; Dutra, E.; Agustí-Panareda, A.; Albergel, C.; Arduini, G.; Balsamo, G.; Boussetta, S.; Choulga, M.; Harrigan, S.; Hersbach, H.; et al. ERA5-Land: A state-of-the-art global reanalysis dataset for land applications. Earth Syst. Sci. Data 2021, 13, 4349–4383. [Google Scholar] [CrossRef]
- Reichle, R.; De Lannoy, R.; Koster, D.G.; Crow, W.T.; Kimball, J.S.; Liu, Q. SMAP L4 Global 3-Hourly 9 km EASE-Grid Surface and Root Zone Soil Moisture Geophysical Data, Version 6 (SPL4SMGP); NASA: Boulder, CO, USA, 2021. [Google Scholar] [CrossRef]
- Nearing, G.; Yatheendradas, S.; Crow, W.; Zhan, X.; Liu, J.; Chen, F. The efficiency of data assimilation. Water Resour. Res. 2018, 54, 6374–6392. [Google Scholar] [CrossRef]
- Jin, Y.; Ge, Y.; Wang, J.; Heuvelink, G.B. Deriving temporally continuous soil moisture estimations at fine resolution by downscaling remotely sensed product. Int. J. Appl. Earth Obs. Geoinf. 2018, 68, 8–19. [Google Scholar] [CrossRef]
- Djamai, N.; Magagi, R.; Goïta, K.; Merlin, O.; Kerr, Y.; Roy, A. A combination of DISPATCH downscaling algorithm with CLASS land surface scheme for soil moisture estimation at fine scale during cloudy days. Remote Sens. Environ. 2016, 184, 1–14. [Google Scholar] [CrossRef]
- Long, D.; Bai, L.; Yan, L.; Zhang, C.; Yang, W.; Lei, H.; Quan, J.; Meng, X.; Shi, C. Generation of spatially complete and daily continuous surface soil moisture of high spatial resolution. Remote Sens. Environ. 2019, 233, 111364. [Google Scholar] [CrossRef]
- Das, B.; Rathore, P.; Roy, D.; Chakraborty, D.; Jatav, R.S.; Sethi, D.; Kumar, P. Comparison of bagging, boosting and stacking algorithms for surface soil moisture mapping using optical-thermal-microwave remote sensing synergies. Catena 2022, 217, 106485. [Google Scholar] [CrossRef]
- Zhao, W.; Sánchez, N.; Lu, H.; Li, A. A spatial downscaling approach for the SMAP passive surface soil moisture product using random forest regression. J. Hydrol. 2018, 563, 1009–1024. [Google Scholar] [CrossRef]
- Zhang, Y.; Liang, S.; Zhu, Z.; Ma, H.; He, T. Soil moisture content retrieval from Landsat 8 data using ensemble learning. ISPRS J. Photogramm. Remote Sens. 2022, 185, 32–47. [Google Scholar] [CrossRef]
- Zhang, X.; Zhou, J.; Liang, S.; Wang, D. A practical reanalysis data and thermal infrared remote sensing data merging (RTM) method for reconstruction of a 1-km all-weather land surface temperature. Remote Sens. Environ. 2021, 260, 112437. [Google Scholar] [CrossRef]
- Tucker, C.J. Remote sensing of leaf water content in the near infrared. Remote Sens. Environ. 1980, 10, 23–32. [Google Scholar] [CrossRef]
- Gao, B.C. NDWI—A normalized difference water index for remote sensing of vegetation liquid water from space. Remote Sens. Environ. 1996, 58, 257–266. [Google Scholar] [CrossRef]
- Qin, Q.; Jin, C.; Zhang, N.; Yang, X. An Two-Dimensional Spectral Space Based Model for Drought Monitoring and its Re-Examination. In Proceedings of the 2010 IEEE International Geoscience and Remote Sensing Symposium, IEEE, Honolulu, HI, USA, 25–30 July 2010; pp. 3869–3872. [Google Scholar]
- O’Neill, P.E.S.; Chan, E.G.; Njoku, T.; Jackson, R.; Bindlish, J. SMAP L3 Radiometer Global Daily 36 km EASE-Grid Soil Moisture, Version 6 [Data Set]; NASA: Boulder, CO, USA, 2019. [Google Scholar] [CrossRef]
- Zhou, J.; Zhang, X.; Tang, W.; Ding, L.; Ma, J.; Zhang, X. Daily 1-km All-Weather Land Surface Temperature Dataset for the Chinese Landmass and Its Surrounding Areas (TRIMS LST; 2000–2021); National Tibetan Plateau Data Center: Xining, China, 2021. [Google Scholar] [CrossRef]
- Garcia, D. Robust smoothing of gridded data in one and higher dimensions with missing values. Comput. Stat. Data Anal. 2010, 54, 1167–1178. [Google Scholar] [CrossRef] [PubMed]
- Zhang, G.; Hao, Z.; Zhu, S.; Zhou, C.; Hua, J. Missing data reconstruction and evaluation of retrieval precision for AMSR2 soil moisture. Trans. Chin. Soc. Agric. Eng. 2016, 32, 137–143. [Google Scholar]
- Wu, Z.; Feng, H.; He, H.; Zhou, J.; Zhang, Y. Evaluation of soil moisture climatology and anomaly components derived from ERA5-land and GLDAS-2.1 in China. Water Resour. Manag. 2021, 35, 629–643. [Google Scholar] [CrossRef]
- Dai, Y.; Wei, N.; Yuan, H.; Zhang, S.; Shangguan, W.; Liu, S.; Lu, X.; Xin, Y. Evaluation of soil thermal conductivity schemes for use in land surface modeling. J. Adv. Model. Earth Syst. 2019, 11, 3454–3473. [Google Scholar] [CrossRef]
- Sammut, C.; Webb, G.I. (Eds.) Encyclopedia of Machine Learning; Springer Science Business Media: Berlin/Heidelberg, Germany, 2011. [Google Scholar]
- Breiman, L. Bagging predictors. Mach. Learn. 1996, 24, 123–140. [Google Scholar] [CrossRef]
- Geurts, P.; Ernst, D.; Wehenkel, L. Extremely randomized trees. Mach. Learn. 2006, 63, 3–42. [Google Scholar] [CrossRef]
- Chen, T.; Guestrin, C. Xgboost: A scalable tree boosting system. In Proceedings of the 22nd Acm Sigkdd International Conference on Knowledge Discovery and Data Mining, San Francisco, CA, USA, 13–17 August 2016; pp. 785–794. [Google Scholar]
- Ke, G.; Meng, Q.; Finley, T.; Wang, T.; Chen, W.; Ma, W.; Ye, Q.; Liu, T.Y. Lightgbm: A highly efficient gradient boosting decision tree. Adv. Neural Inf. Process. Syst. 2017, 30, 3146–3154. [Google Scholar]
- Lal, P.; Singh, G.; Das, N.N.; Colliander, A.; Entekhabi, D. Assessment of ERA5-Land Volumetric Soil Water Layer Product Using In Situ and SMAP Soil Moisture Observations. IEEE Geosci. Remote Sens. Lett. 2022, 19, 2508305. [Google Scholar] [CrossRef]
- Entekhabi, D.; Reichle, R.H.; Koster, R.D.; Crow, W.T. Performance metrics for soil moisture retrievals and application requirements. J. Hydrometeorol. 2010, 11, 832–840. [Google Scholar] [CrossRef]
- Strobl, C.; Boulesteix, A.L.; Zeileis, A.; Hothorn, T. Bias in random forest variable importance measures: Illustrations, sources and a solution. BMC Bioinform. 2007, 8, 1–21. [Google Scholar] [CrossRef] [PubMed]
- Goulden, M.L.; Anderson, R.G.; Bales, R.C.; Kelly, A.E.; Meadows, M.; Winston, G.C. Evapotranspiration along an elevation gradient in California’s Sierra Nevada. J. Geophys.Res. Biogeosci. 2012, 117, G3. [Google Scholar] [CrossRef]
- Karthikeyan, L.; Mishra, A.K. Multi-layer high-resolution soil moisture estimation using machine learning over the United States. Remote Sens. Environ. 2021, 266, 112706. [Google Scholar] [CrossRef]
- Joshi, C.; Mohanty, B.P. Physical controls of near-surface soil moisture across varying spatial scales in an agricultural landscape during SMEX02. Water Resour. Res. 2010, 46, 12. [Google Scholar] [CrossRef]
- Gao, F.; Masek, J.; Schwaller, M.; Hall, F. On the blending of the Landsat and MODIS surface reflectance: Predicting daily Landsat surface reflectance. IEEE Trans. Geosci. Remote Sens. 2006, 44, 2207–2218. [Google Scholar]
- Xiao, Z.; Liang, S.; Tian, X.; Jia, K.; Yao, Y.; Jiang, B. Reconstruction of long-term temporally continuous NDVI and surface reflectance from AVHRR data. IEEE J. Sel. Top. Appl. Earth Obs. Remote Sens. 2017, 10, 5551–5568. [Google Scholar] [CrossRef]
- Yang, G.; Shen, H.; Sun, W.; Li, J.; Diao, N.; He, Z. On the generation of gapless and seamless daily surface reflectance data. IEEE Trans. Geosci. Remote Sens. 2018, 56, 4289–4306. [Google Scholar] [CrossRef]
- Duan, S.B.; Li, Z.L. Spatial downscaling of MODIS land surface temperatures using geographically weighted regression: Case study in northern China. IEEE Trans. Geosci. Remote Sens. 2016, 54, 6458–6469. [Google Scholar] [CrossRef]
Figure 1.
Elevation information of the study area and spatial distribution of in situ soil moisture stations (The stations are indicated by the purple dots.).
Figure 1.
Elevation information of the study area and spatial distribution of in situ soil moisture stations (The stations are indicated by the purple dots.).
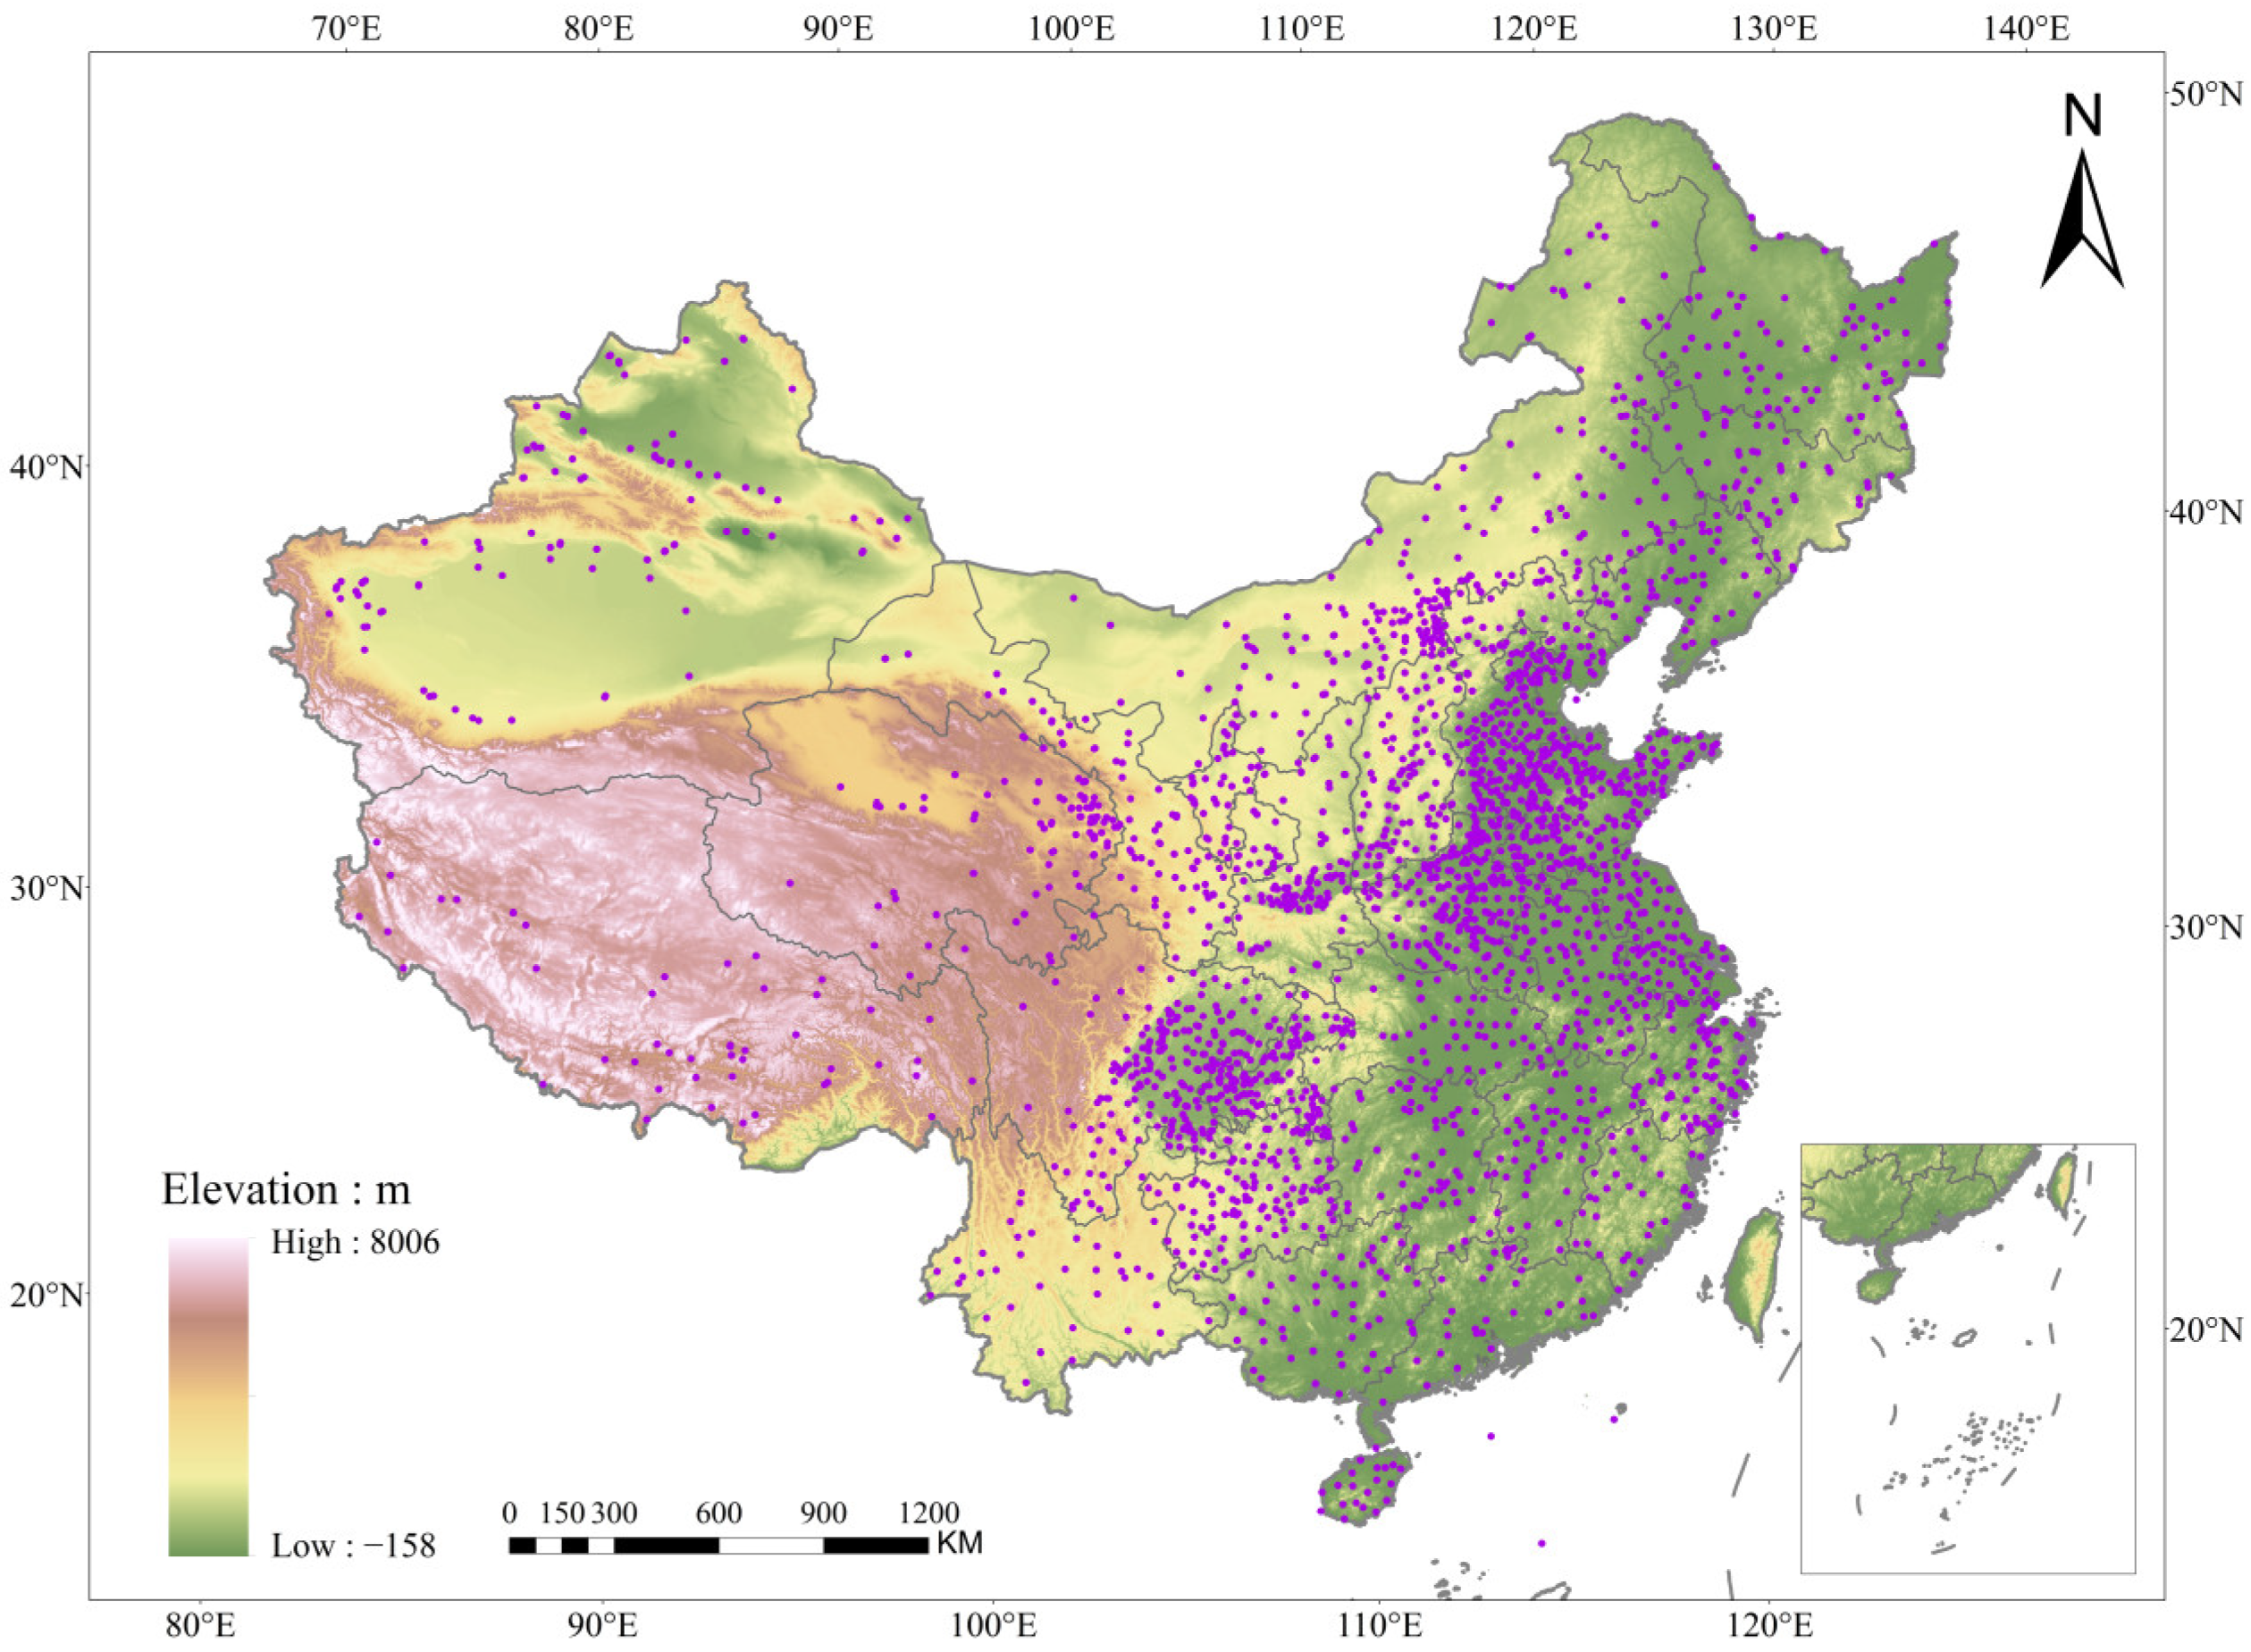
Figure 2.
Flowchart of SSM retrieval in this study.

Figure 3.
Comparisons of the original SMAP (a) and ERA5 (b) SSM against in situ SSM measurements at 2980 meteorological stations during March–October in 2018. (The “Number” is used to measure the degree of density of each point in the scatter plot. The “Number” is larger, the density or frequency of points with the same color in the scatter plot are higher).
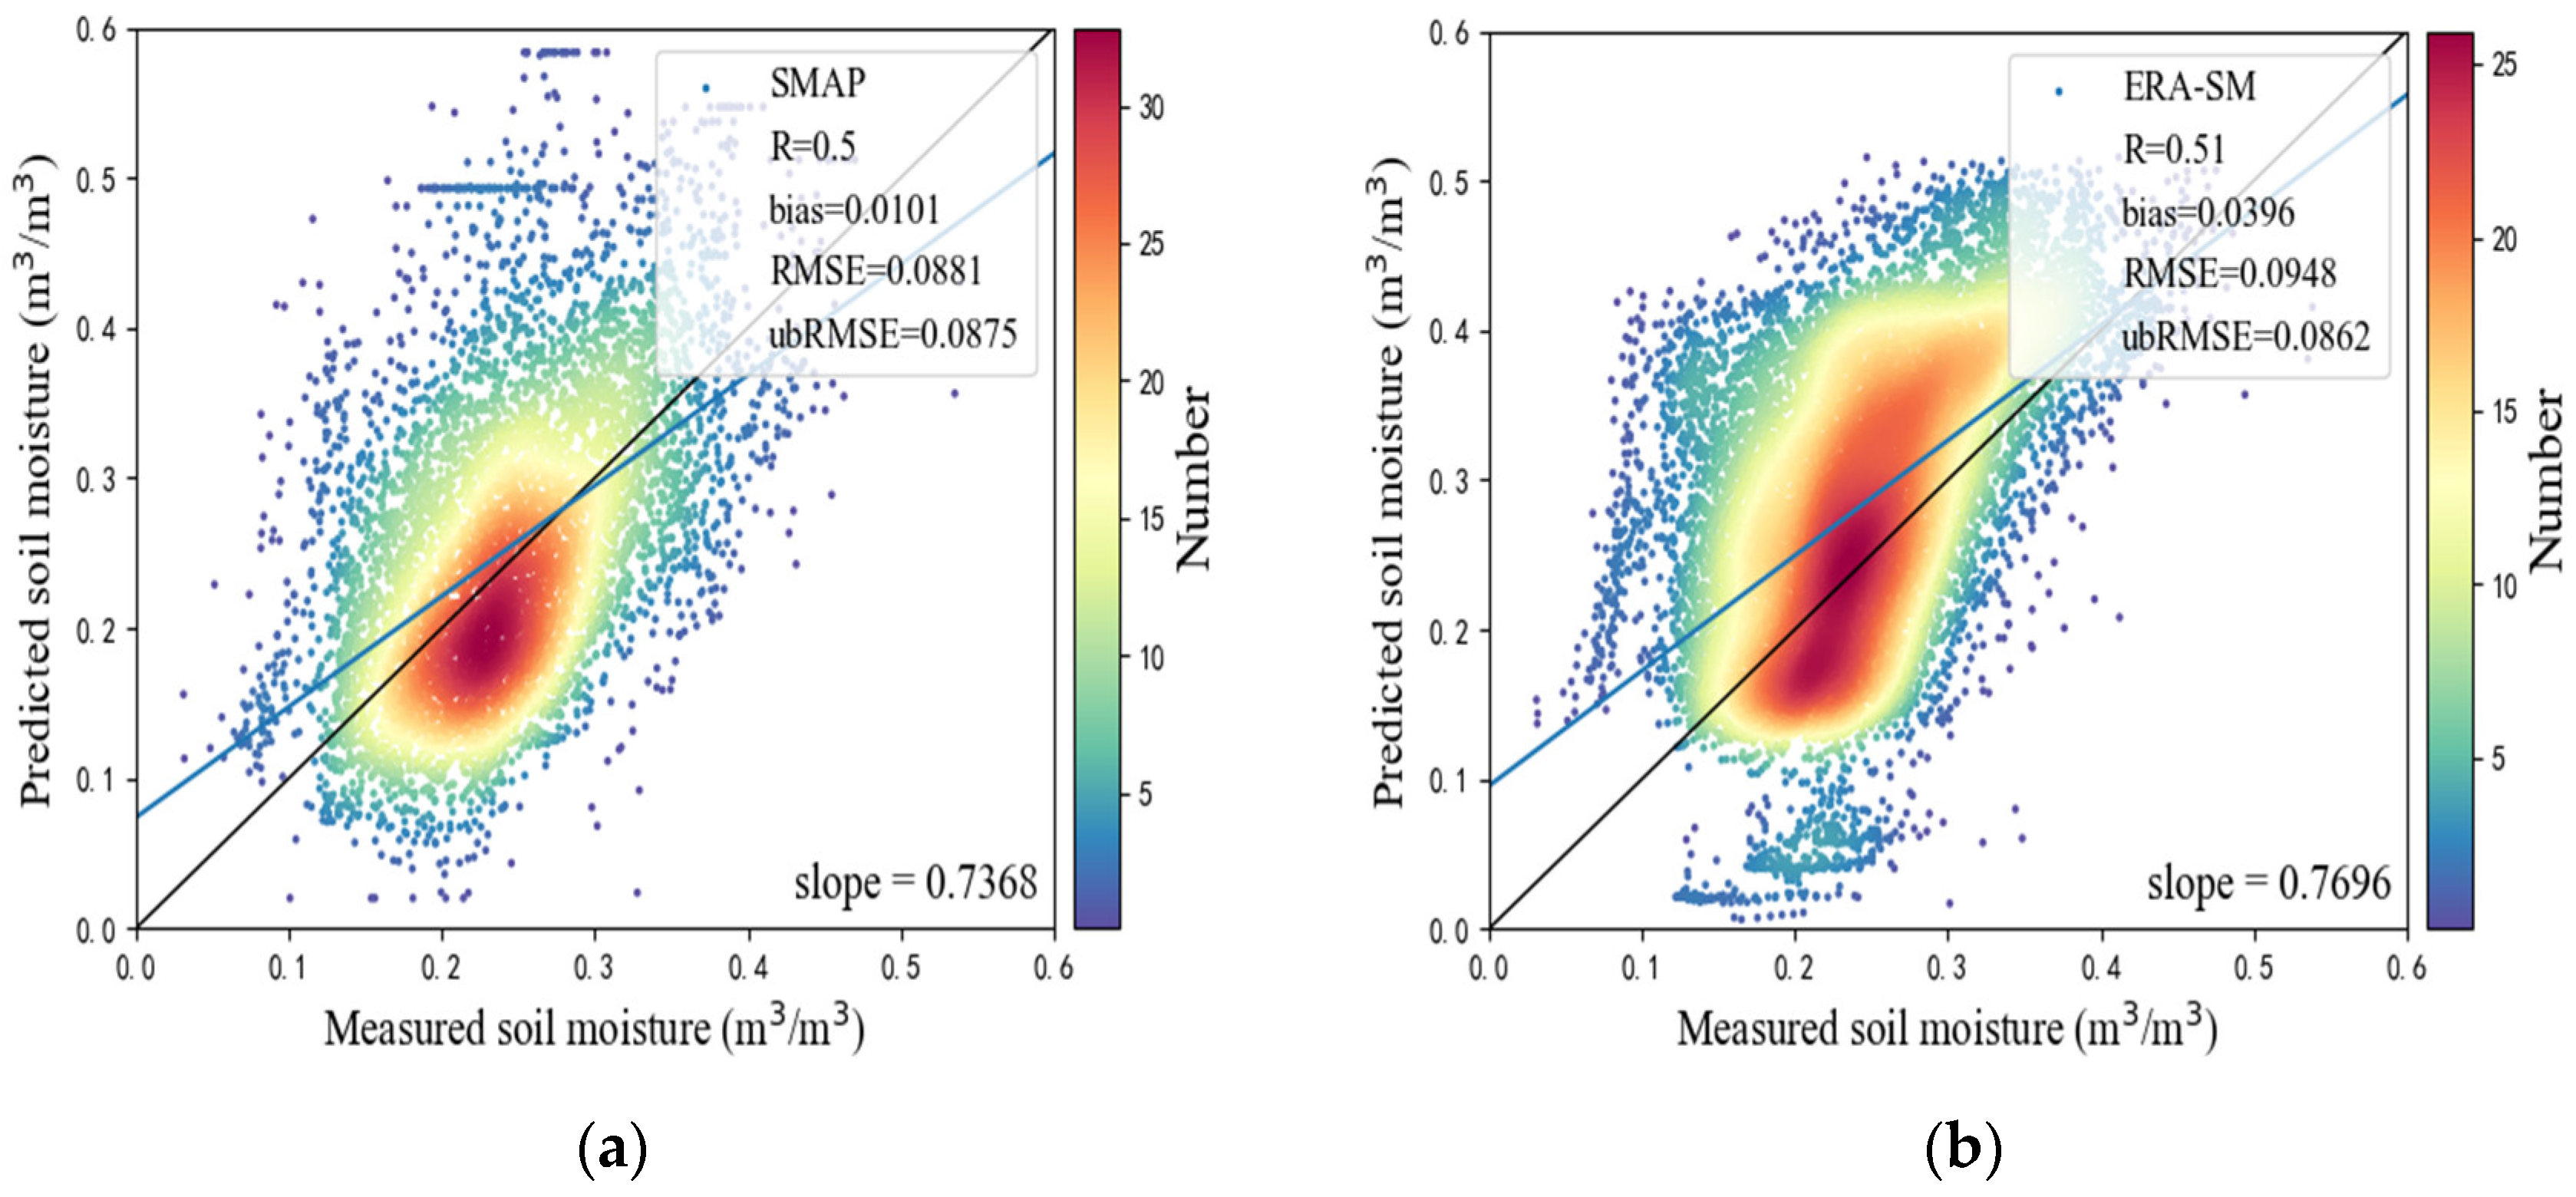
Figure 4.
The fraction of missing SMAP L3 soil moisture data (including SMAP AM and PM) in China in 2018 (a) and pixel-wise correlation coefficient (R2) calculation results (b).
Figure 4.
The fraction of missing SMAP L3 soil moisture data (including SMAP AM and PM) in China in 2018 (a) and pixel-wise correlation coefficient (R2) calculation results (b).
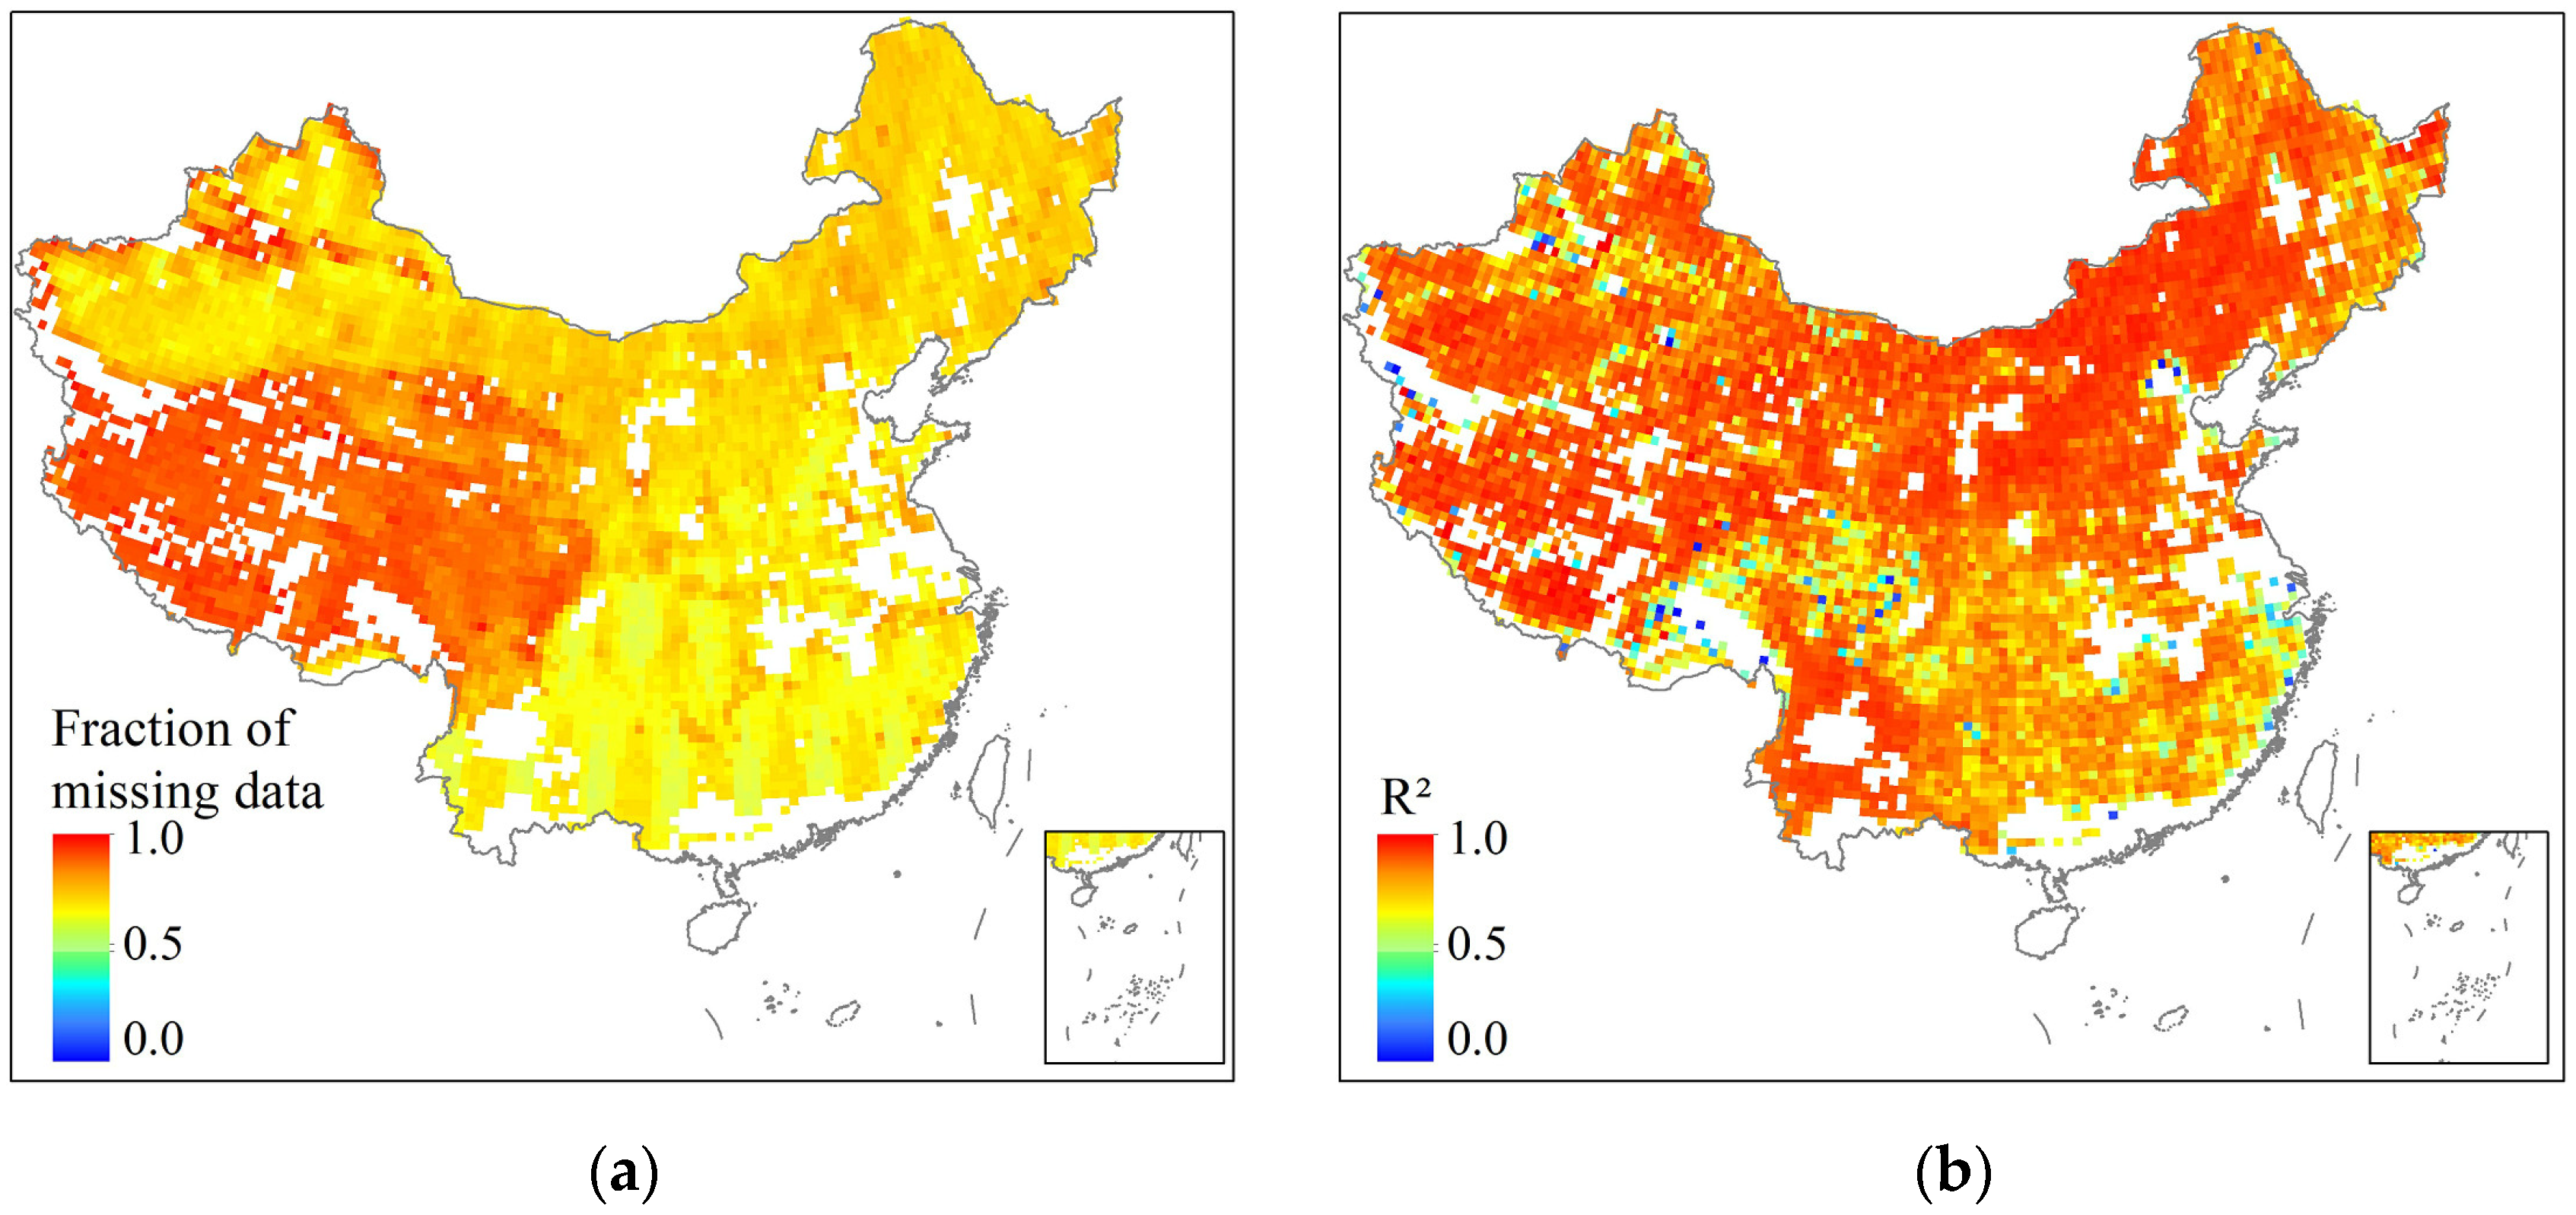
Figure 5.
SMAP L3 AM soil moisture data on 26 August 2018 (a) and its model result (b).
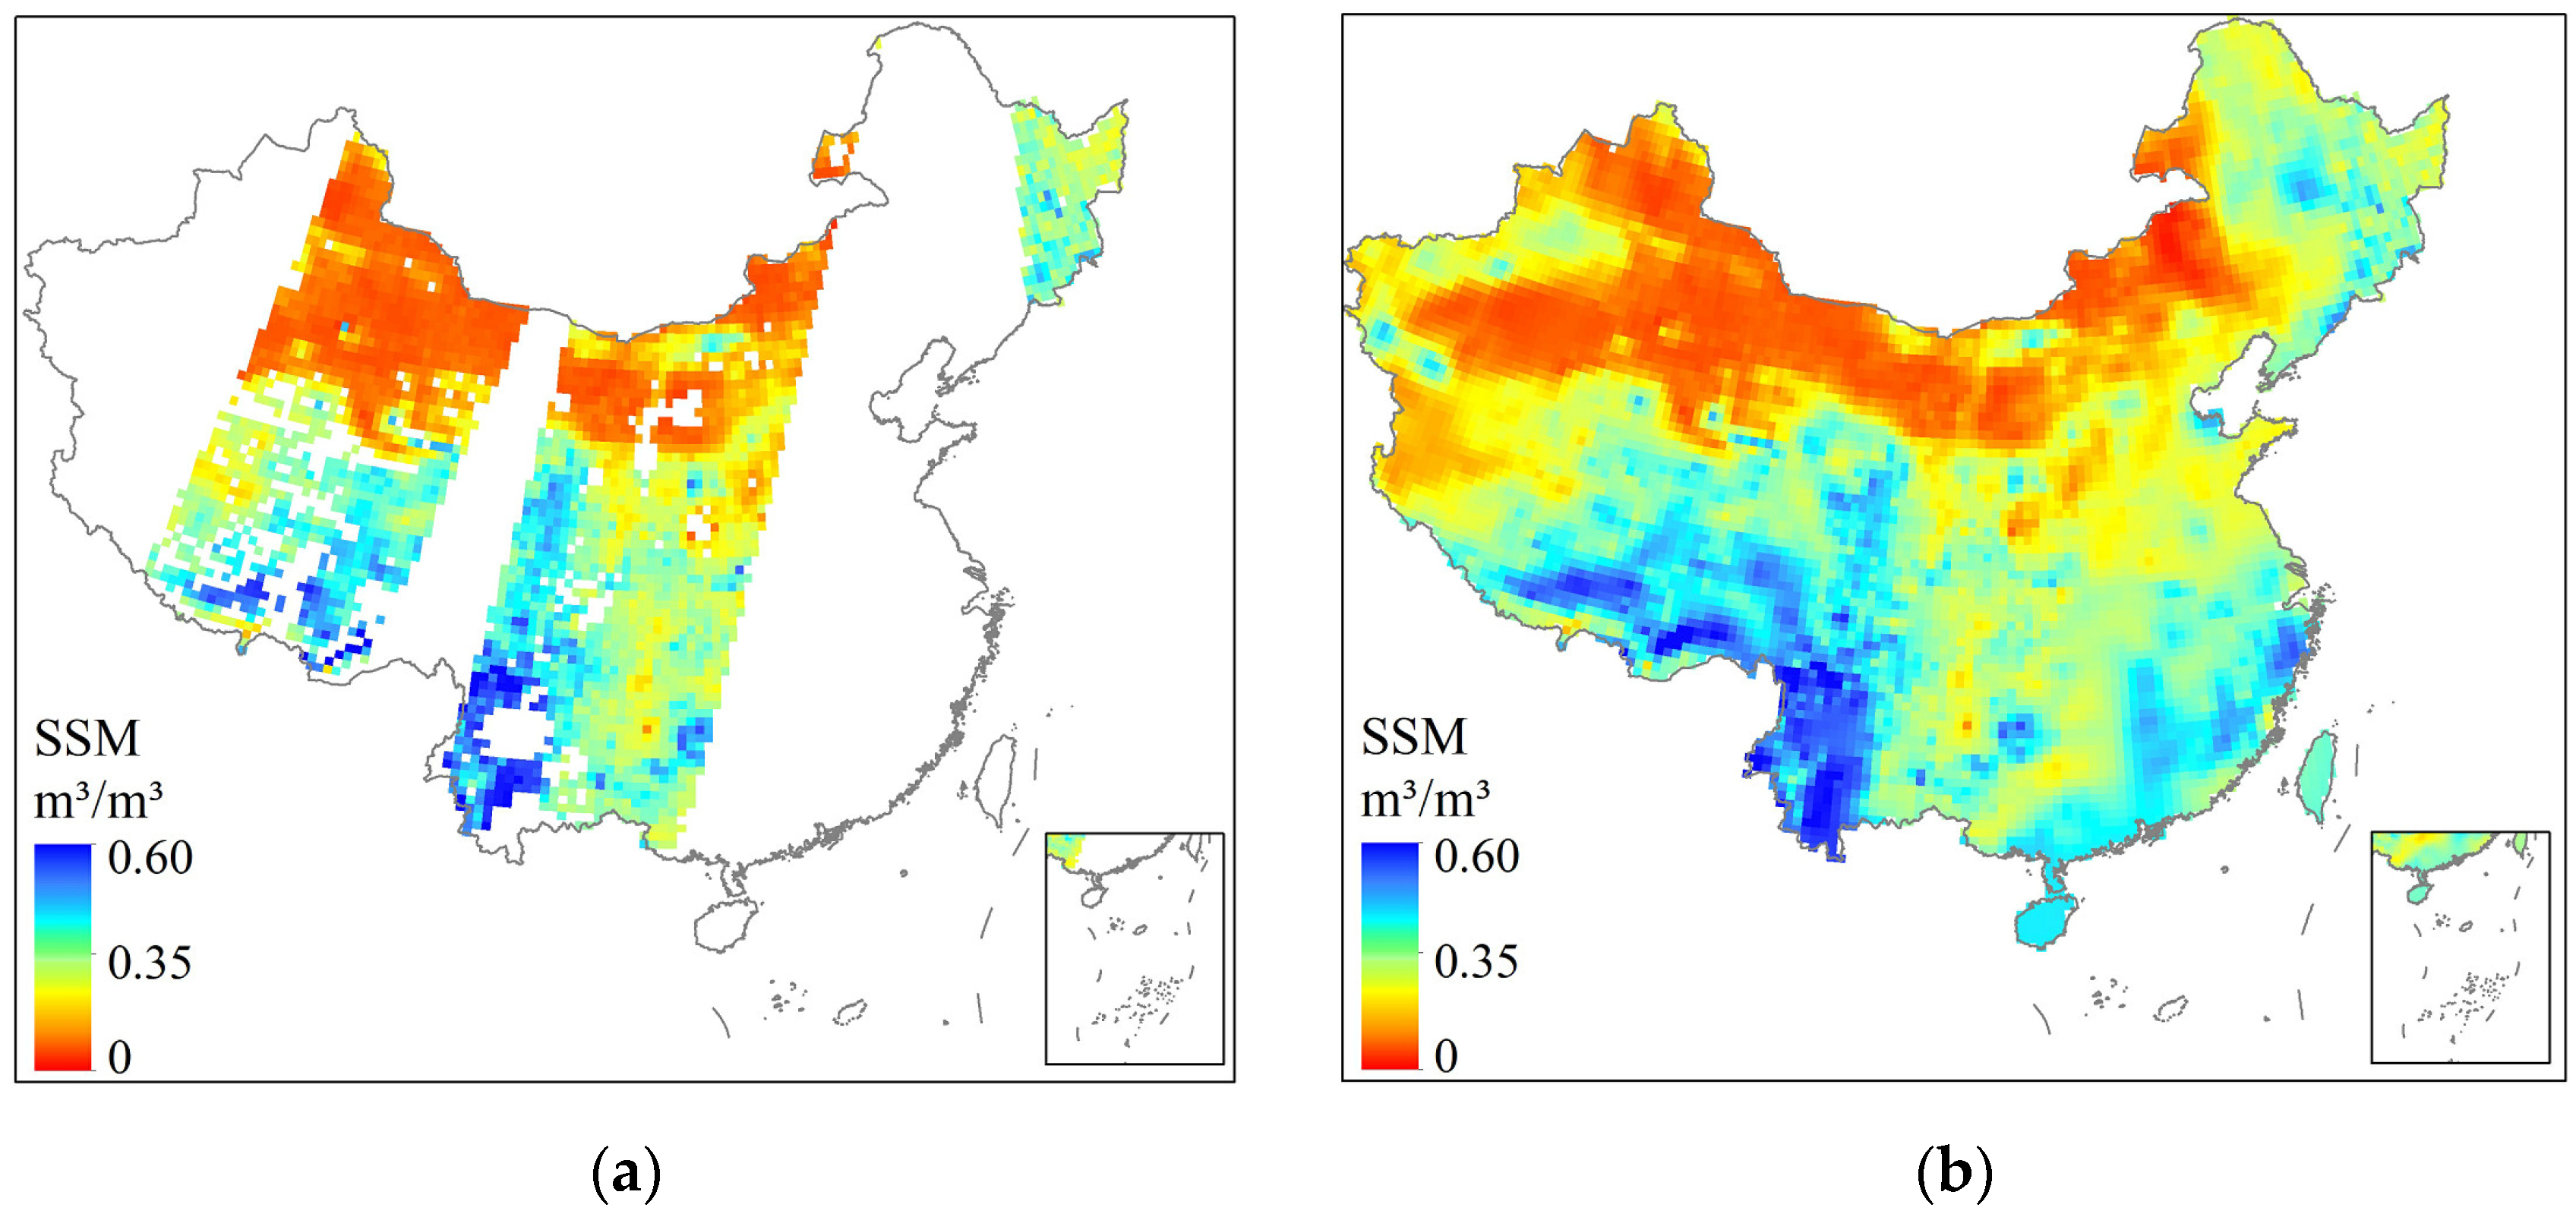
Figure 6.
Time series of observations and their corresponding model predicted values in 2018 from the pixels at 25°N, 105°E (a) and 34°N, 113°E (b).
Figure 6.
Time series of observations and their corresponding model predicted values in 2018 from the pixels at 25°N, 105°E (a) and 34°N, 113°E (b).
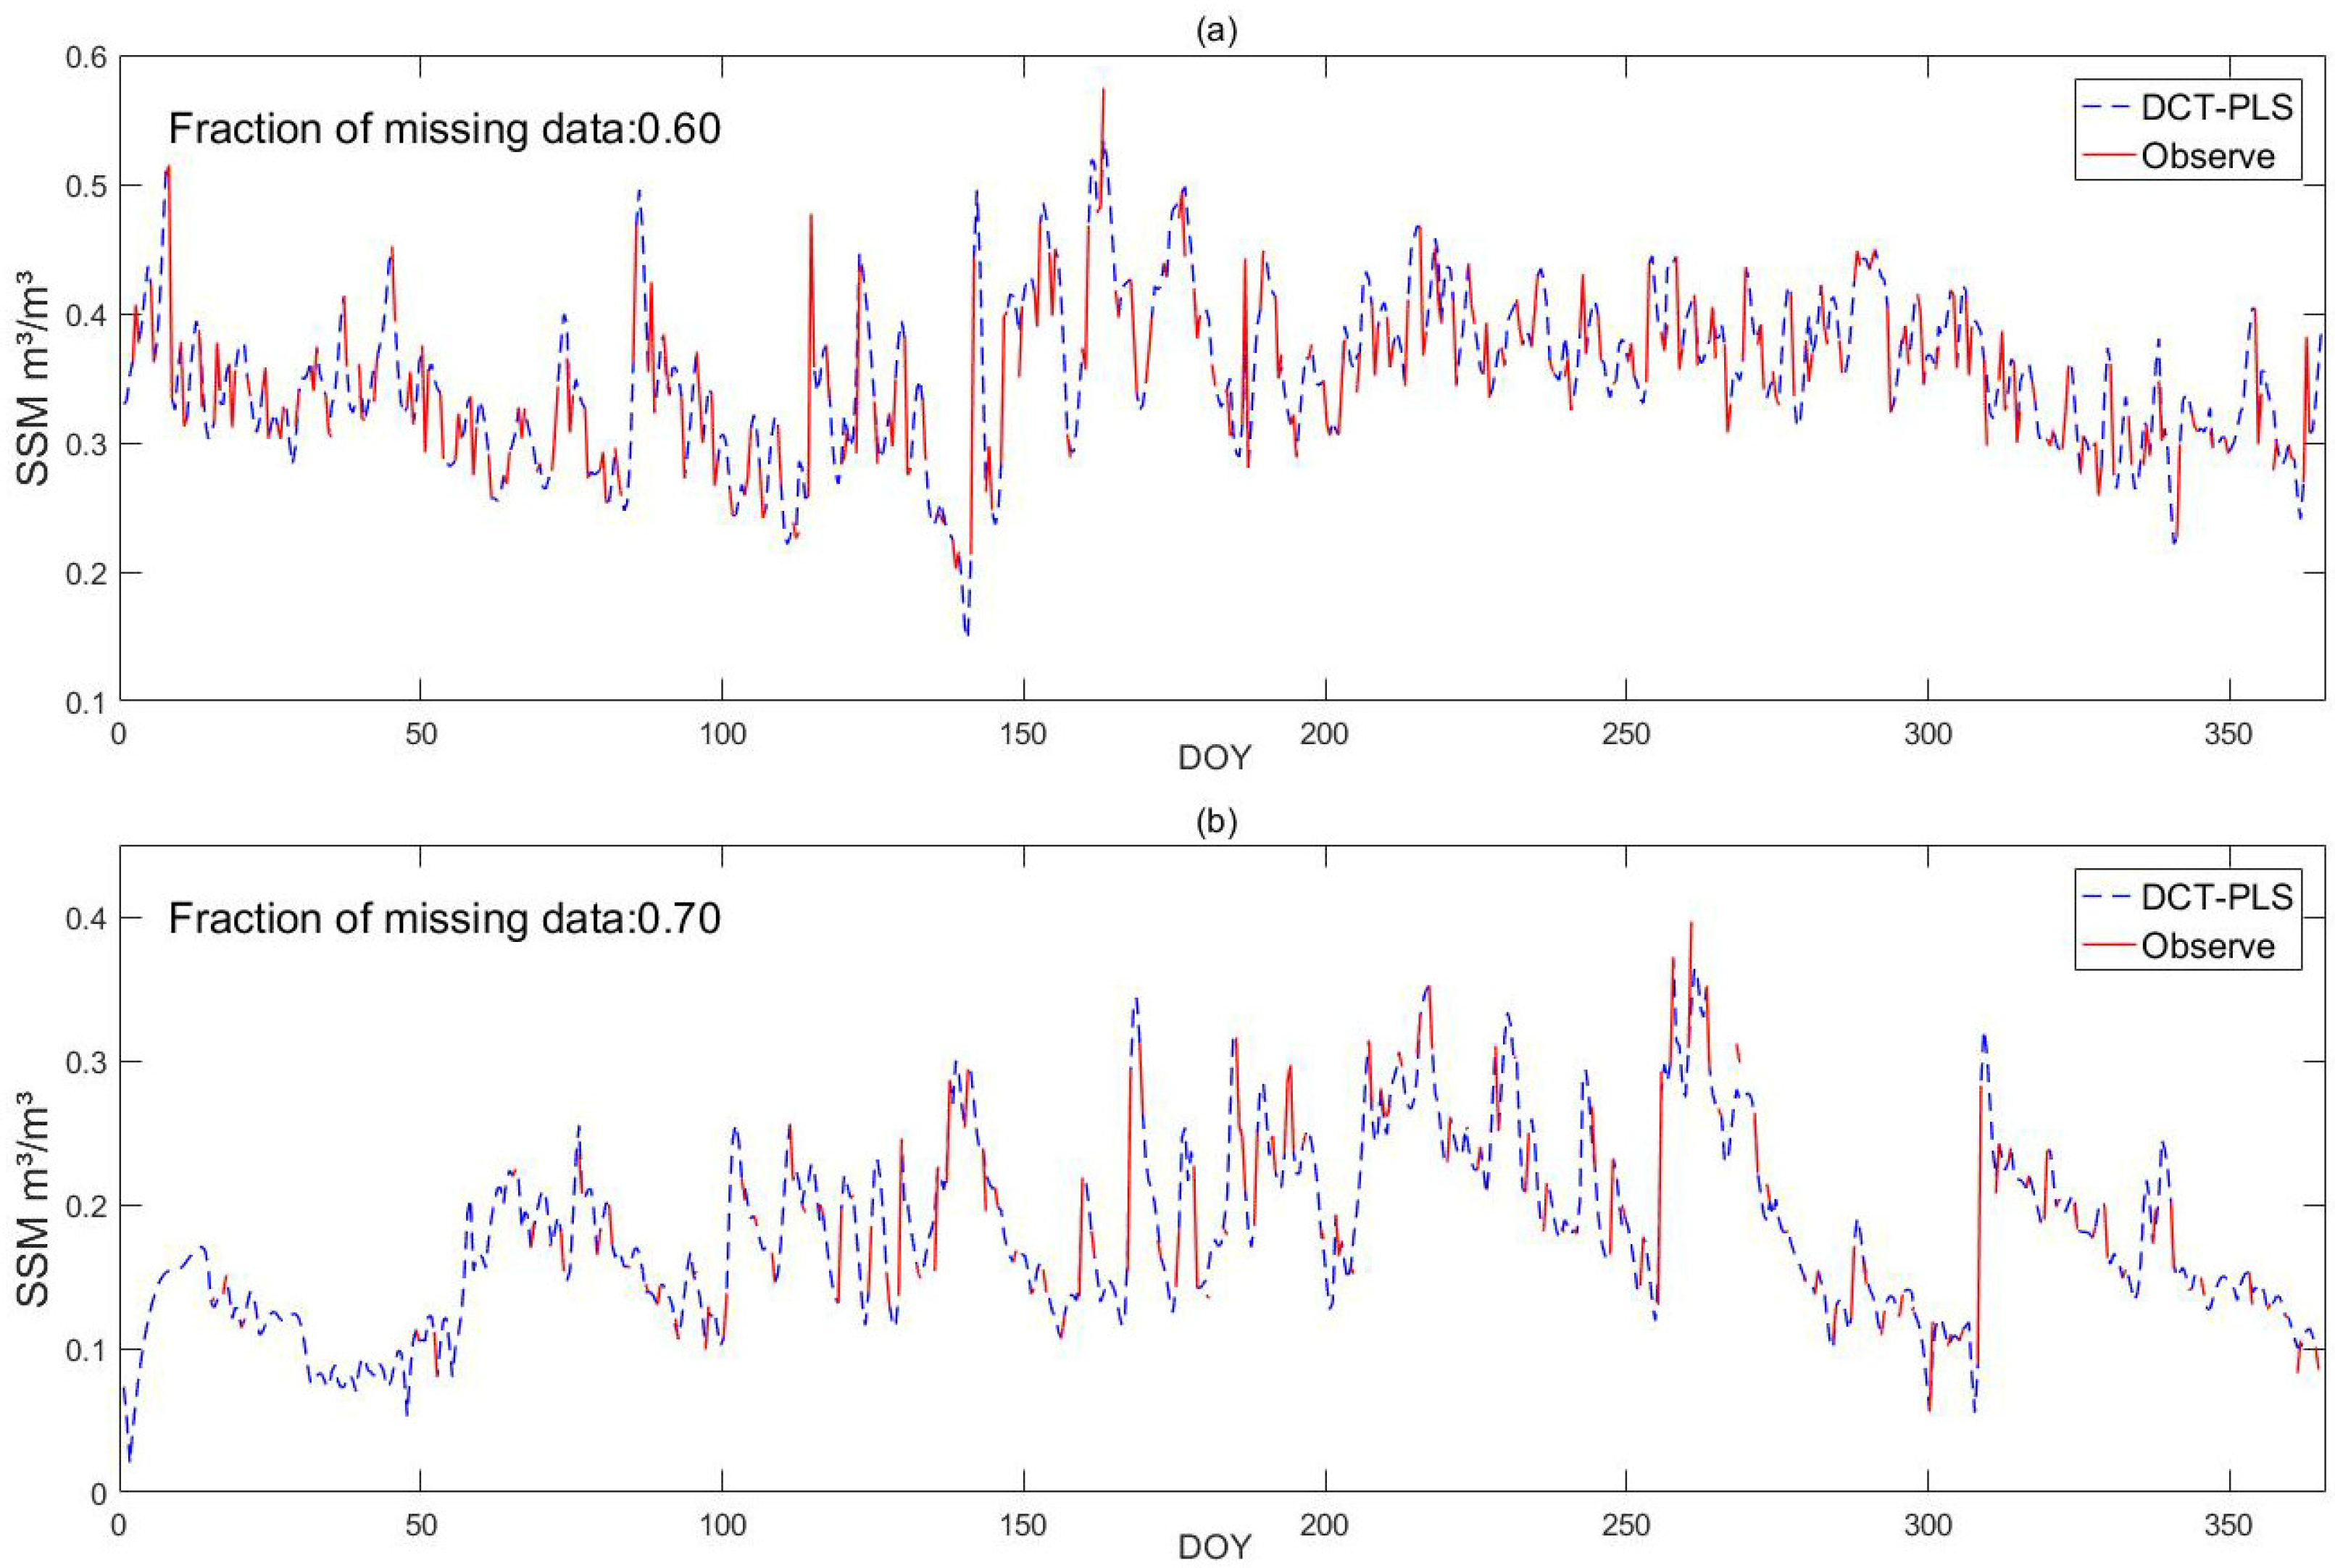
Figure 7.
Comparisons of the reconstructed SSM corresponding to missing data regions (a) and all reconstructed SSM (b) against in situ SSM measurements at 2980 meteorological stations during March–October in 2018.
Figure 7.
Comparisons of the reconstructed SSM corresponding to missing data regions (a) and all reconstructed SSM (b) against in situ SSM measurements at 2980 meteorological stations during March–October in 2018.

Figure 8.
Scatter plots of predicted SM against measured SM of the RF (a), ERT (b), XGBoost (c), and LightGBM (d) models during train (left) and validation (right).
Figure 8.
Scatter plots of predicted SM against measured SM of the RF (a), ERT (b), XGBoost (c), and LightGBM (d) models during train (left) and validation (right).
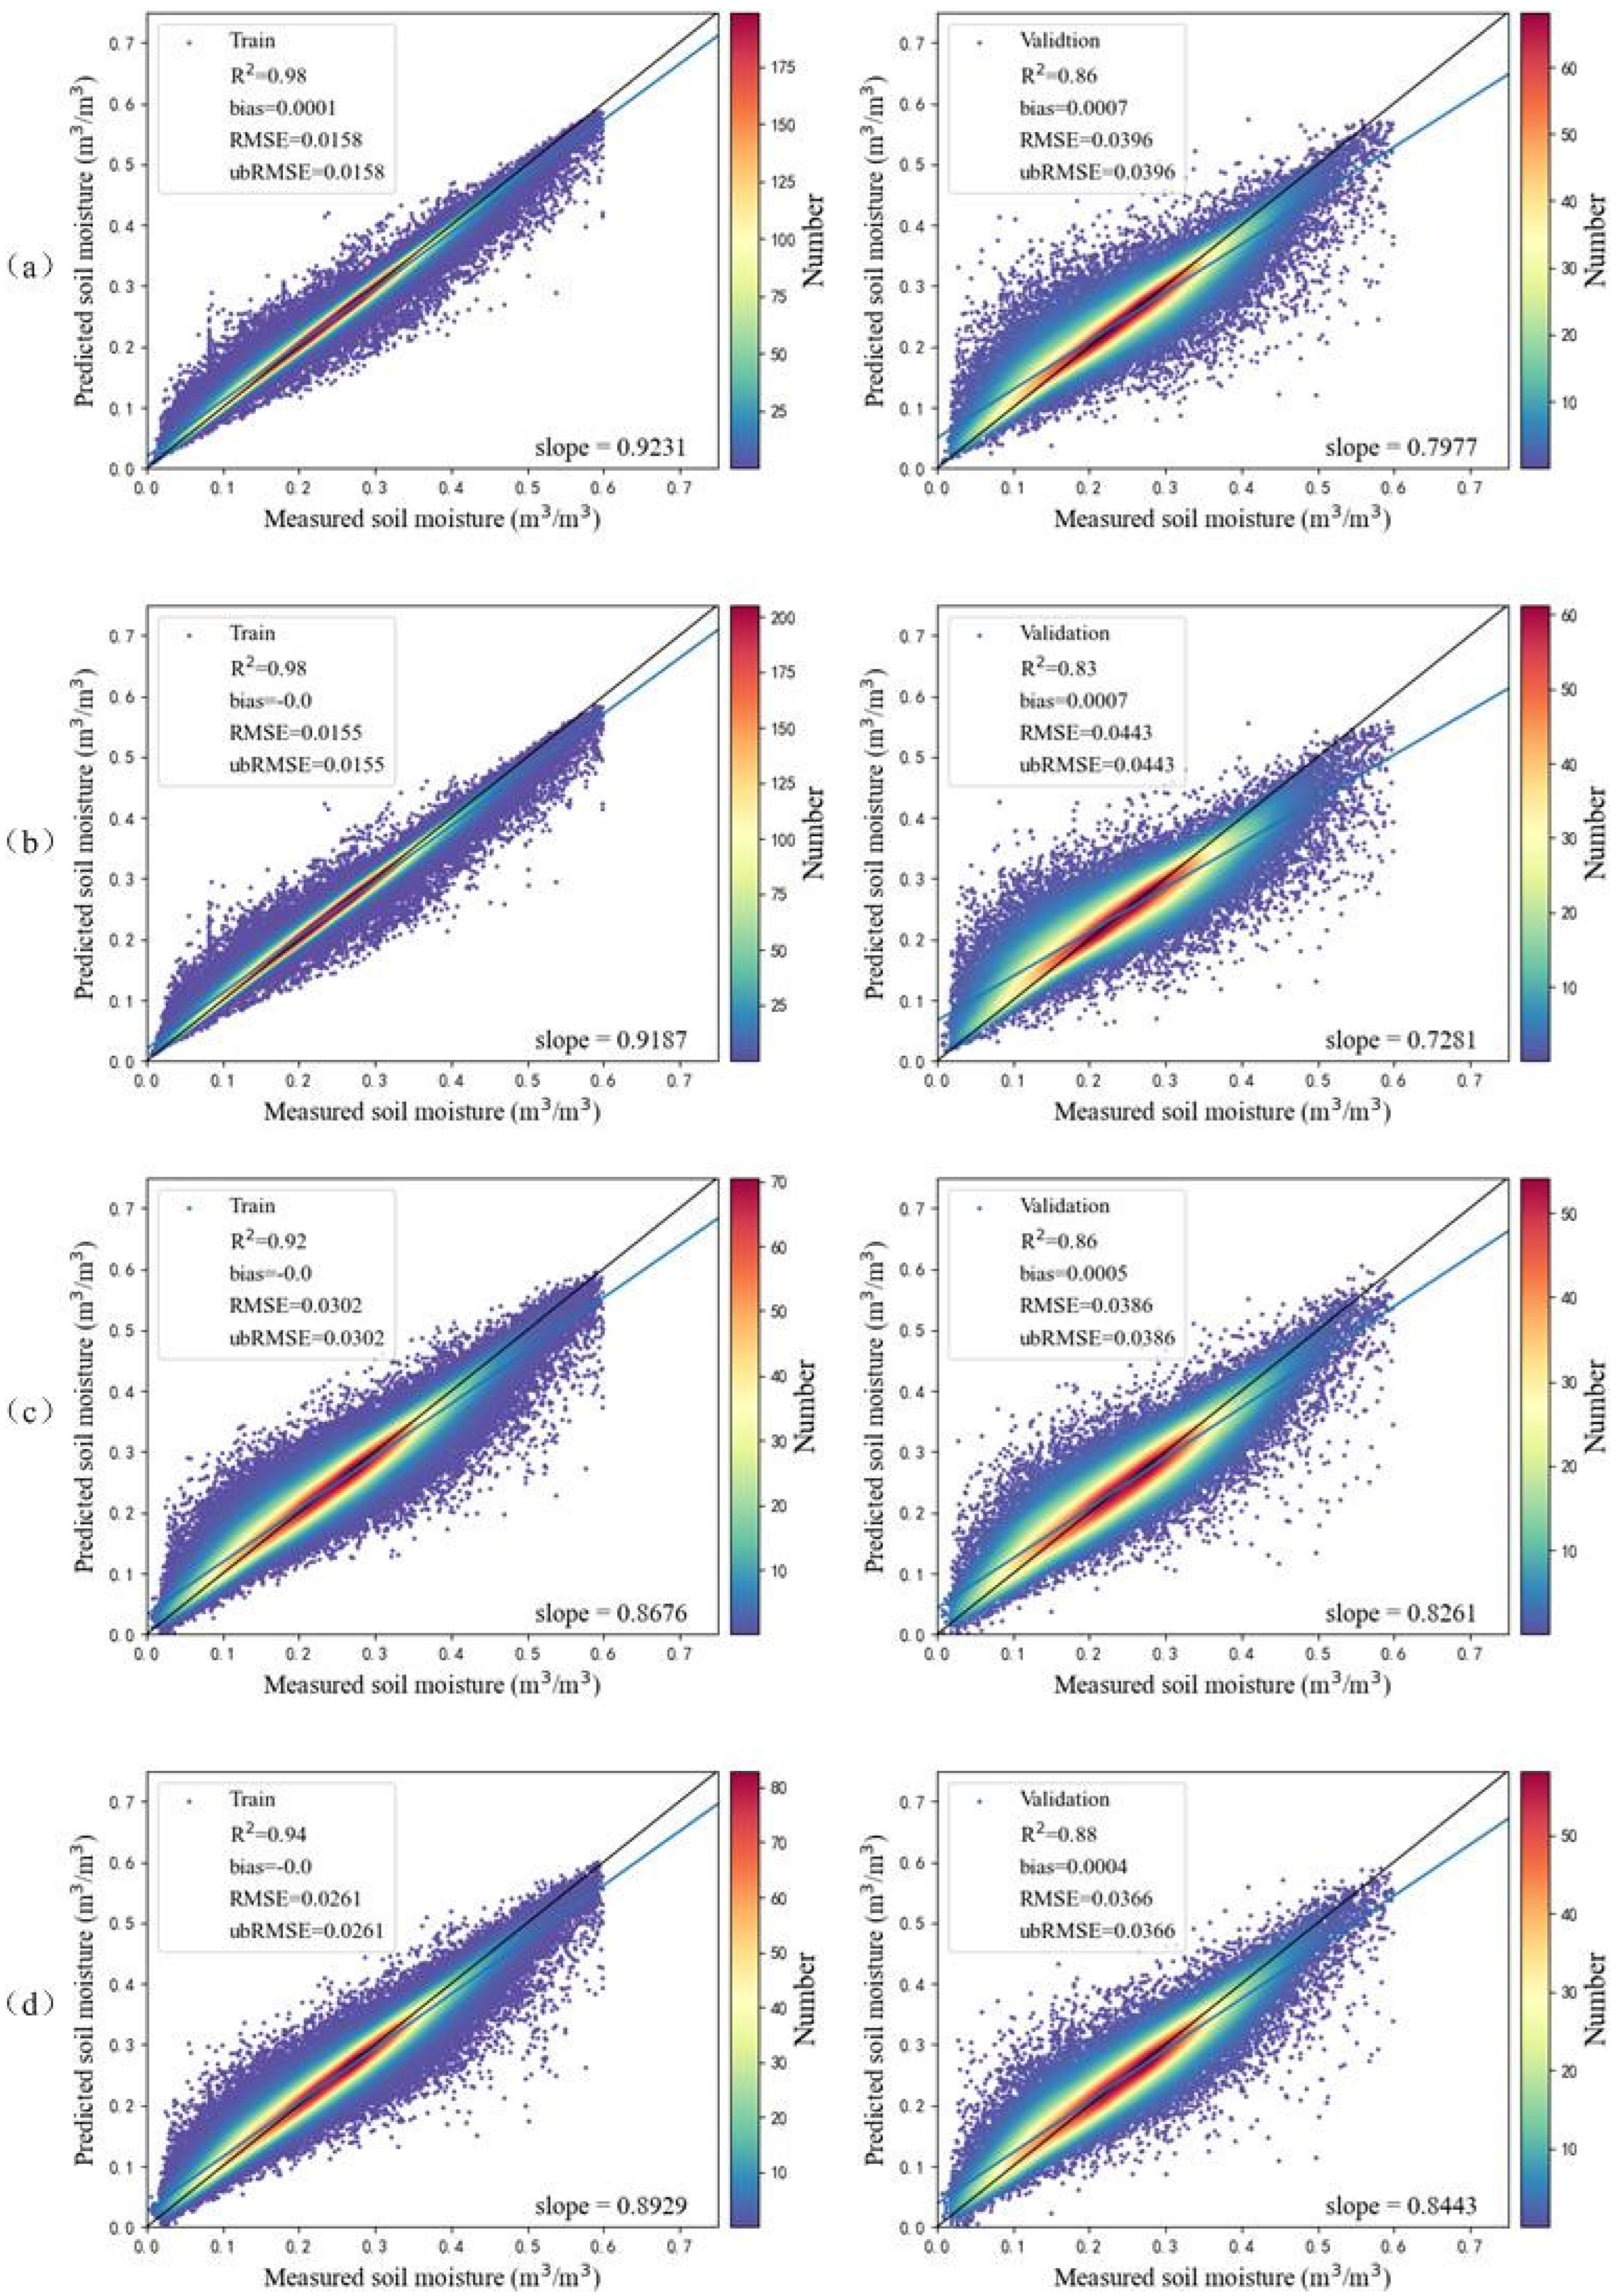
Figure 9.
The values of R (a) and ubRMSE (b) of the LightGBM model at each in situ station.
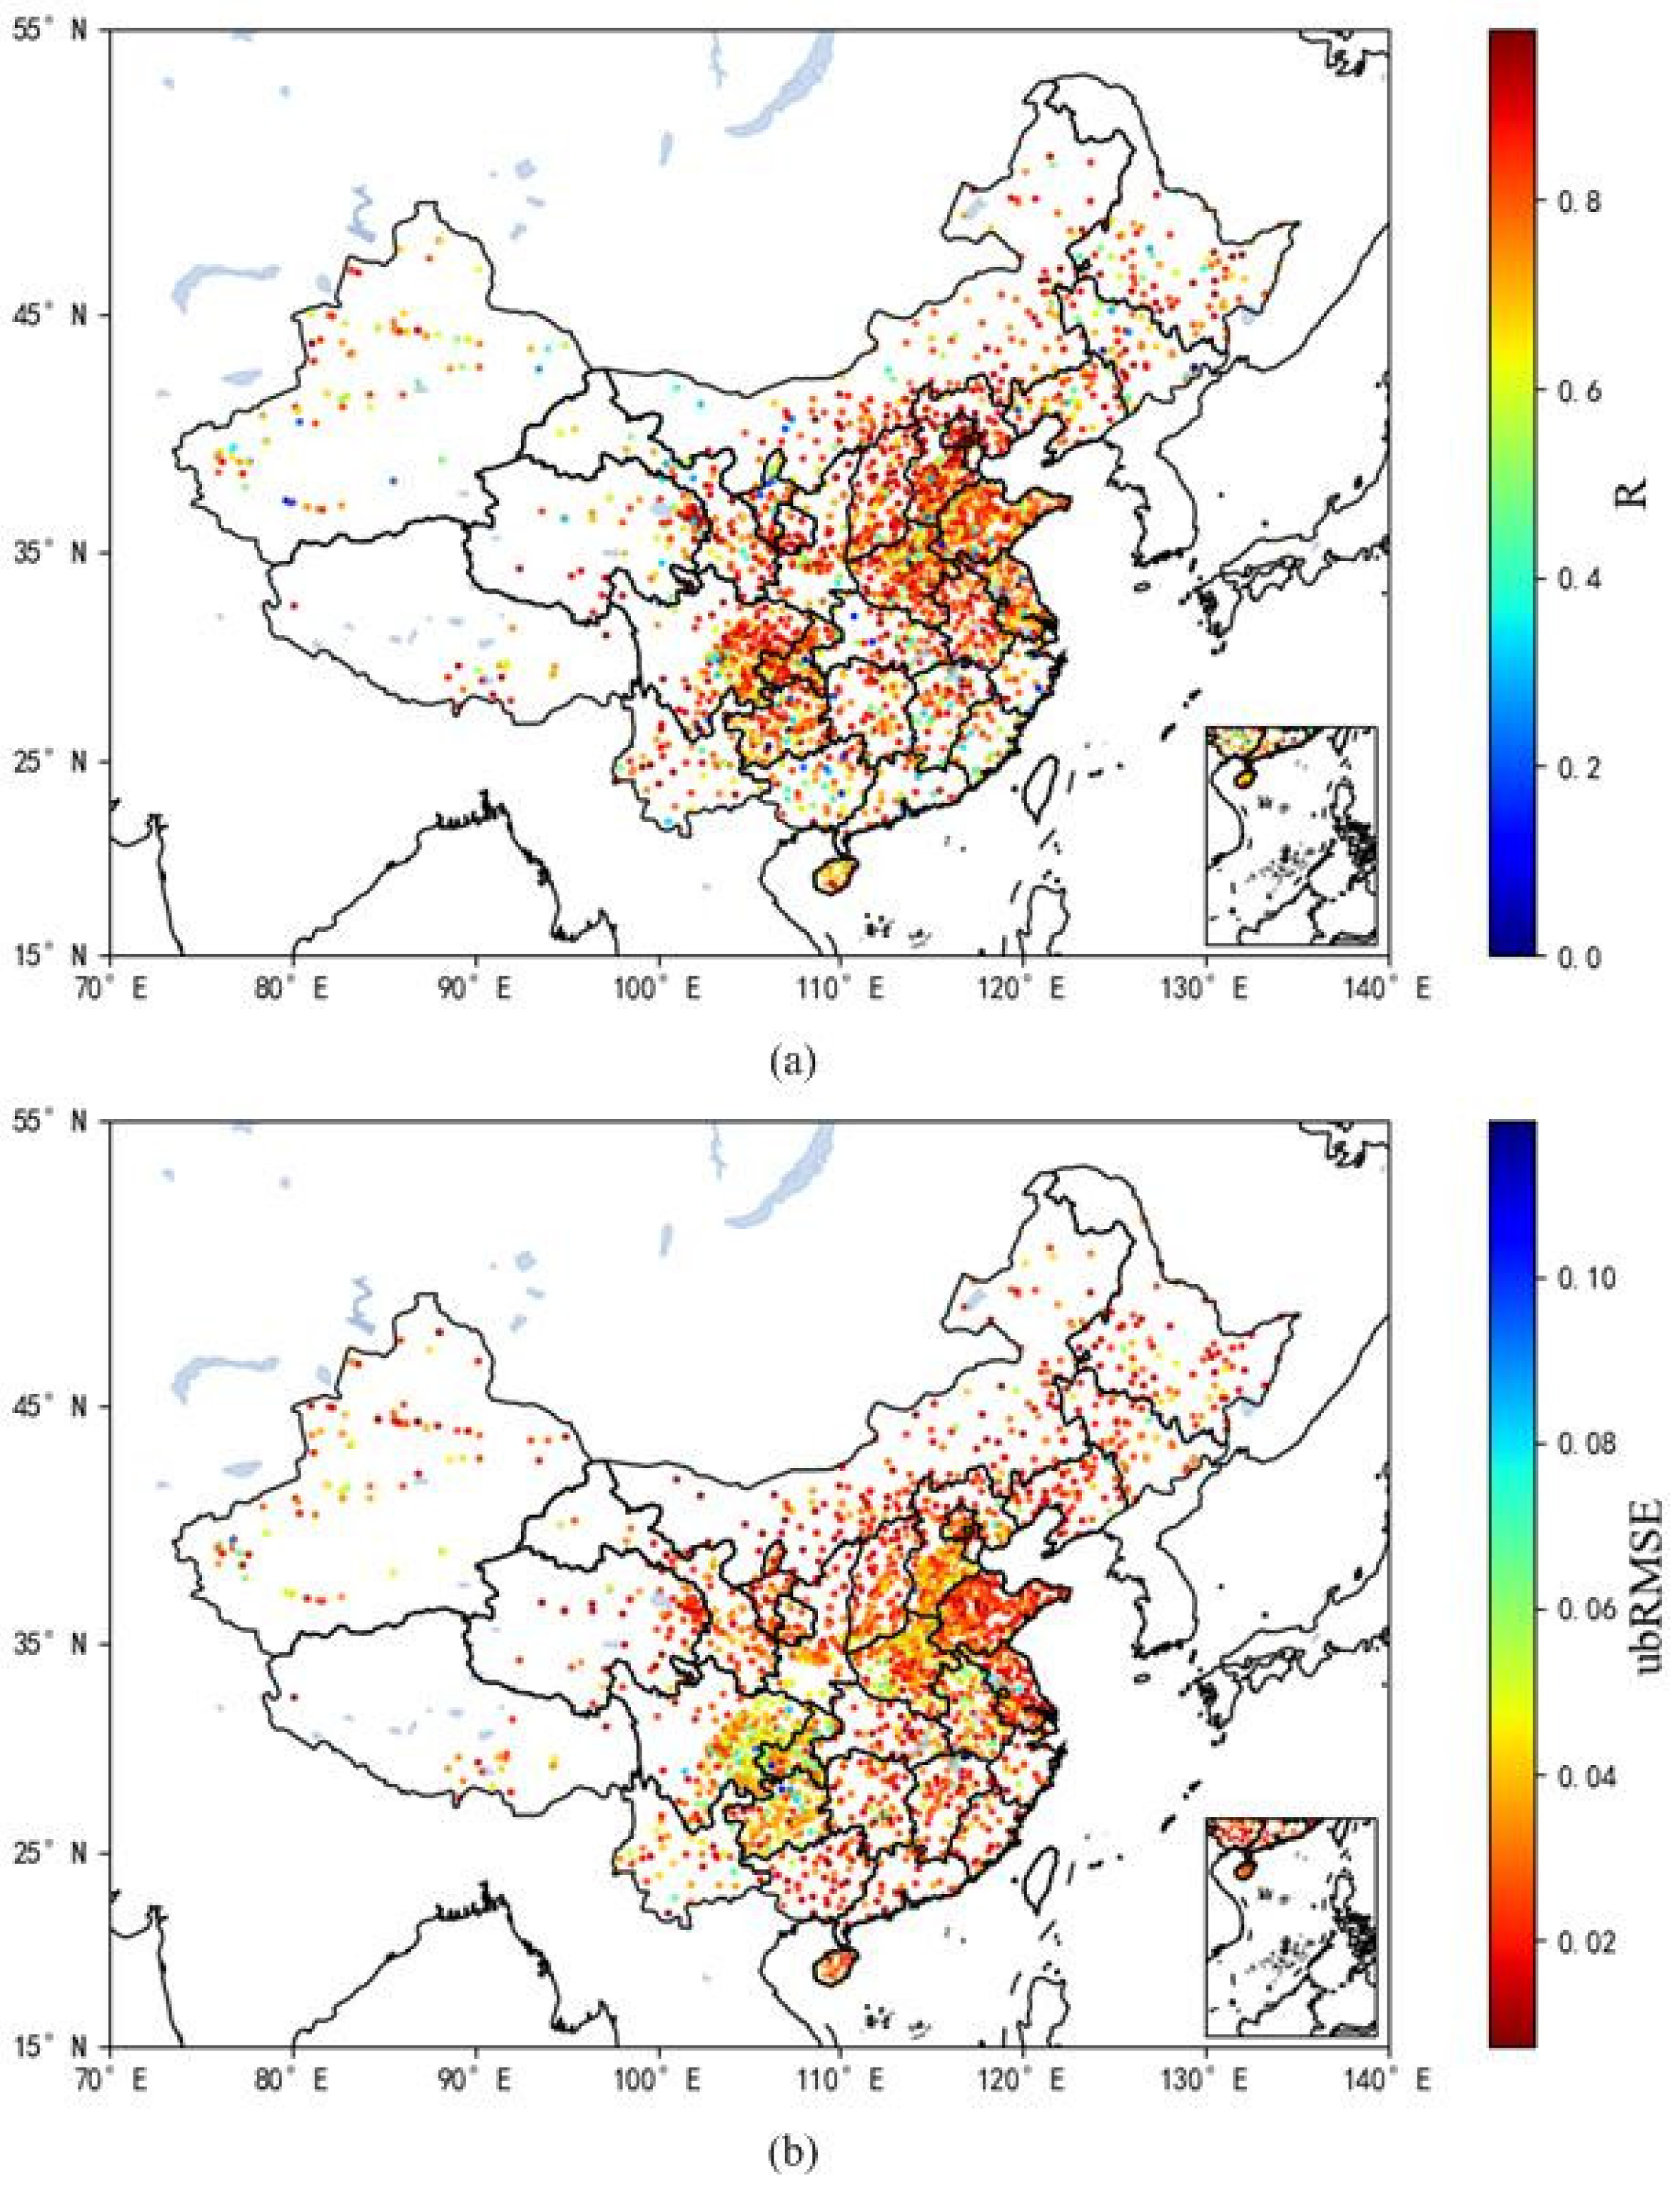
Figure 10.
Spatial distribution map of 1 km surface soil moisture in China. (a–f) are the surface soil moisture in China on the first day of each month from May to October 2018, respectively.
Figure 10.
Spatial distribution map of 1 km surface soil moisture in China. (a–f) are the surface soil moisture in China on the first day of each month from May to October 2018, respectively.

Figure 11.
The relative importance of predictors of the RF (a), ERT (b), XGBoost (c), and LightGBM (d) models.
Figure 11.
The relative importance of predictors of the RF (a), ERT (b), XGBoost (c), and LightGBM (d) models.

Table 1.
List of remote sensing data used in this study.
| Dataset | Source | Spatial Resolution | Temporal Resolution | Index | Reference |
|---|---|---|---|---|---|
| MYD09A1 | NASA LAADS DAAC | 500 m | 8d | NDVI | (Tucker et al., 1980 [33]) |
| NDWI | (Gao et al., 1995 [34]) | ||||
| DDI | (Qin et al., 2010 [35]) | ||||
| SMAP L3 SM | NSIDC | 36 km | 1d | SM | (O’Neill et al., 2021 [36]) |
| TRIMS LST | TPDC | 1 km | 1d | LST | (Zhou et al., 2021 [37]) |
Disclaimer/Publisher’s Note: The statements, opinions and data contained in all publications are solely those of the individual author(s) and contributor(s) and not of MDPI and/or the editor(s). MDPI and/or the editor(s) disclaim responsibility for any injury to people or property resulting from any ideas, methods, instructions or products referred to in the content. |
© 2023 by the authors. Licensee MDPI, Basel, Switzerland. This article is an open access article distributed under the terms and conditions of the Creative Commons Attribution (CC BY) license (https://creativecommons.org/licenses/by/4.0/).
Share and Cite
MDPI and ACS Style
Yang, Z.; He, Q.; Miao, S.; Wei, F.; Yu, M. Surface Soil Moisture Retrieval of China Using Multi-Source Data and Ensemble Learning. Remote Sens. 2023, 15, 2786. https://doi.org/10.3390/rs15112786
AMA Style
Yang Z, He Q, Miao S, Wei F, Yu M. Surface Soil Moisture Retrieval of China Using Multi-Source Data and Ensemble Learning. Remote Sensing. 2023; 15(11):2786. https://doi.org/10.3390/rs15112786
Chicago/Turabian StyleYang, Zhangjian, Qisheng He, Shuqi Miao, Feng Wei, and Mingxiao Yu. 2023. "Surface Soil Moisture Retrieval of China Using Multi-Source Data and Ensemble Learning" Remote Sensing 15, no. 11: 2786. https://doi.org/10.3390/rs15112786
Note that from the first issue of 2016, this journal uses article numbers instead of page numbers. See further details here.