Article

Mangrove Biodiversity Assessment Using UAV Lidar and Hyperspectral Data in China’s Pinglu Canal Estuary

1
School of Resources and Environment, Beibu Gulf University, Qinzhou 535011, China
2
Beibu Gulf Ocean Development Research Center, Beibu Gulf University, Qinzhou 535011, China
3
Guangxi Key Laboratory of Marine Disaster in the Beibu Gulf, Beibu Gulf University, Qinzhou 535011, China
4
Key Laboratory of Marine Geographic Information Resources Development and Utilization in the Beibu Gulf, Beibu Gulf University, Qinzhou 535011, China
5
Guangxi Key Laboratory for Geospatial Informatics and Geomatics Engineering, Guilin University of Technology, Guilin 541004, China
*
Author to whom correspondence should be addressed.
Remote Sens. 2023, 15(10), 2622; https://doi.org/10.3390/rs15102622
Submission received: 3 April 2023 / Revised: 13 May 2023 / Accepted: 14 May 2023 / Published: 18 May 2023

Abstract

:
Mangrove forests are a valuable resource for biological and species diversity, and play a critical role in maintaining biodiversity. However, traditional plant biodiversity survey methods, which rely on labor-intensive field surveys, are not suitable for large-scale continuous spatial observations. To overcome this challenge, we propose an innovative framework for mangrove biodiversity assessment and zoning management based on drone low-altitude remote sensing, integrating data such as vertical structure features and spectral diversity features extracted from on-site measurements, airborne LiDAR, and hyperspectral data. This study focuses on the Maowei Sea mangrove community, located in the estuary of China’s first Pinglu Canal since the founding of the People’s Republic of China. Using the proposed framework, we construct an evaluation index for mangrove biodiversity at the levels of species diversity, ecosystem diversity, and landscape diversity, achieving a quantitative calculation of mangrove biodiversity and an evaluation of spatial distribution patterns. The results show that the biodiversity index of mangroves ranges from 0 to 0.63, with an average value of 0.29, and high-biodiversity areas are primarily concentrated in the southwest of the study area, while low-value areas are mainly located in the north. We also select the elevation and offshore distance of mangrove growth for the spatial zoning of biodiversity. The core area of biodiversity occupies the smallest area, at 2.32%, and is mainly distributed in areas with an elevation of 1.43–1.59 m and an offshore distance of 150.08–204.28 m. Buffer zones and experimental zones account for a significant proportion, with values of 35.99% and 61.69%, respectively. Compared to traditional methods for monitoring mangrove biodiversity, such as community field-sample surveys, the proposed method using unmanned-aerial-vehicle LiDAR and hyperspectral coupling technology to assess mangrove biodiversity and establish a zoning management framework is more conducive to formulating mangrove biodiversity conservation strategies. The study provides a feasible solution for the large-scale biodiversity mapping of mangroves in the Maowei Sea at the estuary of the Pinglu Canal.

1. Introduction

Mangroves are a type of wetland vegetation consisting of evergreen trees and shrubs dominated by mangrove plants that grow in the intertidal zones of the tropical and subtropical coasts. This ecosystem is unique because it serves as a transitional zone between land and sea [1]. Mangrove forests are commonly referred to as “coastal guardians” and “marine green lungs” due to their vital roles in protecting coasts and maintaining the balance of marine life. They provide crucial habitats for rare and endangered waterfowls, as well as fish, shrimp, crabs, and shellfish. Mangroves are essential for slowing tidal currents, promoting sediment deposition, protecting coasts from erosion, sequestering carbon, and maintaining biodiversity. Mangrove ecosystems have an extraordinary diversity of species and the highest ecosystem service functions on the planet, making them of immense ecological value [1,2,3]. Unfortunately, global climate change has led to an increase in sea levels, seawater warming, and coastal disasters such as storm surges, ocean waves, shoreline erosion, and typhoons [4]. Human activities such as wetland reclamation, aquaculture expansion, and urbanization have also had devastating impacts on mangrove ecosystems and their biodiversity [5,6]. Consequently, the global mangrove area has decreased by 30–50% over the past 50 years [7,8]. Mangrove forests in most regions of the world are facing various challenges, including biodiversity decline, ecosystem function degradation, and inadequate protection [9]. Therefore, it is essential to conduct a quantitative assessment of the spatial distribution pattern of mangrove biodiversity to carry out mangrove biodiversity assessments and identify key protected areas. This will provide a scientific basis for governments to formulate conservation strategies, propose conservation measures, and carry out conservation actions. The protection of global mangrove biodiversity is of great significance for achieving sustainable goals.
An efficient evaluation of biodiversity is crucial for conservation efforts [10]. The United Nations Convention on Biological Diversity (CBD) aims to prevent biodiversity loss, with 196 nations serving as signatories. In 2022, the “Kunming Montreal Global Biodiversity Framework” established a target to protect at least 30% of land and marine areas by 2030, building on the “Aichi Biodiversity Goal 11” from 2010–2020 [11,12,13]. Research shows that core protected areas have increased, but most critical marine areas, such as mangroves, remain under-protected [14]. To achieve the 2030 goal, mangrove biodiversity protection must be reinforced. Traditional mangrove monitoring methods, which focus on field surveys and species changes, are affected by natural conditions and require substantial resources [15,16,17]. Technological advancements have improved monitoring efficiency through satellite remote sensing, offering high-resolution hyperspectral data [18,19]. For example, Wang et al. developed a global biodiversity method using multispectral and hyperspectral images [20]. However, this study did not consider the vertical structure of mangroves, which is essential for constructing a biodiversity index for mangrove species [16,17].
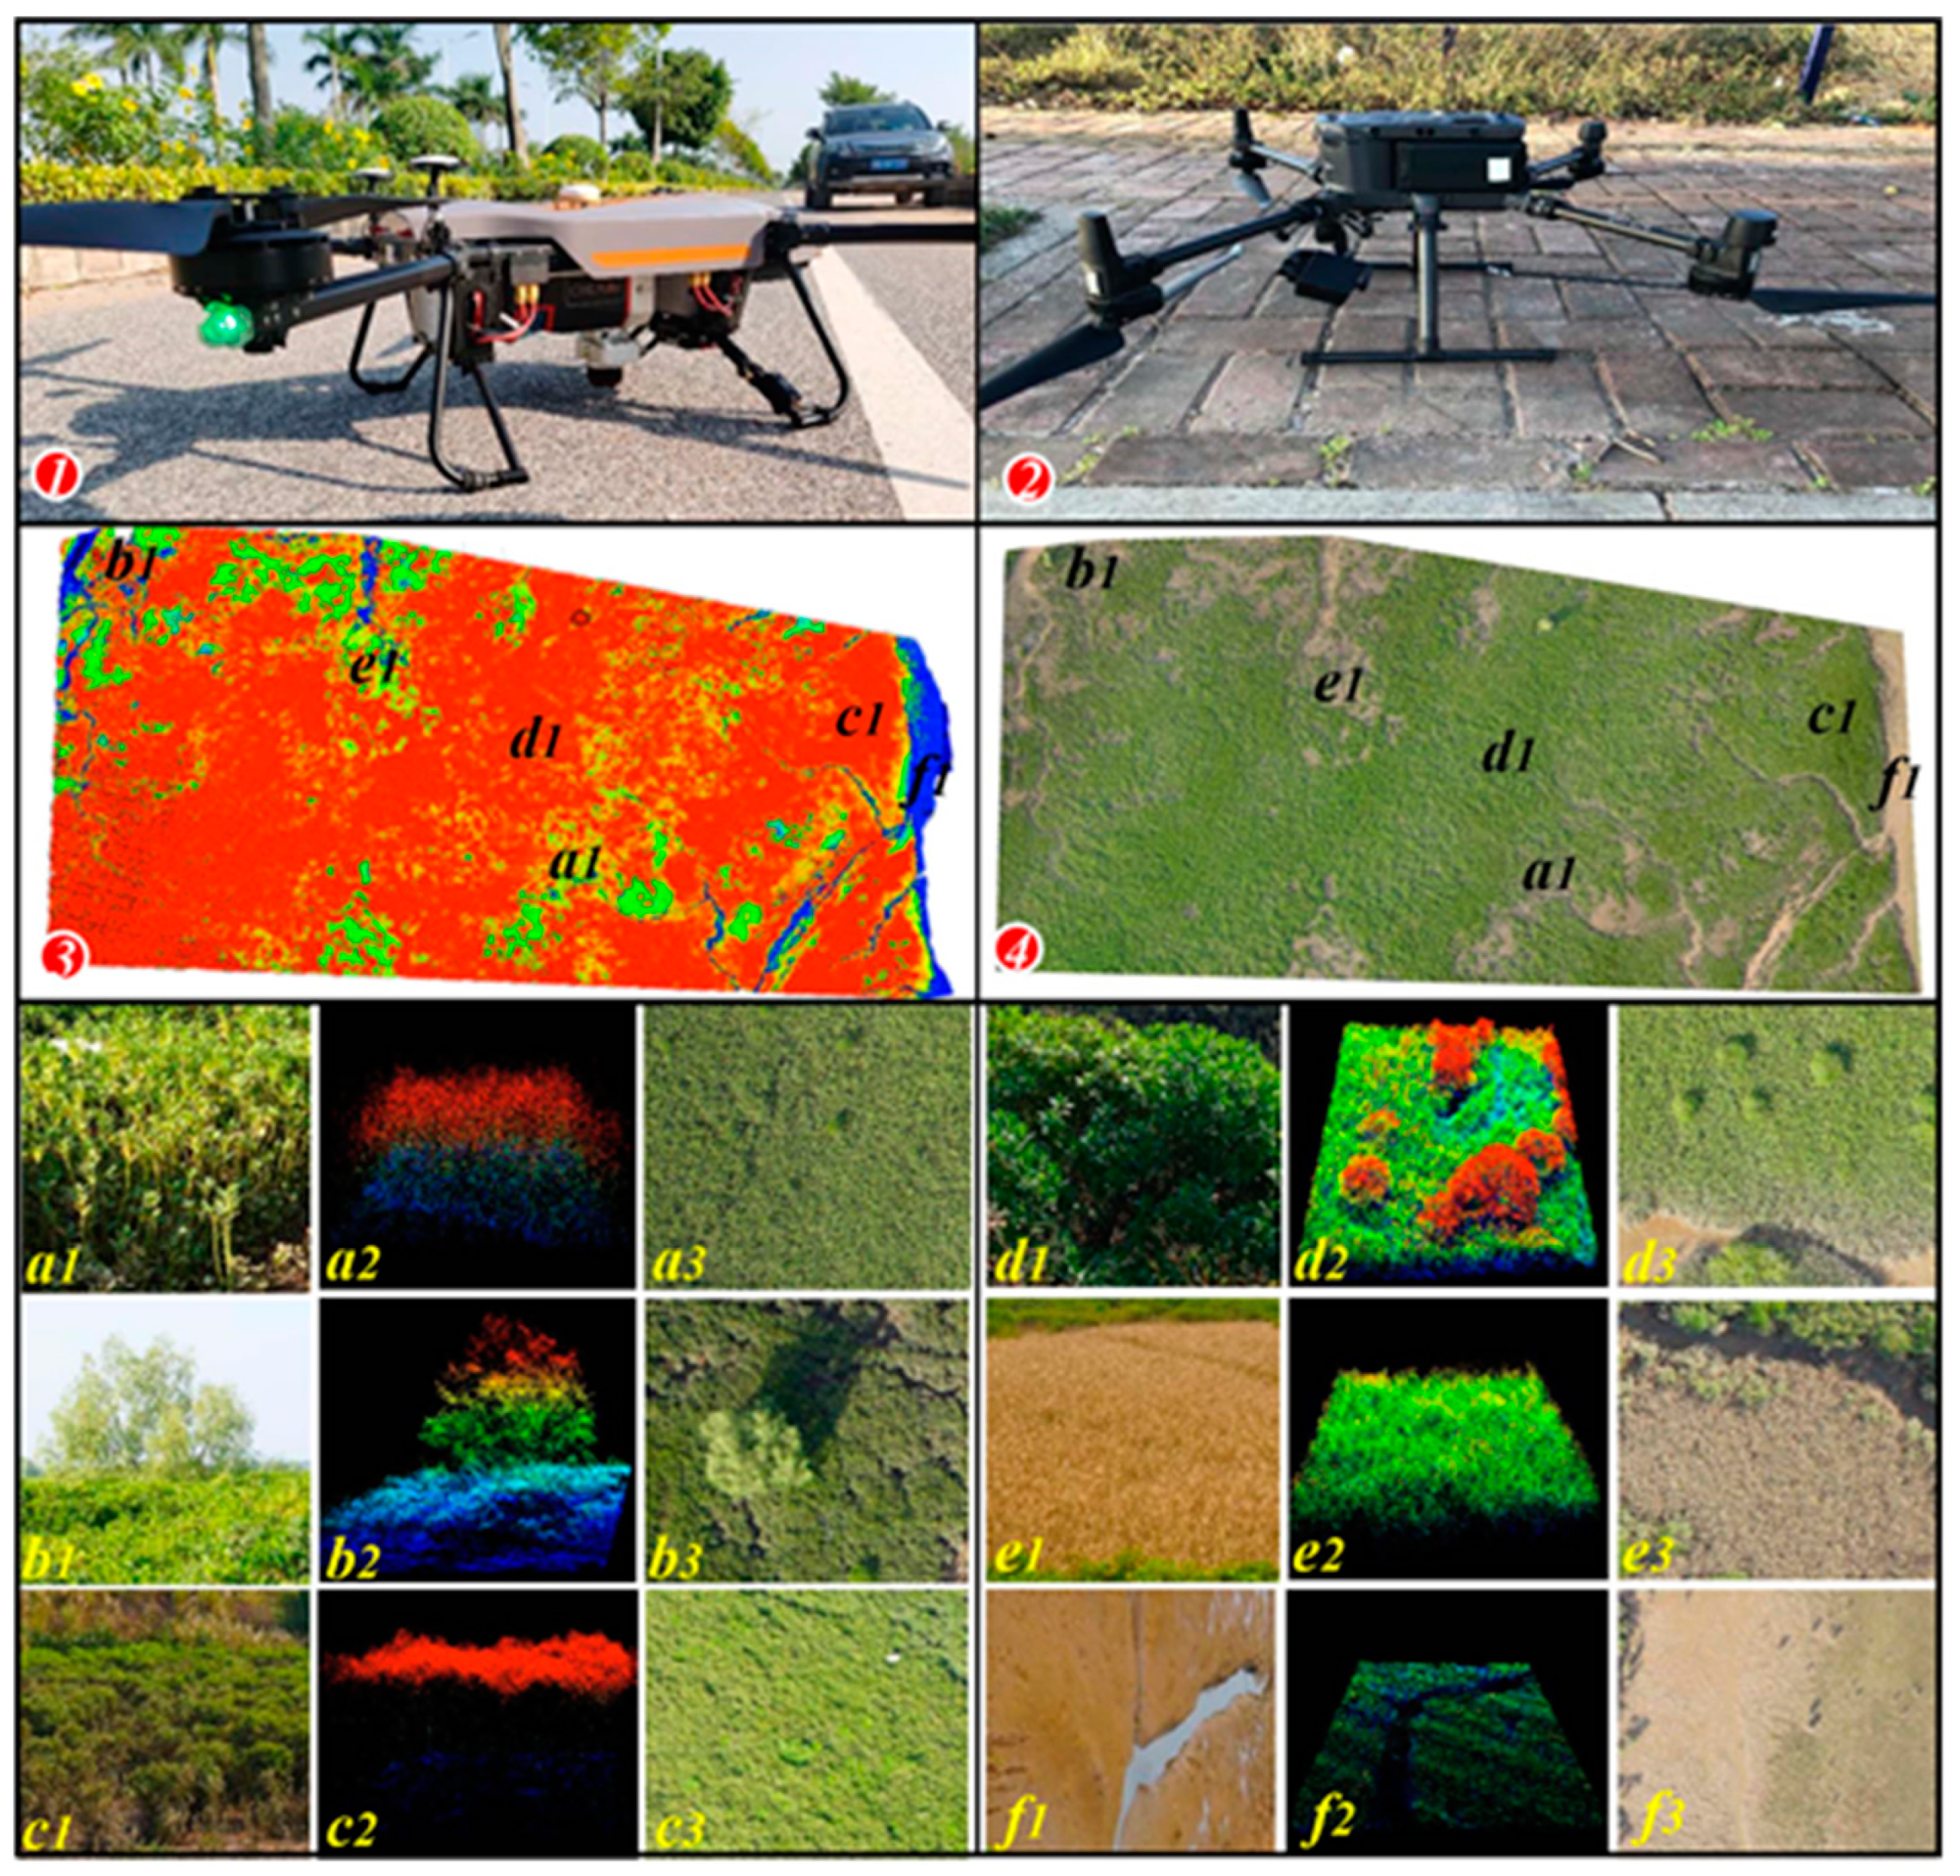
Low-altitude unmanned-aerial-vehicle (UAV) remote sensing technology has emerged as a promising tool for collecting high-resolution mangrove remote sensing data at any time with characteristics such as fast image acquisition, short application cycle, high definition, low constraints on the natural environment, and low operation and maintenance costs [21,22,
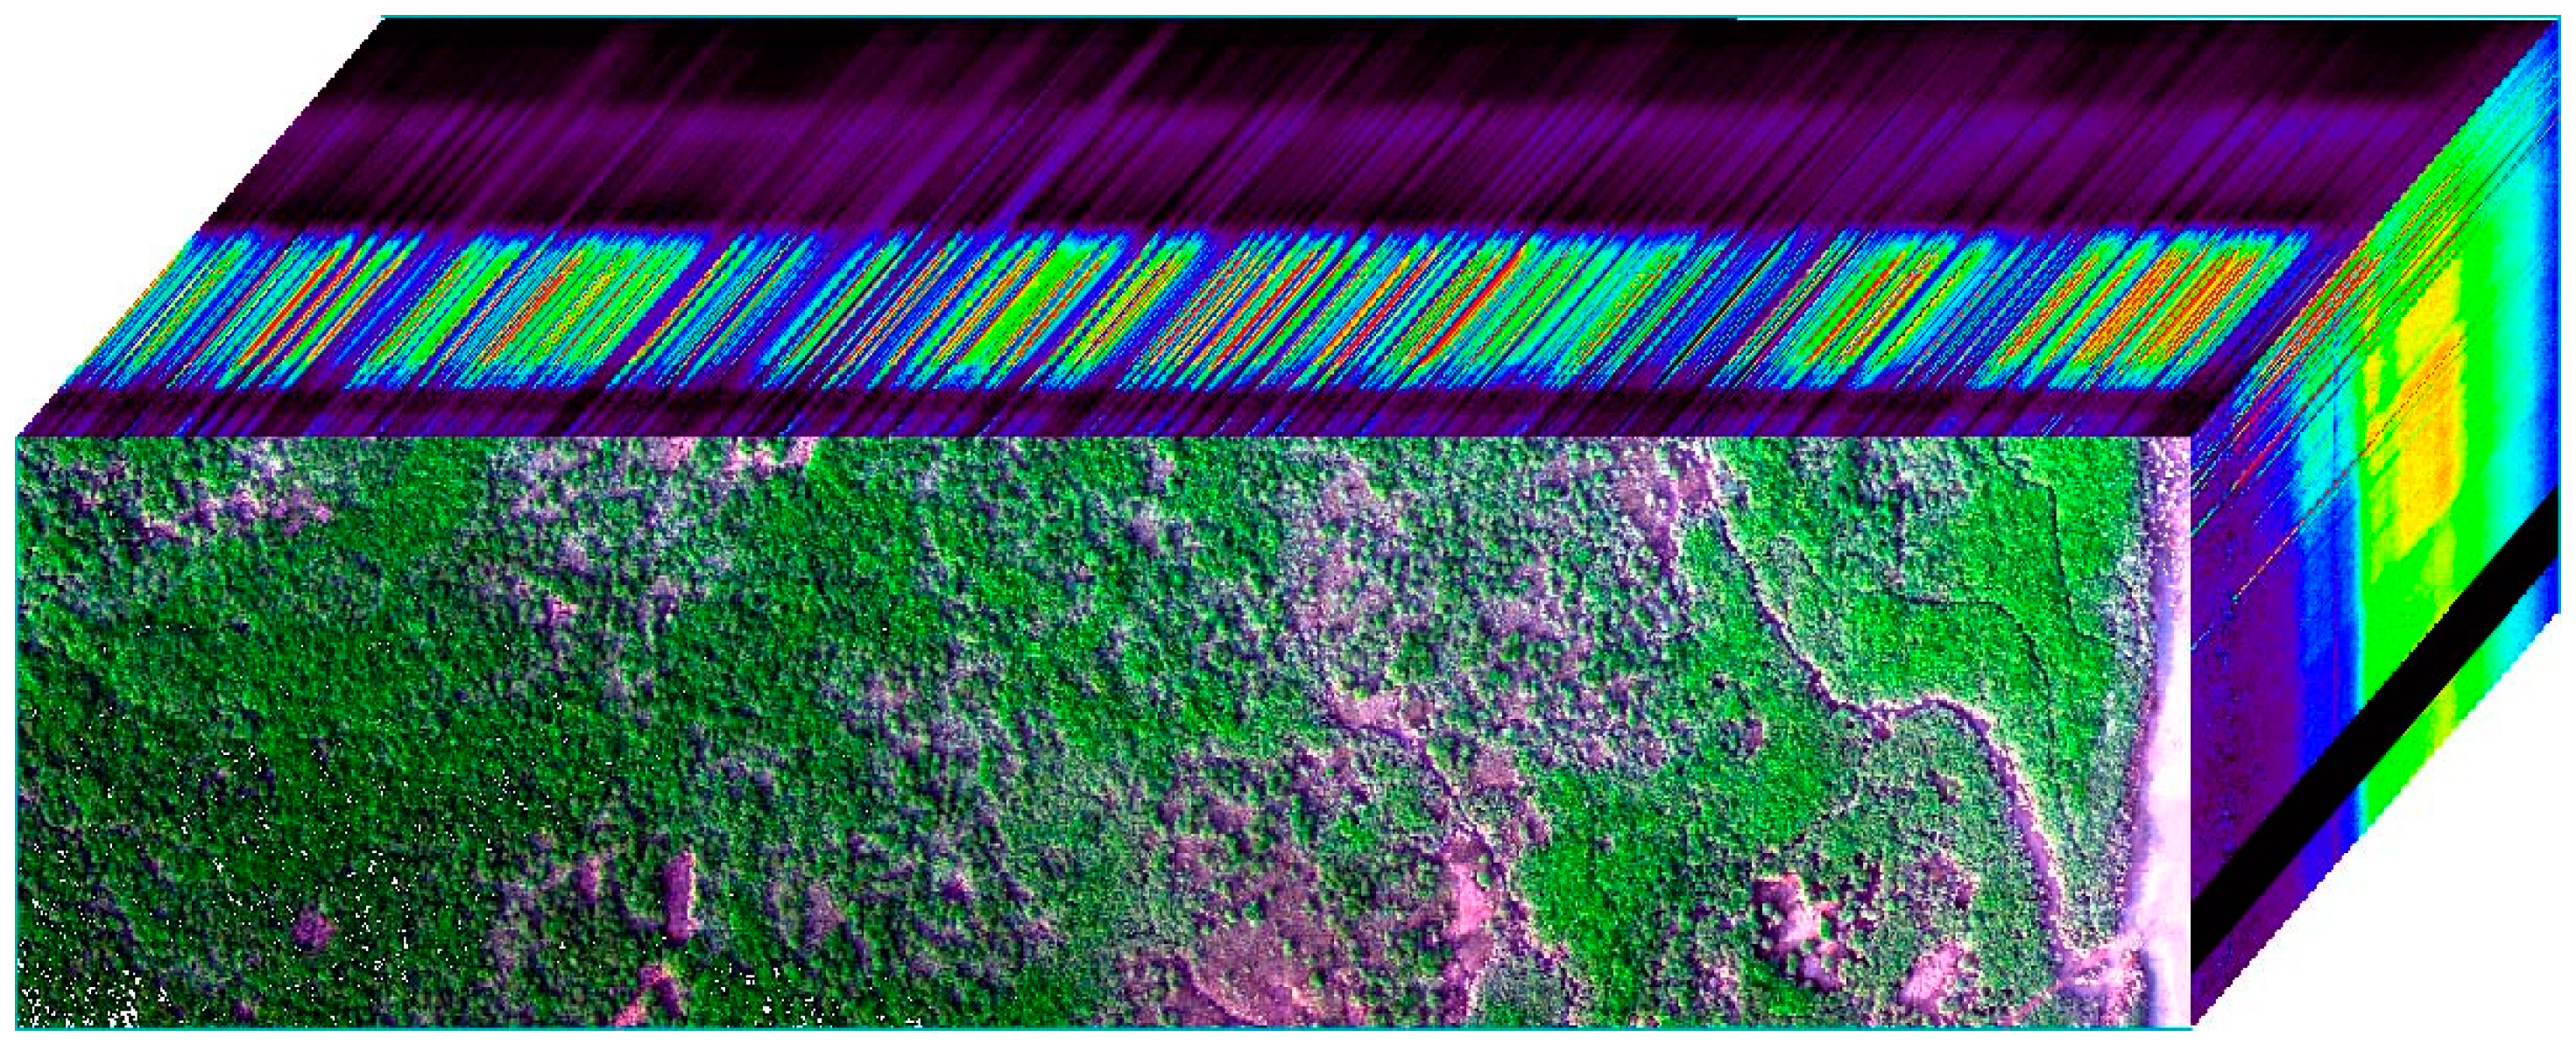
23]. UAV remote sensing can obtain high-precision hyperspectral images and LiDAR data, which can fully compensate for the limitations of traditional satellite remote sensing and ordinary aerial remote sensing and bridge the gap between satellite remote sensing and traditional ground survey methods. This study provides a new perspective and program for biodiversity investigation and monitoring and is considered to have an important revolutionary role in the field of ecological research [24]. Low-altitude remote sensing technology for monitoring biodiversity can directly identify mangrove species, community types, and spatial distribution due to the high spatial and hyperspectral resolution provided by drones [25,26,27], which reflects the biodiversity of mangroves. For instance, Cao et al. [28] combined drone hyperspectral images with digital surface models and studied the classification of mangrove populations in Qiao, Guangdong Province, using the nearest neighbor method and support vector machine classification methods. Moreover, several indicators derived from remote sensing data that can reflect biodiversity, such as leaf area index [29], spectral diversity parameters [30,31], and biomass [32,33], can be employed to assess biodiversity characteristics. Among the various biodiversity estimation methods, the “spectral variation hypothesis” suggests that the number of plant species increases with observed spectral diversity [34,35]. The spectral diversity index has gradually become a crucial approach for remote monitoring of biodiversity. For example, Bongalov et al. [36] conducted spectral image clustering of airborne hyperspectral data in the Malaysian tropical rainforest, treating each cluster as a “species”, and successfully estimated the area’s β diversity; Gholizadeh et al. [37] used airborne imaging hyperspectral data to evaluate the α and β diversity of grasslands and found that the performance of the coefficient of variation of mapping biodiversity was better than that of mapping convex hull volume and spectral angle over the entire study period, which was comparable to the performance of spectral species. Xu et al. [38] established quantitative models for the coefficient of variation, minimum convex hull volume, minimum convex hull area, and Shannon–Wiener diversity index based on remote sensing data from unmanned aerial vehicles in alpine grasslands. Most of these methods rely on low-altitude hyperspectral remote sensing data to explore spectral diversity among species, which is an emerging dimension for measuring plant biodiversity that integrates the characteristics of traits within and between species. In recent years, the “height variation hypothesis” has been increasingly employed to study forest biodiversity [39]. In complex mangrove ecosystems, drone laser point clouds can be used to obtain height and three-dimensional structural information within the mangrove canopy. By combining three-dimensional information, it can also be used to distinguish the canopies of different mangrove species [16,28]. For example, Tian et al. [16] classified mangrove species in the Maowei Sea of Beibu Gulf based on UAV LiDAR point-cloud data and successfully classified the mangrove community in the area into exotic Sonneratia apetala and Aegiceras corniculatum species. Combining the “spectral variation hypothesis” with the “height variation hypothesis” to assess the forest diversity often yields satisfactory results. For example, Asner et al. [40] combined LiDAR and hyperspectral techniques to evaluate the biochemical characteristics of canopy leaves in 79 sample plots in the Andes, and extended the study to the entire tropical rainforest of Peru. They retrieved the leaf nitrogen and phosphorus content of different forest canopy tree species and obtained the forest functional diversity index of the region. Zheng et al. [41] obtained the morphological and physiological characteristics of each individual tree crown based on LiDAR and hyperspectral data, and plotted a distribution map of the functional diversity of subtropical forests in China at the individual level. However, from the current research and application perspective, a technical scheme for monitoring mangrove biodiversity by combining drones and ground-based methods has not yet been established, with insufficient attention being given to mangrove natural reserves as the primary research object. Most studies have focused on forest biodiversity assessment, and effective monitoring methods and research frameworks for mangrove biodiversity have not been established. There is limited interaction among multiple drone surveys in terms of monitoring technology integration, analysis, and processing. Key methods for managing and processing multi-source drone remote sensing monitoring data require further breakthroughs, particularly in areas lacking field surveys of mangrove biodiversity, based on low-altitude drone remote sensing technology. Few studies have evaluated mangrove biodiversity by coupling the “spectral variation hypothesis” and “height variation hypothesis” to construct a comprehensive indicator system.
The Pinglu Canal project spans approximately 140 km, originating at the mouth of the Pingtang River in Hengzhou City, Nanning, and traverses the watershed between the Shaping River and Jiuzhou River, a tributary of the Qinjiang River. After the reply to the environmental impact assessment, the construction of the Pinglu Canal was officially started on 28 August 2022, which was the first man-made canal built since the founding of the People’s Republic of China. The mangrove community at the estuary of the Pinglu Canal is located in the Maoweihai Mangrove Nature Reserve in the Beibu Gulf of Guangxi, which is a typical composite mangrove ecosystem reserve in China characterized by south subtropical estuaries, harbors, and coastal mudflat wetlands. The construction of the Pinglu Canal will alter the geomorphic characteristics, sedimentary facies distribution characteristics, and tidal flow characteristics of the mangrove area, resulting in changes in sediment erosion and deposition. Sedimentation changes will affect the tidal flat elevation information of the mangrove forest, while habitat changes will directly impact the mangrove ecosystem, indirectly affecting the quality of biological habitats and causing indirect damage to the habitat. Moreover, changes in the area and location of the intertidal zone will affect the degree of exposure and exposure time of mangroves, resulting in the disruption of the original biological community structure and a reduction in species. The environmental impact assessment results revealed that the Pinglu Canal project will occupy 13.8698 ha of mangrove forests, with the number of mangrove plants within the proposed land area being 255,325. There will be a significant decrease in the population of Aegiceras corniculatumn by 248,330, 5789 Kandelia candel, 362 Sonneratia apetala, and 844 Acanthus ilicifolius. However, limited research has been conducted on the assessment of mangrove biodiversity in this area, and few scholars have utilized LiDAR and hyperspectral technology to investigate the spatial distribution patterns of mangrove biodiversity.
To address the gaps in research, this study aims to combine hyperspectral and LiDAR technology to acquire both the spectral characteristics of mangrove plants and the vertical three-dimensional structural features of mangroves. Through data fusion and multi-source data collaboration, the study aims to address the challenges in mangrove structure parameter extraction, biodiversity assessment, and the identification of key protected species areas within complex coastal mudflat habitats. Building on the core biodiversity monitoring indicator system proposed by the Group on Earth Observations Biodiversity Observation Network (GEO BON) [10], the study seeks to construct an evaluation index system for mangrove biodiversity at the species diversity, ecosystem diversity, and landscape diversity levels. After obtaining the biodiversity index of the study area through the proposed framework calculation, spatial zoning of mangrove biodiversity will be carried out based on two indicators: the elevation of mangrove growth and offshore distance. Measures were taken to protect the existing mangrove biodiversity, with the aim of minimizing the adverse effects on the local mangroves during the construction of the Pinglu Canal. This research primarily pursues two objectives: (1) Supported by the hypotheses of “spectral variation” and “height variation”, the applicability of UAV low-altitude LiDAR remote sensing and hyperspectral remote sensing in the construction and evaluation of mangrove biodiversity indicator system. (2) How to delineate the spatial zoning results of mangrove biodiversity to provide effective protection for mangrove biodiversity and reduce the impact of canal construction on mangrove biodiversity. The findings of this study can provide a scientific basis and technical support for developing mangrove biodiversity conservation strategies and offer a feasible solution for large-scale mangrove biodiversity mapping in the Maowei Sea at the estuary of the Pinglu Canal.

2. Materials and Methods

2.1. Study Area

The upper reaches of the Pinglu Canal connect to the Xijiang shipping trunk line, known as the “Golden Waterway”. In the west, it passes through the Yongjiang River and leads directly to Nanning, the hinterland of the Zuo and Youjiang Rivers, and Yunnan. In the east, it connects to the Yujiang River and reaches the Greater Bay Area of Guangdong, Hong Kong, and Macao. In the north, it passes through the Qianjiang, Hongshui, and Liujiang rivers, leading directly to Guizhou. The Canal flows out to the sea from the Beibu Gulf in the south, serving as a shortcut for inland rivers in Guangxi and the vast southwestern and south-central regions. The mangroves at the Canal Estuary are located in Qinzhou City in the Guangxi Beibu Gulf. This area contains the Maowei Sea Mangrove Nature Reserve, which is extraordinarily rich in mangrove biodiversity. The reserve hosts 11 families and 16 species of mangrove plants, accounting for 43% of China’s mangrove flora and 69.6% of mangrove plants in Guangxi. The dominant species primarily include Sonneratia apetala, Aegiceras corniculatumn, Kandelia candel, and Acanthus ilicifolius. The latter is a rare mangrove plant belonging to the family Acanthaceae. The reserve is home to 491 species of various animals, including Ciconia nigra, Phalacrocorax Pelagicus, Dugong dugon, Neophocaena, and 33 species of protected birds, under agreements between China, Australia, China, and Japan for the conservation of migratory birds and their habitats. The mangrove research area in this article (Figure 1a,c) is located in the Jianxinwei Mangrove Nature Reserve in the Maowei Sea, Guangxi (Figure 1b), and Figure 1d is our mangrove biodiversity research area (237,241.50 m2). Since approximately 2002, Sonneratia apetala has been introduced in the reserve, followed by large-scale artificial planting of local mangrove species such as Aegiceras corniculatumn and Kandelia candel. As a result, mangrove areas have increased significantly. These mangroves form the largest contiguous mangrove forest in China, and are suitable for mangrove introduction, cultivation experiments, scientific research, and development. The climate of this area is classified as southern subtropical monsoon [16]. The tides are irregular diurnal tides, with an average tidal range of 2.51 m. A warm and humid climate, along with abundant mudflat resources, provides favorable conditions for mangrove growth.

2.2. Materials and Method

2.2.1. UAV Hyperspectral and Laser-Point Cloud Data Acquisition

This study utilized Bumblebee 4-rotor UAV (Figure 2①) and Spectrum Patrol HSG-1 (Figure 2②) for aerial photography and data collection of mangrove laser point clouds and hyperspectral data. The bumblebee drone equipment was equipped with the AS-900HL multi-platform laser scanning system (Figure 2①), which is a system that Huadian has explored for many years in the field of measurement. It has the advantage of quickly obtaining high-precision laser point clouds under complex terrain conditions, making it suitable for obtaining complex three-dimensional mangrove laser point-cloud data. HSG-1 is a cost-effective unmanned airborne hyperspectral imager with a high-accuracy and stability augmentation platform. It has excellent spectral and spatial resolution capabilities and does not require POS calibration and splicing, thus allowing for quick mapping. HSG-1 uses high-quality optical systems to achieve excellent performance.
(1)
Spectrum Patrol HSG-1 UAV Hyperspectral Data Acquisition
The hyperspectral data used in this study were collected using an OptTrace patrol hyperspectral imager (Hangzhou, China) mounted on a DJI Matrice 300 four-rotor UAV equipped with a standard reflective whiteboard. The data were collected on 15 December 2022, under cloudless, sunny weather and low-tide levels to conduct aerial photography of the mangroves in the research area. Prior to data collection, the flight route of the UAV was planned with a flight height of approximately 150 m, flight speed of 8 m/s, 80% heading overlap, 75% lateral overlap, and a mirror head pointed vertically downward. The exposure time was set to 5 ms and the capture frame rate was 50 fps.
The original hyperspectral image contained 220 wavebands, with a spectral range of 400–1000 nm, spatial resolution of 0.1 m, and spectral resolution of 2.8 nm. The collected data were processed using ENVI5.3 image processing software to stitch the images seamlessly. The stitching accuracy was evaluated based on the residuals of the homonymous points between adjacent images. To carry this out, several overlapping corrected images were selected from the shooting area, and a certain number of homonymous points were extracted from different mangrove tree species. The spatial coordinates of these homonymous points on their respective images were calculated, and the coordinate differences were calculated to evaluate the stitching accuracy quantitatively. The matching point mean square error was calculated to be 0.858 pixels, meeting the requirements for the classification and biodiversity evaluation of mangrove hyperspectral data in the study area.
After stitching, the processed image was radiometrically calibrated using a calibration board to convert the digital number (DN) of the image into the surface reflectance. The collected hyperspectral images of the Jianxinwei Mangrove Nature Reserve are shown in Figure 2④, with hyperspectral color stereograms of local areas in Figure 3 (R:660 nm, G:550 nm, B:470 nm), and the spectral curves of different mangrove communities are shown in Figure 4. Aerial photographs of Acanthus ilicifolius (AI), Sonneratia apetala (SA), Aegiceras corniculatum (AC), Kandelia candel (KC), Cyperus malaccensis (CM), and mudflat (MF) are shown in Figure 2(a3,b3,c3,d3,e3,f3), respectively. Figure 2(a1,b1,c1,d1,e1,f1) is the comparison map of field photos collected from the ground of Acanthus ilicifolius, Sonneratia apetala, Aegiceras corniculatum, Kandelia candel, Cyperus malaccensis, and mudflat, respectively.
(2)
Laser Radar Data Acquisition for a Bumblebee Unmanned Aerial Vehicle
On 15 December 2022, the AS-900HL unmanned-aerial-vehicle laser scanner system (Shanghai Huace Navigation Technology Co., Ltd., Hangzhou, China) was used to collect mangrove laser radar data synchronously with hyperspectral data. This system integrates various high-performance sensors such as high-precision and long-range laser scanners, and high-precision optical fiber inertial navigation systems. Its minimalist lightweight design is suitable for controlling unmanned-aerial-vehicle platforms.
Prior to data collection, a flight path was planned to ensure that the flight path of the laser point cloud was consistent with the hyperspectral flight path. The flight height was set to 150 m with a flight speed of 6 m/s. The lens was pointed vertically downward with a 70% sidewise overlap rate and an 80% heading overlap rate. The collected laser point-cloud data for the Jianxinwei Mangrove Nature Reserve are shown in Figure 2 and Figure 3.
The preprocessing steps for the laser radar data were divided into two stages: POS position calculation and point-cloud calculation. The position calculation used the Inertial Explorer post-processing software to process global navigation satellite system (GNSS) data to obtain a high-precision combination of navigation information, such as position, speed, and attitude. The point-cloud calculation used the round-trip time, position, and attitude information of the laser pulses to generate mangrove three-dimensional laser point-cloud data. The data provider (Guangxi Xuanxing Technology Co., Ltd., Nanning, China) used QTModeler V8.2 software for preprocessing and provided point-cloud data products. These data allow for the acquisition of vertical three-dimensional structural features of mangroves, complementing the spectral characteristics obtained from hyperspectral data. The combination of these data sources provides a comprehensive characterization of mangrove biodiversity and forms the basis for further analysis and assessment of the impact of the Pinglu Canal project on mangrove ecosystems. The data provider (Guangxi Xuanxing Technology Co., Ltd., Nanning, China) used QTModeler V8.2 software for preprocessing and provided point-cloud data products. The calculated 3D laser point-cloud data of different mangrove species in Jianxinwei are shown in Figure 2③, and Figure 2(a2,b2,c2,d2,e2,f2) shows the laser point-cloud images of Acanthus ilicifolius, Sonneratia apetala, Aegiceras corniculatum, Kandelia candel, Cyperus malaccensis, and mudflat, respectively. The process of the laser point-cloud data acquisition is detailed in the literature [17].
(3)
UAV hyperspectral and laser point-cloud data extraction
ENVI 5.3 software, developed by ESRI, Inc., was used to process hyperspectral data, which includes atmospheric and geometric corrections as well as image mosaicking. After atmospheric correction, spectral reflectance was obtained and then combined with a digital surface model generated from LiDAR data to perform geometric correction through the manual selection of ground control points. The resulting hyperspectral image was seamlessly mosaicked. Vegetation indices, which reflect mangrove plant growth, coverage, and biomass, were calculated based on previous research and the distribution characteristics of mangrove communities around Jianshan in the Maowei Sea. Ten vegetation indices, BGI2, NDVI, RDVI, TCARI, OSAVI, MCARI1, MCARI2, PRI, SR, and CI, were used to classify mangrove ecosystem types. Because the hyperspectral data had 220 bands, principal component analysis (PCA) was used to reduce data dimensionality [21,42], and texture analysis was performed on the first waveband of PCA to generate seven texture variables: contrast, correlation, data range, similarity, harmony, mean, and variance. The above vegetation indices and texture variables were extracted using ENVI 5.3 software, and the spatial resolution of various raster data was consistent with the original hyperspectral data resolution of the drone, all of which were 0.1 m. All hyperspectral characteristic variables and their specific descriptions are shown in Table 1 and Table 2, respectively.
The mangrove laser point-cloud data, stored in the LAS1.4 format, included X, Y, and Z three-dimensional coordinates, elevation values, echo numbers, echo intensity, and other information [16]. Prior to classification using the Mangrove Aboveground Biomass Retrieval System based on UAV-LiDAR (LiMARS system) [17], noise points were removed from the LiDAR data to eliminate any potential interference caused by low-altitude flying objects, birds, or other sources of noise. The classified point-cloud data included ground and nonground point clouds. The ground point-cloud data can be used to generate a digital elevation model (DEM) using the inverse distance interpolation method in the LiMARS software. Nonground point-cloud data were rasterized to form a digital surface model (DSM). Elevation variables based on DEM were used to normalize the elevation of all point-cloud data. LiDAR feature variables were extracted, including height percentile (H95), canopy coverage (CC), leaf area index (LAI), and canopy height model (CHM), using the LiMARS software independently developed by our team [17]. Based on laser point-cloud data, all grid data extracted using the LiMARS software have a spatial resolution of 0.5 m. All laser point-cloud feature variables and descriptions are presented in Table 3.

2.2.2. Classification of Ecosystem Types and Construction of Biodiversity Indicators

(1)
Classification of ecosystem types
The classification and regression tree (CART) decision tree uses a hill-climbing algorithm [45] to select the optimal combination of attributes from a large set of data features to form a classification model. The addition of data features may result in changes to the classification rules; however, the resulting decision tree must still be the optimal solution. The main data sources for this study were UAV hyperspectral and laser point-cloud data. Variable combinations were formed using CHM generated by 220 hyperspectral bands, 10 vegetation indices, seven texture information, and laser point-cloud variables (the CHM, canopy height model variable, was selected to identify different mangrove tree species due to significant differences in the height of different mangrove tree species). The CART decision tree automatic classification algorithm extension module under the ENVI5.3 software was used to automatically select classification features based on the characteristics of training samples obtained from field surveys and the test variables involved in classification, followed by assignment operations to obtain the optimal binary tree. The CART decision tree applied binary segmentation to divide the data into two parts, and conducted a Boolean test on the branch node. If the condition is true, the data are classified as the right branch. Otherwise, they are classified as the left branch, ultimately forming a binary tree.
(2)
Selection of the biodiversity indicator system
Based on the core biodiversity monitoring indicator system proposed by the Earth Observation Organization Biodiversity Observation Network [10], this study proposes the construction of a mangrove biodiversity evaluation indicator system at three levels: species diversity, ecosystem diversity, and landscape diversity.
At the species diversity level, this study constructed canopy structure variables based on LiDAR and vegetation indices using hyperspectral data from the perspectives of the “spectral variation hypothesis” and “height variation hypothesis”, respectively. Based on the canopy structure variables of LiDAR point-cloud data [50], we selected the height percentile (H95, which is close to the crown height of mangroves and is the 95th percentile height), canopy coverage (CC, the percentage of the vertical projection area of the outermost periphery of the natural expansion of mangrove branches and leaves on the ground to the surface area), and leaf area index (LAI, which refers to the result of the total area of mangrove leaves per unit of mudflat area being multiplied by the mudflat area and is related to the density, structure, biological characteristics of trees, and environmental conditions of mangroves. The LAI is a comprehensive indicator of mangrove utilization of light energy and canopy structure). Based on the vegetation index of the hyperspectral data, this study selected three indicators: PRI [51], BGI2 [52], and CI [10]. The PRI represents the spectral reflectance of mangrove leaves, which is related to changes in the composition of lutein pigments. Lutein dynamics are closely related to plant stress, which is important in mangrove plant photosynthesis and stress. BGI2 represents the blue–green pigment index of mangroves, reflecting the carotenoid content in mangrove leaves, whereas CI uses the reflectance ratio of NIR and red-edge bands to evaluate the chlorophyll content in leaves, which directly depends on the nitrogen content in plants.
At the level of ecosystem diversity, this study selected the aboveground biomass of mangrove ecosystems as an indicator of ecosystem diversity. Biodiversity is generated by the niche diversity of common biological species, which leads to higher community productivity or biomass owing to more effective resource utilization [53]. Tillman, Hector, and Naeem also believed that there is a positive correlation between species diversity and productivity, especially aboveground biomass [53,54,55]. An increase in diversity increases the diversity of species with functional characteristics in communities, which can maximize resource utilization and thereby increase ecosystem productivity or aboveground biomass. Based on this, we selected mangrove aboveground biomass as an indicator of ecosystem diversity, and the aboveground biomass was calculated using allometric growth equations and incremental regression models for different types of mangrove tree species. The specific calculation and estimation process is detailed in the research results of Wu et al. [56] for the Maowei Sea of the Beibu Gulf.
Landscape indices were used to evaluate the heterogeneity and diversity of the landscapes. As a component of biodiversity, the relationship between landscape diversity and species diversity generally assumes a normal distribution [57]. Within a certain range of categories, the richer the types of landscape diversity, the higher the regional biodiversity. In this study, the Simpson diversity index (SIDI), landscape separation index (SPLIT), and landscape spread index (CONTAG) of mangrove ecosystems were used as indicators of ecosystem diversity. The SIDI calculates the probability that two randomly sampled individuals belong to different species to reflect the species richness of the community [58]. The landscape separation index represents the degree of separation between patches in a landscape type. A smaller value indicates a more concentrated distribution of patches, while a larger value indicates a more dispersed distribution of patches within the region, reflecting, to a certain extent, the degree of human interference with the landscape, which is a reverse indicator of the level of biodiversity [59]. The spread index refers to the degree of aggregation or extension of different patch types in the landscape. A high degree of spread indicates that a patch type in the landscape has good connectivity, whereas the reverse indicates that the landscape is more fragmented, and patches with high connectivity are more conducive to the survival and reproduction of species within the landscape [60].
(3)
Construction of biodiversity indicators (BI)
The biodiversity indicator evaluation system was constructed by selecting the above 10 indicators (Table 4), and each indicator was normalized (with a value range of 0 to 1). The standardized calculation method for positive indicators is as follows:
X q = ( A q A q M i n ) / ( A q M a x A q M i n )
where Xq is the value of the normalized evaluation index q, Aq is the value of the pre-normalized evaluation index, AqMin is the minimum value of the pre-normalized evaluation index, and AqMax is the maximum value of the pre-normalized evaluation index. The landscape separation index indicator is an inverse indicator, and the calculation of the above formula must be processed in reverse order to obtain the standard value of this inverse indicator.
The biodiversity index constructed in this article is as follows:
B I = H 95 % × β H 95 % + C C × β C C + L A I × β L A I + P R I × β P R I + B G I 2 × β B G I 2 + C I × β C I + A G B × β A G B + S I D I × β S I D I + S P L I T × β S P L I T + C O N T A G × β C O N T A G
In the formula, H95% is the mangrove 95th percentile height, CC is the mangrove canopy coverage, LAI is the mangrove leaf area index, CRI is the carotenoid reflection index, SR is the simple ratio index, CI is the photosynthetic activity of the mangrove canopy, AGB is the aboveground biomass of the mangrove, SIDI is the Simpson diversity index, SPLIT is the landscape separation index, CONTAG is the landscape spread index, and βi is the weight of each sub-indicator. The value range of the BI biodiversity index is 0–1.
Currently, two main methods exist for determining indicator weights: subjective and objective. Subjective methods, such as the analytic hierarchy process [61], Delphi method [62], and ring comparison scoring method, have limitations in application because of their high degree of subjectivity and qualitative components, leading to uncertainty in the weight calculation. On the other hand, objective methods rely on mathematical relationships between the original data and determine weights through methods such as entropy, multi-objective programming, and principal component analysis [63]. Among the objective methods, the entropy weight method reflects the utility value of the indicator information entropy and provides a more accurate and credible weight value than the subjective weighting method does [64]. In this study, different indicator weights were determined using the calculation process of the entropy weight method in MATLAB 2022a. The calculation process involved three stages: matrix standardization, entropy definition, and weight definition. To implement the entropy weight method, a MATLAB script was programmed in accordance with its definition. The specific code and calculation process can be found at https://mp.weixin.qq.com/s/LAF5wXycV8ZoAB9QHnU9Uw (accessed on 10 May 2023).

2.3. Technical Process

In the context of the construction of China’s first Pinglu Canal since the founding of the People’s Republic of China, this study aimed to assess the impact of construction on the existing mangrove biodiversity. Data were extracted using unmanned-aerial-vehicle LiDAR (to gather vertical structural features) and hyperspectral data (to gather canopy spectral features) based on the hypotheses of “height variation” and “spectral variation”. By dividing protection zones and taking protective measures, the aim was to minimize the adverse effects of construction on local mangroves.
The technical process involved data acquisition and processing, with variable generation using UAV hyperspectral data and LiDAR data to extract parameters from the canopy spectrum and the vertical structure of mangroves. The CART method was used to classify mangrove tree species. An indicator system was constructed for mangrove biodiversity at species diversity (six variables), ecosystem diversity (one variable), and landscape diversity levels (three variables). Entropy weight theory and MATLAB 2022a software were used to calculate different indicator weights, and the spatial distribution pattern of mangrove biodiversity was assessed using biodiversity calculation formulas. Finally, by analyzing the impact of different elevations of mangrove growth and offshore distances on biodiversity, protection zones were designated, and measures were formulated for the protection of mangrove biodiversity under the background of canal construction. Due to the inconsistency in spatial resolution between laser point-cloud variables and hyperspectral variables, we selected two types of mangrove tree species, Sonneratia apetala and Kandelia candel, which are more prominent in the internal image of the sample plot, as control point positioning points. With the support of the Geometric Correction module of ENVI5.3 software, we performed geometric correction on the variables generated by the drone laser point-cloud. After geometric correction, all laser point-cloud variables and hyperspectral variables were aligned with an error of within 0.5 pixels, and the hyperspectral data were resampled to the same resolution as the laser point-cloud data. In the end, we obtained mangrove variables with a resolution of 0.5 m, and the coordinate system of all grid data was WGS-84, using UTM 48N projection. The detailed technical process is illustrated in Figure 5.

3. Results and Analysis

3.1. Classification Accuracy of Different Mangrove Tree Species

Based on hyperspectral and LiDAR point-cloud data, the spatial distribution pattern of the study area was obtained using the CART algorithm (Figure 6). The overall accuracy of mangrove classification obtained by the CART algorithm is 86.77% (kappa = 83.97%) (refer to Table 5), with most of the user classification and mapping accuracies being over 80%. Specifically, SA has the highest classification accuracy owing to the noticeable height features obtained from LiDAR data. Although the AI user accuracy is 59.49%, its mapping accuracy is 97.51%. Through the normalized confusion matrix (shown in Figure 7), it was found that the probability of AI being wrongly classified as MF is 0.28, which could be due to AI growing along the tidal flat and their close survival position. The CART algorithm shows excellent classification performance for mangrove tree species, which provides a foundation for the construction of biodiversity indicators.

3.2. Biodiversity Index Characteristics of Different Mangrove Tree Species

Table 6 shows the statistical indicators of different mangrove tree species at the levels of species diversity, ecosystem diversity, and landscape diversity. The height percentile (H95), canopy coverage (CC), and leaf area index (LAI) were the three indicators generated based on laser point-cloud variables at the species diversity level. The spatial distribution and composition of these indicators are shown in Figure 7 and Figure 8, respectively. Figure 8 and Table 6 show that the H95, LAI, and CC of mangroves in the study area exhibit significant regional differentiation patterns, with spatial distribution patterns being high in the southwest, low in the northwest, and low in the southeast. The average values of H95, LAI, and CC are 2.09 m, 0.78, and 0.72, respectively.
The composite image of the three indicators (Figure 9) and Table 6 show that the yellow area in the northwest of the study area has a high canopy height and H95 (e.g., SA, b1), indicating that the tree height in this area is high, and the mangrove leaves have a large crown cover degree. This area is mainly occupied by Sonneratia apetala, with a maximum tree height of 10.71 m and an average crown cover degree of 0.87. The green and yellow areas (e.g., KC, d1) in the central part of the study are covered by higher leaf area indices, higher trees, and more complex layered crown cover. This area is mainly covered by Kandelia candel, with an average leaf area index of 0.95 m2/m2, an average tree height of 2.49 m, and an average canopy cover of 0.83. The average of the three is only second to the LAI (1.23 m2/m2), H95 (6.53 m), and CC (0.87) of Sonneratia apetala. The yellow area in the south of the study area (e.g., AC, c1) is mainly the coverage area of Aegiceras corniculatumn. The leaf area index and crown cover of this tree species are comparable to those of the Kandelia candel, but the average tree height is slightly lower than that of Kandelia candel. The tree height in the yellow area of this region is approximately 2.24 m, while the average tree height of Kandelia candel is approximately 0.25 m lower than that of Aegiceras corniculatumn. The yellow-green areas (e.g., AI, a1) and green areas (e.g., CM, e1) in the southern part of the study area represent the coverage areas of Acanthus ilicifolius and Cyperus malaccensis, respectively. The three indicators of the Acanthus ilicifolius mangrove species are the lowest among the other three mangrove species, but these three indicators are slightly higher than the leaf area index, tree height, and crown cover values of the Cyperus malaccensis community.
The three diversity indicators generated based on hyperspectral data from unmanned aerial vehicles are PRI, BGI2, and CI. The spatial distribution and composition diagrams of these three indicators are shown in Figure 10 and Figure 11, respectively. Figure 10 and Table 6 show that the PRI and SR of mangroves in the study area exhibit significant regional differentiation. These two indicators show a spatial distribution pattern of high values in the southwest, low values in the northwest, and low values in the southeast. The average values of the two indicators are 0.07 and 9.3, respectively, but the spatial differentiation degree of CI is not significant. From the composite image of the three indicators (Figure 11) and Table 6, it can be seen that the purple region in the southwest of the study area has higher PRI and CI values (for example, AC, c1), indicating that the mangrove forests in this area have higher levels of lutein and chlorophyll, but the BGI2 in this area is relatively low. This area is mainly the distribution area of Aegiceras corniculatum, with a maximum PRI of 0.0776, which is second only to Kandelia candel, with an average CI of 1.2096. The deep-purple region (e.g., KC, d1) in the central region of the study area is characterized by high PRI and high CI index values. This region is mainly covered by the Kandelia candel, with a maximum PRI value of 0.0884 and a CI index value of 1.3116. In the northwest of the study area (e.g., SA, b1), the BGI2 and CI values reached their maximum values in the study area, indicating that the carotenoid and chlorophyll contents of the Sonneratia apetala mangrove tree species were high. The green areas (e.g., AI and a1) and (e.g., CM and e1) the southern part of the study area represent the distribution areas of Acanthus ilicifolius and Cyperus malaccensis, respectively. The BGI2 values of these two mangrove tree species are both high in the study area, indicating that the carotenoid content of these two tree species is high, while the PRI and CI indices of these two tree species are low.
Based on the results of Wu et al. [56] from the First Institute of Oceanography of the Ministry of Natural Resources of China on the aboveground biomass of different mangrove tree species in the Maowei Sea area, we drew a spatial distribution map of mangrove biomass in the area (Figure 12). From the distribution of aboveground biomass of different mangrove tree species (Figure 12), it can be observed that Sonneratia apetala has the highest aboveground biomass, followed by Aegiceras corniculatum, Cyperus malaccensis, and Kandelia candel, while Acanthus ilicifolius has the lowest aboveground biomass. As a tall tree, Sonneratia apetala can reach a maximum height of over 10 m in the Maoweihai Mangrove Reserve and grows rapidly, making it dominant over other mangrove species. Hence, it has dense branches and the highest aboveground biomass per unit area. The Aegiceras corniculatum community is relatively dense and grows lushly, with the aboveground biomass distribution being mainly concentrated in the range of 1.76–3.73 kg/m2, averaging 2.85 kg/m2. Kandelia candel grows relatively slowly, and its aboveground biomass distribution ranges from 1.24–3.09 kg/m2, with an average of 2.32 kg/m2. The aboveground biomass of Acanthus ilicifolius ranges from 0.56–2.64 kg/m2, with an average of 1.68 kg/m2, with the majority of aboveground biomass being located at 2.00–3.73 kg/m2.
Based on the spatial distribution map of mangroves in the study area, three landscape diversity indicators were calculated using the Fragstats software [51]: the Simpson diversity index (SIDI), landscape separation index (SPLIT), and landscape spread index (CONTAG). The spatial distribution and composite diagrams of these three indicators are shown in Figure 13 and Figure 14, respectively. Figure 13 and Table 6 show that the SPLIT, SIDI, and CONTAG of mangroves in the study area exhibited significant regional differentiation, with average values of 2.05, 0.38, and 28.32, respectively. From the composite image of the three indicators (Figure 14) and Table 6, it can be seen that the dark-blue areas in the southwest and northeast of the study area have the highest landscape spread index (e.g., AC, c), which is mainly the distribution area of Aegiceras corniculatum, with a maximum value of 31.7659. The light-white areas in the central part of the study area (e.g., KC, d) are mainly characterized by high landscape spread and a high Simpson diversity index. This area is mainly characterized by the coverage of Kandelia candel, with CONTAG and SIDI values of 25.0976 and 0.4007, respectively. In the northwestern part of the study area (e.g., SA, b), the CONTAG value of the Sonneratia apetala mangrove species is equivalent to that of the Kandelia candel species, but its SIDI value is approximately half of the CONTAG value. The green areas (e.g., AI, a) and (e.g., CM, e) the southern part of the study area represent the distribution areas of Acanthus ilicifolius and Cyperus malaccensis, respectively. The landscape separation index SPLIT of these two mangrove tree species is at the highest value of different mangrove tree species, and the SPLIT values of the two mangrove tree species are 2.5406 and 2.567, respectively, indicating that the degree of mangrove fragmentation of these two species is greater than that of other species, and their spatial distribution is more dispersed.

3.3. Spatial Distribution of the Mangrove Biodiversity index

The weights of the mangrove community biodiversity indicator systems in the study area are listed in Table 7. Based on the weights of various indicators calculated using MATLAB 2022a, the highest weight is assigned to landscape diversity, with a value of 0.5577, followed by species diversity indicators (0.4116), and ecosystem diversity with the lowest weight (0.0307). Regarding species diversity, the vegetation leaf area index and carotenoid BGI2 have a high weight contribution to mangrove biodiversity, while PRI has a relatively small weight contribution. In terms of landscape diversity, the landscape separation index has the largest contribution to mangrove biodiversity, whereas the Simpson diversity index has a smaller contribution weight to biodiversity.
The evaluation index system of mangrove ecosystem biodiversity in the Maowei Sea and its weight calculation results led to the calculation of a comprehensive index of mangrove biodiversity in the study area (Figure 15). The index ranges from 0 to 0.63, with an average value of 0.29. In this study, we divided the biodiversity index of mangroves into five levels: very low (0–0.12), low (0.12–0.23), moderate (0.23–0.31), high (0.31–0.38), and very high (0.38–0.63). The proportions of these five levels were 4.70%, 21.50%, 25.76%, 31.32%, and 16.72%, respectively. The spatial distribution of the biodiversity index shows strong heterogeneity, with high values in the southwest and low values in the northwest, southeast, and southern regions. This pattern may be influenced by factors such as altitude, offshore distance, and hydrological response units of the tidal channel. The northwestern region has a large number of Cyperus malaccensis communities, resulting in relatively low biodiversity indices. The northeast region has a high number of Aegiceras corniculatum communities, with a relatively small aboveground biomass. In the southeast region, the distribution of a large number of Acanthus ilicifolius communities leads to a relatively fragmented community structure and lower biodiversity indices. The contribution of different indicators to the biodiversity index was calculated using the R language software (Figure 16). The script used in the R language in this study is Rscript. During the drawing process, we mainly used two packages, ggplot and ggpairs, from the official website of the R language. The URLs of these two packages are https://search.r-project.org/CRAN/refmans/GGally/html/ggpairs.html (accessed on 10 May 2023) and https://search.r-project.org/CRAN/refmans/ggplotify/html/as.ggplot.html (accessed on 10 May 2023), respectively. The landscape spread index (CONTAG) exhibits the highest correlation coefficient with the mangrove biodiversity index in the landscape diversity index, with a value of 0.861. At the species diversity level, crown cover exhibits the highest correlation coefficient with the mangrove biodiversity index, with a value of 0.243. The correlation coefficient between aboveground biomass and the biodiversity index at the level of ecosystem diversity is small, with a value of only 0.136.

3.4. Mangrove Biodiversity Zoning Scheme

Because of the ongoing excavation and construction stage of the Pinglu Canal, which is the first artificial canal in China since the founding of the People’s Republic of China, our research aimed to use drone hyperspectral and laser point-cloud data to study the spatial distribution patterns of mangrove biodiversity. By exploring the spatial distribution pattern of mangrove biodiversity and its differentiation in elevation and offshore distance, this study aimed to provide data support for the spatial zoning of mangrove biodiversity. We extracted ground point-cloud information from the study area using the LiMARS system, which we developed independently based on the point-cloud data obtained via UAV laser scanning. We generated a surface model of the mangrove mudflat by using the digital elevation processing module of the LiMARS system. To investigate the impact of different beach elevations on mangrove biodiversity, we reclassified the beach elevation data (DEM) in ArcGIS 10.2 into nine categories, as shown in Figure 17. Using elevation classification data, we calculated the spatial diversity of mangrove biodiversity indices at different elevations. The spatial distribution of mangrove biodiversity at different elevations displays a pattern of initially increasing, then decreasing, and then increasing again. The maximum value of the biodiversity index (0.32) is observed at an altitude of 1.43 to 1.59, indicating that this range is the most suitable elevation distribution interval for mangrove biodiversity.
We also investigated the impact of offshore distance on the mangrove biodiversity index. We used the Euclidean distance tool in ArcGIS 10.2 toolbox to extract spatial distribution grid maps of different offshore distances based on the artificial seawall lines in the western region of the study area and the roads in the northern region of the study area. The maps are shown in Figure 16. Next, we plotted the statistical characteristics of the mangrove biodiversity at different offshore distances. The biodiversity index fluctuates over different offshore distances, with the highest value being observed in the distance range from 150.08 to 204.28, reaching a value as high as 0.304. In contrast, the mangrove biodiversity index has its minimum value in the distance range from 258.47 to 312.67 m. Our goal is to use these findings to inform the designation of protection zones and the implementation of protective measures to minimize the potential adverse effects of the construction of the Pinglu Canal on local mangrove forests.
Based on these results, we conclude that the most suitable distribution area for the spatial distribution of biodiversity in the study area is the threshold value of 150.08–204.28 m. We used the optimal elevation range and offshore distance for mangrove biodiversity to perform spatial overlay analysis using the GIS spatial overlay analysis function. As a result, we divided the biodiversity index of the study area into three regions: core, buffer, and experimental areas, as shown in Figure 18. According to the zoning results presented in Figure 18, the core area (red area) is primarily located at an elevation range of 1.43–1.59 m and a distance range of 258.47–312.67 m offshore. The buffer area (yellow area) is mainly located at an elevation range of 0.95~1.43 m. The experimental area (blue area) is irregularly distributed in the periphery of the buffer area. Statistical analysis of the different regions revealed that the experimental area accounted for the largest proportion of the research area, representing 61.68% of the total area. The buffer area accounted for the second largest proportion, representing 35.99% of the research area, while the core area accounted for the smallest proportion, representing only 2.32% of the research area.

4. Discussion

4.1. Selection of Biodiversity Indicators

Mangrove forests are among the most diverse ecosystems on the planet and have the highest value for ecosystem services. Monitoring biodiversity is essential for the implementation of biodiversity conservation and mangrove biodiversity restoration. Rapid and accurate assessment of biodiversity and identification of core protected areas are prerequisites for supporting mangrove biodiversity restoration. However, because of differences in research areas and research objects, as well as limitations in data acquisition, biodiversity indicators and methods are not the same, and a universal biodiversity evaluation method has not been established [65]. Previous researchers often used one of the “spectral variation hypothesis” [66,67] or “height variation hypothesis” [39] as an indicator system to assess forest biodiversity in a certain area. This study is based on the “spectral variation” and “height variation” hypotheses, and constructs an evaluation index system for mangrove biodiversity at three levels: species diversity, ecosystem diversity, and landscape diversity. This method combines the two hypotheses in terms of three-dimensional structure and canopy spectral characteristics, overcoming the difficulty of assessing mangrove biodiversity with a single property. In this study, the canopy spectral variable characteristics generated from hyperspectral data of unmanned aerial vehicles [68] and the height variable characteristics generated from laser point clouds of unmanned aerial vehicles [69,70,71,72,
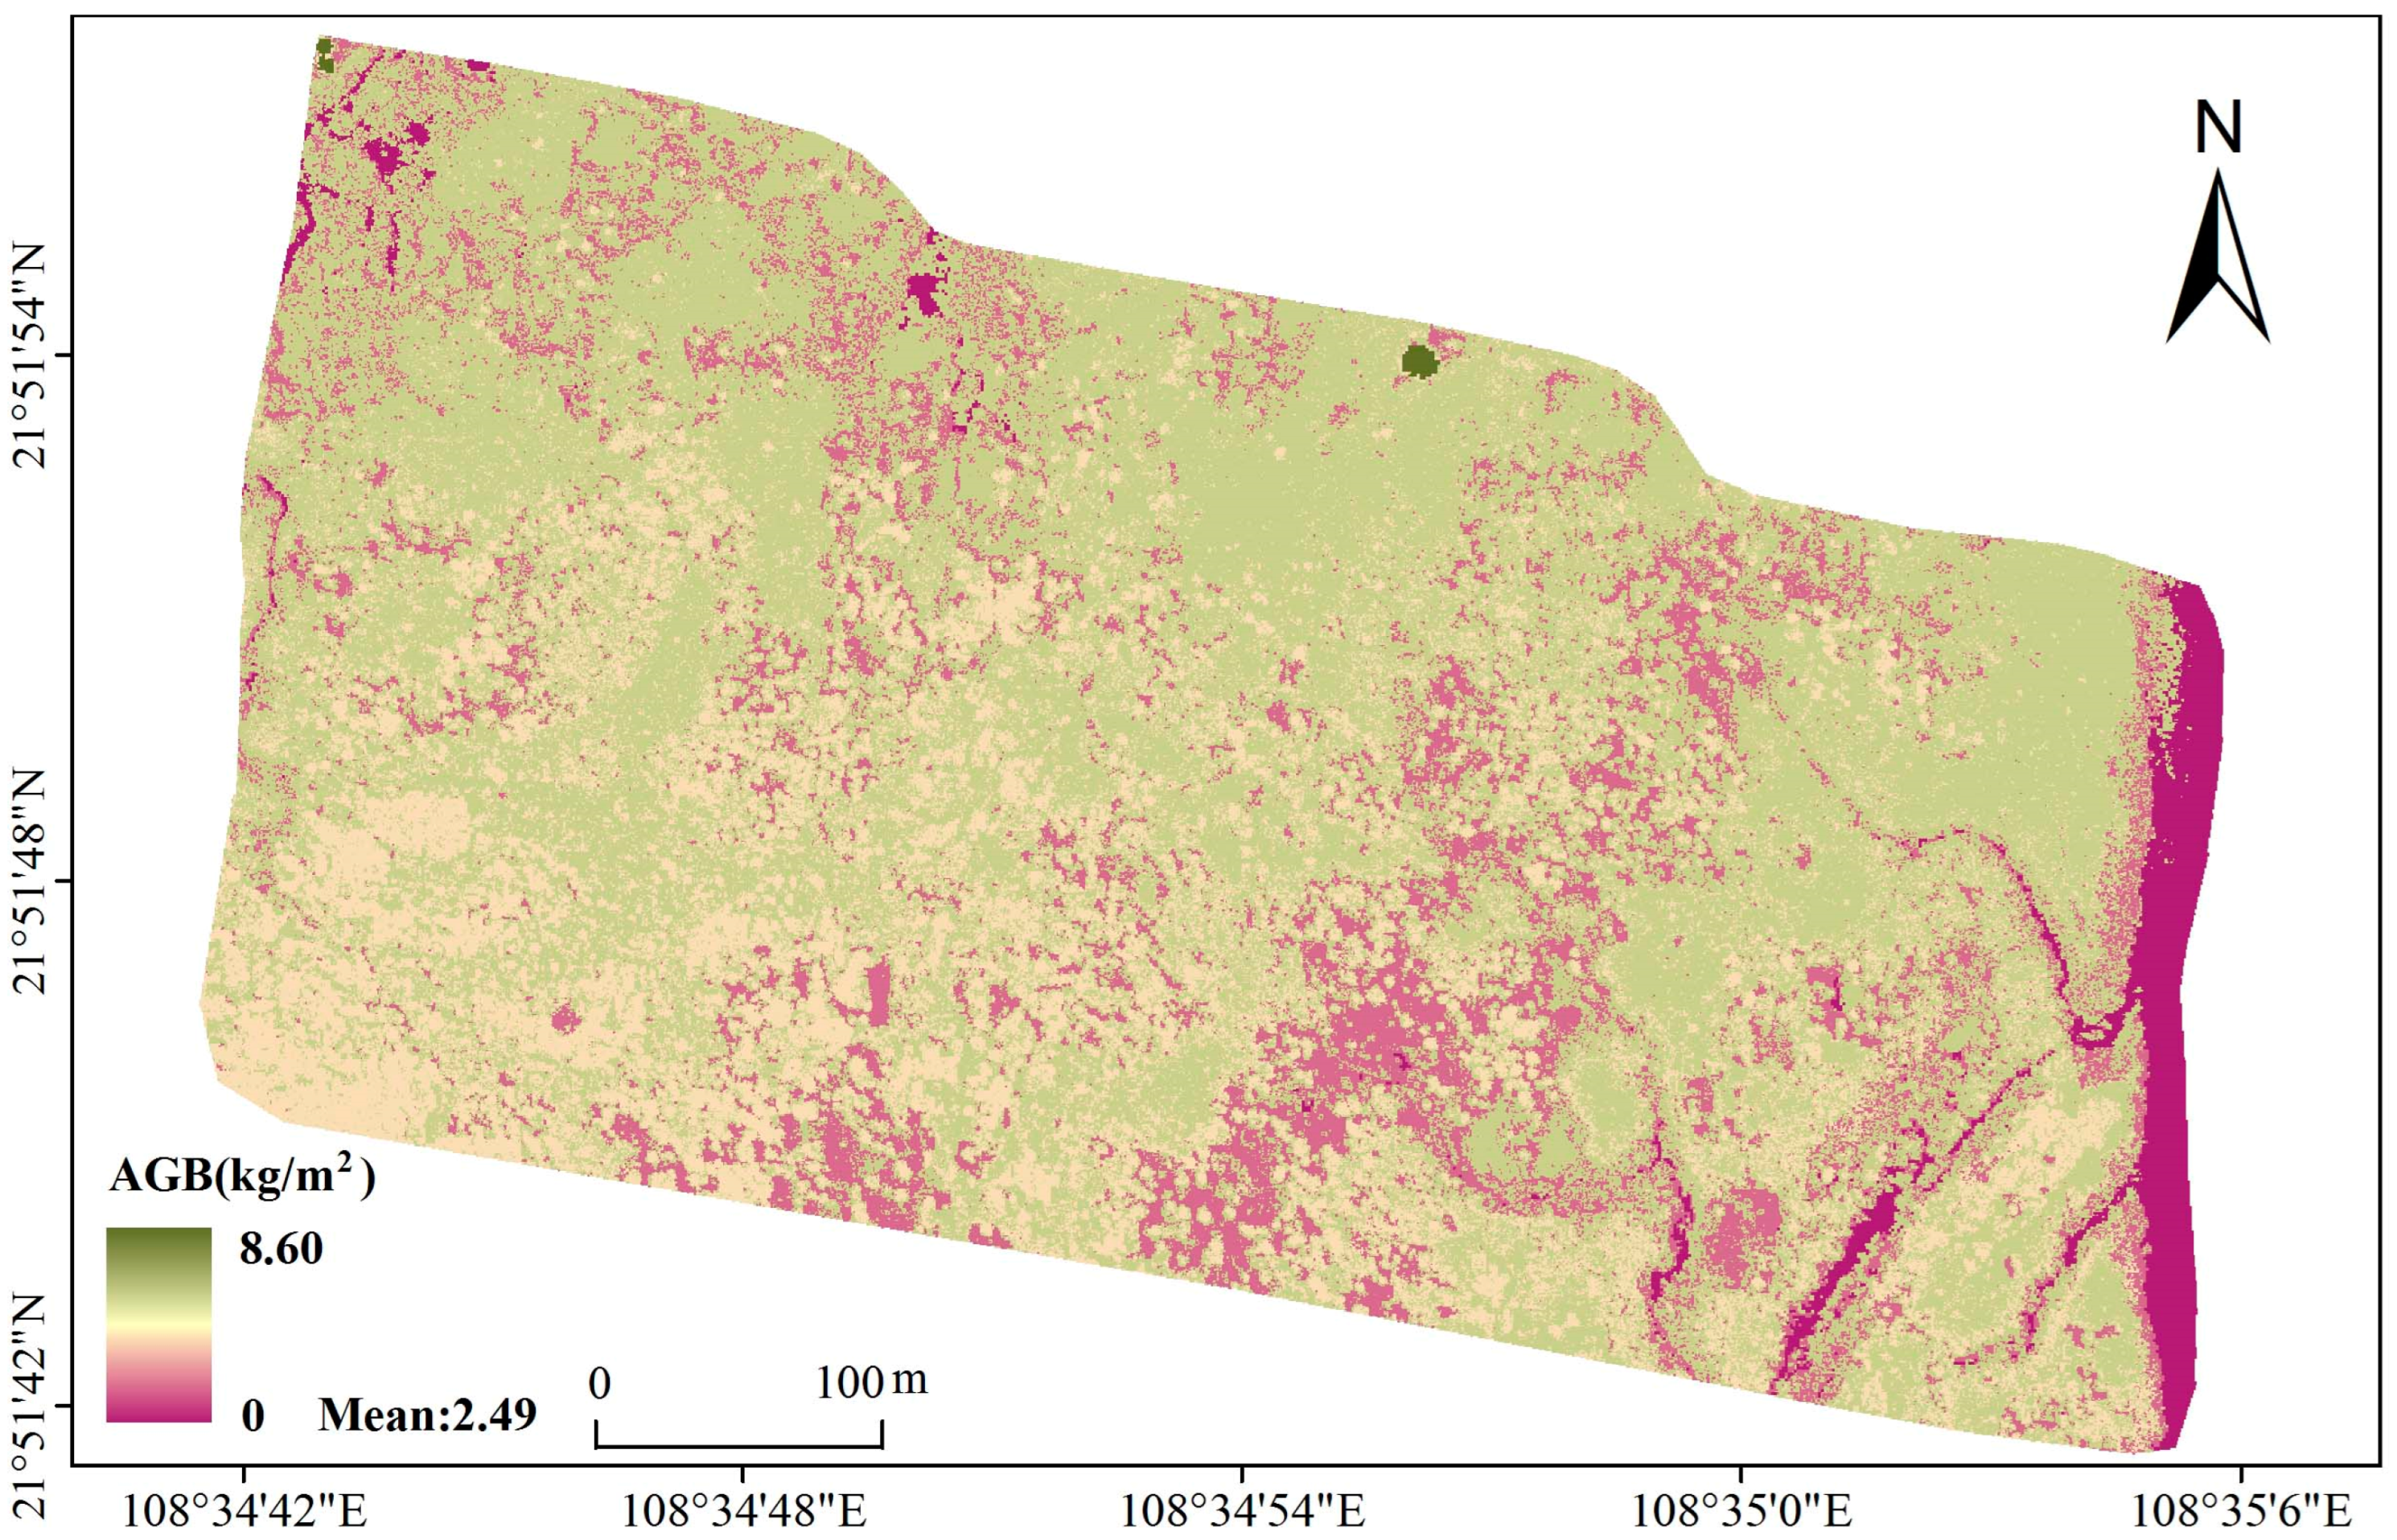
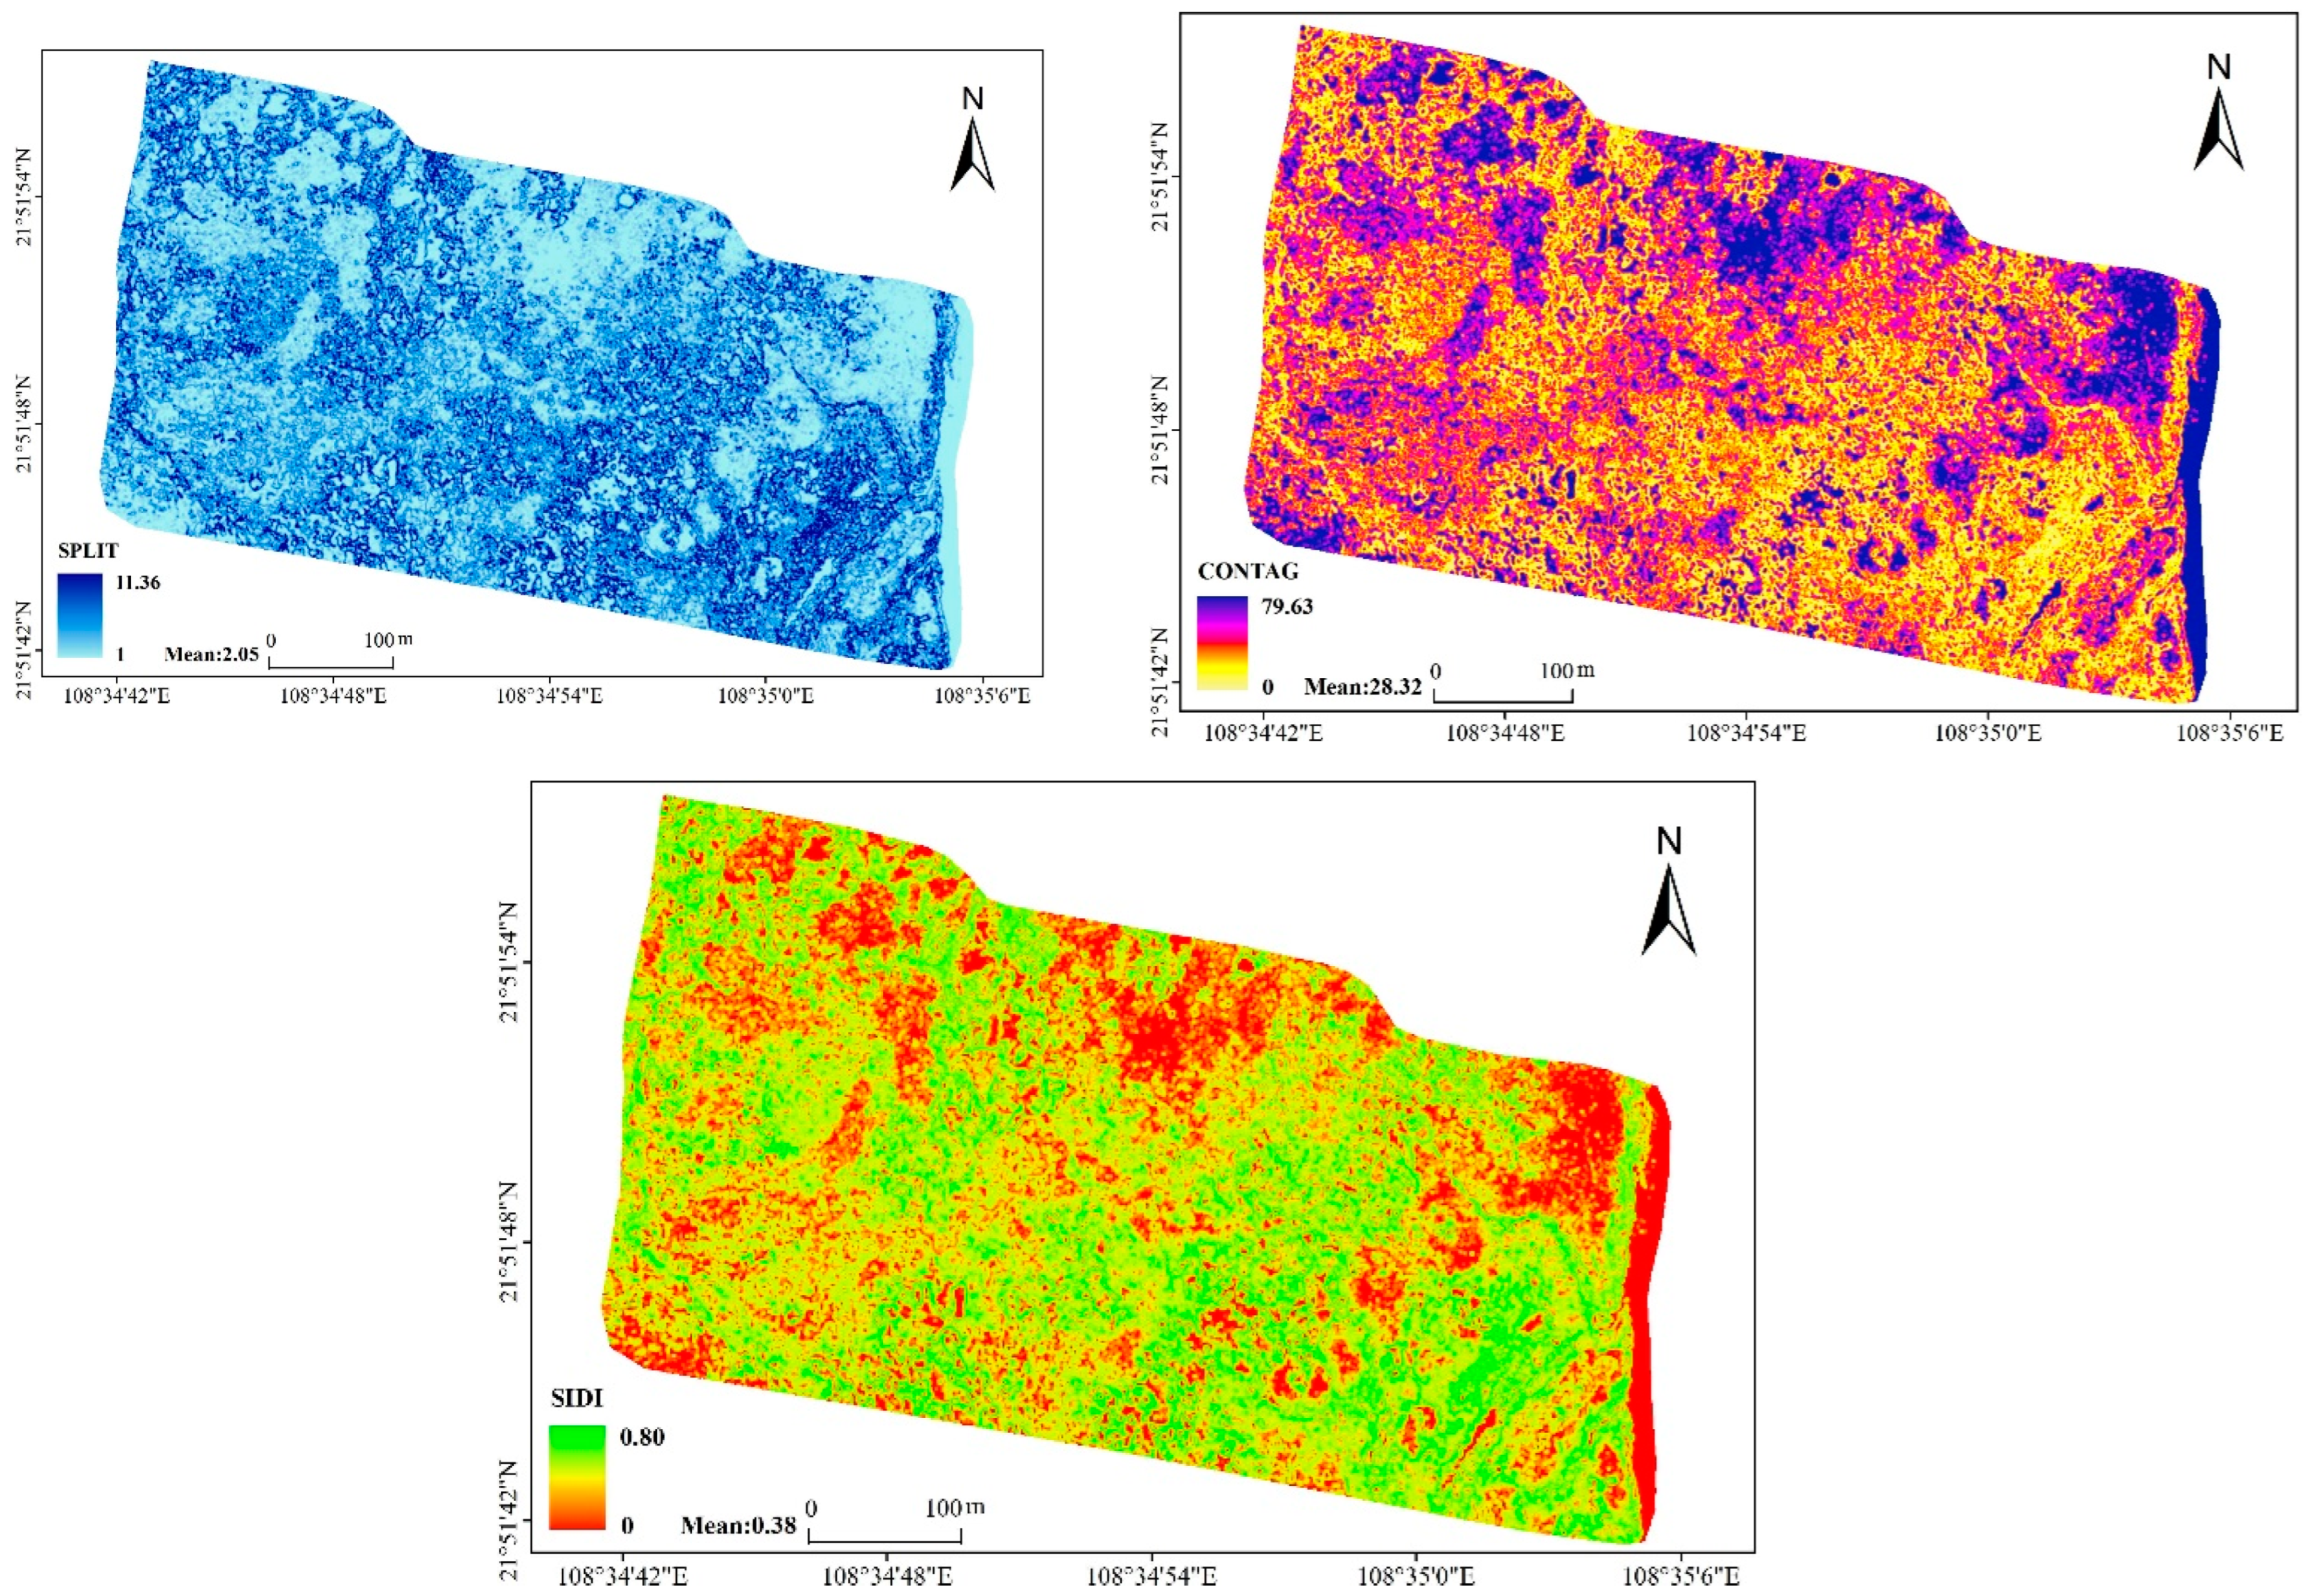
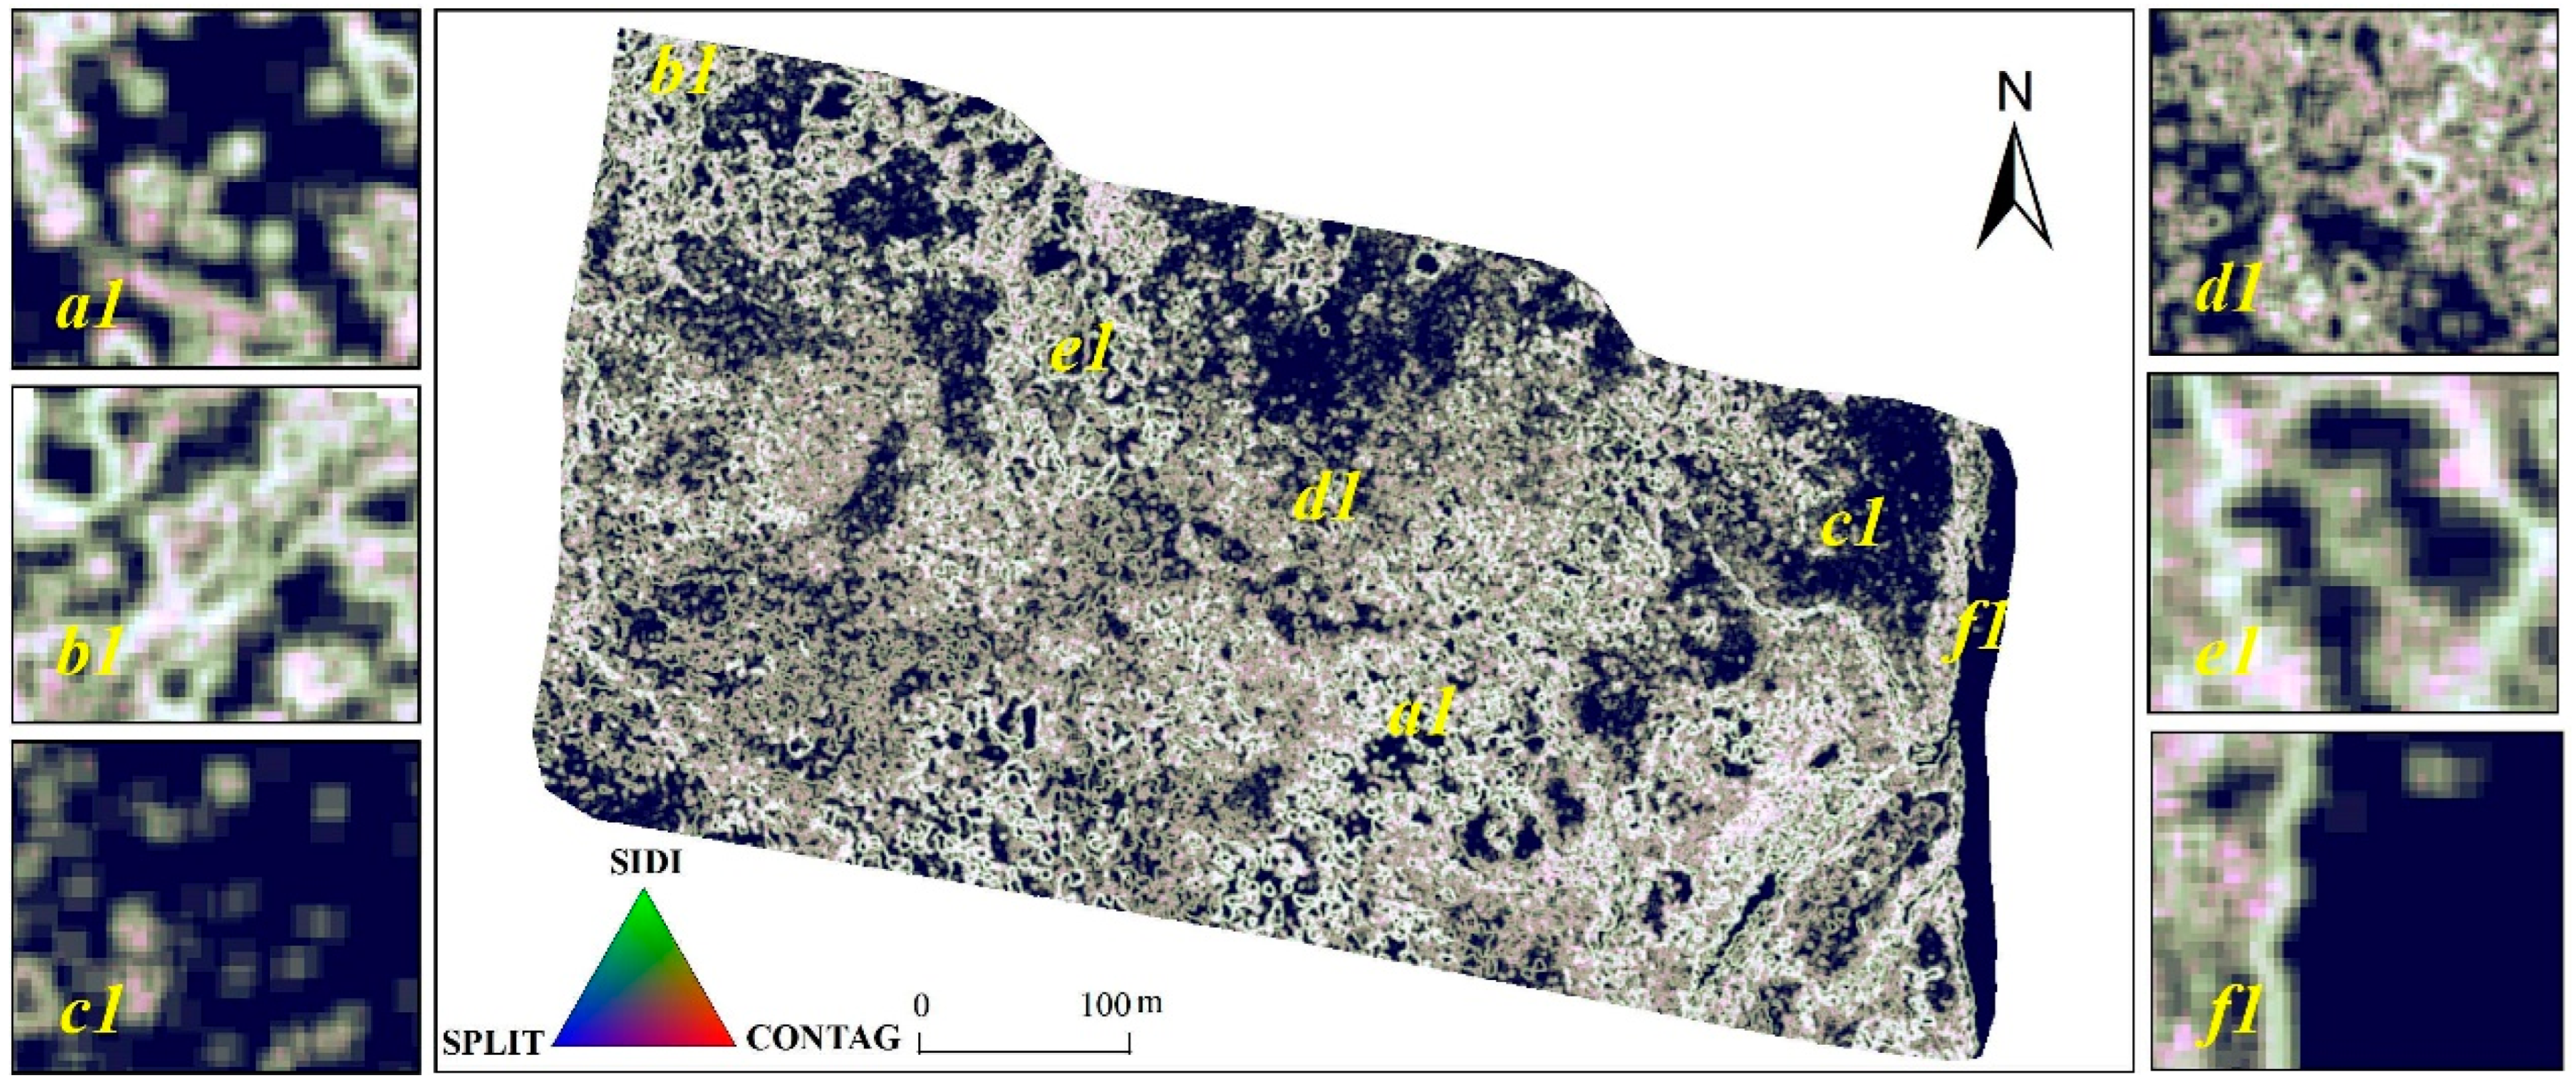
73] are fused at the level of species diversity, which effectively solves the problem of selecting indicator systems at the level of species diversity. In the selection of species diversity and landscape diversity indicator systems, this study is based on the classification results of unmanned-aerial-vehicle remote sensing images, which derive mangrove aboveground biomass and three landscape pattern indices (Simpson diversity index (SIDI), landscape separation index (SPLIT), and landscape spread Index (CONTAG)). This indicator system selection emphasizes both the representativeness and practicality of indicator selection, fully analyzes the connotation of biodiversity, and reflects various levels of biodiversity. UAV data are easy to obtain with strong timeliness and operability, which solves the problem of difficult extraction of biodiversity indicators and parameters in coastal mudflat areas for biodiversity assessment.

4.2. Applicability of UAV Hyperspectral and Lidar in Biodiversity Assessment

Scholars have combined optical remote sensing data and laser radar to conduct forest biodiversity modeling based on the relationships between spectral heterogeneity, structural diversity, and species diversity. This has resulted in improved accuracy in estimating tree species diversity [74,75,76]. Integrating optical and LiDAR or microwave remote sensing data can fully explain forest biodiversity variability from both canopy spectral and vertical structure features, providing a significant opportunity for biodiversity remote sensing monitoring. The hyperspectral data and LiDAR data obtained via drone remote sensing can be used to monitor forest biodiversity from both canopy spectral features and vertical structure features, which provides the possibility for rapid monitoring of mangrove biodiversity.
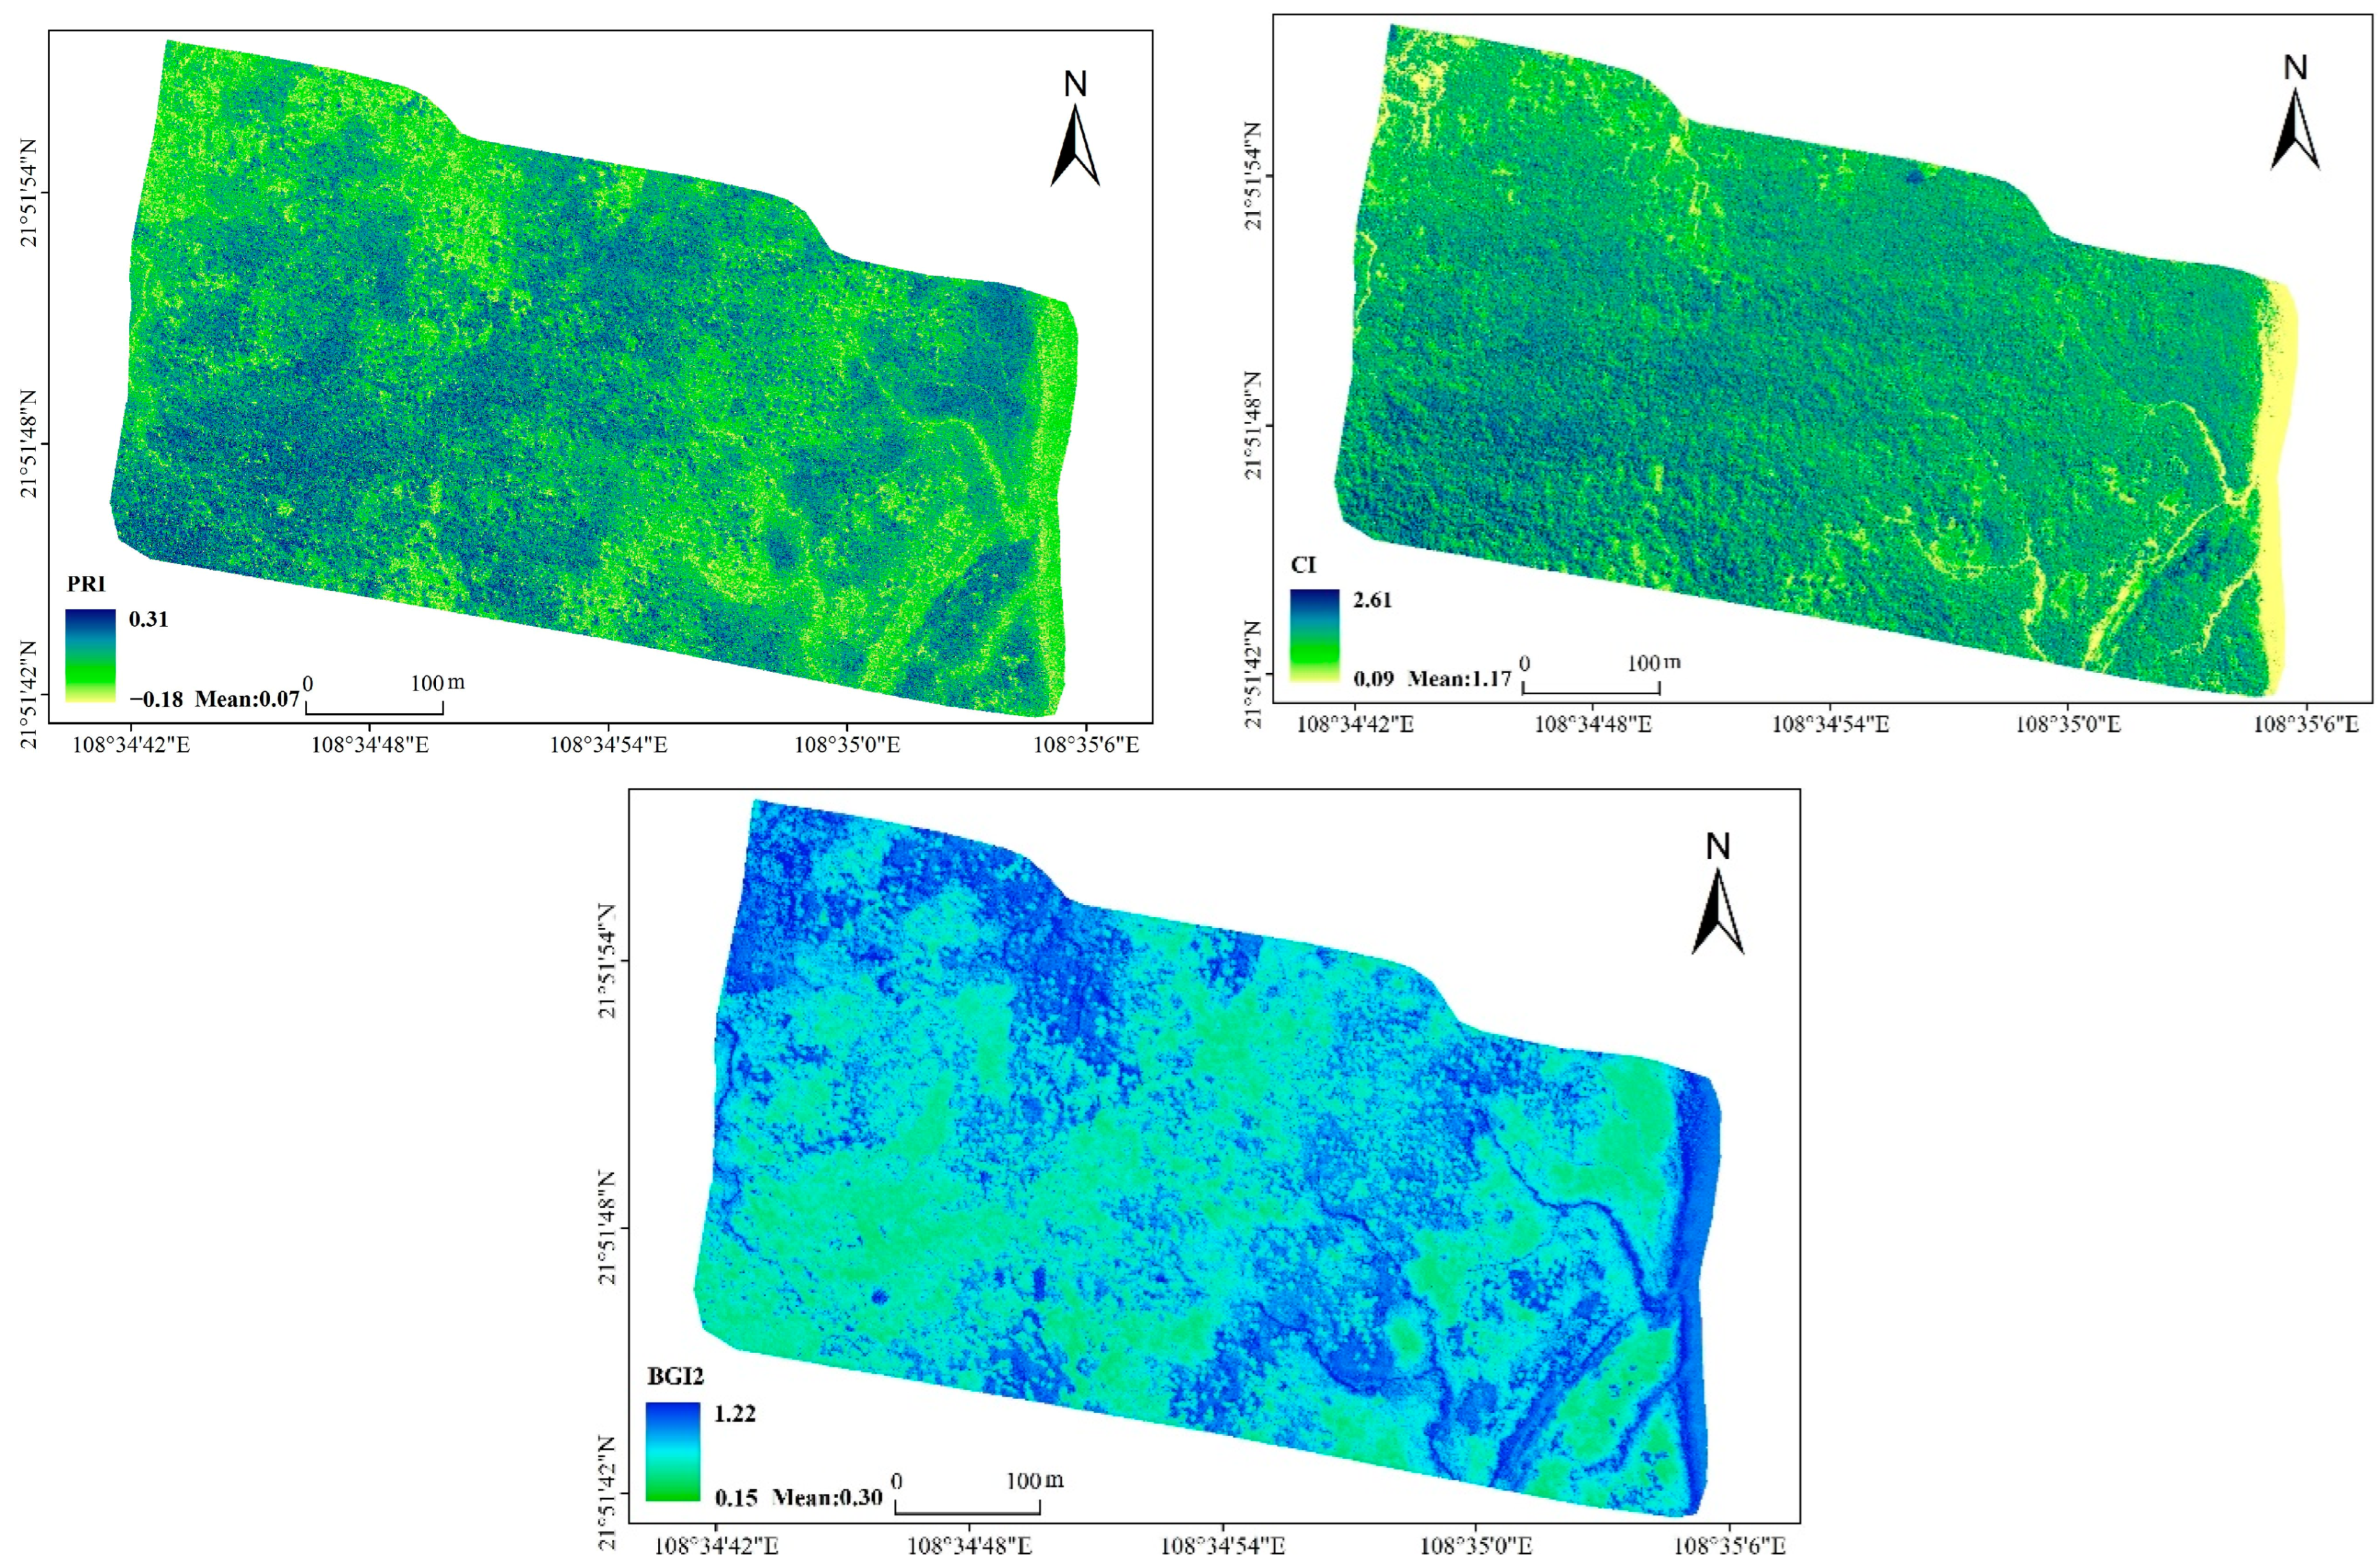
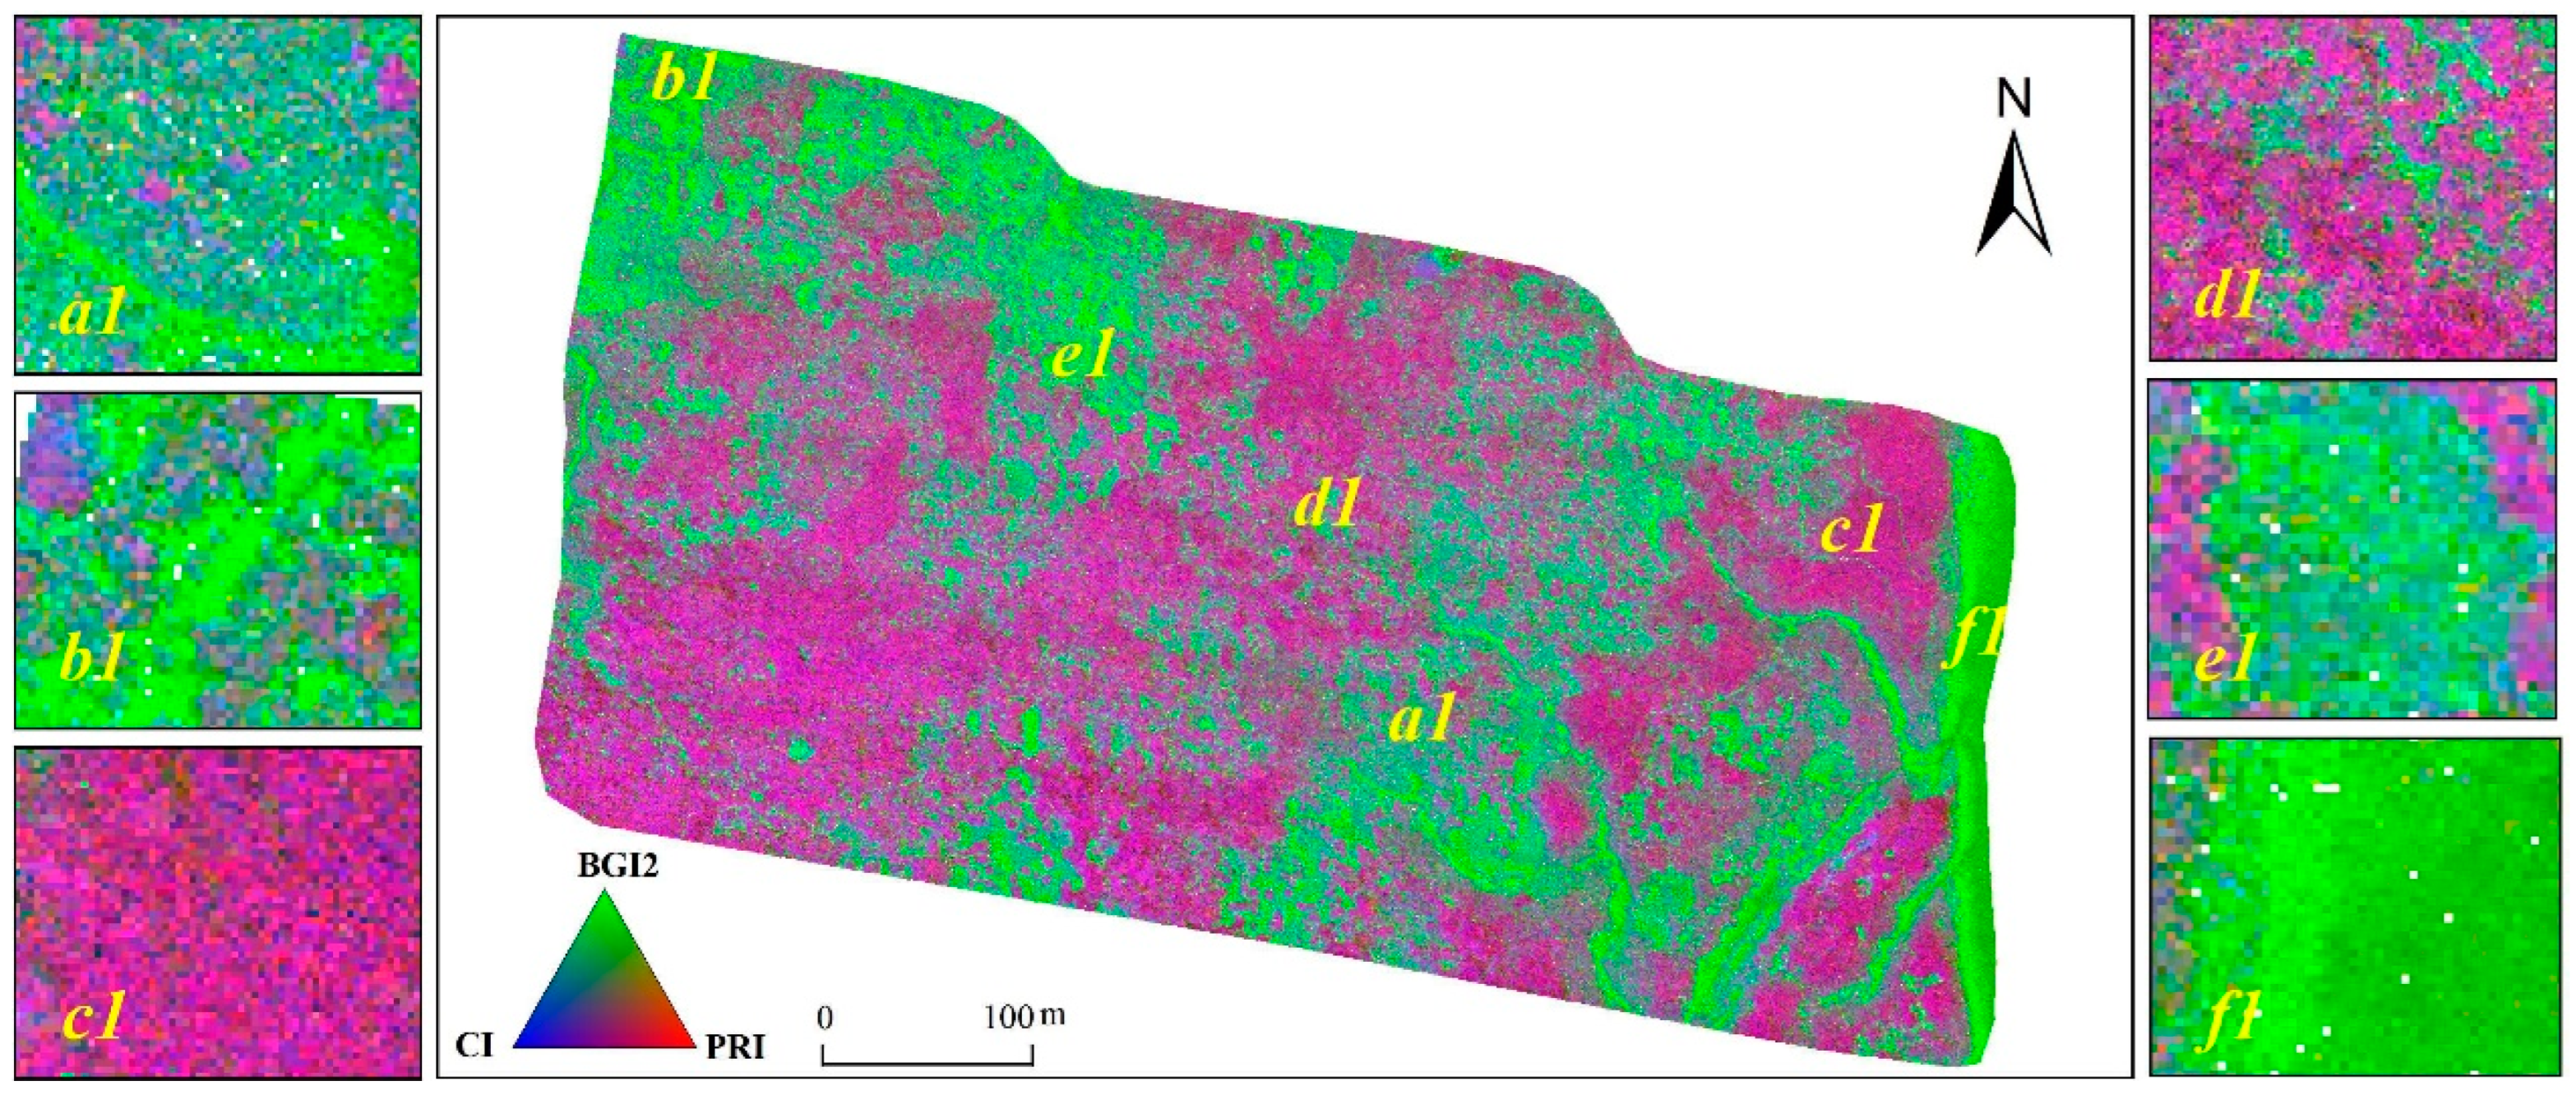
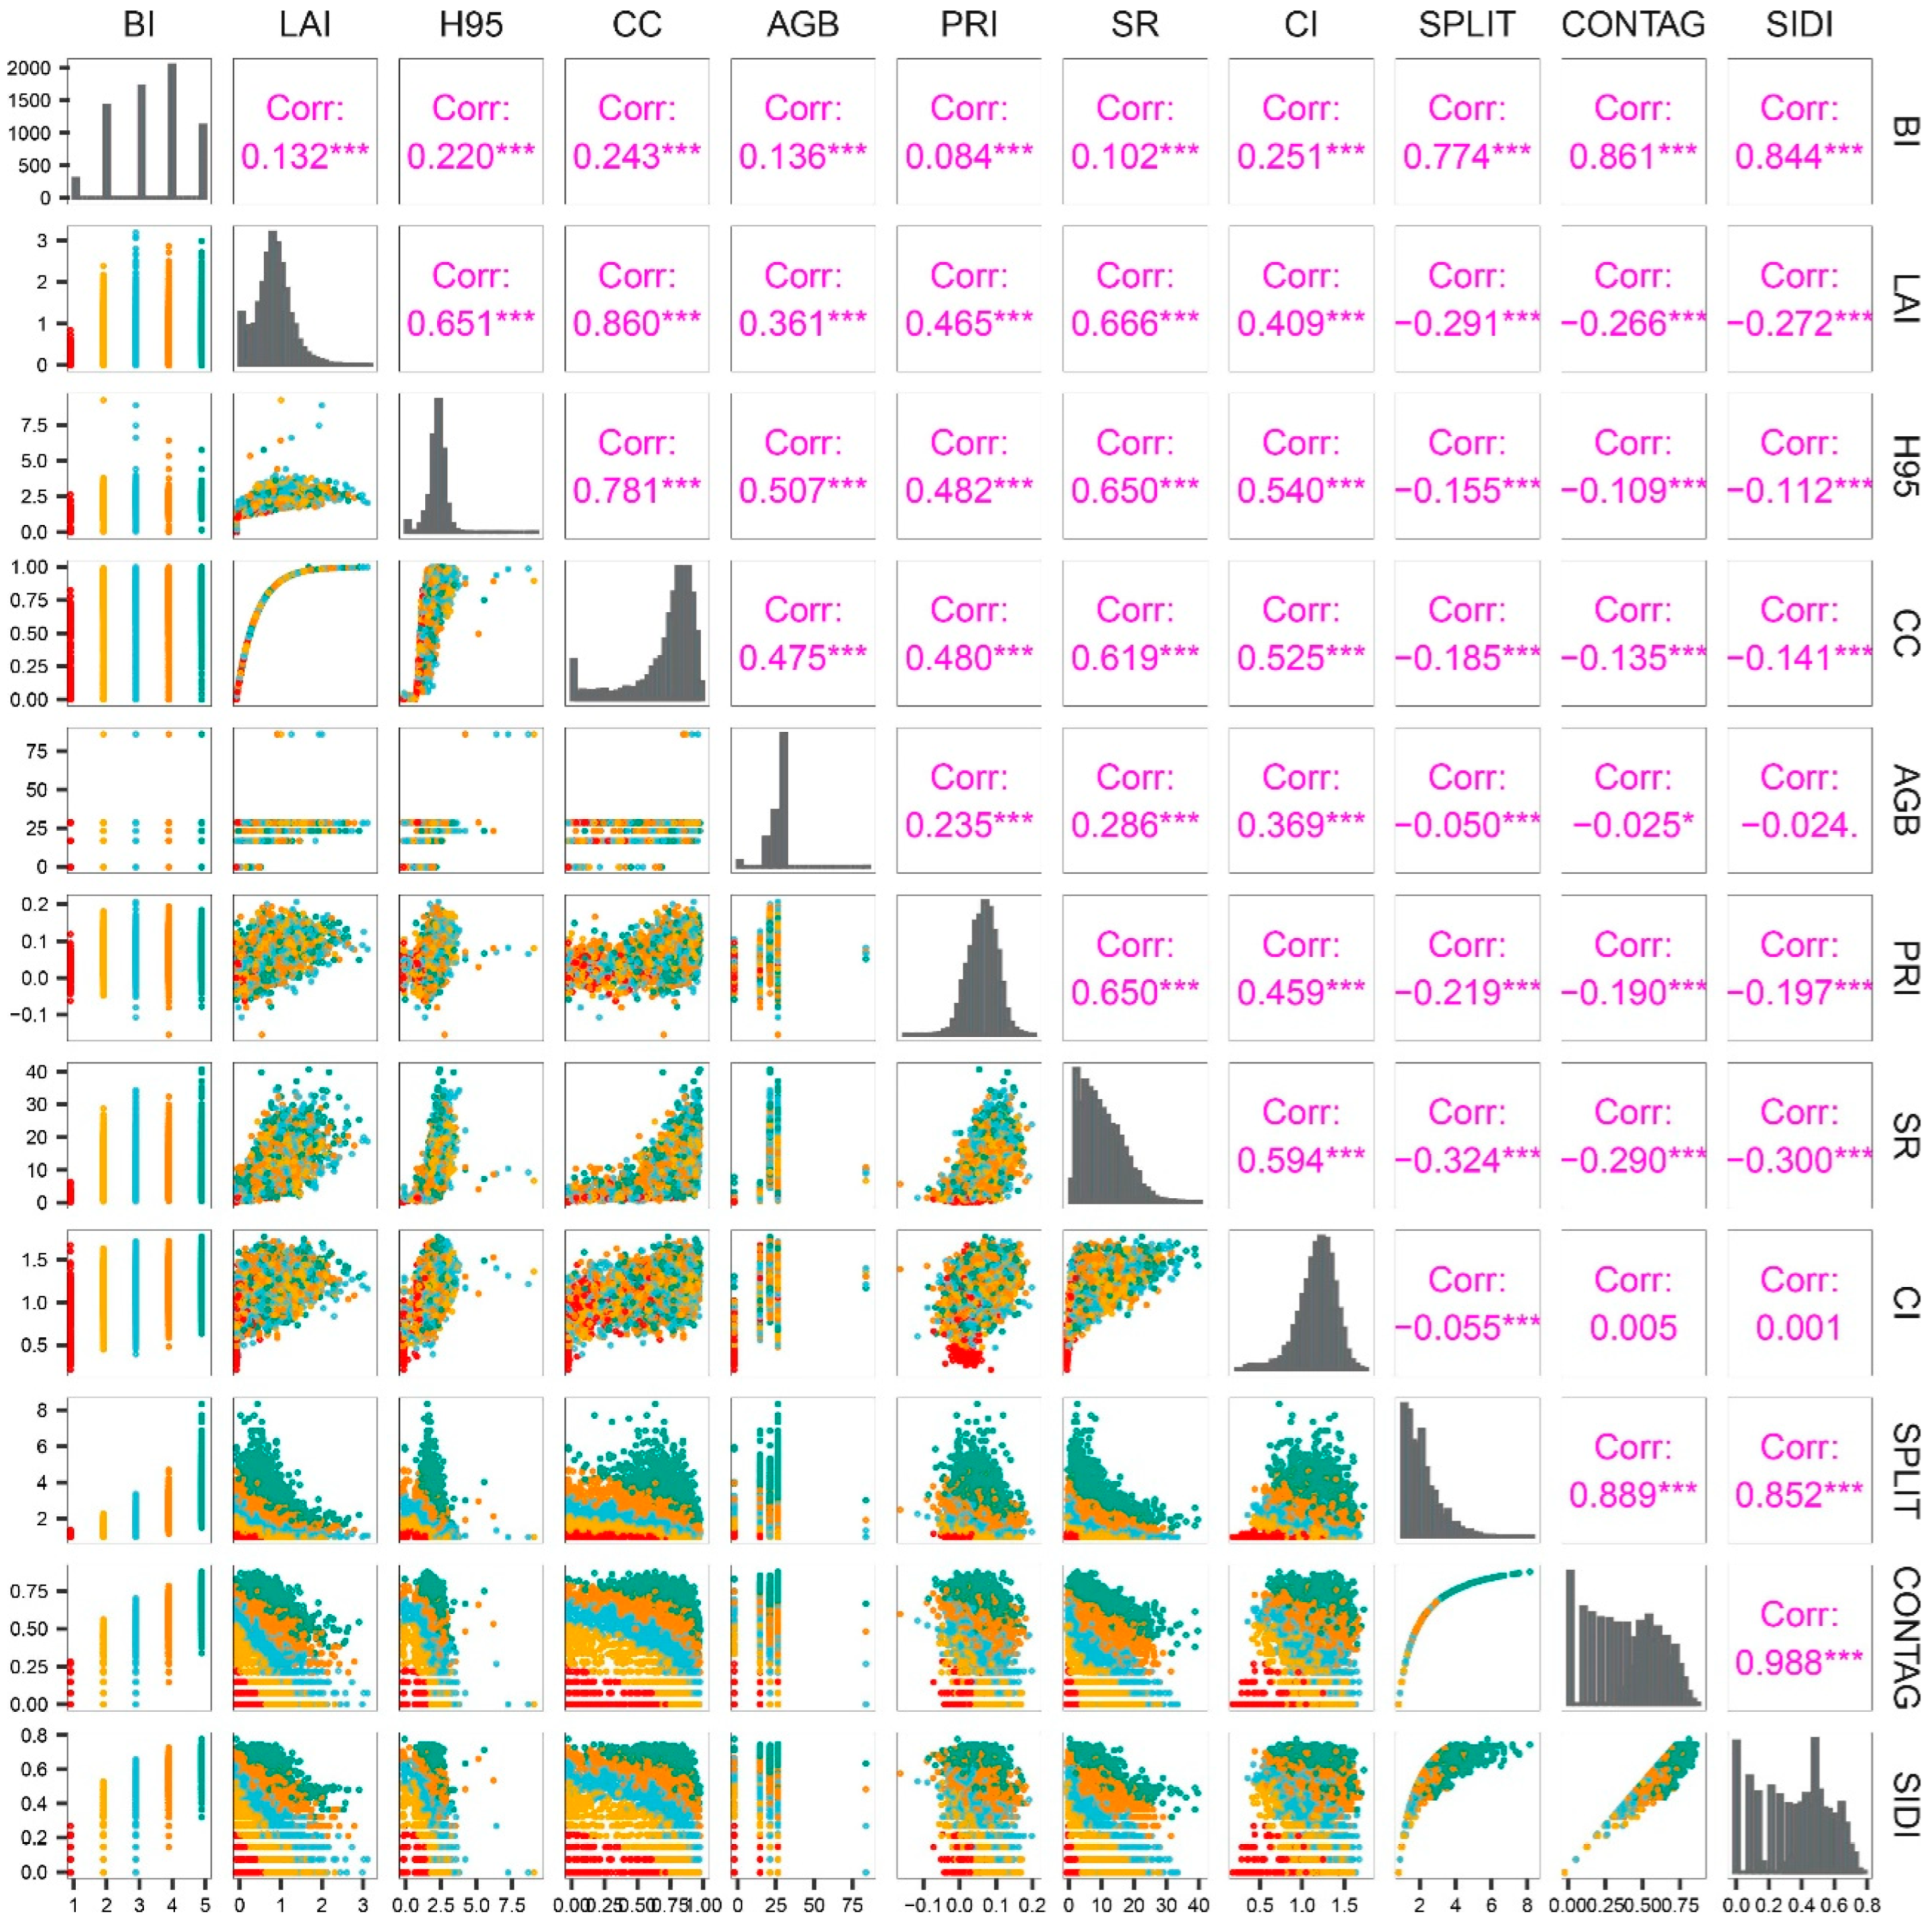
In this study, we extracted PRI (spectral reflectance of mangrove leaves), BGI2 (mangrove blue–green pigment index), and CI (chlorophyll content) from the hyperspectral data of unmanned aerial vehicles to characterize the mangrove canopy’s spectral variability. These physiological characteristics depict the biodiversity of mangroves on the scale of the photosynthetic effective rate, carotenoids in leaves, and chlorophyll properties, which can describe the biodiversity characteristics of mangroves in a more detailed spectral dimension than previous research results have. Previous researchers using the “spectral variation hypothesis” mainly used the variation characteristics (standard deviation, variance, and coefficient of variation) of NDVI indices extracted from multispectral data as predictive factors for tree species diversity modeling [77,78,79,80]. Their results showed that the standard deviations of the green light band reflectance and infrared band derivative have strong explanatory power for the Shannon diversity of tropical tree species. Therefore, this study used PRI, BGI2, and CI indices extracted from unmanned-aerial-vehicle LiDAR data to establish mangrove biodiversity indicators, which can take advantage of hyperspectral data in spectral dimensions. The contents of lutein pigments, carotenoids, and chlorophyll can better reflect the characteristics of mangroves at the mangrove level, providing the possibility for the application of UAV hyperspectral data to mangrove biodiversity. UAV LiDAR can quickly and accurately obtain the three-dimensional coordinates of research objects all day and under all weather conditions, which provides convenience for the classification of mangrove populations and extraction of structural diversity information [
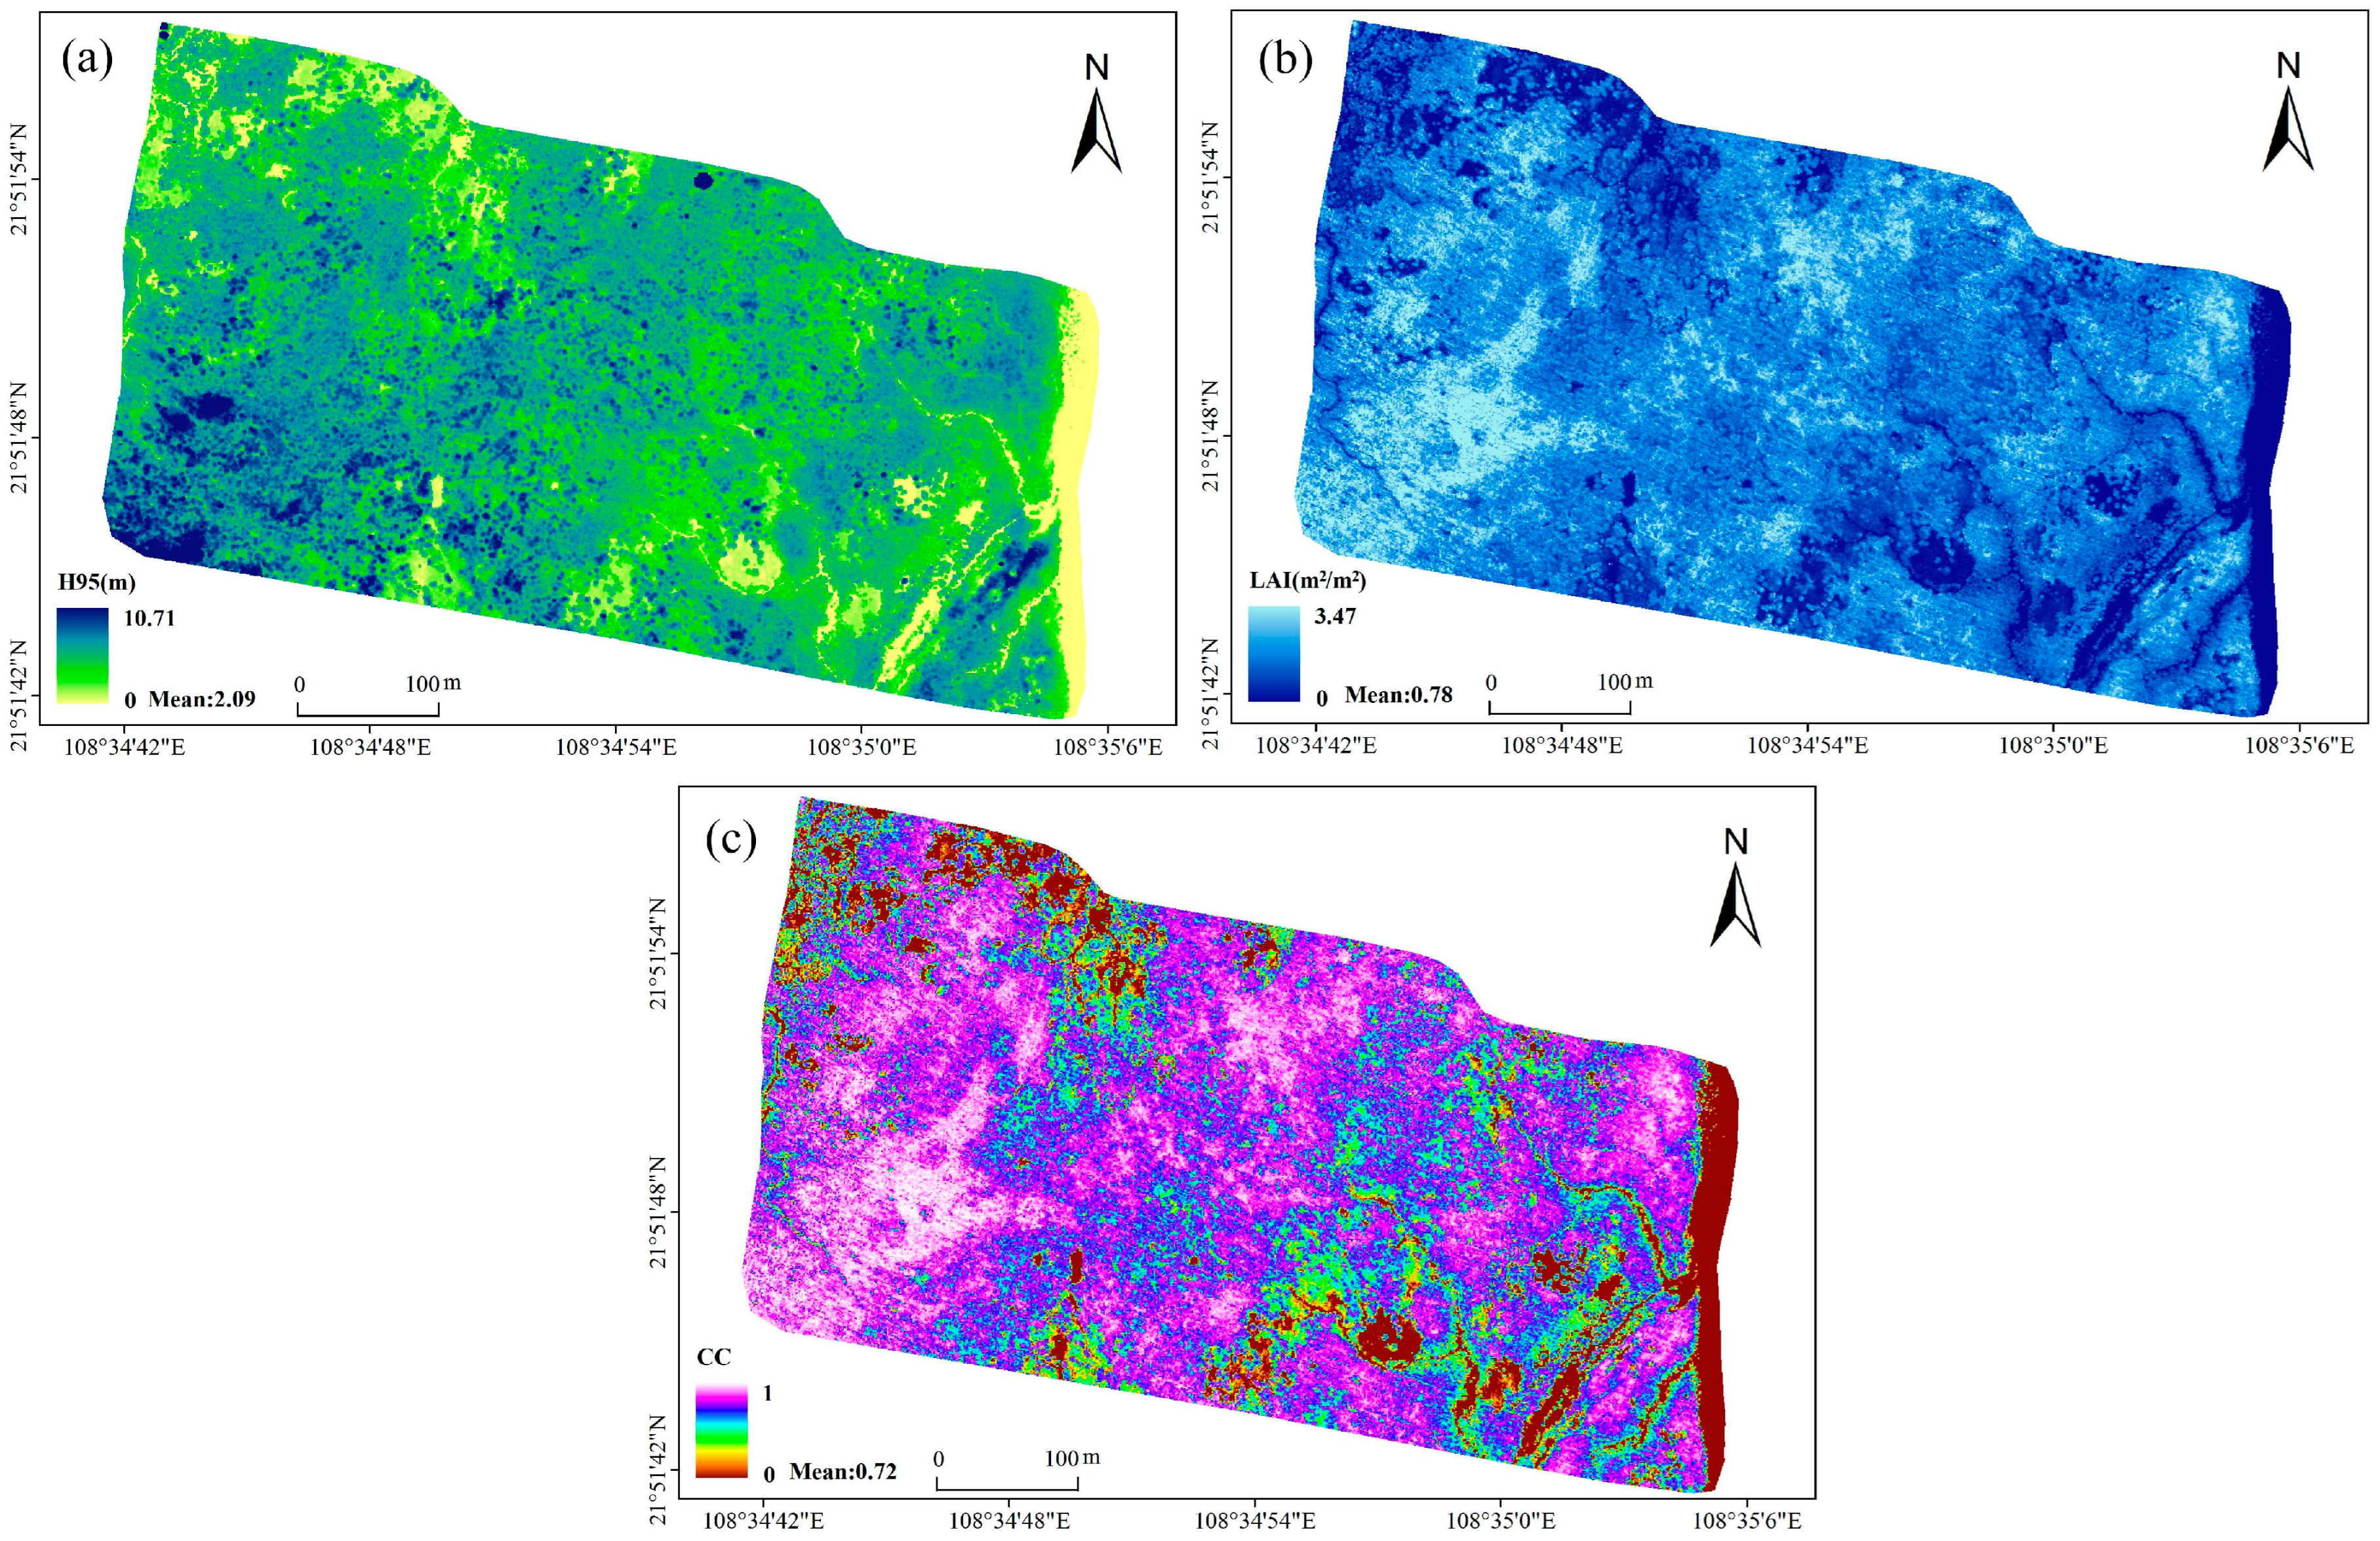
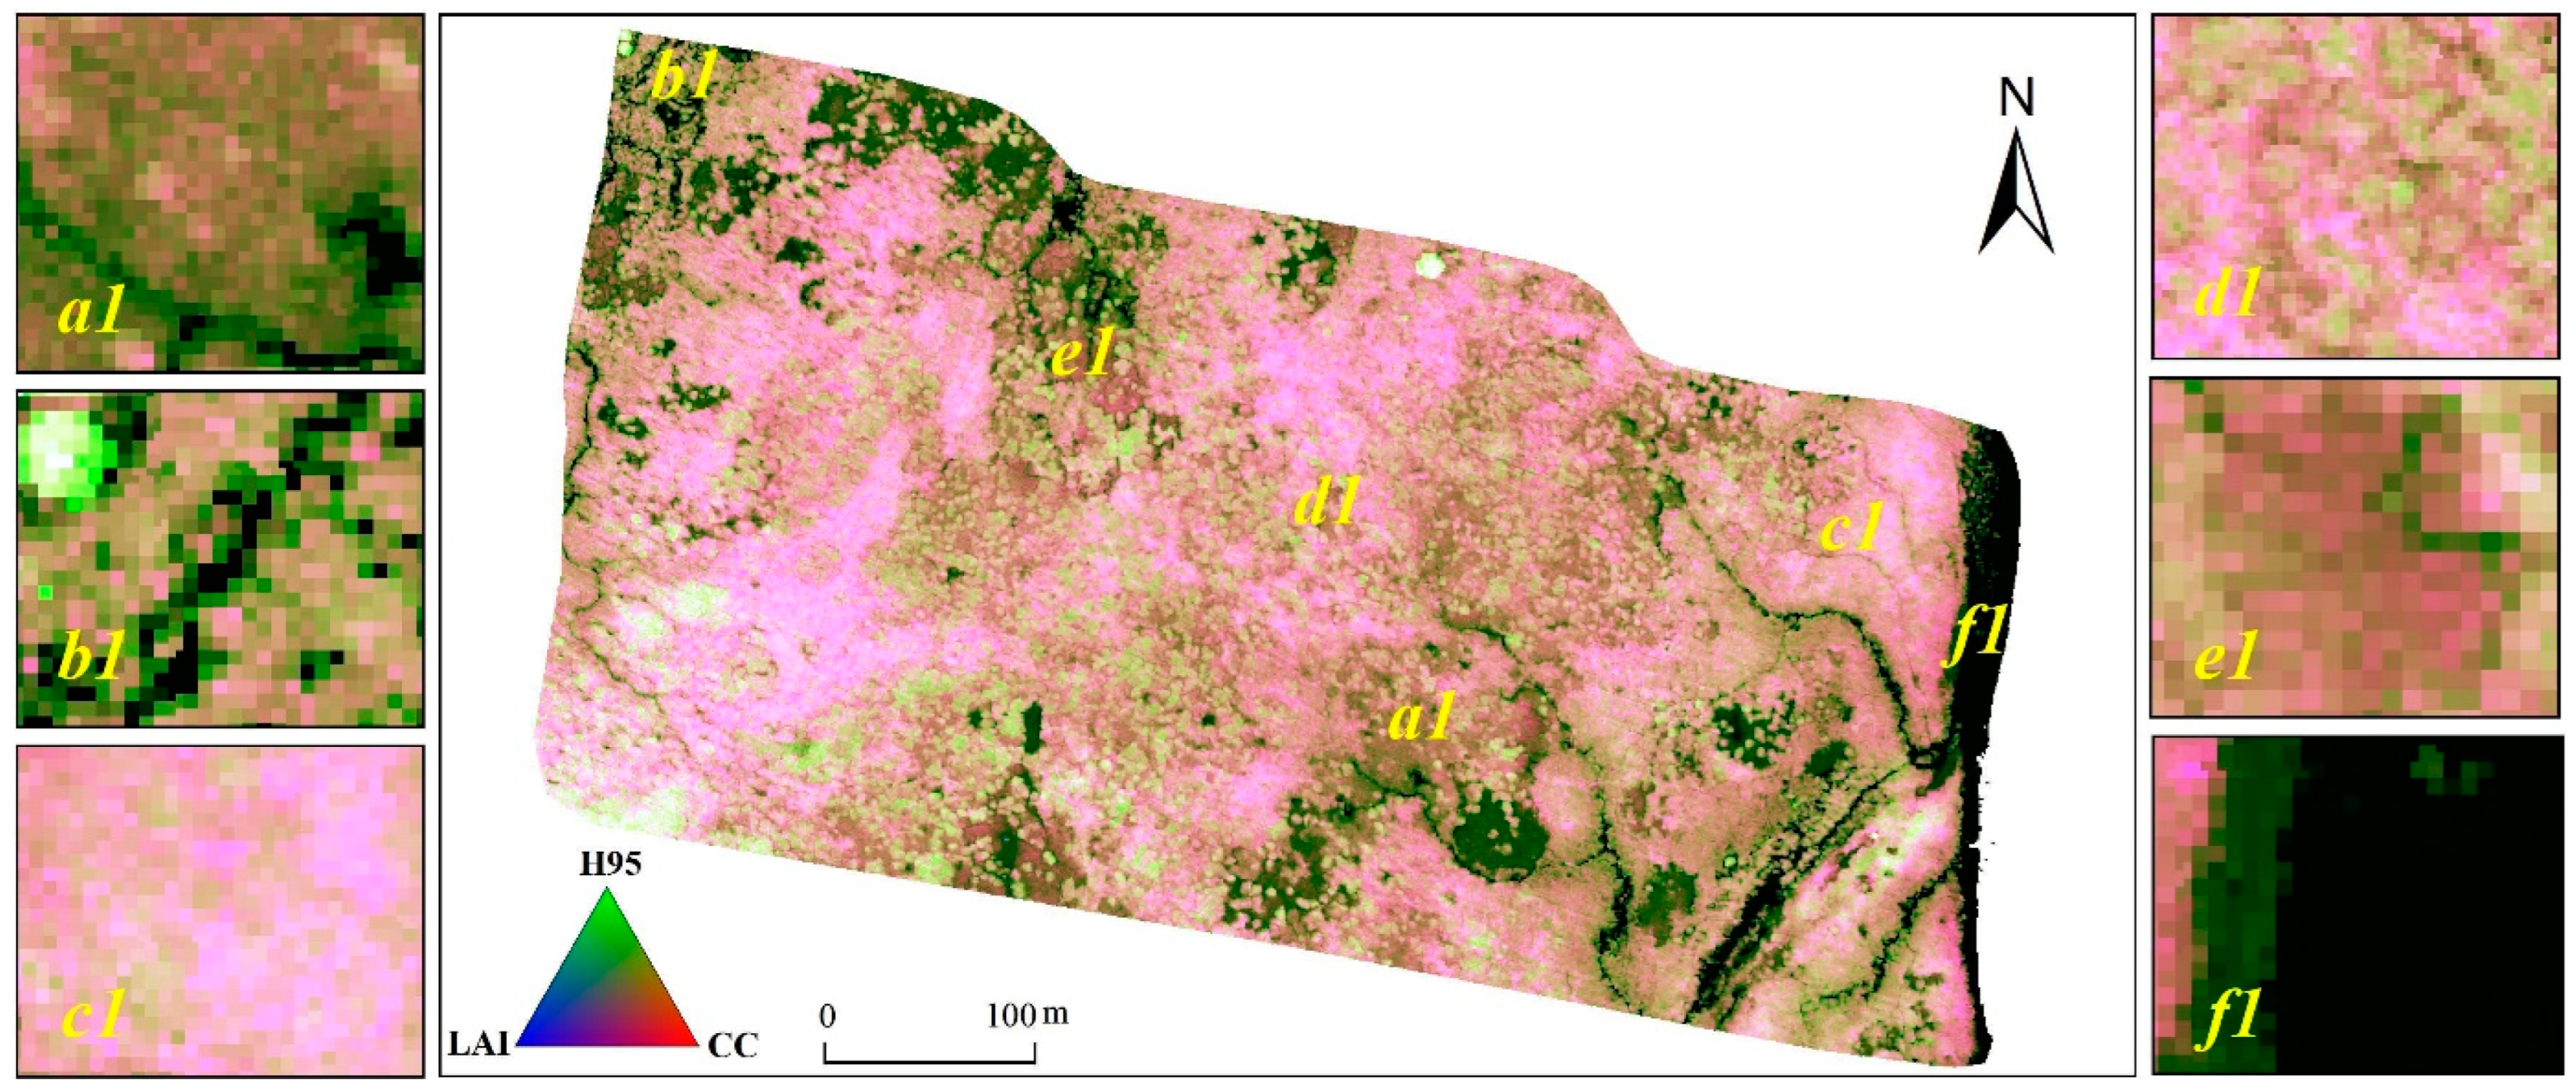
16]. In this study, we extracted three indicators of mangroves (H95), LAI, and canopy coverage (CC) from UAV laser point-cloud data to characterize the biodiversity characteristics of the vertical structure of mangroves. These morphological characteristics represent the height, openness, and complexity of the mangrove canopy structure and have been widely used to characterize the diversity of the canopy structure [81,82,83]. The correlation coefficient between the vegetation index generated by hyperspectral variables of unmanned aerial vehicles and the mangrove biodiversity index is generally lower than that generated by laser point-cloud data, indicating that the characteristic parameters of the vertical structure are better able to characterize the biodiversity status of mangroves. This is consistent with the results of Zheng et al. [41], who investigated the effects of laser point-cloud variables (H95, LAI, and FHD) and hyperspectral variables (CRI, SLA, and NDNI) on the biodiversity of subtropical forests in China. The results showed that the H95 variable in the laser point cloud contributed the most to biodiversity, whereas hyperspectral variables contributed less to the functional diversity of forests.

4.3. Uncertainty of Model Evaluation Results and Future Research Directions

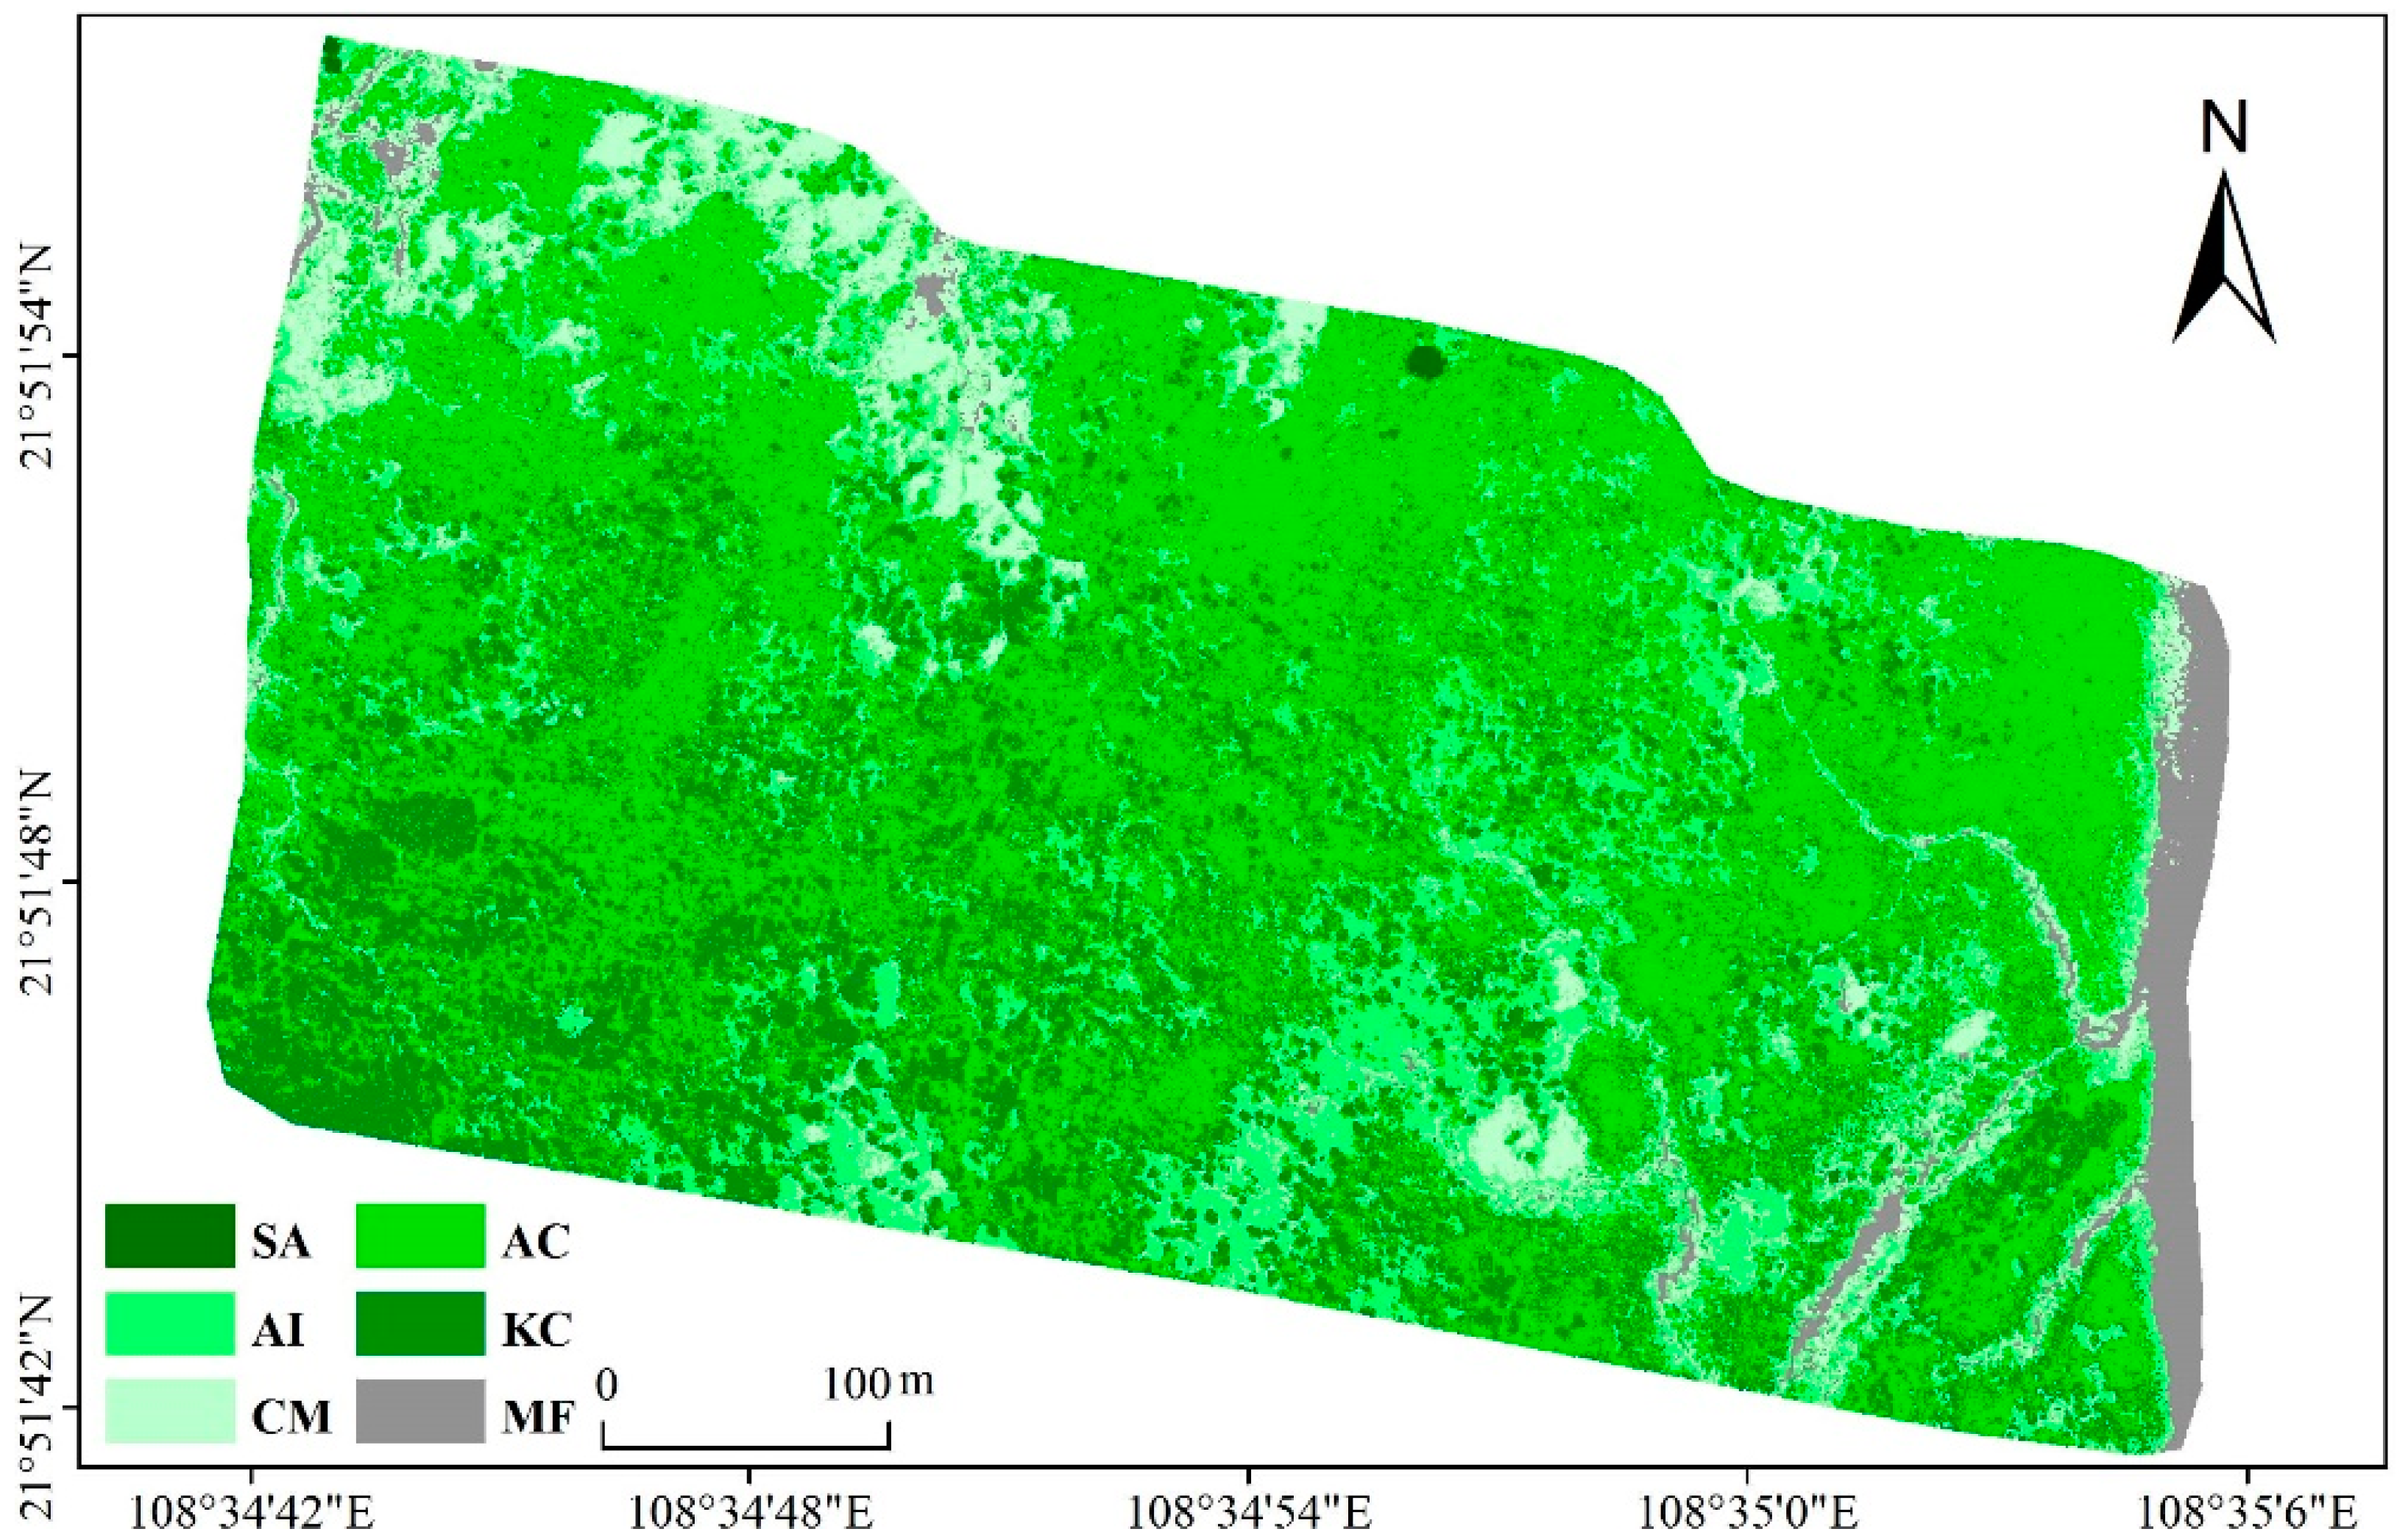
In this study, a specific indicator system was adopted at three levels to evaluate biodiversity indicators: species diversity, ecosystem diversity, and landscape diversity indicators. The generation of ecosystem and landscape diversity indicators was based on the UAV landscape classification results. The classification of mangrove landscape patterns in the study area was performed using various vegetation, UAV hyperspectral, and laser radar data with the support of the CART method [45]. Although the CART decision tree is a supervised classification method that can improve classification accuracy, it is necessary to select a high-quality supervised classification sample set to construct and evaluate the decision tree. Thus, other classification methods, such as machine learning algorithms (random forest [43], SVM [25], and XGBoost [16]), can be considered in the future by integrating UAV laser remote sensing data and hyperspectral remote sensing data for mangrove landscape classification. At the species diversity level, this study mainly selected the PRI, BGI2, and CI of mangroves as hyperspectral variables to characterize the mangrove’s canopy spectral variability. However, it is possible to obtain sensitive indices for other traits that contribute to tree growth, reproduction, survival, vegetation dynamics, and ecosystem function. Incorporating such traits, including functional traits such as chlorophyll, nitrogen, carbon content, and other functional traits of leaves of different mangrove species [40,84], into the biodiversity assessment index system may result in more accurate mangrove biodiversity assessment results.
It is important to consider the environmental conditions under which different mangrove species grow, such as salinity, soil, and climate factors, as they can affect mangrove biodiversity. Future research should incorporate these factors into a biodiversity assessment index system to improve the accuracy of the model. However, owing to the small study area, the salinity, soil, and climate factors of mangroves in this area are relatively uniform. If the methodology proposed in this study is applied to assess mangrove biodiversity on a larger scale, such as in the Maowei Sea and Beibu Gulf, the impact of salinity, soil, and climate factors in different regions on mangrove biodiversity must be considered. Finally, this study used unmanned-aerial-vehicle hyperspectral and laser point-cloud data to assess mangrove biodiversity in the estuary of China’s first Pinglu Canal. Although the study area is relatively small, the framework proposed in this study can be used for large-scale biodiversity mapping, providing a feasible local mangrove biodiversity conservation strategy after the construction of the Pinglu Canal. This study provides a feasible solution for large-scale biodiversity mapping.

4.4. Recommendations for the Protection of Mangrove Biodiversity

Guangxi Pinglu Canal Group Co., Ltd. was established on 30 June 2022. The company mainly focuses on the development of resources along the canal and the investment and construction of industries related to the Canal Economic Belt. Because the biodiversity value of the studied mangrove areas is much higher than that of the surrounding areas, it is important to carry out biodiversity conservation of mangroves during engineering construction. Therefore, this study proposes the following recommendations for Pinglu Canal Company:
Firstly, strictly abide by the relevant regulations on regional mangrove management. During the construction period of Pinglu Canal Group Co., Ltd., no damage or impact shall be caused to the surrounding mangrove forests, and no materials shall be piled up in the mangrove forests. During the construction of the Pinglu Canal, temporary sites such as borrow areas, spoil areas, stockpile areas, and worksheds should be set up outside the core protected area of the mangrove forest to ensure that the damage to the mangrove forest in the area during construction is minimized.
Secondly, the construction scope should be strictly controlled. The sediment from channel dredging should be transported out of the construction area in a timely manner and should not be directly dumped into the surrounding area to avoid covering the roots of mangrove plants and causing damage or even death to the mangroves. If it is found that the Pinglu Canal Company is damaged and endangers the survival of mangroves or even experiences abnormal situations of mangrove decline or death, it should be immediately reported to the Forestry Department or the Oceanic Administration and other competent departments, and emergency measures should be taken to control the situation in a timely manner. If necessary, the work should be stopped.
Thirdly, the core area of mangrove biodiversity should be absolutely protected. Except for the necessary field positioning observations for scientific research, facilities or activities that affect or interfere with the ecological environment of mangroves should not be established or engaged in. Owing to the blockage of seawater caused by construction equipment and facilities, seawater can be prevented from reaching the surrounding areas of mangroves, resulting in changes in the growth environment and death of mangroves. Therefore, construction equipment and facilities cannot be deployed in core areas of mangrove biodiversity protection.
Fourthly, try to shorten the construction period as much as possible. Pinglu Canal Company should try its best to use advanced and reasonable construction equipment and processes, strictly follow the operating procedures, scientifically arrange the operating procedures, shorten the construction period as much as possible, and minimize the impact of project construction on the regional mangrove ecosystem.

5. Conclusions

This study focused on the mangrove community in the Maowei Sea, the estuary of China’s first Pinglu Canal since the founding of the People’s Republic of China, and proposed an evaluation index system for mangrove biodiversity at the levels of species diversity, ecosystem diversity, and landscape diversity. By integrating data such as vertical structure and canopy spectral features extracted from airborne laser radar and hyperspectral data, the study achieved quantitative calculation and spatial distribution pattern evaluation of mangrove biodiversity. The results show the following:
(1)
The weight of mangrove landscape diversity has the highest value of 0.5577, followed by species diversity indicators with a weight of 0.4116, and ecosystem diversity has the lowest weight with a value of 0.0307.
(2)
The mangrove biodiversity index ranges from 0 to 0.63, with an average value of 0.29. High-biodiversity areas are mainly concentrated in the southwest of the study area, while low-biodiversity areas are mainly concentrated in the north of the study area.
(3)
The most suitable distribution area for the mangrove biodiversity index is mainly concentrated in the distance range with an elevation of 1.43–1.59 m and an offshore distance of 150.08–204.28 m.
(4)
The core area for mangrove biodiversity conservation is relatively small, accounting for only 2.32%, while the buffer zone and experimental zone account for a larger proportion, with values of 35.99% and 61.69%, respectively.

Author Contributions

Conceptualization, Y.T. and H.H.; methodology, Y.T. and G.Z.; software, Q.Z. and X.X.; validation, Y.T., Y.Z. and J.L.; formal analysis, Y.T.; investigation, Y.T., G.Z., Q.Z., X.X., J.O. and J.T.; resources, Y.T., H.H. and G.Z; data curation, Y.T. and Q.Z.; writing—original draft preparation, Y.T.; writing—review and editing, Y.T.; visualization, Y.T., H.H. and Q.Z.; supervision, Y.T.; project administration, Y.T. All authors have read and agreed to the published version of the manuscript.

Funding

This work is supported by the National Natural Science Foundation of China (grant numbers 42261024 and 42061020), Guangxi Forestry Science and Technology Promotion demonstration project (Guilin scientific research [2022] no. 4), Marine Science First-Class Subject, Beibu Gulf University (DRB003), Key Research Base of Humanities and Social Sciences in Guangxi Universities “Beibu Gulf Ocean Development Research Center” (BHZKY2202), major projects of key research bases for humanities and social sciences in Guangxi universities (JDZD202214), high-level talent introduction project of Beibu Gulf University, (grant no. 2019KYQD28).

Data Availability Statement

Not applicable.

Conflicts of Interest

The authors declare no conflict of interest.

References

  1. Trégarot, E.; Caillaud, A.; Cornet, C.C.; Taureau, F.; Catry, T.; Cragg, S.M.; Failler, P. Mangrove ecological services at the forefront of coastal change in the French overseas territories. Sci. Total. Environ. 2021, 763, 143004. [Google Scholar] [CrossRef]
  2. Hu, W.; Wang, Y.; Zhang, D.; Yu, W.; Chen, G.; Xie, T.; Liu, Z.; Ma, Z.; Du, J.; Chao, B. Mapping the potential of mangrove forest restoration based on species distribution models: A case study in China. Sci. Total. Environ. 2020, 748, 142321. [Google Scholar] [CrossRef]
  3. Damastuti, E.; de Groot, R.; Debrot, A.O.; Silvius, M.J. Effectiveness of community-based mangrove management for biodiversity conservation: A case study from Central Java, Indonesia. Trees For. People 2022, 7, 100202. [Google Scholar] [CrossRef]
  4. Alongi, D.M. Mangrove forests: Resilience, protection from tsunamis, and responses to global climate change. Estuar. Coast. Shelf Sci. 2008, 76, 1–13. [Google Scholar] [CrossRef]
  5. Richards, D.R.; Friess, D.A. Rates and drivers of mangrove deforestation in Southeast Asia, 2000–2012. Proc. Natl. Acad. Sci. USA 2016, 113, 344–349. [Google Scholar] [CrossRef]
  6. Valiela, I.; Bowen, J.L.; York, J.K. Mangrove Forests: One of the World’s Threatened Major Tropical Environments: At least 35% of the area of mangrove forests has been lost in the past two decades, losses that exceed those for tropical rain forests and coral reefs, two other well-known threatened environments. Bioscience 2001, 51, 807–815. [Google Scholar]
  7. Alongi, D.M. Present state and future of the world’s mangrove forests. Environ. Conserv. 2002, 29, 331–349. [Google Scholar] [CrossRef]
  8. Duke, N.C.; Meynecke, J.O.; Dittmann, S.; Ellison, A.M.; Anger, K.; Berger, U.; Cannicci, S.; Diele, K.; Ewel, K.C.; Field, C.D. A world without mangroves? Science 2007, 317, 41–42. [Google Scholar] [CrossRef] [PubMed]
  9. Friess, D.A.; Rogers, K.; Lovelock, C.E.; Krauss, K.W.; Hamilton, S.E.; Lee, S.Y.; Lucas, R.; Primavera, J.; Rajkaran, A.; Shi, S. The state of the world’s mangrove forests: Past, present, and future. Annu. Rev. Environ. Resour. 2019, 44, 89–115. [Google Scholar] [CrossRef]
  10. Hoban, S.; Bruford, M.; Jackson, J.D.U.; Lopes-Fernandes, M.; Heuertz, M.; Hohenlohe, P.A.; Paz-Vinas, I.; Sjögren-Gulve, P.; Segelbacher, G.; Vernesi, C. Genetic diversity targets and indicators in the CBD post-2020 Global Biodiversity Framework must be improved. Biol. Conserv. 2020, 248, 108654. [Google Scholar] [CrossRef]
  11. Donald, P.F.; Buchanan, G.M.; Balmford, A.; Bingham, H.; Couturier, A.R.; de la Rosa, G.E., Jr.; Gacheru, P.; Herzog, S.K.; Jathar, G.; Kingston, N. The prevalence, characteristics and effectiveness of Aichi Target 11′ s “other effective area-based conservation measures” (OECMs) in Key Biodiversity Areas. Conserv. Lett. 2019, 12, e12659. [Google Scholar] [CrossRef]
  12. Maxwell, S.L.; Cazalis, V.; Dudley, N.; Hoffmann, M.; Rodrigues, A.S.L.; Stolton, S.; Visconti, P.; Woodley, S.; Kingston, N.; Lewis, E. Area-based conservation in the twenty-first century. Nature 2020, 586, 217–227. [Google Scholar] [CrossRef] [PubMed]
  13. Yang, R.; Cao, Y.; Hou, S.; Peng, Q.; Wang, X.; Wang, F.; Tseng, T.-H.; Yu, L.; Carver, S.; Convery, I. Cost-effective priorities for the expansion of global terrestrial protected areas: Setting post-2020 global and national targets. Sci. Adv. 2020, 6, eabc3436. [Google Scholar] [CrossRef]
  14. Venter, O.; Magrach, A.; Outram, N.; Klein, C.J.; Possingham, H.P.; Di Marco, M.; Watson, J.E.M. Bias in protected-area location and its effects on long-term aspirations of biodiversity conventions. Conserv. Biol. 2018, 32, 127–134. [Google Scholar] [CrossRef]
  15. Guo, S.-Z.; Bai, H.-Y.; Huang, X.-Y.; Meng, Q.; Zhao, T. Remote sensing phenology of Larix chinensis forest in response to climate change in Qinling Mountains. Chin. J. Ecol. 2019, 38, 1123. [Google Scholar]
  16. Tian, Y.; Huang, H.; Zhou, G.; Zhang, Q.; Tao, J.; Zhang, Y.; Lin, J. Aboveground mangrove biomass estimation in Beibu Gulf using machine learning and UAV remote sensing. Sci. Total. Environ. 2021, 781, 146816. [Google Scholar] [CrossRef]
  17. Tian, Y.; Zhang, Q.; Huang, H.; Huang, Y.; Tao, J.; Zhou, G.; Zhang, Y.; Yang, Y.; Lin, J. Aboveground biomass of typical invasive mangroves and its distribution patterns using UAV-LiDAR data in a subtropical estuary: Maoling River estuary, Guangxi, China. Ecol. Indic. 2022, 136, 108694. [Google Scholar] [CrossRef]
  18. Giri, C.; Ochieng, E.; Tieszen, L.L.; Zhu, Z.; Singh, A.; Loveland, T.; Masek, J.; Duke, N. Status and distribution of mangrove forests of the world using earth observation satellite data. Glob. Ecol. Biogeogr. 2011, 20, 154–159. [Google Scholar] [CrossRef]
  19. Hernández-Stefanoni, J.L.; Gallardo-Cruz, J.A.; Meave, J.A.; Rocchini, D.; Bello-Pineda, J.; López-Martínez, J.O. Modeling α-and β-diversity in a tropical forest from remotely sensed and spatial data. Int. J. Appl. Earth Obs. Geoinf. 2012, 19, 359–368. [Google Scholar] [CrossRef]
  20. Wang, D.; Qiu, P.; Wan, B.; Cao, Z.; Zhang, Q. Mapping α-and β-diversity of mangrove forests with multispectral and hyperspectral images. Remote Sens. Environ. 2022, 275, 113021. [Google Scholar] [CrossRef]
  21. Tian, Y.; Yang, Z.; Yu, X.; Jia, Z.; Rosso, M.; Dedman, S.; Zhu, J.; Xia, Y.; Zhang, G.; Yang, J. Can we quantify the aquatic environmental plastic load from aquaculture? Water Res. 2022, 219, 118551. [Google Scholar] [CrossRef]
  22. Yang, Z.; Yu, X.; Dedman, S.; Rosso, M.; Zhu, J.; Yang, J.; Xia, Y.; Tian, Y.; Zhang, G.; Wang, J. UAV remote sensing applications in marine monitoring: Knowledge visualization and review. Sci. Total Environ. 2022, 838, 155939. [Google Scholar] [CrossRef]
  23. Hu, J.B.; Zhang, J. Unmanned Aerial Vehicle remote sensing in ecology: Advances and prospects. Acta Ecol. Sin. 2018, 38, 20–30. [Google Scholar]
  24. Turner, W. Sensing biodiversity. Science 2014, 346, 301–302. [Google Scholar] [CrossRef]
  25. Jiang, Y.; Zhang, L.; Yan, M.; Qi, J.; Fu, T.; Fan, S.; Chen, B. High-resolution mangrove forests classification with machine learning using worldview and uav hyperspectral data. Remote Sens. 2021, 13, 1529. [Google Scholar] [CrossRef]
  26. Otero, V.; Van De Kerchove, R.; Satyanarayana, B.; Martínez-Espinosa, C.; Fisol, M.A.B.; Ibrahim, M.R.B.; Sulong, I.; Mohd-Lokman, H.; Lucas, R.; Dahdouh-Guebas, F. Managing mangrove forests from the sky: Forest inventory using field data and Unmanned Aerial Vehicle (UAV) imagery in the Matang Mangrove Forest Reserve, peninsular Malaysia. For. Ecol. Manag. 2018, 411, 35–45. [Google Scholar] [CrossRef]
  27. Zhu, X.; Hou, Y.; Weng, Q.; Chen, L. Integrating UAV optical imagery and LiDAR data for assessing the spatial relationship between mangrove and inundation across a subtropical estuarine wetland. ISPRS J. Photogramm. Remote Sens. 2019, 149, 146–156. [Google Scholar] [CrossRef]
  28. Cao, J.; Leng, W.; Liu, K.; Liu, L.; He, Z.; Zhu, Y. Object-based mangrove species classification using unmanned aerial vehicle hyperspectral images and digital surface models. Remote Sens. 2018, 10, 89. [Google Scholar] [CrossRef]
  29. Tian, J.; Wang, L.; Li, X.; Gong, H.; Shi, C.; Zhong, R.; Liu, X. Comparison of UAV and WorldView-2 imagery for mapping leaf area index of mangrove forest. Int. J. Appl. Earth Obs. Geoinf. 2017, 61, 22–31. [Google Scholar] [CrossRef]
  30. Xu, Y.; Wang, J.; Xia, A.; Zhang, K.; Dong, X.; Wu, K.; Wu, G. Continuous wavelet analysis of leaf reflectance improves classification accuracy of mangrove species. Remote Sens. Environ. 2019, 11, 254. [Google Scholar] [CrossRef]
  31. Zeming, Z.; Benqing, C.; Ran, X.; Wei, F. Identification of the mangrove species using UAV hyperspectral images: A case study of Zhangjiangkou mangrove national nature reserve. Haiyang Xuebao 2021, 43, 137–145. [Google Scholar]
  32. Qiu, P.; Wang, D.; Zou, X.; Yang, X.; Xie, G.; Xu, S.; Zhong, Z. Finer resolution estimation and mapping of mangrove biomass using UAV LiDAR and worldview-2 data. Forests 2019, 10, 871. [Google Scholar] [CrossRef]
  33. Zhu, Y.; Liu, K.; Myint, S.W.; Du, Z.; Li, Y.; Cao, J.; Liu, L.; Wu, Z. Integration of GF2 optical, GF3 SAR, and UAV data for estimating aboveground biomass of China’s largest artificially planted mangroves. Remote Sens. 2020, 12, 2039. [Google Scholar] [CrossRef]
  34. Heumann, B.W.; Hackett, R.A.; Monfils, A.K. Testing the spectral diversity hypothesis using spectroscopy data in a simulated wetland community. Ecol. Inform. 2015, 25, 29–34. [Google Scholar] [CrossRef]
  35. Palmer, M.W.; Earls, P.G.; Hoagland, B.W.; White, P.S.; Wohlgemuth, T. Quantitative tools for perfecting species lists. Environmetrics 2002, 13, 121–137. [Google Scholar] [CrossRef]
  36. Bongalov, B.; Burslem, D.F.R.P.; Jucker, T.; Thompson, S.E.D.; Rosindell, J.; Swinfield, T.; Nilus, R.; Clewley, D.; Phillips, O.L.; Coomes, D.A. Reconciling the contribution of environmental and stochastic structuring of tropical forest diversity through the lens of imaging spectroscopy. Ecol. Lett. 2019, 22, 1608–1619. [Google Scholar] [CrossRef]
  37. Gholizadeh, H.; Gamon, J.A.; Helzer, C.J.; Cavender-Bares, J. Multi-temporal assessment of grassland α-and β-diversity using hyperspectral imaging. Ecol. Appl. 2020, 30, e02145. [Google Scholar] [CrossRef]
  38. Xu, C.; Zeng, Y.; Zheng, Z.; Zhao, D.; Liu, W.; Ma, Z.; Wu, B. Assessing the impact of soil on species diversity estimation based on UAV imaging spectroscopy in a natural alpine steppe. Remote Sens. 2022, 14, 671. [Google Scholar] [CrossRef]
  39. Torresani, M.; Rocchini, D.; Sonnenschein, R.; Zebisch, M.; Hauffe, H.C.; Heym, M.; Pretzsch, H.; Tonon, G. Height variation hypothesis: A new approach for estimating forest species diversity with CHM LiDAR data. Earth Syst. Sci. Data 2020, 117, 106520. [Google Scholar] [CrossRef]
  40. Asner, G.P.; Martin, R.E.; Knapp, D.E.; Tupayachi, R.; Anderson, C.B.; Sinca, F.; Vaughn, N.R.; Llactayo, W. Airborne laser-guided imaging spectroscopy to map forest trait diversity and guide conservation. Science 2017, 355, 385–389. [Google Scholar] [CrossRef]
  41. Zheng, Z.; Zeng, Y.; Schneider, F.D.; Zhao, Y.; Zhao, D.; Schmid, B.; Schaepman, M.E.; Morsdorf, F. Mapping functional diversity using individual tree-based morphological and physiological traits in a subtropical forest. Remote Sens. Environ. 2021, 252, 112170. [Google Scholar] [CrossRef]
  42. Pal, S.K.; Majumdar, T.J.; Bhattacharya, A.K. ERS-2 SAR and IRS-1C LISS III data fusion: A PCA approach to improve remote sensing based geological interpretation. ISPRS J. Photogramm. Remote Sens. 2007, 61, 281–297. [Google Scholar] [CrossRef]
  43. Behera, M.D.; Barnwal, S.; Paramanik, S.; Das, P.; Bhattyacharya, B.K.; Jagadish, B.; Roy, P.S.; Ghosh, S.M.; Behera, S.K. Species-level classification and mapping of a mangrove forest using random forest—Utilisation of AVIRIS-NG and sentinel data. Remote Sens. 2021, 13, 2027. [Google Scholar] [CrossRef]
  44. Guo, Q.; Su, Y.; Hu, T.; Zhao, X.; Wu, F.; Li, Y.; Liu, J.; Chen, L.; Xu, G.; Lin, G. An integrated UAV-borne lidar system for 3D habitat mapping in three forest ecosystems across China. Int. J. Remote Sens. 2017, 38, 2954–2972. [Google Scholar] [CrossRef]
  45. Li, C.-F.; Dai, Y.-Y.; Zhao, J.-J.; Yin, J.-Y.; Dong, J.-S. Volcanic ash cloud detection from remote sensing images using principal component analysis. Comput. Electr. Eng. 2014, 40, 204–214. [Google Scholar] [CrossRef]
  46. Zhao, X.; Yue, C.-R.; Li, C.; Limei, Z.; Lei., G. Estimation of mean forest stand height based on airborne LiDAR data. J. For. Res. 2020, 33, 59–66. [Google Scholar]
  47. Qu, Y.; Shaker, A.; Silva, C.A.; Klauberg, C.; Pinagé, E.R. Remote sensing of leaf area index from LiDAR height percentile metrics and comparison with MODIS product in a selectively logged tropical forest area in Eastern Amazonia. Remote Sens. 2018, 10, 970. [Google Scholar] [CrossRef]
  48. Wang, Y.; Fang, H. Estimation of LAI with the LiDAR technology: A review. Remote Sens. 2020, 12, 3457. [Google Scholar] [CrossRef]
  49. Mielcarek, M.; Stereńczak, K.; Khosravipour, A. Testing and evaluating different LiDAR-derived canopy height model generation methods for tree height estimation. Int. J. Appl. Earth Obs. Geoinf. 2018, 71, 132–143. [Google Scholar] [CrossRef]
  50. Zhang, X.; Liu, L.; Chen, X.; Gao, Y.; Xie, S.; Mi, J. GLC_FCS30: Global land-cover product with fine classification system at 30 m using time-series Landsat imagery. Earth Syst. Sci. Data 2021, 13, 2753–2776. [Google Scholar] [CrossRef]
  51. Gitelson, A.A.; Zur, Y.; Chivkunova, O.B.; Merzlyak, M.N. Assessing carotenoid content in plant leaves with reflectance spectroscopy. Photochem. Photobiol. 2002, 75, 272–281. [Google Scholar] [CrossRef]
  52. Jordan, C.F. Derivation of leaf-area index from quality of light on the forest floor. Ecology 1969, 50, 663–666. [Google Scholar] [CrossRef]
  53. Tilman, D.; Wedin, D.; Knops, J. Productivity and sustainability influenced by biodiversity in grassland ecosystems. Nature 1996, 379, 718–720. [Google Scholar] [CrossRef]
  54. Hector, A.; Schmid, B.; Beierkuhnlein, C.; Caldeira, M.C.; Diemer, M.; Dimitrakopoulos, P.G.; Finn, J.A.; Freitas, H.; Giller, P.S.; Good, J. Plant diversity and productivity experiments in European grasslands. Science 1999, 286, 1123–1127. [Google Scholar] [CrossRef]
  55. Naeem, S.; Thompson, L.J.; Lawler, S.P.; Lawton, J.H.; Woodfin, R.M. Declining biodiversity can alter the performance of ecosystems. Nature 1994, 368, 734–737. [Google Scholar] [CrossRef]
  56. Wu, P.; Ren, G.; Zhang, C.; Wang, H.; Liu, S.; Ma, Y. Fine identification and biomass estimation of mangroves based on UAV multispectral and LiDAR. Natl. Remote Sens. Bull. 2022, 26, 1169–1181. [Google Scholar]
  57. Bojie, F.; Liding, C. Landscape diversity types and their ecological significance. Acta Geogr. Sin. 1996, 51, 454–462. [Google Scholar]
  58. Peng, Y.; Wang, W.-T.; Lu, Y.-T.; Dong, J.-H.; Zhou, Y.-Q.; Shang, J.-X.; Li, X.; Mi, K. Multiscale influences of urbanized landscape metrics on the diversity of indigenous plant species: A case study in Shunyi District of Beijing, China. J. Appl. Ecol. 2020, 31, 4058–4066. [Google Scholar]
  59. Xu, Q.; Zhang, F.; Xu, Z.; Jia, Y.; You, J. Some characteristics of Simpson index and the Shannon-Wiener index and their dilution effect. Pratacultural Sci. 2011, 28, 527–531. [Google Scholar]
  60. Dogan, H.M.; Dogan, M. A new approach to diversity indices–modeling and mapping plant biodiversity of Nallihan (A3-Ankara/Turkey) forest ecosystem in frame of geographic information systems. Biodivers. Conserv. 2006, 15, 855–878. [Google Scholar] [CrossRef]
  61. Yao, Q.X.; Xie, J.J.; Liu, J.X.; Tang, L. Multi-Index optimization for saponification experiment of selective adsorbent BLPAMA. Chin. J. Chem. Eng. 2014, 42, 40–44. [Google Scholar]
  62. Zalba, B.; Marın, J.M.; Cabeza, L.F.; Mehling, H. Review on thermal energy storage with phase change: Materials, heat transfer analysis and applications. Appl. Therm. Eng. 2003, 23, 251–283. [Google Scholar] [CrossRef]
  63. Chang, L.J. The Study of Urban Economic and Social Development Evaluation System. Ph.D. Thesis, Dalian University of Technology, Dalian, China, 2009. [Google Scholar]
  64. Ba, Y.; Guo, J.; Lu, S.; Xu, Q.; Hu, X. Assessing ecological health of open water region from Bostenhu Lake during last 20 years. China Environ. Sci. 2013, 33, 503–507. [Google Scholar]
  65. Leite, J.V.; Campos, J.C.; Gangkofner, U.; Vale, C.G.; Brito, J.C. Remote Sensing indicators and vertebrate biodiversity distribution in global drylands: An assessment with ESA diversity II products. J. Arid Environ. 2019, 166, 51–59. [Google Scholar] [CrossRef]
  66. Jiao, Q.; Sun, Q.; Zhang, B.; Huang, W.; Ye, H.; Zhang, Z.; Zhang, X.; Qian, B. A random forest algorithm for retrieving canopy chlorophyll content of wheat and soybean trained with PROSAIL simulations using adjusted average leaf angle. Remote Sens. 2021, 14, 98. [Google Scholar] [CrossRef]
  67. Ye, H.; Huang, W.; Huang, S.; Wu, B.; Dong, Y.; Cui, B. Remote estimation of nitrogen vertical distribution by consideration of maize geometry characteristics. Remote Sens. 2018, 10, 1995. [Google Scholar] [CrossRef]
  68. Xu, Y.; Zhang, C.; Jiang, R.; Wang, Z.; Zhu, M.; Shen, G. UAV-based hyperspectral images and monitoring of canopy tree diversity. Biodivers. Sci. 2021, 29, 647. [Google Scholar] [CrossRef]
  69. Dalla Corte, A.P.; Souza, D.V.; Rex, F.E.; Sanquetta, C.R.; Mohan, M.; Silva, C.A.; Zambrano, A.M.A.; Prata, G.; de Almeida, D.R.A.; Trautenmüller, J.W. Forest inventory with high-density UAV-Lidar: Machine learning approaches for predicting individual tree attributes. Comput. Electron. Agric. 2020, 179, 105815. [Google Scholar] [CrossRef]
  70. Liu, X.; Hao, Y.; Widagdo, F.R.A.; Xie, L.; Dong, L.; Li, F. Predicting height to crown base of Larix olgensis in Northeast China Using UAV-LiDAR data and nonlinear mixed effects models. Remote Sens. 2021, 13, 1834. [Google Scholar] [CrossRef]
  71. Pinton, D.; Canestrelli, A.; Wilkinson, B.; Ifju, P.; Ortega, A. Estimating ground elevation and vegetation characteristics in coastal salt marshes using UAV-based LiDAR and digital aerial photogrammetry. Remote Sens. 2021, 13, 4506. [Google Scholar] [CrossRef]
  72. Slavík, M.; Kuželka, K.; Modlinger, R.; Tomášková, I.; Surový, P. UAV laser scans allow detection of morphological changes in tree canopy. Remote Sens. 2020, 12, 3829. [Google Scholar] [CrossRef]
  73. Xu, W.; Deng, S.; Liang, D.; Cheng, X. A crown morphology-based approach to individual tree detection in subtropical mixed broadleaf urban forests using UAV LiDAR data. Remote Sens. Environ. 2021, 13, 1278. [Google Scholar] [CrossRef]
  74. Liu, L. Estimation of Tree Species Diversity in Subtropical Forests Based on Multi-Source Remote Sensing Data. Ph.D. Thesis, Chinese Academy of Forestry, Beijing, China, 2017. [Google Scholar]
  75. George-Chacon, S.P.; Dupuy, J.M.; Peduzzi, A.; Hernandez-Stefanoni, J.L. Combining high resolution satellite imagery and lidar data to model woody species diversity of tropical dry forests. Ecol. Indic. 2019, 101, 975–984. [Google Scholar] [CrossRef]
  76. Mohammadi, J.; Shataee, S.; Næsset, E. Modeling tree species diversity by combining ALS data and digital aerial photogrammetry. Sci. Remote Sens. 2020, 2, 100011. [Google Scholar] [CrossRef]
  77. Gould, W. Remote sensing of vegetation, plant species richness, and regional biodiversity hotspots. Ecol. Appl. 2000, 10, 1861–1870. [Google Scholar] [CrossRef]
  78. Torresani, M.; Rocchini, D.; Sonnenschein, R.; Zebisch, M.; Marcantonio, M.; Ricotta, C.; Tonon, G. Estimating tree species diversity from space in an alpine conifer forest: The Rao’s Q diversity index meets the spectral variation hypothesis. Ecol. Inform. 2019, 52, 26–34. [Google Scholar] [CrossRef]
  79. Vaglio Laurin, G.; Chan, J.C.-W.; Chen, Q.; Lindsell, J.A.; Coomes, D.A.; Guerriero, L.; Frate, F.D.; Miglietta, F.; Valentini, R. Biodiversity mapping in a tropical West African forest with airborne hyperspectral data. PLoS ONE 2014, 9, e97910. [Google Scholar] [CrossRef] [PubMed]
  80. Lucas, K.L.; Carter, G.A. The use of hyperspectral remote sensing to assess vascular plant species richness on Horn Island, Mississippi. Remote Sens. Environ. 2008, 112, 3908–3915. [Google Scholar] [CrossRef]
  81. Coops, N.C.; Tompaski, P.; Nijland, W.; Rickbeil, G.J.M.; Nielsen, S.E.; Bater, C.W.; Stadt, J.J. A forest structure habitat index based on airborne laser scanning data. Ecol. Indic. 2016, 67, 346–357. [Google Scholar] [CrossRef]
  82. Fahey, R.T.; Atkins, J.W.; Gough, C.M.; Hardiman, B.S.; Nave, L.E.; Tallant, J.M.; Nadehoffer, K.J.; Vogel, C.; Scheuermann, C.M.; Stuart-Haëntjens, E. Defining a spectrum of integrative trait-based vegetation canopy structural types. Ecol. Lett. 2019, 22, 2049–2059. [Google Scholar] [CrossRef]
  83. Simonson, W.D.; Allen, H.D.; Coomes, D.A. Use of an airborne lidar system to model plant species composition and diversity of Mediterranean oak forests. Conserv. Biol. 2012, 26, 840–850. [Google Scholar] [CrossRef] [PubMed]
  84. Asner, G.P.; Martin, R.E.; Carranza-Jiménez, L.; Sinca, F.; Tupayachi, R.; Anderson, C.B.; Martinez, P. Functional and biological diversity of foliar spectra in tree canopies throughout the Andes to Amazon region. New Phytol. 2014, 204, 127–139. [Google Scholar] [CrossRef] [PubMed]
Figure 1. The location of Beibu Gulf in China (a), the Pinglu Canal and its impact on mangrove areas (b), the location of Beibu Gulf in Guangxi Zhuang Autonomous Region (c) and distribution map of biodiversity research area (d).
Remotesensing 15 02622 g001
Figure 2. UAV laser point-cloud and hyperspectral data acquisition, generation and typical feature comparison.
Remotesensing 15 02622 g002
Figure 3. Mangrove hyperspectral color stereo (R:660 nm, G:550 nm and B:470 nm data synthesis).
Remotesensing 15 02622 g003
Figure 4. Hyperspectral curves of different mangrove communities, river rocks and mudflats.
Remotesensing 15 02622 g004
Figure 5. Technical process of mangrove biodiversity assessment based on UAV hyperspectral and LiDAR remote sensing (SD, ED and LD represent the combined indicators of species diversity, ecosystem diversity and landscape diversity, respectively; while βSD, βED and βLD represent the combined indicator weights of species diversity, ecosystem diversity and landscape diversity, respectively).
Remotesensing 15 02622 g005
Figure 6. Spatial distribution of different mangrove communities, rivers and mudflat ecosystem types (SA: Sonneratia apetala; AC: Aegiceras corniculatum; AI: Acanthus ilicifolius; KC: Kandelia candel; CM: Cyperus malaccensis; MF: mudflat).
Remotesensing 15 02622 g006
Figure 7. Normalized confusion matrix of different mangrove species.
Remotesensing 15 02622 g007
Figure 8. Mangrove canopy structure variables (height percentile (H95, (a)), leaf area index (LAI, (b)) and crown cover (CC, (c)), respectively) generated based on UAV laser point-cloud data.
Remotesensing 15 02622 g008
Figure 9. Synthetic map of mangrove canopy structure variables based on UAV laser point-cloud data. Notes: panels (a1,b1,c1,d1,e1,f1) are Acanthus ilicifolius (AI), Sonneratia apetala (SA), Aegiceras corniculatum (AC), Kandelia cande l(KC), Cyperus malaccensis (CM), and mudflat (MF), respectively.
Remotesensing 15 02622 g009
Figure 10. Mangrove level variables generated based on UAV hyperspectral data (three indicators: PRI [51], BGI2 (SR, [52]) and CI [10], respectively.
Remotesensing 15 02622 g010
Figure 11. Synthesis of mangrove horizontal variables generated based on UAV hyperspectral data. Notes: panels (a1,b1,c1,d1,e1,f1) are Acanthus ilicifolius (AI), Sonneratia apetala (SA), Aegiceras corniculatum (AC), Kandelia candel (KC), Cyperus malaccensis (CM), and mudflat (MF), respectively.
Remotesensing 15 02622 g011
Figure 12. Spatial distribution patterns of aboveground biomass of different mangrove tree species.
Remotesensing 15 02622 g012
Figure 13. Mangrove landscape diversity indices calculated based on the spatial distribution of mangrove species (Simpson diversity index (SIDI), landscape separation index (SPLIT) and landscape spread index (CONTAG), respectively).
Remotesensing 15 02622 g013
Figure 14. Synthetic map of mangrove landscape diversity index calculated based on the spatial distribution of mangrove species.
Remotesensing 15 02622 g014
Figure 15. Spatial distribution patterns of biodiversity index.
Remotesensing 15 02622 g015
Figure 16. Correlation coefficients between different index systems and mangrove biodiversity indices. Notes: in the above figure, 1–5, respectively represent the levels of the mangrove biodiversity index, which are relatively low (0–0.12), low (0.12–0.23), medium (0.23–0.31), high (0.31–0.38), and high (0.38–0.63). * Signifcant correlation at the 0.05 level (both sides); *** signifcant correlation at the 0.001 level (both sides).
Remotesensing 15 02622 g016
Figure 17. Spatial distribution characteristics of mangrove biodiversity indices at different elevations and offshore distances.
Remotesensing 15 02622 g017
Figure 18. Results of mangrove biodiversity zoning (biodiversity is divided into core, buffer and experimental zones based on biodiversity conservation functions).
Remotesensing 15 02622 g018
Table 1. Vegetation indices extracted based on hyperspectral data.
FeaturesVegetation IndexFormulaReferences
BGI2Blue Green Pigment Index 2 B a n d 200 B a n d 165 [28]
NDVINormalized Difference Vegetation Index B a n d 75 B n a d 121 B a n d 75 + B a n d 121 [43]
RDVIReformed Difference Vegetation Index B a n d 75 B a n d 121 B a n d 75 + B a n d 121 [40]
TCARITransformed Chlorophyll Absorption in Reflectance Index 3 * [ B a n d 110 B a n d 121 0.2 * B a n d 110 B a n d 165 * B a n d 110 B a n d 121 ] [41]
OSAVIOptimized Soil Adjusted Vegetation Index 1 + 0.16 * B a n d 75 B a n d 121 B a n d 75 + B a n d 121 + 0.16 [10]
MCARI1Modified Chlorophyll Absorption Ratio Index 1 1.2 * 2.5 * B a n d 75 B a n d 121 1.3 * b a n d 75 b a n d 165 [40]
MCARI2Modified Chlorophyll Absorption Ratio Index 2 1.5 * 2.5 * B a n d 75 B a n d 121 1.3 * B a n d 75 B a n d 165 2 * B a n d 75 + 1 2 * 6 * B a n d 75 5 * B a n d 121 0.5 [41]
PRIPhotochemical Reflectance Index B a n d 168 B a n d 172 B a n d 168 + B a n d 172 [10]
SRSimple Ratio Index B a n d 75 B a n d 121 [44]
CIClumping Index B a n d 55 B a n d 99 1 [45]
Table 2. Texture indices generated by the first variable of PCA principal components.
FeaturesTexture FeaturesFormulaReferences
TMTextural Mean u i = i P i , j [16]
HOMHomogeneity H o m = i j P i , j 1 + i j 2
DisDissimilarity D i s = i j P i , j
CorCorrelation C o r = i j i j P i , j u i u j σ i σ j
VarVariance σ i 2 = i 2 P i , j u i 2
EntEntropy E n t = i j P i , j , ln , P i , j
ConContrast C o n = i j P i j 2 P i , j
Table 3. Structural variables generated from laser point-cloud data.
FeaturesLidar IndexReferences
H95 i n h i g i i n g i [46]
CC N c N c + N g [47]
LAI 1 k ln I / I 0 [48]
CHMDSMDEM[49]
Table 4. Variables for laser point-cloud data generation.
Biodiversity LevelsVegetation IndexIndex
Species diversity (SD)LiDAR-based canopy structure variablesH95%
CC
LAI
Based on hyperspectral variablesPRI
BGI2
CI
Ecosystem diversity (ED)AGB
Landscape diversity (LD)SIDI
SPLIT
CONTAG
Table 5. Confusion matrix for mangrove classification.
TruthPredicted (Pixels)TotalUA (%)
SAAICMACKCMF
SA12100000121100
AI0235480011239559.49
CM06282002331190.68
AC0003427034997.99
KC80023262029389.42
MF00000247247100
Total1292413303652693821716
PA (%)93.8097.5185.4593.7097.4064.66
Kappa (%)83.97OA (%)86.77
Table 6. Statistical characteristics of biodiversity indicator system of different mangrove tree species.
LandscapeSDEDLD
Canopy Structure VariablesHyperspectral Variables
LAIH95CCPRIBGI2CIAGBSPLITCONTAGSIDI
AIrange0~2.4450.03519~8.50450~10.1798~0.22220.2688~1.17010.3318~2.61295.6~26.41~11.36360~72.62040~0.784
mean0.44141.64750.53380.03130.63321.053316.82.540626.67740.4787
SArange0~3.16510.1488~10.71320~10.1093~0.13690.2208~0.98730.7214~1.70~138.41~5.34190~64.72130~0.7648
mean1.23196.53290.86710.03130.39861.3701861.462222.69950.2059
ACrange0~3.46850.0413~9.66810~10.1541~0.24710.1111~1.09910.3127~2.015317.6~37.31~9.92060~71.60110~0.7968
mean0.94092.23810.82190.07760.38151.209628.51.860131.76590.3414
KCrange0~3.46850.0764~9.66810~10.1012~0.30770.1155~0.92210.5099~2.181412.4~30.91~10.96490~72.36560~0.7936
mean0.94482.4860.82980.08840.34071.311623.22.03925.09760.4007
CMrange0~2.4450.0370~6.82390~10.1607~0.20270.2731~1.21650.3015~2.092120~37.31~9.61540~69.19640~0.7968
mean0.34981.56340.44540.02870.64991.028928.652.56725.19320.4679
MFrange0~1.35260~2.51790~10.0960~0.14750.1813~1.19950.0933~1.669501~7.91140~69.56270~0.7904
mean0.018560.24850.0290.02730.27920.531601.41913.91310.1598
Table 7. Results of calculating the weights of mangrove species diversity, ecosystem diversity and landscape diversity indicators.
IndexSDEDLD
Canopy Structure VariablesHyperspectral Variables
LAIH95FVCPRISRCIAGBSPLITDIVISIONSIDI
Entropy weight0.11920.03600.06080.00850.17040.01670.03070.27490.14540.1374
Disclaimer/Publisher’s Note: The statements, opinions and data contained in all publications are solely those of the individual author(s) and contributor(s) and not of MDPI and/or the editor(s). MDPI and/or the editor(s) disclaim responsibility for any injury to people or property resulting from any ideas, methods, instructions or products referred to in the content.

