Article

Improved Spectral Detection of Nitrogen Deficiency and Yellow Mosaic Disease Stresses in Wheat Using a Soil Effect Removal Algorithm and Machine Learning

1
National Engineering Research Center for Wheat/State Key Laboratory of Wheat and Maize Crop Science, Henan Agricultural University, Zhengzhou 450046, China
2
CIMMYT-China Wheat and Maize Joint Research Center, State Key Laboratory of Wheat and Maize Crop Science, Henan Agricultural University, Zhengzhou 450046, China
3
College of Science, Henan Agriculture University, Zhengzhou 450046, China
*
Author to whom correspondence should be addressed.
These authors contributed equally to this work.
Remote Sens. 2023, 15(10), 2513; https://doi.org/10.3390/rs15102513
Submission received: 5 April 2023 / Revised: 5 May 2023 / Accepted: 8 May 2023 / Published: 10 May 2023

Abstract

:
Wheat yellow mosaic disease is a low-temperature and soil-borne disease. Crop infection by the yellow mosaic virus can lead to severe yield and economic losses. It is easily confused with nitrogen deficiency based on the plant’s morphological characteristics. Timely disease detection and crop management in the field require the precise identification of crop stress types. However, the detection of crop stress is often underappreciated. Wheat nitrogen deficiency and yellow mosaic disease were investigated in the field and wheat physiological and biochemical experiments were conducted to collect agronomic indicators, four years of reflectance spectral data at green-up and jointing were collected, and then studies for the detection of nitrogen deficiency and yellow mosaic disease stresses were carried out. The continuous removal (CR), first-order derivative (FD), standard normal variate (SNV), and spectral separation of soil and vegetation (3SV) preprocessing methods and 96 spectral indices were evaluated. The threshold method and variance inflation factor (TVIF) were used as feature selection methods combined with machine learning to develop a crop stress detection method. The results show that the most sensitive wavelengths are found in the 725–1000 nm region, while the sensitivity of the spectrum in the 400–725 nm region is lower. The PRI670,570, B, and RARSa spectral indices can detect nitrogen deficiency and yellow leaf disease stress, and the OA and Kappa values are 93.87% and 0.873, respectively, for PRI670,570, which is the best index. A 3SV-TVIF-SVM stress detection method was then proposed, using OA and Kappa values of 96.97% and 0.931, respectively, for field data validation. The results of the study can provide technical support and a theoretical basis for the accurate control of yellow mosaic disease and nitrogen fertilizer management in the field.

Graphical Abstract

1. Introduction

In recent years, the growth of crops has been severely affected by changes in the climate and the environment. Generally, crops are affected by biotic and abiotic stresses [1]. Examples include water and nitrogen deficiency, organisms (bacteria, viruses, and parasites), and natural disasters. Nitrogen is an indicator that is valued in agricultural production. Optimal crop yield from high-quality grain can only be obtained with sufficient provision and corresponding uptake of N [2]. Wheat (Triticum aestivum L.) is an important food source worldwide. Wheat yellow mosaic virus (WYMV) is a low-temperature, soil-borne disease transmitted through a Polymyxa graminis mediator [3] and occurs frequently in the Yellow, Huaihe, and middle and lower Yangtze River wheat regions of China, resulting in severe wheat yield losses [4]; yield losses have reached 70–80% during serious epidemics [5]. The green-up and jointing stages have a high incidence of WYMV infection. In these two stages, nitrogen-deficient wheat plants are highly similar to WYMV-infected wheat plants in terms of apparent morphology. The high similarity of these plants is detrimental to disease prevention and control and crop field management. Therefore, it is necessary to accurately detect crop stress types in numerous complex stress environments.
Crop stress detection methods are based on the observation of changes in apparent plant characteristics, such as color or texture features, while manual methods are inefficient in terms of reproducibility and unsuitable for large areas. Plant biomass, leaf structural damage, chlorophyll, and water content are bound to induce a response when plants are affected by nitrogen deficiency or disease stress [6]. These responses have different absorption and reflection characteristics in a reflectance spectral profile [7]. The reflectance and absorbance of light are strongly influenced by the physiological and chemical properties of plants, and there are differences in the reflectance spectral response induced under different stresses [8]. Generally, the photosynthesis and pigment content of crops under different stresses have specific differences, and reflectance spectra are helpful for revealing fine spectral signals in various stress scenarios. The spectral indices indicative of crop physiology and biochemistry studied previously are expected to be transferrable for the detection of stresses. This is especially true for disease detection indices, such as the photochemical reflectance index (PRI) and anthocyanin reflectance index (ARI) for yellow rust detection [9,10] and the green normalized difference vegetation index (GNDVI) for cotton leafhopper monitoring [11]. For crop stress, previous work has focused more on the detection of healthy and diseased plant samples [12,13], the detection of crop drought [14], and the detection of waterlogging stress in oilseed rape leaves [15]. Wheat yellow mosaic disease occurs mainly in the early stages of growth and causes incomplete tiller development, leading to the yellowing and dwarfing of affected plants [4]. Nitrogen deficiency, a typical abiotic stress, often accompanies wheat throughout its growth stages. The symptoms of nitrogen deficiency are extremely similar to those caused by infection with the yellow mosaic disease at green-up and jointing. To our knowledge, studies on remote sensing detection of wheat yellow mosaic disease and nitrogen deficiency stress have not been reported.
The responses of vegetation leaf chemicals, the canopy structure, and soil to canopy spectra are mixed [16]. Different stresses may exacerbate this effect, which would be detrimental to the remote sensing detection of different stresses. Due to the extreme similarity of nitrogen deficiency and yellow mosaic disease-infected plants in terms of appearance characteristics, the separability of spectra under both stresses may be poor. Generally, some stress scenarios lead to a decrease in spectral responsiveness, and previous work has enhanced spectral responsiveness using spectral preprocessing. For example, derivative analysis can mitigate the effects of natural illumination and background noise and thus enhance local spectral features [17], allowing for the detection of rice damaged by Cnaphalocrocis medinalis [18]. The continuous removal technique provides a quantitative method for characterizing concave and convex shape features around specific absorption locations along the spectrum [19]. This technique has been applied to disease detection in tomatoes and wheat [20,21]. For invariant shape spectral preprocessing methods, the standard normal variate (SNV) method can eliminate linear effects, and in the detection of drought stress in maize plants [22], the sensitivity of spectra was effectively enhanced with good results using this method. The spectral separation of soil and vegetation algorithm (3SV), which does not require a priori information from the soil, significantly enhances the spectral response and was applied to chlorophyll content monitoring in wheat and rice [23]. Therefore, these preprocessing algorithms need to be evaluated in detail.
In recent years, the combination of remote sensing parameters representing the physiological and biochemical characteristics of plants and machine learning algorithms has been successfully applied in plant disease detection [24,25]. Some studies have suggested that a smaller set of input features can significantly improve the efficiency of a model without severely sacrificing detection accuracy [26]. Generally, feature selection (FS) methods and machine learning (ML) are used in combination with each other, which can thus improve the targeting and efficiency of model inputs [27]. In particular, for the early detection of rice blast, 2–4 sensitive features can be used to identify infected samples using a combination of the threshold method and variance inflation factor (TVIF) for dimensionality reduction [13]. However, different study subjects will be affected differently by the crop, scenario, location, etc. Little attention has been paid to the detection of nitrogen deficiency and yellow mosaic disease stresses. Aspects of spectral response, preprocessing methods, feature selection, and machine learning in this context need further clarification.
The overall objective of this study was to develop a classification method using FS-ML for nitrogen-deficient and WYMV-infected samples and to examine both stresses at various stress levels. Therefore, the specific objectives were (1) to examine the variability of the physiological and biochemical parameters of the two stress samples and to evaluate previously constructed spectral indices; (2) to evaluate CR, FD, SNV, and 3SV spectral preprocessing methods to determine the spectral characteristics of various transformed spectra based on the spectral separability between the two stress samples; and (3) to evaluate the detection accuracy of each ML algorithm at different stress levels.

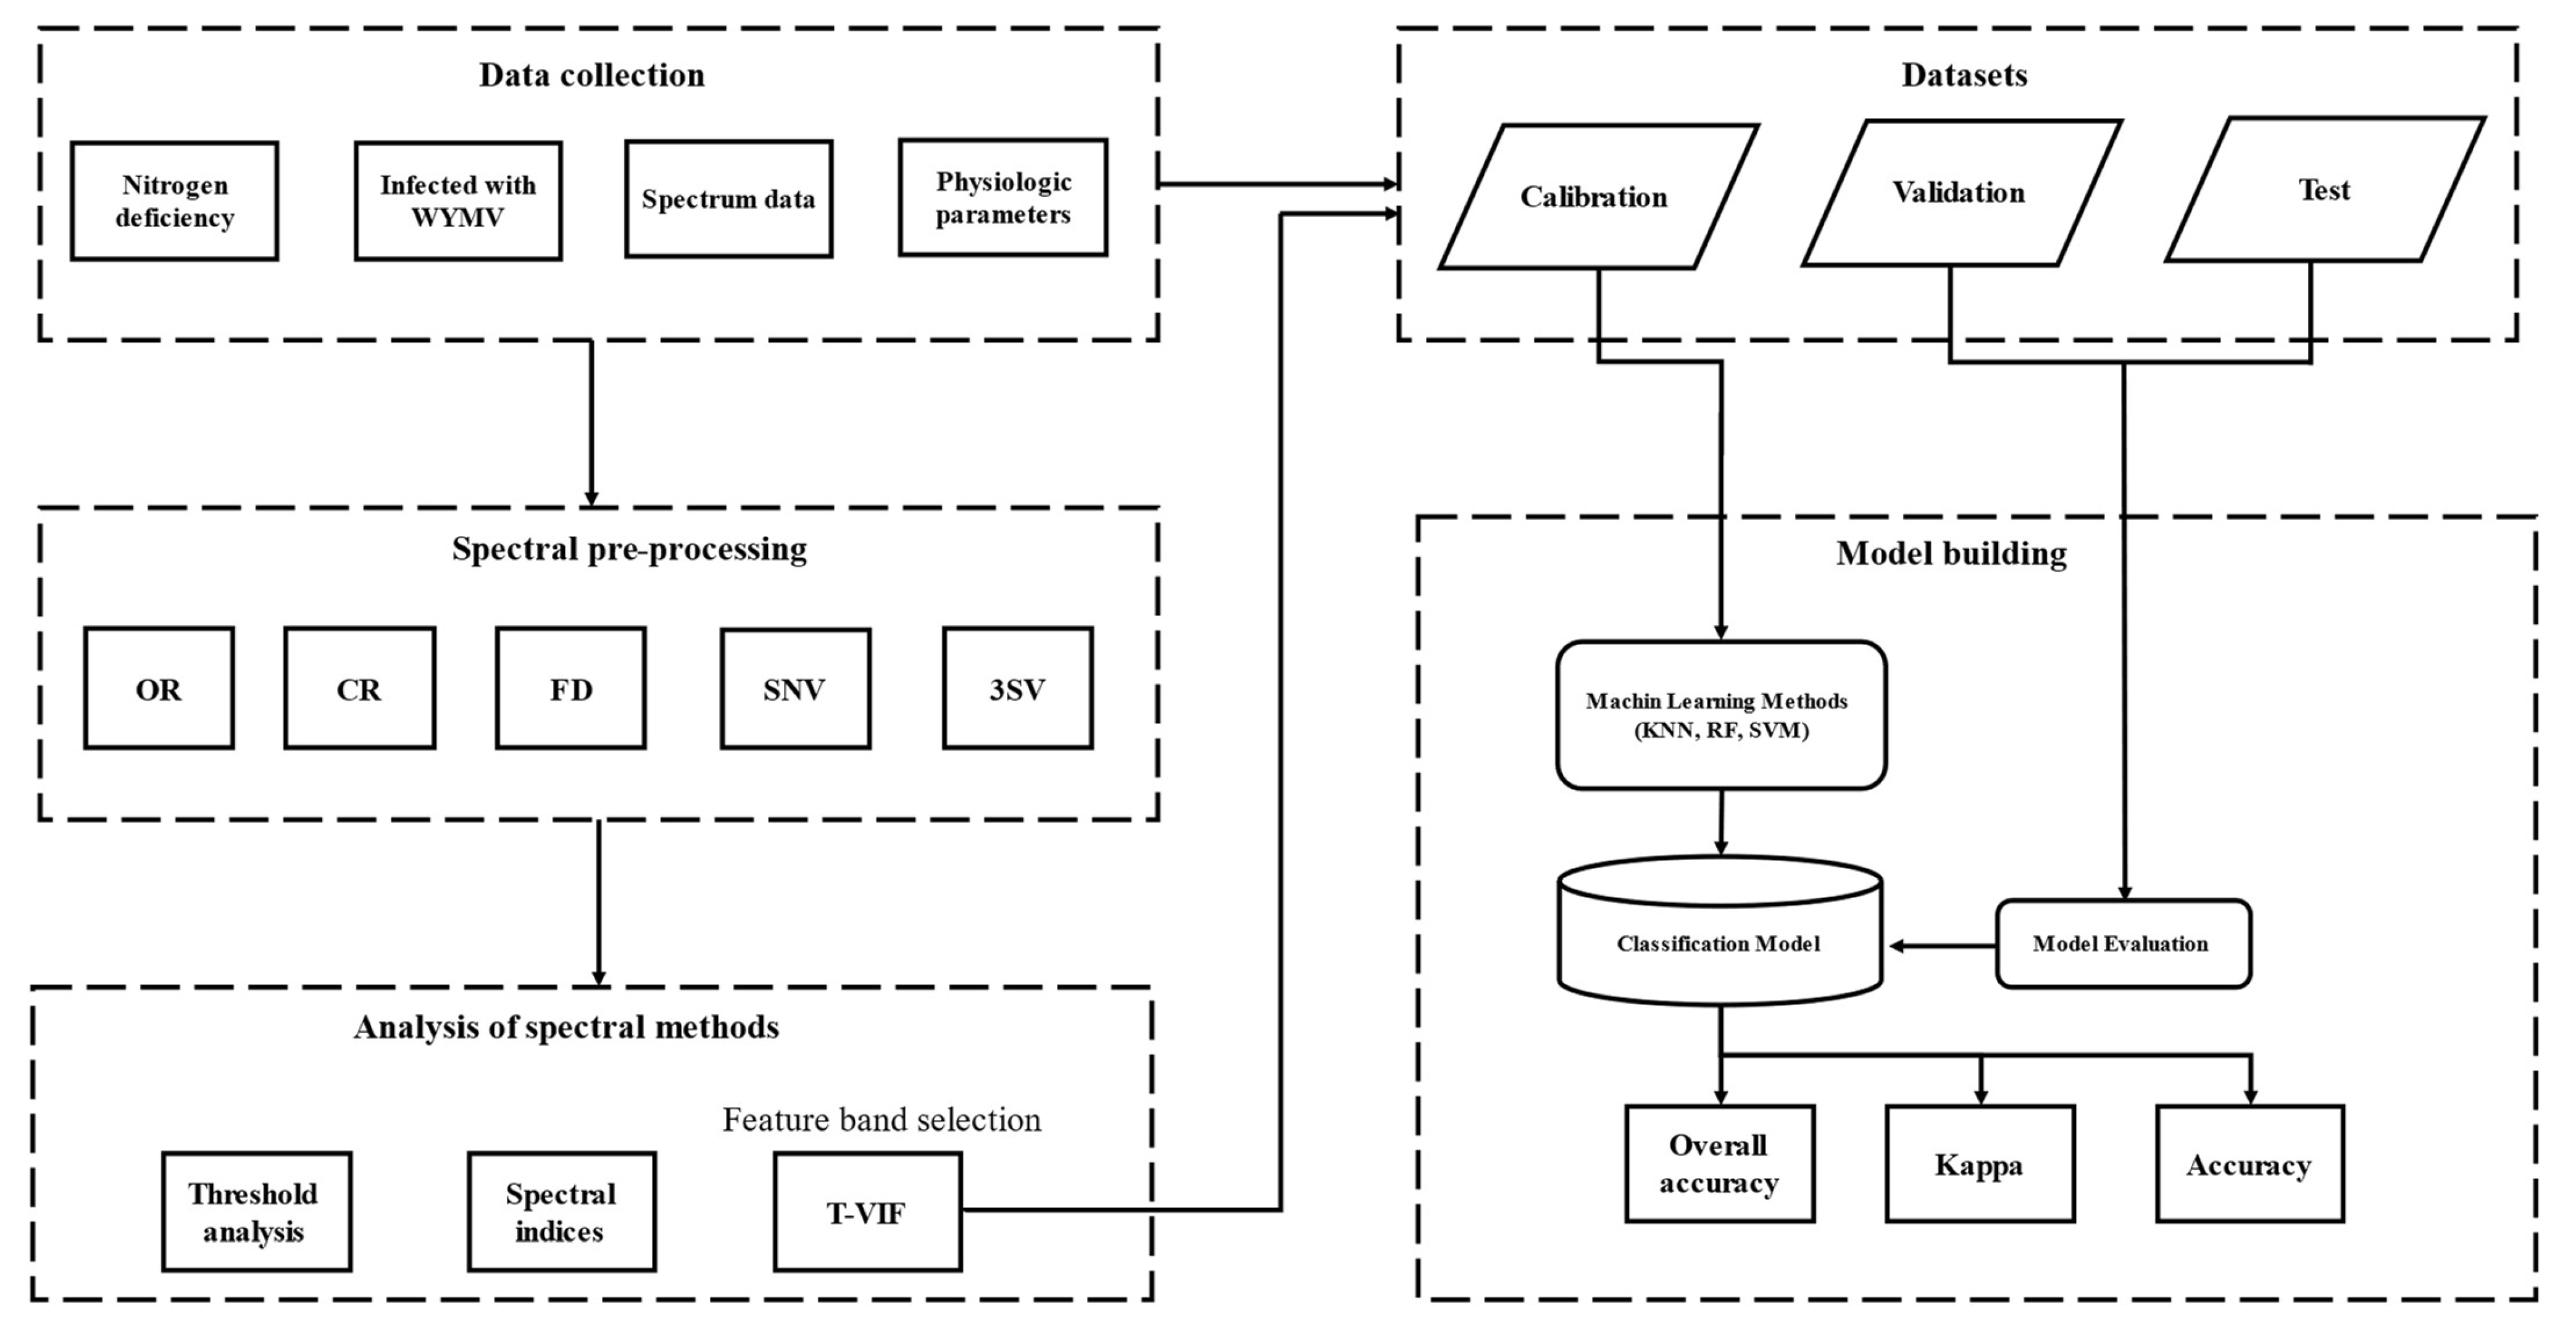
2. Materials and Methods

2.1. Experimental Design

The experiments were conducted over four years at four locations in Henan Province, China. As illustrated in Table 1, different years, eco-sites, cultivar stress types, and growth stages of hexaploid winter wheat were investigated.
Experiment 1 was conducted in 2018–2019 in the city of Zhoukou (33°33′N, 114°37′E) in Shangshui County at a site with lime concretion black soil and the cultivars were Yumai 49–198 and Zhoumai 27. Experiment 2 was conducted in 2018–2019 in the city of Xinxiang (35°6′N, 113°56′E) in Yuanyang County at a site with fluvo-aquic soil and the cultivars were Aikang 58 and Yumai 49–198. Experiment 3 was conducted in 2019–2020 in the city of Xinxiang (35°6′N, 113°56′E) in Yuanyang County at a site with fluvo-aquic soil and the cultivars were Yumai 49–198 and Zhoumai 27. A 50% nitrogen fertilizer (in the form of urea) was applied in the preplanting stage and again in the jointing period for the +N plots, and 150 kg ha−1 of P2O5 (in the form of monocalcium phosphate [Ca(H2PO4)2]) and 90 kg ha−1 of K2O (in the form of KCl) were applied prior to seeding for all treatments. The experimental plots were arranged in a split-plot design with three replicates, two cultivars, and three N rates (0, 90, and 180 N kg ha−1). Other field management measures were the same as those used in local conventional wheat production.
Experiment 4 was conducted in 2021–2022 in the city of Luohe (33°57′N, 114°02′E) at a site with lime concretion black soil and the cultivars were Xinong 979 and Zhoumai 22. Experiment 5 was conducted in 2021–2022 in the city of Zhumadian (33°38′N, 114°02′E) in Xiping County at a site with lime concretion black soil and the cultivars were Aikang 58 and Zhengmai 379. Experiment 6 was conducted in 2018–2019 in the city of Luohe (33°57′N, 114°02′E) at a site with lime concretion black soil and the cultivars were Bainong 207 and Zhoumai 27. Due to the early fall crop in these areas, the large number of rainy days, the lack of light, wheat combine harvesters across the region, high stubble harvesting, and crop rotation reversal difficulties, most varieties displayed poor resistance to WYMV, resulting in the rapid development and spread of WYMD. The experiments were conducted on family farms, and the fertilizer application rates, application periods, and field management measures were the same as those used in local conventional wheat production.

2.2. Data Collection

2.2.1. Measurements of Stress Levels

Experiments 1–3 were performed with planned N applications and a total of three stress levels (N0, N1, and N2). Field data from trials 4–6 were obtained using a randomized survey of farmers’ fields. Based on the incidence of the disease in the plots in the region in previous years, a survey of the actual incidence of the disease in the field was conducted using three disease levels: severe (level 3), moderate (level 2), and mild (level 1). The surveyed plots had a sporadic incidence of yellow mosaic disease during the overwintering period, and the disease developed in patches during the greening period with obvious symptom characteristics, so field sampling was conducted during the greening and nodulation periods of the wheat. The area of each survey site was 0.2 m2; the severity of wheat yellow mosaic disease grading criteria are shown in Table 2.

2.2.2. Measurements of Canopy Reflectance Spectra

From 10:00 to 14:00 (Beijing local time), when there was either no wind or low wind velocity, a FieldSpec handheld spectrometer (FieldSpec Handheld 2, Analytical Spectral Devices, Boulder, CO, USA) was used to measure the canopy spectrum. The field of view of the spectrometer was 25° in the 325–1075 nm band, the spectral sampling interval was 1.4 nm, and the spectral resolution was 3.0 nm. A 0.4 m × 0.4 m BaSO4 calibration plate was used to calculate black and baseline reflectance. The diameter of the ground field of view was 0.44 m. Ten spectra were recorded at each sampling point as the samples and the average value was taken as the spectral reflectance of the sampling area. Since there is some noise in the canopy reflection spectra collected by this device, we removed the spectral information before 400 nm and after 1000 nm.

2.2.3. Measurements of Stress Levels

After each measurement of the canopy spectral reflectance, wheat plants from an area of 0.20 m2 from each plot were cut at ground level and harvested for determination of the leaf weight and noted as the leaf biomass (LB, g/m2 soil). From each sample, all green leaves were separated from the stems according to the leaf position, and the first, second, third, and fourth upper fully expanded leaves were placed into different cooled sample bags at 4 °C and transported to the laboratory for subsequent analysis. The pigments in the sampled leaves were extracted in 80% acetone immediately after the samples were transported to the laboratory. The resulting extracts were immediately assayed spectrophotometrically. The specific absorption coefficients of Chla and Chlb followed the report by Lichtenthaler [28].
In addition, the leaves remaining after the LCC measurement were used for other indicator measurements. The weighing was performed before drying and referred to as the leaf fresh weight (LFW). The leaf dry weight (LDW) was determined by oven drying the sample at 105 °C for 30 min, followed by oven drying at 80 °C until a constant weight was achieved and weighed. A subsample was taken from the ground samples for subsequent analysis. The material was digested according to the method developed by Issac and Johnson [29], and the N content was measured using a Kjeldahl apparatus (Kjeltec 2300, FOSS AB, Hoeganaes, Sweden). The leaf water content (LWC) was also measured. The LWC of wheat was calculated with the following equation:
L W C ( % ) = L F W L D W L D W × 100 %
where LFW is the leaf fresh weight and LDW is the leaf dry weight.

2.3. Data Analysis Methods

Nitrogen deficiency and yellow mosaic disease stress detection methods were developed based on empirical data and tested using independent year data to enhance the model’s generality. The detection of stress types at two stages comprised four main modules: data collection, preprocessing, feature selection, and classification model (Figure 1).

2.3.1. Spectral Preprocessing Method

Reflectance spectra are often subject to a variety of interferences, so preprocessing has become a key step in spectral modeling. In this study, four preprocessing methods were evaluated: first-order derivative (FD), continuous removal (CR), standard normal variate (SNV), and the spectral separation of soil and vegetation algorithm (3SV). FD was used to calculate the reflectance change with an incremental wavelength of 1 nm. It can mitigate the effects of natural illumination and background noise and thus enhance local spectral features [17]. CR provides a quantitative method for characterizing the concave and convex shape features around specific absorption locations along the spectrum [19]. In SNV, each spectrum is centered and then scaled by the corresponding standard deviation. The multiplicative effects of scattering can be reduced after SNV transformation [30]. Lastly, 3SV was developed by taking advantage of the difference in the absorption coefficients of pigments at 477 and 677 nm between pure vegetation and canopy mixture spectra while considering the shape of soil and vegetation spectra. It was proposed without the need for any auxiliary data [23]. The 3SV algorithm is calculated as follows:
Step 1: Calculate the slope of the canopy reflectance between 477 and 677 nm using Equation (2), which is approximately equal to the slope of CRS.
Step 2: Estimate CRS at the reference wavelength of 477 nm using Equation (3). The coefficient c was set to 0.6.
Step 3: Simulate CRS, λ in the 470–800 nm range using Equation (4).
Step 4: Calculate CRV, λ using Equation (5).
slope ( C R S )   =   slope ( R C )   =   ( R C , 677 R C , 477 ) / ( 677 477 )
C R S , 477 = R C , 477 × slope ( C R S ) slope max c
C R S , λ   =   slope ( C R S ) × ( λ 477 ) + C R S , 477
C R V , λ   =   R C , λ C R S , λ
where RC,477 and RC,677 are the canopy reflectances at wavelengths of 477 nm and 677 nm, respectively. slopemax was set as 5.1 × 10⁻⁴ according to dry soil reflectance. CRV,λ and CRS,λ are the vegetation spectral reflectance and soil spectral reflectance, respectively.

2.3.2. Determination of the Set of Input Features

The separability of spectral features between nitrogen deficiency and yellow mosaic disease stress can be determined using the thresholding technique [12,13]. For a specific spectral feature, the mean values of the nitrogen-deficient (T1) and infected (T2) samples were separately calculated and the distance between T1 and T2 was divided equally into 100 portions. Finally, the optimal threshold was defined as the one with the highest classification accuracy among the 100 values. A separability assessment was applied to all of the spectral features individually.
In this study, we counted the spectral indices proposed by previous authors and referred to the light indices summarized by Croft et al. [31] and Tian et al. [13] regarding pigment, nitrogen, and crop stresses, which were evaluated for their migratability (Table 3; see Supplementary Materials for all spectral indices), resulting in our list of the top 10 best spectral indices. Two feature selection methods were evaluated. The feature selection method combines a threshold (T) method with a variance inflation factor (VIF) [13]. Specifically, we performed a threshold analysis of the reflection spectra (400–1000 nm). Only the most sensitive features, here meaning those with an overall accuracy in the top 5%, were retained and selected using a variance inflation factor (VIF). The main filtering process was performed to eliminate one variable at a time with the maximum VIF (>10) and iterated to ensure that the VIF of all the variables in the feature set was less than 10. The VIF was calculated with the following equation:
V I F i = 1 1 R i 2
where R i 2 represents the coefficient of determination between the ith variable xi in the independent variable matrix and the variables aside from it. This is the regression result of ordinary least squares (OLS) using xi as the dependent variable and the remaining variables as independent variables, that is, the correlation between the variable xi and the other variables.

2.3.3. Machine Learning

The detection of nitrogen deficiency and yellow mosaic disease stresses was performed using three nonparametric machine learning algorithms: k-nearest neighbor (KNN), random forest (RF), and support vector machine (SVM).
KNN is a nonparametric classification method that classifies unlabeled samples by analyzing their k-nearest neighbors with class labels. The classification performance of KNN depends significantly on prior knowledge and a metric for calculating the distances between k samples [40]. RF uses the bootstrap resampling method to extract multiple samples from the original sample and models each bootstrap sample into a decision tree. It then combines them into multiple decision trees for prediction and uses the majority voting method to determine the final classification result of the joint prediction model. The advantage of this method is that the training speed is relatively fast [41]. Additionally, the randomness of sampling and feature selection means that RF does not easily fall victim to overfitting [42]; therefore, it is widely used in remote sensing monitoring. The basic idea behind SVM is to create a regression hyperplane using training samples and approximate the samples to the hyperplane to minimize the total deviation of the sample points to the plane [43]. The kernel functions of SVM mainly include linear sum functions, radial basis sum functions (RBFs), and polynomial kernel functions. In particular, RBF can handle complex nonlinear problems between the independent and dependent variables. For this study, we used the Minkowski distance between three samples to determine the attribution of samples to be classified. We used SVM with an RBF kernel to evaluate the best-performing hyperparameters using a cross-validated grid search [44]. The tree number setting (100–2000) is dynamic in RF modeling, which means that it is corrected for each cross-validation iteration.

2.3.4. Evaluation of Accuracy

In this study, we performed 100 replicate four-fold cross-validations (CVs) to assess the stability and accuracy of all models in stress detection. This technique was chosen for its advantages in outlier detection and its unbiased estimation [45]. There were 310 sample data points (Dataset 1) used to build and validate the model in this study, while data from independent years (Dataset 2) were used to test the model (Table 4). These samples were randomly divided into four datasets containing roughly equal numbers of samples. The model was then repeatedly trained using all but the first dataset, and the model performance was tested using the retained data. After four iterations, the respective averages of the overall accuracy (OA), Kappa coefficient (Kappa), and accuracy for different stress levels (Accuracy) were used to evaluate the model performance. OA and Kappa are combined indicators and Accuracy is assessed from each stress level. The modeling analyses were implemented in MATLAB (The MathWorks Inc., Natick, MA, USA).
OA = T P + T N T P + T N + F P + F N
K a p p a = OA ( T P + F P ) ( T P + F N ) + ( T N + F N ) ( F P + T N ) ( T P + T N + F P + F N ) ( T P + T N + F P + F N ) 1 ( T P + F P ) ( T P + F N ) + ( T N + F N ) ( F P + T N ) ( T P + T N + F P + F N ) ( T P + T N + F P + F N )
A c c u r a c y = T i n i
In the above formulas, TP is a correctly identified healthy sample, FP is a healthy sample identified as infected, TN is a correctly identified infected sample, FN is an infected sample identified as healthy, Ti is a correctly identified sample with disease level I, and ni is all samples with disease level i.

3. Results

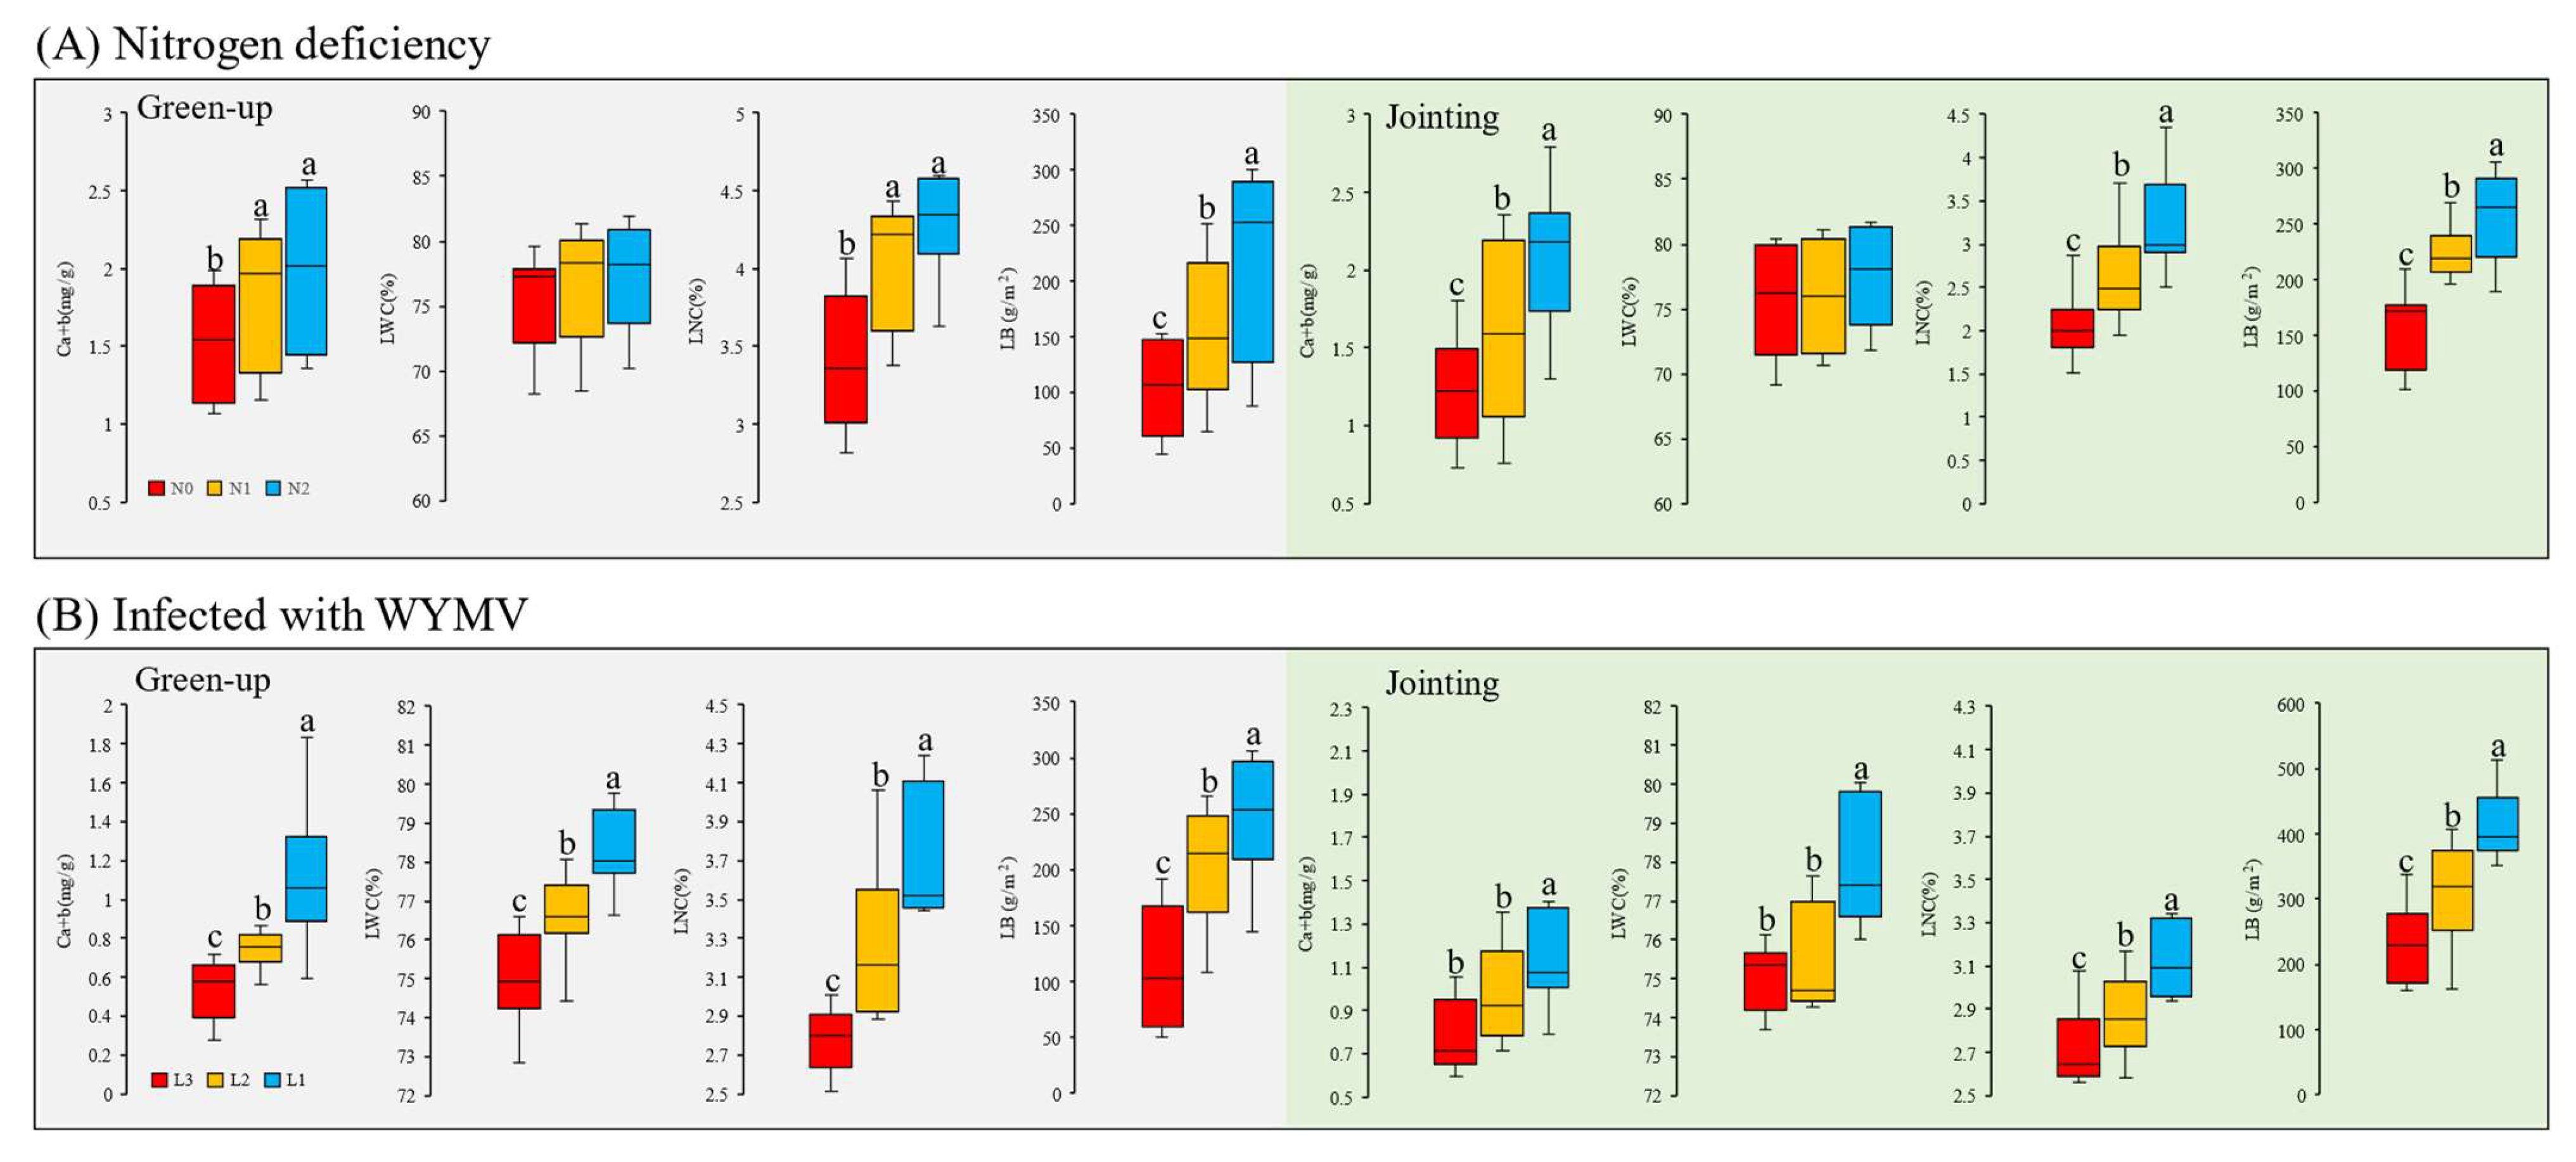
3.1. Leaf Physiological Parameter Variation for Various Stress Levels

Figure 2 shows the changes and differences in leaf physiological parameters for various stress levels in the two stages. Nitrogen deficiency and yellow mosaic disease stress had the same trends for various physiological parameters. With increasing nitrogen application, the chlorophyll content, leaf nitrogen content, and leaf biomass increased, and there were significant differences in both stages under different nitrogen application rates (Figure 2A). However, leaf water content had a tendency to increase but did not differ significantly at different nitrogen application rates. For samples infected with WYMV, the trend of each physiological parameter was from low to high in both periods from level 3 to level 1, and there were significant differences in samples with different levels of infection (Figure 2B). In general, for both stresses, the differences in the parameters were not significant, except for the leaf water content.

3.2. Stress-Sensitive Spectral Feature Regions at Various Transformed Spectra

Figure 3 shows the shape and stress separability of the spectra using various preprocessing methods. CR and FD clearly changed the shape of the spectra (Figure 3B,C), while SNV and 3SV did not change the shape of the spectra (Figure 3D,E). For the original reflectance (OR), 725 nm was used as the dividing line, and the separability of 725–1000 nm for stress was higher than that of 400–724 nm, with the highest point of 741 nm having an OA of 0.911 (Figure 3F). The separability values of CR at 403–479 nm and 498–727 nm were higher than those of OR, and the others were not as good as those of OA; however, the highest precision band at 689 nm had an OA of only 0.813, which was much lower than that of OR741 (Figure 3G). FD had a higher OA than OR in more wavelengths below the 400–731 nm region, and 721 nm was the highest point, with an OA of 0.924 (Figure 3H). However, 732–1000 nm had lower stress separability than OA. For SNV, as compared to OR, the OA was elevated at 400–537 nm and 541–719 nm and decreased at other wavelengths. The highest point for SNV was 0.921 at 688 nm, which was higher than that of the OA at OR741 (Figure 3I). For 3SV, OA was elevated at all wavelengths except for a small number of wavelengths within 612–615 nm and 750–1000 nm, and the highest point for OA at 732 nm was 0.931 (Figure 3J). Overall, CR, FD, and SNV enhanced the stress separability in the visible region wavelengths (400–780 nm) and they did not enhance the stress separability in the NIR region wavelengths (780–1000 nm). Moreover, 3SV enhanced the spectral separability at full wavelengths. In terms of spectral separability, 3SV was the best spectral preprocessing method. Therefore, the overall ranking of the various transform spectra was 3SV > FD > SNV > OR > CR.

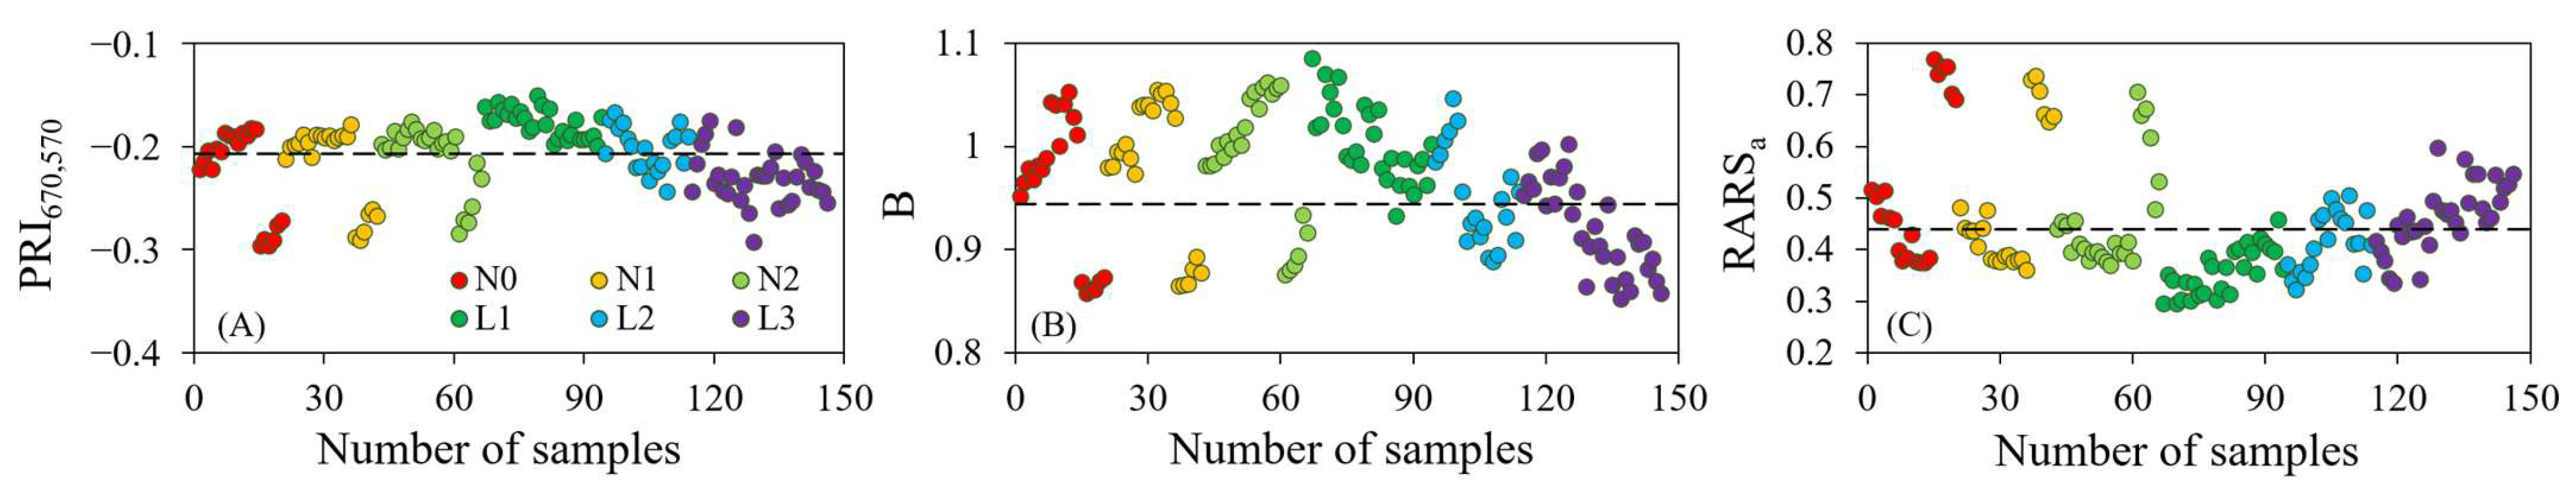
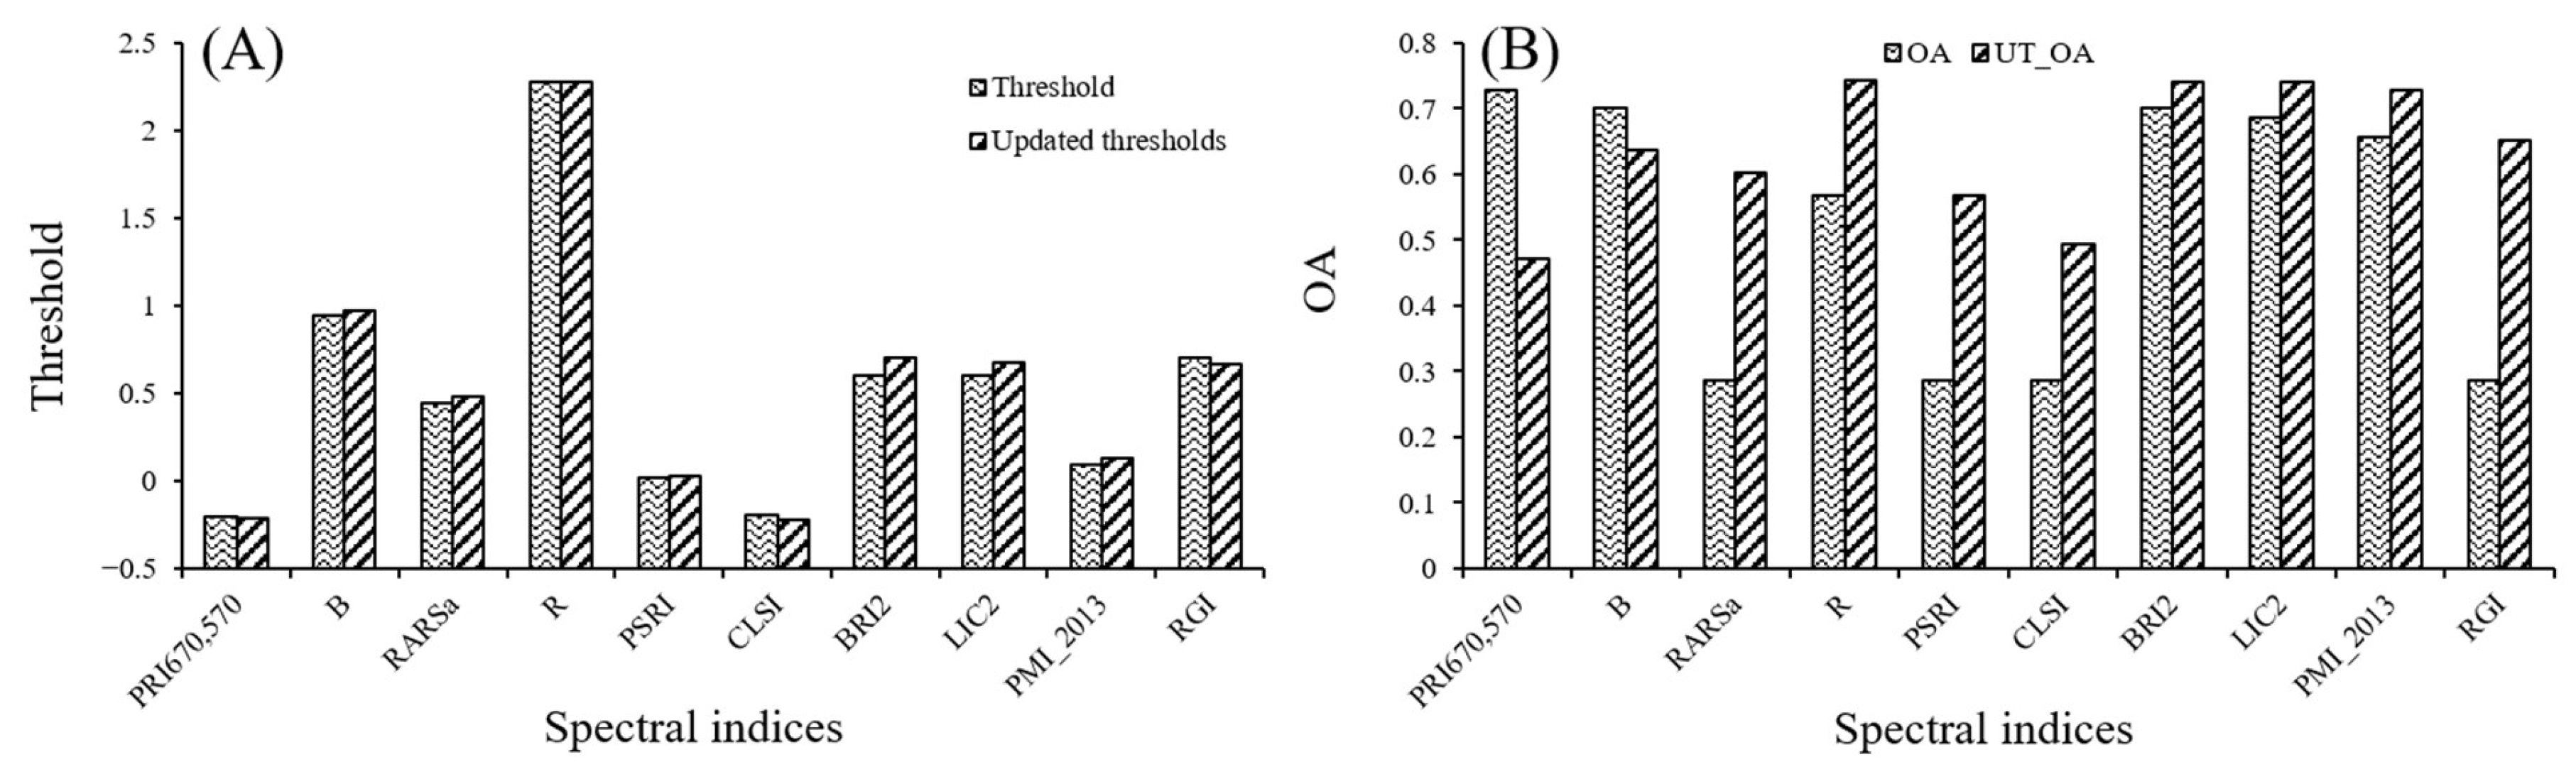
3.3. Evaluation of Spectral Index Migration Capability for the Detection of Stress

Table 5 shows the accuracies of the 10 spectral indices for the detection of nitrogen deficiency and yellow mosaic disease samples. The separability of the spectral indices was assessed using the threshold method. These 10 spectral indices performed best with Dataset 1. Among them, PRI670,570 was the best detected, with OA and Kappa values of 93.87% and 0.873, respectively. For nitrogen-deficient samples, CLSI_2013 and PMI_2013 were more suitable for N0 and N1. Each spectral index was poor at N2 detection, with the highest accuracy of only 80%, and PMI_2013 was most suitable for nitrogen-deficient samples. For samples infected with WYMV, PSRI, BRI2, and RGI were the best detected. It is clear that due to the uniqueness of the spectral indices, they may be good for detection under a certain stress level, though it is difficult to find a spectral index that applies to all stress levels.
Figure 4 shows a plot of the distribution points of the three highest spectral indices of OA. The black dashed line in the figure shows the optimal threshold, which is based on Dataset 1, for finding the optimal value. In addition, we tested these ten spectral indices using Dataset 2 (Figure 5). We found that the performance of all ten spectral indices decreased across years of data, with the OA of PRI670,570 decreasing by 22.38%. When the threshold was sought again using Dataset 2, the threshold value of the spectral index changed (Figure 5A). There were 8 spectral indices with elevated OA (Figure 5B). The PRI670,570 and B thresholds changed and OA decreased, indicating that the best threshold based on Dataset 1 is reliable and PRI670,570 can be considered for application in different years.

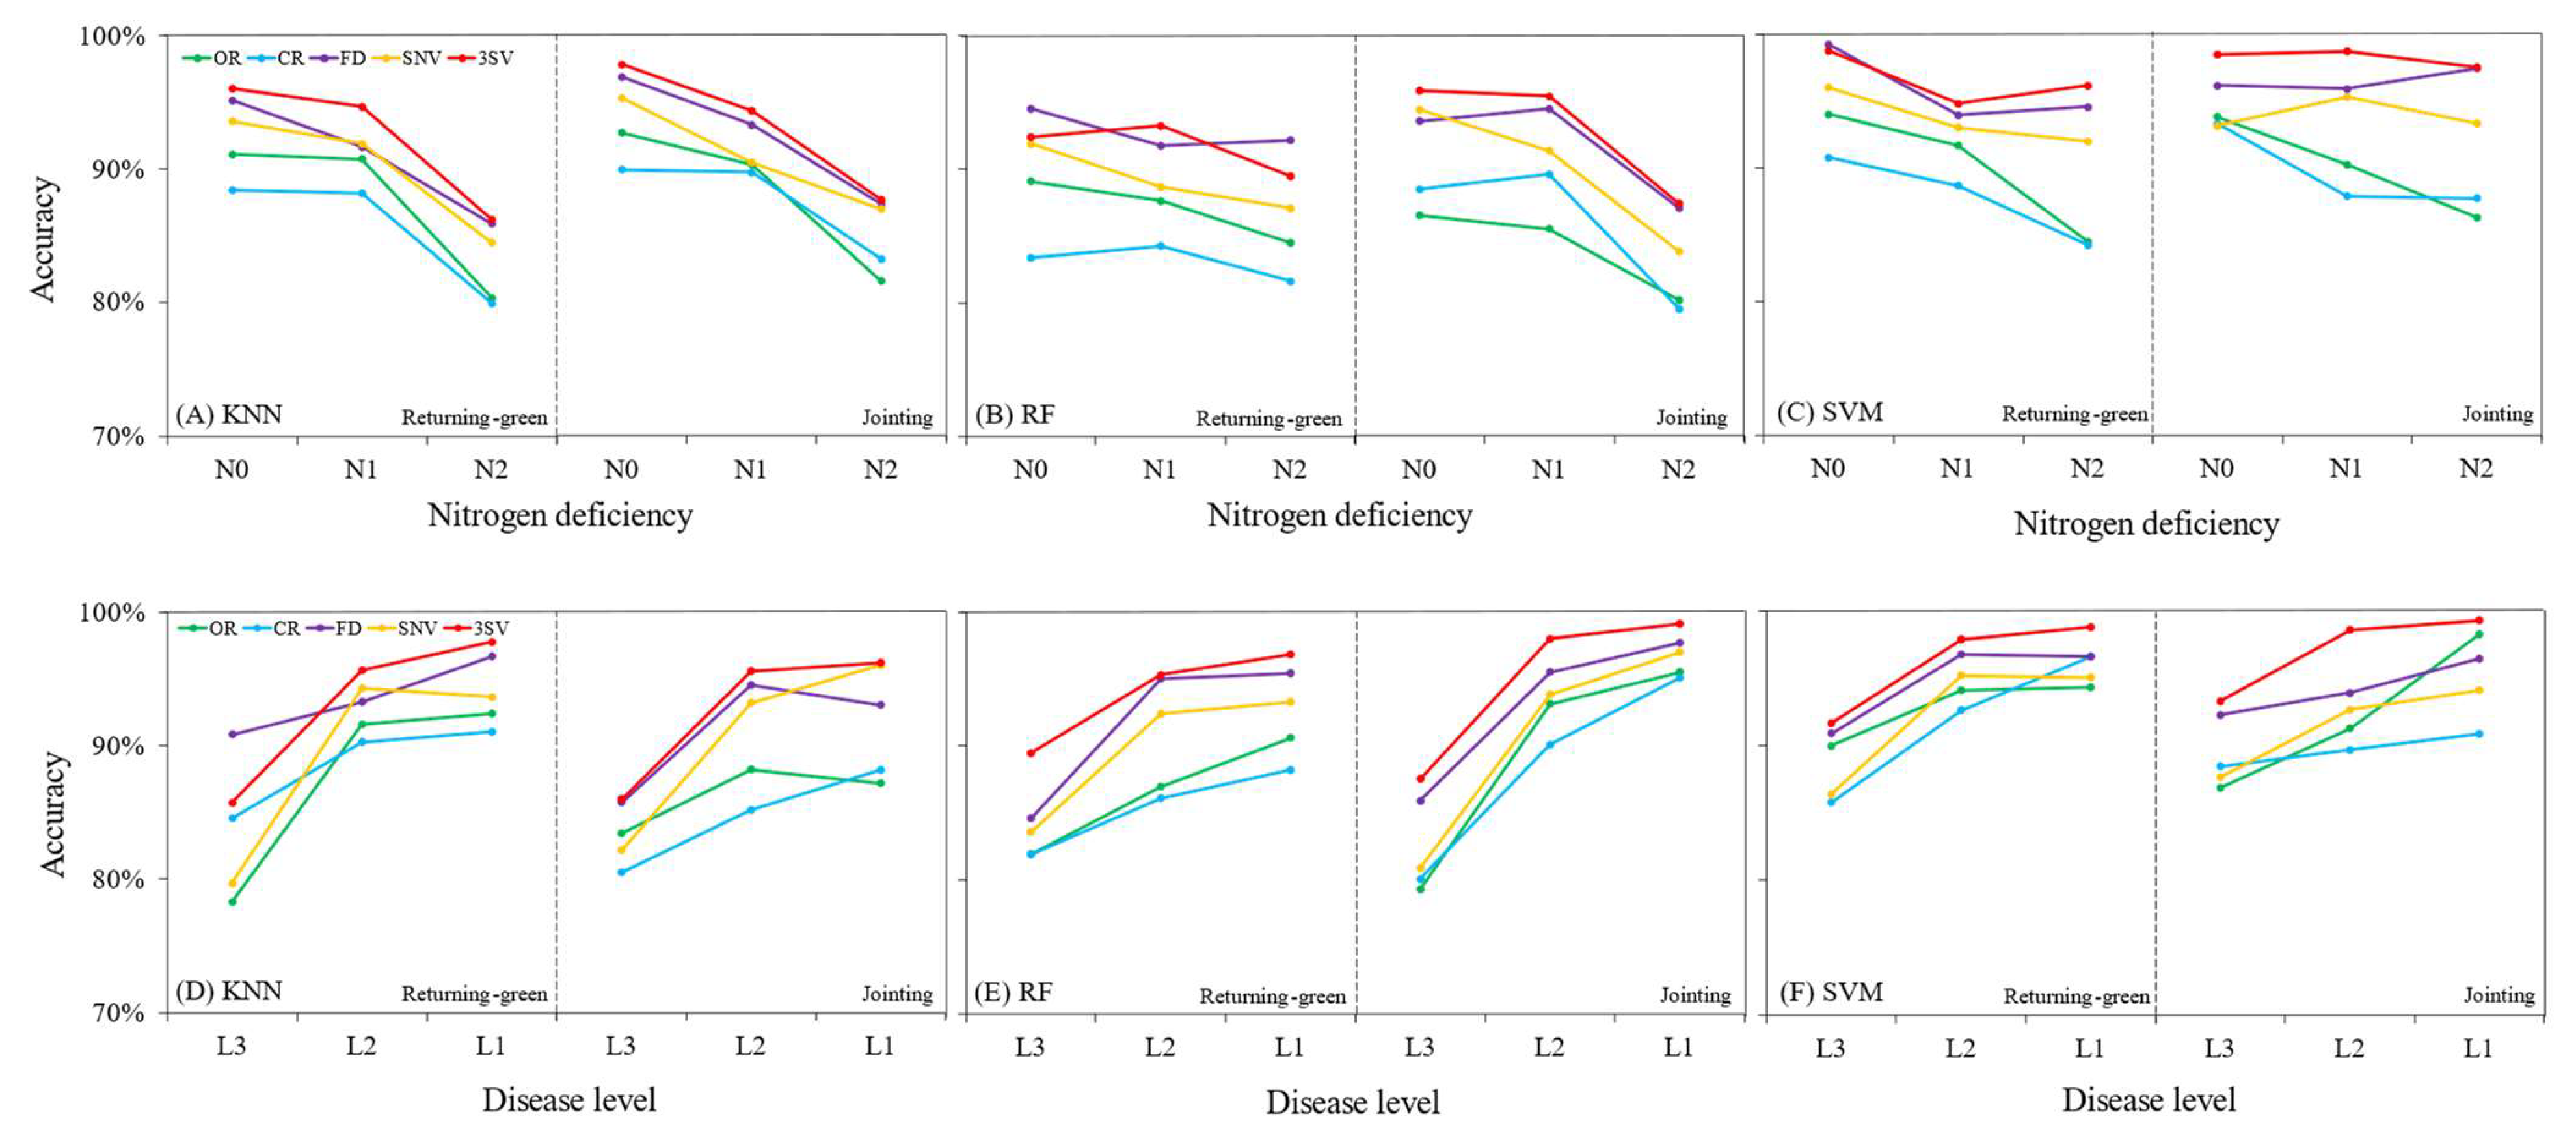
3.4. Detection of Stress Using ML Models

Table 6 shows the accuracies of machine learning models with different input features for nitrogen deficiency and yellow mosaic disease stress detection. There were significant differences between the preprocessing methods. Compared to that of OR-ML, 3SV-ML showed the best improvement, followed by FD-ML and SNV-ML, while CR-ML showed a significant decrease in performance. There were also differences between the machine learning methods, with SVM performing best with all input features, followed by RF and KNN. The combination of preprocessing methods and machine learning resulted in the highest validation set accuracy for 3SV-SVM, with OA and Kappa values of 96.97% and 0.931, respectively. Compared to those of OR-SVM, the improvements were 3.36% and 8.89, respectively. This was followed by FD-SVM, which obtained validation set OA and Kappa values of 96.20% and 0.925, respectively, which were 2.54% and 8.19% higher than those of OR-SVM. In addition, to further evaluate the potential performance of the machine learning model, the performance of correct detection at each stress level in both stages was evaluated (Figure 6). For the nitrogen-deficient samples, the detection effect of various machine learning models gradually decreased with increasing nitrogen application during the green-up and jointing stages. The detection accuracy of the jointing stage was better than that of the green-up stage (Figure 6A–C). For samples infected with WYMV, the performance of the machine learning model decreased as the disease level increased, and the variability in the detection effect at the green-up and jointing stages was not significant (Figure 6D–F). Overall, samples with N2 application were easily judged to be infected with WYMV, and samples with a disease level of 3 were easily judged as nitrogen deficient.
To further validate the applicability and stability of the model, Dataset 2 was used to test the model (Figure 7). Although their detection accuracy was reduced, the preprocessing methods and machine learning performances had similar trends as those using the validation set, with the 3SV-SVM model performing best. The effectiveness of the FD, SNV, and 3SV preprocessing methods was once again demonstrated, and the accuracy was improved compared to that of OR detection in all cases. For nitrogen deficiency samples, the accuracies for stress level detection were ranked as N0, N1, and N2. For samples infected with WYMV, the detection accuracy for L1 was higher than that for L2 and was most significant in KNN. In addition, there was no consistent pattern in terms of the detection accuracy trends for the L1 and L2 stress samples (RF and SVM), and the detection performance for the L3 samples, those with the highest disease severity, performed the worst in various machine learning models. Overall, machine learning models can be considered for field applications.

4. Discussion

4.1. Similarity and Spectral Response Characteristics of Nitrogen Deficiency and Yellow Mosaic Disease Stresses

In recent years, climate change has caused diverse growing environments, which means that crop growth is affected by unfavorable environmental conditions [46]. For abiotic stresses, such as common water and nutrient deficits, the effects on crop yield may be more severe than those of diseases in some cases [47]. However, crop stress has different characteristics for different regions and larger environments. In the Yellow and Huaihe River wheat areas of China, straw return, combined harvester cross-zone operations, and higher crop residues impact crop stress. The wheat yellow mosaic disease occurs rampantly during the green-up and jointing stages, wherein it mainly infects the tip or middle of the heart of the leaf, resulting in yellowing and dwarfing of the plant [48]. Additionally, inappropriate N application methods and N application amounts result in soil hardening and environmental pollution [49,50]. During the green-up and jointing stages, nitrogen deficiency resulted in short, poorly divided wheat plants and yellow–green plants, which had a high degree of similarity in terms of appearance to that of yellow mosaic-infected plants. The results of this study showed a high degree of similarity in the differences and trends of the physiological and biochemical parameters of nitrogen deficiency and yellow mosaic leaf disease stresses. Sensitive regions for original reflectance were located in the red edge and near-infrared regions (725–1000 nm), with poor sensitivity in the visible region (400–725 nm). This is related to the high consistency of the two stresses in terms of the changes in chlorophyll content and leaf nitrogen content. Our results also showed that a decrease in nitrogen did not significantly change the leaf water content, while with increasing aggravation of yellow mosaic disease, the leaf water content changed significantly, indicating a greater difference between the two stresses.
From a review of previous work, spectral preprocessing methods can be divided into two types: scattering correction and spectral derivative [51], each of which can significantly improve the sensitivity of the spectra. Some studies have suggested that the shape of a spectrum should be considered during preprocessing [52,53]. Therefore, we divided the spectral preprocessing methods into two types: invariant-shape and shape-changing spectral preprocessing methods. Although preprocessing methods have been proven to be effective in previous studies, the crop type, the target, and the stage of remote sensing monitoring should be considered before application. Our results showed that the results from 3SV preprocessing were in strongest agreement with those from the original spectrally sensitive region. CR, FD, and SNV only enhance the local features in the visible region (400–780 nm). Additionally, stage is an issue that needs to be given more attention in remote sensing detection. During the green-up and jointing stages, the soil is widely exposed, and the structure of the upper part of the canopy is not yet fully formed and is unstable. Although the scattering effect has some influence, it is still weak compared to that of the soil. It is clear that 3SV and FD are effective in removing the adverse effects of soil and are better than SNV and CR in this application. These conclusions are in accordance with the characteristics of the wheat growth stage.

4.2. Application of Spectral Indices for Stress Detection

Spectral indices from previous studies were investigated and evaluated. The better performing spectral indices in the detection of nitrogen deficiency and yellow leaf disease stress consisted mainly of blue–green–red wavelengths of visible light and those that referred to color information, followed by plant stress. Previous results on the detection of multiple stresses in conifer woodlands were based on red edge information in broad bands [54]. Similar results were confirmed in this study, where most of the better-performing spectral indices contained red edge information. The variation in spectral reflectance in the red edge region is mainly due to the strong absorption of chlorophyll in the red band and the effect of canopy structure [55,56]. Therefore, spectral indices related to red edge information have greater potential for the detection of nitrogen deficiency and yellow mosaic disease stresses.
In addition, the optimal separability thresholds for spectral indices are derived from statistical analysis and are usually less resistant to noise. This also means that optimal separability thresholds require sufficiently large datasets and have poor accuracy when tested with independent year data. However, the separability thresholds of PRI670,570 and B are the best, and the stability of the stress detection accuracy was better with Dataset 2. The environment can influence the separability threshold of the spectral index. For example, planting density, cultivars, and phenology will affect the detection performance of the spectral index. As a result, one can see differences in the optimal thresholds in different years (Figure 5). The main reason for this phenomenon is that other drivers (year, climate, cultivars, planting density, stages, etc.) can lead to different ranges of variation in reflectance. Certainly, spectral indices have some advantages in terms of their simplicity, fast computation, and good mapping [57]. PRI670,570 can be considered as a technical tool for preliminary stress determination, but further validation is needed for its application at the satellite scale.

4.3. Advantages of Feature Selection and Machine Learning for Stress Detection

Generally, feature selection methods have become the first step before machine learning modeling and can greatly simplify the model and enhance its efficiency. Some feature selection methods have been studied, and, from a technical point of view, it is feasible to carry out feature selection bands using some algorithms [58,59]. However, these algorithms have unclear input features and more variables, which is not conducive to the interpretability and simple application of the model. It is necessary to simplify the steps of the feature selection method and reduce its complexity. TVIF is a good feature selection method with small linearity of extracted feature variables compared to that of other feature selection methods, and its biggest advantages are its simplicity and need for fewer input variables.
ML-based stress detection is significantly better than that of spectral indices. The power of the SVM model lies in binary classification and several previous studies have demonstrated its superior performance in classification [60,61,62]. In this study, SVM outperformed the other machine learning models using both Dataset 1 and Dataset 2. The 3SV-TVIF-SVM model is more simplistic and the 3SV preprocessing method can mitigate the influence of soil on the spectrum. The effective combination of TVIF and SVM can solve the problem of difficultly in selecting feature bands and machine learning models, which greatly simplifies the steps for stress detection model construction. Compared with previous studies, the model in this paper is accurate and efficient. This is mainly reflected in three ways: advanced preprocessing algorithms (3SV), a small number of and specific features, and advanced machine learning algorithms. Previous models struggle with to match these in stress detection. There is currently no systematic or process-oriented solution for crop stress detection; our solution can provide useful references and new insights for other crop and stress detection models. However, the transferability of this method needs to be further validated for other crops and stresses.

4.4. Limitations and Potential Applications

Recently, some researchers have suggested that phenology will affect the accuracy of remote sensing detection [63,64]. However, the main phenological stages were those of green-up and jointing in this study, and when considering the complete phenological stage, they were relatively short. Therefore, it is difficult to apply the spectral response pattern of this study to the complete phenological stages of other crops. This is due to the fact that a shorter phenological stage results in a smaller range of reflectance changes. In contrast, a complete phenological stage has a wide range of reflectance changes, which will hinder the transferability of the method. For spectral preprocessing, this paper’s scheme will apply to similar work influenced by the soil background. Many preprocessing methods were not evaluated herein, such as the continuous wavelet transform (CWT), which was used to detect diseases [65]. The wavelet coefficients mainly enhance the responsiveness of wavelengths in the red edge region [66]; the soil background and mixed pixel causes its performance to be weaker. It is possible to make two or more preprocessing methods work in combination with each other, such as the combination of 3SV and CWT. However, their order of use is also significant: 3SV as an invariant-shape method should come first and CWT second because the change of spectral shape may lead to loss of spectral features [53]. The effective combination of preprocessing methods should be valued. In addition, the ambiguity of the characteristic bands is very important [13], affecting the transferability of UAV and satellite platform applications. The results of this study will decrease in accuracy when applied at large scales. The main reasons for this are the ambiguity of the characteristic bands and mixed pixels. Therefore, carrying out advanced mixed pixel decomposition methods and ambiguity evaluation of feature bands is essential for large-scale applications.
Hybrid methods concerning radiative transfer models combined with machine learning are also abundant [67,68], which is an excellent solution to the low efficiency and high cost of field sampling surveys. Therefore, future development of physical methods capable of simulating stress scenarios can enhance the rationality and generality of these methods.

5. Conclusions

In this study, changes and differences in physiological parameters and spectral responses to nitrogen deficiency and yellow mosaic disease stress in wheat were analyzed. The wavelength range of 725–1000 nm was the most sensitive region for the detection of both stresses, while 400–725 nm was slightly less sensitive. Additionally, we enhanced the sensitivity of the spectra using four preprocessing methods (CR, FD, SNV, and 3SV); 3SV effectively removed the adverse effects of soil. The results were highly consistent with those in the sensitive region of the original spectra. Thus, 3SV was the best preprocessing method. A total of 96 spectral indices were evaluated by finding the optimal threshold and PRI670,570, B, and RARSa were found to be the best-performing spectral indices for effectively detecting the two stresses. The TVIF feature selection method was combined with the ML model, and then an optimal stress detection solution based on 3SV-TVIF-SVM was proposed. The effectiveness of this solution was confirmed based on empirical data, with OA and Kappa values of 96.97% and 0.931, respectively.

Supplementary Materials

The following supporting information can be downloaded at: https://www.mdpi.com/article/10.3390/rs15102513/s1, Table S1: 96 Spectral Indices. References [12,32,33,34,35,36,37,38,39,69,70,71,72,73,74,75,76,77,78,79,80,81,82,83,84,85,86,87,88,89,90,91,92,93,94,95,96,97,98,99,100,101,102,103,104,105,106,107] are cited in the Supplementary Materials.

Author Contributions

Conceptualization, Z.F. and W.F.; methodology, H.Z.; software, J.D.; validation, Z.F., L.H. and X.Y.; formal analysis, Y.G. and W.L.; investigation, H.Z.; resources, H.Z.; data curation, Z.F. and H.Z.; writing—original draft preparation, Z.F.; writing—review and editing, Z.F., X.L. and W.F.; visualization, X.L.; supervision, J.D. and X.L.; project administration, H.Z. and W.F.; funding acquisition, H.Z. and W.F. All authors have read and agreed to the published version of the manuscript.

Funding

This research was funded by grants from the Postdoctoral Science Foundation Project of China (2021M701109) and the National Key Research Project of China (2018YFD0300701).

Data Availability Statement

The data presented in this study are available upon request from the corresponding author. The data are not publicly available due to their use in subsequent studies.

Acknowledgments

Thanks to the three reviewers and the editors for their suggestions, which could lead to an improved quality of the manuscript.

Conflicts of Interest

The authors declare no conflict of interest.

References

  1. Maria, F.B.; Thomas, A.G.; Christoph, A.H.; Andrew, K.S. Changes in thermal infrared spectra of plants caused by temperature and water stress. ISPRS J. Photogramm. Remote Sens. 2016, 111, 22–31. [Google Scholar] [CrossRef]
  2. Berger, K.; Verrelst, J.; Féret, J.B.; Wang, Z.; Wocher, M.; Strathmann, M.; Danner, M.; Mauser, W.; Hank, T. Crop nitrogen monitoring: Recent progress and principal developments in the context of imaging spectroscopy missions. Remote Sens. Environ. 2020, 242, 111758. [Google Scholar] [CrossRef] [PubMed]
  3. Wu, C.F.; Wang, F.Y.; Ge, A.H.; Zhang, H.Q.; Chen, G.X.; Deng, Y.W.; Yang, J.; Chen, J.P.; Ge, T.D. Enrichment of microbial taxa after the onset of wheat yellow mosaic disease. Agric. Ecosyst. Environ. 2021, 322, 107651. [Google Scholar] [CrossRef]
  4. Xu, Y.; Hu, L.; Li, L.; Zhang, Y.; Sun, B.; Meng, X.; Zhu, T.; Sun, Z.; Hong, G.; Chen, Y.; et al. Ribotypes of Polymyxa graminis in wheat samples infected with soilborne wheat viruses in China. Plant Dis. 2018, 102, 948–954. [Google Scholar] [CrossRef] [PubMed]
  5. Guo, L.M.; He, J.; Li, J.; Chen, J.P.; Zhang, H.M. Chinese wheat mosaic virus: A long-term threat to wheat in China. J. Integr. Agric. 2019, 18, 821–829. [Google Scholar] [CrossRef]
  6. Zhang, J.; Huang, Y.; Pu, R.; Gonzalez-Moreno, P.; Yuan, L.; Wu, K.; Huang, W. Monitoring plant diseases and pests through remote sensing technology: A review. Comput. Electron. Agric. 2019, 165, 104943. [Google Scholar] [CrossRef]
  7. Wahabzada, M.; Mahlein, A.K.; Bauckhage, C.; Steiner, U.; Oerke, E.C.; Kersting, K. Plant phenotyping using probabilistic topic models: Uncovering the hyperspectral language of plants. Sci. Rep. 2016, 6, 22482. [Google Scholar] [CrossRef] [PubMed]
  8. Zahir, S.A.D.M.; Omar, A.F.; Jamlos, M.F.; Azmi, M.A.M.; Muncan, J. A review of visible and near-infrared (Vis-NIR) spectroscopy application in plant stress detection. Sens. Actuators A. 2022, 338, 113468. [Google Scholar] [CrossRef]
  9. Huang, W.; Lamb, D.W.; Niu, Z.; Zhang, Y.; Liu, L.; Wang, J. Identification of yellow rust in wheat using in-situ spectral reflectance measurements and airborne hyperspectral imaging. Precis. Agric. 2007, 8, 187–197. [Google Scholar] [CrossRef]
  10. Devadas, R.; Lamb, D.W.; Simpfendorfer, S.; Backhouse, D. Evaluating ten spectral vegetation indices for identifying rust infection in individual wheat leaves. Precis. Agric. 2009, 10, 459–470. [Google Scholar] [CrossRef]
  11. Prabhakar, M.; Prasad, Y.G.; Thirupathi, M.; Sreedevi, G.; Dharajothi, B.; Venkateswarlu, B. Use of ground based hyperspectral remote sensing for detection of stress in cotton caused by leafhopper (Hemiptera: Cicadellidae). Comput. Electron. Agric. 2011, 79, 189–198. [Google Scholar] [CrossRef]
  12. Mahlein, A.K.; Rumpf, T.; Welke, P.; Dehne, H.W.; Plümer, L.; Steiner, U.; Oerke, E.C. Development of spectral indices for detecting and identifying plant diseases. Remote Sens. Environ. 2013, 128, 21–30. [Google Scholar] [CrossRef]
  13. Tian, L.; Xue, B.; Wang, Z.; Li, D.; Yao, X.; Cao, Q.; Zhu, Y.; Cao, W.; Cheng, T. Spectroscopic detection of rice leaf blast infection from asymptomatic to mild stages with integrated machine learning and feature selection. Remote Sens. Environ. 2021, 257, 112350. [Google Scholar] [CrossRef]
  14. Dao, P.D.; He, Y.; Proctor, C. Plant drought impact detection using ultra-high spatial resolution hyperspectral images and machine learning. Int. J. Appl. Earth Obs. Geoinf. 2021, 102, 102364. [Google Scholar] [CrossRef]
  15. Xia, J.; Cao, H.; Yang, Y.; Zhang, W.; Wan, Q.; Xu, L.; Ge, D.; Zhang, W.; Ke, Y.; Huang, B. Detection of waterlogging stress based on hyperspectral images of oilseed rape leaves (Brassica napus L.). Comput. Electron. Agric. 2019, 159, 59–68. [Google Scholar] [CrossRef]
  16. Yu, K.; Lenz-Wiedemann, V.; Chen, X.; Bareth, G. Estimating leaf chlorophyll of barley at different growth stages using spectral indices to reduce soil background and canopy structure effects. ISPRS J. Photogramm. Remote Sens. 2014, 97, 58–77. [Google Scholar] [CrossRef]
  17. Tsai, F.; Philpot, W. Derivative Analysis of Hyperspectral Data. Remote Sens. Environ. 1998, 66, 41–51. [Google Scholar] [CrossRef]
  18. Huang, J.; Liao, H.; Zhu, Y.; Sun, J.; Sun, Q.; Liu, X. Hyperspectral detection of rice damaged by rice leaf folder (Cnaphalocrocis medinalis). Comput. Electron. Agr. 2012, 82, 100–107. [Google Scholar] [CrossRef]
  19. Malenovský, Z.; Homolová, L.; Zurita-Milla, R.; Lukeš, P.; Kaplan, V.; Hanuš, J.; Gastellu-Etchegorry, J.P.; Schaepman, M.E. Retrieval of spruce leaf chlorophyll content from airborne image data using continuum removal and radiative transfer. Remote Sens. Environ. 2013, 131, 85–102. [Google Scholar] [CrossRef]
  20. Xu, H.R.; Ying, Y.B.; Fu, X.P. Near-infrared spectroscopy in detecting leaf miner damage on tomato leaf. Biosyst. Eng. 2007, 96, 447–454. [Google Scholar] [CrossRef]
  21. Luo, J.; Huang, W.; Zhao, J.; Zhang, J.; Zhao, C.; Ma, R. Detecting aphid density of winter wheat leaf using hyperspectral measurements. IEEE J. Sel. Top. Appl. Earth Obs. Remote Sens. 2013, 6, 690–698. [Google Scholar] [CrossRef]
  22. Asaari, M.S.M.; Mishra, P.; Mertens, S.; Dhondt, S.; Inzé, D.; Wuyts, N.; Scheunders, P. Close-range hyperspectral image analysis for the early detection of stress responses in individual plants in a high-throughput phenotyping platform. ISPRS J. Photogramm. Remote Sens. 2018, 138, 121–138. [Google Scholar] [CrossRef]
  23. Li, D.; Chen, J.M.; Yu, W.; Zheng, H.; Yao, X.; Cao, W.; Wei, D.; Xiao, C.; Zhu, Y.; Cheng, T. Assessing a soil-removed semi-empirical model for estimating leaf chlorophyll content. Remote Sens. Environ. 2022, 282, 113284. [Google Scholar] [CrossRef]
  24. Zarco-Tejada, P.J.; Hornero, A.; Beck, P.S.A.; Kattenborn, T.; Kempeneers, P.; Hernández-Clemente, R. Chlorophyll content estimation in an open-canopy conifer forest with Sentinel-2A and hyperspectral imagery in the context of forest decline. Remote Sens. Environ. 2019, 223, 320–335. [Google Scholar] [CrossRef] [PubMed]
  25. Poblete, T.; Camino, C.; Beck, P.S.A.; Hornero, A.; Kattenborn, T.; Saponari, M.; Boscia, D.; Navas-Cortes, J.A.; Zarco-Tejada, P.J. Detection of Xylella fastidiosa infection symptoms with airborne multispectral and thermal imagery: Assessing bandset reduction performance from hyperspectral analysis. ISPRS J. Photogramm. Remote Sens. 2020, 162, 27–40. [Google Scholar] [CrossRef]
  26. Moghaddam, S.; Mokhtarzade, M.; Beirami, B.A. A feature extraction method based on spectral segmentation and integration of hyperspectral images. Int. J. Appl. Earth Obs. Geoinf. 2020, 89, 102097. [Google Scholar] [CrossRef]
  27. Zhao, X.; Zhang, J.; Pu, R.; Shu, Z.; He, W.; Wu, K. The continuous wavelet projections algorithm: A practical spectral-feature-mining approach for crop detection. Crop J. 2022, 10, 1264–1273. [Google Scholar] [CrossRef]
  28. Lichtenthaler, H.K. Chlorophylls and carotenoids: Pigments of photosynthetic biomembranes. Method Enzymol. 1987, 148, 350–382. [Google Scholar] [CrossRef]
  29. Issac, R.A.; Johnson, W.C. Determination of total nitrogen in plant tissue, using a block digestor. J. Assoc. Off. Anal. Chem. 1976, 59, 98–100. [Google Scholar] [CrossRef]
  30. Barnes, R.J.; Dhanoa, M.S.; Lister, S.J. Standard normal variate transformation and de-trending of near-infrared diffuse reflectance spectra. Appl. Spectrosc. 1989, 43, 772–777. [Google Scholar] [CrossRef]
  31. Croft, H.; Chen, J.M.; Zhang, Y. The applicability of empirical vegetation indices for determining leaf chlorophyll content over different leaf and canopy structures. Ecol. Complex. 2014, 17, 119–130. [Google Scholar] [CrossRef]
  32. Chappelle, E.W.; Kim, M.S.; McMurtrey, J.E. Ratio analysis of reflectance spectra (RARS)—An algorithm for the remote estimation of the concentrations of chlorophyll-a, chlorophyll-b, and carotenoids in soybean leaves. Remote Sens. Environ. 1992, 39, 239–247. [Google Scholar] [CrossRef]
  33. Hernandez-Clemente, R.; Navarro-Cerrillo, R.M.; Suarez, L.; Morales, F.; Zarco-Tejada, P.J. Assessing structural effects on PRI for stress detection in conifer forests. Remote Sens. Environ. 2011, 115, 2360–2375. [Google Scholar] [CrossRef]
  34. Gitelson, A.A.; Yacobi, Y.Z.; Schalles, J.E.; Rundquist, D.C.; Han, L.; Stark, R.; Etzion, D. Remote estimation of phytoplankton density in productive waters. Arch. HydrobioI. 2000, 55, 121–136. [Google Scholar]
  35. Calderón, R.; Navas-Cortés, J.A.; Lucena, C.; Zarco-Tejada, P.J. High-resolution airborne hyperspectral and thermal imagery for early detection of Verticillium wilt of olive using fluorescence, temperature and narrow-band spectral indices. Remote Sens. Environ. 2013, 139, 231–245. [Google Scholar] [CrossRef]
  36. Zarco-Tejada, P.J.; Gonzalez-Dugo, V.; Berni, J.A.J. Fluorescence, temperature and narrow-band indices acquired from a UAV platform for water stress detection using a micro-hyperspectral imager and a thermal camera. Remote Sens. Environ. 2012, 117, 322–337. [Google Scholar] [CrossRef]
  37. Zarco-Tejada, P.J.; Berjon, A.; Lopez-Lozano, R.; Miller, J.R.; Martin, P.; Cachorro, V.; Gonzalez, M.R.; de Frutos, A. Assessing vineyard condition with hyperspectral indices: Leaf and canopy reflectance simulation in a row-structured discontinuous canopy. Remote Sens. Environ. 2005, 99, 271–287. [Google Scholar] [CrossRef]
  38. Lichtenthaler, H.K.; Lang, M.; Sowinska, M.; Heisel, F.; Mieh´e, J.A. Detection of Vegetation Stress Via a New High Resolution Fluorescence Imaging System. J. Plant Physiol. 1996, 148, 599–612. [Google Scholar] [CrossRef]
  39. Merzlyak, M.N.; Gitelson, A.A.; Chivkunova, O.B.; Rakitin, V.Y. Non-destructive optical detection of pigment changes during leaf senescence and fruit ripening. Physiol. Plant. 1999, 106, 135–141. [Google Scholar] [CrossRef]
  40. Weinberger, K.; Blitzer, J.; Saul, L.K. Distance metric learning for large margin earest neighbor Classificatio. J. Mach. Learn. Res. 2009, 10, 207–244. [Google Scholar] [CrossRef]
  41. Breiman, L. Random forests. Mach. Learn. 2001, 45, 5–32. [Google Scholar] [CrossRef]
  42. Liang, L.; Di, L.; Zhang, L.; Deng, M.; Qin, Z.; Zhao, S.; Lin, H. Estimation of crop LAI using hyperspectral vegetation indices and a hybrid inversion method. Remote Sens. Environ. 2015, 165, 123–134. [Google Scholar] [CrossRef]
  43. Mountrakis, G.; Im, J.; Ogole, C. Support vector machines in remote sensing: A review. ISPRS J. Photogramm. Remote Sens. 2011, 66, 247–259. [Google Scholar] [CrossRef]
  44. Camps-Valls, G.; Bruzzone, L.; Rojo-Alvarez, J.L.; Melgani, F. Robust support vector regression for biophysical variable estimation from remotely sensed images. IEEE Geosci. Remote Sens. Lett. 2006, 3, 339–343. [Google Scholar] [CrossRef]
  45. Zhang, J.; Okin, G.S.; Zhou, B. Assimilating optical satellite remote sensing images and field data to predict surface indicators in the Western, U.S.: Assessing error in satellite predictions based on large geographical datasets with the use of machine learning. Remote Sens. Environ. 2019, 233, 111382. [Google Scholar] [CrossRef]
  46. Li, Z.; Zhou, J.; Dong, T.; Xu, Y.; Shang, Y. Application of electrochemical methods for the detection of abiotic stress biomarkers in plants. Biosens. Bioelectron. 2021, 182, 113105. [Google Scholar] [CrossRef] [PubMed]
  47. Payne, W.Z.; Kurouski, D. Raman-based diagnostics of biotic and abiotic stresses in plants. A review. Front. Plant Sci. 2021, 11, 616672. [Google Scholar] [CrossRef]
  48. Zhang, F.; Liu, S.; Zhang, T.; Ye, Z.; Han, X.; Zhong, K.; Yang, J.; Chen, J.; Liu, P. Construction and biological characterization of an infectious full-length cDNA clone of a Chinese isolate of Wheat yellow mosaic virus. Virology 2021, 556, 101–109. [Google Scholar] [CrossRef]
  49. Fagodiya, R.K.; Pathak, H.; Kumar, A.; Bhatia, A.; Jain, N. Global temperature change potential of nitrogen use in agriculture: A 50-year assessment. Sci. Rep. UK. 2017, 7, 44928. [Google Scholar] [CrossRef]
  50. Jiang, J.; Jiang, S.; Xu, J.; Wang, J.; Li, Z.; Wu, J.; Zhang, J. Lowering nitrogen inputs and optimizing fertilizer types can reduce direct and indirect greenhouse gas emissions from rice-wheat rotation systems. Eur. J. Soil Biol. 2020, 97, 103152. [Google Scholar] [CrossRef]
  51. Rinnan, Å.; Van Den Berg, F.; Engelsen, S.B. Review of the most common pre-processing techniques for near-infrared spectra. TrAC Trends Anal. Chem. 2009, 28, 1201–1222. [Google Scholar] [CrossRef]
  52. Bi, Y.; Yuan, K.; Xiao, W.; Wu, J.; Shi, C.; Xia, J.; Chu, G.; Zhang, G.; Zhou, G. A local pre-processing method for near-infrared spectra, combined with spectral segmentation and standard normal variate transformation. Anal. Chim. Acta. 2016, 909, 30–40. [Google Scholar] [CrossRef] [PubMed]
  53. Feng, Z.; Wang, L.; Yang, Z.; Zhang, Y.; Li, X.; Song, L.; He, L.; Duan, J.; Feng, W. Hyperspectral Monitoring of Powdery Mildew Disease Severity in Wheat Based on Machine Learning. Front. Plant Sci. 2022, 13, 828454. [Google Scholar] [CrossRef] [PubMed]
  54. Eitel, J.U.; Vierling, L.A.; Litvak, M.E.; Long, D.S.; Schulthess, U.; Ager, A.A.; Krofcheck, D.J.; Stoscheck, L. Broadband, red-edge information from satellites improves early stress detection in a new mexico conifer woodland. Remote Sens. Environ. 2011, 115, 3640–3646. [Google Scholar] [CrossRef]
  55. Curran, P.J.; Dungan, J.L.; Gholz, H.L. Exploring the relationship between reflectance red edge and chlorophyll content in slash pine. Tree Physiol. 1990, 7, 33–48. [Google Scholar] [CrossRef]
  56. Dawson, T.P.; Curran, P.J. Technical note a new technique for interpolating the reflectance red edge position. Int. J. Remote Sens. 1998, 19, 2133–2139. [Google Scholar] [CrossRef]
  57. Qian, B.; Ye, H.; Huang, W.; Xie, Q.; Pan, Y.; Xing, N.; Ren, Y.; Guo, A.; Jiao, Q.; Lan, Y. A sentinel-2-based triangular vegetation index for chlorophyll content estimation. Agric. For. Meteorol. 2022, 322, 109000. [Google Scholar] [CrossRef]
  58. Li, H.; Liang, Y.; Xu, Q.; Cao, D. Key wavelengths screening using competitive adaptive reweighted sampling method for multivariate calibration. Anal. Chim. Acta. 2009, 648, 77–84. [Google Scholar] [CrossRef]
  59. Soares, S.F.C.; Gomes, A.A.; Araujo, M.C.U.; Filho, A.R.G.; Galvão, R.K.H. The successive projections algorithm. TrAC-Trends Anal. Chem. 2013, 42, 84–98. [Google Scholar] [CrossRef]
  60. Maulika, U.; Chakraborty, D. Learning with transductive SVM for semisupervised pixel classification of remote sensing imagery. ISPRS J. Photogramm. Remote Sens. 2013, 77, 66–78. [Google Scholar] [CrossRef]
  61. Rapinel, S.; Mony, C.; Lecoq, L.; Clément, B.; Thomas, A.; Hubert-Moy, L. Evaluation of Sentinel-2 time-series for mapping floodplain grassland plant communities. Remote Sens. Environ. 2019, 223, 115–129. [Google Scholar] [CrossRef]
  62. Gelabert, P.J.; Rodrigues, M.; Riva, J.; Ameztegui, A.; Sebastià, M.T.; Vega-Garcia, C. LandTrendr smoothed spectral profiles enhance woody encroachment monitoring. Remote Sens. Environ. 2021, 262, 112521. [Google Scholar] [CrossRef]
  63. Li, Z.; Zhao, Y.; Taylor, J.; Gaulton, R.; Jin, X.; Song, X.; Li, Z.; Meng, Y.; Chen, P.; Feng, H.; et al. Comparison and transferability of thermal, temporal and phenological-based in-season predictions of above-ground biomass in wheat crops from proximal crop reflectance data. Remote Sens. Environ. 2022, 273, 112967. [Google Scholar] [CrossRef]
  64. He, L.; Liu, M.; Zhang, S.; Guan, H.; Wang, C.; Feng, W.; Guo, T. Remote estimation of leaf water concentration in winter wheat under different nitrogen treatments and plant growth stages. Precis. Agric. 2022, 24, 986–1013. [Google Scholar] [CrossRef]
  65. Cheng, T.; Rivard, B.; Sánchez-Azofeifa, G.A.; Feng, J.; Calvo-Polanco, M. Continuous wavelet analysis for the detection of green attack damage due to mountain pine beetle infestation. Remote Sens. Environ. 2010, 114, 899–910. [Google Scholar] [CrossRef]
  66. Li, D.; Cheng, T.; Zhou, K.; Zheng, H.; Yao, X.; Tian, Y.; Zhu, Y.; Cao, W. WREP: A wavelet-based technique for extracting the red edge position from reflectance spectra for estimating leaf and canopy chlorophyll contents of cereal crops. ISPRS J. Photogramm. Remote Sens. 2017, 129, 103–117. [Google Scholar] [CrossRef]
  67. Zhang, Y.; Hui, J.; Qin, Q.; Sun, Y.; Zhang, T.; Sun, H.; Li, M. Transfer-learning-based approach for leaf chlorophyll content estimation of winter wheat from hyperspectral data. Remote Sens. Environ. 2021, 267, 112724. [Google Scholar] [CrossRef]
  68. Wan, L.; Zhou, W.; He, Y.; Wanger, T.C.; Cen, H. Combining transfer learning and hyperspectral reflectance analysis to assess leaf nitrogen concentration across different plant species datasets. Remote Sens. Environ. 2022, 269, 112826. [Google Scholar] [CrossRef]
  69. Bausch, W.C.; Duke, H.R. Remote sensing of plant nitrogen status in corn. Trans. the ASAE 1996, 39, 1869–1875. [Google Scholar] [CrossRef]
  70. Blackburn, G.A. Quantifying chlorophylls and caroteniods at leaf and canopy scales: An evaluation of some hyperspectral approaches. Remote Sens. Environ. 1998, 66, 273–285. [Google Scholar] [CrossRef]
  71. Blackburn, G.A. Spectral indices for estimating photosynthetic pigment concentrations: A test using senescent tree leaves. Int. J. Remote Sens. 1998, 19, 657–675. [Google Scholar] [CrossRef]
  72. Blackburn, G.A. Relationships between spectral reflectance and pigment concentrations in stacks of deciduous broadleaves. Remote Sens. Environ. 1999, 70, 224–237. [Google Scholar] [CrossRef]
  73. Carter, G.A. Ratios of leaf reflectances in narrow wavebands as indicators of plant stress. Int. J. Remote Sens. 1994, 15, 697–703. [Google Scholar] [CrossRef]
  74. Chen, P.; Haboudane, D.; Tremblay, N.; Wang, J.; Vigneault, P.; Li, B. New spectral indicator assessing the efficiency of crop nitrogen treatment in corn and wheat. Remote Sens. Environ. 2010, 114, 1987–1997. [Google Scholar] [CrossRef]
  75. Dash, J.; Curran, P.J. The MERIS terrestrial chlorophyll index. Int. J. Remote Sens. 2004, 25, 5403–5413. [Google Scholar] [CrossRef]
  76. Datt, B. Remote sensing of chlorophyll a, chlorophyll b, chlorophyll a+b, and total carotenoid content in eucalyptus leaves. Remote Sens. Environ. 1998, 66, 111–121. [Google Scholar] [CrossRef]
  77. Datt, B. A new reflectance index for remote sensing of chlorophyll content in higher plants: Tests using Eucalyptus leaves. J. Plant Physiol. 1999, 154, 30–36. [Google Scholar] [CrossRef]
  78. Eitel, J.U.H.; Long, D.S.; Gessler, P.E.; Smith, A.M.S. Using in-situ measurements to evaluate the new RapidEye™ satellite series for prediction of wheat nitrogen status. Int. J. Remote Sens. 2007, 28, 4183–4190. [Google Scholar] [CrossRef]
  79. Féret, J.-B.; François, C.; Gitelson, A.; Asner, G.P.; Barry, K.M.; Panigada, C.; Richardson, A.D.; Jacquemoud, S. Optimizing spectral indices and chemometric analysis of leaf chemical properties using radiative transfer modeling. Remote Sens. Environ. 2011, 115, 2742–2750. [Google Scholar] [CrossRef]
  80. Gamon, J.A.; Huemmrich, K.F.; Wong, C.Y.S.; Ensminger, I.; Garrity, S.; Hollinger, D.Y.; Noormets, A.; Peñuelas, J. A remotely sensed pigment index reveals photosynthetic phenology in evergreen conifers. Proc. Natl. Acad. Sci. USA 2016, 113, 13087–13092. [Google Scholar] [CrossRef]
  81. Gamon, J.A.; Penuelas, J.; Field, C.B. A Narrow-Waveband Spectral Index That Tracks Diurnal Changes in Photosynthetic Efficiency. Remote Sens. Environ. 1992, 41, 35–44. [Google Scholar] [CrossRef]
  82. Garrity, S.R.; Bohrer, G.; Maurer, K.D.; Mueller, K.L.; Vogel, C.S.; Curtis, P.S. A comparison of multiple phenology data sources for estimating seasonal transitions in deciduous forest carbon exchange. Agric. For. Meteorol. 2011, 151, 1741–1752. [Google Scholar] [CrossRef]
  83. Gitelson, A.; Merzlyak, M.N. Quantitative estimation of chlorophyll-a using reflectance spectra-experiments with autumn chestnut and maple leaves. J. Photochem. Photobiol. B-Biol. 1994, 22, 247–252. [Google Scholar] [CrossRef]
  84. Gitelson, A.A.; Buschmann, C.; Lichtenthaler, H.K. The chlorophyll fluorescence ratio F-735/F-700 as an accurate measure of the chlorophyll content in plants. Remote Sens. Environ. 1999, 69, 296–302. [Google Scholar] [CrossRef]
  85. Gitelson, A.A.; Keydan, G.P.; Merzlyak, M.N. Three-band model for noninvasive estimation of chlorophyll, carotenoids, and anthocyanin contents in higher plant leaves. Geophys. Res. Lett. 2006, 33, 431–433. [Google Scholar] [CrossRef]
  86. Gitelson, A.A.; Merzlyak, M.N. Signature analysis of leaf reflectance spectra: Algorithm development for remote sensing of chlorophyll. J. Plant Physiol. 1996, 148, 494–500. [Google Scholar] [CrossRef]
  87. Gitelson, A.A.; Merzlyak, M.N.; Chivkunova, O.B. Optical properties and nondestructive estimation of anthocyanin content in plant leaves. Photochem. Photobiol. 2001, 74, 38–45. [Google Scholar] [CrossRef] [PubMed]
  88. Gitelson, A.A.; Zur, Y.; Chivkunova, O.B.; Merzlyak, M.N. Assessing carotenoid content in plant leaves with reflectance spectroscopy. Photochem. Photobiol. 2002, 75, 272–281. [Google Scholar] [CrossRef] [PubMed]
  89. Haboudane, D.; Miller, J.R.; Tremblay, N.; Zarco-Tejada, P.J.; Dextraze, L. Integrated narrow-band vegetation indices for prediction of crop chlorophyll content for application to precision agriculture. Remote Sens. Environ. 2002, 81, 416–426. [Google Scholar] [CrossRef]
  90. Hansen, P.M.; Schjoerring, J.K. Reflectance measurement of canopy biomass and nitrogen status in wheat crops using normalized difference vegetation indices and partial least squares regression. Remote Sens. Environ. 2003, 86, 542–553. [Google Scholar] [CrossRef]
  91. He, L.; Qi, S.L.; Duan, J.Z.; Guo, T.C.; Feng, W.; He, D.X. Monitoring of wheat powdery mildew disease severity using multiangle hyperspectral remote sensing. IEEE Trans. Geosci. Remote Sens. 2020, 59, 979–990. [Google Scholar] [CrossRef]
  92. He, L.; Song, X.; Feng, W.; Guo, B.; Zhang, Y.; Wang, Y.; Wang, C.; Guo, T. Improved remote sensing of leaf nitrogen concentration in winter wheat using multi-angular hyperspectral data. Remote Sens. Environ. 2016, 174, 122–133. [Google Scholar] [CrossRef]
  93. Huang, W.; Guan, Q.; Luo, J.; Zhang, J. New Optimized Spectral Indices for Identifying and Monitoring Winter Wheat Diseases. IEEE J. Sel. Top. Appl. Earth Obs. Remote Sens. 2014, 7, 2516–2524. [Google Scholar] [CrossRef]
  94. Li, D.; Chen, J.M.; Zhang, X.; Yan, Y.; Zhu, J.; Zheng, H.; Zhou, K.; Yao, X.; Tian, Y.; Zhu, Y.; et al. Improved estimation of leaf chlorophyll content of row crops from canopy reflectance spectra through minimizing canopy structural effects and optimizing off-noon observation time. Remote Sens. Environ. 2020, 248, 111985. [Google Scholar] [CrossRef]
  95. Liu, L.; Huang, W.; Pu, R.; Wang, J. Detection of internal leaf structure deterioration using a new spectral ratio index in the near-infrared shoulder region. J. Integr. Agric. 2014, 13, 760–769. [Google Scholar] [CrossRef]
  96. Lu, S.; Lu, F.; You, W.Q.; Wang, Z.Y.; Liu, Y.; Omasa, K. A robust vegetation index for remotely assessing chlorophyll content of dorsiventral leaves across several species in different seasons. Plant Methods 2018, 14, 15. [Google Scholar] [CrossRef] [PubMed]
  97. Maccioni, A.; Agati, G.; Mazzinghi, P. New vegetation indices for remote measurement of chlorophylls based on leaf directional reflectance spectra. J. Photochem. Photobiol. B-Biol. 2001, 61, 52–61. [Google Scholar] [CrossRef] [PubMed]
  98. Mirik, M.; Michels, G.J.; Kassymzhanova-Mirik, S.; Elliott, N.C.; Catana, V.; Jones, D.B.; Bowling, R. Using digital image analysisand spectral reflectance data to quantify damage by greenbug (Hemitera: Aphididae) in winter wheat. Comput. Electron. Agric. 2006, 51, 86–98. [Google Scholar] [CrossRef]
  99. Penuelas, J.; Baret, F.; Filella, I. Semiempirical indexes to assess carotenoids chlorophyll-a ratio from leaf spectral reflectance. Photosynthetica 1995, 31, 221–230. [Google Scholar]
  100. Penuelas, J.; Pinol, J.; Ogaya, R.; Filella, I. Estimation of plant water concentration by the reflectance water index WI (R900/R970). Int. J. Remote Sens. 1997, 18, 2869–2875. [Google Scholar] [CrossRef]
  101. Reyniers, M.; Walvoort, D.J.J.; Baardemaaker, J.D. A linear model to predict with a multi-spectral radiometer the amount of nitrogen in winter wheat. Int. J. Remote Sens. 2006, 27, 4159–4179. [Google Scholar] [CrossRef]
  102. Sims, D.A.; Gamon, J.A. Relationships between leaf pigment content and spectral reflectance across a wide range of species, leaf structures and developmental stages. Remote Sens. Environ. 2002, 81, 337–354. [Google Scholar] [CrossRef]
  103. Vogelmann, J.E.; Rock, B.N.; Moss, D.M. Red edge spectral measurements from sugar maple leaves. Int. J. Remote Sens. 1993, 14, 1563–1575. [Google Scholar] [CrossRef]
  104. Xue, L.; Cao, W.; Luo, W.; Dai, T.; Zhu, Y. Monitoring leaf nitrogen status in rice with canopy spectral reflectance. Agron. J. 2004, 96, 135–142. [Google Scholar] [CrossRef]
  105. Zarco-Tejada, P.J.; Camino, C.; Beck, P.S.A.; Calderon, R.; Hornero, A.; Hernandez-Clemente, R.; Kattenborn, T.; Montes-Borrego, M.; Susca, L.; Morelli, M.; et al. Previsual symptoms of Xylella fastidiosa infection revealed in spectral plant-trait alterations. Nat. Plants 2018, 4, 432–439. [Google Scholar] [CrossRef]
  106. Zarco-Tejada, P.J.; Miller, J.R.; Mohammed, G.H.; Noland, T.L.; Sampson, P.H. Chlorophyll fluorescence effects on vegetation apparent reflectance: II. Laboratory and airborne canopy-level measurements with hyperspectral data. Remote Sens. Environ. 2000, 74, 596–608. [Google Scholar] [CrossRef]
  107. Zhu, Y.; Yao, X.; Tian, Y.; Liu, X.; Cao, W. Analysis of common canopy vegetation indices for indicating leaf nitrogen accumulations in wheat and rice. Int. J. Appl. Earth Obs. Geoinf. 2008, 10, 1–10. [Google Scholar] [CrossRef]
Figure 1. A technology roadmap for the detection of nitrogen deficiency and yellow mosaic leaf disease stresses (OR: Original reflectance; CR: Continuous removal; FD: First-order derivative; SNV: Standard normal variate; 3SV: Spectral separation of soil and vegetation; TVIF: The threshold method and variance inflation factor).
Remotesensing 15 02513 g001
Figure 2. Changes in physiological parameters for various growth stages under the two stresses (Lower case letters (a, b, c) are 5% significant level).
Remotesensing 15 02513 g002
Figure 3. Waveforms and separability of various transform spectra. ((AE) are the shape of each transform spectrum, and (FJ) are the two-stress separability of each transform spectrum).
Remotesensing 15 02513 g003
Figure 4. Data distribution points for the three best spectral indices (L1, L2, and L3 are the WYMV disease levels; L1 is Level 1; L2 is Level 2; and L3 is Level 3).
Remotesensing 15 02513 g004
Figure 5. (A,B) Evaluation of ten spectral indices based on the original and updated thresholds for stress detection ability (UT_OA: OA of the spectral index after updating the thresholds).
Remotesensing 15 02513 g005
Figure 6. The accuracies for various transformed spectra and machine learning models for each stress level in the two growth stages (validation set).
Remotesensing 15 02513 g006
Figure 7. Detection accuracies for various transformed spectra and machine learning models for each stress level with independent year data ((AC) are nitrogen stress levels, and (DF) are disease stress levels).
Remotesensing 15 02513 g007
Table 1. Soil status, cultivars, stress types, and sampling dates for the four experiments.
Experiment IDSeason
and Site
CultivarStress TypeSampling Stage
EXP.12018–2019
Shangshui County
Yumai 49–198
Zhoumai 27
N rate (kg ha−1)
N0 (0)
N1 (90)
N2 (180)
Green-up
Jointing
EXP.22018–2019
Yuanyang County
Aikang 58
Yumai 49–198
N rate (kg ha−1)
N0 (0)
N1 (90)
N2 (180)
Green-up
Jointing
EXP.32019–2020
Yuanyang County
Yumai 49–198
Zhoumai 27
N rate (kg ha−1)
N0 (0)
N1 (90)
N2 (180)
Green-up
Jointing
EXP.42021–2022
Luohe City
Xinong 979
Zhoumai 22
Mild (Level 1)
Moderate (Level 2)
Severe (Level 3)
Green-up
Jointing
EXP.52021–2022
Zhumadian City
Aikang 58
Zhengmai 379
Mild (Level 1)
Moderate (Level 2)
Severe (Level 3)
Green-up
Jointing
EXP.62018–2019
Luohe City
Bainong 207
Zhoumai 27
Mild (Level 1)
Moderate (Level 2)
Severe (Level 3)
Green-up
Jointing
Table 2. Symptoms of different levels of wheat yellow mosaic disease.
Disease LevelSymptom
Mild (L1)New leaves show faded green streaks or yellow foliage symptoms.
Moderate (L2)Most leaves show faded green streaks or yellow foliage symptoms, sometimes new leaves are twisted and plant dwarfing is not obvious.
Severe (L3)Most of the plants show severe foliar symptoms, necrotic spots on the old leaves and plants are obviously dwarfed, some tillers die or the whole plant dies.
Table 3. Spectral indices (SIs) included in this study and their formulations.
TypeIndexShortFormulationReference
ChlorophyllRatio analysis of reflectance spectraRARSaR675/R700[32]
XanthophyllPhotochemical refl. index (670 and 570)PRI670,570(R570 − R531 − R670)/(R570 + R531 + R670)[33]
R/G/B colorRedness indexRR700/R670[34]
Blue indexBR450/R490[35]
Blue/red indexBRI2R450/R690[36]
Red/green indexRGIR690/R550[37]
Lichtenthaler indexLIC1R440/R690[38]
Plant stressPowdery mildew indexPMI_2013(R520 − R584)/(R520 + R584) + R724[12]
Cercospora leaf spot indexCLSI_2013(R698 − R570)/(R698 + R570) − R734[12]
Plant senescence reflectance indexPSRI(R680 − R500)/R750[39]
Table 4. Description of sample size and source for various datasets.
DatasetData SourceNitrogen Deficiency SamplesSamples Infected with WYMVTotal
Dataset 1EXP.1, EXP.2, EXP.4, EXP.5130180310
Dataset 2EXP.3, EXP.66680146
Table 5. Spectral indices for the top ten highest stress detection accuracies.
VIsOA (%)KappaNitrogen Deficiency SamplesWYMV Infection Samples
N0N1N2Level 1Level 2Level 3
PRI670,57093.87%0.87397.56%90.91%80%100%98.33%93.33%
B91.61%0.82495.12%90.91%62.22%100%100%95.00%
RARSa91.29%0.82097.56%90.91%75.56%100%98.33%83.33%
R91.29%0.82097.56%90.91%75.56%100%98.33%83.33%
PSRI90.65%0.80295.12%84.09%55.56%100%100%100%
CLSI_201390.32%0.802100%95.45%73.33%91.67%90.00%91.67%
BRI290%0.78895.12%88.64%46.67%100%100%100%
LIC290%0.79097.56%86.36%57.78%91.67%100%100%
PMI_201390%0.797100%95.45%80%83.33%91.67%91.67%
RGI89.68%0.78195.12%79.55%53.33%100%100%100%
Table 6. Stress detection accuracies of machine learning models with different input feature sets under various transformed spectra.
Data TypeFeaturesModelCalibration SetValidation Set
OAKappaOAKappa
ORR750, R960KNN94.80%0.89291.92%0.817
RF100.00%192.63%0.831
SVM95.80%0.92193.82%0.855
CRR791, R859KNN93.45%0.86489.14%0.765
RF96.46%0.92990.17%0.784
SVM95.23%0.91891.85%0.816
FDR585, R710KNN96.81%0.93194.15%0.865
RF100.00%195.60%0.912
SVM98.56%0.94896.20%0.925
SNVR645, R690KNN96.51%0.92692.10%0.851
RF100.00%193.90%0.875
SVM98.68%0.96194.50%0.889
3SVR741, R967KNN97.47%0.94695.44%0.908
RF100.00%196.15%0.922
SVM98.94%0.97196.97%0.931
Disclaimer/Publisher’s Note: The statements, opinions and data contained in all publications are solely those of the individual author(s) and contributor(s) and not of MDPI and/or the editor(s). MDPI and/or the editor(s) disclaim responsibility for any injury to people or property resulting from any ideas, methods, instructions or products referred to in the content.

