
UAV Low-Altitude Remote Sensing Inspection System Using a Small Target Detection Network for Helmet Wear Detection


Department of Civil Engineering, Kyungpook National University, Daegu 41566, Republic of Korea
*
Author to whom correspondence should be addressed.
Remote Sens. 2023, 15(1), 196; https://doi.org/10.3390/rs15010196
Submission received: 29 November 2022
/
Revised: 20 December 2022
/
Accepted: 27 December 2022
/
Published: 30 December 2022
(This article belongs to the Section AI Remote Sensing)
Abstract
:Automated construction site supervision systems are critical for reducing accident risks. We propose a helmet detection system with low-altitude remote sensing by UAVs in this paper to automate the detection of helmet-wearing workers to overcome the limitations of most detection efforts that rely on ground surveillance cameras and improve the efficiency of safety supervision. The proposed system has the following key aspects. (1) We proposed an approach for speedy automatic helmet detection at construction sites regularly leveraging the flexibility and mobility of UAVs. (2) A single-stage high-precision attention-weighted fusion network is proposed, allowing the detection AP of small-sized targets to be enhanced to 88.7%, considerably improving the network’s detection performance for small-sized targets. (3) Our proposed method can accurately categorize helmets based on whether they are worn or not and the type of helmet color, with an mAP of 92.87% and maximum detection accuracy in each category.
1. Introduction
Recently, the use of unmanned aerial vehicle (UAV) remote sensing has had a wealth of applications in the civil sector, including monitoring climate change [1,2], assisting in search and rescue operations [3,4], and maintenance in the construction industry [5,6]. Among them, UAV remote sensing is developing rapidly in the construction industry, such as aerial mapping for planning of construction projects [7,8], assisting in site logistics and transportation [9,10], and checking the safety of building structures [11,12]. However, more technologies are needed for the protective supervision of construction workers.
In recent years, the construction industry has had the highest accident rate and worker mortality rate compared to other sectors [13], a condition mainly caused by workers not wearing helmets and the difficulty and high cost of relying solely on manual inspections and supervision [14,15]. Therefore, achieving automated construction supervision is crucial to reduce accident rates.
Early real-time monitoring of construction sites was performed mainly by cameras at fixed points on the site ground and manual tracking to determine whether safety violations occurred, such as the absence of wearing helmets [16,17]. While this reduced some inspection costs, it was very time-consuming and subjected to human error. Subsequently, many studies applied traditional computer vision techniques to detect workers’ helmets [18,19], making the operation automated. Still, it is challenging to extend to practical use due to the cost and accuracy of traditional algorithms.
With the development of deep learning models, object detection based on convolutional neural networks (CNN) has gradually replaced the traditional algorithm of manually designed feature algorithms. It has also driven the process of construction supervision automation. Currently, the more mature intelligent construction site solutions on the market are based on deep learning methods to establish monitoring systems with cameras erected on the ground, which must use the existing or specially installed surveillance cameras on the site to obtain data. For example, Long et al. [20] proposed a helmet detection method based on YOLOv5 to improve the efficiency of helmet-wearing detection. Dai et al. [21] proposed a lightweight model based on a single-shot multi-box detector (SDD) by compressing the network’s structure to meet the task requirement of detecting whether a helmet is worn in real time. On the other hand, Han et al. [22] introduced a double attention mechanism based on the structure of SSD to improve the average accuracy of helmet detection. However, such detection methods have certain limitations, which exist in three main aspects.
- Firstly, most of the helmet-wearing detection work relies on ground-mounted surveillance cameras. However, such a method has many limitations, including fixed camera view, limited set-up density, installation location restricted by the site environment, and wired power supply and data transmission. Therefore, it is challenging to automate supervision on construction sites.
- Secondly, we believe that it is also necessary to identify the specific color of the helmet, such as red, blue, white, or yellow, when it comes to intelligent supervision and detection. This is because although helmet colors represent different meanings in different regions, it is common to use them to distinguish, for example, the skilled trades of workers, managers, and supervisors. This is necessary to supervise whether a specific group of people is in the corresponding area during construction. However, most of the proposed methods in this work only detect whether workers wear helmets [23,24,25,26,27,28]. Even though a small number of studies classify helmet colors in more detail [29,30], it is essential to improve the accuracy of the color classification of helmets, limited by the performance of their proposed models.
- In addition, due to the limitations of ground surveillance, workers who are further away appear smaller in size in the images, and most of the recognition algorithms proposed in the state-of-the-art work cannot directly meet the needs of this type of detection.
Therefore, applying this helmet detection task to practical automated site supervision is challenging, considering these limitations. In this paper, we propose a detection system for UAV low-altitude remote sensing with the process operation shown in Figure 1, aiming at automatic and adequate supervision and detection of helmeted workers, with the following main contributions:
- This paper proposes a novel scheme for inspecting construction sites with UAVs. The flexible maneuverability of UAVs will be used to perform fast and efficient helmet-wearing inspections periodically on construction sites. We validate the system in real construction sites using the deep learning model proposed in this paper.
- For UAV remote sensing images, our proposed single-stage end-to-end helmet detection network is based on the highest accuracy Swin Transformer module as the backbone network, which ensures efficient feature extraction. At the same time, the model complexity is low, and we propose an attention-weighted fusion network so that a deeper network with more powerful semantic information can improve the efficiency of the network for small target detection.
- The experimental results show that our proposed method can accurately classify the actual construction site in the patrol according to whether or not wearing helmet and helmet color type and reach the mAP of 92.87% on the open-source dataset GDUT-Hardhat Wearing Detection (GDUT-HWD) and improved the AP to 88.7% for small-size target detection.
2. Materials and Methods
2.1. UAV Inspection Program
The experimental site is located in Daegu, Korea, the construction site (35° N 128° E) of the Kyungpook University Dormitory Project (Phase 3), as shown in Figure 2a. The construction site covers an area of 15,962 m2. As shown in Figure 2b, a DJI Avata UAV was used to conduct a remote sensing inspection at the site. The inspection path was selected from the workers’ activity area, as shown in Figure 2c. The UAV path interval during the inspection was 10 m.
Figure 3 shows the UAV’s image data acquisition attitude, while Table 1 shows the detailed aerial photography parameters. This UAV was selected as small, lightweight, equipped with wing protection, and simple operation. During construction site inspections, it poses minimal hazards to workers. The paper discusses different scales of helmet detection using different flight altitudes relative to the target’s location.
2.2. Helmet Detection Network for UAV Inspection Systems
The proposed helmet-wearing detection network consists of three main steps, as shown in Figure 4: backbone feature extraction network based on Swin Transformer module attention-weighted fusion network and decoupled headers.
In Step 1, the Swin Transformer is used as the basic module of the backbone feature extraction network to provide efficient feature extraction capability. In Step 2, the proposed attention-weighted fusion network is utilized to enrich the feature diversity and give the deep network more powerful semantic information to improve the network’s overall efficiency for small target detection. In Step 3, using the K-means clustering method, the sample points close to a cluster center are grouped into that cluster center. Then, the most suitable size of prior boxes can be configured according to different output feature layers, which can shorten the adjustment time of prior boxes in the prediction process and accelerate the convergence speed of the network.
2.2.1. Design of Backbone Network (Step 1)
For helmet detection using UAV images, ensuring high accuracy is one of the main focuses of the research. Since the feature richness depends on the backbone network’s performance, selecting a high-precision backbone network is crucial. Among them, Swin Transformer achieves the best results on most datasets, so we utilized its hierarchical feature extraction structure to construct a backbone network with the ability of multi-scale segmentation while ensuring high efficiency.
Precisely, each module of the backbone network consists of a bottleneck structure based on windows multi-head self-attention (W-MSA) [31] and shifted windows multi-head self-attention (SW-MSA) [32] in series, i.e., the self-attention module shown in Figure 5.
The W-MSA module divides the feature map into windows. Compared to the MSA structure, there is a significant saving in the number of parameters and model complexity. In addition, SW-MSA makes it possible to interact between windows as a global self-attentive operation to improve the limitation that W-MSA only performs self-attentive computation within each window. In contrast, information transfer between windows is not possible. Such a tandem module based on W-MSA and SW-MSA to serve as the backbone network’s core can enable information transfer in adjacent windows and reduce computational costs.
First, the image serves as an input to the patch partition module as shown in Figure 6 for chunking, i.e., every 4 × 4 adjacent pixel is a patch, and then it is flattened in the channel direction so that each patch has 16 pixels. Additionally, each pixel has three values of R, G, and B. Therefore, the input image of shape (640, 640, 3) is flattened to the image shape (160, 160, 48), and the linear embedding layer adjusts the number of channels of each pixel to 128, and the self-attentive module obtains block 1 of the shape (160, 160, 128).
A patch-merging module first changes the remaining three blocks to change the number of channels in the feature layer, as shown in Figure 7. If the input is a single channel feature map of 4 × 4 size, patch merging will divide every 2 × 2 neighboring pixel into a patch and then stitch the pixels in the same position (same color) in each patch together to get four feature maps. Then, the four feature maps are stitched together in the channel direction and passed through a LayerNorm layer. Finally, the number of channels of the feature map is halved by a linear transformation. With such a downsampling module, feature layers containing three sizes, i.e., block 2, block 3, and block 4, with shapes of (80, 80, 256), (40, 40, 512), and (20, 20, 1024), are obtained. Such multi-scale network modeling is designed to apply to object features due to the angular variations or distances generated during UAV motion.
2.2.2. Attention-Weighted Fusion Network (Step 2)
The task of detecting workers wearing helmets using UAVs inevitably faces the challenge of seeing small objects. According to the definition of target size in the most widely used COCO dataset, a size smaller than 32 × 32 pixel points is a tiny target, a medium target is defined as 32 × 32 to 96 × 96, and a large target is determined as larger than 96 × 96 [33]. In Section 3.1, we give details about the helmet dataset used for the target size in this paper.
The feature layers extracted from the backbone network correspond to different perceptual fields, which do not coincide with the depth of the network and express different levels of abstraction of the features. The deeper feature maps are difficult to learn the feature information of small targets, so fusing the shallower feature maps with the deep feature maps to obtain the integrated feature layer can increase the feature richness of small objects. Still, their perception of location and detailed information worsens as the network deepens. To solve this problem, we propose an attention-weighted fusion network, as shown in Step 2 in Figure 4, which aims to make the network with richer semantic information to improve the efficiency of the network for small target detection. Additionally, to let the network weigh the important information part, we impose the improved attention mechanism on the integrated feature layers conv_3, conv_4, and conv_5.
In our previous work on helmet detection, the spatial attention module of the lightweight residual convolutional attention network (LRCA-Net) [34] was improved to obtain LRCA-Netv2 [35], which aims to synthesize global features more effectively while not being limited to local information. However, we found that there was still a need for improvement by analyzing the channel attention module part of LRCA-Netv2, as shown in Figure 8.
The operation process is shown in Figure 8. The input feature F first goes through a global average pooling (GAP) and then is convolved by 1D of size k to achieve local cross-channel interaction coverage improvement, where the convolution kernel size k represents the coverage of local cross-channel interactions. The number of parameters is also significantly reduced compared to linear mapping.
However, the simple GAP is likely to produce channels with the same mean even though they have different feature information appear with the same mean. Even though GAP is simple and efficient, it undeniably suppresses the diversity among channels. To solve this problem, we propose an improved channel attention module, as shown in Figure 9.
The improvement process revolves around GAP, which, as a data compression method, belongs to a frequency band of the discrete cosine transform (DCT) [36]. The DCT transform itself is lossless and can convert the signal of the channel to the frequency domain, which is a kind of unfolding related to the Fourier transform. The 2D-DCT is shown as in Equation (1), and GAP is a component of the 2D-DCT when h and w are both 0.
where x represents the input, H is the height of x, and W is the width of x. n is the number of DCTs.
GAP was the only component considered before improvement. Such processing reduces the feature richness, so we split the input channel into n parts, as shown in Split in Figure 9. Each part is combined and compressed (dotted multiplication) using the corresponding basis function DCTn to obtain each weight component. The splicing replaces the previous method using only GAP, as shown in Equation (2).
where [,] represents the concatenate operation, Ac represents the channel attention module, and σ represents the sigmoid function.
Therefore, using the new channel attention instead of the previous module, the overall structure of the improved LRCA-Netv3 can be obtained, as shown in Figure 10.
When the weighted summation of inputs is performed using 2D-DCTs, the essential functions of these 2D-DCTs are composed of pre-designed horizontal and vertical cosine waves, so no additional parameters are added. Such a design can avoid the limitations of GAP and preserve the maximum diversity in the initial stage of feature map compression.
2.2.3. Decoupled Headers (Step 3)
The decoupled headers are configured according to the three different sizes of the output feature layers in Step 2 using an anchor-based approach to make the final output target’s classification and edge positions. A total of nine prior boxes are set for the three output feature layers, i.e., each feature layer has three prior boxes of different sizes for adjustment during prediction. The dimensions of the anchor boxes are calculated from the results of the K-means cluster analysis dataset, as shown in Figure 11, where the masks of the anchor boxes are shown in Table 2.
Such a decoupling head can make its shape closer to the actual anchor box in the dataset, shorten the adjustment time of the box during prediction, speed up network convergence, and improve network accuracy.
2.3. Experiments
2.3.1. Dataset and Experimental Environment
Based on the GDUT-HWD dataset [37], this paper evaluates the proposed UAV helmet detection network. There are a variety of scenes in the dataset, such as visual range, illumination, worker pose, and cover. Annotated images consist of 3174 instances, each annotated with class labels and bounding boxes. We randomly divided the training and validation sets into 2857 and 317 images in a 9:1 ratio. In our experiments, a total of five classes (containing four helmet colors and the class without helmet wear) with a total of three sizes were selected as detection objects to discuss the efficiency of the proposed method for detecting helmet wear with different colors and sizes. Figure 12 shows the percentage of ground truth for each object in the dataset. Figure 12b defines the target size as small for sizes smaller than 32 × 32 pixels points, medium is defined as 32 × 32 to 96 × 96, and large is determined as larger than 96 × 96, with small size targets accounting for the largest percentage.
Table 3 shows the experimental setup used in this paper. Pytorch 1.9.0 was used to construct the experiment, and CUDA kernels were used to compute the results. The hardware consisted mainly of a high-performance workstation host. Intel(R) Core (TM) i5-11400F processor and RTX 3050 graphics card powered the workstation.
2.3.2. Evaluation Index and Hyperparameter Setting
This paper introduces the average accuracy (AP) in Equation (6), the mean average precision (mAP) in Equation (7), and the F1 score in Equation (5). The larger the value of these metrics, the higher the agreement of the prediction results with the ground truth.
The AP is calculated using the difference–average precision metric, the area under the precision–recall curve. The equations for precision and recall are shown in Equations (3) and (4).
where T/F denotes true/false, which indicates whether the prediction is correct, and P/N represents positive/negative, which means a positive or negative prediction result.
where n denotes the number of detection points, and Pinterop (r) represents the value of the accuracy at a recall of r.
The hyperparameters set in the training process are shown in Table 4, where the input image size is 640 × 640, the batch size is 8, the training period is 500 epochs, the maximum learning rate is 0.01, and the minimum learning rate is 0.0001. The learning rate descent method is cosine annealing [38], the loss function is CIoU [39], and the augmentation methods are mosaic and mix-up.
3. Results
3.1. Comparison of Model Training
To validate the effectiveness of our proposed network, the effects of different module combinations on the results and comparisons between other models are further discussed in the ablation experiments. As a fair comparison, in the ablation experiments, the required dataset for training, the relevant hyperparameters, the training strategy, and the experimental environment are all the same except for the added module parameters.
Figure 13 shows the trend in the loss function and mAP for each model when trained after 500 epochs. In Figure 13a, it can be seen that the loss function of the proposed method in this paper decreased and reached convergence, which justifies the network. On the other hand, in Figure 13b, the mAP of almost all networks rose with the iterative training of the network, and our method could quickly rise to the highest value within 100 epochs and was much higher than that of all other methods. It is worth noting that the mAP in Figure 13b was obtained from the validation set, and the parameters set to speed up the evaluation were conservative to visualize the change in mAP during training. The actual mAP of each model is shown in Table 5.
3.2. Comparison of Attention Modules
As shown in Table 5, the baseline represents only 84.07% of mAP when only the backbone network was used to extract features and output results without adding any modules. After adding the attention-weighted fusion network, the results improved to 89.14%. In addition, to discuss the performance of our proposed attention mechanism LRCA-Netv3, we selected four representative attention mechanisms and configured them separately in Step 2 of the network.
Figure 14 depicts a visual heat map of the network with and without LRCAv3, where the LRCAv3 module is configured at Attention 1, Attention 2, and Attention 3, shown in Figure 4, with the size of each channel being 20 × 20, 40 × 40, and 80 × 80, respectively. Because of the small size of the helmet in the UAV photos, detecting the target in the feature layer with a spatial dimension of 20 × 20 was difficult, as shown in Figure 14b. After configuring LRCAv3, the high brightness of the target detected by each size feature layer increased, especially the high brightness of the feature layer with a spatial dimension of 80 × 80 which increased significantly. This indicates that the network is more interested in small-sized targets after step-type feature fusion and attention weighting.
3.3. Comparison of Model Performance
We compare the detection network proposed in this paper with the widely used object detection algorithms SSD [43], Faster-RCNN [44], Yolov5, YolovX [45], and EfficientDet [46]. The quantitative experimental results using the same dataset and model training methods are shown in Table 6, and Figure 15 shows each model’s precision × recall curves for each object class detection.
The discussion of the mAP trends shown in Figure 16a shows that the accuracy of each model improved as the network structure became more complex. With low complexity, our method achieved the highest accuracy for each category. mAP improved by 10.5% and 9.4% concerning YOLOv5-L and YOLOX-L, respectively, and although our approach was slightly more complex, it is a worthwhile investment for such a substantial improvement. In addition, Figure 16b also shows the superiority of the proposed method for small-size target detection. Although it did not exceed YOLOX-L, the AP reached 92.88% and 96.74% for medium and large-size object detection, which is sufficient for practical detection. When facing the challenge of small-size target detection, our method achieved 88.7% AP, the highest among the compared methods. This indicates that Step 2 in our approach improved the detection performance of small targets through the aggregation of multi-level features and attention weighting.
3.4. Visualization of UAV Inspections
Finally, evaluate the proposed method’s performance outside the training dataset during actual UAV inspections. Images with a resolution of 3840 × 2160 and heights of 5 m, 10 m, and 15 m relative to the target were detected for the experimental site. Using the non-maximum suppression method and setting the IOU above 0.5 to remove the redundant bounding boxes, the video processing speed could reach about 12 fps. The visualization results in Figure 17 show the comparison of the performance of each model based on the UAV images. In Figure 18, the detection effectiveness of the proposed method is demonstrated for small-sized helmet targets taken at different heights.
4. Discussion
The helmet detection system with low-altitude remote sensing by UAV proposed in this paper is inspired by the difficulties of implementing automation in practical construction supervision. Firstly, helmet detection is limited by the site environment, such as fixed camera view, limited setup density, installation location, wired power supply, and data transmission. Secondly, although most jobs can automatically detect whether workers are wearing helmets, and a small number of jobs can classify the color of helmets in more detail, it is essential to improve the accuracy of the color classification of helmets, limited by the performance of their proposed models. Finally, when the height of the UAV changes, the size of the worker’s helmet in the image is relatively small, and most recognition algorithms struggle to meet the needs of such small target detection.
The training experiments of the model prove that the loss function of the method proposed in this paper can drop quickly and reach convergence. Its mAP rises rapidly with the iterative training of the network, which intuitively reflects the reasonableness of the model and its excellent performance.
As can be seen by the ablation experiments of the attention module, compared to the channel attention SENet and ECA-Net, the accuracy is improved by 3.3% and 3.1%, respectively, because LRCA-Netv3 combines channel and spatial attention. Compared with CBAM, which also integrates channel and spatial attention, our method can incorporate global information in the spatial attention approach. In addition, the improved method uses 2D DCTs in different frequency domains to weigh each channel segment, which can better maintain the diversity of initial features compared to GAP. The accuracy is improved compared to the previous generation without more computational cost.
Comparing the experimental results of each model, we can see that with low complexity, our method achieves the highest accuracy for each category. mAP improves by 10.5% and 9.4% concerning YOLOv5-L and YOLOX-L, respectively, and although our approach is slightly more complex, it is a worthwhile investment for such a substantial improvement. In addition, Figure 16b also shows the superiority of the proposed method for small-size target detection. Although it does not exceed YOLOX-L, the AP reaches 92.88% and 96.74% for medium and large-size object detection, which is sufficient for practical detection. When facing the challenge of small-size target detection, our method achieves 88.7% AP, the highest among the compared methods. This indicates that Step 2 in our approach improves the detection performance of small targets by aggregation of multi-level features and attention weighting.
Finally, by discussing the results of experiments conducted at construction sites, our approach has a more comprehensive detection capability for small helmet targets than other models. However, it is easy to find that the detection effect gradually decreases with the increase in the UAV height, and the phenomenon of missed and false detection occurs. The main reason is the variation in workers’ postures and insufficient samples of high-altitude views in the dataset used for training. Considering this limitation, improving the sample richness of the dataset and the development of detection datasets for multiple targets at construction sites applied to UAVs became one of the subsequent research directions. In addition, the DJI Avata UAV used in our approach has a flight speed of 8 m/s in normal mode and an endurance of only 15 min. If the program needs to be extended to a larger-scale construction site, it may be difficult due to the endurance of the UAV. In addition, the UAV’s fast flight and high noise level will distract the workers and cause safety problems when traveling over the construction site.
5. Conclusions
Improving construction site worker safety is a must for establishing intelligent sites. This paper suggests a helmet detection system with low-altitude remote sensing by UAVs, aiming to automatically detect helmeted workers to overcome the limitation that most detection work relies on the limits of ground-mounted surveillance cameras and improves the effectiveness of intelligent safety supervision. The main contributions of this study include (1) a novel scheme for inspecting construction sites with UAVs, which utilizes the flexibility and mobility of UAVs to perform rapid and automatic helmet-wearing inspections on construction sites at regular intervals. (2) A single-stage end-to-end helmet detection network is proposed, based on a high-precision Swin Transformer module as the backbone network. It utilizes an attention-weighted fusion network to substantially improve the detection performance of the network for small-sized targets. (3) The proposed method can accurately classify helmets based on whether they are worn and the type of helmet color, and the detection accuracy of each category is ahead of other methods. Overall, this work provides a new idea for automated field supervision. In the future, it is necessary to further enrich the diversity of detection targets and environments and to explore the integration of detection tasks with tracking and alerting technologies.
Author Contributions
Conceptualization, H.L. and S.S.; methodology, H.L.; software, H.L.; writing—original draft preparation, H.L.; writing—review and editing, S.S.; visualization, H.L.; supervision, S.S.; project administration, S.S.; funding acquisition, S.S. All authors have read and agreed to the published version of the manuscript.
Funding
This research was supported by Basic Science Research Program through the National Research Foundation of Korea (NRF) funded by the Ministry of Education (2016R1D1A1B02011625).
Institutional Review Board Statement
Not applicable.
Informed Consent Statement
Not applicable.
Data Availability Statement
Not applicable.
Conflicts of Interest
The authors declare no conflict of interest.
References
- Roldán, J.J.; Joossen, G.; Sanz, D.; Del Cerro, J.; Barrientos, A. Mini-UAV based sensory system for measuring environmental variables in greenhouses. Sensors 2015, 15, 3334–3350. [Google Scholar] [CrossRef] [PubMed] [Green Version]
- Gomez, C.; Purdie, H. UAV-based Photogrammetry and Geocomputing for Hazards and Disaster Risk Monitoring—A Review. Geoenviron. Disasters 2016, 3, 23. [Google Scholar] [CrossRef] [Green Version]
- Karaca, Y.; Cicek, M.; Tatli, O.; Sahin, A.; Pasli, S.; Beser, M.F.; Turedi, S. The potential use of unmanned aircraft systems (drones) in mountain search and rescue operations. Am. J. Emerg. Med. 2018, 36, 583–588. [Google Scholar] [CrossRef] [PubMed]
- Burke, C.; McWhirter, P.R.; Veitch-Michaelis, J.; McAree, O.; Pointon, H.A.; Wich, S.; Longmore, S. Requirements and limitations of thermal drones for effective search and rescue in marine and coastal areas. Drones 2019, 3, 78. [Google Scholar] [CrossRef] [Green Version]
- Oudjehane, A.; Baker, T.; Moeini, S. The role and value of integrating AI, drones and associate technologies in construction projects. In Proceedings of the Canadian Society for Civil Engineering Annual Conference, Laval (Greater Montreal), QC, Canada, 12–15 June 2019. [Google Scholar]
- Falorca, J.F.; Miraldes, J.P.N.D.; Lanzinha, J.C.G. New trends in visual inspection of buildings and structures: Study for the use of drones. Open Eng. 2021, 11, 734–743. [Google Scholar] [CrossRef]
- Martinez, J.G.; Gheisari, M.; Alarcón, L.F. UAV integration in current construction safety planning and monitoring processes: Case study of a high-rise building construction project in Chile. J. Manag. Eng. 2020, 36, 05020005. [Google Scholar] [CrossRef]
- Jiang, W.; Zhou, Y.; Ding, L.; Zhou, C.; Ning, X. UAV-based 3D reconstruction for hoist site mapping and layout planning in petrochemical construction. Autom. Constr. 2020, 113, 103137. [Google Scholar] [CrossRef]
- Elghaish, F.; Matarneh, S.; Talebi, S.; Kagioglou, M.; Hosseini, M.R.; Abrishami, S. Toward digitalization in the construction industry with immersive and drones technologies: A critical literature review. Smart Sustain. Built Environ. 2020, 10, 345–363. [Google Scholar] [CrossRef]
- Li, Y.; Liu, C. Applications of multirotor drone technologies in construction management. Int. J. Constr. Manag. 2018, 19, 401–412. [Google Scholar] [CrossRef]
- Liu, J.; Jennesse, M., Jr.; Holley, P. Utilizing light unmanned aerial vehicles for the inspection of curtain walls: A case study. In Proceedings of the Construction Research Congress 2016, San Juan, Puerto Rico, 31 May–2 June 2016; pp. 2651–2659. [Google Scholar]
- Choi, S.-S.; Kim, E.-K.; Sung-Suk, C. Design and implementation of vision-based structural safety inspection system using small unmanned aircraft. In Proceedings of the 2015 17th International Conference on Advanced Communication Technology (ICACT), Pyeongchang, Republic of Korea, 1–3 July 2015; pp. 562–567. [Google Scholar] [CrossRef]
- Qi, J.; Issa, R.R.A.; Hinze, J.; Olbina, S. Integration of safety in design through the use of building information modeling. In Proceedings of the International Workshop on Computing in Civil Engineering 2011, Miami, FL, USA, 19–22 June 2011; pp. 698–705. [Google Scholar] [CrossRef]
- Suderman, B.L.; Hoover, R.W.; Ching, R.P.; Scher, I.S. The effect of hardhats on head and neck response to vertical impacts from large construction objects. Accid. Anal. Prev. 2014, 73, 116–124. [Google Scholar] [CrossRef]
- Liang, H.; Zhang, S.; Su, Y. The structure and emerging trends of construction safety management research: A bibliometric review. Int. J. Occup. Saf. Ergon. 2018, 26, 469–488. [Google Scholar] [CrossRef] [PubMed]
- Irizarry, J.; Gheisari, M.; Walker, B.N. Usability assessment of drone technology as safety inspection tools. J. Inf. Technol. Constr. 2012, 17, 194–212. [Google Scholar]
- Patrick, O.O.; Nnadi, E.O.; Ajaelu, H.C. Effective use of quadcopter drones for safety and security monitoring in a building construction sites: Case study Enugu Metropolis Nigeria. J. Eng. Technol. Res. 2020, 12, 37–46. [Google Scholar]
- Rubaiyat, A.H.; Toma, T.T.; Kalantari-Khandani, M.; Rahman, S.A.; Chen, L.; Ye, Y.; Pan, C.S. Automatic detection of helmet uses for construction safety. In Proceedings of the 2016 IEEE/WIC/ACM International Conference on Web Intelligence Workshops (WIW), Omaha, NE, USA, 13–16 October 2016; pp. 135–142. [Google Scholar]
- Jin, M.; Zhang, J.; Chen, X.; Wang, Q.; Lu, B.; Zhou, W.; Nie, G.; Wang, X. Safety helmet detection algorithm based on color and hog features. In Proceedings of the 2020 IEEE 19th International Conference on Cognitive Informatics and Cognitive Computing (ICCI*CC), Beijing, China, 26–28 September 2020; pp. 215–219. [Google Scholar]
- Long, X.; Cui, W.; Zheng, Z. Safety helmet wearing detection based on deep learning. In Proceedings of the 2019 IEEE 3rd Information Technology, Networking, Electronic and Automation Control Conference (ITNEC), Chengdu, China, 15–17 March 2019; pp. 2495–2499. [Google Scholar]
- Dai, B.; Nie, Y.; Cui, W.; Liu, R.; Zheng, Z. Real-time safety helmet detection system based on improved SSD. In Proceedings of the 2nd International Conference on Artificial Intelligence and Advanced Manufacture, Manchester, UK, 15–17 October 2020; pp. 95–99. [Google Scholar]
- Han, G.; Zhu, M.; Zhao, X.; Gao, H. Method based on the cross-layer attention mechanism and multiscale perception for safety helmet-wearing detection. Comput. Electr. Eng. 2021, 95, 107458. [Google Scholar] [CrossRef]
- Deng, L.; Li, H.; Liu, H.; Gu, J. A lightweight YOLOv3 algorithm used for safety helmet detection. Sci. Rep. 2022, 12, 10981. [Google Scholar] [CrossRef]
- Hayat, A.; Morgado-Dias, F. Deep learning-based automatic safety helmet detection system for construction safety. Appl. Sci. 2022, 12, 8268. [Google Scholar] [CrossRef]
- Sun, C.; Zhang, S.; Qu, P.; Wu, X.; Feng, P.; Tao, Z.; Zhang, J.; Wang, Y. MCA-YOLOV5-Light: A faster, stronger and lighter algorithm for helmet-wearing detection. Appl. Sci. 2022, 12, 9697. [Google Scholar] [CrossRef]
- Zhang, B.; Sun, C.-F.; Fang, S.-Q.; Zhao, Y.-H.; Su, S. Workshop safety helmet wearing detection model based on SCM-YOLO. Sensors 2022, 22, 6702. [Google Scholar] [CrossRef]
- Chen, M.; Kong, R.; Zhu, J.; Wang, L.; Qi, J. Application research of safety helmet detection based on low computing power platform using YOLO v5. In Proceedings of the International Conference on Adaptive and Intelligent Systems, Larnaca, Cyprus, 25–26 May 2022; Springer: Cham, Switzerland, 2022; pp. 107–117. [Google Scholar] [CrossRef]
- Xia, X.; Zhai, J. Study on small target detection of construction site helmet based on YOLOv5. In Proceedings of the Chinese Intelligent Systems Conference, Changsha, China, 10–13 May 2022; Springer: Singapore, 2022; pp. 18–27. [Google Scholar] [CrossRef]
- Tran, V.T.; To, T.S.; Nguyen, T.-N.; Tran, T.D. Safety helmet detection at construction sites using YOLOv5 and YOLOR. In Proceedings of the International Conference on Intelligence of Things, Delft, The Netherlands, 7–10 November 2022; Springer: Cham, Switzerland, 2022; pp. 339–347. [Google Scholar] [CrossRef]
- Zhang, C.; Tian, Z.; Song, J.; Zheng, Y.; Xu, B. Construction worker hardhat-wearing detection based on an improved BiFPN. In Proceedings of the 2020 25th International Conference on Pattern Recognition (ICPR), Milan, Italy, 10–15 January 2021; pp. 8600–8607. [Google Scholar] [CrossRef]
- Vaswani, A.; Shazeer, N.; Parmar, N.; Uszkoreit, J.; Jones, L.; Gomez, A.N.; Kaiser, L.; Polosukhin, I. Attention is all you need. In Proceedings of the Annual Conference on Neural Information Processing Systems, Long Beach, CA, USA, 4–9 December 2017. [Google Scholar]
- Liu, Z.; Lin, Y.; Cao, Y.; Hu, H.; Wei, Y.; Zhang, Z.; Lin, S.; Guo, B. Swin transformer: Hierarchical vision transformer using shifted windows. In Proceedings of the IEEE/CVF International Conference on Computer Vision, Montreal, BC, Canada, 11–17 October 2021; pp. 10012–10022. [Google Scholar]
- Lin, T.Y.; Maire, M.; Belongie, S.; Hays, J.; Perona, P.; Ramanan, D.; Dollár, P.; Zitnick, C.L. Microsoft coco: Common objects in context. In Proceedings of the European Conference on Computer Vision, Zurich, Switzerland, 6–12 September 2014; Springer: Cham, Switzerland, 2014; pp. 740–755. [Google Scholar]
- Liang, H.; Seo, S. Lightweight deep learning for road environment recognition. Appl. Sci. 2022, 12, 3168. [Google Scholar] [CrossRef]
- Liang, H.; Seo, S. Automatic detection of construction workers’ helmet wear based on lightweight deep learning. Appl. Sci. 2022, 12, 10369. [Google Scholar] [CrossRef]
- Qin, Z.; Zhang, P.; Wu, F.; Li, X. FCANet: Frequency channel attention networks. In Proceedings of the IEEE/CVF International Conference on Computer Vision, Montreal, BC, Canada, 11–17 October 2021. [Google Scholar]
- Wu, J.; Cai, N.; Chen, W.; Wang, H.; Wang, G. Automatic detection of hardhats worn by construction personnel: A deep learning approach and benchmark dataset. Autom. Constr. 2019, 106, 102894. [Google Scholar] [CrossRef]
- Loshchilov, I.; Hutter, F. Sgdr: Stochastic gradient descent with warm restarts. arXiv 2016, arXiv:1608.03983. [Google Scholar]
- Zheng, Z.; Wang, P.; Liu, W.; Li, J.; Ye, R.; Ren, D. Distance-IoU loss: Faster and better learning for bounding box regression. In Proceedings of the AAAI Conference on Artificial Intelligence, New York, NY, USA, 7–12 February 2020; Volume 34, pp. 12993–13000. [Google Scholar]
- Hu, J.; Shen, L.; Sun, G. Squeeze-and-excitation networks. In Proceedings of the IEEE Conference on Computer Vision and Pattern Recognition, Salt Lake City, UT, USA, 18–23 June 2018; pp. 7132–7141. [Google Scholar]
- Wang, Q.; Wu, B.; Zhu, P.; Li, P.; Zuo, W.; Hu, Q. ECA-Net: Efficient channel attention for deep convolutional neural networks. In Proceedings of the 2020 IEEE/CVF Conference on Computer Vision and Pattern Recognition (CVPR), Seattle, WA, USA, 13–19 June 2020. [Google Scholar] [CrossRef]
- Woo, S.; Park, J.; Lee, J.Y.; Kweon, I.S. CBAM: Convolutional block attention module. In Proceedings of the European Conference on Computer Vision (ECCV), Munich, Germany, 8–14 September 2018; pp. 3–19. [Google Scholar]
- Liu, W.; Anguelov, D.; Erhan, D.; Szegedy, C.; Reed, S.; Fu, C.Y.; Berg, A.C. SSD: Single shot multibox detector. In Proceedings of the European Conference on Computer Vision, Amsterdam, The Netherlands, 8–16 October 2016; Springer: Cham, Switzerland, 2016; pp. 21–37. [Google Scholar]
- Ren, S.; He, K.; Girshick, R.; Sun, J. Faster R-CNN: Towards real-time object detection with region proposal networks. IEEE Trans. Pattern Anal. Mach. Intell. 2017, 39, 1137–1149. [Google Scholar] [CrossRef]
- Ge, Z.; Liu, S.; Wang, F.; Li, Z.; Sun, J. YoloX: Exceeding Yolo series in 2021. arXiv 2021, arXiv:2107.08430. [Google Scholar]
- Tan, M.; Pang, R.; Le, Q.V. EfficientDet: Scalable and efficient object detection. In Proceedings of the IEEE/CVF Conference on Computer Vision and Pattern Recognition, Seattle, WA, USA, 13–19 June 2020; pp. 10781–10790. [Google Scholar]
Figure 1.
Flowchart of the proposed UAV low altitude remote sensing construction site patrol inspection system.
Figure 1.
Flowchart of the proposed UAV low altitude remote sensing construction site patrol inspection system.
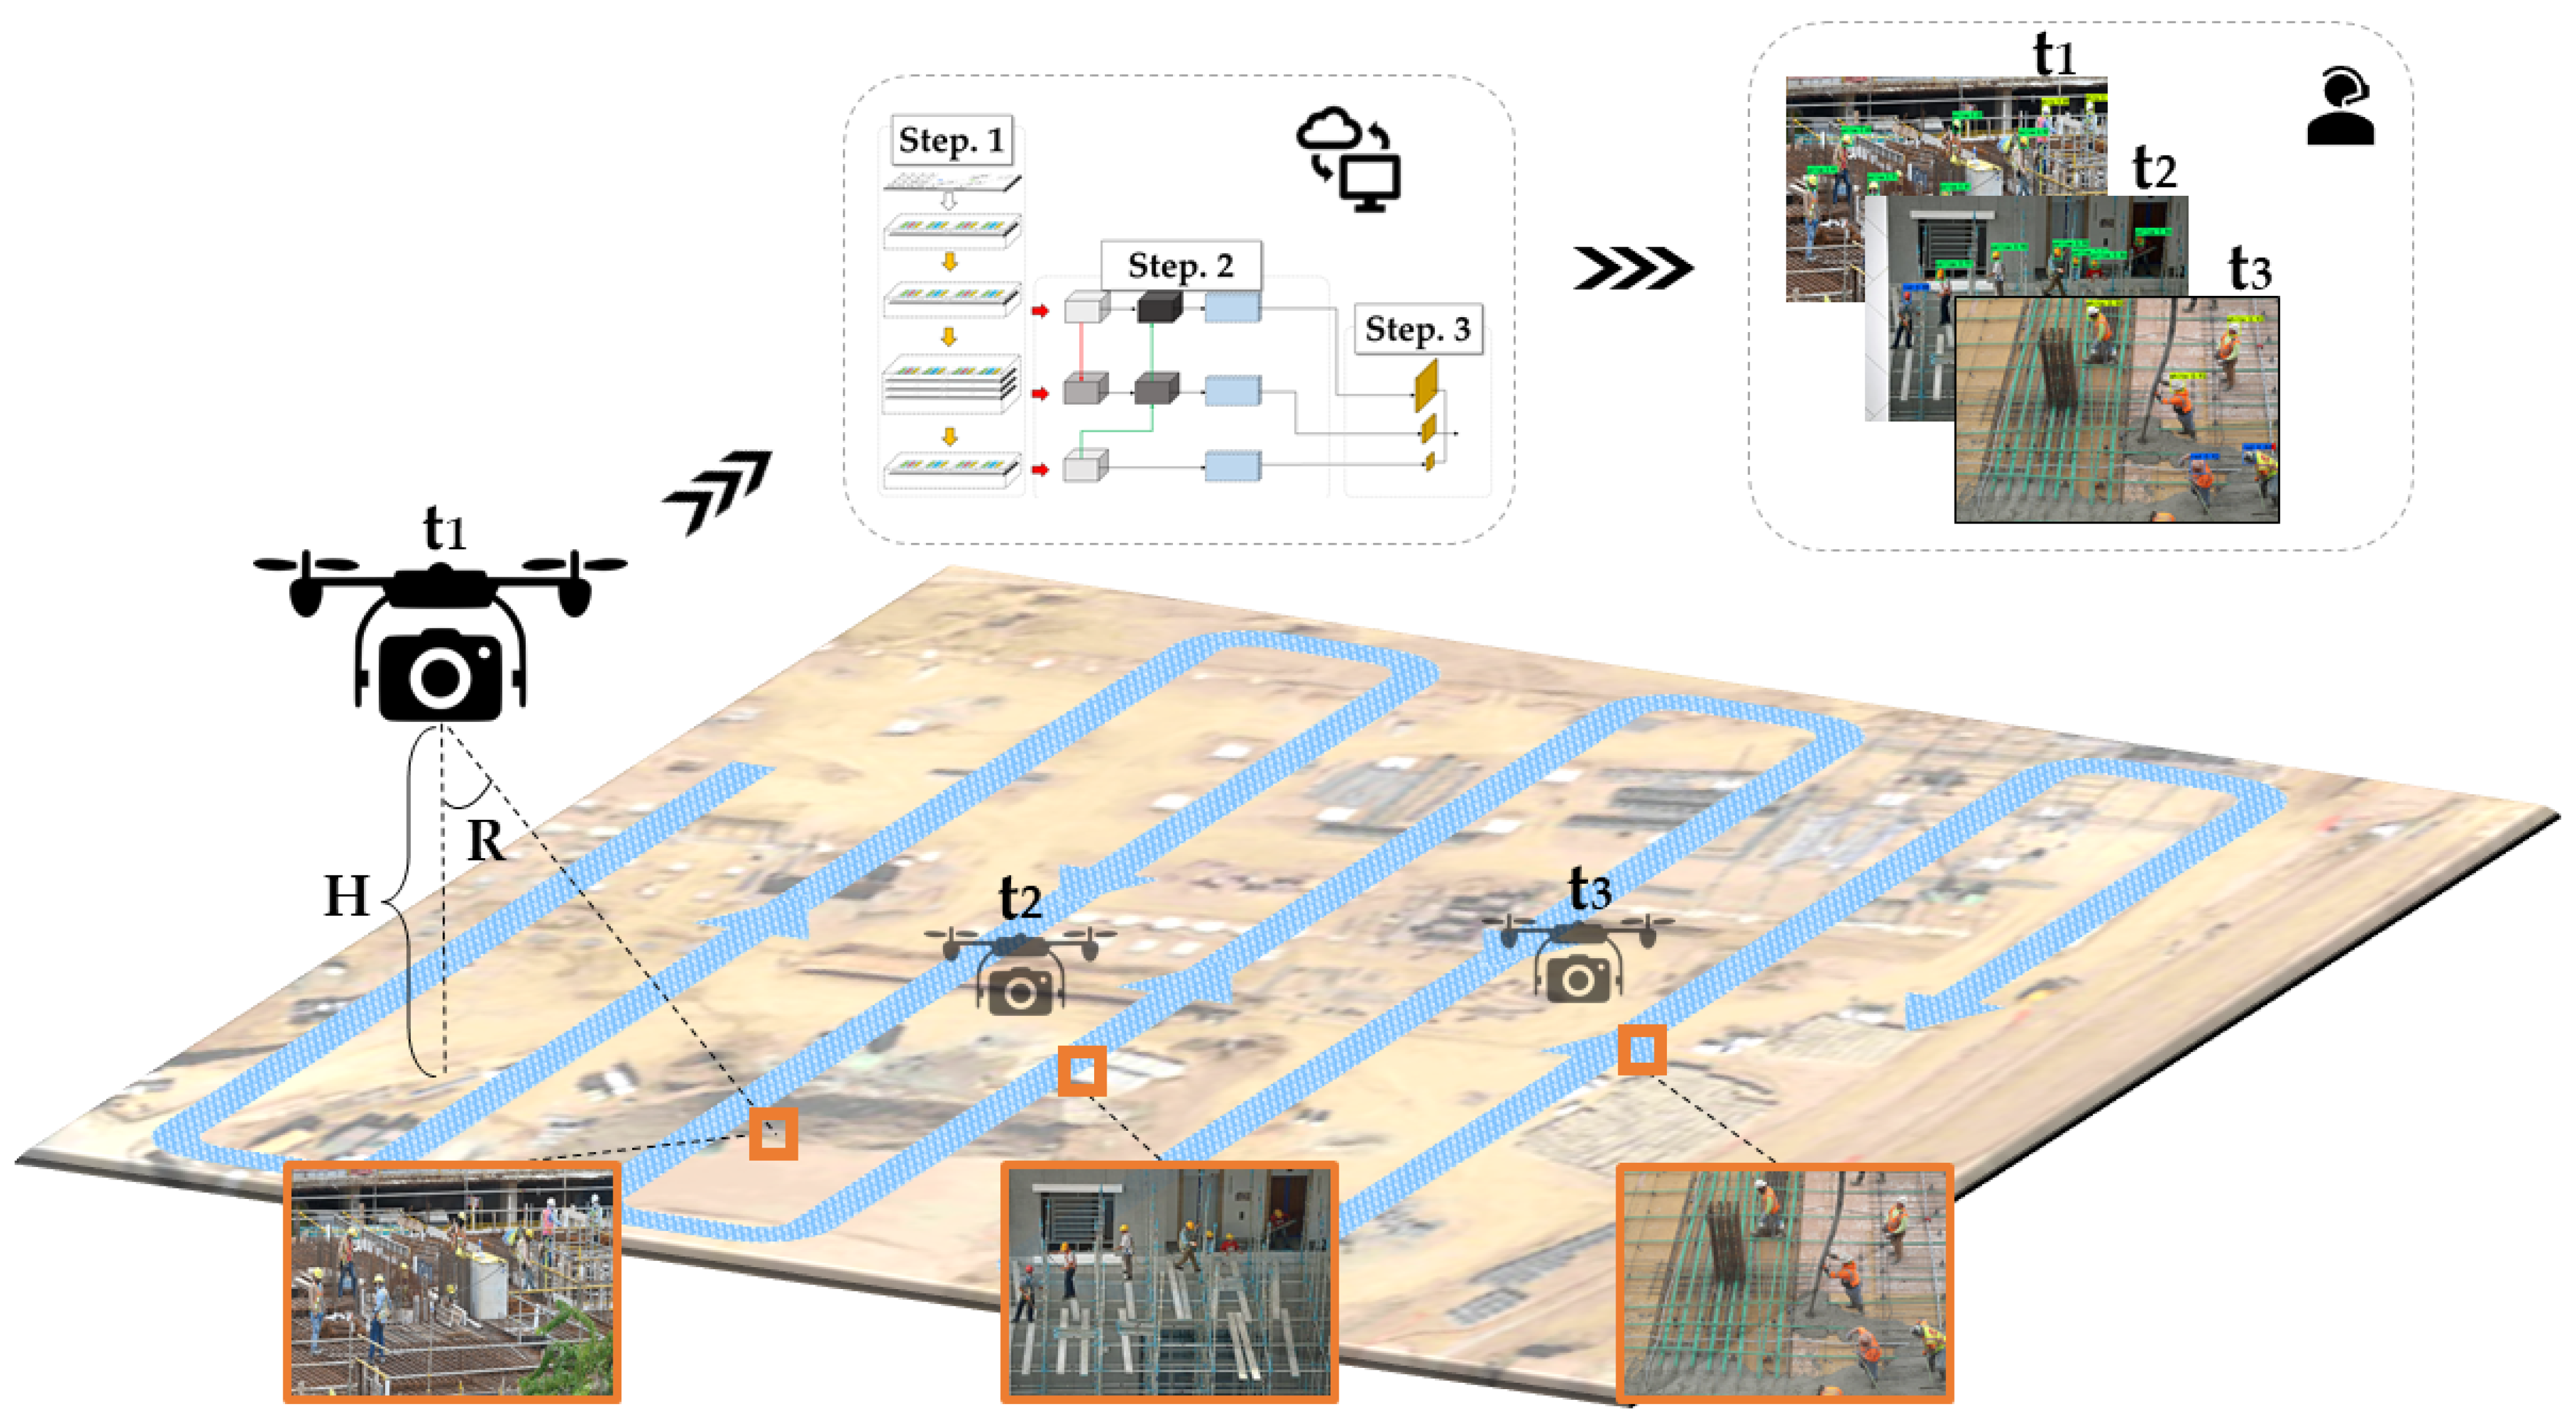
Figure 2.
Experimental sites and data collection. (a) location of the test site, (b) UAV, wearable glasses, and operating stick, (c) an example of the UAV inspection path. (d) Example of UAV data.
Figure 2.
Experimental sites and data collection. (a) location of the test site, (b) UAV, wearable glasses, and operating stick, (c) an example of the UAV inspection path. (d) Example of UAV data.

Figure 3.
UAV body attitude during the inspection.

Figure 4.
The helmet detection network applied to UAV inspection systems consists of three main steps.
Figure 4.
The helmet detection network applied to UAV inspection systems consists of three main steps.

Figure 5.
The basic self-attention module, which constitutes the backbone network, consists of W-MSA and SW-MSA connected in series.
Figure 5.
The basic self-attention module, which constitutes the backbone network, consists of W-MSA and SW-MSA connected in series.

Figure 6.
Example of patch partition module’s processing of input images.

Figure 7.
Example of patch-merging module’s downsampling details for a channel.

Figure 8.
Channel attention module section of LRCA-Netv2.

Figure 9.
Improved channel attention module.

Figure 10.
The overall structure of LRCA-Netv3 using the improved channel attention module.

Figure 11.
The K-means clustering derives the clusters of height and width of the anchor boxes.

Figure 12.
Details of the GDUT-HWD dataset, where (a) is the number of each category as a percentage of ground truth, and (b) is the number of instances of large, medium, and small sizes.
Figure 12.
Details of the GDUT-HWD dataset, where (a) is the number of each category as a percentage of ground truth, and (b) is the number of instances of large, medium, and small sizes.

Figure 13.
Iterative trends of (a) loss function convergence curves and (b) mAP for each model after 500 epochs of training. It should be noted that compared networks use different loss functions.
Figure 13.
Iterative trends of (a) loss function convergence curves and (b) mAP for each model after 500 epochs of training. It should be noted that compared networks use different loss functions.

Figure 14.
The visualized heat map generated by the LRCAv3 proposed in this paper is configured at the Attention locations shown in Figure 4, respectively, where higher colors indicate higher weights given by the network. (a) No Attention module is configured, and (b) LRCAv3 is configured.
Figure 14.
The visualized heat map generated by the LRCAv3 proposed in this paper is configured at the Attention locations shown in Figure 4, respectively, where higher colors indicate higher weights given by the network. (a) No Attention module is configured, and (b) LRCAv3 is configured.

Figure 15.
Precision × recall curves for each target category detection, (a) Blue, (b) Red, (c) White, (d) Yellow, (e) None.
Figure 15.
Precision × recall curves for each target category detection, (a) Blue, (b) Red, (c) White, (d) Yellow, (e) None.

Figure 16.
A comprehensive comparison of the models, (a) G-FLOPs(G) vs. mAP, (b) detection of the small, medium, and large instances, is shown in Table 6 for details.
Figure 16.
A comprehensive comparison of the models, (a) G-FLOPs(G) vs. mAP, (b) detection of the small, medium, and large instances, is shown in Table 6 for details.

Figure 17.
Comparison of each model based on images collected using a UAV with a flight altitude of 15 m. (a) Original image (b) SSD, (c) Faster R-CNN, (d) YOLOX, and (e) Our Approach.
Figure 17.
Comparison of each model based on images collected using a UAV with a flight altitude of 15 m. (a) Original image (b) SSD, (c) Faster R-CNN, (d) YOLOX, and (e) Our Approach.

Figure 18.
A detection example of the proposed method using a non-maximum suppression method and an IOU of 0.5 to remove redundant bounding boxes. The values on the prediction boxes represent confidence levels, and the text describes their categories. These examples cover the detection conditions of the UAV at different altitudes, representing 5 m, 10 m, and 15 m from left to right.


Table 1.
DJI Avata UAV camera and aerial parameters.
| UAV Parameters | Experimental Parameters | ||
|---|---|---|---|
| Takeoff weight | 0.4 kg | Inspection height (H) | 5 m, 10 m, 15 m |
| Dimensions (L × W × H) | 180 × 180 × 80 mm | Shooting angles (R) | 30°~70° |
| Max resolution | 4 K/60 fps | The total duration of a single inspection | 10 min |
| Max video transmission bitrate | 50 Mbps | Inspection cycle (T) | 1.5 h |
| Field of view (FOV) | 155° | Back-and-forth spacing | 10 m |
| Propeller guard | Built-in | Wind speed | 0~3 m/s |
| Communication frequency band | Up to 40 MHz | Flight speed | 8 m/s |
Table 2.
The anchor mask setting parameters are derived from Figure 11.
Table 2.
The anchor mask setting parameters are derived from Figure 11.
| Anchor Layer | Anchor Size (Width, Height) |
|---|---|
| Anchor 1 | (48, 87); (69, 123); (114,202) |
| Anchor 2 | (20, 36); (26, 48); (35, 64) |
| Anchor 3 | (6, 9); (9, 15); (14, 25) |
Table 3.
Workstation mainframe hardware and software.
| Items | Description | |
|---|---|---|
| Hardware | Central Processing Unit | Intel(R) Core (TM) i5-11400F |
| Random Access Memory | 16 GB | |
| Solid State Drive | Samsung SSD 500 GB | |
| Graphics Card | NVIDIA GeForce RTX 3050 | |
| Software | Operating System | Windows 11 Pro, 64 bit |
| Programming Language | Python 3.7 | |
| Learning Framework | Pytorch 1.9.0 | |
Table 4.
The hyperparameters are set during the training of the proposed method.
| Input Settings | Loss Calculation | Data Enhancement | ||||||
|---|---|---|---|---|---|---|---|---|
| Input shape | Batch size | Total Epoch | Loss Function | Max_lr | Min_lr | Decay Type | Mosaic | Mixup |
| 640 × 640 | 8 | 500 | CIoU | 0.01 | 0.0001 | Cosine Annealing | True | True |
Table 5.
Results of ablation experiments using the same dataset, where bold numbers indicate the highest mAP, and “√” in each column indicates that the leftmost component is used in the model. The last number in each column represents the mAP obtained using the corresponding component.
Table 5.
Results of ablation experiments using the same dataset, where bold numbers indicate the highest mAP, and “√” in each column indicates that the leftmost component is used in the model. The last number in each column represents the mAP obtained using the corresponding component.
| Backbone | Baseline | √ | √ | √ | √ | √ | √ |
| Step-scale feature fusion | √ | √ | √ | √ | √ | √ | |
| SENet [40] | √ | ||||||
| ECA-Net [41] | √ | ||||||
| CBAM [42] | √ | ||||||
| LRCA-Netv2 [35] | √ | ||||||
| LRCA-Netv3 | √ | ||||||
| Parameters (millions) | 85.3 | 86.7 | 86.7 | 86.7 | 86.7 | 86.7 | 86.7 |
| mAP | 84.07% | 89.14% | 89.57% | 89.71% | 91.52% | 92.01% | 92.87% |
Table 6.
Comparison of the proposed method with SSD, Faster-RCNN, YOLO series, and EfficientDet on the same dataset. An Interaction of Union (IoU) threshold of 0.5 is adopted here.
Table 6.
Comparison of the proposed method with SSD, Faster-RCNN, YOLO series, and EfficientDet on the same dataset. An Interaction of Union (IoU) threshold of 0.5 is adopted here.
| Method | Input Size | Sizes-AP(%) | Categories-AP(%) | mAP(%) | F1(%) | Parameters (Millions) | G-FLOPs(G) | Inference Speed (s) | |||||||
|---|---|---|---|---|---|---|---|---|---|---|---|---|---|---|---|
| Small | Medium | Large | Blue | Red | White | Yellow | None | ||||||||
| SSD | 600 × 600 | 38.2 | 90.1 | 96.5 | 79.41 | 75.63 | 78.43 | 77.81 | 74.26 | 77.11 | 63.1 | 26.29 | 247.01 | 0.17648 | |
| Faster-RCNN | 600 × 600 | 37.5 | 92.5 | 96.1 | 80.15 | 69.83 | 77.45 | 78.46 | 71.51 | 75.48 | 64.2 | 136.78 | 370.01 | 0.28335 | |
| 600 × 600 | 38.9 | 94.1 | 97.4 | 83.74 | 78.07 | 80.87 | 79.30 | 77.44 | 79.88 | 65.8 | 28.316 | 939.36 | 0.32351 | ||
| YOLOv5 | L | 640 × 640 | 78.7 | 95.3 | 97.5 | 84.34 | 81.97 | 83.64 | 83.17 | 78.55 | 82.33 | 81.7 | 46.65 | 114.31 | 0.06981 |
| X | 640 × 640 | 77.9 | 95.1 | 98.2 | 86.42 | 83.58 | 84.80 | 85.74 | 80.99 | 84.31 | 82.2 | 87.27 | 217.41 | 0.07008 | |
| YOLOX | L | 640 × 640 | 78.1 | 94.0 | 97.4 | 85.24 | 83.09 | 83.72 | 84.37 | 80.98 | 83.48 | 79.44 | 37.62 | 106.12 | 0.06996 |
| X | 640 × 640 | 79.5 | 95.5 | 98.7 | 86.45 | 83.12 | 85.18 | 85.86 | 81.84 | 84.51 | 81.2 | 70.84 | 188.51 | 0.07326 | |
| EfficientDet | D4 | 1024 × 1024 | 68.2 | 74.5 | 85.9 | 77.08 | 70.14 | 74.74 | 72.05 | 69.19 | 72.64 | 73.8 | 20.70 | 110.26 | 0.07014 |
| D5 | 1280 × 1280 | 70.3 | 73.8 | 87.2 | 78.41 | 72.77 | 75.68 | 73.18 | 70.07 | 74.02 | 73.1 | 33.63 | 270.65 | 0.09178 | |
| D6 | 1280 × 1280 | 70.2 | 75.0 | 90.8 | 77.91 | 73.54 | 76.93 | 75.14 | 74.11 | 75.53 | 75.4 | 51.84 | 546.31 | 0.14435 | |
| D7 | 1536 × 1536 | 64.4 | 80.4 | 94.5 | 78.49 | 73.31 | 77.89 | 75.91 | 75.89 | 76.30 | 78.7 | 57.57 | 650.17 | 0.19472 | |
| Our Approach | 640 × 640 | 88.7 | 92.88 | 96.74 | 91.81 | 90.89 | 95.86 | 92.69 | 93.09 | 92.87 | 90.8 | 86.70 | 249.41 | 0.07762 | |
Disclaimer/Publisher’s Note: The statements, opinions and data contained in all publications are solely those of the individual author(s) and contributor(s) and not of MDPI and/or the editor(s). MDPI and/or the editor(s) disclaim responsibility for any injury to people or property resulting from any ideas, methods, instructions or products referred to in the content. |
© 2022 by the authors. Licensee MDPI, Basel, Switzerland. This article is an open access article distributed under the terms and conditions of the Creative Commons Attribution (CC BY) license (https://creativecommons.org/licenses/by/4.0/).
Share and Cite
MDPI and ACS Style
Liang, H.; Seo, S. UAV Low-Altitude Remote Sensing Inspection System Using a Small Target Detection Network for Helmet Wear Detection. Remote Sens. 2023, 15, 196. https://doi.org/10.3390/rs15010196
AMA Style
Liang H, Seo S. UAV Low-Altitude Remote Sensing Inspection System Using a Small Target Detection Network for Helmet Wear Detection. Remote Sensing. 2023; 15(1):196. https://doi.org/10.3390/rs15010196
Chicago/Turabian StyleLiang, Han, and Suyoung Seo. 2023. "UAV Low-Altitude Remote Sensing Inspection System Using a Small Target Detection Network for Helmet Wear Detection" Remote Sensing 15, no. 1: 196. https://doi.org/10.3390/rs15010196
Note that from the first issue of 2016, this journal uses article numbers instead of page numbers. See further details here.