

Maritime DGPS System Positioning Accuracy as a Function of the HDOP in the Context of Hydrographic Survey Performance


Department of Geodesy and Oceanography, Gdynia Maritime University, Morska 81-87, 81-225 Gdynia, Poland
Remote Sens. 2023, 15(1), 10; https://doi.org/10.3390/rs15010010
Submission received: 18 October 2022
/
Revised: 15 December 2022
/
Accepted: 19 December 2022
/
Published: 20 December 2022
(This article belongs to the Special Issue Satellite Navigation and Signal Processing)
Abstract
:The Differential Global Positioning System (DGPS) is a marine navigation system operating at frequencies of 283.5–325 kHz, which is now the primary method for locating vessels in coastal shipping, as well as hydrography and mapping systems worldwide. Its positioning accuracy is determined by the following: the pseudorange error to Global Positioning System (GPS) satellites, the age of pseudorange corrections, and the value of the Horizontal Dilution of Precision (HDOP), which, in terms of accuracy, is crucial in positioning using GPS satellites. In 2020, the International Hydrographic Organization (IHO) introduced a new (the highest) order of hydrographic surveys, i.e., the Exclusive Order, which requires a positioning system to provide an accuracy of 1 m (p = 0.95). The aim of this article is to provide an answer to the question as to whether the maritime DGPS system, whose positioning accuracy is constantly increasing with that of the GPS system, fulfils the requirements for the hydrographic surveys of harbours. To this end, an extensive experimental study on the maritime DGPS system, involving a total of nearly 3.5 million fixes, was conducted. Statistical analyses showed that when ensuring the HDOP values range from 0.8 to 1.4, the DGPS system can be used in hydrographic surveys of harbours.
1. Introduction
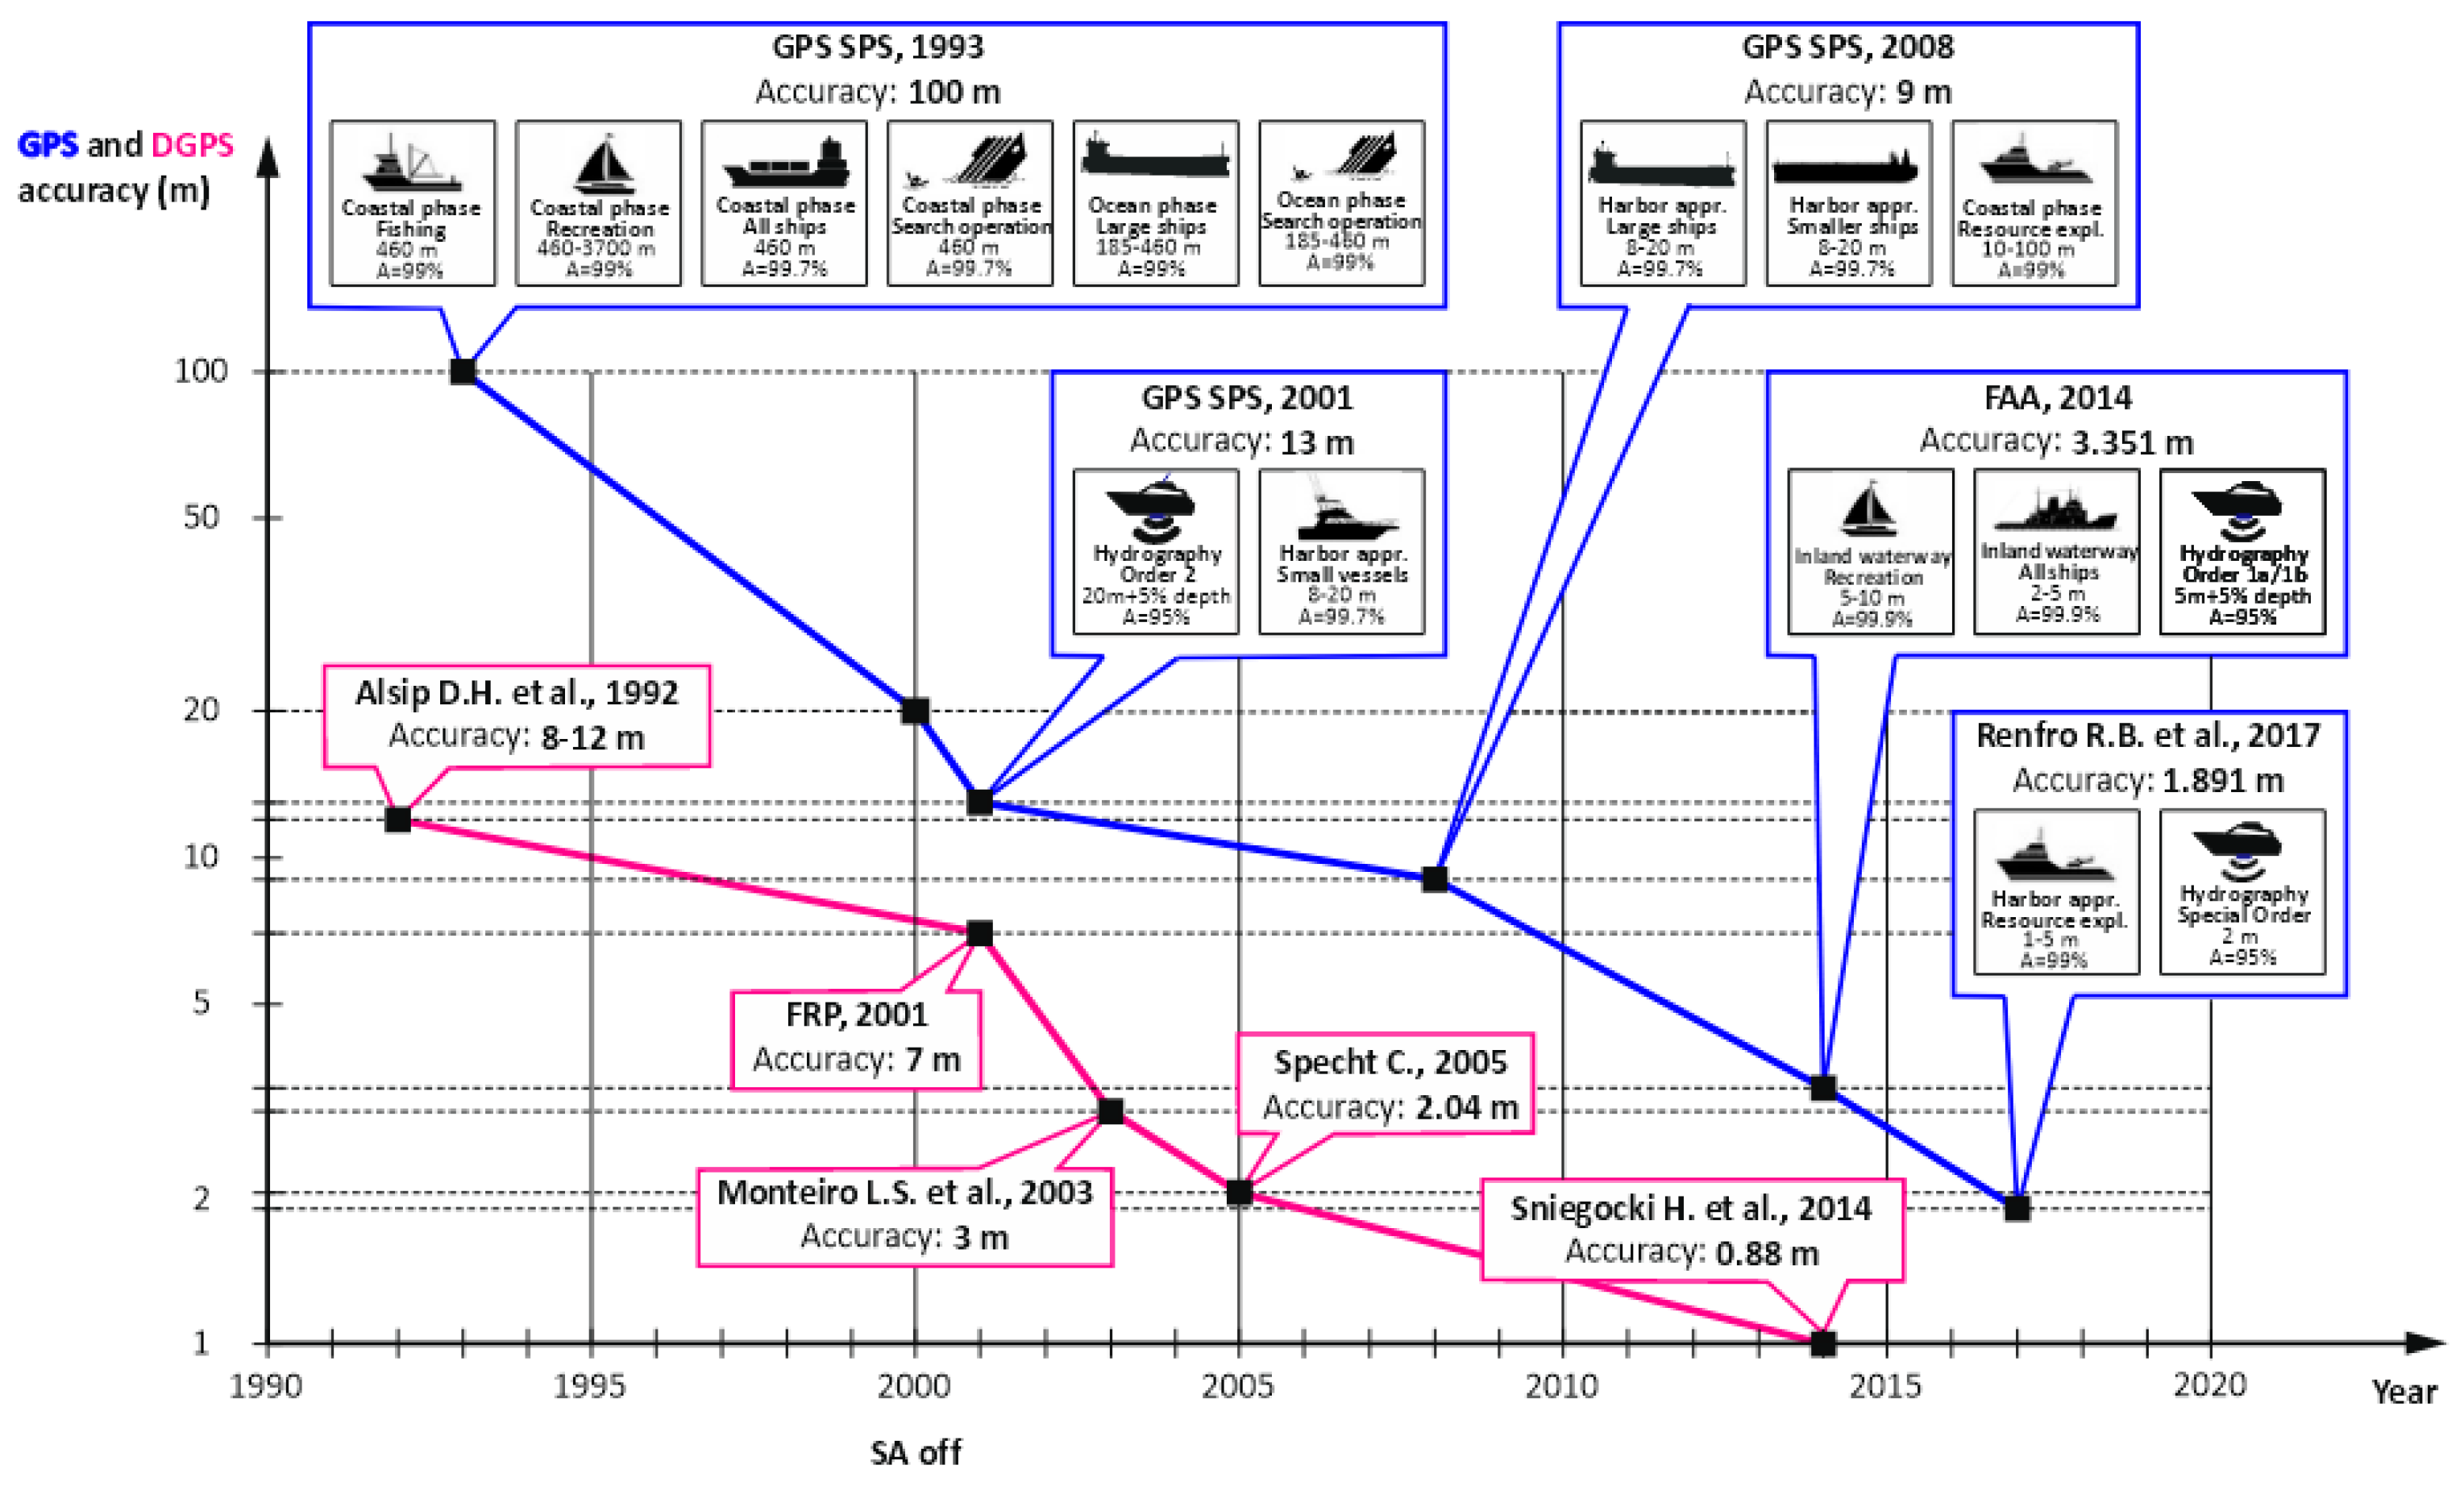
On 6 September 1983, by proclamation of the President of the United States, Ronald Reagan [1], after the shooting down of a Korean airliner by the Union of Soviet Socialist Republics (USSR), the Global Positioning System (GPS) was made available to civilian users, thus opening up new possibilities for its application in many fields of science and technology, as well as navigation and transport. Initially, the GPS provided a positioning accuracy of 100 m (p = 0.95) [2], which proved insufficient for many navigation and transport applications. Over time, its accuracy improved steadily. Information on the current GPS positioning accuracy was regularly published by the United States Department of Defense (U.S. DoD) in the standards describing the bulletins from the years 1993, 1995, 2001, and 2008, as well as in other documents. In 1993, it amounted to 100 m (p = 0.95) in the horizontal plane [2]. In 2001, it increased to 13 m (p = 0.95) [3]. In the recent version of the GPS Standard Positioning Service (SPS) standard from 2008, it was 9 m (p = 0.95) [4]. GPS positioning accuracy continued to increase in the subsequent years, but since the U.S. DoD discontinued the publication of SPS standards, the information on the current accuracy of the system had to be obtained from official or scientific publications. Referring to selected works, it is sufficient to cite that in 2014, it was 3.351 m [5], while in 2017, it was 1.891 m [6]. An extensive study conducted in 2021 [7] shows that the current GPS positioning accuracy is 2.393 m (p = 0.95). In a subsequent paper, the same author [8] experimentally determined, based on 900,000 fixes, the numerical relationships between the 2D position error and the different HDOP values.
The continuous change in the GPS system’s accuracy that has been occurring for nearly 40 years has resulted in an increased positioning accuracy for all the systems directly related to it, i.e., augmentation GPS systems, such as European Geostationary Navigation Overlay Service (EGNOS), Global Navigation Satellite System (GNSS) geodetic network methods, Wide Area Augmentation System (WAAS), as well as the maritime DGPS system, which is the primary positioning system for marine navigation worldwide.
The DGPS system is the most important maritime positioning system used in marine navigation and hydrography. The origins of the maritime DGPS system date back to the early beginnings of the GPS system. As early as 1983, due to the system’s low accuracy of 100 m (p = 0.95), the United States Coast Guard Research & Development Center (U.S. CG RDC) commenced work on a differential GPS radio navigation system referred to as the DGPS system. Its basic functionality is to transmit pseudorange corrections to GPS measurements to the maritime user’s receiver. The intense development of the DGPS system took place in the 1990s. At the beginning of the 21st century, the DGPS system underwent a major change involving the modification of the pseudorange correction transmission method, resulting in the replacement of the Radio Technical Commission for Maritime (RTCM) 1 message with the RTCM 9-3 message [9]. This change has been introduced in most maritime countries of the world [10]. It was also often combined with the replacement of technical equipment with newer solutions and also had an effect on the DGPS positioning accuracy. When observing the DGPS development trends, it can be concluded that the main current directions of research into this system include the use of DGPS methods in multi-system receivers [11,12,13], the development of network methods to improve accuracy and reliability [14], GNSS differential method mobile applications [15], and the application of DGPS methods in air navigation [16].
Having analysed the DGPS positioning accuracy, it should be noted that the first tests of this system, carried out in the 1990s, proved that it could achieve an accuracy of 8–12 m (p = 0.95) with the functioning Selective Availability (SA) and the operation in the GPS SPS [17]. In 2001, after the switching-off of the SA in the GPS system, a marked improvement in the DGPS accuracy can be noticed. A significant document for global navigation [18] indicates that the DGPS system’s accuracy was 7 m (Distance Root Mean Square (DRMS)) in 2001. Johnson et al. [19] point out that the accuracy achieved by a network of 85 American DGPS stations is 10 m. In 2003, Monteiro et al. [20] conducted a sea trial in harbour and coastal areas onboard a survey vessel of the Portuguese Hydrographic Office and achieved an accuracy greater than 3 m. Results similar to Monteiro’s were obtained in stationary measurements carried out regularly (every few years) by Specht C. In 2005, the 2D position error value was 2.04 m (2DRMS) [21]. In 2014, the accuracy of the DGPS system was 0.88 m (2DRMS) [22].
Research into the GPS and DGPS positioning accuracy, carried out for years by numerous researchers, has allowed generalisations to be made. Figure 1 compares the accuracy for the GPS and DGPS systems over the last 30 years. A strong correlation is evident between the increase in the maritime DGPS system’s accuracy and the increase in accuracy of the main system, i.e., the GPS. The figure also highlights the marine navigation applications of both systems, which became possible due to the increase in accuracy.
Hydrographic surveys, intended in particular for determining waterbody depths, are among the most challenging in terms of positioning accuracy [23]. The accuracy requirements are determined by the waterbody type to which a particular hydrographic survey order has been assigned (Table 1) in accordance with the IHO S-44 standard [24]. Among these, the measurements of waterbodies of particular significance to the safety of navigation constitute the Exclusive Order, whose permissible 2D position error is 1 m (2DRMS). In this order, the use of Real Time Kinematic (RTK) and Real Time Network (RTN) solutions [25,26] is nowadays common. They provide an accuracy at a level of approx. 5 cm (p = 0.95), thus considerably exceeding the positioning requirements of the Exclusive Order. They are limited by the short range and the very high cost of geodetic receivers. The maritime DGPS system has a typical range of approx. 100 km within a radius of the reference station, and the cost of a receiver is several times lower.
Analyses of the DGPS system’s accuracy (Figure 1) prove that it is close to a level of 1 m (p = 0.95), which is of significant importance to the Exclusive Order hydrographic surveys. Exceeding (or not) this value (1 m, p = 0.95) results in the DGPS system being able (or not) to be widely used in the Exclusive Order hydrographic surveys reserved for measurements with the highest accuracy, primarily those of harbours. With this in mind, it is reasonable to ask the question at the origin of this article, i.e., whether the maritime DGPS system is able, in terms of positioning accuracy, to satisfy the requirements of the Exclusive Order, which means that it can be successfully used in the areas where there are strict minimum underkeel clearance and manoeuvrability criteria.
The article is divided in a classic manner. The Introduction section outlines the problem and reviews the literature on the subject. The Materials and Methods section presents issues of the study implementation and its methodology. The Results and Discussion sections present the results and assess them, in particular in the context of HDOP values and the possibility for the performance of Exclusive Order hydrographic surveys.
2. Materials and Methods
In GNSS systems and their differential versions, such as the maritime DGPS, the position coordinates are determined based on the distance measurement between satellites and the user’s receiver. The positioning accuracy is significantly affected by the Dilution of Precision (DOP), which has an effect on accuracy in accordance with the following relationship:
where
- M—measuring position error,
- σ—measurement error of the navigation parameter (pseudorange), and
- DOP—geometric coefficient calculated based on the satellite’s position in relation to the receiver.
The first variable of the right side of the equation (σ) is the sum of various errors affecting the accuracy of the distance measurement to satellites. Its nature is very complex and determined by many factors (e.g., ionosphere and troposphere). The modelling of distance measurement errors in the GPS system has been presented in numerous publications. A model for GPS measurements (pseudorange) based on time series statistics were presented in [27] based on autoregressive models and 700 points. Statistical modeling being applied to the pseudorange in order to estimate the true satellite–user ranges, and therefore to reduce errors and to obtain information that allows service integrity monitoring, was proposed in [28]. In [29], the authors proposed improvements in accurate GPS positioning using time series.
Studies by various authors, in particular [30,31], demonstrated that the analysis of the influence of the HDOP value on the GPS position error due to the User Equivalent Range Error (UERE) value (which is difficult to estimate precisely) should be carried out by statistical inference methods based on a long measurement campaign. Moreover, it should be stressed that the GPS system satellites represent a constellation of different models produced in different years and thus have different technical characteristics, which affect the UERE value in a significant and diverse manner as part of different satellites.
There are two types of the DOP, depending on the navigation type (2D and 3D). For aerial or land applications, its three-dimensional Precision Dilution of Precision (PDOP) is used, while in marine navigation, the two-dimensional Horizontal Dilution of Precision (HDOP) is applied.
If signals reach an object such as the bus from Figure 2 from different directions and heights, the position lines intersect at relatively large angles close to 90 degrees (α). In this way, a low PDOP value ensures high accuracy. With regard to the second object, i.e., a train, signals cannot be received from certain directions due to their obscuration by buildings, which makes the position lines intersect at small angles. This results in a high PDOP value, which leads to a great position error.
The analyses cited above show that despite the possibility for precise determination of the DOP value at any time of measurement, it is not currently possible to accurately calculate, at any given time, the measuring position error (M) due to the large number of unknown error components that affect the UERE value. Therefore, when planning GPS and DGPS measurements to ensure high positioning accuracy, only the DOP value is minimised through the minimisation of the matrix A referred to as the DOP matrix, in accordance with the following relationship [32],
determined based on a position line gradient matrix G (also called the matrix of coefficients or geometric matrix),
where
- —elements of the matrix G−1, provided G exists.
However, the determination of coordinates in the DGPS system differs significantly from the positioning using the GPS system. In the GPS system, pseudoranges, i.e., geometric distances between all the visible satellites and the user’s receiver, are determined by measurements. The user’s coordinates are then calculated based on the alignment iterative method, whose algorithm has been repeatedly described in the literature on the subject [33,34]. Nevertheless, positioning using the DGPS system differs from the GPS solution in the following main elements:
- A DGPS receiver, similarly to GPS, determines pseudoranges, but these are additionally corrected using a pseudorange correction transmitted by the reference station via radio, which is not the case with the GPS system;
- For the determination of coordinates, only the pseudoranges to which the DGPS reference station has transmitted corrections are used. In contrast to the GPS system, a DGPS receiver only uses these GPS satellites to which the DGPS reference station will transmit a pseudorange correction. The other pseudoranges are not used in positioning.
In mathematical terms, the distance to GPS satellites, as measured by the DGPS receiver, is corrected in the differential process using a pseudorange correction PRC calculated for the moment of observation t in accordance with the following relationship,
where
- ρD—differentially corrected pseudorange,
- ρ—pseudorange measured by the GPS system, and
- PRC(t)—extrapolated pseudorange correction at the moment of observation t.
Due to the low bandwidth of the radio link between the DGPS reference station and the DGPS receiver, which is typically 100 or 200 bps, the pseudorange correction, before adding it to the pseudorange ρ, is calculated based on the extrapolated (predicted) rate of its changes (RRC) over time (t − t0), in accordance with the relationship
where
- PRC(t0)—pseudorange correction determined by the DGPS reference station at the moment t0, and
- RRC(t − t0)—range rate correction over time (t − t0).
In order to statistically assess the influence of the HDOP value on the maritime DGPS system’s error, a very long measurement campaign involving 3,424,704 fixes was used. This population of over 3.5 million is equivalent to the continuous recording of DGPS measurements for almost 40 days. The study was conducted in Gdynia (Poland) using a DGPS reference station located 40 km away from the typical coded maritime DGPS receiver. The surveys were performed with a frequency of 1 Hz, which were recorded as ASCII strings in the National Marine Electronics Association 0183 (NMEA 0183) standard. Since the determination of such a large number of position coordinates can be regarded as a representative sample in statistical terms, the inference on this basis can be considered reliable.
At the same time, in addition to the position coordinates, the HDOP values, the number of GPS satellites, and the age of corrections were recorded. The recorded geographic coordinates (latitude and longitude) presented in the angular (curvilinear) measure prevent the determination of errors in particular measurements. Therefore, it is reasonable to continue calculations in metres. To this end, the geographic coordinates were projected from the surface of the World Geodetic System 1984 (WGS 84) ellipsoid [35] onto a plane surface using the Gauss–Krüger transformation that is commonly used in geodesy [36]. The calculations yield plane coordinates (x,y), where the value x denotes the distance (in metres) between a point and the equator, calculated along the meridian arc (on the WGS 84 ellipsoid), and the variable y is the distance (in metres) from the arbitrarily fixed central meridian.
3. Results
The analysis of measurement results began with determining the number of satellites used in the DGPS positioning. The number of satellites used as a function of availability is provided in Figure 3.
In this regard, the maritime DGPS system differs significantly from typical GPS system. The results presented may appear surprising, as it is seemingly unexpected that no more than 9 GPS satellites are used when applying the DGPS solution, all the more so because in GPS measurements, there are situations where up to 16 GPS satellites are used (Figure 4).
The number of satellites used by the DGPS system, which is small and different from a typical GPS solution, requires an additional explanation based on the theory of the system’s operation. The maritime DGPS system uses shore-based reference stations, which, due to the very low frequency of data transmission (283.5–325 kHz), apply low bit rate radio lines based on transmitters with ranges of up to 100 km and above. The bit rate of the correction data transmitted in accordance with the RTCM standard is only 100 or 200 bauds. This means that the pseudorange corrections transmitted by the reference station to satellites reach the user only every 5–6 s after they are sent by the reference station at the bit rate of 100 bps. This extension of the age of corrections results in a drop in the positioning accuracy of the DGPS system, which lasts until the subsequent corrections for GPS satellites are correctly received by the maritime receiver. For this reason, the transmission of too great a number of corrections by the reference station in the DGPS system is not justified, as it would result in the elongation of their age and an additional drop in accuracy. Thus, the DGPS reference station usually only transmits corrections to nine satellites, which results from the RTCM 9-3 message, where, as part of a single message, corrections are accurately transmitted to three satellites. Hence, the transmission of three such messages to three satellites is fully justified. Therefore, it is reasonable not to send a greater number of corrections to the user. In the software of the maritime DGPS reference station, the satellites which ensure the lowest possible value of HDOP are selected.
The first element of the DGPS statistical data analysis was to assess the HDOP values noted during the measurements. Figure 5a presents the percentage availability of individual HDOP values for the maritime DGPS system. This variable takes on values ranging from 0.9 to 2.2. From a research perspective, it is interesting to compare the HDOP values for the DGPS and GPS systems. This is why Figure 5b presents analogous GPS statistics, which were analysed in detail in [8]. The comparison of two graphs is not coincidental, because it will enable the drawing of additional conclusions concerning the statistical features of specific variables in the DGPS system as compared to the GPS system.
The following conclusions can be drawn from Figure 5 presented:
- The typical HDOP values for the maritime DGPS system are ranging from 0.9 to 1.3, which occur a total of 93.11% of the time. The most common values are HDOP = 1.0 and HDOP = 1.1, occurring in 35.2% and 32.07% of the time, respectively;
- The DGPS system is characterised by an HDOP value higher than that for the GPS system. A comparison of both systems (GPS and DGPS) shows that the typical HDOP value for the GPS system is lower by 0.2–0.3 in relation to the maritime DGPS system. This results from the differential correction transmission method, which was explained earlier in the publication. However, a study into statistical distributions of the GPS system in 2021 showed that the highest value of HDOP = 0.6 was provided by a GPS constellation consisting of 12, 13, 14, 15, and 16 satellites, of which the value of 14 is predominant. The mean number of satellites was high (14.085), with a relatively small standard deviation of 0.76, which must be emphasised [8].
In the next stage of the analyses, the DGPS results were sorted in such a way that the DGPS position coordinates (from which the position errors were determined) with the same HDOP value were located in separate sets. Hence, the first set only contained the measurements with the value of HDOP = 0.8, while the subsequent set of surveys contained only the value of HDOP = 0.9, etc. Figure 6 presents the distributions of DGPS position errors containing the same HDOP value.
The following conclusions can be drawn from Figure 6 presented:
- For the value of HDOP = 0.8, the distribution of DGPS position errors has the smallest error. However, the low number of measurements (0.2% of the population) does not justify making a reliable inference;
- The distributions of DGPS position errors for the HDOP values ranging from 0.9 to 1.3, from the DGPS position error perspective, have very similar statistical distributions, which may suggest that they have a similar position error value;
- The similar distributions of the DGPS system’s errors may lead to the conclusion that they are virtually independent of the HDOP value for the geometric coefficient range of 0.9–1.3. The very high number of measurements in each set may suggest that this is a particular feature of the DGPS system. It is fundamentally different in relation to the GPS system, where the influence of the HDOP value on the position error is very clear, with changes in the error value of up to 20% [8].
As this issue has not been addressed in the literature on the subject, it was reasonable to carry out a detailed statistical analysis of each file containing the same HDOP value. To this end, the Easy Fit and Mathcad softwares were used. Table 2 presents selected 2D position error statistics for different HDOP values, expressed as a percentage, in the DGPS system.
Based on Table 2, the graphs in Figure 7 were drawn, which enable a more transparent analysis of the variability of the results. In the graph, the DGPS position error, which has been changed from the best values of 5%, through 10%, up to the 95% population, is presented on the X axis. However, the accuracy values for each HDOP value are collectively presented on the Y axis.
The results presented in Figure 7 lead to the following final conclusions of the analyses carried out:
- In the DGPS system, the position error does not change for the HDOP values ranging from 0.9 to 1.3, which means that increasing the HDOP value does not result in a significant increase in the position error, unlike the GPS system in which the position error is strictly determined by the HDOP value;
- For the value of HDOP = 1.4, the DGPS system’s error is noticeably higher than that for other HDOP values from the range of 0.9–1.3. Based on this value, an increase in the position error with the HDOP can be expected, similar to the GPS system.
It can be assumed that if the DGPS system is able to ensure the positioning accuracy of less than 1 m (p = 0.95) for hydrographic surveys, its use in hydrography under the Exclusive Order is entirely possible. Moreover, in contrast to the phase GNSS solutions used in hydrography, the maritime DGPS system ensures positioning integrity, which is not the case with the RTK and RTN solutions.
4. Discussion
The results of the DGPS system’s accuracy were compared with the studies carried out based on the same station, the same receiver, and under the same conditions. Figure 8 presents the results of these campaigns from the years 2006, 2009, and 2014, during which very long measurement campaigns of approx. 1–3 million fixes were carried out as well [40].
A comparison of the results shows that the DGPS system currently enables its use in hydrography, in particular, the Exclusive Order. The study conducted on a representative sample of 3.5 million fixes showed that the DGPS system could be successfully used in hydrography irrespective of waterbodies, including harbours.
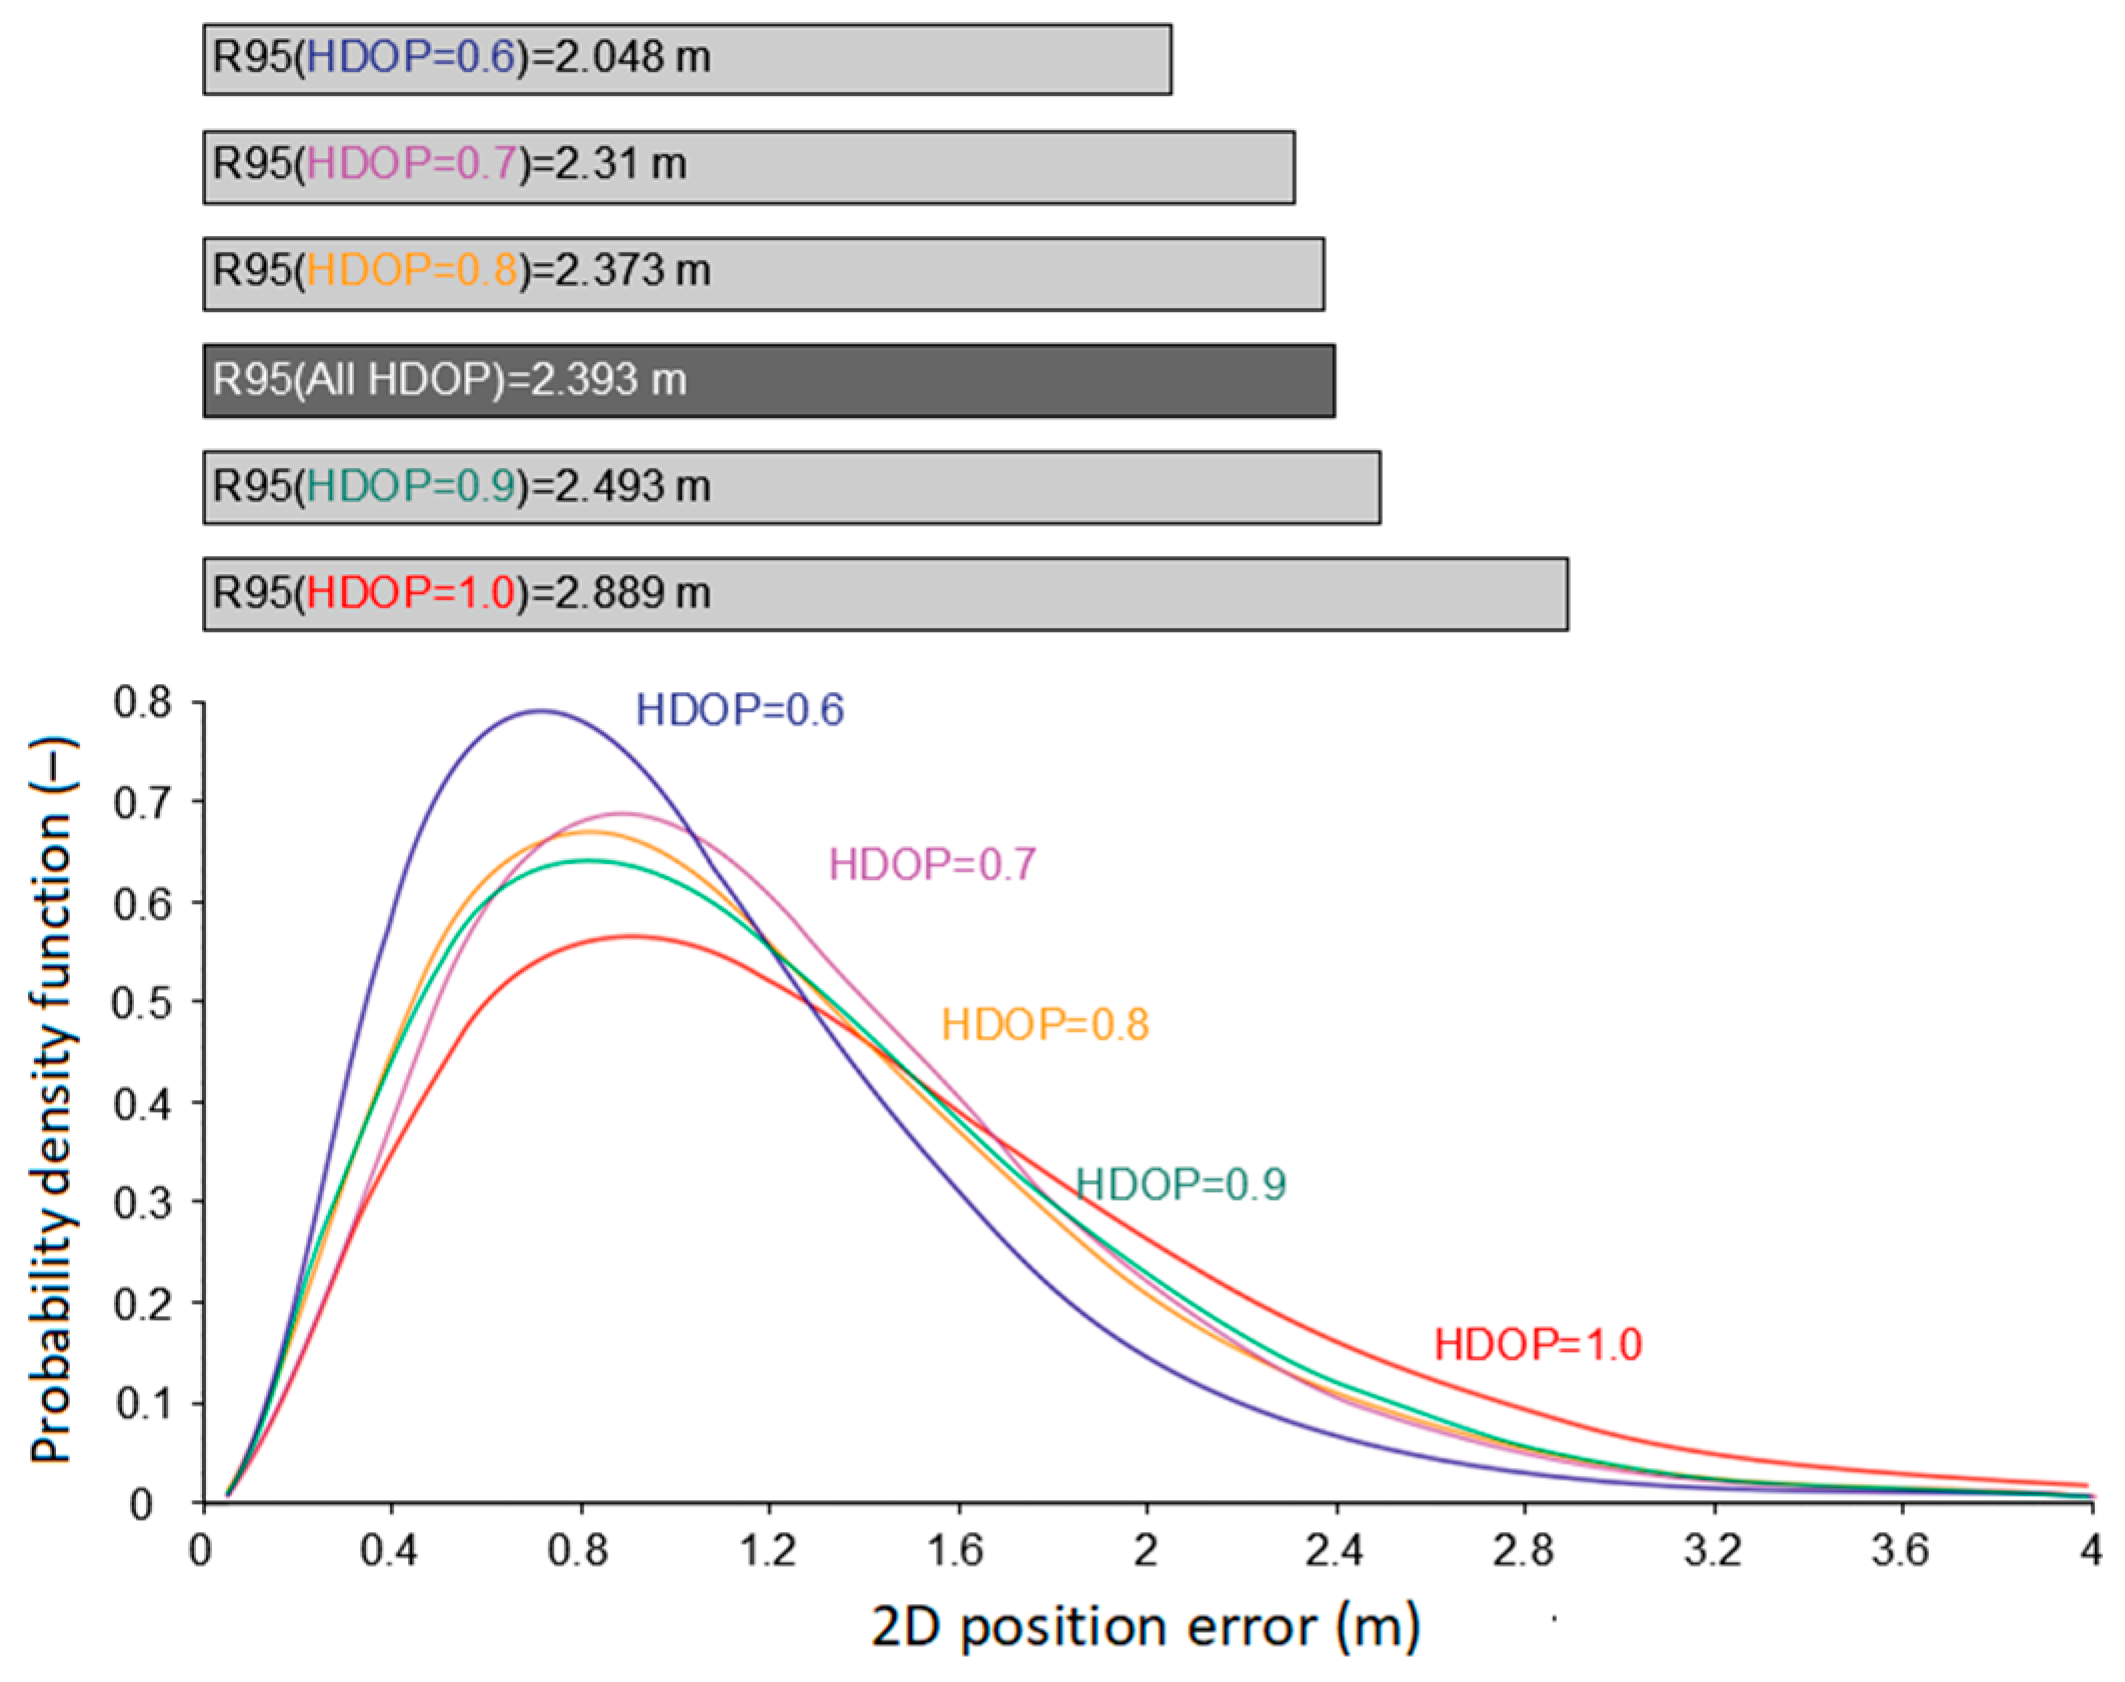
When carrying out this study, the author was almost certain that increasing the HDOP value in the DGPS system would increase the positioning accuracy. This belief resulted from the expected analogy with GPS measurements, in which the publication by [8] experimentally presented a close relationship in this regard (Figure 9).
A very similar study carried out by Specht M. [8] proves that the average HDOP value in the GPS system, with no terrain obstacles, is 0.8 and that the difference between the HDOP values of 0.7 and 1.0 statistically changes the position error from a value of 2.31 m to 2.889 m (R95 measure). This means that the planning of a GPS campaign can enable “savings” of 0.579 m, i.e., 20%, which is confirmed by the analyses and diagrams in Figure 9. With regard to the maritime DGPS system, the user has no influence (through proper planning of the measurement duration) on the HDOP value. As for the DGPS system, the most common HDOP values are 1.0 and 1.1, which is greater by 0.3 than that for the GPS system. The presented comparison between the GPS and DGPS systems may lead to the conclusion that in differential coded measurements, a change in the HDOP value within the range of 0.8–1.3 does not result in a noticeable, in statistical terms, change in the position accuracy.
5. Conclusions
The aim of the article was to determine whether the maritime DGPS system, in terms of positioning accuracy, is currently able to satisfy the requirements of the Exclusive Order, which are 1 m (p = 0.95). As the GPS system’s accuracy is constantly increasing, the above question seems relevant today. An increase in GPS accuracy leads to an increase in DGPS accuracy. Having analysed changes in the DGPS system’s accuracy over the past 15 years (Figure 8), it was reasonable to analyse the current accuracy in the context of the emergence of a new hydrographic category, i.e., the Exclusive Order. Currently, the DGPS system provides a positioning accuracy of 0.971 m, when an HDOP value of up to 1.4 is provided.
An interesting issue is the absence of a relationship between the DGPS position error and the HDOP values from the range of 0.8–1.3, which, when compared to the GPS system, is a distinctive characteristic resulting from the differential correction transmission method. It should be emphasised that in the GPS system, it is the receiver that decides which of the satellites (usually all) will be used to determine the position. In the DGPS system, it is the reference (land) station that formats and sets the number of satellites to which PRC corrections will be transmitted. Since in the DGPS system, the telecommunications link throughput is 100 or 200 baud, increasing the number of transmitted PRC corrections grows the age of the corrections, which will result in increasing the position error. Therefore, it is reasonable for the DGPS reference station to transmit only three RTCM 9-3 messages. Moreover, the study showed that typical HDOP values fall within a range of 0.9–1.1, while in the GPS system, they typically fall within a range of 0.7–0.9.
In a situation where the DGPS system cannot be used (too long a distance from the reference station, low signal level, low Signal-to-Noise Ratio (SNR), interference, etc.), an alternative method of Exclusive Order hydrographic surveys is the use of RTN solutions with an accuracy of 2–5 cm (p = 0.95). However, their range is limited by the range of the mobile network.
Funding
This research was funded from the statutory activities of Gdynia Maritime University, grant number WN/2022/PZ/05.
Conflicts of Interest
The author declares no conflict of interest.
References
- OSTP. Statement by the President Regarding the United States’ Decision to Stop Degrading Global Positioning System Accuracy. Available online: https://clintonwhitehouse4.archives.gov/WH/EOP/OSTP/html/0053_2.html (accessed on 15 December 2022).
- U.S. DoD. Global Positioning System Standard Positioning Service Signal Specification, 1st ed.; U.S. DoD: Arlington, VA, USA, 1993.
- U.S. DoD. Global Positioning System Standard Positioning Service Performance Standard, 3rd ed.; U.S. DoD: Arlington, VA, USA, 2001.
- U.S. DoD. Global Positioning System Standard Positioning Service Performance Standard, 4th ed.; U.S. DoD: Arlington, VA, USA, 2008.
- FAA William J. Hughes Technical Center. Global Positioning System (GPS) Standard Positioning Service (SPS) Performance Analysis Report; Report #86; FAA William J. Hughes Technical Center: Egg Harbor Township, NJ, USA, 2014.
- Renfro, B.A.; Stein, M.; Boeker, N.; Terry, A. An Analysis of Global Positioning System (GPS) Standard Positioning Service (SPS) Performance for 2017; TR-SGL-18-02; SGL: Austin, TX, USA, 2018. [Google Scholar]
- Specht, M. Consistency Analysis of Global Positioning System Position Errors with Typical Statistical Distributions. J. Navig. 2021, 74, 1201–1218. [Google Scholar] [CrossRef]
- Specht, M. Experimental Studies on the Relationship between HDOP and Position Error in the GPS System. Metrol. Meas. Syst. 2022, 29, 17–36. [Google Scholar]
- Ward, N. Future of IALA DGNSS. In Proceedings of the 2006 National Technical Meeting of The Institute of Navigation (ION NTM 2006), Monterey, CA, USA, 18–20 January 2006. [Google Scholar]
- Ferguson, K.; Albright, M.; Remondi, B.W.; Cleveland, A.; Parsons, M. NDGPS Reference Station and Integrity Monitor Architecture Modernization. In Proceedings of the 60th Annual Meeting of The Institute of Navigation, Dayton, OH, USA, 7–9 June 2004. [Google Scholar]
- Hakansson, M.; Jensen, A.B.O.; Horemuz, M.; Hedling, G. Review of Code and Phase Biases in Multi-GNSS Positioning. GPS Solut. 2017, 21, 849–860. [Google Scholar] [CrossRef] [Green Version]
- Krasuski, K.; Ćwiklak, J. Aircraft Positioning Using DGNSS Technique for GPS and GLONASS Data. Sens. Rev. 2020, 40, 559–575. [Google Scholar] [CrossRef]
- Liu, H.; Shu, B.; Xu, L.; Qian, C.; Zhang, R.; Zhang, M. Accounting for Inter-system Bias in DGNSS Positioning with GPS/GLONASS/BDS/Galileo. J. Navig. 2017, 70, 686–698. [Google Scholar] [CrossRef]
- Bakuła, M.; Uradziński, M.; Krasuski, K. Network Code DGNSS Positioning for Faster L1–L5 GPS Ambiguity Initialization. Sensors 2020, 20, 5671. [Google Scholar] [CrossRef] [PubMed]
- Bakuła, M.; Uradziński, M.; Krasuski, K. Performance of DGPS Smartphone Positioning with the Use of P(L1) vs. P(L5) Pseudorange Measurements. Remote Sens. 2022, 14, 929. [Google Scholar] [CrossRef]
- Krasuski, K.; Popielarczyk, D.; Ciećko, A.; Ćwiklak, J. A New Strategy for Improving the Accuracy of Aircraft Positioning Using DGPS Technique in Aerial Navigation. Energies 2021, 14, 4431. [Google Scholar] [CrossRef]
- Alsip, D.H.; Butler, J.M.; Radice, J.T. The Coast Guard’s Differential GPS Program. Navig. J. Inst. Navig. 1992, 39, 345–361. [Google Scholar] [CrossRef]
- U.S. DoT.; U.S. DoD.; U.S. DHS. 2001 Federal Radionavigation Plan; U.S. DoD: Springfield, VA, USA, 2001.
- Johnson, G.; Hartnett, R.; Swaszek, P. DGPS and WAAS Maritime Accuracy and Availability Studies. In Proceedings of the 60th Annual Meeting of The Institute of Navigation, Dayton, OH, USA, 7–9 June 2004. [Google Scholar]
- Monteiro, L.S.; Marreiros, P.R. Analysis of Maritime DGPS Positioning Accuracy at Sea. In Proceedings of the 16th International Technical Meeting of the Satellite Division of The Institute of Navigation (ION GPS/GNSS 2003), Portland, OR, USA, 9–12 September 2003. [Google Scholar]
- Specht, C. Accuracy and Coverage of the Modernized Polish Maritime Differential GPS. Adv. Space Res. 2011, 47, 221–228. [Google Scholar] [CrossRef]
- Sniegocki, H.; Specht, C.; Specht, M. Testing Accuracy of Maritime DGPS System Based on Long-term Measurements Campaigns over the Years 2006–2014. Int. J. Civ. Eng. Technol. 2014, 5, 1–8. [Google Scholar]
- Makar, A. Reliability of the Digital Sea Bottom Model Sourced by Multibeam Echosounder in Shallow Water. In Proceedings of the 5th World Multidisciplinary Earth Sciences Symposium (WMESS 2019), Prague, Czech Republic, 9–13 September 2019. [Google Scholar]
- IHO. IHO Standards for Hydrographic Surveys; Special Publication No. 44, 6th ed.; IHO: Monaco, Monaco, 2020. [Google Scholar]
- Makar, A. Determination of Inland Areas Coastlines. In Proceedings of the 18th International Multidisciplinary Scientific GeoConference (SGEM 2018), Albena, Bulgaria, 2–8 July 2018. [Google Scholar]
- Makar, A. Dynamic Tests of ASG-EUPOS Receiver in Hydrographic Application. In Proceedings of the 18th International Multidisciplinary Scientific GeoConference (SGEM 2018), Albena, Bulgaria, 2–8 July 2018. [Google Scholar]
- Barros, M.S.S.; Rosa, L.C.L.; Walter, F.; Alves, L.H.P.M. Global Positioning System: A Methodology for Modelling the Pseudorange Measurements. Adv. Space Res. 1999, 23, 1529–15232. [Google Scholar] [CrossRef]
- Barros, M.S.S.; Rosa, L.C.L.; Walter, F.; Méndez, D. GPS: Statistical Models to Reproduce the Pseudoranges in Different Scenarios and their Reliability Evaluation. Adv. Space Res. 2001, 28, 227–232. [Google Scholar] [CrossRef]
- Koyama, Y.; Tanaka, T. Improvements in Accurate GPS Positioning Using Time Series Analysis. In Proceedings of the SICE Annual Conference 2010 (SICE 2010), Taipei, Taiwan, 18–21 August 2010. [Google Scholar]
- Belabbas, B.; Hornbostel, A.; Sadeque, M.Z. Error Analysis of Single Frequency GPS Measurements and Impact on Timing and Positioning Accuracy. In Proceedings of the 2nd Workshop on Positioning, Navigation and Communication 2005 (WPNC 2005) and 1st Ultra-wideband Expert Talk 2005 (UET 2005), Hannover, Germany, 17 March 2005. [Google Scholar]
- Belabbas, B.; Petitprez, F.; Hornbostel, A. UERE Analysis for Static Single Frequency Positioning Using Data of IGS Stations. In Proceedings of the 2005 National Technical Meeting of The Institute of Navigation (ION NTM 2005), Long Beach, CA, USA, 13–16 September 2005. [Google Scholar]
- Spilker, J.J., Jr.; Axelrad, P.; Parkinson, B.W.; Enge, P. Global Positioning System: Theory and Applications; AIAA: Reston, VA, USA, 1996; Volume 1. [Google Scholar]
- Hofmann-Wellenhof, B.; Legat, K.; Wieser, M. Navigation—Principles of Positioning and Guidance; Springer: Wien, Austria, 2003. [Google Scholar]
- Langley, R.B. The Mathematics of GPS. GPS World 1991, 2, 45–50. [Google Scholar]
- NGA. Department of Defense World Geodetic System 1984, Its Definition and Relationships with Local Geodetic Systems, 3rd ed.; NGA: Springfield, VA, USA, 2004. [Google Scholar]
- Deakin, R.E.; Hunter, M.N.; Karney, C.F.F. The Gauss-Krüger Projection. In Proceedings of the 23rd Victorian Regional Survey Conference, Warrnambool, Australia, 10–12 September 2010. [Google Scholar]
- Specht, M. Consistency of the Empirical Distributions of Navigation Positioning System Errors with Theoretical Distributions—Comparative Analysis of the DGPS and EGNOS Systems in the Years 2006 and 2014. Sensors 2021, 21, 31. [Google Scholar] [CrossRef] [PubMed]
- Specht, M. Determination of Navigation System Positioning Accuracy Using the Reliability Method Based on Real Measurements. Remote Sens. 2021, 13, 4424. [Google Scholar] [CrossRef]
- Specht, M. Statistical Distribution Analysis of Navigation Positioning System Errors—Issue of the Empirical Sample Size. Sensors 2020, 20, 7144. [Google Scholar] [CrossRef] [PubMed]
- Specht, C.; Smolarek, L.; Pawelski, J.; Specht, M.; Dąbrowski, P. Polish DGPS System: 1995–2017—Study of Positioning Accuracy. Pol. Marit. Res. 2019, 26, 15–21. [Google Scholar] [CrossRef]
Figure 1.
Changes in the GPS and DGPS systems’ accuracies over the recent years, based on se-lected documents and authors. Own study based on [2,3,4,5,6,17,18,20,21,22].

Figure 2.
The influence of the DOP on the GPS position error [8].
Figure 2.
The influence of the DOP on the GPS position error [8].

Figure 3.
The number of satellites used by the DGPS receiver to determine the position coordinates.

Figure 4.
The number of GPS satellites used to determine the position at HDOP = 0.6 (a) and HDOP = 0.8 (b) [8].
Figure 4.
The number of GPS satellites used to determine the position at HDOP = 0.6 (a) and HDOP = 0.8 (b) [8].

Figure 5.
The percentage availability of individual HDOP values for the maritime DGPS system (a) and the percentage availability of individual HDOP values for the GPS system (b).
Figure 5.
The percentage availability of individual HDOP values for the maritime DGPS system (a) and the percentage availability of individual HDOP values for the GPS system (b).

Figure 6.
The distributions of the DGPS system’s errors containing the same HDOP value: 0.8 (a), 0.9 (b), 1.0 (c), 1.1 (d), 1.2 (e), and 1.3 (f).
Figure 6.
The distributions of the DGPS system’s errors containing the same HDOP value: 0.8 (a), 0.9 (b), 1.0 (c), 1.1 (d), 1.2 (e), and 1.3 (f).

Figure 7.
The DGPS system’s accuracy (Y axis) as a function of the HDOP value at a varying probability (X axis).
Figure 7.
The DGPS system’s accuracy (Y axis) as a function of the HDOP value at a varying probability (X axis).

Figure 8.
The positioning accuracy of the maritime DGPS system based on the measurements performed in the years 2006, 2009, and 2014 [40].
Figure 8.
The positioning accuracy of the maritime DGPS system based on the measurements performed in the years 2006, 2009, and 2014 [40].

Figure 9.
The relationship between the HDOP value and the GPS position error [8].
Figure 9.
The relationship between the HDOP value and the GPS position error [8].


Table 1.
The requirements for positioning accuracy during the hydrographic survey performance under a specific order [24].
Table 1.
The requirements for positioning accuracy during the hydrographic survey performance under a specific order [24].
| Criteria | Order 2 | Order 1b | Order 1a | Special Order | Exclusive Order |
|---|---|---|---|---|---|
| Area description | Areas where a general description of the sea floor is considered adequate | Areas where underkeel clearance is not considered to be an issue but surface shipping expected to transit the area | Areas where underkeel clearance is not considered not to be critical but features of concern to surface shipping may exist | Areas where underkeel clearance is critical | Areas where there is strict minimum underkeel clearance and manoeuvrability criteria |
| Depth | 20 m + 10% of depth | 5 m + 5% of depth | 5 m + 5% of depth | 2 m | 1 m |
Table 2.
2D position error statistics for different HDOP values in the DGPS system.
| Descriptive Statistic | 2D Position Error | ||||||
|---|---|---|---|---|---|---|---|
| HDOP = 0.8 | HDOP = 0.9 | HDOP = 1.0 | HDOP = 1.1 | HDOP = 1.2 | HDOP = 1.3 | HDOP = 1.4 | |
| Range | 0.965 m | 2.063 m | 2.013 m | 10.061 m | 1.684 m | 1.659 m | 2.320 m |
| Mean | 0.236 m | 0.417 m | 0.399 m | 0.448 m | 0.424 m | 0.426 m | 0.387 m |
| Standard deviation | 0.127 m | 0.218 m | 0.208 m | 0.224 m | 0.202 m | 0.208 m | 0.262 m |
| 5th percentile | 0.062 m | 0.116 m | 0.098 m | 0.134 m | 0.127 m | 0.124 m | 0.089 m |
| 10th percentile | 0.087 m | 0.160 m | 0.142 m | 0.186 m | 0.179 m | 0.169 m | 0.125 m |
| 25th percentile (Q1) | 0.142 m | 0.254 m | 0.242 m | 0.289 m | 0.278 m | 0.268 m | 0.209 m |
| 50th percentile (Median) | 0.230 m | 0.392 m | 0.378 m | 0.419 m | 0.403 m | 0.404 m | 0.323 m |
| 75th percentile (Q3) | 0.309 m | 0.549 m | 0.535 m | 0.576 m | 0.551 m | 0.568 m | 0.482 m |
| 90th percentile | 0.369 m | 0.697 m | 0.683 m | 0.746 m | 0.685 m | 0.703 m | 0.751 m |
| 95th percentile | 0.430 m | 0.799 m | 0.767 m | 0.852 m | 0.772 m | 0.781 m | 0.971 m |
| Max percentile | 0.971 m | 2.069 m | 2.019 m | 10.068 m | 1.690 m | 1.666 m | 2.326 m |
Disclaimer/Publisher’s Note: The statements, opinions and data contained in all publications are solely those of the individual author(s) and contributor(s) and not of MDPI and/or the editor(s). MDPI and/or the editor(s) disclaim responsibility for any injury to people or property resulting from any ideas, methods, instructions or products referred to in the content. |
© 2022 by the author. Licensee MDPI, Basel, Switzerland. This article is an open access article distributed under the terms and conditions of the Creative Commons Attribution (CC BY) license (https://creativecommons.org/licenses/by/4.0/).
Share and Cite
MDPI and ACS Style
Specht, C. Maritime DGPS System Positioning Accuracy as a Function of the HDOP in the Context of Hydrographic Survey Performance. Remote Sens. 2023, 15, 10. https://doi.org/10.3390/rs15010010
AMA Style
Specht C. Maritime DGPS System Positioning Accuracy as a Function of the HDOP in the Context of Hydrographic Survey Performance. Remote Sensing. 2023; 15(1):10. https://doi.org/10.3390/rs15010010
Chicago/Turabian StyleSpecht, Cezary. 2023. "Maritime DGPS System Positioning Accuracy as a Function of the HDOP in the Context of Hydrographic Survey Performance" Remote Sensing 15, no. 1: 10. https://doi.org/10.3390/rs15010010
Note that from the first issue of 2016, this journal uses article numbers instead of page numbers. See further details here.