
Hyperspectral Anomaly Detection Using Deep Learning: A Review
by
 , , , , ,
Xing Hu
1 ,
,
Chun Xie
1,
Zhe Fan
1,
Qianqian Duan
2,
Dawei Zhang
1,*,
Linhua Jiang
3,
Xian Wei
4,
Danfeng Hong
5,
Guoqiang Li
6,
Xinhua Zeng
3,
Wenming Chen
7,
Dongfang Wu
8 and
Jocelyn Chanussot
9 1
School of Optical-Electrical and Computer Engineering, University of Shanghai for Science & Technology, Shanghai 200093, China
2
School of Electronics and Electrical Engineering, Shanghai University of Engineering Science, Shanghai 201620, China
3
Engineering Research Center of AI & Robotics, Ministry of Education, Academy for Engineering & Technology, Fudan University, Shanghai 200433, China
4
MOE Engineering Research Center of Software and Hardware Co-Design and Application, East China Normal University, Shanghai 200062, China
5
Key Laboratory of Computational Optical Imaging Technology, Aerospace Information Research Institute, Chinese Academy of Sciences, Beijing 100094, China
6
School of Software, Shanghai Jiao Tong University, Shanghai 200240, China
7
Biomechanics and Intelligent Rehabilitation Engineering Group, Institute of Biomedical Engineering & Technology, Fudan University, Shanghai 200433, China
8
School of Artificial Intelligence, Zhejiang Gongshang University, No. 18 Xuezheng Street, Xiasha Higher Education Park, Hangzhou 314423, China
9
CNRS, Grenoble INP, GIPSA-Lab, Université Grenoble Alpes, 38000 Grenoble, France
*
Author to whom correspondence should be addressed.
Remote Sens. 2022, 14(9), 1973; https://doi.org/10.3390/rs14091973
Submission received: 13 March 2022
/
Revised: 9 April 2022
/
Accepted: 14 April 2022
/
Published: 20 April 2022
(This article belongs to the Special Issue Pattern Recognition in Hyperspectral Remote Sensing)
Abstract
:Hyperspectral image-anomaly detection (HSI-AD) has become one of the research hotspots in the field of remote sensing. Because HSI’s features of integrating image and spectrum provide a considerable data basis for abnormal object detection, HSI-AD has a huge application potential in HSI analysis. It is difficult to effectively extract a large number of nonlinear features contained in HSI data using traditional machine learning methods, and deep learning has incomparable advantages in the extraction of nonlinear features. Therefore, deep learning has been widely used in HSI-AD and has shown excellent performance. This review systematically summarizes the related reference of HSI-AD based on deep learning and classifies the corresponding methods into performance comparisons. Specifically, we first introduce the characteristics of HSI-AD and the challenges faced by traditional methods and introduce the advantages of deep learning in dealing with these problems. Then, we systematically review and classify the corresponding methods of HSI-AD. Finally, the performance of the HSI-AD method based on deep learning is compared on several mainstream data sets, and the existing challenges are summarized. The main purpose of this article is to give a more comprehensive overview of the HSI-AD method to provide a reference for future research work.
1. Introduction
1.1. Hyperspectral Image and Applications
In the field of remote sensing, hyperspectral image (HSI) is a ground image collected by advanced sensor technology and imaging system mounted on satellites or other aircraft. By combining the advantages of spectroscopy and digital imaging, the spectral dimension of a hyperspectral image consists of hundreds of continuous narrow bands that are obtained in the visible, near-infrared, short-infrared, midinfrared, and even ultraviolet wavelengths of the electromagnetic spectrum. Spectral resolution refers to the number and width of parts of the electromagnetic spectrum measured by a sensor. HSI can collect more bands than multispectral, thus the details of hyperspectral detection are greater. HSI has the feature of integrating image and spectrum. It can describe both the two-dimensional spatial information of the ground object distribution and the one-dimensional spectral information of the ground object spectral characteristics, forming a three-dimensional data cube of “image-spectrum-merging”. Compared with the range where human eyes can only accept visible light, HSI systems collect detailed spectral information which can be used to detect materials which have fine spectral features which may be hard to detect with human vision. Such data exploitation can be performed even with a visible only HSI system, allowing humans to understand and recognize certain characteristics of the target in another way, greatly improving people’s perception of the world ability.
Due to the difference in the absorption of different wavelengths of light by different object material components, a certain feature of the object will be very prominent in the image at a specific wavelength, but less prominent in the image at other wavelengths. Therefore, the spectral information can fully reflect the difference in the physical structure and chemical composition of the object. For example, hyperspectral target detection and recognition can effectively identify camouflage in the military, and can effectively evaluate crop growth, yield estimation, vegetation inspection, and non-destructive testing in agriculture; in geological survey and survey, it can realize the fine identification and survey of mineral resources, and ecological restoration, etc.; in the field of biomedicine, non-contact and non-destructive diagnostic techniques can be used to realize the visualization of different pathological conditions of the organization and the screening and tracking of lesions [1,2,3].
1.2. Anomaly Detection
Anomaly detection is a very important sub-branch in machine learning and has important applications in computer vision, data mining, and natural language processing (NLP). The purpose of anomaly detection is to identify data that does not match normal data or that is significantly different from expected data. The types of abnormal data can be divided into point anomalies, context anomalies, and group anomalies. Learning methods of anomaly detection can be divided into supervised, unsupervised, and semi-supervised learning. Currently, deep learning technology provides great convenience for anomaly detection in the era of big data.
1.3. Hyperspectral Anomaly Detection
HSI-AD refers to the identification of pixels whose spectral characteristics in an image are significantly different from adjacent or global background pixels. “Anomaly” does not specifically refer to a specific feature, it can be a pixel, multiple pixels, a feature, or a variety of different features, as long as it is a feature that is different from the spectral curve of the surrounding background environment—all can be called “abnormal”. In practical applications, HSI-AD can be used as a preliminary screening work for target detection, to quickly screen out suspected target features from a large scene, and then match with the prior information of the target spectrum to identify the target features.
For unsupervised methods, since it does not require any prior spectral information of the target and background, HSI-AD is an unsupervised detection method with less dependence on the label of the data set. Compared with other methods, the unsupervised deep learning method can extract more deep features and obtain better detection performance. However, due to the high spectral dimension of HSI, the correlation between the spectral bands is strong, and there is a large amount of information redundancy. Therefore, it is necessary to remove the correlation between the spectral bands through dimensionality reduction and feature extraction from the high-dimensional space to reduce redundant information. Hyperspectral data dimensionality reduction is to use low-dimensional data to represent high-dimensional data reasonably and efficiently. Principal component analysis (PCA) is the most commonly used traditional dimensionality reduction method. However, PCA is a linear transformation, and the nonlinear characteristics of HSI cause the PCA method to have certain limitations.
In practical applications, because the abnormal target is a sparse event with a minor probability relative to the background, the essence of the anomaly detection algorithm is to overcome the problem of inconsistent background distribution and try to make the abnormal target detection in the same distribution of background information. At the same time, it also tries to suppress the interference of background information and highlight abnormal target information.
1.4. Contributions and Structure
In this article, we focus on the HSI anomaly detection method based on deep learning, the purpose is to provide a more comprehensive overview of the existing methods.
Our work mainly stems from two aspects. On the one hand, this article hopes to clarify the principles behind the existing anomaly detection methods based on deep learning. We systematically reviewed a large number of relevant papers in literatures. From the perspective of deep learning network information extraction model features, the relevant references are divided into three categories: model-based, hybrid method-based, and other method-based. On the other hand, future research on HSI anomaly detection is also discussed.
The rest of this article is organized as follows. Section 2 summarizes the commonly used anomaly detection data sets in detail; Section 3 briefly outlines traditional machine learning methods and deep learning methods; Section 4 conducts an introduction of related models and according to the feature types extracted by the deep network, the previous work is divided into three categories for detailed introduction; Section 5 summarizes the performance evaluation indicators of anomaly detection. The sixth section compares the performance of the typical methods selected by the overview model; the seventh and eighth sections describe the challenges and future directions of the development of the hyperspectral anomaly detection field; and finally, the content of this article is summarized.
2. Datasets
For different hyperspectral sensors, the spectral range that can be collected is also different. The spectral range of “AVIRIS” is 400–2450 nm, “HYDICE” is 400–2500 nm, “ROSIS-03” is 440–850 nm, “NANO-Hyperspec” is 400–1000 nm. Commonly used airborne data sets for hyperspectral anomaly detection are shown in Table 1 and are described in detail below.
- (1)
- San Diego Dataset: The real hyperspectral data of the San Diego area collected by AVIRIS sensor. SDD-1 has 189 spectral bands, and the image data space pixel size is 100 × 100. The hangar, tarmac, and soil are the main backgrounds, and three airplanes and 134 spatial pixels are considered anomalies. SDD-2 has 193 spectral bands, spatial pixels 100 × 100, beach and seawater as the main background, and man-made objects with 202 spatial pixels in the water are regarded as anomalies.
- (2)
- Cat Island Dataset: Collected by AVIRIS sensor, it contains 193 spectral bands and the spatial pixels are 100 × 100. The main background is seawater and islands, and a ship with 19 spatial pixels is considered anomalous.
- (3)
- Pavia Dataset: the scene of Pavia city in northern Italy collected by ROSIS-03 sensor. Including 102 spectral bands, the image scene covers 150 × 150 pixels, the spatial resolution is 1.3 m/pixel, and the main background is bridge and water. There are some vehicles on the bridge accounting for a total of 68 pixels. The spectral characteristics of these pixels are different from the background, thus they are regarded as anomalies.
- (4)
- HYDICE Urban Dataset: an urban scene in California, the image size is 80 × 100, and the original data has 210 bands. After removing noise and water absorption, 162 bands are generally left for subsequent processing and analysis. The ground features include roads, roofs, grasslands, and trees. Among them, 21 pixels were considered abnormal.
- (5)
- GulfPort Dataset: Images of GulfPort area in the United States collected by AVIRIS sensors. Contains 191 spectral bands, the range is 400–2500 nm, the spatial pixel is 100 × 100, and the spatial resolution is 3.4 m. Three planes of different proportions on the ground are regarded as anomalies.
- (6)
- Los Angeles Dataset: The image of Los Angeles urban area collected by AVIRIS sensor, including 205 spectral bands, spatial pixels of 100 × 100, and spatial resolution of 7.1 m. Among them, LA-1 occupies 272 pixels of buildings and LA-2 occupies 232 pixels of houses are considered abnormal.
- (7)
- Wuhan University: The ultra-macro airborne hyperspectral imaging spectrometer (NANO-Hyperspec) loaded by UAV drones contains 270 bands and 4000 × 600 spatial pixels, which is much larger than the commonly used hyperspectral anomaly detection data set. Among them, there are 1122 abnormal pixels in Station and 1510 abnormal pixels in Park.
- (8)
- Texas Coast Dataset: The US Texas coast image collected by the AVIRIS sensor, including Texas coast-1, contains 204 spectral bands, spatial pixels 100 × 100, and spatial resolution 17.2 m, 67 pixels of which are regarded as anomalies. Texas coast-2, contains 207 spectral bands, spatial pixels 100 × 100, spatial resolution 17.2 m, vehicles in the parking lot are marked as abnormal.
- (9)
- Bay Champagne Dataset: The Vanuatu region image collected by the AVIRIS sensor contains 188 spectral bands, spatial pixels 100 × 100, and a spatial resolution of 4.4 m. Among them, 13 pixels are regarded as anomalies, accounting for 0.13% of the entire scene.
- (10)
- EI Segundo Data: The image of the El Segundo area in the United States collected by the AVIRIS sensor contains 224 spectral bands, spatial pixels 250 × 300, and spatial resolution 7.1 m. The data set consists of oil refinery areas, residential areas, parks, and campuses, among which oil storage tanks and towers are considered anomalies.
- (11)
- Grand Island: Collected by the AVIRIS sensor, it contains 224 spectral channels with a spatial resolution of 4.4 m, and man-made objects in the water are regarded as anomalies.
- (12)
- Cuprite and Moffett: Collected by the AVIRIS sensor, it contains 224 bands, the spatial size is 512 × 512, and the spatial resolution is 20 m. Furthermore, 46 and 59 pixels are regarded as anomalies, respectively.
In actual work, in addition to using the natural scene collected by the sensor, synthetic HSI is often used. Its purpose is to verify the adaptive ability of the proposed method in the case of complex background interference.
In addition, the above data set is collected by three different sensors, namely, AVIRIS, HYDICE, and ROSIS-03. Experiments on data sets collected by different sensors can verify the generalization and effectiveness of the method. Furthermore, in the data set, anomalies have different presentation forms, including point form and structural information. Data sets with different presentation forms of anomalies can also show the generalization and effectiveness of the method for anomalies of different scales [4].
3. Machine Learning Model in HSI-AD
3.1. Traditional Methods
As the prior knowledge of abnormal spectra is difficult to obtain, the abnormality is usually detected by background modeling of hyperspectral data or statistical surface features. Compared with the surrounding environment, the anomaly has two important characteristics that can be used to distinguish it from the background:
- (1)
- Abnormal spectral features are easy to distinguish in the spectral domain;
- (2)
- Abnormalities usually appear in smaller areas;
Therefore, it can be detected by establishing a reference background model or suppressing the background. Traditional modeling methods are divided into three categories: methods based on statistics, representation models, and tensor decomposition.
The Gaussian assumption based on the statistical model (assuming that the background obeys a certain distribution) makes the statistical model mathematically easy to handle. Therefore, the statistical model has been widely used in traditional modeling. A large number of methods are devoted to suppressing the background and establishing the background model. In 1990, Reed and Yu [5] proposed the Reed-Xiaoli (RX) method, which models the background as a Gaussian distribution, and the anomalies are sparse and can be detected from the background by the Mahalanobis distance. Based on the RX method, global GRX [5] and local LRX [6] methods are proposed, which estimate the statistical parameters of the background based on the entire image and dual windows, respectively. However, in practice, due to the complexity of HSI, it is not enough to use Gaussian distribution to simulate background distribution. Therefore, KRX [7], cluster-based (CBAD) [8] and support vector domain description (SVDD) [9] and other methods are proposed.
Representation-based models usually include collaborative representation, sparse representation, and low-rank representation. Among them, the collaborative representation-based detector CRD is based on the theory that background pixels can be well represented by neighboring pixels, but abnormal pixels cannot be well represented. Therefore, even with the participation of abnormal pixels, the background can be modeled adaptively. The Mahalanobis distance method based on low-rank and sparse matrix decomposition uses the LRaSMD technology to distinguish the background from anomalies, explores the low-rank prior knowledge of the background, calculates the statistics of the background, and then uses the difference of Mahalanobis distance to detect abnormal pixels [10].
Based on the theory of tensor decomposition, since HSI is regarded as a third-order tensor cube, the tensor decomposition method can be used to better mine the spectral and spatial characteristics of the spectrum. Since 2017, the application of tensor decomposition methods to solve the HSI-AD problem has become one of the hot spots [11,12,13,14].
In traditional machine learning methods, a common problem is that it is difficult for a feature extraction method to achieve good results in all types of data. The deep learning method solves this problem well and for different types of data, deep learning models can learn features autonomously based on different data.
3.2. Deep Learning-Based Methods
In recent years, deep neural networks have shown strong advantages in the modeling and generalization of complex datasets and can obtain more data features than traditional methods. Deep learning methods have been widely used in multispectral image classification, and some results have been achieved [15,16,17,18,19], but the HSI-AD method based on deep learning has just emerged. There are three commonly used models for anomaly detection, namely, hybrid model, semi-supervised model, and unsupervised model. The hybrid model is mainly used as a feature extractor to extract robust features, which can reduce the dimensional disaster of high-dimensional data, but because it does not improve the surface features of the potential feature layer, it is a sub-optimal choice; the semi-supervised method performs anomaly detection using pretrained model data that only contains normal samples, while the unsupervised model can better explain the characteristics of the data, and is more suitable for data with limited samples and difficult to obtain labels, such as hyperspectral data.
3.2.1. CNN
Convolutional neural network (CNN) is a combination of artificial neural networks and deep learning. The weights in the convolutional neural network are trained through the backpropagation algorithm to achieve deep learning. It not only has the advantages of traditional neural networks, such as better fault tolerance, adaptability, and strong self-learning ability, but also has the advantages of automatic feature extraction, weight sharing, and good input image and network structure.
In CNNs, the latter convolutional layer can extract the data features of the previous convolutional layer and extract the higher-level feature information from the low-level feature information. CNNs mainly include an input layer, convolutional layer, pooling layer, fully connected layer, and output layer.
The most important part of the CNN, is that it uses the convolution kernel (filter) to obtain the data feature information of the previous layer. The pooling layer is located behind the convolutional layer, uses the correlation characteristics of the input data to reduce information redundancy, and selects the characteristic information that best represents the data. The fully connected layer is located after the pooling layer, the loss of features is reduced through the fully connected layer, and the features are further enhanced. Because the expressive ability of the linear model is not enough, the activation function can add nonlinear factors to the network, so that the network can better solve more complex problems. Commonly used activation functions are ReLU, Leaky ReLU, Tanh, Sigmoid, etc. [20,21,22].
3.2.2. Autoencoder
For all unsupervised anomaly detection models, autoencoder (AE) and its variants are the core of the unsupervised anomaly detection model. AE and its similar variant structures have been applied to hyperspectral AD, mainly as a preprocessing of detection, that is, feature extraction or the use of residuals between the reconstructed background image and the original image to detect anomalies. Autoencoder is an unsupervised learning algorithm composed of an encoder and decoder. Its purpose is to learn to reconstruct itself with data representation close to the original input. The basic structure of AE consists of an input layer, a hidden layer, and a reconstruction layer.
SAEs (stacked autoencoders) are composed of stacked multiple layers of AEs, which map the output of one layer to the input of the next layer. VAE (variational autoencoder) is a generative model, which imposes constraints on the encoder, constrains the latent variables to be random variables, and according to the prior distribution , it obeys the multivariate Gaussian distribution . VAE uses reconstruction probability to detect anomalies. First, calculate the mean and standard deviation, then use prior sampling, and finally calculate the average reconstruction probability error as the reconstruction probability [23,24,25]. This will generate something similar but not the same as the sample. An AAE (adversarial autoencoder) is a specific AE. It uses the idea of generative adversarial networks (GAN), with stronger data generation ability [26].
3.3. DBN
Deep belief nets are composed of several layers of restricted Boltzmann machines (RBM). The use of unsupervised learning is similar to the autoencoder, its purpose is to retain the characteristics of the original features as much as possible while reducing the dimensionality of the features. Among them, RBM is a kind of neural perceptron. The output layer of the previous RBM is used as the input layer of the next RBM unit, which is stacked in sequence to form the basic structure of DBN.
3.4. GAN
Generative adversarial network (GAN) is another important network framework for unsupervised anomaly detection technology. The concept of GAN was originally proposed in the zero-sum game framework of game theory and has now become the most common and effective generative model. It generates new data points with certain changes by learning a specific data distribution. GAN consists of a generator model (G) and a discriminator model (D). The generator learns its features from the input data to generate as “true” fake samples as possible to deceive the discriminator, and the discriminator combines the real samples with the samples generated by the generator to identify and judge the authenticity. G accepts random noise as input and generates false data G(z), and D estimates the probability of a real sample. Therefore, the generator wants to fool the discriminator, and the discriminator wants to know the trick of the generator to know that the generator can generate the required data distribution [20,27,28].
3.5. RNN and LSTM
Recursive neural network is an artificial neural network based on sequence modeling. The essence of RNN is to simulate the memory ability of people, remember some of the information that has appeared in the learning process, and use the remembered information to affect the output of subsequent nodes.
RNN forms a loop body in the process of processing data. For a sequence of data, at each time , the RNN network unit will read the current input data and the implicit encode corresponding to the input data , to generate the implicit encoding result at time together. Then the is transmitted back to participate in the generation of the implicit coding of the input data at time . This cycle of processing is repeated until the sequence of data has been processed.
Long short-term memory (LSTM) is an RNN with a special mode, which is mainly used to solve the problem of gradient disappearance and gradient explosion during long sequence training. Compared with the more common RNN, LSTM can have better performance in longer sequences. RNN has only one transfer state , while LSTM has two transfer states, one (cell state) and one (hidden state). Among them, the passed changes slowly. Usually, the output is the passed from the previous state plus some values. And tends to be very different under different nodes.
4. HSI-AD Based on Deep Learning
At present, deep learning technology has been widely used in the classification of HSI. Compared with traditional methods, deep neural networks have shown strong advantages in the modeling and generalization of complex data sets and can obtain deeper data features than traditional methods. In recent years, many scholars have also applied deep learning technology to hyperspectral anomaly detection. Based on this theory, many deep networks have been proposed to extract features, and good processing performance has been achieved.
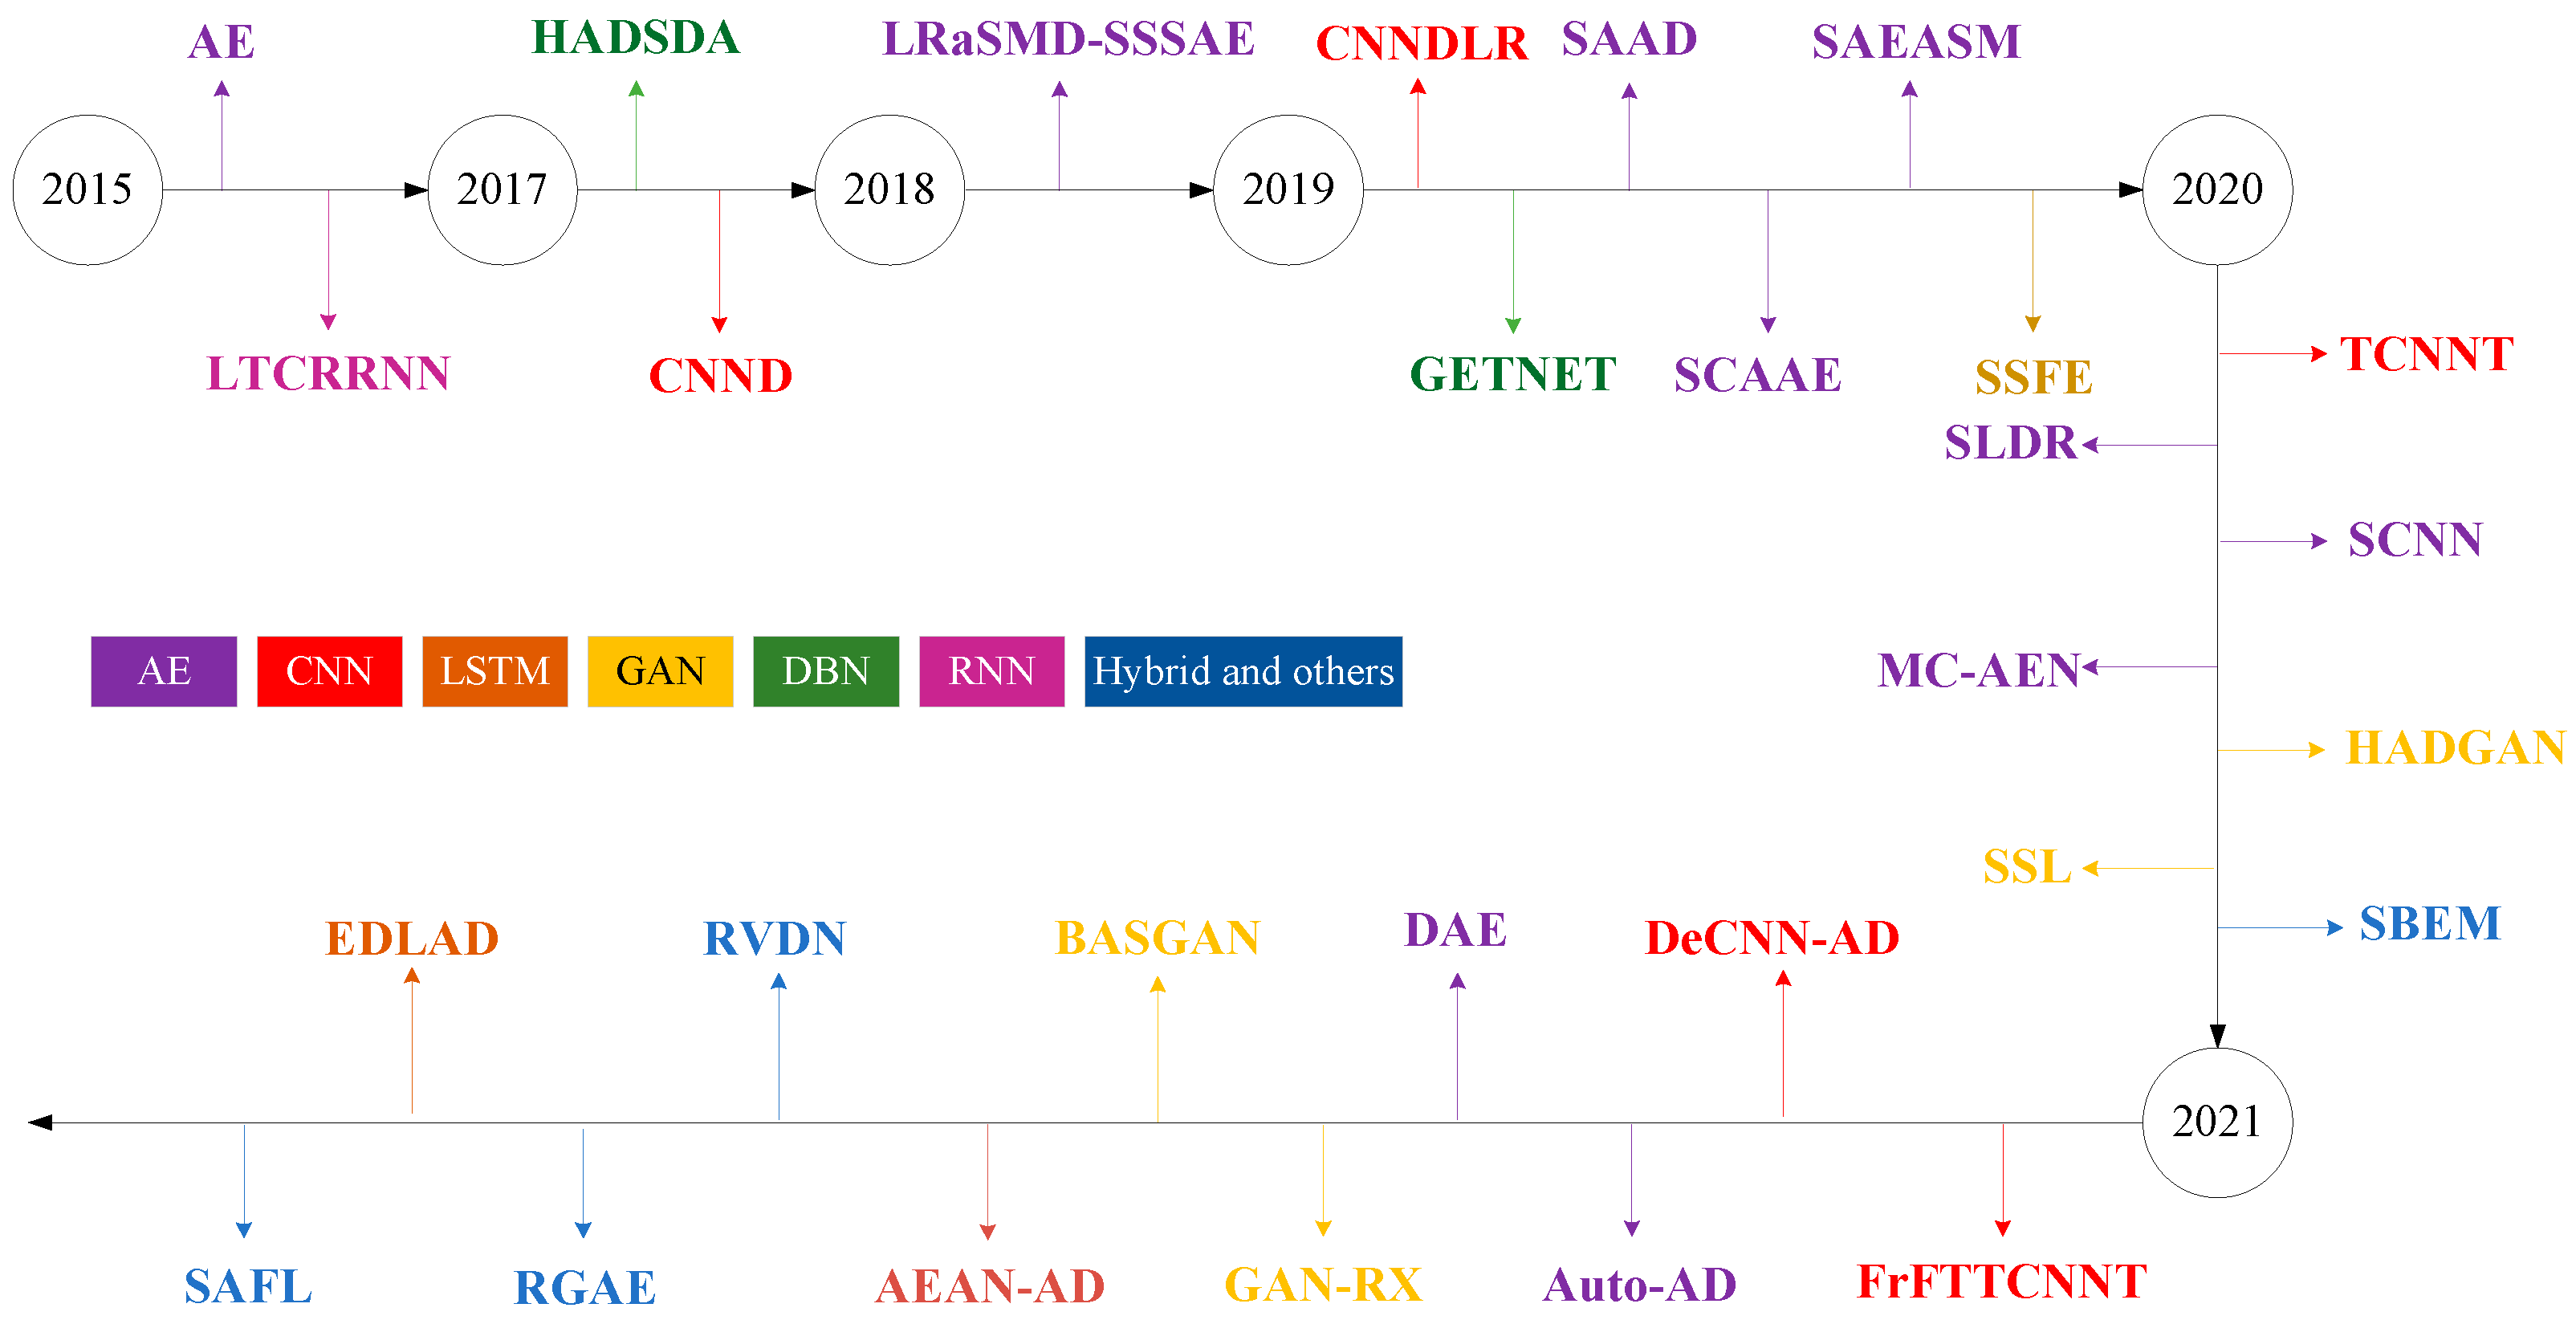
In this section, we will systematically review the HSI exception handling method based on deep learning. As shown in Figure 1, we divide the HSI-AD method based on deep learning into three categories: model-based, hybrid method, and another three types. Figure 2, is a timeline diagram of the development of the HSI-AD method based on deep learning.
These three networks will be detailed below:
Figure 1.
Network classification.
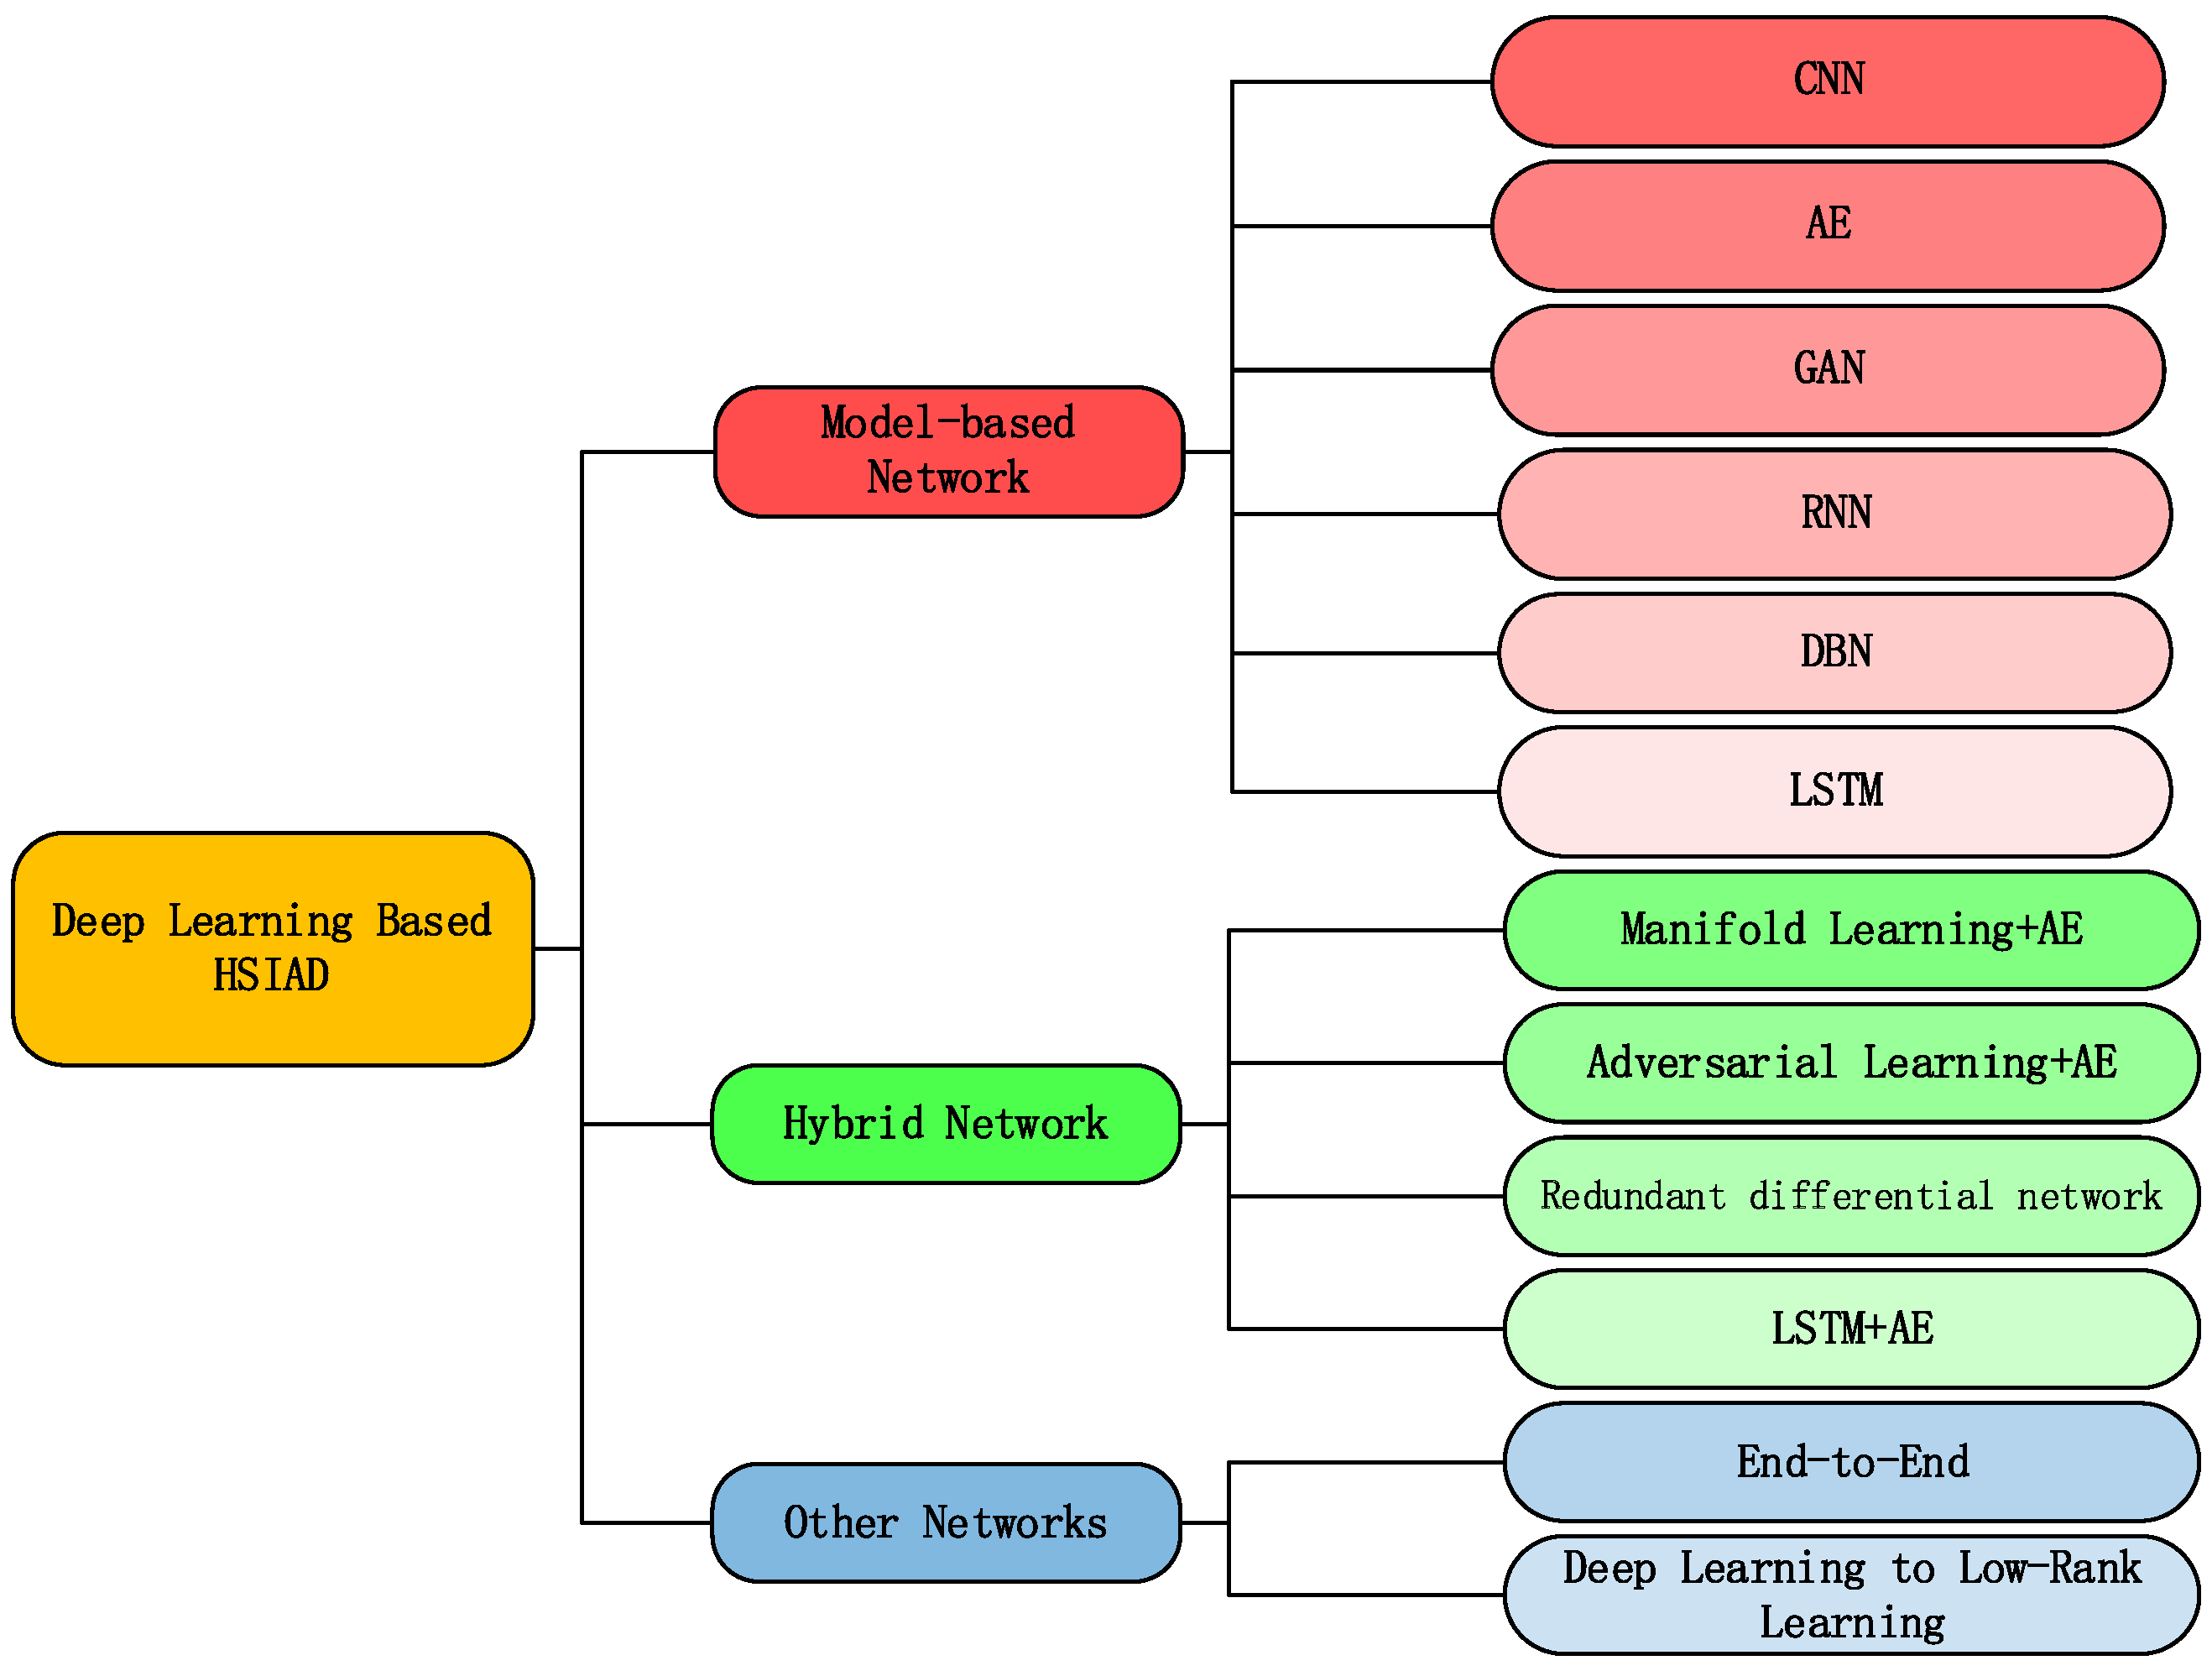
Figure 2.
The HSI-AD method based on deep learning distributed in chronological order.
4.1. Model-Based Network
4.1.1. Based on Convolutional Neural Network
The first attempt to use deep learning to solve the anomaly detection problem was an anomaly detection framework proposed by Li et al. [1] in 2017 (CNND), which used the value difference between adjacent pixel pairs in the reference image as input data to train a multi-layer CNN. Then in the test phase, the trained CNN was used to evaluate the difference between adjacent pixel pairs to detect anomalies. Because it labels samples, it cannot be regarded as an unsupervised method in the strict sense. Moreover, CNND measures the similarity between data from the same sensor. It should be extended to hyperspectral data collected by different sensors to truly detect the validity and generalization of the framework. The anomaly detection algorithm based on CNN and low-rank representation (LRR) proposed in reference [29] also requires reference objects with labeled samples. However, in practical applications, it is difficult to obtain the prior spectral information of real objects.
At present, tensor theory has been widely used in HSI processing. Anomaly detection algorithms based on tensors have achieved satisfactory detection performance, such as coskewness detector (COSD) [12], anomaly detection based on low-rank tensor decomposition (LTDD) [13] and algorithms based on tensor decomposition (TenB) [14]. However, these anomaly detection algorithms mainly use tensor theory for dimensionality reduction or denoising. In order not to destroy the spatial spectrum characteristics of HSI as much as possible, Ref. [30] proposed a tensor-based adaptive subspace detection (TBASD) algorithm, which uses a tensor block structure that can completely preserve the neighborhood relationship between the spatial dimensions and the global correlation between the spectral dimensions, similar to the patch in [31]. Unlike patch, tensor blocks in TBASD are mapped to a dictionary without loss of spectral dimension. TBASD can be seen as a tensor version of the background joint sparse representation (BJSR).
Based on the tensor theory, in view of the limitations of the above two CNN-based anomaly detection algorithms, Ref. [20] proposed a tensor-based transfer CNN model (TCNNT), which is an unsupervised CNN model. This method uses the test tensor and the local neighborhood tensor as the convolution kernel of CNN and extracts the depth features from the dictionary. The dictionary is also divided into non-overlapping tensor blocks. The advantage of the tensor block structure is that the spectral and spatial features are kept relatively complete, which is helpful for subsequent detection.
In traditional CNN, the bias and weight parameters are usually trained by a supervised method. In the TCNNT method, the weight is defined as
where is the width or height of the tensor block, is spectral size of tensor block, the HSI is normalized, so that the product of the convolution result and the weight parameter is not greater than 1, so that the bias parameter is generated from −0.5 to 0.5, and the optimal value is obtained through repeated experiments.
If the test point is abnormal, it is difficult to extract features from the dictionary tensor by using the test tensor as a convolution kernel. The convolution result of the test tensor and the dictionary tensor will be small, and the difference between the test tensor and the convolution result will be large. The convolution result of the local proximity tensor and the dictionary tensor will be large, and the difference between the local proximity tensor and the convolution result will be very small. The final test result will be even greater. On the contrary, the test point is not abnormal, and the final test result will be smaller.
Considering the application of tensor structure in TCNNT, Ref. [32] proposed a hyperspectral anomaly detection method based on tensor-based fractional Fourier transform and transfer CNN (FrFTTCNNT). Compared with the traditional Fourier transform (FT), the fractional Fourier transform (FrFT) can better deal with the non-stationary noise in HSI and effectively improve the performance of anomaly detection. The algorithm first converts the test block of each test point in the HSI into a one-dimensional vector to obtain a high-dimensional data set with more spatial information. Second, using principal component analysis (PCA) to remove the redundancy of the spectral bands in the data set. Then, Fourier transform is performed on the data set after PCA. Finally, in the fractional Fourier domain (FrFD), TCNNT is used to calculate the final result. The performance of the FrFTTCNNT algorithm is better than that of the TCNNT algorithm because the initial processing object of the former is the corresponding test block under each test point, which can make full use of the spatial characteristics of HSI. In addition, the Fourier transform can better deal with non-stationary noise in HSI and improve the resolution of background and anomalies.
In [33], since the ability of the low-rank (LRR) attribute-based anomaly detector to separate background and abnormal pixels depends on the expressive ability of the dictionary, it can be enhanced by designing an appropriate prior for the dictionary representation coefficient and constructing a better dictionary. However, it is not easy to manually design an effective regularizer, and complex regularization may increase the difficulty of solving and optimizing problems. Therefore, Ref. [34] HSI-AD method based on deep plug-and-play denoising CNN is proposed. The main idea of the plug-and-play prior used is the most advanced prior among existing priors [35,36] and CNN-based denoisers [33,37], rather than creating a new prior. The advantages of plug-and-play a priori have been proven in solving the problem of hyperspectral inversion, such as compression imaging [38], image denoising [39], image fusion [40], and so on. This algorithm is the first method that uses plug-and-play a priori for hyperspectral anomaly detection. The use of plug-and-play priors can insert the most advanced priors for the representation coefficients. At the same time, CNN-based denoisers, fast and flexible denoising convolutional neural networks (FFDNet) are used as the priors in the plug-and-play framework. An improved background dictionary construction method was proposed; the dictionary includes background pixels, but does not contain abnormal pixels. Experiments show that a pure and comprehensive dictionary can improve the performance of anomaly detection. The comparison of experimental results also verifies that the algorithm achieves better detection results than other methods.
To solve the problem that traditional algorithms are not suitable for HSI’s high-dimensionality and sub-pixel level information is not fully utilized. The authors of [41] proposed a general end-to-end two-dimensional CNN framework for change detection. By introducing a hybrid affinity matrix fused with sub-pixel representation, it can mine more cross-channel gradient features and fuse multi-source information. Furthermore, the designed two-dimensional CNN effectively learns the difference characteristics of multi-source data at a higher level and enhances the generalization ability of the algorithm. GETNET is different from general network weight sharing. GETNET uses local weight sharing. Because the hybrid affinity matrix has two parts of information with different properties, it uses two different convolution kernels: the upper left corner and the lower right corner. After convolution and pooling, two different levels of features are learned, and then the fully connected layer is used to fuse the two types of features to improve the generalization ability of the model.
Low-rank representation (LRR) is a model of data decomposition, which uses a specific method to select some pixels from the original data to construct a dictionary. The background estimated by the dictionary is assumed to be of low rank, and the abnormal component can be obtained through the residual of the original data and the estimated background. However, in the operation of LRR, the anomaly matrix must receive the constraint of norm to get the optimal result, and the atoms constituting the dictionary should contain various background components of the data. Therefore, it is necessary to propose an effective dictionary construction strategy to make its representation more stable and differentiated. In addition, most LRR methods use raw data for decomposition, which has high correlation and redundancy, which will increase the difficulty of decomposition and affect the distinction between anomalies and backgrounds. In [42], an end-to-end cube CNN is used to efficiently obtain the abundance of each pixel, which can automatically learn and interpret feature representations, and integrate spectral and spatial information, which has better performance than pixel-based CNN. In response to these problems, Ref. [29] proposed a low-rank hyperspectral anomaly detection algorithm based on density clustering of convolutional neural networks. It fully extracts the feature information of the HSI data set by training the CNN model, and estimates the abundance map with higher accuracy. At the same time, it combines the density-based clustering algorithm to extract relevant information from the abundance matrix, so that it can estimate abnormalities and minimize pollution.
4.1.2. Based on Autoencoder
Existing autoencoders based on unsupervised work are mainly divided into three types: autoencoder (AE), variational encoder (VAE), and adversarial autoencoder (AAE). The autoencoder (AE) is composed of an encoder and a decoder and can be regarded as an unsupervised learning algorithm. Its purpose is to learn a reconstruction close to the original input. In anomaly detection, it uses the error of each test data as an anomaly score, and a data point with a high anomaly score is considered an anomaly.
Variational autoencoder (VAE) is a model developed in recent years, which can generate samples that are similar but not the same as the samples in the data. The adversarial-autoencoder (AAE) uses the idea of GAN network to have stronger data generation capabilities. Autoencoders have been used for representation learning, and are widely used in natural language processing, text retrieval, speech recognition, and many other fields. Autoencoders effectively encode a given input in a non-linear manner to minimize reconstruction errors. Compared with linear methods, such as principal component analysis (PCA), independent component analysis (ICA), and minimum noise score (MNF), autoencoders have better performance.
Given the lack of effective background representation for HSI-AD, it is unable to adapt to the changing complexity of HSI. In 2015, an anomaly detection method for autoencoders was proposed by [43], which can use the learning ability inherited by autoencoders to represent scenes of different complexity. First, a sparse autoencoder (a regularized autoencoder is added and it does not limit the ability of the hidden layer to accept data) is used to sparsely encode the spectral image; then sparsely decode, reconstruct the original pixels, and then evaluate the coding error at each pixel as a measure of abnormality. Compared with the RX benchmark algorithm, it has achieved good results.
In the HSI field, an autoencoder (AE) was first applied to the classification of HSI; the authors of [44] first proposed an HSI classification algorithm based on a stacked autoencoder (SAE), which used an autoencoder [45,46] to learn the deep features of HSI layer by layer. In addition, the denoising autoencoder (DAE) proposed by [47] and the multi-scale convolution AE proposed by [48] have achieved satisfactory results. On this basis, in 2017, Zhao et al. [49] proposed a method based on stacked noise reduction autoencoder (HADSDA). The main idea is to first construct two different feature detection models: spectral feature (SF) and cluster fusion feature (FFC). The SF model uses the spectral characteristic value of each pixel. FFC uses clustering to construct a set of similar pixels, and then uses the stacked denoising autoencoder algorithm (SDA) to fuse the similar pixel levels and map them to the corresponding depth of the nonlinear space, thereby completing the feature-level fusion of similar features, and then to obtain richer deep nonlinear features, and finally obtain more accurate detection results.
The band redundancy for HSI and the spectral similarity between different bands may cause the problem that background and anomalies are difficult to separate in high-dimensional space, and the sparse representation model is not suitable for anomaly detection due to the lack of prior information. In 2019, a hyperspectral anomaly detection algorithm (SAAD) based on the reconstruction error residual of the sparse autoencoder was proposed by [50]. It first uses the sparse autoencoder to train samples of double concentric windows (inner window + outer window) to represent parameters, and then calculate the residual of the reconstruction error as the detection output. Its detection performance is better than other algorithms.
Given the high-dimensionality and band redundancy of HSI images, in 2019, Ref. [4] proposed a feature representation method for spectrally constrained autoencoders in hyperspectral anomaly detection (SCAAE). It was the first to propose the generative model AAE, for HSI feature representation, which introduces the spectral constraint strategy into the adversarial autoencoder. Specifically, the author introduces the spectral angular distance into the loss function of AAE to enhance the consistency of the spectrum and better learn to characterize high-dimensional spectral vectors. Then, considering the different contribution rates of each hidden node to anomaly detection, an adaptive weighting method is used to fuse each hidden node separately, and then a two-layer structure is designed to suppress background changes while retaining its abnormal characteristics. The performance of this method is better than traditional algorithms, and it also verifies the advantages of AE in hyperspectral anomaly detection.
In 2020, a hyperspectral anomaly recognition and reconstruction algorithm (SLDR) based on spectral learning was proposed in [10]. Anand Cho used a variational autoencoder (VAE) for anomaly detection. Because its reconstruction probability is high, and it is easier to use VAE to detect anomalies than to use AE. It uses the powerful characterization capabilities of VAE to mine inherent spectral features from high-dimensional spectra. First, it uses the spectral error map (SEM) to detect anomalies, because SEM can reflect the spectral similarity of each pixel between the input and the reconstruction well. Secondly, the spectral angular distance (SAD) is added to the loss function of the proposed SLDR model, which constrains the model to generate a reconstruction with greater spectral similarity to the input. Third, it imposes constraints on the encoder to make it generate latent variables that obey the unit Gaussian distribution, which helps the decoder to reconstruct a better background relative to the input. The results show that compared with RX, CRD, AED, and AAE, the proposed SLDR method is better than other classic anomaly detection algorithms [51].
Although representations learned by AEs are useful for background estimation, the existing AE-based methods are complicated, and require parameters to be manually set, in addition to preprocessing or post-processing procedures, e.g., the dimension of the embedding manifold [10] or the number of principal components [52]. In addition to pre-processing or postprocessing, parameters need to be manually set. In 2021, in response to the appeal, an autonomous hyperspectral anomaly detection network (Auto-AD) was proposed by [53]. Among them, a hyperspectral anomaly detection framework based on full convolutional AE is used to reconstruct the background with the same dimensions as the original image to avoid the loss of spectral information, and the detection of anomalies based on reconstruction errors does not require additional construction of detectors. In addition, the Auto-AD method does not need to manually set any parameters, nor does it involve preprocessing or postprocessing. Moreover, the network can accurately reconstruct the background, and abnormalities are automatically separated. Additionally, because in the background estimation training process, the probability of anomalies being reconstructed is still very low. Additionally, proposing an adaptive weighted loss function to further feedback the reconstruction error, so as to reduce the influence of potential abnormal pixels with large reconstruction error on the total loss. Additionally, in the training process, the weight of the abnormal pixel is reduced, and the adaptive update of the weight also makes the anomaly and the background have a higher contrast.
For the following problems in the field of hyperspectral anomaly detection:
- (1)
- Can the detection model applied to natural images be directly extended to HAD tasks without any background or abnormal training samples?
- (2)
- If not, how to design the network architecture in a spectrum-driven way to take advantage of the inherent spectral characteristics without supervision.
- (3)
- Is it possible to improve the detection performance by emphasizing the discriminative constraints on the feature extraction network?
In 2021, a dual feature extraction network (DFEN) was proposed by [54]. The algorithm studied the function of dual networks. The network inputs high-dimensional spectral information and outputs discriminative information without background or abnormal training samples. Additionally, for the first time to jointly train two AESs in hyperspectral anomaly detection, one of which is used to mine the potential features in the original spectral data, and the other AE is used to learn the potential features in the background spectral data. Moreover, it imposes an end-to-end differential learning loss between the two networks, including adversarial learning and Gaussian constraint learning. Among them, the purpose of adversarial learning is to maintain the original frequency spectrum, and the purpose of Gaussian constraint learning is to learn the background distribution of the latent space. Additionally, based on the mean square error spatial distance between the two potential feature matrices and the orthogonal projection divergence spectrum distance, the spatial and spectral anomaly scores are calculated, and the difference between the features extracted by the double AES is used for anomaly detection. By combining the differences in these two areas, the accuracy of the detection results and the false alarm rate are improved.
Because the autoencoder is very sensitive to noise and anomalies during the training process, the relationship between pixels is very easy to be discarded. In 2021, Ref. [55] proposed a hyperspectral anomaly detection algorithm (RGAE) based on a robust graph autoencoder. In order to enable AE to better deal with noise and outliers in training, it uses to redesign. Finally, the reconstruction residual is used as the basis of hyperspectral anomaly detection. Through a large number of experiments on three real data sets, the superiority of RGAE in hyperspectral anomaly detection is verified.
In [49], a self-encoding based on stacked noise reduction only uses the spectral characteristics of HSI. However, spatial features play an increasingly important role in HSI processing, and it has been verified in HSI classification that the performance of detection algorithms that use the spectral spatial features of HSI data is generally better than traditional detection methods that only consider the spectral features of HSI data. In 2018 [56], a spectral space stacking noise reduction autoencoder based on low-rank sparse matrix decomposition (LRaSMD-SSSAE) was proposed for hyperspectral heterogeneity detection. First, the Go Decomposition (GoDec) algorithm is used to solve the low-rank background components and sparse anomaly components; secondly, the stacked autoencoder (SAE) is used to extract the depth feature information on the sparse matrix of the spectral depth feature and the low-rank matrix of the spatial depth feature, respectively. Finally, the spectral-spatial feature matrix is established, and the local Mahalanobis distance algorithm is used to calculate the final detection result.
In 2019, Ref. [57] used the residual ratio idea of similar background joint sparse representation (BJSR) and tensor-based adaptive subspace detection (TBASD) and proposed an adaptive subspace model based on stacked autoencoders (SAEASM). The method first uses three windows centered on the test point, the inner window, the outer window, and the dictionary window, to obtain the local background pixels and the dictionary in the HSI. Second, it uses the SAE framework to obtain the difference in deep features between the test points and the local dictionary pixels. Then, the SAE framework is used to obtain the difference between the local background pixels and the deep features of the local dictionary pixels [56]. Finally, based on the 2-norm of the above two deep features, an adaptive subspace model based on a stacked autoencoder is used to obtain the detection results.
The high spectral dimension of HSI will lead to a strong correlation between spectral bands, and there are many redundancy problems. In 2020, Ref. [58] propose a hyperspectral anomaly detection framework based on segmentation and convolutional neural network algorithms. This method is based on segmentation and uses the statistical characteristics of the segmented area to suppress false alarms because clustering and segmentation can divide the input data into a segmented group. It is assumed that the distribution of each segment is close to the multivariate Gaussian distribution, then the more abnormal targets appear, the larger the standard deviation of the corresponding segment, and the frequency of abnormal pixels is lower than that of background pixels. At the same time, a neural network based on convolutional stacked autoencoding (SAE) is used to extract the depth and nonlinear relationship from the input data, which uses a one-dimensional convolutional autoencoder (1-D) and a two-dimensional convolutional autoencoder (2-D). The two structures are different. Each layer of 1-DSAE consists of a one-dimensional filter, ReLu activation function, maximum pooling of the encoder, and up-sampling of the decoder part. Each layer of 2-DSAE only contains a two-dimensional filter and a ReLu activation function. The last layer of the decoder part of the two networks uses a sigmoid activation function to stay within the dynamic range of the input data. The proposed method can improve the TPR of the low FPR area, especially the TPR of the global area.
In 2021, an unsupervised pixel-level hyperspectral anomaly detection method based on an autoencoder confrontation network was proposed in [59]. The algorithm includes three steps: data preparation, reconstruction, and detection. In the data preparation stage, it uses the unsupervised method of background purification to train the deep network; in the reconstruction stage, it proposes three different depths of auto-encoding adversarial network models (AEAN): 1-D-AEAN, 2-D-AEAN, and 3-D-AEAN. These three models are developed for spectrum, space, and joint spectrum-space domains. The goal of the AEAN model is to generate a near-real synthetic HSI and calculate the reconstruction error map between the original image pixels and the synthetic image pixels. In the detection phase, a WRX detector based on weighted RX is used.
This algorithm refers to the structure in [60,61], where the AD method of [60] includes a denoising autoencoder, which is suitable for outliers and video AD problems. The network model proposed in [59] uses an autoencoder instead of a denoising autoencoder. In [61], a model called GANomaly was used for semi-supervised advertising from a labeled image dataset. It uses three loss functions to train the network in a semi-supervised manner, and we use two loss functions to train the network in an unsupervised manner. Different from [59,60], it uses an autoencoder to process pixel-based AD from HSI under the framework of adversarial learning.
4.1.3. GAN
In 2020, Ref. [28] considered the advantages of the reconstruction ability of the autoencoder and the generalization ability of the GAN network in the high-dimensional, unlabeled, and limited-sample HAD. This paper proposes a hyperspectral anomaly detection method based on discriminative reconstruction constraints to generate a confrontation network. This is the first time that a GAN network is used in HSI-AD. First, use the autoencoder network and the counter potential discriminator to learn the normal background distribution in the latent feature layer, and AE learns the background reconstruction as much as possible to ensure a lower reconstruction error for normal samples and a higher reconstruction for abnormal samples error. Secondly, increase consistency enhancement representation and shrinkage constraints (good representation of normal samples and poor representation of abnormal samples) in the potential feature layer to ensure that the abnormal samples and normal samples are projected to similar positions in the potential feature layer. Third, the use of adversarial image feature correctors in the input space (to avoid too-strong generalization ability to generate variants that do not belong to this category) can ensure the reliability of the generated samples. Finally, the spectral joint anomaly detector based on the energy-based space (the minimum band selection method is the most pre-spatial detection step) and distance is applied to the residual image to generate the final detection image.
Given the sensitivity of unsupervised techniques to noise and data processing, and due to the lack of constraints from labeled training examples, they are usually not as accurate as supervised techniques. Moreover, anomaly-based labels are more difficult to obtain than normal, in order to improve the accuracy of the supervision method while making up for the lack of availability of training samples. In the field of anomaly detection, a semi-supervised method [62,63,64,65,66,67] is used. This method only uses the existing labels of normal training samples to train the model, and then applies the model to normal and abnormal samples to distinguish abnormalities. Semi-supervised methods can be considered as a trade-off between labeling and performance. However, both normal and abnormal labels are not available in HSI, thus limiting the application of supervised methods.
In 2020, Ref. [68] proposed a hyperspectral anomaly detection framework (SSL) based on generative adversarial semi-supervised spectral learning. The framework detects HSI anomalies by studying spectral and spatial features. First, a GAN-based model is proposed to estimate the background distribution and initial spectral features in a semi-supervised manner, where each pixel represents the possibility of anomalies that can be inferred by applying the trained model to all spectral vectors. Then, the morphological attribute filter is used to generate initial features in the spatial domain. Finally, the feature fusion technology is used to suppress the background, and the complementary information from different aspects is combined to obtain the fusion detection map.
In 2021, Ref. [27] proposed a hyperspectral anomaly detection algorithm based on generative adversarial networks (GAN). The algorithm trains the GAN model to generate a synthetic background image that is as close to the original background image as possible. Then, by subtracting the composite image from the original image, we can remove the background from the original HSI. Finally, the Reed-Xiaoli (RX) anomaly detector (AD) is used to detect anomalies in the spectral differential image.
In view of the complex background of HSI images, unknown prior knowledge and unbalanced samples, it is difficult to separate the background and anomalies. In 2021, Ref. [69] proposed a hyperspectral anomaly detection background anomaly separable feature method based on generative adversarial network (BASGAN) for HSI anomaly detection. Aiming at the fact that GAN performs well in background samples but poorly in abnormal samples, it transforms the problem of unsupervised hyperspectral anomaly detection into a new semi-supervised network architecture. In this way, accurate background data distribution characteristics are found, and an adaptive balance between performance and sample limitation is achieved. And the latent representation and image reconstruction confrontation loss are introduced into the semi-supervised confrontation training method. For the separability of background and anomalies, it adaptively constructs pseudo-background samples for training, which overcomes the difficulty of manual labeling. And for the first time, fake samples are used to impose background anomaly separation constraints on the GAN network, and to correct the suspicious samples that are generated in the background estimation process that are not sufficiently separable from the background.
4.1.4. Recurrent Neural Network (RNN)
In 2016, Lyu et al. [70] used recurrent neural networks for land change detection for the first time. By introducing and improving the basic RNN framework of the LSTM model, the algorithm can provide a stable change rule for the change detection of multi-temporal remote sensing data. And the learned rules can be transferred from one learning image to another new multi-target image, with good transferability. The algorithm has good robustness when detecting binary and multi-class variation samples. However, there are cases where a small number of unchanged samples are mistaken for changed samples. Although the data set used by the author is a multi-spectral image, land change is a kind of anomaly detection, thus the application of cyclic neural network to HSI-AD is also worthy of our reference.
4.1.5. Deep Belief Network (DBN)
Aiming at the accuracy of the HSI anomaly detector mainly affected by background distribution assumptions and abnormal pixel pollution, in 2018, Ref. [71], inspired by the idea of deep learning and weighted RXD, proposed an HSI anomaly detection method based on an adaptive weighting deep belief network (DBN). It uses an unsupervised autoencoder to learn the advanced features of the HSI data set. In order to overcome the pollution of abnormal pixels, a statistical method is proposed to identify potential local abnormal pixels and reduce their influence through a penalty factor, combining the reciprocal of the reconstruction error with the penalty factor, the adaptive weight is used to measure the contribution of adjacent pixels.
For [71], the reconstruction error between the input and output of the DBN autoencoder is directly used as an abnormal score, and only the spectral characteristics of HSI are used, and the spatial characteristics are not included. In 2019, Ref. [72] proposed a hyperspectral anomaly detection method (SSFE) based on spectral and spatial feature extraction. In this method, first, DBN is used to extract deep spectral features from the suppressed data space. Then, a detector based on Mahalanobis distance (MD) is used to detect abnormalities in a single pixel or a small number of pixels.
4.1.6. Based on Long and Short-Term Memory Network
For the method based on the self-encoder network, it learns a low-dimensional representation, while ignoring the spectral continuity between adjacent bands. Therefore, in 2021, Ref. [73] proposed a hyperspectral anomaly detection network (EDLAD) based on long short-term memory (LSTM). The gating mechanism introduced in the LSTM network can fit the spectral continuity between adjacent bands well, and at the same time can ensure that the background is maintained during the reconstruction process to reduce abnormal pollution.
4.2. Based on Hybrid Network
4.2.1. Manifold Learning Constrained Autoencoder Network
Deep learning-based methods have achieved good results, but the latent representation learned by AE or DBN is global, and neither of them considers the local structure information of hyperspectral data. The recognition of anomalies is to regard pixels with significant differences in their spectra from their neighborhoods as anomalies. Therefore, local features help improve detection accuracy. In 2020, Ref. [74] a hyperspectral anomaly detection algorithm for autoencoders based on popular constraints (MC-AEN) was proposed. The popular learning method is a non-linear dimensionality reduction method, which can obtain the structural information of the input data and provide a new way for feature extraction. The algorithm first uses popular learning methods to learn embedding popularity and then uses the learned embedding popularity constraints to learn the latent representation of AE, so as to completely retain the internal structure of hyperspectral data. Combining the global reconstruction error of MC-AENDE and the local reconstruction error of the learned latent representation, it makes full use of the structural information of the hyperspectral data to obtain better detection performance.
4.2.2. Semi-Supervised Background Estimation Based on Adversarial Learning and Autoencoder
In 2020 [75], in order to improve the performance of the supervised method, and at the same time alleviate the problem of the lack of labeled training samples, a semi-supervised background estimation model (SBEM) based on autoencoder and adversarial learning was proposed. This is the first attempt in the field of hyperspectral anomaly detection to construct an anomaly detection model with a semi-supervised method. The model uses only background samples to train the model and then applies the model to all samples. The SBEM is composed of the encoder, decoder, and discriminator. It mainly includes three steps: unsupervised background search, semi-supervised background learning, and original his test.
In the unsupervised background search, the difference between the low probability of anomaly occurrence and the essential difference from the known background is used to ensure the purity of the background, and the pixels with a high probability of belonging to the background are retained. In semi-supervised background learning, reconstruction loss, spectral loss, and adversarial loss are jointly trained to fully capture the required background distribution. This process constructs a background estimation function based on the searched background samples. Finally, all spectral samples are input into the background estimation function.
4.2.3. Redundant Difference Network
In the hyperspectral anomaly detection based on spectral dimension transformation, the unrecognizable features in the original feature space can be easily identified through feature projection. And in the network based on the autoencoder, although the reconstruction probability can effectively highlight the abnormal target, because the reconstructed feature space has the same dimensions as the original feature space, it often has a higher false detection rate. In 2021, Ref. [76] proposed an unsupervised network model of redundant difference network (RDVN). This algorithm is influenced by the Siamese network [77] (Bromley et al., 1993) (SN), generative adversarial network [78] (Alex et al., 2017) (GAN), compound eye theory (Yingjie, Hinde, and Gillingwater 2003) [79] (CE), and other theoretical inspirations. SN is a supervisory network composed of two neural networks with the same weight and structure, used to measure the similarity of two inputs. However, since HAD is an unsupervised method, the training method of the network must be adjusted. Therefore, the confrontation mechanism of GAN is introduced into the SN, and the following adjustments are made: (1) the same input—each network uses the same training sample; (2) different network parameters—the weight and offset of each network are different; and (3) the training process adopts alternate training between the two networks (adversarial training). As we all know, many insects have compound eyes composed of many lenses. Each lens of the compound eye captures its own image. Combining this phenomenon, the network structure is further improved to RDVN, which has higher robustness.
RDVN is composed of multiple single-layer neural networks with the same structure and hyperparameters. A set of training samples is used as the input of the network, and the difference between the activation value of any network and the reference network is used as the backpropagation error. After the training is completed, the difference between the activation values of the two networks is used as the distinguishing feature (DF). Finally, the DF is used as the input of the anomaly detector to obtain the detection result.
DF not only highlights abnormal targets and increases the true positive rate, but also increases the distinguishability between different categories, thereby reducing the false positive rate.
4.2.4. Adversarial Autoencoder Network Based on LSTM
Aiming at the problem that the current anomaly detection algorithms based on deep learning often use a single pixel as the input and the sequence data spatial information in the push-broom sensor that collects HSI cannot be effectively used, in 2021, Ref. [80] proposed a linear network (SAFL) based on an adversarial autoencoder (AAE) and a long short-term memory network (LSTM). The model maps the sequence data to a low-dimensional space that obeys the Gaussian distribution, and can learn more potential features, especially for darker and smaller targets. Compared with traditional RX and LRX methods, this method can achieve higher detection rate with lower false positive rate.
4.3. Other Networks
4.3.1. End to End
Although deep learning methods can alleviate dimensionality problems, the DP methods currently proposed are implemented in two steps: first perform characterization learning to extract features, and then perform abnormal target detection on the extracted features. However, the feature extraction will have a huge impact on the final performance of the model, and the two-step method may obtain sub-optimal solutions. Therefore, it is necessary to explore a new framework to jointly optimize the feature extractor and estimate the network performance, so that the network can obtain better performance gains under unsupervised conditions. In 2021, Jiang K et al. [81] proposed an end-to-end local invariant autoencoding density estimation model (E2E-LIADE) for HSI-AD. Among them, in order to satisfy the prevalence assumption, a local invariant autoencoder (LIA) is introduced to extract the inherent low-dimensional prevalence embedded in the original space; and combine the local invariant of the graph regularization constraint with the reconstruction error to obtain an augmented low-dimensional representation (ALDR). More importantly, E2E-LIADE optimizes LIA’s ALDR and density estimation network in an end-to-end manner at the same time, preventing the model from falling into local optimality.
4.3.2. Deep Learning Converted to Low-Rank Representation
In unsupervised hyperspectral anomaly detection, the lack of prior information often limits the performance of the detection. Therefore, in 2021, Ref. [82] proposed a hyperspectral anomaly detection method based on weakly supervised low-rank representation. This method transforms the HSI anomaly detection of deep learning into a low-rank optimization problem, which can not only characterize the complex and diverse backgrounds in real hyperspectral anomaly detection, but can also obtain relatively strong supervision information. First, it uses weak supervision to model the background distribution, which helps to build a dictionary in an all-round way. Secondly, considering the different nature of the background and anomalies, a dictionary-based low-rank algorithm is used to further explore the background structure, while eliminating the bias introduced in the previous step, and finally the low-rank result and the initial processing result are combined for anomaly detection to provide training data for background estimation.
5. Performance Evaluation Index for Anomaly Detection
5.1. Based on Convolutional Neural Network
The receiver operating characteristic curve (ROC) is a qualitative analysis of the model. The abscissa of the curve is the false positive rate (FPR), and the ordinate is the true positive rate (TPR).
AUC (area under ROC curve) is the area under the ROC curve, which is a quantitative analysis of the model. In practice, AUC is often used as an index to evaluate the accuracy of the method. The larger the AUC value, the better the detection performance of the algorithm.
5.2. Box Plot
A box plot can effectively evaluate the algorithm’s suppression of the background and the separation of the target. The upper and lower quartiles of the box are the upper and lower quartiles of the data, meaning that the box contains 50% of the data. In the middle of the box is the median of the data, representing the average level of the data. The top and bottom lines of the box represent the maximum and minimum values of the data. Generally, the height of the red and blue boxes is used to indicate the suppression of the background and abnormalities of different algorithms. In HSI-AD, the lower the blue box, the more severe the background is suppressed; the distance between the red box and the blue box represents the algorithm’s separation of the background and the anomaly. The larger the interval, the more conducive to the separation of the target and the anomaly. It shows that the separation of the algorithm is better. An example box plot is shown in Figure 3.
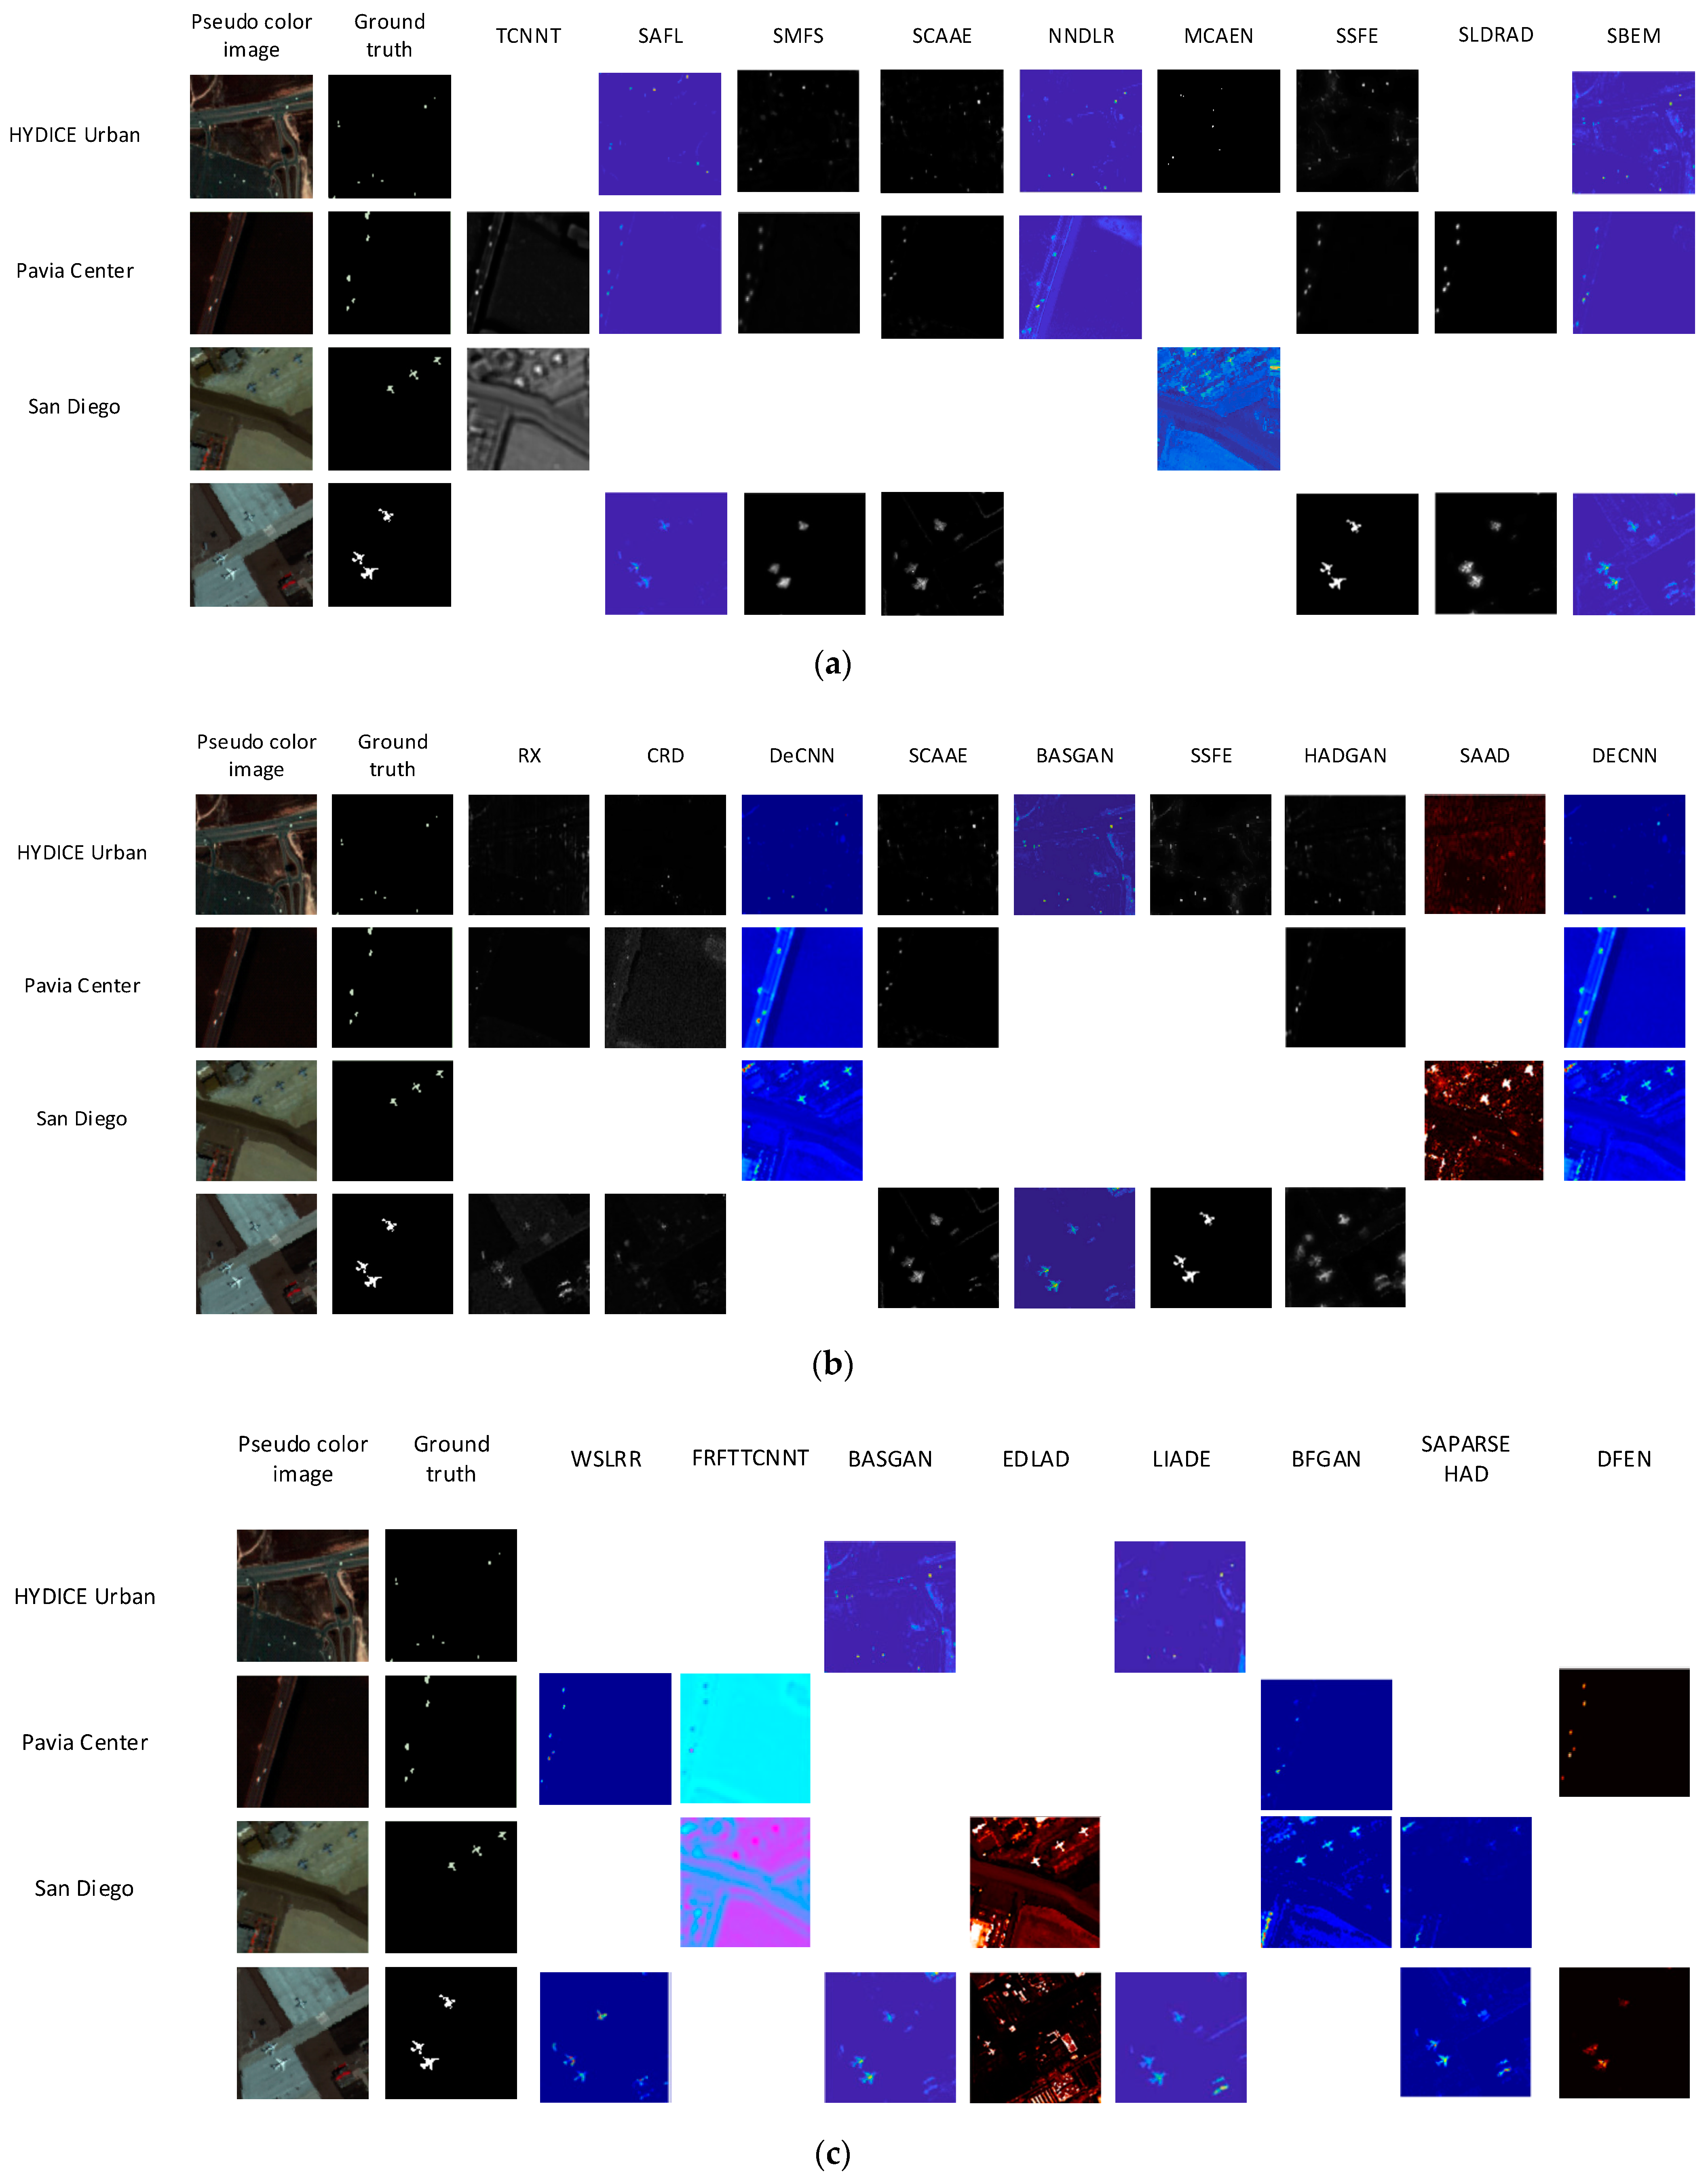
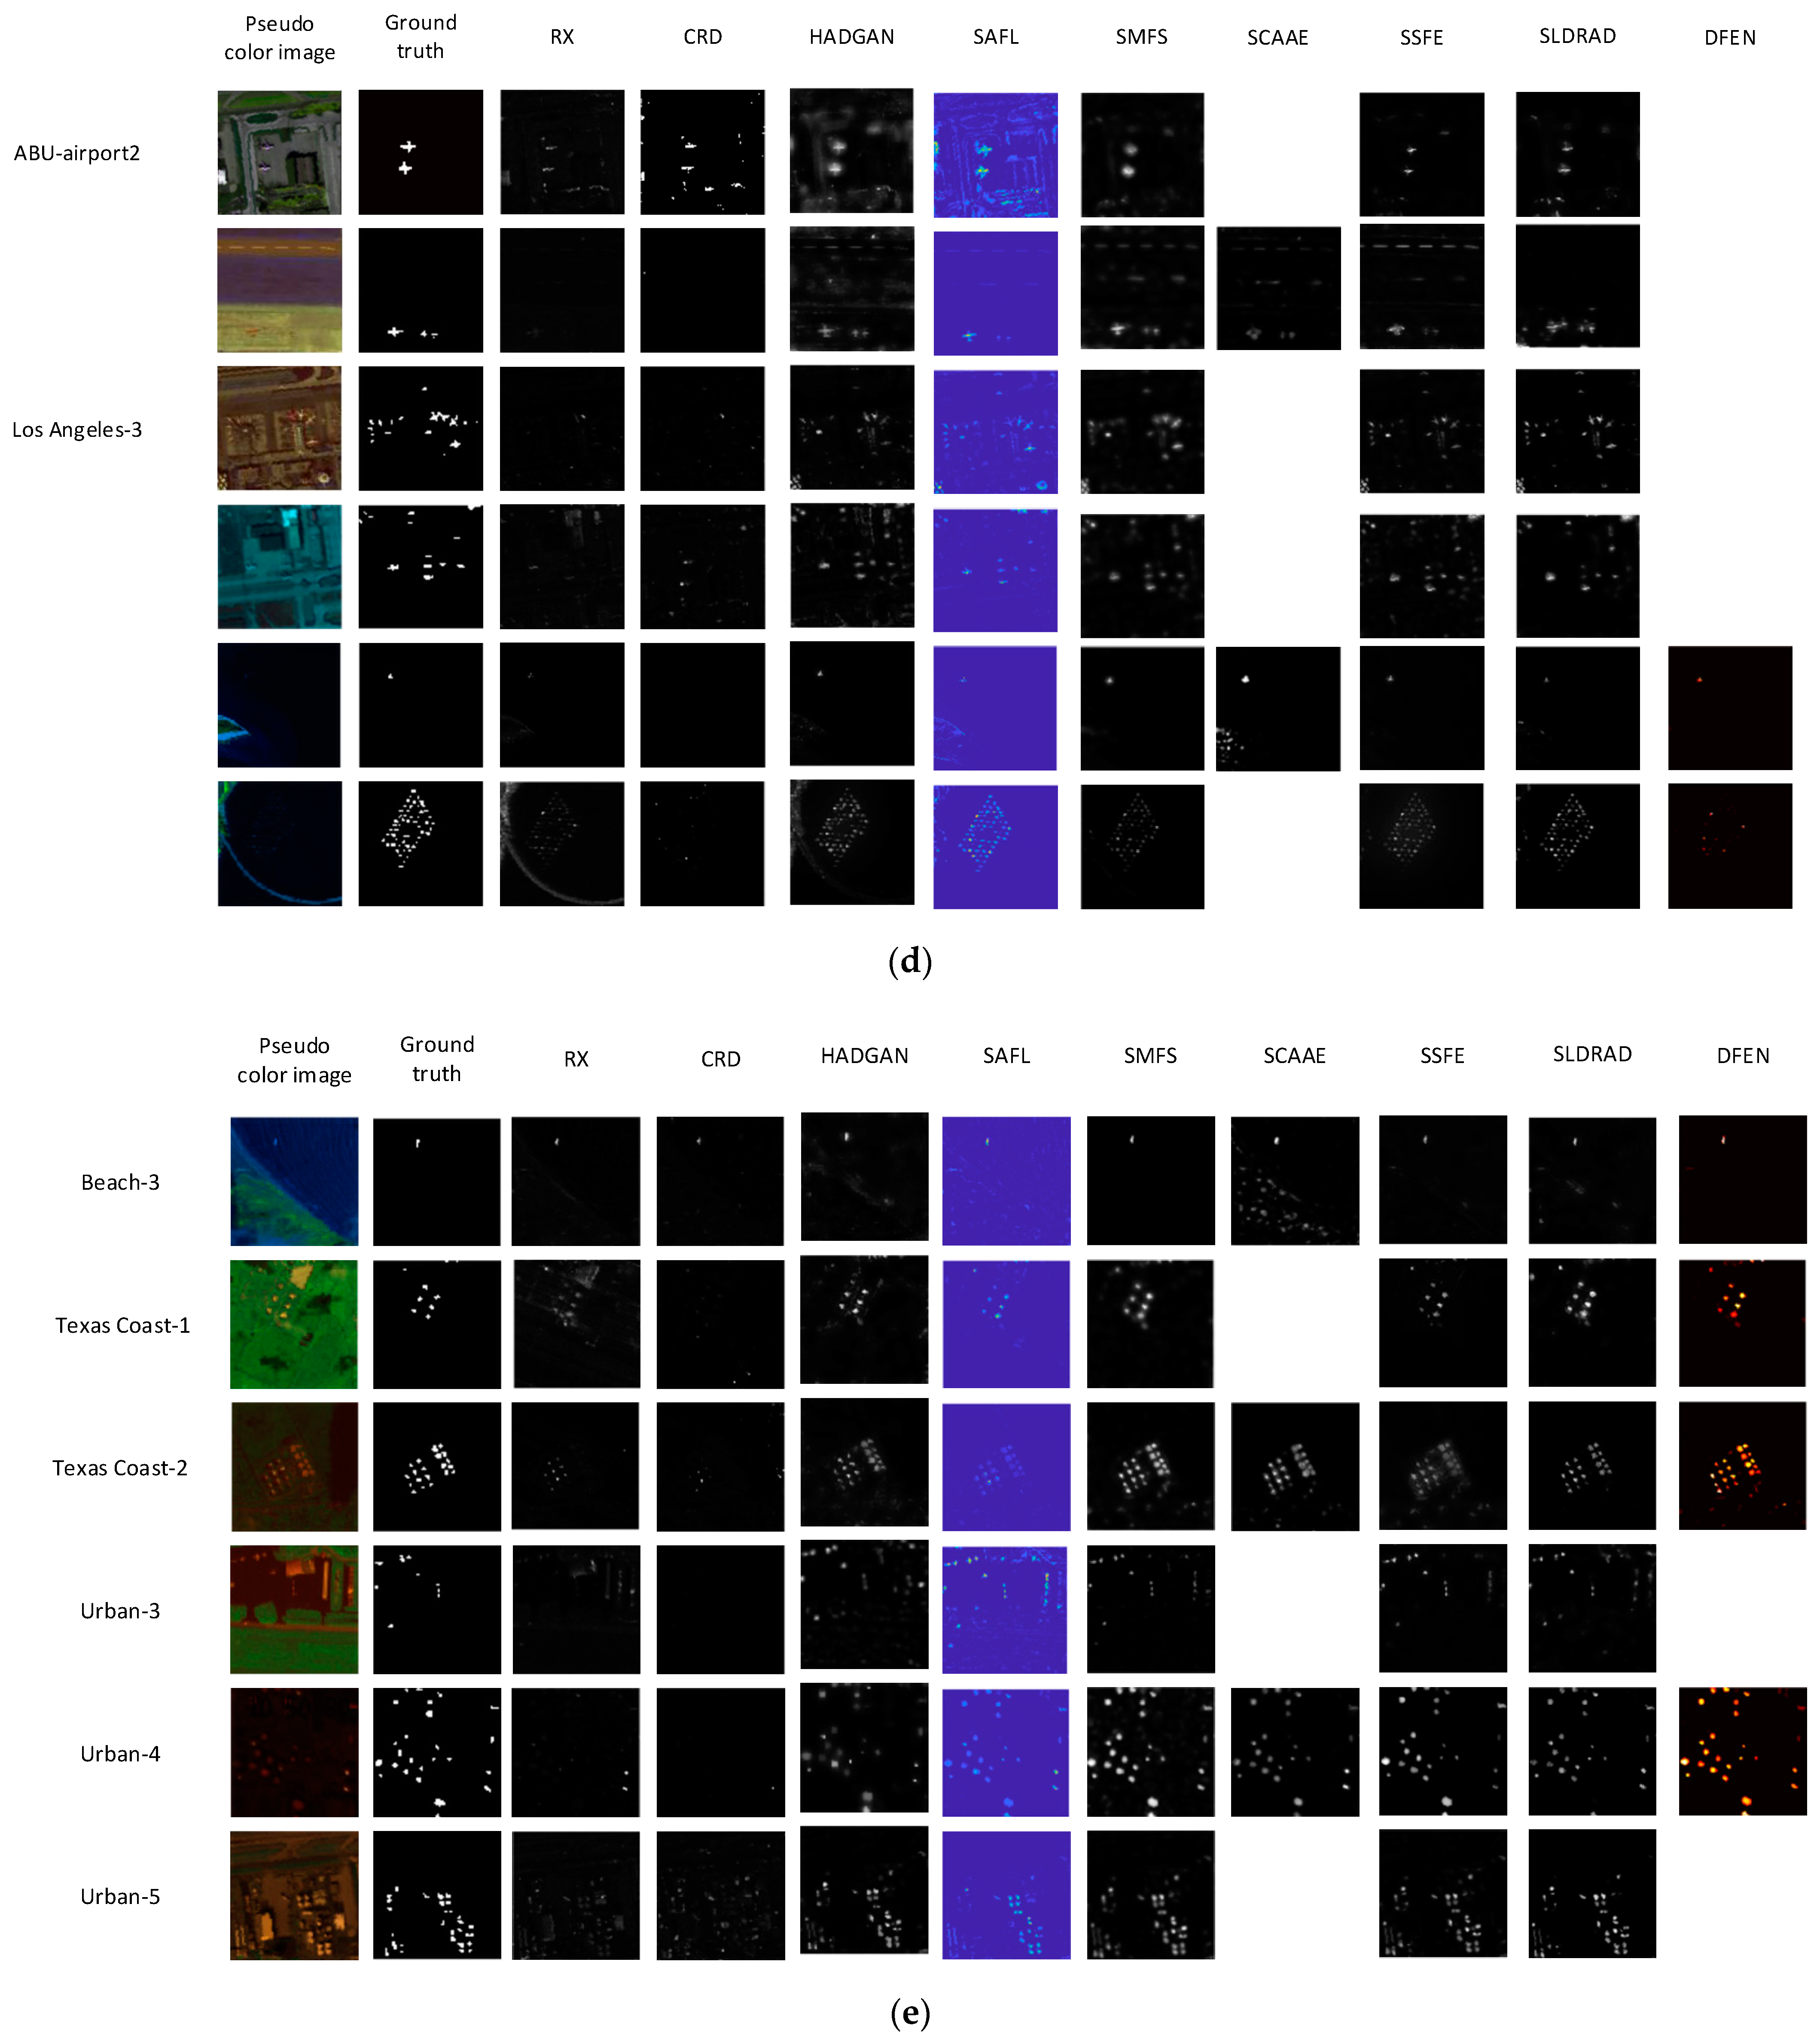
6. Performance Comparison
In this section, several typical models will be selected from the above classification methods and compared with traditional algorithms to study the performance of anomaly detection, among them, traditional algorithms: RX based on statistics, CRD based on representation, and TBASD based on tensor. Since the experimental data sets of each algorithm are different, a common data set is selected as much as possible for comparison, in order to more reasonably verify the anomaly detection performance of different algorithms on the same data set. Among them, the bold mark indicates the AUC value of the algorithm with the best performance for this data set. Figure 4 shows the detection results with different models on different datasets, respectively.
At the same time, we summarize the detection results of different algorithms on different data sets, which can more intuitively show the anomaly detection effect between different algorithms on the comparison graph.
In Figure 4a–d, the detection results of some algorithms on some data sets are listed. Take (a) as an example, in the San Diego data set, background and anomaly separation of RX is very poor, while background and anomaly of CRD are vague. The degree of background separation of SCAEE and HADGAN was significantly better than that of RX and CRD. In the Pavia Center dataset, compared with RX and CRD, SCAEE, and HADGAN, outliers are more complete and clearer, while background and anomaly of CRD are not well separated, and the outliers of RX are very fuzzy although background suppression is better. The comparison in (b–d) is similar with minor differences, thus no detailed description is given here. In the figure, it can be seen intuitively that the hyperspectral anomaly detection algorithm based on depth feature extraction is superior to the traditional algorithm in terms of background and anomaly separation degree and anomaly detection rate.
Table 2 and Table 3 list the performances of different models for comparison, respectively. The data in the tables show that the deep learning method is significantly better than the traditional method. Moreover, the performance of the hybrid network is better than the anomaly detection performance of the single network to a certain extent. Because the former can extract more hidden features than the latter, and the data-rich detail mining is more in place.
7. Challenges
- (1)
- Using feature extraction or band selection to reduce dimensionality, features may be lost to a certain extent.
- (2)
- Affected by noise and interference, it is difficult to meet the requirements of high detection accuracy and low false alarm rate using high-dimensional hyperspectral anomaly detection. In addition, there are problems with insufficient samples and imbalances.
- (3)
- Real-time anomaly detection can not only detect ground objects in real time, but can also effectively relieve the pressure of data storage. Therefore, the military defense and civilian fields have an urgent need for real-time processing. The current real-time processing algorithm results are not ideal. How to introduce new methods, such as GPU, is a key issue for real-time processing.
- (4)
- HSI contains abundant spectral information, but due to the influence of illumination, scattering, and other problems, it is easily disturbed by noise during the imaging process. Therefore, it is difficult for the original spectral features to effectively show the separability of the background and the abnormal target.
- (5)
- There are many methods for anomaly detection, but there are few practical applications.
- (6)
- UAV-borne hyperspectral data has a higher resolution, and the large amount of existing UAVs data should be fully utilized.
- (7)
- Deep learning hyperspectral anomaly detection under the condition of few samples is still a challenging problem.
8. Future Directions
- (1)
- According to HSI’s own characteristics, combined with the advantages of end-to-end and high-level deep feature extraction of deep learning models, it can be combined with manifold learning, sparse representation, graph learning, and other theories to consider designing new deep learning models to improve performance.
- (2)
- Combining the characteristics of HSI, design a space-spectrum joint deep network.
- (3)
- In terms of model training, transfer learning, weakly supervised learning, self-supervised learning, etc. can be introduced, and a small number of samples can be used to implement deep learning network training and optimization.
- (4)
- Focus on the collaborative learning of multi-modal and multi-temporal data.
- (5)
- Real-time anomaly detection.
9. Conclusions
HSI anomaly detection has received extensive attention in the field of remote sensing image processing. Compared with traditional machine learning algorithms, the hyperspectral anomaly detection algorithm based on deep learning can extract the complex features of HSI more effectively. In this article, we briefly introduce several HSI depth models that are commonly used to represent anomaly detection and give a comprehensive overview of existing anomaly detection methods. In general, we divide the networks used for anomaly detection into model networks, hybrid networks, and other networks. Under this framework, the advantages of different networks have been fully utilized to extract the corresponding features. The network used for anomaly detection is developing from a single network to multi-network integration. The detection accuracy of different methods shows that deep learning methods are better than non-deep learning methods overall. We also listed the current common data sets used for HSI anomaly detection. At present, with the development of drone technology, the HSI collected by the sensors on the drone has a higher resolution. Finally, we elaborated on the problems and future development directions of the current HSI anomaly detection development. It is hoped that the content of this article can provide certain insights and ideas for scholars’ future research work.
Author Contributions
Conceptualization, X.H. and C.X.; methodology, X.H. and C.X.; validation, X.H. and Z.F.; formal analysis, X.W. and D.H.; investigation, Z.F., X.W., D.H. and D.Z.; resources, L.J., G.L. and X.Z.; data curation, X.H., C.X., W.C., Q.D. and J.C.; writing—original draft preparation, X.H., C.X. and Z.F.; writing—review and editing, X.H., C.X., D.W. and Z.F.; visualization, C.X., X.W., D.H., X.Z. and Q.D.; supervision, X.H., D.Z., L.J., G.L., W.C. and J.C.; project administration, X.H. All authors have read and agreed to the published version of the manuscript.
Funding
This research was funded by the national key research and development program (2019YFB1705702) and the National Natural Science Foundation of China (62175037), and the Shanghai Science and Technology Innovation Action Plan (20JC1416500).
Data Availability Statement
Not applicable.
Conflicts of Interest
The authors declare no conflict of interest.
Appendix A
Figure A1.
(a–e) Anomaly detection effects of different methods on different hyperspectral datasets.
Figure A1.
(a–e) Anomaly detection effects of different methods on different hyperspectral datasets.
References
- Li, W.; Wu, G.; Du, Q. Transferred Deep Learning for Anomaly Detection in Hyperspectral Imagery. IEEE Geosci. Remote Sens. Lett. 2017, 14, 597–601. [Google Scholar] [CrossRef]
- Eismann, M.T.; Stocker, A.D.; Nasrabadi, N.M. Automated Hyperspectral Cueing for Civilian Search and Rescue. Proc. IEEE 2009, 97, 1031–1055. [Google Scholar] [CrossRef]
- Hong, D.; Gao, L.; Yao, J.; Zhang, B.; Plaza, A.; Chanussot, J. Graph Convolutional Networks for Hyperspectral Image Classification. IEEE Trans. Geosci. Remote Sens. 2020, 59, 5966–5978. [Google Scholar] [CrossRef]
- Xie, W.; Lei, J.; Liu, B.; Li, Y.; Jia, X. Spectral constraint adversarial autoencoders approach to feature representation in hy-perspectral anomaly detection. Neural Netw. 2019, 119, 222–234. [Google Scholar] [CrossRef] [PubMed]
- Reed, I.S.; Yu, X. Adaptive multiple-band CFAR detection of anoptical pattern with unknown spectral distribution. IEEE Trans. Acoust. Speech Signal Process. 1990, 38, 1760–1770. [Google Scholar] [CrossRef]
- Nasrabadi, N.M. Regularization for spectral matched filter and RX anomaly detector. Proc. SPIE 2008, 6966, 696604. [Google Scholar] [CrossRef]
- Kwon, H.; Nasrabadi, N. Kernel RX-algorithm: A nonlinear anomaly detector for hyperspectral imagery. IEEE Trans. Geosci. Remote Sens. 2005, 43, 388–397. [Google Scholar] [CrossRef]
- Carlotto, M. A cluster-based approach for detecting man-made objects and changes in imagery. IEEE Trans. Geosci. Remote Sens. 2005, 43, 374–387. [Google Scholar] [CrossRef]
- Banerjee, A.; Burlina, P.; Diehl, C. A support vector method for anomaly detection in hyperspectral imagery. IEEE Trans. Geosci. Remote Sens. 2006, 44, 2282–2291. [Google Scholar] [CrossRef]
- An, J.; Cho, S. Variational Autoencoder based Anomaly Detection using Reconstruction Probability. Comput. Sci. 2015, 2, 1–18. [Google Scholar]
- Cheng, B.; Zhao, C.; Zhang, L. Research Advances of Anomaly Target Detection Algorithms for Hyperspectral Imagery. Electron. Opt. Control 2021, 28, 56–59+65. [Google Scholar]
- Geng, X.; Sun, K.; Ji, L.; Zhao, Y. A High-Order Statistical Tensor Based Algorithm for Anomaly Detection in Hyperspectral Imagery. Sci. Rep. 2014, 4, 6869. [Google Scholar] [CrossRef] [PubMed] [Green Version]
- Li, S.; Wang, W.; Qi, H.; Ayhan, B.; Kwan, C.; Vance, S. Low-rank tensor decomposition based anomaly detection for hyper-spectral imagery. In Proceedings of the IEEE International Conference on Image Processing (ICIP), Quebec City, QC, Canada, 27–30 September 2015. [Google Scholar]
- Xing, Z.; Wen, G.; Wei, D. A Tensor Decomposition-Based Anomaly Detection Algorithm for Hyperspectral Image. IEEE Trans. Geosci. Remote Sens. 2016, 54, 5801–5820. [Google Scholar]
- Sun, J.; Wang, W.; Wei, X.; Fang, L.; Tang, X.; Xu, Y.; Yu, H.; Yao, W. Deep Clustering With Intraclass Distance Constraint for Hyperspectral Images. IEEE Trans. Geosci. Remote Sens. 2020, 59, 4135–4149. [Google Scholar] [CrossRef]
- Hong, D.; Gao, L.; Yokoya, N.; Yao, J.; Chanussot, J.; Du, Q.; Zhang, B. More Diverse Means Better: Multimodal Deep Learning Meets Remote-Sensing Imagery Classification. IEEE Trans. Geosci. Remote Sens. 2020, 59, 4340–4354. [Google Scholar] [CrossRef]
- Hong, D.; He, W.; Yokoya, N.; Yao, J.; Gao, L.; Zhang, L.; Chanussot, J.; Zhu, X.X. Inter-pretable Hyperspectral Artificial Intelligence: When Non-Convex Modeling meets Hyperspectral Remote Sensing. IEEE Geosci. Remote Sens. Mag. 2021, 9, 52–87. [Google Scholar] [CrossRef]
- Wu, X.; Hong, D.; Chanussot, J. Convolutional Neural Networks for Multimodal Remote Sensing Data Classification. IEEE Trans. Geosci. Remote Sens. 2021, 60, 1–10. [Google Scholar] [CrossRef]
- Hong, D.; Yokoya, N.; Chanussot, J.; Zhu, X.X. An Augmented Linear Mixing Model to Address Spectral Variability for Hyperspectral Unmixing. IEEE Trans. Image Process. 2019, 28, 1923–1938. [Google Scholar] [CrossRef] [Green Version]
- Li, S.; Song, W.; Fang, L.; Chen, Y.; Ghamisi, P.; Benediktsson, J.A. Deep Learning for Hyperspectral Image Classification: An Overview. IEEE Trans. Geosci. Remote Sens. 2019, 57, 6690–6709. [Google Scholar] [CrossRef] [Green Version]
- Li, R.; Cui, K.; Chan, R.H.; Plemmons, R.J. Classification of Hyperspectral Images Using SVM with Shape-adaptive Reconstruction and Smoothed Total Variation. arXiv 2022, arXiv:2203.15619. [Google Scholar]
- Zhao, C.; Li, C.; Feng, S. A Spectral–Spatial Method Based on Fractional Fourier Transform and Collaborative Representation for Hyperspectral Anomaly Detection. IEEE Geosci. Remote Sens. Lett. 2020, 18, 1259–1263. [Google Scholar] [CrossRef]
- Ghamisi, P.; Plaza, J.; Chen, Y.; Li, J.; Plaza, A.J. Advanced Spectral Classifiers for Hyperspectral Images: A review. IEEE Geosci. Remote Sens. Mag. 2017, 5, 8–32. [Google Scholar] [CrossRef] [Green Version]
- Lei, J.; Fang, S.; Xie, W.; Li, Y.; Chang, C.-I. Discriminative Reconstruction for Hyperspectral Anomaly Detection With Spectral Learning. IEEE Trans. Geosci. Remote Sens. 2020, 58, 7406–7417. [Google Scholar] [CrossRef]
- Shi, Y. Anomaly intrusion detection method based on variational autoencoder and attention mechanism. J. Chongqing Univ. Posts Telecommun. (Nat. Sci. Ed.) 2021, 1–8. Available online: http:kns.cnki.net/kcms/detail/50.1181.n.20210824.1036.014.html (accessed on 12 March 2022).
- Makhzani, A.; Shlens, J.; Jaitly, N.; Goodfellow, I.; Frey, B. Adversarial Autoencoders. arXiv 2015, arXiv:1511.05644. [Google Scholar]
- Arisoy, S.; Nasrabadi, N.M.; Kayabol, K. GAN-based Hyperspectral Anomaly Detection. In Proceedings of the 28th European Signal Processing Conference (EUSIPCO), Amsterdam, The Netherlands, 18–21 January 2021. [Google Scholar]
- Jiang, T.; Li, Y.; Xie, W.; Du, Q. Discriminative Reconstruction Constrained Generative Adversarial Network for Hyperspectral Anomaly Detection. IEEE Trans. Geosci. Remote Sens. 2020, 58, 4666–4679. [Google Scholar] [CrossRef]
- Song, S.; Zhou, H.; Yang, Y.; Song, J. Hyperspectral Anomaly Detection via Convolutional Neural Network and Low Rank With Density-Based Clustering. IEEE J. Sel. Top. Appl. Earth Obs. Remote Sens. 2019, 12, 3637–3649. [Google Scholar] [CrossRef]
- Zhang, L.; Cheng, B.; Deng, Y. A tensor-based adaptive subspace detector for hyperspectral anomaly detection. Int. J. Remote Sens. 2018, 39, 2366–2382. [Google Scholar] [CrossRef]
- Du, B.; Zhang, M.; Zhang, L.; Hu, R.; Tao, D. PLTD: Patch-Based Low-Rank Tensor Decomposition for Hyperspectral Images. IEEE Trans. Multimed. 2017, 19, 67–79. [Google Scholar] [CrossRef]
- Zhang, L.; Cheng, B. Fractional Fourier Transform and Transferred CNN Based on Tensor for Hyperspectral Anomaly Detection. IEEE Geosci. Remote Sens. Lett. 2021, 19, 1–5. [Google Scholar] [CrossRef]
- Zhang, K.; Zuo, W.; Zhang, L. FFDNet: Toward a Fast and Flexible Solution for CNN based Image Denoising. IEEE Trans. Image Process. 2018, 27, 4608–4622. [Google Scholar] [CrossRef] [PubMed] [Green Version]
- Fu, X.; Jia, S.; Zhuang, L.; Xu, M.; Zhou, J.; Li, Q. Hyperspectral Anomaly Detection via Deep Plug-and-Play Denoising CNN Regularization. IEEE Trans. Geosci. Remote Sens. 2021, 59, 9553–9568. [Google Scholar] [CrossRef]
- Dabov, K.; Foi, A.; Katkovnik, V.; Egiazarian, K. Image Denoising by Sparse 3-D Transform-Domain Collaborative Filtering. IEEE Trans. Image Process. 2007, 16, 2080–2095. [Google Scholar] [CrossRef] [PubMed]
- Gu, S.; Zhang, L.; Zuo, W.; Feng, X. Weighted nuclear norm minimization with application to image denoising. In Proceedings of the IEEE Conference on Computer Vision and Pattern Recognition, Columbus, OH, USA, 23–28 June 2014; pp. 2862–2869. [Google Scholar]
- Zhang, K.; Zuo, W.; Chen, Y.; Meng, D.; Zhang, L. Beyond a gaussian denoiser: Residual learning of deep cnn for image de-noising. IEEE Trans. Image Process. 2017, 26, 3142–3155. [Google Scholar] [CrossRef] [Green Version]
- Teodoro, A.M.; Bioucas-Dias, J.M.; Figueiredo, M.A.T. Image restoration and reconstruction using variable splitting and class-adapted image priors. In Proceedings of the 2016 IEEE International Conference on Image Processing (ICIP), Phoenix, AZ, USA, 25–28 September 2016; pp. 3518–3522. [Google Scholar] [CrossRef] [Green Version]
- Zhuang, L.; Bioucas-Dias, J.M. Fast hyperspectral image denoising and inpainting based on low-rank and sparse representa-tions. IEEE J. Sel. Top. Appl. Earth Obs. Remote Sens. 2018, 11, 730–742. [Google Scholar] [CrossRef]
- Dian, R.; Li, S.; Kang, X. Regularizing Hyperspectral and Multispectral Image Fusion by CNN Denoiser. IEEE Trans. Neural Networks Learn. Syst. 2020, 32, 1124–1135. [Google Scholar] [CrossRef]
- Wang, Q.; Yuan, Z.; Du, Q.; Li, X. GETNET: A General End-to-end Two-dimensional CNN Framework for Hyperspectral Image Change Detection. arXiv 2019, arXiv:1905.01662. [Google Scholar] [CrossRef] [Green Version]
- Zhang, X.; Sun, Y.; Zhang, J.; Wu, P.; Jiao, L. Hyperspectral Unmixing via Deep Convolutional Neural Networks. IEEE Geosci. Remote Sens. Lett. 2018, 15, 1755–1759. [Google Scholar] [CrossRef]
- Bati, E.; Çalışkan, A.; Koz, A.; Alatan, A.A. Hyperspectral anomaly detection method based on auto-encoder. SPIE Remote Sens. 2015, 9643, 220–226. [Google Scholar] [CrossRef]
- Chen, Y.; Lin, Z.; Zhao, X.; Wang, G.; Gu, Y. Deep Learning-Based Classification of Hyperspectral Data. IEEE J. Sel. Top. Appl. Earth Obs. Remote Sens. 2014, 7, 2094–2107. [Google Scholar] [CrossRef]
- Rumelhart, D.E.; Hinton, G.E.; Williams, R.J. Learning representations by back-propagating errors. Nature 1986, 323, 533–536. [Google Scholar] [CrossRef]
- Hinton, G.E.; Osindero, S.; Teh, Y.-W. A Fast Learning Algorithm for Deep Belief Nets. Neural Comput. 2006, 18, 1527–1554. [Google Scholar] [CrossRef] [PubMed]
- Vincent, P.; Larochelle, H.; Bengio, Y. Extracting and Composing Robust Features with Denoising Autoencoders Machine Learning. In Proceedings of the Twenty-Fifth International Conference (ICML), Helsinki, Finland, 5–9 June 2008. [Google Scholar]
- Zhao, W.; Guo, Z.; Yue, J.; Zhang, X.; Luo, L. On combining multiscale deep learning features for the classification of hyperspectral remote sensing imagery. Int. J. Remote Sens. 2015, 36, 3368–3379. [Google Scholar] [CrossRef]
- Zhao, C.; Li, X.; Zhu, H. Hyperspectral anomaly detection based on stacked denoising autoencoders. J. Appl. Remote Sens. 2017, 11, 042605. [Google Scholar] [CrossRef]
- Chang, S.; Du, B.; Zhang, L. A Sparse Autoencoder Based Hyperspectral Anomaly Detection Algorihtm Using Residual of Reconstruction Error. In Proceedings of the 2019 IEEE International Geoscience and Remote Sensing Symposium, Yokohama, Japan, 28 July–2 August 2019; pp. 5488–5491. [Google Scholar] [CrossRef]
- Van Veen, D.; Jalal, A.; Soltanolkotabi, M. Compressed Sensing with Deep Image Prior and Learned Regularization. arXiv 2018, arXiv:1806.06438. [Google Scholar]
- Zhao, C.; Zhang, L. Spectral-spatial stacked autoencoders based on low-rank and sparse matrix decomposition for hyper-spectral anomaly detection. Infrared Phys. Technol. 2018, 92, 166–176. [Google Scholar] [CrossRef]
- Wang, S.; Wang, X.; Zhang, L. Auto-AD: Autonomous Hyperspectral Anomaly Detection Network Based on Fully Convolu-tional Autoencoder. IEEE Trans. Geosci. Remote Sens. 2021, 60, 5503314. [Google Scholar] [CrossRef]
- Xie, W.; Lei, J.; Fang, S.; Li, Y.; Jia, X.; Li, M. Dual Feature Extraction Network for Hyperspectral Image Analysis. Pattern Recognit. 2021, 118, 107992. [Google Scholar] [CrossRef]
- Fan, G.; Ma, Y.; Huang, J. Robust Graph Autoencoder for Hyperspectral Anomaly Detection. In Proceedings of the 2021 IEEE International Conference on Acoustics, Speech and Signal Processing (ICASSP), Toronto, ON, Canada, 6–11 June 2021; pp. 1830–1834. [Google Scholar]
- Cheng, T.; Wang, B. Graph and Total Variation Regularized Low-Rank Representation for Hyperspectral Anomaly Detection. IEEE Trans. Geosci. Remote Sens. 2019, 58, 391–406. [Google Scholar] [CrossRef]
- Zhang, L.; Cheng, B. A stacked autoencoders-based adaptive subspace model for hyperspectral anomaly detection. Infrared Phys. Technol. 2018, 96, 52–60. [Google Scholar] [CrossRef]
- Hosseiny, B.; Shah-Hosseini, R. A hyperspectral anomaly detection framework based on segmentation and convolutional neural network algorithms. Int. J. Remote Sens. 2020, 41, 6946–6975. [Google Scholar] [CrossRef]
- Arisoy, S.; Nasrabadi, N.M.; Kayabol, K. Unsupervised Pixel-wise Hyperspectral Anomaly Detection via Autoencoding Ad-versarial Networks. IEEE Geosci. Remote Sens. Lett. 2021, 19, 5502905. [Google Scholar]
- Sabokrou, M.; Khalooei, M.; Fathy, M.; Adeli, E. Adversarially learned one-class classifier for novelty detection. In Proceedings of the IEEE Conference on Computer Vision and Pattern Recognition, Salt Lake City, UT, USA, 18–22 July 2018; pp. 3379–3388. [Google Scholar]
- Akcay, S.; Atapour-Abarghouei, A.; Breckon, T.P. GANomaly: Semi-supervised Anomaly Detection via Adversarial Training. In Proceedings of the ACCV 2018—14th Asian Conference on Computer Vision, Perth, Australia, 2–6 December 2018; Jawahar, C.V., Li, H., Mori, G., Schindler, K., Eds.; Springer: Berlin/Heidelberg, Germany, 2019. [Google Scholar]
- Nadeem, M.; Marshall, O.; Singh, S. Semi-Supervised Deep Neural Network for Network Intrusion Detection. In CCERP-2016; Kennesaw State University: Kennesaw, GA, USA, 2016. [Google Scholar]
- Wulsin, D.; Blanco, J.; Mani, R. Semi-Supervised Anomaly Detection for EEG Waveforms Using Deep Belief Nets. In Proceedings of the Ninth International Conference on Machine Learning and Applications, Washington, DC, USA, 12–14 December 2010. [Google Scholar]
- Song, H.; Jiang, Z.; Men, A.; Yang, B. A Hybrid Semi-Supervised Anomaly Detection Model for High-Dimensional Data. Comput. Intell. Neurosci. 2017, 2017, 8501683. [Google Scholar] [CrossRef] [PubMed] [Green Version]
- Nguyen, A.T.; Park, M. Detection of DoH Tunneling using Semi-supervised Learning method. In Proceedings of the 2022 International Conference on Information Networking (ICOIN), Jeju-si, Korea, 12–15 January 2022; pp. 450–453. [Google Scholar] [CrossRef]
- Wang, T.; Zhang, Z.; Tsui, K.-L. A Deep Generative Approach for Rail Foreign Object Detections via Semi-supervised Learning. IEEE Trans. Ind. Inform. 2022. [Google Scholar] [CrossRef]
- Shao, L.; Zhang, E.; Ma, Q.; Li, M. Pixel-Wise Semisupervised Fabric Defect Detection Method Combined With Multitask Mean Teacher. IEEE Trans. Instrum. Meas. 2022, 71, 1–11. [Google Scholar] [CrossRef]
- Jiang, K.; Xie, W.; Li, Y.; Lei, J.; He, G.; Du, Q. Semisupervised Spectral Learning With Generative Adversarial Network for Hyperspectral Anomaly Detection. IEEE Trans. Geosci. Remote Sens. 2020, 58, 5224–5236. [Google Scholar] [CrossRef]
- Zhong, J.; Xie, W.; Li, Y.; Lei, J.; Du, Q. Characterization of Background-Anomaly Separability With Generative Adversarial Network for Hyperspectral Anomaly Detection. IEEE Trans. Geosci. Remote Sens. 2020, 59, 6017–6028. [Google Scholar] [CrossRef]
- Lyu, H.; Hui, L. Learning a transferable change detection method by Recurrent Neural Network. In Proceedings of the IEEE International Geoscience and Remote Sensing Symposium, Beijing, China, 10–15 July 2016. [Google Scholar]
- Ning, M.; Yu, P.; Wang, S. An Unsupervised Deep Hyperspectral Anomaly Detector. Sensors 2018, 18, 693. [Google Scholar]
- Lei, J.; Xie, W.; Yang, J.; Li, Y.; Chang, C.-I. Spectral–Spatial Feature Extraction for Hyperspectral Anomaly Detection. IEEE Trans. Geosci. Remote Sens. 2019, 57, 8131–8143. [Google Scholar] [CrossRef]
- Zhu, D.; Du, B.; Zhang, L. DLAD: An Encoder-Decoder Long Short-Term Memory Network-Based Anomaly Detector for Hyperspectral Images. In Proceedings of the IEEE International Geoscience and Remote Sensing Symposium, Brussels, Belgium, 11–16 July 2021; pp. 4412–4415. [Google Scholar] [CrossRef]
- Lu, X.; Zhang, W.; Huang, J. Exploiting Embedding Manifold of Autoencoders for Hyperspectral Anomaly Detection. IEEE Trans. Geosci. Remote Sens. 2019, 58, 1527–1537. [Google Scholar] [CrossRef]
- Xie, W.; Liu, B.; Li, Y.; Lei, J.; Du, Q. Autoencoder and Adversarial-Learning-Based Semisupervised Background Estimation for Hyperspectral Anomaly Detection. IEEE Trans. Geosci. Remote Sens. 2020, 58, 5416–5427. [Google Scholar] [CrossRef]
- Li, X.; Zhao, C.; Yang, Y. Hyperspectral anomaly detection based on the distinguishing features of a redundant difference-value network. Int. J. Remote Sens. 2021, 42, 5459–5477. [Google Scholar] [CrossRef]
- Shah, R.; Säckinger, E. Signature Verification Using A “Siamese” Time Delay Neural Network. Int. J. Pattern Recognit. Artif. Intell. 1993, 7, 737–744. [Google Scholar]
- Alex, V.; KP, M.S.; Chennamsetty, S.S.; Krishnamurthi, G. Generative adversarial networks for brain lesion detection. Med. Imaging Image Process. Int. Soc. Opt. Photonics 2017, 10133, 101330G. [Google Scholar] [CrossRef]
- Yang, Y.; Hinde, C.J.; Gillingwater, D. Improve neural network training using redundant structure. In Proceedings of the 2003 International Joint Conference on Neural Networks, Portland, OR, USA, 20–24 July 2003. [Google Scholar]
- Ouyang, T.; Wang, J.; Zhao, X.; Wu, S. LSTM-Adversarial Autoencoder for Spectral Feature Learning in Hyperspectral Anomaly Detection. In Proceedings of the IEEE International Geoscience and Remote Sensing Symposium IGARSS, Brussels, Belgium, 11–16 July 2021; pp. 2162–2165. [Google Scholar]
- Jiang, K.; Xie, W.; Lei, J.; Li, Z.; Li, Y.; Jiang, T.; Du, Q. E2E-LIADE: End-to-End Local Invariant Autoencoding Density Estimation Model for Anomaly Target Detection in Hyperspectral Image. IEEE Trans. Cybern. 2021, 1–12. [Google Scholar] [CrossRef] [PubMed]
- Xie, W.; Zhang, X.; Li, Y. Weakly Supervised Low-Rank Representation for Hyperspectral Anomaly Detection. IEEE Trans. Cybern. 2021, 51, 3889–3990. [Google Scholar] [CrossRef] [PubMed]
Figure 3.
Box plot.

Figure 4.
(a–d) Anomaly detection effects of different methods on different hyperspectral datasets (comparison of partial methods and none methods is in Appendix A).
Figure 4.
(a–d) Anomaly detection effects of different methods on different hyperspectral datasets (comparison of partial methods and none methods is in Appendix A).
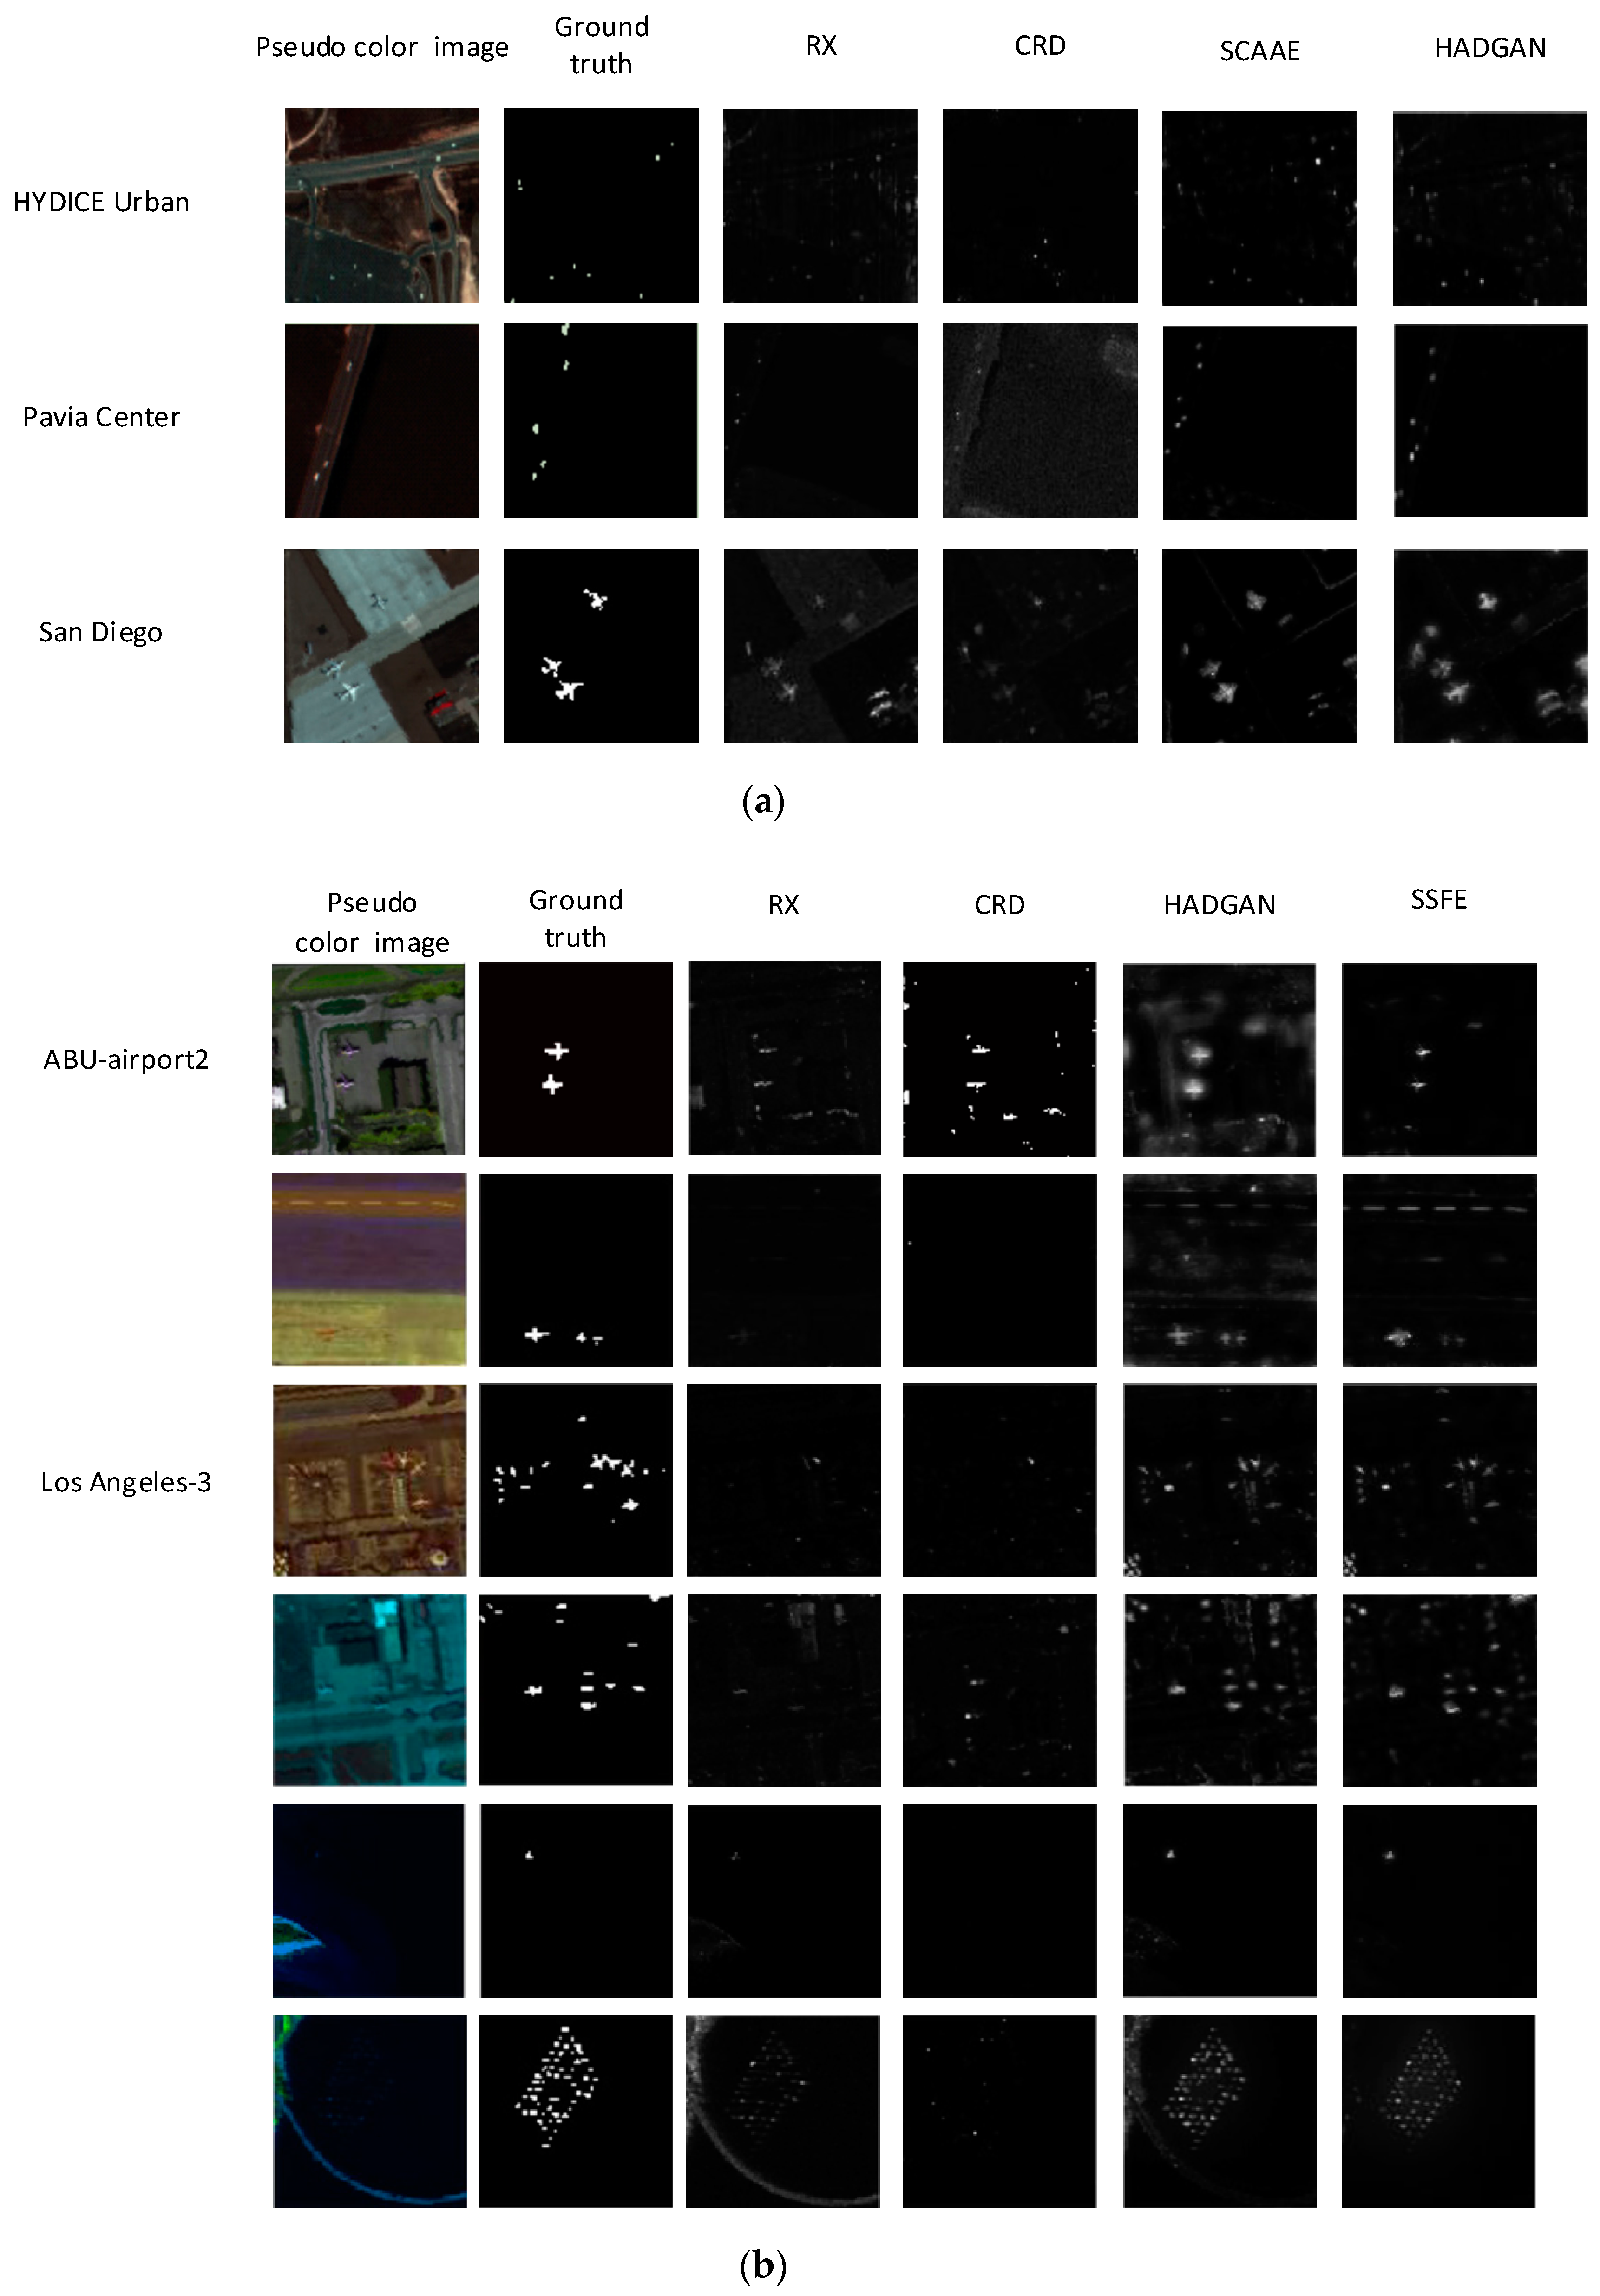
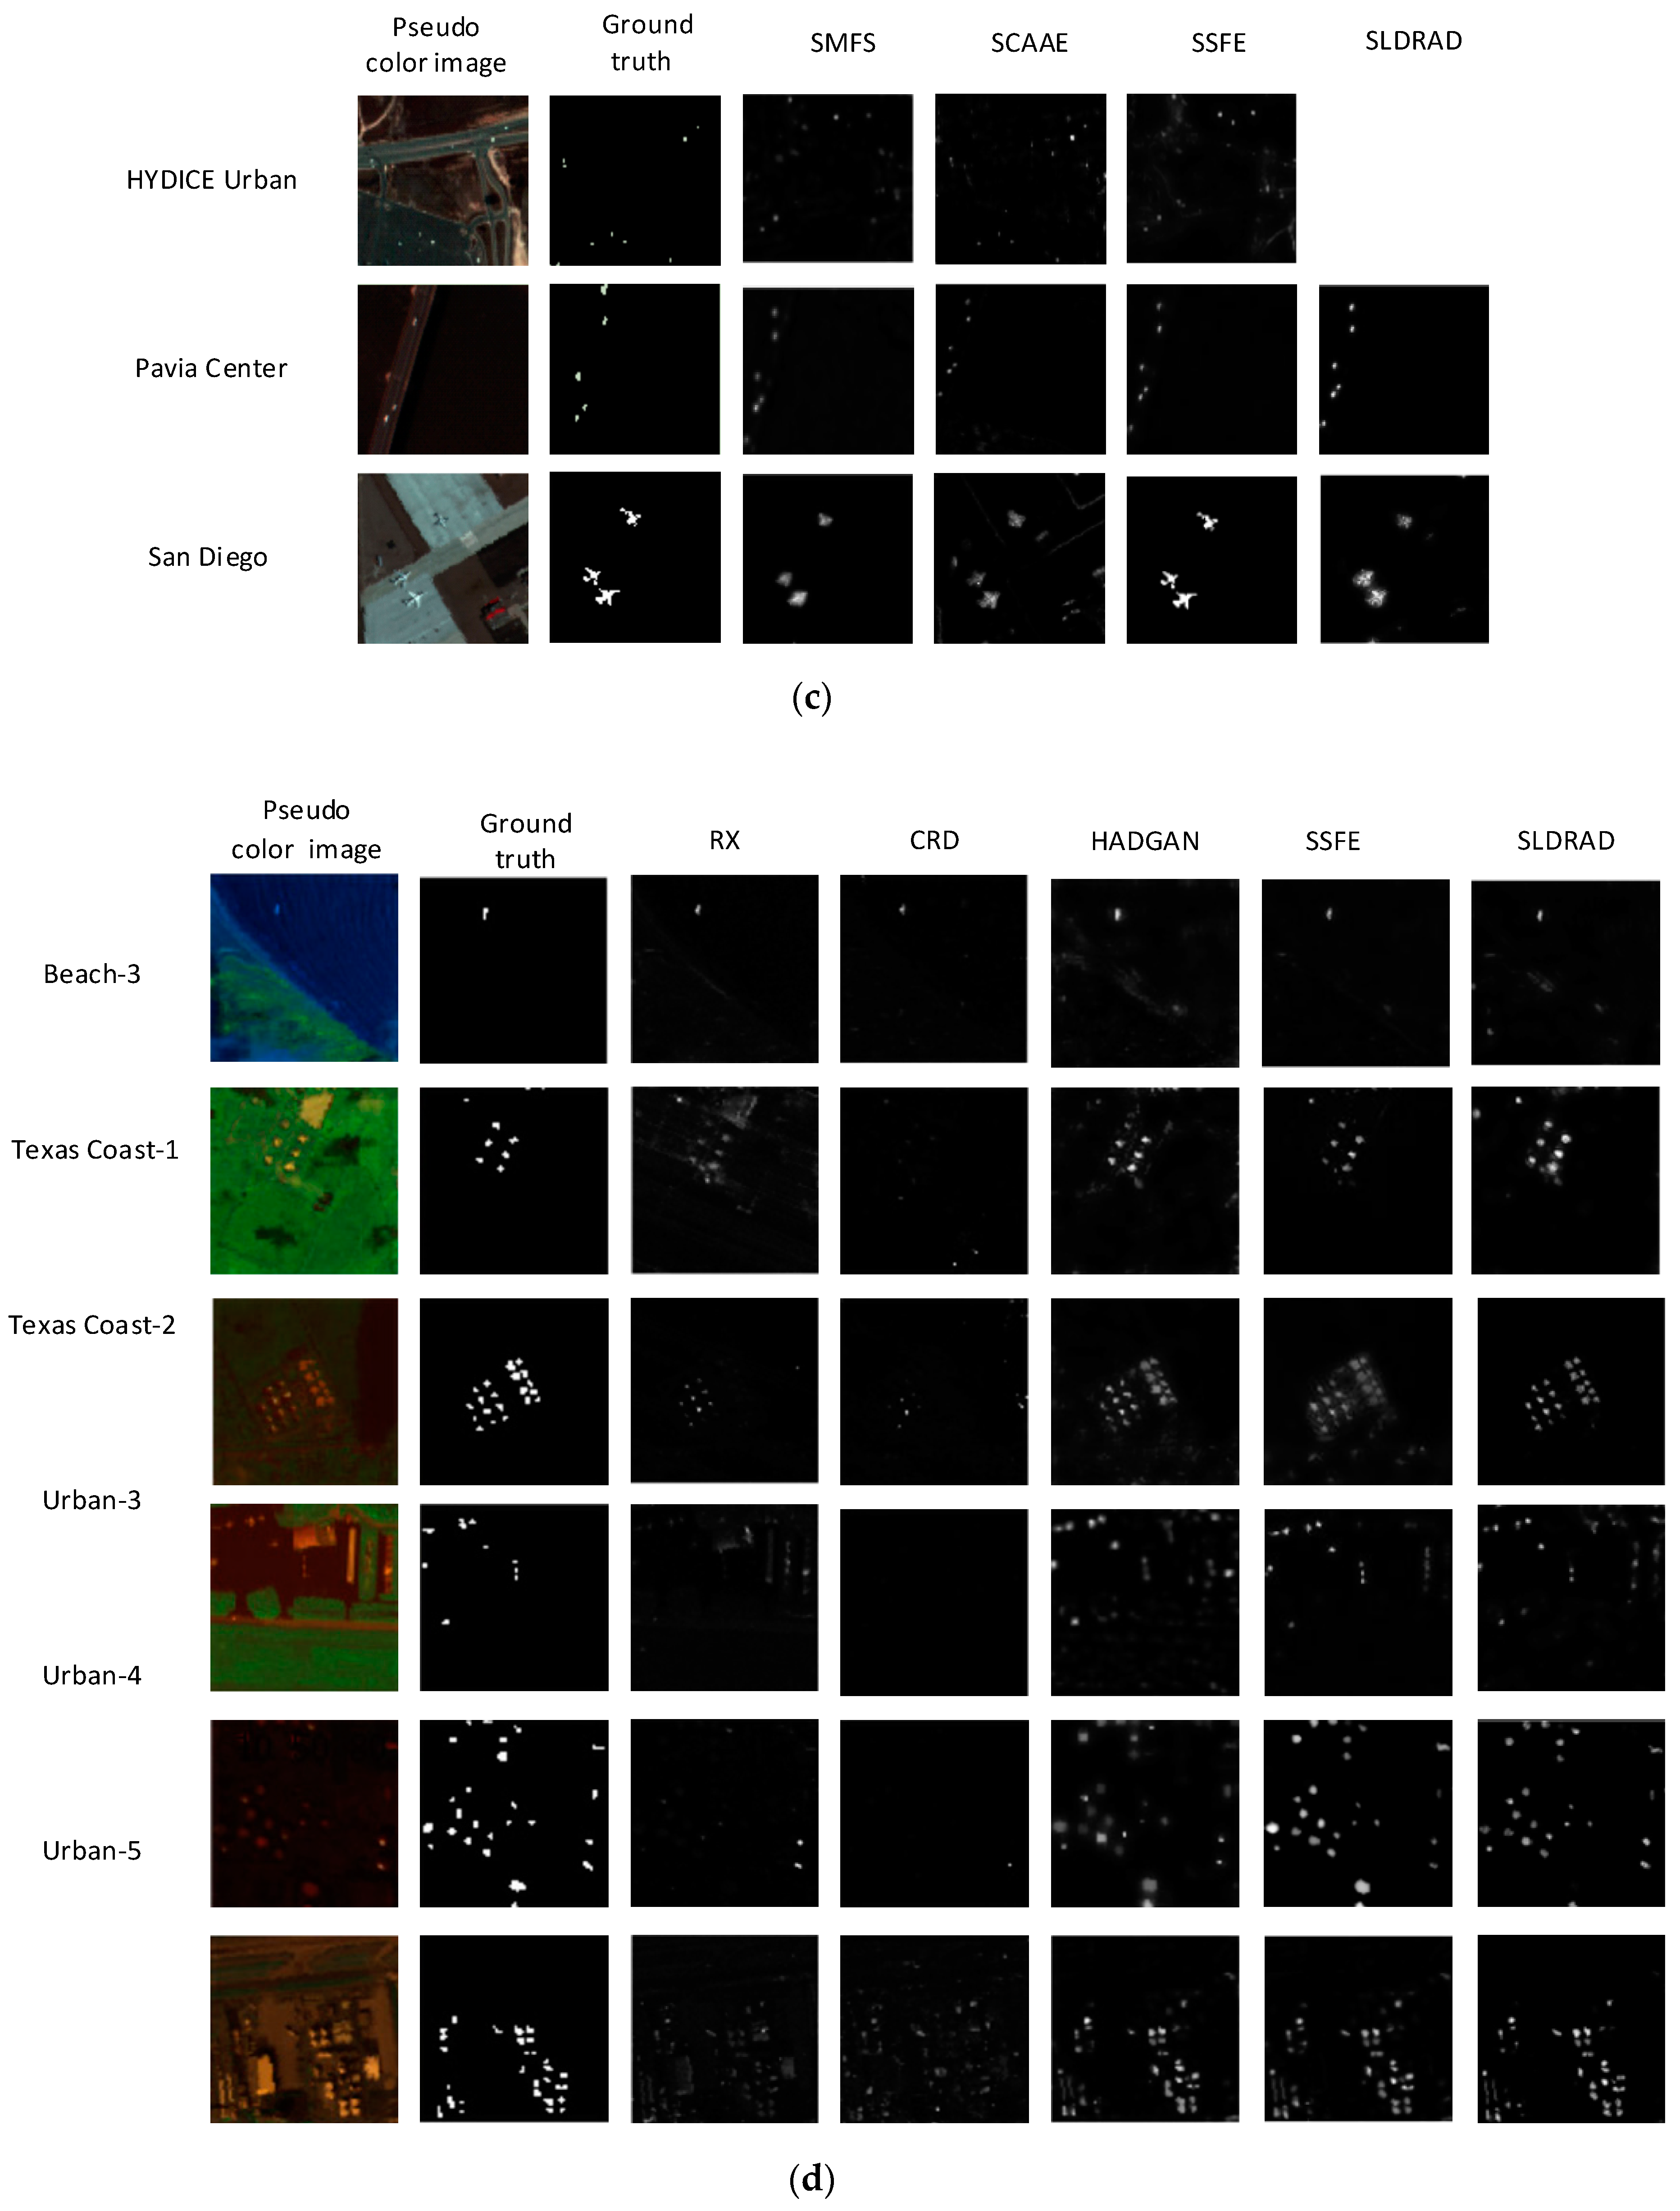

Table 1.
Summary of airborne data sets commonly used for hyperspectral anomaly detection.
| Dataset | Sensor | Spectral Band | Size | Resolution | Abnormal |
|---|---|---|---|---|---|
| San Diego | AVIRIS | SDD-1:189 SDD-2:193 | 100 × 100 | 7.5 m | SDD-1:3 planes and 134 pixels SDD-2: 202-pixel artificial object |
| Cat Island | AVIRIS | 193 | 100 × 100 | 17.2 m | One ship: 19 pixels |
| Pavia | ROSIS-03 | 102 | 150 × 150 | 1.3 m | Vehicle: 68 pixels |
| HYDICE Urban | Hydice | 210 | 80 × 100 | 3 m | 21 pixels |
| GulfPort | AVIRIS | 191 | 100 × 100 | 3.4 m | Three airplanes of different proportions with 68 pixels |
| Los Angeles | AVIRIS | 205 | 100 × 100 | 7.1 m | LA-1: buildings with 272 pixels LA_2: houses with 232 pixels |
| Texas Coast | AVIRIS | TC-1:204 TC-2:207 | 100 × 100 | 17.2 m | TC-1: 67 pixels TC-2: Vehicle |
| Bay Champagne | AVIRIS | 188 | 100 × 100 | 4.4 m | Vehicle |
| EI Segundo | AVIRIS | 224 | 250 × 300 | 7.1 m | Oil storage tanks and towers |
| WHU-Hi | NANO-Hyperspec (Airborne) | Station:270 Park:270 | 4000 × 600 | 0.04 m 0.08 m | 1122 pixels 1510 pixels |
| Grand Island | AVIRIS | 224 | 300 × 480 | 4.4 m | Man-made objects in water |
| Cuprite | AVIRIS | 224 | 512 × 512 | 20 m | 46 pixels |
| Moffett | AVIRIS | 224 | 512 × 512 | 20 m | 59 pixels |
Table 2.
AUC comparison between model networks.
| Dataset | RX Statistics | CRD Representation | TBASD Tensor | DeCNN CNN | SCAAE AE | BASGAN GAN | SSFE DBN | EDLAD LSTM |
|---|---|---|---|---|---|---|---|---|
| HYDICE Urban | 0.9857 | 0.9956 | - | 0.9976 | 0.9968 | 0.9987 | 0.9985 | - |
| San Diego | 0.909 | 0.9880 | - | 0.9932 | 0.9852 | 0.9954 | 0.9946 | 0.9917 |
| Pavia | 0.9543 | 0.9862 | 0.9828 | 0.9994 | 0.9992 | - | - | - |
Table 3.
AUC performance comparison between hybrid model and other models.
| Dataset | RX Statistics | CRD Representation | TBASD Tensor | DeCNN CNN | SCAAE AE | BASGAN GAN | SSFE DBN | EDLAD LSTM |
|---|---|---|---|---|---|---|---|---|
| HYDICE Urban | 0.9857 | 0.9956 | - | 0.9976 | 0.9968 | 0.9987 | 0.9985 | - |
| San Diego | 0.909 | 0.9880 | - | 0.9932 | 0.9852 | 0.9954 | 0.9946 | 0.9917 |
| Pavia | 0.9543 | 0.9862 | 0.9828 | 0.9994 | 0.9992 | - | - | - |
Publisher’s Note: MDPI stays neutral with regard to jurisdictional claims in published maps and institutional affiliations. |
© 2022 by the authors. Licensee MDPI, Basel, Switzerland. This article is an open access article distributed under the terms and conditions of the Creative Commons Attribution (CC BY) license (https://creativecommons.org/licenses/by/4.0/).
Share and Cite
MDPI and ACS Style
Hu, X.; Xie, C.; Fan, Z.; Duan, Q.; Zhang, D.; Jiang, L.; Wei, X.; Hong, D.; Li, G.; Zeng, X.; et al. Hyperspectral Anomaly Detection Using Deep Learning: A Review. Remote Sens. 2022, 14, 1973. https://doi.org/10.3390/rs14091973
AMA Style
Hu X, Xie C, Fan Z, Duan Q, Zhang D, Jiang L, Wei X, Hong D, Li G, Zeng X, et al. Hyperspectral Anomaly Detection Using Deep Learning: A Review. Remote Sensing. 2022; 14(9):1973. https://doi.org/10.3390/rs14091973
Chicago/Turabian StyleHu, Xing, Chun Xie, Zhe Fan, Qianqian Duan, Dawei Zhang, Linhua Jiang, Xian Wei, Danfeng Hong, Guoqiang Li, Xinhua Zeng, and et al. 2022. "Hyperspectral Anomaly Detection Using Deep Learning: A Review" Remote Sensing 14, no. 9: 1973. https://doi.org/10.3390/rs14091973
Note that from the first issue of 2016, this journal uses article numbers instead of page numbers. See further details here.