
Coastal Wetland Responses to Sea Level Rise: The Losers and Winners Based on Hydro-Geomorphological Settings


1
Science Economics and Insight Division, NSW Department of Planning and Environment, Sydney, NSW 2150, Australia
2
School of Earth Atmosphere and Life Sciences, University of Wollongong, Wollongong, NSW 2522, Australia
*
Author to whom correspondence should be addressed.
Remote Sens. 2022, 14(8), 1888; https://doi.org/10.3390/rs14081888
Submission received: 18 February 2022
/
Revised: 9 April 2022
/
Accepted: 12 April 2022
/
Published: 14 April 2022
(This article belongs to the Special Issue Big Earth Data and Remote Sensing in Coastal Environments)
Abstract
:Many coastal wetlands are under pressure due to climate change and the associated sea level rise (SLR). Many previous studies suggest that upslope lateral migration is the key adaptive mechanism for saline wetlands, such as mangroves and saltmarshes. However, few studies have explored the long-term fate of other wetland types, such as brackish swamps and freshwater forests. Using the current wetland map of a micro-tidal estuary, the Manning River in New South Wales, Australia, this study built a machine learning model based on the hydro-geomorphological settings of four broad wetland types. The model was then used to predict the future wetland distribution under three sea level rise scenarios. The predictions were compared to compute the persistence, net, swap, and total changes in the wetlands to investigate the loss and gain potential of different wetland classes. Our results for the study area show extensive gains by mangroves under low (0.5 m), moderate (1.0 m), and high (1.5 m) sea level rise scenarios, whereas the other wetland classes could suffer substantial losses. Our findings suggest that the accommodation spaces might only be beneficial to mangroves, and their availability to saltmarshes might be limited by coastal squeeze at saline–freshwater ecotones. Furthermore, the accommodation spaces for freshwater wetlands were also restrained by coastal squeeze at the wetland-upland ecotones. As sea level rises, coastal wetlands other than mangroves could be lost due to barriers at the transitional ecotones. In our study, these are largely manifested by slope impacts on hydrology at a higher sea level. Our approach provides a framework to systematically assess the vulnerability of all coastal wetland types.

1. Introduction
Coastal wetlands, found within continental margins, are low-lying areas of extraordinarily high biodiversity and with high human accessibility [1,2,3]. Many types of wetlands, ranging from saline wetlands (such as mangroves and saltmarshes) that are regularly inundated with sea water to freshwater swamps upstream of the tidal limit in estuaries where salinity is rarely above 0.5 ppt [4], occur along the gradients of tidal influence. As an essential component of the coastal landscape, these wetlands provide an array of important ecological services that are critical for wildlife and human welfare, such as buffering against storm surges, filtering and purifying water, sustaining biodiversity, and sequestering carbon [5,6,7,8]. However, they are also among the most exploited and threatened ecosystems worldwide, subjected to a variety of stresses, including timber harvesting, land reclamation, erosion, and climate change, and its associated sea level rise (SLR) [9,10].
Although SLR imposes obvious threats to all coastal wetlands, most previous wetland vulnerability assessments focused on tidal saline wetlands (e.g., salt marshes and mangroves) [11,12,13]. There are significant knowledge gaps on how freshwater and brackish wetlands respond to projected SLR [7,13]. Many regional and global monitoring and assessment frameworks, such as the high-precision rod surface-elevation table-marker horizon (RSET-MH) [14,15,16,17], mainly target mangroves and saltmarshes. Other wetlands, such as coastal floodplain forests, swamps, and lagoons, have received much less attention [2,13]. Globally, there is currently a lack of information on the distribution of these wetlands as well as basic information on the physiological ecology of major coastal freshwater wetland species under natural settings; the structure and dynamics of pure and mixed species communities, soil–plant interactions, biogeochemistry, hydrology, soils, wildlife habitat, primary biotic and abiotic functions; and the response of these systems to natural and human-caused disruptions. Existing information is often not in a form that can be applied to ecosystem problems, especially those related to management, restoration, or creation of tidal swamps. In contrast, the first World Mangroves Atlas was published in 1997 [18]. Nevertheless, coastal freshwater wetlands, which generally lie just upslope from the saline wetlands, are similarly valuable in terms of their provision of critical ecosystem services, and should also be part of coordinated monitoring and assessment efforts to inform coastal climate change adaptation policy [1,7,19].
With the sea level rising, it is expected that increased inundation and salinity would change the existing zonation of vegetation communities in an estuary and would likely favor the encroachment of saline species into upland brackish and freshwater ecosystems [20,21]. Brackish and freshwater upland species can be killed by increased tidal flooding because they are not tolerant to long-term inundation and/or elevated salinity [7]. For example, tidal forests along the northern Gulf of Mexico are predicted to suffer substantial loss as a result of SLR [22]. Additionally, in North America, there has been extensive mortality of tree stands in the Atlantic coastal landscapes due to storm surges, which create windows for saline wetland transgression [23]. Similarly, the widespread dieback of native Melaleuca forest in the coastal floodplains of northern Australia due to saltwater intrusion [24] has led to the expansion of mangrove forests and saltmarshes [2]. These studies documented the retreat of coastal forests and the subsequent replacement with mangroves and/or saltmarshes as the sea level rises. However, reports on other coastal freshwater wetlands are rare (but see [25,26]), and the systematic assessment of the transition between wetland types in the face of climate change and the associated SLR is needed because the mechanisms that control these transitions could vary with the hydro-geomorphological and ecological settings at the freshwater–saltwater interface [26].
Many recent studies have demonstrated that the landward migration of coastal wetlands is one of the main adaptation mechanisms in relation to the impacts of SLR [11,12,27,28]. However, the lateral accommodation space is often limited by a naturally steep topography and/or man-made infrastructure for shoreline protection in many estuaries, i.e., coastal squeeze [29]. Many coastal forested wetlands, such as the Casuarina forest, and littoral rainforest are also identified as threatened ecological communities in Australia [30]. As these are succeeded by encroaching saline wetlands (see above), they might be more vulnerable to degradation and loss as a result of SLR than other coastal wetlands [22]. Therefore, how to balance promoting landward migration of intertidal wetlands and conserving other freshwater wetlands in coastal landscapes under SLR is a significant challenge for natural resource managers.
This study presents an early systematic assessment of the potential transition between wetland types under three SLR scenarios to address a major knowledge gap impeding adaptive management. First, we build a machine learning model (RF, random forest) using a detailed wetland map for the Manning Estuary, a moderately developed barrier riverine estuary [31] in south-east Australia. The RF model establishes the hydro-geomorphological conditions for each wetland type to occur. We then predict the future distribution of coastal wetlands under three SLR scenarios (0.5 m, 1.0 m, and 1.5 m, corresponding to low, intermediate, and high, hereafter also referred to as scenarios 1, 2, and 3, respectively). The three SLR scenarios represent a range of the possible SLR magnitudes within the present century and beyond [32]. Finally, the loss and gain of each wetland type are calculated at pixel level to form an extended transition matrix, and the dominant signals of change for each class [33,34] are identified. Specifically, we aim to answer the following questions that are of particular interest to conservation planning: (i) is SLR-induced coastal squeeze an equal issue for all wetlands?; (ii) does lateral accommodation space provide equal opportunities for all wetlands?; and (iii) which wetlands are facing the greatest threats under SLR?
2. Methods
2.1. Study Area
The Manning River Estuary (31.879°S, 152.686°E, Figure 1) is located on the mid-north coast of New South Wales (NSW), Australia. It belongs to the warm temperate climate zone with warm, humid summers and mild winters. During winter–spring (July to October), the climate is predominately controlled by the sub-tropical high-pressure belt, resulting in dry conditions. During summer–autumn (November to May), the prevailing monsoon brings warm and wet conditions. The interannual variation in rainfall is high [35] due to the influence of the El Niño–Southern Oscillation; lower-than-average annual rainfall occurs during El Niño periods while greater-than-average rainfall occurs during La Niña periods.
The Manning River Estuary is a barrier type estuary, with a sand barrier parallel to the shoreline that encloses the entrance to the estuary [36]. The sandy barrier impounds estuary environments, but maintains a permanently open entrance that influences the water exchange between the ocean and estuary and sediment accumulation. The estuary of the Manning River extends over 25.3 km2 [36] and receives freshwater inflows from a catchment of approximately 8400 km2 [37]. Most of the rivers and creeks are unregulated, with no major storages used to capture and store flows. The tidal range at the entrance can be up to 1.9 m, the tidal limit is near Wingham, about 53.9 km upstream of the estuary mouth [38] (Figure 1), and the saline limit is approximately 50 km upstream [39]. The coastal floodplain encompasses a complex of waterways and is moderately developed, with approximately 10% being conserved as national parks and natural reserves. Based on the land use/land cover map of NSW (NSW Landuse 2017, downloaded from https://data.nsw.gov.au/data/dataset/nsw-landuse-2017, accessed on 12 August 2019), the major land uses for the developed areas are grazing modified pastures (~43%), grazing native vegetation (~21%), urban settlements and farm residentials (~2%), and forestry (~1%).
There are many wetland types, including coastal floodplain freshwater marshes; freshwater forested swamps dominated by tree species, such as Swamp Mahogany (Eucalyptus robusta) and Broad-Leaved Paperbark (Melaleuca quinquenervia); brackish forested swamps (i.e., Swamp Oak, Casuarina glauca); saltmarshes; gray mangroves; and mudflats [40]. As a result of land reclamation, these wetlands are typically patchy or fringing the riverbanks, except in the Crowdy Bay National Park (~11,700 ha) where extensive wet and dry heathlands occur. The wetlands provide essential ecological services (e.g., habitats for waterbirds, fish and crustaceans [41]) for the maintenance of local and regional biodiversity. Wetland conservation is a major challenge facing the future management of the Manning River Estuary due to the increasing threat of SLR, land clearing, and livestock trampling [41]. Our study focused on the Crowdy Bay National Park and its surrounding low-intensive land use (e.g., grazed native vegetation), where the disturbance to natural hydrological connectivity due to agricultural and urban development is relatively small to absent, and continuous freshwater forested wetlands occur (Figure 1).
Figure 1.
(A) A map showing the Manning River catchment situated in NSW, Australia. (B) A map of the Manning River Catchment showing the extent of the Manning Estuary and where Crowdy Bay National Park is situated. (C) The mapped wetland types in the focused study area simplified from the existing wetlands map in [40]. The terrestrial vegetation includes the lightly grazed native vegetation. The background aerial photo shows the surrounding grazing and croplands, and proximity of the focused study area to the saline waters of the lower estuary.

2.2. Data Sources and Preparation
2.2.1. Responsible Variable
The recent wetland map [40] was used to create the response variable wetland type. The original map discriminates wetlands into 13 major groups, which we aggregated into five broad wetland types: two freshwater wetlands, i.e., coastal forested wetland (referred to as Forest) and freshwater marsh (referred to as Marsh); two saline wetlands (i.e., Mangroves and Saltmarshes); and one brackish wetland (Swamp Oak, referred to as Oak). However, the initial modeling found that machine learning techniques that use only the hydro-geomorphic predictor variables, had limited power to separate Oak and Saltmarshes (nearly 1/3 of the Oak was classified as Saltmarshes and more than ¼ of Saltmarshes was mistakenly classed as Oak). Therefore, Oak was integrated into Saltmarshes and termed as Saltmarsh/Swamp in this study. The aggregated wetland map was then overlaid with the simplified land-use map by the NSW Department of Planning and Environment (NSW Landuse 2017, downloaded on 12 August 2019 from https://data.nsw.gov.au/data/dataset/nsw-landuse-2017) to form a land-cover map with six classes, i.e., four wetland types, water, and terrestrial vegetation (all other land covers). The land-cover vector data were then converted to 5 m × 5 m raster grids for stratified random sampling [42]. From each class, we randomly sampled 5% of the grids resulting in a dataset with 200,758 data points for building the random forest classification model (see below). It is important to note that we only sampled from the natural (e.g., national parks) and semi-natural (e.g., grazed native vegetation) land covers informed by NSW Landuse 2017.
2.2.2. Predictor Variables and Pre-Processing
Topographic variables: Topographic heterogeneity is a major factor structuring plant assemblies in natural wetlands [43,44,45]. Over the last two decades, the NSW government commissioned Airborne Light Detection and Ranging (LiDAR) surveys covering all coastal areas. The detailed 1 m-DEM (digital elevation model) with a horizontal accuracy of 0.4 m and vertical accuracy of 0.15 m was resampled to a 5 m resolution to achieve a reasonable computing time. We calculated 6 topographic variables using the 5 m DEM to characterize the terrain heterogeneity. Although a variety of indices have been developed [46], the selected variables are known to be important for predicting vegetation distribution through influencing the dispersal, colonization, and growth of plant species [47]. We used the SAGA application [48], a free open-source GIS software, for all the calculations.
- TPI (Topographic Position Index): The difference between the value of a grid cell and the mean value of its 8 surrounding cellswhere h is the elevation in meters. The positive or negative values of the TPI indicate that the central point is located higher or lower than its average surroundings, respectively.
- The Terrain Ruggedness Index (TRI) can be expresses as:where Zc is the elevation of the central grid cell and Zi is the elevation of one through to eight neighboring cells. The Terrain Ruggedness Index (TRI) is a topographic measurement developed by [50] to quantify topographic irregularities in a region.
- The Topographic Wetness Index (TWI), according to Kirkby and Beven [51], can be expressed as:where α is the catchment area [(flow accumulation + 1) × (pixel area in m2)], and θ is the ground slope angle in radians. It is assumed that topography controls the movement of the water in a sloped terrain, and thus the soil moisture level, which, in turn, affects the distribution of plant species. High TWI values are found in converging flat areas and low values are typical for steep diverging terrains.
- The calculated Wind Exposition Index (WEI), as proposed by Böhner and Antonić [52], can be expressed as:where N is the angle step (we used 24, i.e., each 15 degrees). The horizon angle φ for any given grid in the DEM (with the elevation z) is defined as the maximum angle toward any other grid in a given azimuth, within a selected search distance d (we used 10 km in this study), determined by:where d is the distance to the point with a higher elevation z + . The WEI is a non-dimensional index used to quantify wind exposure at the land surface. A value < 1 indicates more covered areas, and a value > 1 indicates the areas exposed to wind.
- Slope according to Horn [53] using the elevation of eight neighboring grid cells. Slope is one of the basic topographical parameters of the terrain. The slope angle is an important contributing factor to flooding and soil erosion, and the slope aspect affects sunlight, humidity, and temperature, which are all important for plant colonization and establishment.
Geohydrological variables: Two geohydrological variables were calculated and used as predictors in the model, the water depth at High High-Water Solstice Springs (HHWSS), H, and the distance to the water edge at HHWSS, D. H was calculated as the difference (mm) between the HHWSS tidal plane and the LiDAR DEM; therefore, cells with a negative value of H are high-ground areas that are not generally inundated by the tide except during extreme events, and cells with positive values are low-lying areas that are subjected to inundation during most spring high tides. To calculate the distance to the water edge, we first used the calculated H to define the maximum extent of the water surface. The water surface polygons were then converted to polylines, and a raster of Euclidean distance to the polyline was created using ArcMap. Both H and D are effectively surrogating for the tidal inundation regime, which varies with the estuary type and location within an estuary [54].
The HHWSS tidal-plane layers of each estuary were previously developed to assess the regional vulnerability of built assets to tidal inundation [55]. Briefly, for well-gauged estuaries, the procedure involves the following: (1) the HHWSS elevation of each tide gauge is computed using standard harmonic analysis techniques, and (2) the estuary tidal plane is calculated by interpolating HHWSS elevations between gauges using a minimum curvature spline technique. The characteristic shapes of the tidal plane were identified for each estuary type, which were then used to infer the tidal planes in poorly gauged estuaries. Three SLR scenarios were then simulated by adding 0.5 m, 1.0 m and 1.5 m to the present-day tidal plane. The key advantage of this approach over the simpler bathtub approach for simulating SLR is that it more closely represents the true intra-estuary variation in water levels due to tidal amplifications/attenuations and other shallow-water processes characteristic of each estuary type [54,56]. The approach does not, however, include any future modification to the tidal dynamics as a result of a morphological adjustment to SLR, thus it remains a first-order approximation to future water levels inside the estuaries [57].
Prior to the model training, all of the predictor variables were centered (i.e., by subtracting the mean) and scaled (i.e., by dividing the standard deviation) to reduce structural multicollinearity [58]. Although multicollinearity is less problematic in machine learning than in conventional statistics, highly correlated variables can reduce the precision of the estimated coefficients, which weakens the predictive power of the fitted model [58]. We applied VIF (Variance Inflation Factor) analysis and removed the variables with VIFs greater than 5 [59], resulting in 7 variables, i.e., H, D, TWI, TPI, TRI, Slope, and WEI, included in model training.
2.3. A Random Forest Model for the Current Wetland Distributions
We modeled the current distribution of the six land-cover classes using random forest (RF) implemented in the R package “Caret” [60]. Random forest is a widely used supervised machine learning method for classification and regression [61]. It is among the top machine learning algorithms to discriminate coastal wetlands [62].
The dataset was split into training (25%) and testing (75%) subsets using stratified random sampling. We used only one quarter of the data for model tuning to reduce the computing time. Moreover, the larger testing dataset increases the robustness of validation. With the training dataset, the repeated (5 times) 10-fold cross-validation procedure is used for model tuning. As the land cover classes are highly imbalanced, and most machine learning models tend to be more efficient and accurate in predicting the majority class than the minority class as they aim to minimize the overall error rate [63], sampling techniques are often used to tackle the problem of extremely imbalanced data. We used down-sampling in model tuning, i.e., randomly subset all the classes in the training set, so that their class frequencies match the least prevalent class, to correct this behavior. Using the testing dataset, we calculated the overall, producer, and user accuracy (OA, PA, and UA, respectively) of wetland classifications. We also reported the Cohen’s Kappa statistic, which considers the expected error rate. While Kappa = 1 indicates perfect model prediction, Kappa = 0 is interpreted as no agreement between observations and predictions.
Further, we assessed the model performance by computing an agreement map, i.e., the mapped and predicted current distribution of coastal wetlands within natural land covers using the function CompareClassification in the R package “greenbrown” [64]. It is necessary to constrain the comparison within natural land covers as historical coastal development has reclaimed many coastal wetlands for croplands, pastures and other anthropogenic land covers [21,65].
2.4. Predicting the Wetland Distribution under Sea Level Rise Scenarios
A total of 3 future tidal planes were simulated under 3 sea level rise scenarios: 0.5 m, 1.0 m and 1.50 m [55]. With the new tidal planes, the two geohydrological variables (i.e., H and D) were recalculated. The trained and evaluated RFs are then used to predict the future distribution of coastal wetlands for each SLR scenario.
2.5. Wetland Changes under Three SLR Scenarios
To explore the change in the distribution and extent of wetland types, we conducted a grid-by-grid comparison between the predicted current distribution and the predictions under the three SLR scenarios. The predicted current and future distribution maps were overlain to produce a categorical transition matrix of the four wetland types. The changes in the wetland types were quantified in terms of gross gains, gross losses, and persistence as well as net and swap changes. The swap change refers to gross loss of type in one area with a gross gain of the same type in another location or vice versa [33,34]. With the categorical transition matrix, we further computed the loss-to-persistence ratio (i.e., loss/persistence) and gain-to-persistence ratio (i.e., gain/persistence) to assess the tendency of each wetland type to lose to and to gain from other types, which is an approach developed by Braimoh [33].
3. Results
3.1. A Model Accuracy Assessment
Based on the validation testing, the wetland type model achieved an overall accuracy of 92.4% and the Kappa coefficient of agreement was 0.90 (Table 1). However, accuracies were variable at the category level. The model discriminated Water almost perfectly (99.8% and 97.9% for PA and UA, respectively). Similarly, the performance for Terrestrial Vegetation was also very high (PA and UA were 99.2 and 97.5%, respectively). The discrimination power for Mangrove and Marsh was relatively lower (the PA was 63.9% and 61.1%, respectively, Table 1). There was little evidence of a misclassification between wetlands and non-wetlands. Among the different wetland types, in general, the model slightly overestimated Mangrove and Marsh, and slightly underestimated Saltmarsh/Swamp and Forest (Table 1). A misclassification most commonly occurred between Forest and Marsh: while 13.14% of Forest was misclassified as Marsh, 11.69% of Marsh was misinterpreted as Forest (Table 1). There was also some misclassification between Mangrove and Saltmarsh/Swamp: 11.74% of Saltmarsh/Swamp were misclassified as Mangroves and 7.62% of Mangroves were wrongly categorized as Saltmarsh/Swamp (Table 1). These classification errors among wetland types reflected the often proximal distribution of mangroves and saltmarshes, despite their marginally different hydro-geomorphic requirements [7]. Any other confusion between classes was marginal.
The map accuracy was lower in comparison with the validation test, with an OA of 87.2% and Kappa of 0.82. Similar to the testing performance just described, both PA and UA had considerable variations at the category level. The PA ranged from 59.9% (Marsh) to 100% (Water), while the UA varied between 79.2% (Saltmarsh/Swamp) to 100% (Water). The most mismatches between the modeled and mapped land cover commonly occurred at three locations: (1) native vegetation where the hydrological connectivity was heavily impeded by artificial banks, roads, and drains (Figure 2, inset 1); (2) errors in the original land-use land-cover map (Figure 2, inset 2); and (3) the higher model uncertainty in the wetland transitional zones (Figure 2, inset 3), especially the areas between Saltmarsh/Swamp and Forest, Forest and Marsh, and Saltmarsh/Swamp and Mangrove.
3.2. The Spatial Extent and Wetland Transitions under the SLR Scenarios
The model predicted that SLR would cause substantial land-cover changes and shifts in the study area (Figure 3). As the sea level rises, the area of water body is predicted to expand at the expense of other land-cover types (mainly Mangroves and Saltmarshes/Swamp), increasing from 11,371 ha to 12,627 ha (10.5%), 21,598 ha (89.9%), and 35,223 ha (209.8%) under low, moderate, and high SLR scenarios, respectively. In comparison to the gain in Water, the predicted loss in the terrestrial vegetation area was relatively small with a decrease of 1323 ha (5.7%), 3433 ha (14.9%) and 5503 ha (23.8%) under the 3 SLR scenarios.
The changes in wetland types were variable. Under the low SLR scenario 1, there was virtually no change in the total area of the wetlands; the gains in Mangroves counterbalanced the losses in other wetland types, resulting in an insignificant net increase of 67 ha (0.1%). Under higher SLR scenarios, however, a substantial loss of wetlands was predicted, with the total wetland area reduced by 6793 ha (10.30%) and 18,349 ha (27.83%) under scenarios 2 and 3, respectively (Figure 3).
The spatial extent of wetland (i.e., all four classes lumped together) loss, gain, and persistence under SLR scenarios is presented in Figure 4. Note that persistence includes a wetland area persisting as a wetland area irrespective of whether it changes wetland type. To emphasize the effects on wetlands, we excluded water and terrestrial vegetation in the map. In general, the loss and gain potentials increased as the SLR became larger (Figure 4). However, the gain potential was much less than the loss potential, resulting in persistent wetland decreases at higher sea levels.
It was clear that most wetland loss occurred at the open water margin and wetland gains were at the upslope margin. Under scenario 1, the loss of wetlands was minimal and restrained to riparian areas along the streams and rivers. Similarly, the encroachment of wetlands into the uplands was marginal. Under higher SLR scenarios, extensive loss occurred in freshwater wetlands on the coastal floodplain when SLR reached 1.5 m (Figure 4). In contrast, the gains were limited, and only small patches of freshwater wetlands were formed in the uplands (Figure 4).
3.3. The Gains, Losses, Net Change, and Swap Change at the Category Levels
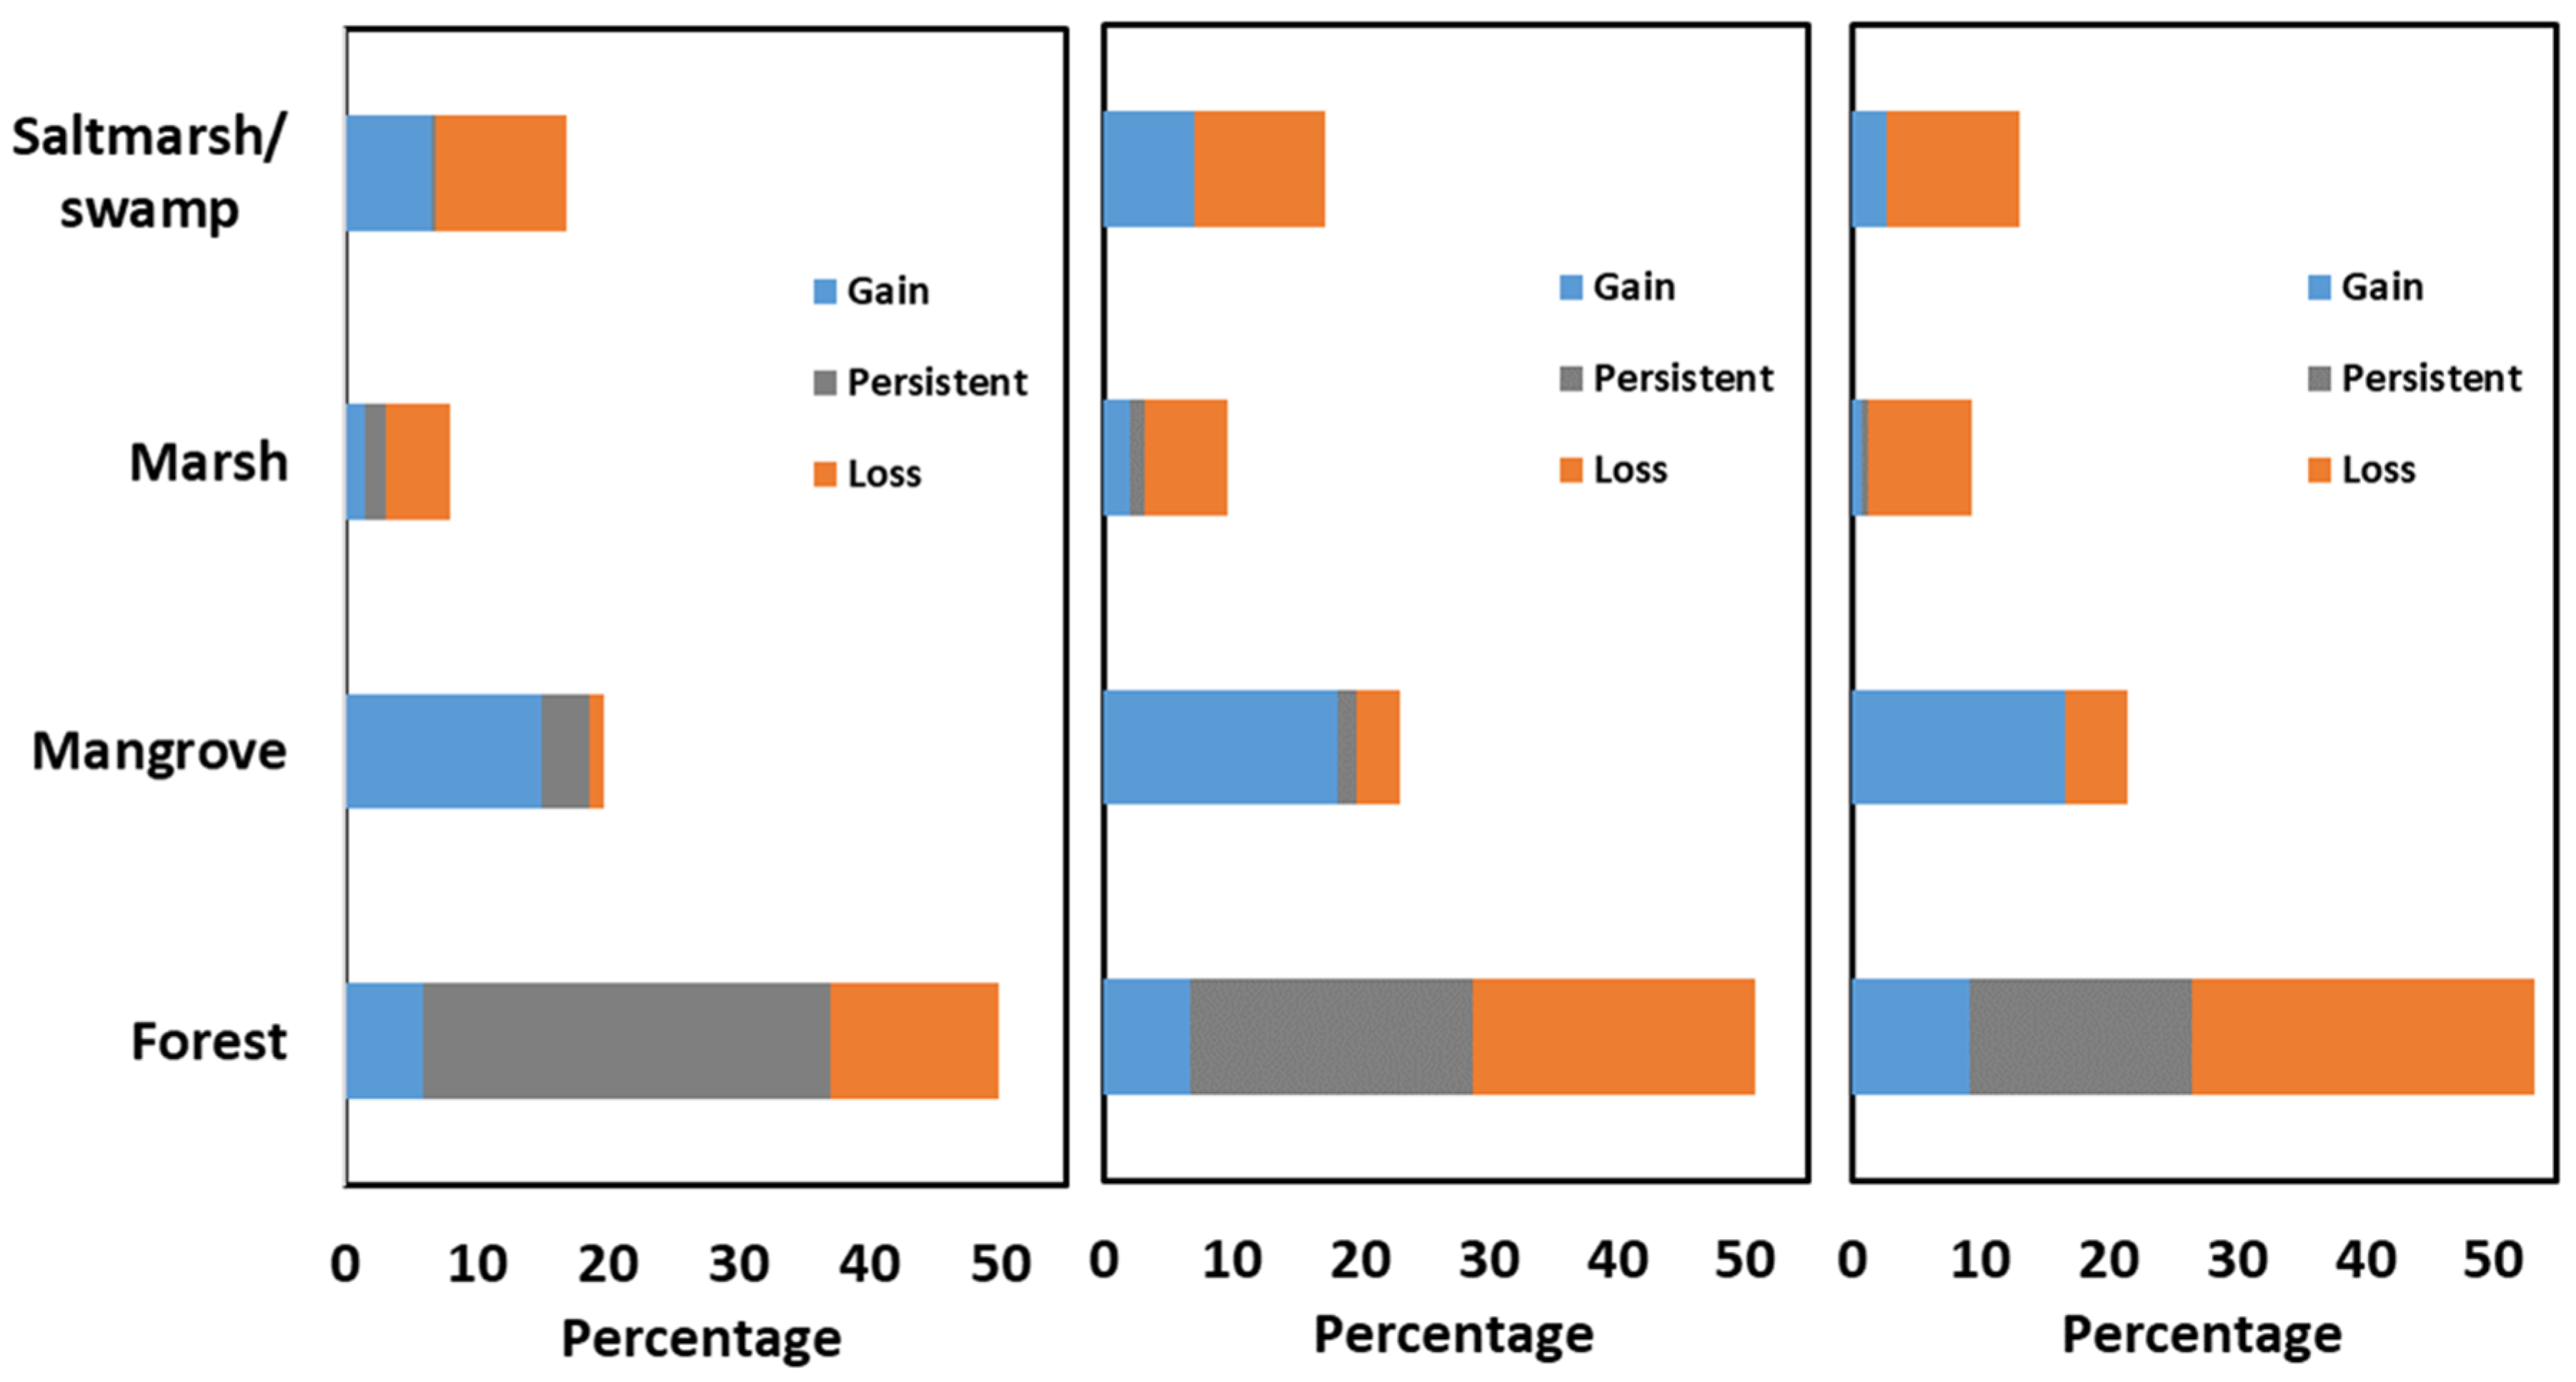
SLR-associated transitions of land cover from one class to other classes, including areal gains, losses, persistence, total changes, and swaps, are listed in Table 2 and summarized visually in Figure 5. The change percentages associated with each class are proportions of the total area shown in Figure 3. At the landscape scale, the total changes under SLR scenario 1 were dominated by wetlands (the total change was 18.78%, 16.25% and 16.52% for Forest, Mangroves and Saltmarsh/Swamp, respectively, Table 2). The total change in Water increased in dominance under SLR scenarios 2 and 3. The change in upland terrestrial vegetation was low under all SLR scenarios likely due to a steeper slope, suggesting a limited horizontal migration potential in the study area near the entrance of Manning Estuary.
Among the wetlands, the proportion of persistence was highest for Forest, followed by Mangrove, Marsh and Saltmarsh/Swamp under scenario 1. However, wetland persistence decreased rapidly under higher SLR scenarios, especially for Saltmarsh/Swamp and Mangrove (Figure 5 and Table 2). Under SLR scenario 3, all wetland types, except Forest, lost their persistence (the persistence was 0, 0.06%, and 0.50% for Saltmarsh/Swamp, Mangrove, and Marsh, respectively, Table 2). In addition, the total changes were comprised of a high level of swap changes, especially for Forest and Saltmarsh/Swamp (Table 2), indicating that a widespread wetland transition occurred due to the SLR. Moreover, the changes caused by SLR were disproportionate, with Forest and Saltmarsh/Swamp having the greatest variations, and the uneven areal changes in different wetland types was consistent between the scenarios (Figure 5). Under SLR scenario 1, all wetland types were predicted to suffer small losses ranging from 3.28% (Saltmarsh/Swamp), to Marsh (3.50%), to 6.91% (Forest), except for Mangrove, which was predicted to increase by 13.75%. The patterns of loss and gain were similar under SLR scenarios 2 and 3, with Forest suffering the highest loss followed by Saltmarsh/Swamp and Marsh and gains for Mangrove (Table 2).
3.3.1. Forest Transitions
The transitions in Forest were dominated by persistence and loss, although persistence decreased with a higher SLR (Figure 5). Under SLR scenario 1, the greatest loss (29.20%) was due to the encroachment of Saltmarsh/Swamp (6645 ha) and Mangrove (5126 ha). The exchange between Marsh and Forest resulted in a net gain of 3607 ha, which was much larger than the gain of 1230 ha from upland terrestrial vegetation. At a higher SLR of 1.0 m, nearly half of the current forest area was predicted to be lost to other wetland types, and the majority of the loss was caused by the encroachment of Mangrove (14,677 ha) and Saltmarsh/Swamp (5646 ha). Again, the gain of 4465 ha by Marsh outweighed the loss of 1733 ha from Marsh, and the gain from the uplands increased to 2294 ha. Under the highest SLR of 1.5 m considered in this study, most of the current forest area (60.37%) was predicted to be replaced by other wetland types (17,381 ha) or inundated (9287 ha). The total gain of 9196 ha was from Terrestrial (3434 ha) and Marsh (5762 ha).
3.3.2. Mangrove Transitions
The change in Mangrove was dominated by gains (Figure 5), and it was predicted to expand under all simulated SLR scenarios. For the first 0.5 m of SLR, 25.8% (1251 ha) of the current mangroves were predicted to be lost to Water. However, 5126 ha of Forest and 9931 ha of Saltmarsh/Swamp were predicted to be converted to mangroves, resulting in an increase of 284.39%. When SLR reaches 1.0 m, although nearly 70% (3354 ha) of the current mangrove area would be inundated by water, large predicted gains (14,677 ha from Forest, 3421 ha from Saltmarsh/Swamp, and 259 ha from Marsh) resulted in a net increase of 309.05%. Under the highest SLR scenario of 1.5 m, almost all current Mangroves were predicted to be lost. Nevertheless, the gains from Forest (14,372 ha), Saltmarsh/Swamp (1772 ha), and Marsh (526 ha) was far greater than the loss, resulting in a net increase of 244.58%.
3.3.3. Saltmarsh/Swamp Transitions
The Saltmarsh/Swamp had the highest potential for loss due to very limited persistence under SLR scenario 1 (358 ha or 3.48%) and no persistence under higher SLR scenarios (Figure 5). Under a low SLR, the predicted loss of 96.52% was mainly caused by the encroachment of Mangrove (9931 ha). All newly created Saltmarsh/Swamp (6645 ha) was due to the predicted landward migration into Forest. Under the higher SLR scenario of 1.0 m, inundation (6873 ha) by Water and invasion by Mangrove (3421 ha) resulted in a predicted 100% loss of the current Saltmarsh/Swamp areas. The encroachment into Forest (5646 ha) and Marsh (1470 ha) was the gain mechanism. When the sea level rise increased to 1.5 m, flooding (9767 ha) was responsible for the majority of losses, and only a small fraction of the Saltmarsh/Swamp loss (526 ha) was due to Mangrove encroachment. Most of the predicted gain was due to the migration into Forest (2348 ha), and the migration into Marsh (467 ha) was marginal.
3.3.4. Marsh Transitions
Marsh occupied the smallest proportion of the coastal landscape in the focus study area in the Manning Estuary (Figure 1 and Figure 3), and loss was the dominant transitional pathway under a future sea level rise (Figure 5). The predicted exchange between Forest and Marsh was the main transition mechanism for all SLR scenarios (Table 2). Additionally, there was also considerable Marsh loss to Saltmarsh/Swamp (1165 ha) under SLR scenario 2, and to Mangrove (1772 ha) under scenario 3. The predicted Marsh gain from the upland terrestrial land cover was limited (373 ha, 383 ha, and 165 ha under the three SLR scenarios). The predicted loss to Forest always outweighed the gain (see above), resulting in the highest net-loss rate (40.99%, 50.53%, and 84.45% under scenarios 1, 2, and 3, respectively).
4. Discussion
Upland migration is considered to be one of the major coastal ecosystem adaptation mechanisms to SLR [11,69], and many previous studies have argued that, on some coasts, the lateral accommodation space for saline vegetated wetlands (especially mangroves) is large enough to counteract areal loss in the face of SLR (e.g., [23,27,70]). There is currently a knowledge gap on the impacts of SLR on other coastal wetlands, such as freshwater and brackish forests [13], presenting a major barrier for integrated coastal ecosystem management [13,71,72]. Based on the modeled hydro-geomorphological settings of current wetland distributions, this study predicted the potential distribution of future wetlands and investigated the transitions of wetland types under low (0.5 m), moderate (1.0 m), and high (1.5 m) sea level rise scenarios. In agreement with previous studies [28,73], the results for our study area located near the entrance of a micro-tidal barrier-type estuary predicted that the total area of wetland would be kept at the current level (a slight increase of 67 ha, 0.01%) under the low SLR scenario, but would substantially decrease under the moderate and high SLR scenarios (a reduction by 10.30% and 27.83% under moderate and high SLR scenarios, respectively). Moreover, our results predicted that mangroves are the clear winner, significantly increasing in the face of future SLR, while all other wetland types would suffer considerable losses, especially under higher SLR scenarios. Our results support the hypothesized landward transgression under SLR [74] for all wetland types, although the migration is highly localized (Figure 2), influenced by local hydro-geomorphology [75]. These site-specific transitions support the ecotone theory [76], which predicts that a high rate of ecological shifts induced by environmental change often occurs at the transition zones [77]. It is important to note that hydro-geomorphology is just one of the many factors dictating how coastal wetlands respond to SLR, albeit being in many locations one of the most important [78,79]. Other factors, such as catchment freshwater and sediment input, tide entrance conditions, temperature, rainfall and evaporation, and extreme events [21,80,81], are not explored in the present paper. Nevertheless, the results of our machine learning approach are broadly consistent with more data-demanding numerical models [73], such as the 1D Marsh Equilibrium Model (MEM), 2D SLAMM (Sea Level Affecting Marshes Model), and more complex 3D Delft3D hydrodynamic model [82].
4.1. Mangrove Has the Largest Horizontal Accommodation Space
For our study area, mangroves are predicted to increase under all simulated SLR scenarios. Under the low SLR scenario, our results predicted that almost all of the existing Saltmarsh/Swamp (96.52%) would be replaced by Mangrove even though considerable Mangrove along the riparian zone would be lost to inundation. Under a moderate and high SLR, when Saltmarsh/Swamp is also subjected to inundation, Mangrove is predicted to continue its migration landward into freshwater forests, and to a lesser degree, into freshwater marshes. This is consistent with previous observations of widespread migration of mangroves into adjacent saline marshes, including saltmarshes and forested swamps (e.g., Casuarina and Melaleuca) in south-east Australian estuaries [21] and other parts of the globe [83].
Many mechanisms have been suggested to explain the trend of mangrove expansion, including increased winter temperatures [84], increased annual maximum temperature [79], altered rainfall patterns [85], higher sediment accretion rates [16], and sea level rise [83]. Our modeling results suggest that changes in the relative sea level and distance to water (i.e., the two variables due to SLR, which varied in predicting the future wetland distribution) could largely explain the landward migration of the mangrove–saltmarsh ecotone.
4.2. Natural Coastal Squeeze Limited the Upland Migration of Other Wetland Types
Of the six investigated land-cover types, Saltmarsh/Swamp had the lowest persistence (the persistence was zero under moderate and high scenarios, Table 2). The low persistence means that the current saltmarsh area is predicted not to survive the SLR scenarios considered. With the pressure of mangrove encroachment and tidal inundation, Saltmarsh/Swamp also has the capacity to migrate landward into forests or freshwater marshes. However, the predicted lateral migration was limited, probably by slope [11,22,86], and only a small proportion of the current forests and freshwater marshes were available for the migration of Saltmarsh/Swamp after deducting the areas encroached by mangroves. This natural coastal squeeze, i.e., the barriers that prevent wetland migration to the adjacent uplands [87], was high for saltmarshes and saline brackish swamps, and deterred the landward advance of Saltmarsh/Swamp at the saltmarsh/swamp–forest ecotone, resulting in a large predicted decrease in the saltmarsh area, even under the low SLR scenario.
Due to the low differentiating power of the models based solely on hydro-geomorphology, we did not distinguish between the Casuarina swamp and saltmarshes. However, there are observations showing the expansion of saltmarshes and die-back of these brackish forests [7]. Further studies taking advantage of the availability of long-term airborne and spaceborne imagery could provide new insights into the requirements of these vegetation communities [78], and accurately predict their future distribution in the face of SLR.
The predicted upland migration of freshwater forest wetlands and marshes was also limited by natural coastal squeeze, and the total available accommodation spaces were 1323 ha, 2430 ha, and 3545 ha in the study area under the three SLR scenarios. These limited lateral accommodation spaces were far smaller than the areas encroached by mangroves, saltmarshes, and brackish swamps, resulting in the predicted extensive loss of freshwater wetlands in the focused study area of the Manning River Estuary, in agreement with the observations in many North American coastal plains [78].
4.3. Hydro-Geomorphology Alone Might Not Explain the Transitions among Current Freshwater Wetlands
Our results suggest that SLR would cause a considerable exchange between freshwater forest wetlands and freshwater marshes, although this transition is much smaller than that occurring between the saline and freshwater wetlands. These results should be interpreted with caution, however, since, to achieve optimal discriminating accuracy, we had to group some disparate wetland classes, which may mask some of the salt–freshwater wetland transitions. Although there are significant differences in the floral composition and vegetation structure [7,88], determinant factors, such as freshwater inputs and groundwater availability [2,26], might not closely associate with the hydro-geomorphological variables considered in this study. Again, further studies with long-term imagery are required to investigate the interchange of freshwater wetlands due to SLR.
5. Conclusions
Using the current wetland map of a micro-tidal estuary, the Manning River in New South Wales, Australia, this study built a machine learning model based on the hydro-geomorphological settings of four broad wetland types. The model was then used to predict the future wetland distribution under three sea level rise scenarios. The predictions were compared to investigate the persistence, net, swap, and total changes in wetlands. The results show potentially extensive gains of mangroves under low (0.5 m), moderate (1.0 m), and high (1.5 m) sea level rise scenarios. However, all other wetlands could suffer substantial losses. Although landward migration of saline wetlands is a key adaptive mechanism in response to sea level rise, especially in areas where the existing wetlands are not able to avoid drowning through vertical accretion, our findings suggest that these accommodation spaces might only be beneficial to mangroves, and their availability to saltmarshes and brackish swamps might be limited by coastal squeeze at the saline-freshwater ecotones. Moreover, our results also indicate that the accommodation spaces for freshwater wetlands could be restrained by coastal squeeze at the wetland-upland ecotones.
Author Contributions
Conceptualization, L.W. and M.G.H.; methodology, L.W.; validation, L.W. and M.G.H.; formal analysis, L.W., writing—original draft preparation, L.W.; writing—review and editing, L.W. and M.G.H. All authors have read and agreed to the published version of the manuscript.
Funding
This research received no external funding.
Data Availability Statement
The data presented in this study are available on request from the corresponding author.
Acknowledgments
We thank David Hanslow for providing the HHWSS tidal planes. We also thank MidCoast Council for makes the current wetland distribution map available to public.
Conflicts of Interest
The authors declare no conflict of interest.
References
- Ewel, K.C. Appreciating tropical coastal wetlands from a landscape perspective. Front. Ecol. Environ. 2010, 8, 20–26. [Google Scholar] [CrossRef]
- Grieger, R.; Capon, S.J.; Hadwen, W.L.; Mackey, B. Spatial variation and drivers of vegetation structure and composition in coastal freshwater wetlands of subtropical Australia. Mar. Freshw. Res. 2021, 72, 1746–1759. [Google Scholar] [CrossRef]
- Hopkinson, C.S.; Wolanski, E.; Cahoon, D.R.; Perillo, G.M.; Brinson, M.M. Coastal wetlands: A synthesis. In Coastal Wetlands; Elsevier: Amsterdam, The Netherlands, 2019; pp. 1–75. [Google Scholar]
- Cowardin, L.M. Classification of Wetlands and Deepwater Habitats of the United States; Fish and Wildlife Service, US Department of the Interior: Washington, DC, USA, 1979.
- Barbier, E.B. The Protective Value of Estuarine and Coastal Ecosystem Services in a Wealth Accounting Framework. Environ. Resour. Econ. 2016, 64, 37–58. [Google Scholar] [CrossRef]
- Barbier, E.B.; Hacker, S.D.; Kennedy, C.; Koch, E.W.; Stier, A.C.; Silliman, B.R. The value of estuarine and coastal ecosystem services. Ecol. Monogr. 2011, 81, 169–193. [Google Scholar] [CrossRef]
- Saintilan, N.; Rogers, K.; Kelleway, J.J.; Ens, E.; Sloane, D.R. Climate change impacts on the coastal wetlands of Australia. Wetlands 2019, 39, 1145–1154. [Google Scholar] [CrossRef]
- Woodruff, J.D.; Irish, J.L.; Camargo, S.J. Coastal flooding by tropical cyclones and sea-level rise. Nature 2013, 504, 44–52. [Google Scholar] [CrossRef] [Green Version]
- He, Q.; Silliman, B.R. Climate Change, Human Impacts, and Coastal Ecosystems in the Anthropocene. Curr. Biol. 2019, 29, R1021–R1035. [Google Scholar] [CrossRef]
- IPCC. Climate change 2014: Synthesis report. In Contribution of Working Groups I, II and III to the Fifth Assessment Report of the Intergovernmental Panel on Climate Change; Intergovernmental Panel on Climate Change: Geneva, Switzerland, 2014; pp. 1–151. [Google Scholar]
- Enwright, N.M.; Griffith, K.T.; Osland, M.J. Barriers to and opportunities for landward migration of coastal wetlands with sea-level rise. Front. Ecol. Environ. 2016, 14, 307–316. [Google Scholar] [CrossRef]
- Schuerch, M.; Spencer, T.; Temmerman, S.; Kirwan, M.L.; Wolff, C.; Lincke, D.; McOwen, C.J.; Pickering, M.D.; Reef, R.; Vafeidis, A.T.; et al. Future response of global coastal wetlands to sea-level rise. Nature 2018, 561, 231–234. [Google Scholar] [CrossRef]
- Grieger, R.; Capon, S.J.; Hadwen, W.L.; Mackey, B. Between a bog and a hard place: A global review of climate change effects on coastal freshwater wetlands. Clim. Chang. 2020, 163, 161–179. [Google Scholar] [CrossRef]
- Cahoon, D.R.; Lynch, J.C.; Perez, B.C.; Segura, B.; Holland, R.D.; Stelly, C.; Stephenson, G.; Hensel, P. High-Precision Measurements of Wetland Sediment Elevation: II. The Rod Surface Elevation Table. J. Sediment. Res. 2002, 72, 734–739. [Google Scholar] [CrossRef]
- Krauss, K.W.; Cahoon, D.R.; Allen, J.A.; Ewel, K.C.; Lynch, J.C.; Cormier, N. Surface elevation change and susceptibility of different mangrove zones to sea-level rise on Pacific high islands of Micronesia. Ecosystems 2010, 13, 129–143. [Google Scholar] [CrossRef]
- Rogers, K.; Wilton, K.M.; Saintilan, N. Vegetation change and surface elevation dynamics in estuarine wetlands of southeast Australia. Estuar. Coast. Shelf Sci. 2006, 66, 559–569. [Google Scholar] [CrossRef]
- Webb, E.L.; Friess, D.A.; Krauss, K.W.; Cahoon, D.R.; Guntenspergen, G.R.; Phelps, J. A global standard for monitoring coastal wetland vulnerability to accelerated sea-level rise. Nat. Clim. Chang. 2013, 3, 458–465. [Google Scholar] [CrossRef] [Green Version]
- Spalding, M.D.; Blasco, F.; Field, C.D. World Mangrove Atlas; International Society for Mangrove Ecosystems: Okinawa, Japan, 1997. [Google Scholar]
- Cole, L.E.S.; Bhagwat, S.A.; Willis, K.J. Long-term disturbance dynamics and resilience of tropical peat swamp forests. J. Ecol. 2015, 103, 16–30. [Google Scholar] [CrossRef] [Green Version]
- Cherry, J.A.; Battaglia, L.L. Tidal Wetlands in a Changing Climate: Introduction to a Special Feature. Wetlands 2019, 39, 1139–1144. [Google Scholar] [CrossRef]
- Saintilan, N.; Williams, R.J. Mangrove transgression into saltmarsh environments in south-east Australia. Glob. Ecol. Biogeogr. 1999, 8, 117–124. [Google Scholar] [CrossRef] [Green Version]
- Doyle, T.W.; Krauss, K.W.; Conner, W.H.; From, A.S. Predicting the retreat and migration of tidal forests along the northern Gulf of Mexico under sea-level rise. For. Ecol. Manag. 2010, 259, 770–777. [Google Scholar] [CrossRef]
- Kirwan, M.L.; Gedan, K.B. Sea-level driven land conversion and the formation of ghost forests. Nat. Clim. Chang. 2019, 9, 450–457. [Google Scholar] [CrossRef] [Green Version]
- Bowman, D.M.J.S.; Prior, L.D.; De Little, S.C. Retreating Melaleuca swamp forests in Kakadu National Park: Evidence of synergistic effects of climate change and past feral buffalo impacts. Austral Ecol. 2010, 35, 898–905. [Google Scholar] [CrossRef]
- Reed, D.; Wang, Y.; Meselhe, E.; White, E. Modeling wetland transitions and loss in coastal Louisiana under scenarios of future relative sea-level rise. Geomorphology 2020, 352, 106991. [Google Scholar] [CrossRef]
- White, E.; Kaplan, D. Restore or retreat? Saltwater intrusion and water management in coastal wetlands. Ecosyst. Health Sustain. 2017, 3, e01258. [Google Scholar] [CrossRef] [Green Version]
- Kirwan, M.L.; Walters, D.C.; Reay, W.G.; Carr, J.A. Sea level driven marsh expansion in a coupled model of marsh erosion and migration. Geophys. Res. Lett. 2016, 43, 4366–4373. [Google Scholar] [CrossRef] [Green Version]
- Thorne, K.; MacDonald, G.; Guntenspergen, G.; Ambrose, R.; Buffington, K.; Dugger, B.; Freeman, C.; Janousek, C.; Brown, L.; Rosencranz, J.; et al. U.S. Pacific coastal wetland resilience and vulnerability to sea-level rise. Sci. Adv. 2018, 4, eaao3270. [Google Scholar] [CrossRef] [Green Version]
- Pontee, N. Defining coastal squeeze: A discussion. Ocean Coast. Manag. 2013, 84, 204–207. [Google Scholar] [CrossRef]
- OEH. Threatened Ecological Communities Strategy; NSW Office of Environment and Heritage: Sydney, Australia, 2017.
- Roy, P.S.; Williams, R.J.; Jones, A.R.; Yassini, I.; Gibbs, P.J.; Coates, B.; West, R.J.; Scanes, P.R.; Hudson, J.P.; Nichol, S. Structure and function of south-east Australian estuaries. Estuar. Coast. Shelf Sci. 2001, 53, 351–384. [Google Scholar] [CrossRef]
- Kopp, R.E.; Horton, R.M.; Little, C.M.; Mitrovica, J.X.; Oppenheimer, M.; Rasmussen, D.J.; Strauss, B.H.; Tebaldi, C. Probabilistic 21st and 22nd century sea-level projections at a global network of tide-gauge sites. Earth’s Future 2014, 2, 383–406. [Google Scholar] [CrossRef]
- Braimoh, A.K. Random and systematic land-cover transitions in northern Ghana. Agric. Ecosyst. Environ. 2006, 113, 254–263. [Google Scholar] [CrossRef]
- Pontius, R.G., Jr.; Shusas, E.; McEachern, M. Detecting important categorical land changes while accounting for persistence. Agric. Ecosyst. Environ. 2004, 101, 251–268. [Google Scholar] [CrossRef]
- West, R.J.; Thorogood, C.A.; Walford, T.R.; Williams, R.J. Estuarine Inventory of NSW Fisheries: Bulletin 2; NSW Department of Agriculture: Orange, Australia, 1985.
- Kench, P.S. Geomorphology of Australian estuaries: Review and prospect. Austral. J. Ecol. 1999, 24, 367–380. [Google Scholar] [CrossRef]
- Williams, R.E.; Wyllie, S. The retention of pollutants and the related tidal characteristics of the Manning river. In Proceedings of 12th Federal Convention; Australian Water & Wastewater Association: Adelaide, Australia, 1987; pp. 458–465. [Google Scholar]
- Bucher, D.J. Spatial and Temporal Patterns of Recreational Angling Effort in a Warm-Temperate Australian Estuary. Geogr. Res. 2006, 44, 87–94. [Google Scholar] [CrossRef]
- Manly Hydraulics Laboratory. OEH NSW Estuaries Salinity Data Compilation 1992 to 2011. In Report MHL 1812; Manly Hydraulics Laboratory: Manly Vale, Australia, 2012. [Google Scholar]
- Eco Logical Australia. Manning River Wetlands Mapping. Prepared for MidCoast Council. 2019. Available online: https://www.midcoast.nsw.gov.au/files/assets/public/document-resources/environment-docs/manning-river-catchment-wetland-mapping.pdf (accessed on 4 August 2020).
- MidCoast Council. Manning River Estuary and Catchment Management Program. 2021. Available online: https://haveyoursay.midcoast.nsw.gov.au/our-manning-river (accessed on 4 August 2021).
- Neyman, J. On the Two Different Aspects of the Representative Method: The Method of Stratified Sampling and the Method of Purposive Selection. In Breakthroughs in Statistics; Springer: New York, NY, USA, 1992; pp. 123–150. [Google Scholar]
- Morzaria-Luna, L.; Callaway, J.C.; Sullivan, G.; Zedler, J.B. Relationship between topographic heterogeneity and vegetation patterns in a Californian salt marsh. J. Veg. Sci. 2004, 15, 523–530. [Google Scholar] [CrossRef]
- Schlesinger, W.H. On the Relative Dominance of Shrubs in Okefenokee Swamp. Am. Nat. 1978, 112, 949–954. [Google Scholar] [CrossRef]
- Huenneke, L.F.; Sharitz, R.R. Microsite abundance and distribution of woody seedlings in a South Carolina cypress-tupelo swamp. Am. Midl. Nat. 1986, 115, 328–335. [Google Scholar] [CrossRef]
- Moore, I.D.; Grayson, R.B.; Ladson, A.R. Digital terrain modelling: A review of hydrological, geomorphological, and biological applications. Hydrol. Process. 1991, 5, 3–30. [Google Scholar] [CrossRef]
- Alexander, C.; Deák, B.; Heilmeier, H. Micro-topography driven vegetation patterns in open mosaic landscapes. Ecol. Indic. 2016, 60, 906–920. [Google Scholar] [CrossRef]
- Conrad, O.; Bechtel, B.; Bock, M.; Dietrich, H.; Fischer, E.; Gerlitz, L.; Wehberg, J.; Wichmann, V.; Böhner, J. System for Automated Geoscientific Analyses (SAGA) v. 2.1.4. Geosci. Model Dev. 2015, 8, 1991–2007. [Google Scholar] [CrossRef] [Green Version]
- Guisan, A.; Weiss, S.B.; Weiss, A.D. GLM versus CCA spatial modeling of plant species distribution. Plant Ecol. 1999, 143, 107–122. [Google Scholar] [CrossRef]
- Riley, S.J.; DeGloria, S.D.; Elliot, R. Index that quantifies topographic heterogeneity. Intermt. J. Sci. 1999, 5, 23–27. [Google Scholar]
- Beven, K.J.; Kirkby, M.J. A physically based, variable contributing area model of basin hydrology. Hydrol. Sci. J. 1979, 24, 43–69. [Google Scholar] [CrossRef] [Green Version]
- Böhner, J.; Antonić, O. Land-Surface Parameters Specific to Topo-Climatology. Dev. Soil Sci. 2009, 33, 195–226. [Google Scholar] [CrossRef]
- Horn, B.K. Hill shading and the reflectance map. Proc. IEEE 1981, 69, 14–47. [Google Scholar] [CrossRef] [Green Version]
- Hughes, M.G.; Rogers, K.; Wen, L. Saline wetland extents and tidal inundation regimes on a micro-tidal coast, New South Wales, Australia. Estuar. Coast. Shelf Sci. 2019, 227, 106297. [Google Scholar] [CrossRef]
- Hanslow, D.J.; Morris, B.D.; Foulsham, E.; Kinsela, M. A Regional Scale Approach to Assessing Current and Potential Future Exposure to Tidal Inundation in Different Types of Estuaries. Sci. Rep. 2018, 8, 7065. [Google Scholar] [CrossRef] [PubMed]
- Khojasteh, D.; Glamore, W.; Heimhuber, V.; Felder, S. Sea level rise impacts on estuarine dynamics: A review. Sci. Total Environ. 2021, 780, 146470. [Google Scholar] [CrossRef]
- Hughes, M.G.; Glasby, T.M.; Hanslow, D.J.; West, G.J.; Wen, L. Random forest classification method for predicting intertidal wetland migration under sea level rise. Front. Environ. Sci. 2022; in press. [Google Scholar]
- Dormann, C.F.; Elith, J.; Bacher, S.; Buchmann, C.; Carl, G.; Carré, G.; Marquéz, J.R.G.; Gruber, B.; Lafourcade, B.; Leitão, P.J.; et al. Collinearity: A review of methods to deal with it and a simulation study evaluating their performance. Ecography 2013, 36, 27–46. [Google Scholar] [CrossRef]
- O’Brien, R.M. A Caution Regarding Rules of Thumb for Variance Inflation Factors. Qual. Quant. 2007, 41, 673–690. [Google Scholar] [CrossRef]
- Kuhn, M. Building predictive models in R using the caret package. J. Stat. Softw. 2008, 28, 1–26. [Google Scholar] [CrossRef] [Green Version]
- Oliveira, S.; Oehler, F.; San-Miguel-Ayanz, J.; Camia, A.; Pereira, J.M.C. Modeling spatial patterns of fire occurrence in Mediterranean Europe using Multiple Regression and Random Forest. For. Ecol. Manag. 2012, 275, 117–129. [Google Scholar] [CrossRef]
- Wen, L.; Hughes, M. Coastal Wetland Mapping Using Ensemble Learning Algorithms: A Comparative Study of Bagging, Boosting and Stacking Techniques. Remote Sens. 2020, 12, 1683. [Google Scholar] [CrossRef]
- Tyagi, S.; Mittal, S. Sampling Approaches for Imbalanced Data Classification Problem in Machine Learning. In Proceedings of ICRIC 2019; Springer: Cham, Switzerland, 2020; pp. 209–221. [Google Scholar]
- Forkel, M.; Wutzler, T. Greenbrown—Land Surface Phenology and Trend Analysis; Version 2.2, 15 April 2015; A Package for the R Software: Vienna, Austria, 2015. [Google Scholar]
- Rogers, K.; Boon, P.I.; Branigan, S.; Duke, N.C.; Field, C.D.; Fitzsimons, J.A.; Kirkman, H.; Mackenzie, J.R.; Saintilan, N. The state of legislation and policy protecting Australia’s mangrove and salt marsh and their ecosystem services. Mar. Policy 2016, 72, 139–155. [Google Scholar] [CrossRef]
- Landis, J.R.; Koch, G.G. The Measurement of Observer Agreement for Categorical Data. Biometrics 1977, 33, 159–174. [Google Scholar] [CrossRef] [PubMed] [Green Version]
- Congalton, R.G.; Green, K. Assessing the Accuracy of Remotely Sensed Data Principles and Practices; CRS Press: Boca Raton, FL, USA, 2019. [Google Scholar]
- Anderson, J.R.; Hardy, E.E.; Roach, J.T.; Witmer, R.E. A Land Use and Land Cover Classification System for Use with Remote Sensor Data; Survey Prof. Paper; United State Department of Interior: Washington, DC, USA, 1976; Volume 964, p. 28.
- Woodroffe, C.D.; Rogers, K.; McKee, K.L.; Lovelock, C.E.; Mendelssohn, I.A.; Saintilan, N. Mangrove Sedimentation and Response to Relative Sea-Level Rise. Annu. Rev. Mar. Sci. 2016, 8, 243–266. [Google Scholar] [CrossRef] [PubMed] [Green Version]
- Alizad, K.; Hagen, S.C.; Medeiros, S.C.; Bilskie, M.V.; Morris, J.T.; Balthis, L.; Buckel, C.A. Dynamic responses and implications to coastal wetlands and the surrounding regions under sea level rise. PLoS ONE 2018, 13, e0205176. [Google Scholar] [CrossRef]
- Fagherazzi, S.; Anisfeld, S.C.; Blum, L.K.; Long, E.V.; Feagin, R.A.; Fernandes, A.; Kearney, W.S.; Williams, K. Sea Level Rise and the Dynamics of the Marsh-Upland Boundary. Front. Environ. Sci. 2019, 7, 25. [Google Scholar] [CrossRef]
- Waltham, N.J.; Burrows, D.; Wegscheidl, C.; Buelow, C.; Ronan, M.; Connolly, N.; Groves, P.; Marie-Audas, D.; Creighton, C.; Sheaves, M. Lost Floodplain Wetland Environments and Efforts to Restore Connectivity, Habitat, and Water Quality Settings on the Great Barrier Reef. Front. Mar. Sci. 2019, 6, 71. [Google Scholar] [CrossRef]
- Glick, P.; Clough, J.; Polaczyk, A.; Couvillion, B.; Nunley, B. Potential Effects of Sea-Level Rise on Coastal Wetlands in Southeastern Louisiana. J. Coast. Res. 2013, 63, 211–233. [Google Scholar] [CrossRef]
- Morris, J.T.; Sundareshwar, P.V.; Nietch, C.T.; Kjerfve, B.; Cahoon, D.R. Responses of coastal wetlands to rising sea level. Ecology 2002, 83, 2869–2877. [Google Scholar] [CrossRef]
- Brinson, M.M.; Christian, R.R.; Blum, L.K. Multiple States in the Sea-Level Induced Transition from Terrestrial Forest to Estuary. Estuaries 1995, 18, 648–659. [Google Scholar] [CrossRef]
- Smith, R.L. Ecology and Field Biology, 2nd ed.; Harper & Row: New York, NY, USA, 1974; p. 251. [Google Scholar]
- Noble, I.R. A Model of the Responses of Ecotones to Climate Change. Ecol. Appl. 1993, 3, 396–403. [Google Scholar] [CrossRef]
- White, E.E.; Ury, E.A.; Bernhardt, E.S.; Yang, X. Climate Change Driving Widespread Loss of Coastal Forested Wetlands throughout the North American Coastal Plain. Ecosystems 2021, 1–16. [Google Scholar] [CrossRef]
- Whitt, A.A.; Coleman, R.; Lovelock, C.E.; Gillies, C.; Ierodiaconou, D.; Liyanapathirana, M.; Macreadie, P.I. March of the mangroves: Drivers of encroachment into southern temperate saltmarsh. Estuar. Coast. Shelf Sci. 2020, 240, 106776. [Google Scholar] [CrossRef]
- Adam, P. Saltmarshes in a time of change. Environ. Conserv. 2002, 29, 39–61. [Google Scholar] [CrossRef]
- Leonardi, N.; Carnacina, I.; Donatelli, C.; Ganju, N.; Plater, A.J.; Schuerch, M.; Temmerman, S. Dynamic interactions between coastal storms and salt marshes: A review. Geomorphology 2018, 301, 92–107. [Google Scholar] [CrossRef] [Green Version]
- Fitzgerald, D.M.; Hughes, Z. Marsh Processes and Their Response to Climate Change and Sea-Level Rise. Annu. Rev. Earth Planet. Sci. 2019, 47, 481–517. [Google Scholar] [CrossRef] [Green Version]
- Di Nitto, D.; Neukermans, G.; Koedam, N.; Defever, H.; Pattyn, F.; Kairo, J.G.; Dahdouh-Guebas, F. Mangroves facing climate change: Landward migration potential in response to projected scenarios of sea level rise. Biogeosciences 2014, 11, 857–871. [Google Scholar] [CrossRef] [Green Version]
- Cavanaugh, K.C.; Kellner, J.R.; Forde, A.J.; Gruner, D.S.; Parker, J.D.; Rodriguez, W.; Feller, I.C. Poleward expansion of mangroves is a threshold response to decreased frequency of extreme cold events. Proc. Natl. Acad. Sci. USA 2014, 111, 723–727. [Google Scholar] [CrossRef] [Green Version]
- Eslami-Andargoli, L.; Dale, P.E.R.; Sipe, N.; Chaseling, J. Mangrove expansion and rainfall patterns in Moreton Bay, Southeast Queensland, Australia. Estuar. Coast. Shelf Sci. 2009, 85, 292–298. [Google Scholar] [CrossRef] [Green Version]
- Molino, G.D.; Defne, Z.; Aretxabaleta, A.L.; Ganju, N.K.; Carr, J.A. Quantifying Slopes as a Driver of Forest to Marsh Conversion Using Geospatial Techniques: Application to Chesapeake Bay Coastal-Plain, United States. Front. Environ. Sci. 2021, 9, 149. [Google Scholar] [CrossRef]
- Doody, J.P. ‘Coastal squeeze’—An historical perspective. J. Coast. Conserv. 2004, 10, 129–138. [Google Scholar] [CrossRef]
- Grieger, R.; Capon, S.; Hadwen, W. Resilience of coastal freshwater wetland vegetation of subtropical Australia to rising sea levels and altered hydrology. Reg. Environ. Chang. 2019, 19, 279–292. [Google Scholar] [CrossRef]
Figure 2.
The areas of agreement and mismatch between mapped and predicted land cover in the focused study area of the Manning River Estuary. The inset aerial photos show that the mismatches commonly occurred at hydrologically interrupted native vegetation (the levee and drain in Inset map 1), mis-mapped land use in the original land-use map (Inset map 2, cleared pasture mapped as grazed native vegetation), and the wetland transition zone (Inset map 3, the transition areas between Saltmarsh/Swamp and Forest).
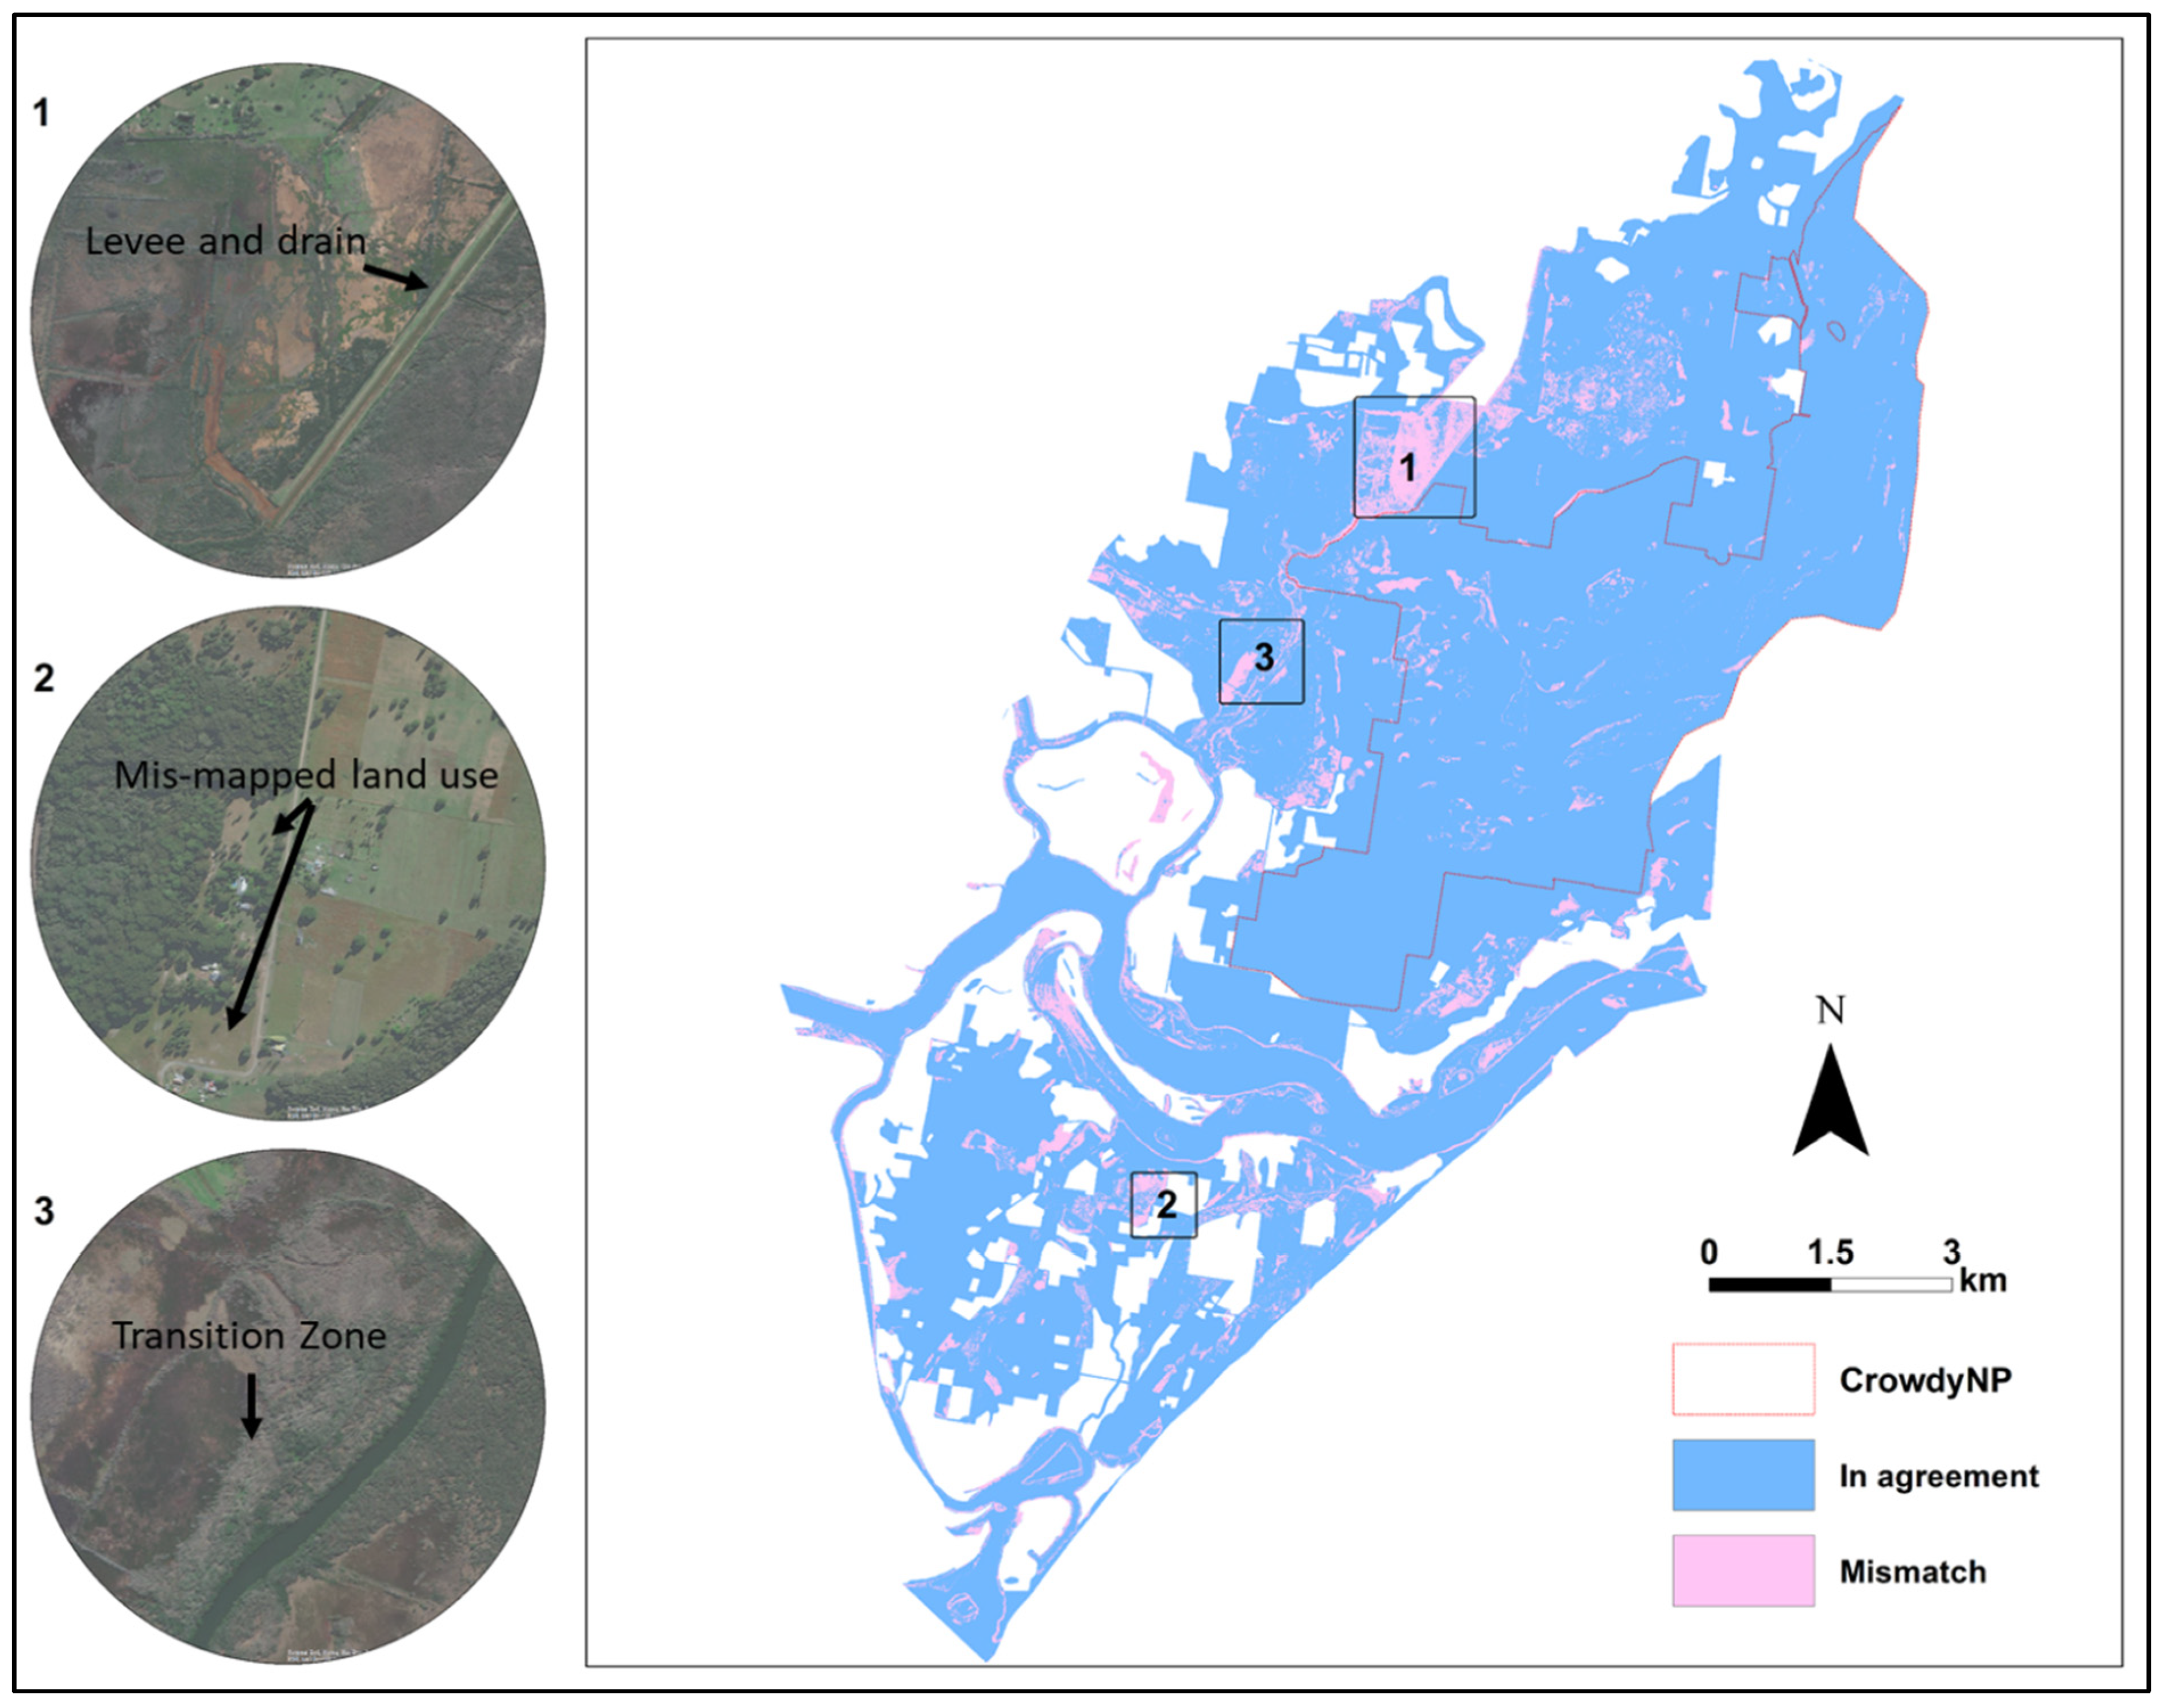
Figure 3.
The predicted land-cover maps showing the current and future distributions of major wetland types under three sea level rise scenarios (SLR scenarios 1, 2, and 3 correspond to 0.5 m, 1.0 m, and 1.5 m SLR, respectively) in the focused study area of the Manning River Estuary. The areas of predicted land cover are also listed.
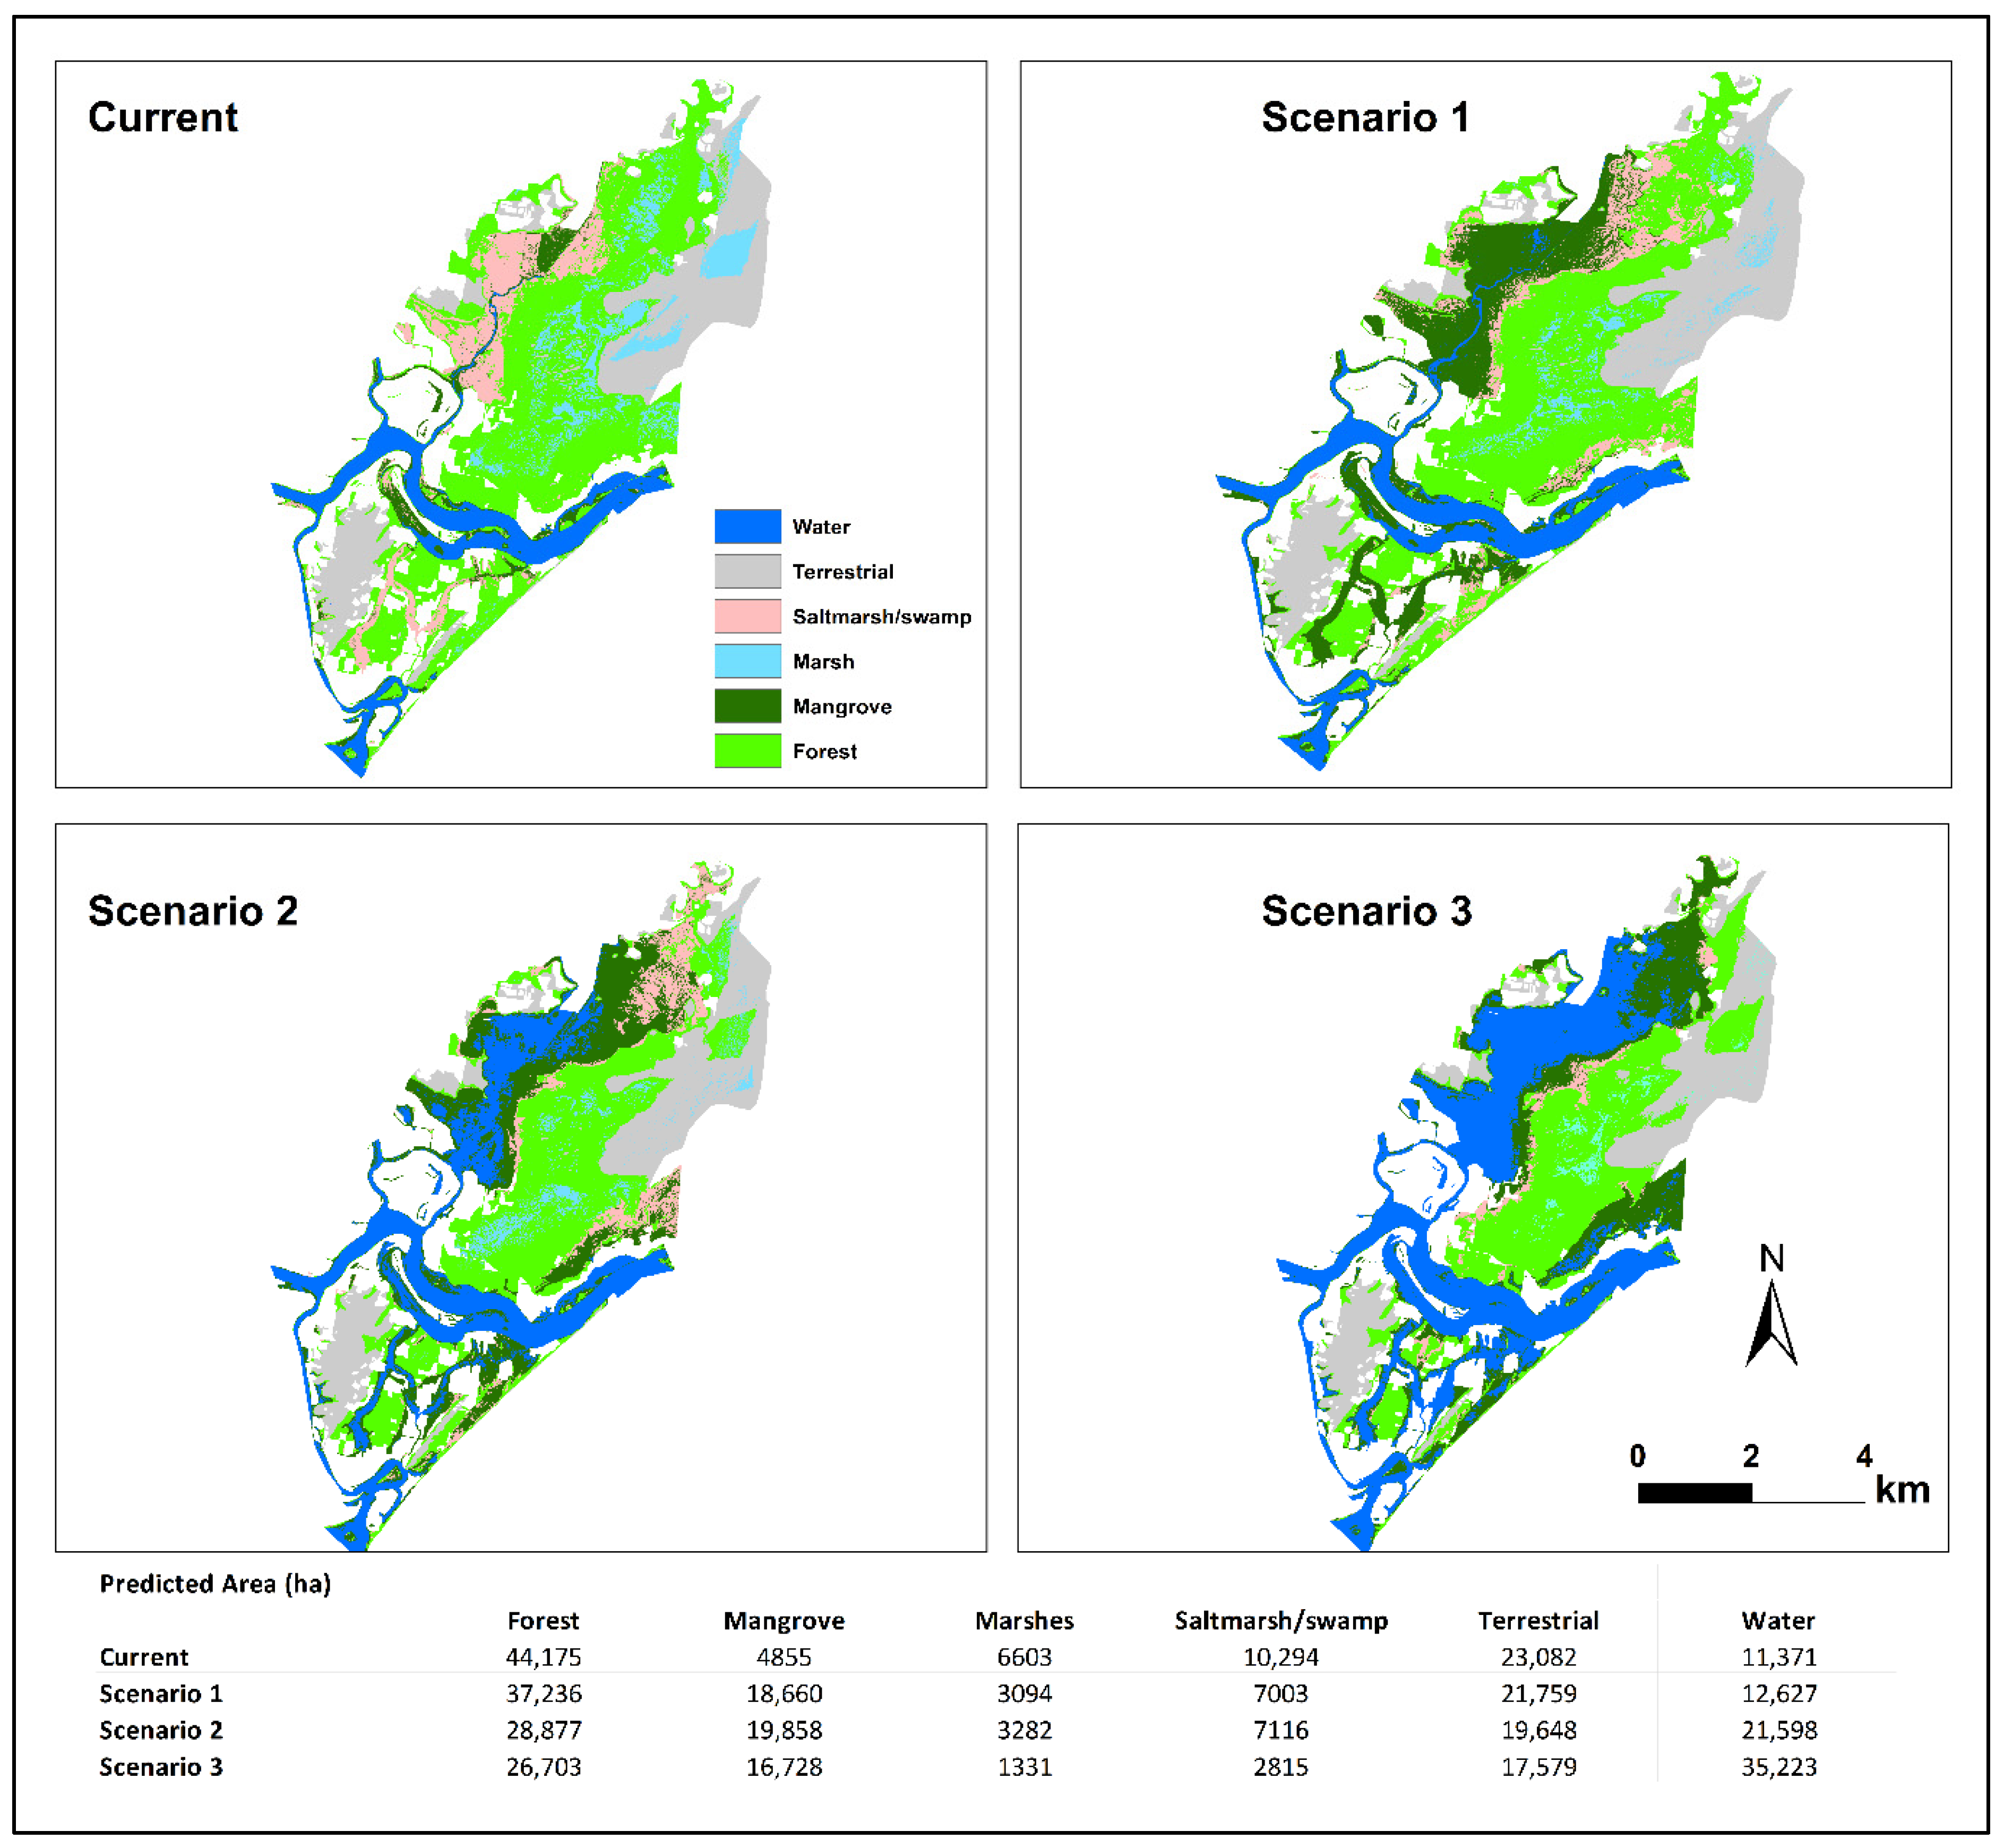
Figure 4.
Wetland loss and gain under SLR scenarios (SLR scenarios 1, 2, and 3 correspond to 0.5 m, 1.0 m, and 1.5 m SLR, respectively). A summary of the areal changes (ha) and ratios between loss and gain, loss and persistence, and gain and persistence are extracted from the maps and also listed. Note that water and terrestrial vegetation were masked out to focus on wetland changes.
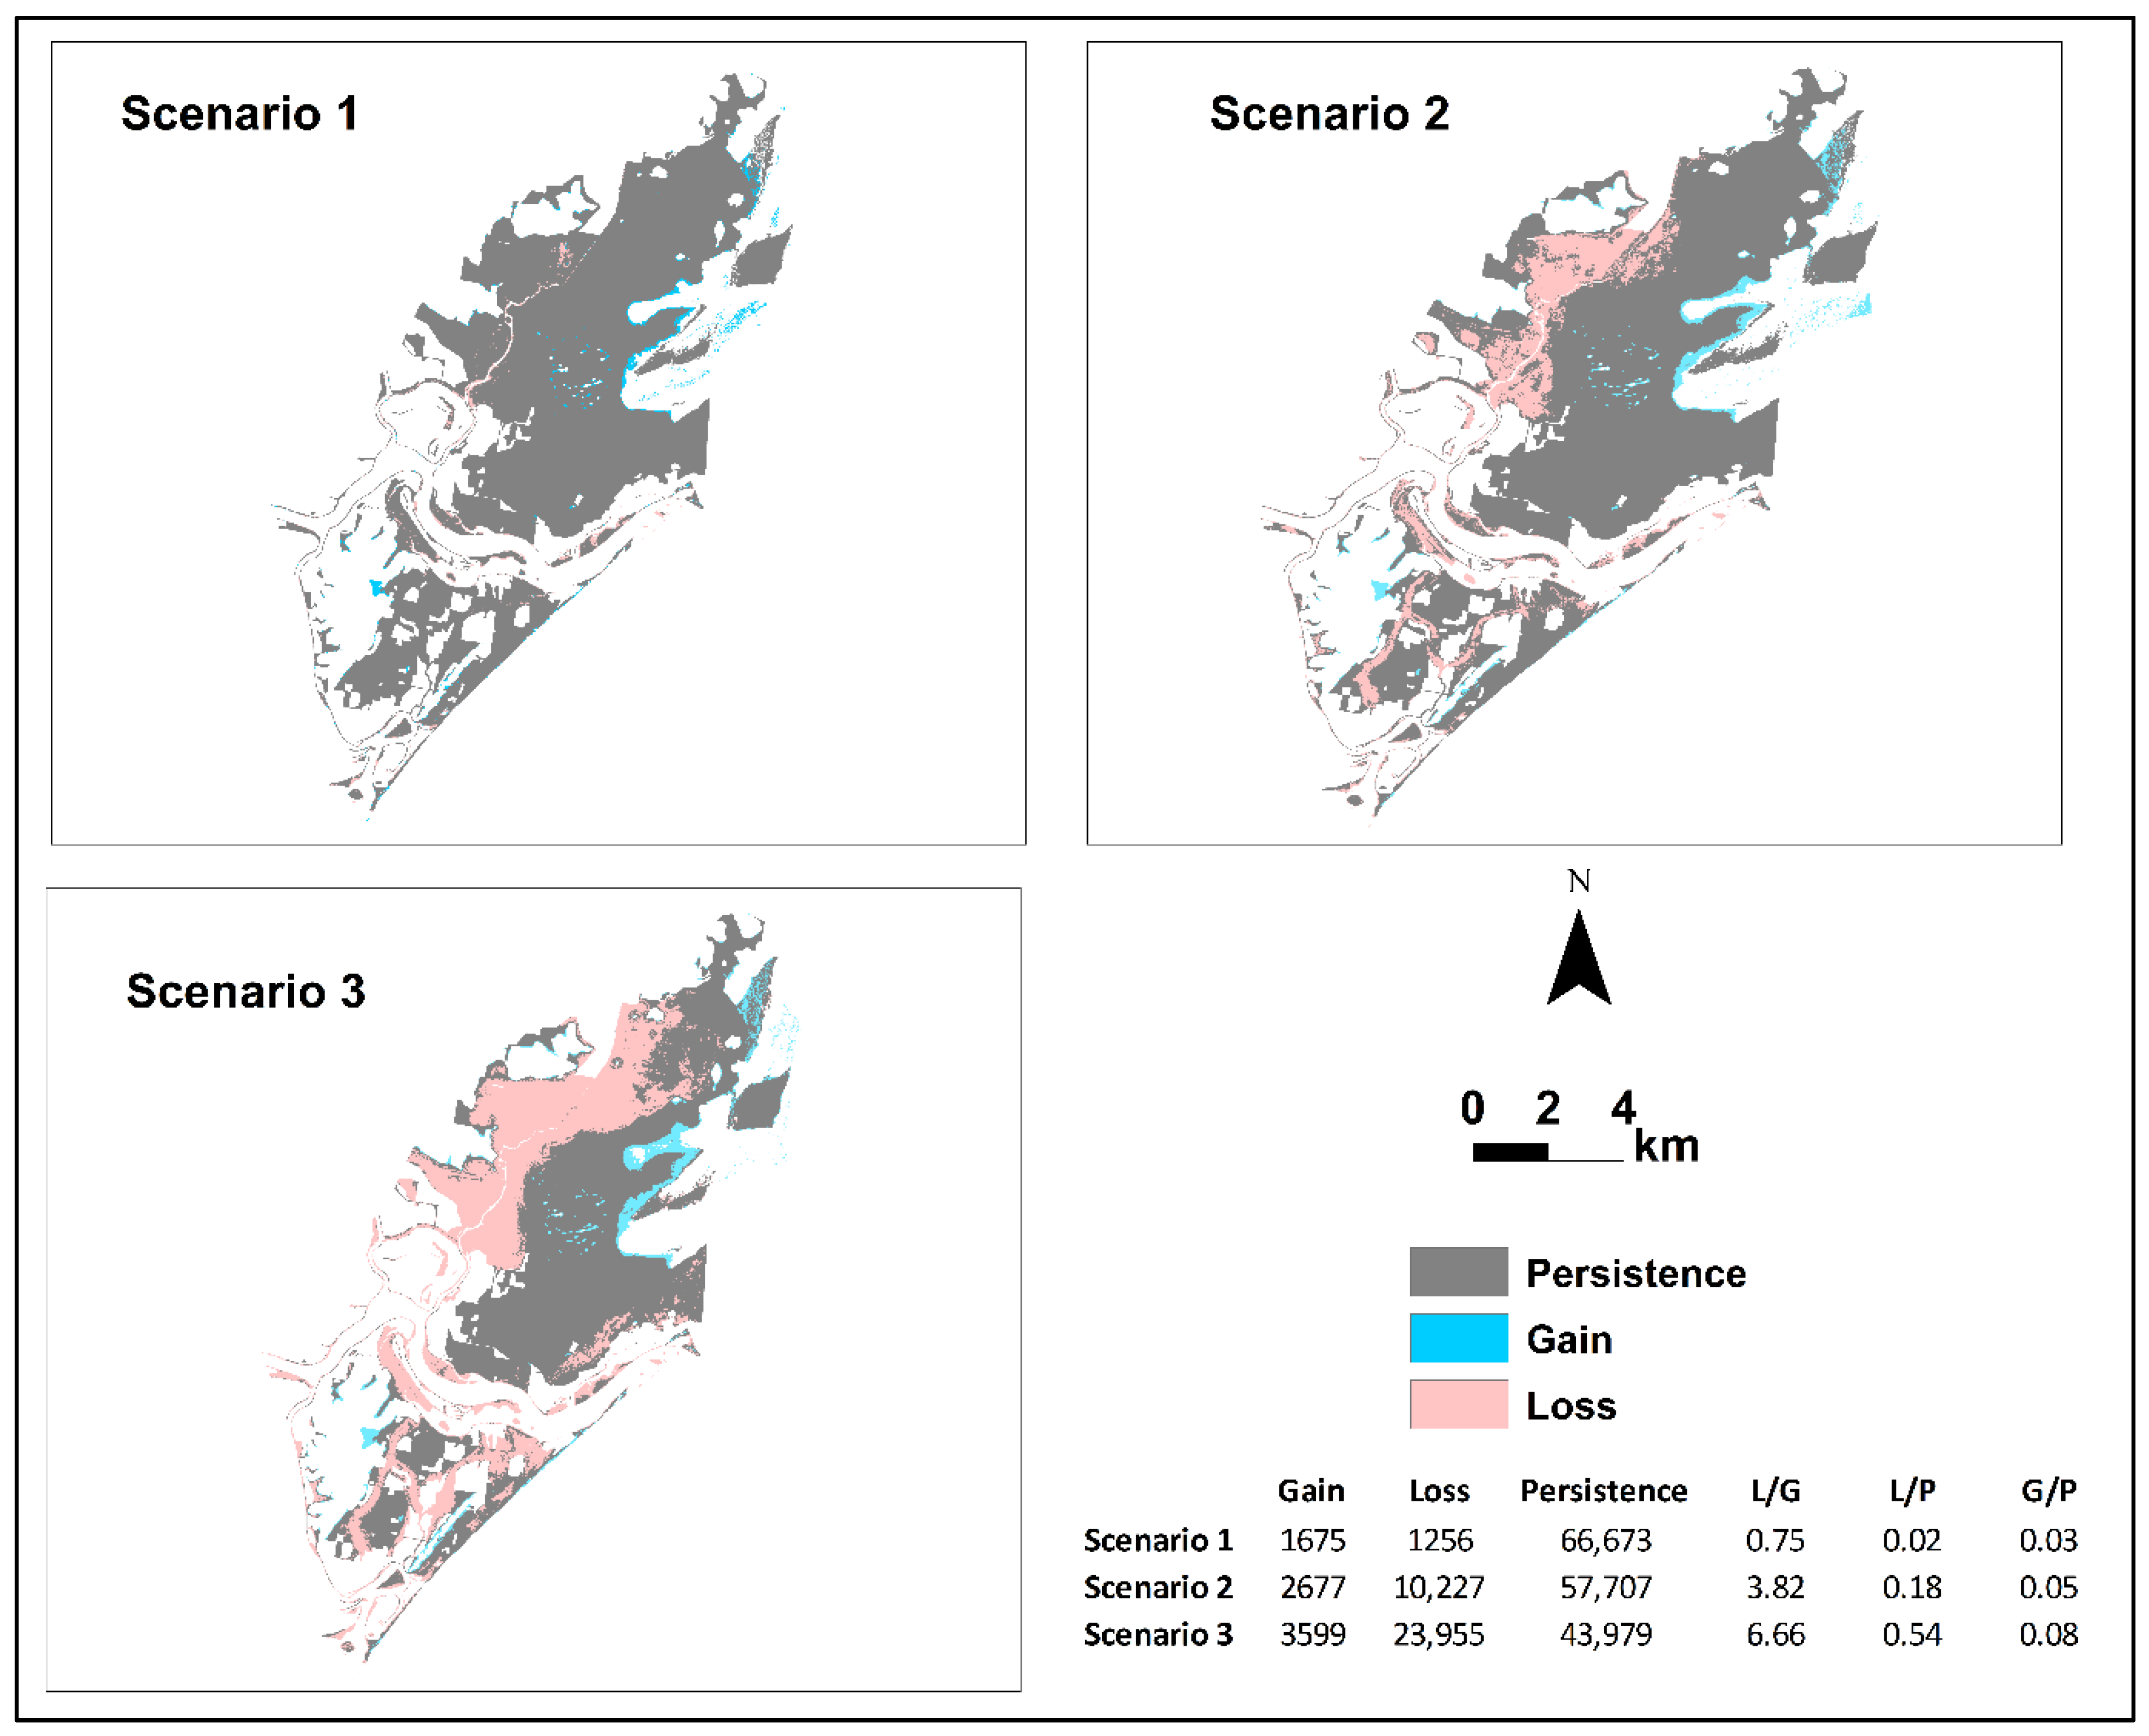
Figure 5.
A plot showing the sources of difference (i.e., gain, loss, and persistence) between the predicted present-day and future wetland distribution maps under SLR scenario 1 (left), scenario 2 (middle), and scenario 3 (right), for each wetland category. The change percentages associated with each class are the proportions of the total area shown in Figure 3.

Table 1.
A confusion matrix for test points of the Manning wetland classification model together with model performance metrics.
Table 1.
A confusion matrix for test points of the Manning wetland classification model together with model performance metrics.
| Observed | ||||||||||
|---|---|---|---|---|---|---|---|---|---|---|
| Forest | Mangrove | Marsh | Saltmarsh/Swamp | Terrestrial | Water | Total | PA (%) | UA (%) | ||
| Modeled | Forest | 34,754 | 0 | 1315 | 0 | 141 | 0 | 36,210 | 96.1 | 86.3 |
| Mangrove | 0 | 5435 | 0 | 2459 | 0 | 624 | 8518 | 63.9 | 91.1 | |
| Marsh | 5297 | 0 | 9848 | 0 | 1029 | 0 | 16,174 | 61.1 | 87.9 | |
| Saltmarsh/Swamp | 10 | 455 | 0 | 18,484 | 0 | 0 | 18,949 | 97.5 | 88.3 | |
| Terrestrial | 254 | 0 | 82 | 0 | 45,851 | 0 | 46,187 | 99.2 | 97.5 | |
| Water | 0 | 80 | 0 | 0 | 0 | 28,901 | 28,981 | 99.8 | 97.9 | |
| Total | 40,315 | 5970 | 11,245 | 20,943 | 47,021 | 29,525 | ||||
| Kappa | 0.90 | |||||||||
| OA (%) | 92.4 | |||||||||
S/Swamp = Saltmarsh/Swamp; OA = overall accuracy; PA = producer accuracy; and UA = user accuracy.
Table 2.
The land-cover transitions for the focused study area in the Manning River Estuary under three sea level rise scenarios (SLR scenarios 1, 2, and 3 correspond to 0.5 m, 1.0 m, and 1.5 m SLR, respectively). The change percentages associated with each class are proportions of the total area shown in Figure 3.
| Wetland Type | Gain | Persistent | Loss | NC | SC | TC | G/P | L/P | L/G | |
|---|---|---|---|---|---|---|---|---|---|---|
| Scenario 1 | Forest | 5.94 | 31.16 | 12.85 | −6.91 | 11.87 | 18.78 | 0.19 | 0.41 | 2.16 |
| Mangrove | 15.00 | 3.59 | 1.25 | 13.75 | 2.49 | 16.25 | 4.18 | 0.35 | 0.08 | |
| Marsh | 1.49 | 1.59 | 6.98 | −5.50 | 2.98 | 8.47 | 0.93 | 4.38 | 4.69 | |
| Saltmarsh/Swamp | 6.62 | 0.36 | 9.90 | −3.28 | 13.24 | 16.52 | 18.55 | 27.74 | 1.50 | |
| Terrestrial | 2.28 | 19.40 | 1.60 | 0.68 | 3.19 | 3.88 | 0.12 | 0.08 | 0.70 | |
| Water | 1.25 | 11.33 | 0 | 1.25 | 0 | 1.25 | 0.11 | 0 | 0 | |
| Scenario 2 | Forest | 6.73 | 22.03 | 21.97 | −15.24 | 13.47 | 28.71 | 0.31 | 1.00 | 3.26 |
| Mangrove | 18.29 | 1.49 | 3.34 | 14.95 | 6.68 | 21.63 | 12.23 | 2.24 | 0.18 | |
| Marsh | 2.11 | 1.16 | 7.42 | −5.31 | 4.22 | 9.53 | 1.82 | 6.39 | 3.52 | |
| Saltmarsh/Swamp | 7.09 | 0 | 10.25 | −3.17 | 14.18 | 17.34 | 1.45 | |||
| Terrestrial | 1.25 | 18.33 | 2.67 | −1.42 | 2.49 | 3.91 | 0.07 | 0.15 | 2.14 | |
| Water | 10.19 | 11.33 | 0 | 10.19 | 0 | 10.19 | 0.90 | 0 | 0 | |
| Scenario 3 | Forest | 9.16 | 17.44 | 26.57 | −17.41 | 18.32 | 35.73 | 0.53 | 1.52 | 2.90 |
| Mangrove | 16.61 | 0.06 | 4.78 | 11.83 | 9.56 | 21.39 | 290.2 | 83.50 | 0.29 | |
| Marsh | 0.82 | 0.50 | 8.07 | −7.25 | 1.64 | 8.90 | 1.63 | 16.02 | 9.82 | |
| Saltmarsh/Swamp | 2.80 | 0 | 10.25 | −7.45 | 5.61 | 13.06 | 3.66 | |||
| Terrestrial | 0.10 | 17.41 | 3.59 | −3.48 | 0.21 | 3.69 | 0.01 | 0.21 | 34.80 | |
| Water | 23.76 | 11.33 | 0 | 23.76 | 0 | 23.76 | 2.10 | 0 | 0 |
TC = total change; NC = net change; SC = swap change; L/P = loss/persistence; G/P = gain/persistence; and L/G = loss/gain.
Publisher’s Note: MDPI stays neutral with regard to jurisdictional claims in published maps and institutional affiliations. |
© 2022 by the authors. Licensee MDPI, Basel, Switzerland. This article is an open access article distributed under the terms and conditions of the Creative Commons Attribution (CC BY) license (https://creativecommons.org/licenses/by/4.0/).
Share and Cite
MDPI and ACS Style
Wen, L.; Hughes, M.G. Coastal Wetland Responses to Sea Level Rise: The Losers and Winners Based on Hydro-Geomorphological Settings. Remote Sens. 2022, 14, 1888. https://doi.org/10.3390/rs14081888
AMA Style
Wen L, Hughes MG. Coastal Wetland Responses to Sea Level Rise: The Losers and Winners Based on Hydro-Geomorphological Settings. Remote Sensing. 2022; 14(8):1888. https://doi.org/10.3390/rs14081888
Chicago/Turabian StyleWen, Li, and Michael G. Hughes. 2022. "Coastal Wetland Responses to Sea Level Rise: The Losers and Winners Based on Hydro-Geomorphological Settings" Remote Sensing 14, no. 8: 1888. https://doi.org/10.3390/rs14081888
Note that from the first issue of 2016, this journal uses article numbers instead of page numbers. See further details here.