
A CFAR Algorithm Based on Monte Carlo Method for Millimeter-Wave Radar Road Traffic Target Detection


School of Aerospace Science and Technology, Xidian University, Xi’an 710071, China
*
Author to whom correspondence should be addressed.
Remote Sens. 2022, 14(8), 1779; https://doi.org/10.3390/rs14081779
Submission received: 19 February 2022
/
Revised: 4 April 2022
/
Accepted: 5 April 2022
/
Published: 7 April 2022
(This article belongs to the Special Issue Radar Remote Sensing for Applications in Intelligent Transportation)
Abstract
:The development of Intelligent Transportation Systems (ITS) puts forward higher requirements for millimeter-wave radar surveillance in the traffic environment, such as lower time delay, higher sensitivity, and better multi-target detection capability. The Constant False Alarm Rate (CFAR) detector plays a vital role in the adaptive target detection of the radar. Still, traditional CFAR detection algorithms use a sliding window to find the target limit radar detection speed and efficiency. In such cases, we propose and discuss a CFAR detection method, which transforms the Monte Carlo simulation principle into randomly sampling instantaneous Range–Doppler Matrix (RDM) data, to improve the detection ability of radar for moving targets such as pedestrians and vehicles in the traffic environment. Compared with conventional methods, simulation and real experiments show that the method breaks through the reference window limitation and has higher detection sensitivity, higher detection accuracy, and lower detection delay. We hope to promote the detection application of millimeter-wave radar in road traffic scenes.
1. Introduction
Using millimeter-wave radar as a monitoring system has recently raised increased in various fields attributed to its high detection accuracy and weather resistance. In road traffic applications, accurate acquisition of moving target information such as pedestrians and vehicles on the road is one of traffic radar’s most basic and essential tasks. However, with the development of intelligent transportation systems, the timely reflection of road conditions and realization of traffic accident warnings become necessary, which puts higher requirements on the low processing delay of radar systems. Therefore, we start from the radar target detection method to reduce the system processing delay and improve the system’s real-time while ensuring high monitoring performance.
Generally, a number of approaches have been proposed to improve radar performance in traffic scenes, which can be mainly classified into two categories: (1) Around the signal processing direction, reduce or eliminate the interference signal as much as possible to ensure the purity of the target signal. (2) Design better detectors.
In the field of suppressing interference signals, cutting the interference-contaminated samples out of the signal is the most direct interference suppression method. Still, it also suppresses part of the valid signal of targets, resulting in less accurate reconstruction of the cutout samples of useful signals. To alleviate this effect, an iterative matrix-pencil (MP) method-based extrapolation for interference mitigation is proposed [1], but the accuracy of the reconstructed signal will decrease with the increase of the proportion of the contaminated samples. To improve signal reconstruction accuracy, an approach based on the sparse and low-rank decomposition of the Hankel matrix is proposed [2], however, iteration and best quality selection increase the complexity of the algorithm. For dealing with inter-radar interference, some new methods are proposed, such as designing a new orthogonal noise waveform [3] or presenting an interference mitigation technique in the tunable Q-factor wavelet transform (TQWT) domain [4]. In addition, some researchers have started from range and Doppler cell migration calibration to reduce signal distortion [5].
Designing better detectors is another direction to improve the application ability of radar. Compared with signal interference suppression, although the improvement of radar detection performance is weak, the design of the detector is more straightforward. In particular, in most cases, it will not add additional links and computational complexity, which is more suitable for low-cost radar systems with low-performance processors. So this paper studies from the perspective of detector design. In the actual application of radar, the target always appears before the complex and changeable noise background, which is subject to changes in time and location, so the fixed threshold detection method cannot effectively distinguish the target from the background noise [6]. Radar Constant False Alarm Rate(CFAR) detection, which adaptively sets the detection threshold by evaluating current clutter environments [7,8], is a crucial technology for separating targets and background. Thus, an appropriate CFAR detection algorithm can improve radar detection performance and provide accurate target information for radar data processing. It also emerged as a key research aspect in radar detection.
The earliest proposed CFAR detection algorithm is the Cell Average CFAR (CA-CFAR) [9], which is based on the average local noise power level to detect targets. Design a reference window, take the window’s center unit as the candidate target, and use the amplitude accumulation value of other units in the window as the estimated value of background noise power. Whether the target exists is determined by judging the power value of the candidate target and the estimated noise power value. The CA-CFAR has poor detection performance under non-uniform noise and multi-target environments since interference signals or other targets within the reference window lead to background noise estimation error. Aiming at the problem of CA-CFAR detection performance degradation under multi-target or non-uniform noise, the maximum selection detection (GO-CFAR) [10] and the minimum selection detection (SO-CFAR) [11] are proposed. The GO-CFAR can maintain good false alarm control performance in a clutter edge environment, but ”target masking” in a multi-target environment will appear. The SO-CFAR has a good multi-target resolution ability, but its false alarm control ability is weak. Ordered Statistical CFAR (OS-CFAR) [12] is another typical CFAR detection method derived from the median filter concept in digital image processing. It arranges the sample units in the reference window according to the power value and selects one of the sample power values as the decision threshold. Compared with the detection performance of CA-CFAR, OS-CFAR has strong robustness to multi-target detection, but it has a high resulting CFAR loss. Some new methods combining OS and CA are proposed. Take the trimmed-mean detector (TM-CFAR) [13] algorithm as an example. The sample points in the reference window are sorted by amplitude value like OS-CFAR. Then remove part of the sample points with the largest and smallest amplitudes. Finally, the remaining sample points are averaged as the estimated value of background noise.
Now, new CFAR detection algorithms have been proposed based on traditional methods for different application requirements. Some scholars are dedicated to studying the multi-target detection capabilities of the detector. For example, the OSCA-CFAR algorithm is proposed, which combines the CA-CFAR algorithm and the OS-CFAR algorithm, to improve the multi-target detection capability of millimeter-wave radars, and gives algorithm performance simulation under an ideal noise environment [14]. Some researchers focus on improving the detection performance of the detector in a complex cluster environment. A Comp-CFAR method is proposed according to the central limit theorem and the logarithmic compression principle of the signal for targets detection in the clutter with long smearing effect characteristics [15]. A CFAR detector based on zlog(z) is used to reduce the false alarm rate in Weibull clutter [16]. Some other scholars have proposed a new method combined with machine learning [17]. Train a feedforward artificial neural network (ANN) on the data set containing the input and output of the CFAR sliding window to improve the efficiency of CFAR detection. However, this way increases the complexity of the algorithm.
Table 1 briefly summarizes the CFAR detection algorithms mentioned above. All current CFAR algorithms achieve target detection by designing a reference window and processing the data in the window. The design of the reference window can effectively reduce the level of clutter interference, but there are two drawbacks. One is that sliding the window reduces the efficiency of detecting objects. Especially in Linear Frequency Modulated Continuous Wave (LFMCW) radar systems, the input to the CFAR detector is a two-dimensional Range–Doppler Matrix (RDM). Although the principle of the CFAR algorithm has not changed, the sliding of the reference window has changed from a one-dimensional sliding search to a two-dimensional sliding search, which dramatically reduces the real-time performance of radar target detection. The other drawback is that the window limits the sample points for background noise estimation. Theoretically, the more sample points are used, the more accurate the estimated noise power value and the higher the CFAR detection accuracy. The design and sliding of the reference window limit the efficiency of radar target detection.
Fortunately, compared with the complex background environment such as the sea surface, the background noise in the traffic road is relatively simple. Especially when radar monitors moving targets, the effect of background noise data on detection can be eliminated using the de-zeroing Doppler method. Combining the non-ideal target motion (vehicle turning, braking and lane changing), the irregularity of the target reflection area, and the independence of the frame data, we consider that the moving target echoes in the traffic road obey the ideal Swerling II model. Based on the above analysis, a reference window designed for complex noise and interference reduction may not be necessary for road traffic monitoring applications where the background noise is relatively clean. Instead, the sliding window increases the algorithm’s time complexity and reduces the efficiency of radar monitoring. To meet the requirement of low processing latency for traffic monitoring radar systems, we propose a CFAR algorithm based on the Monte Carlo to improve radar detection efficiency and sensitivity to moving targets in the traffic environment. Compared with the traditional algorithm, the algorithm has higher detection sensitivity and, more importantly, does not require the design and sliding of the reference window, which dramatically reduces the algorithm time complexity and improves the detection speed and efficiency. The contributions of this paper are summarized as follows: First, in the proposed CFAR detection algorithm, the entire RDM matrix area is randomly sampled to obtain the sample points of the background noise power estimation at the current moment. The principle is converting the Monte Carlo simulation principle, which gets properties of unknown quantities by independently repeating experiments, into a random sampling of the RDM matrix domain. This way breaks through the limitation of the reference window and can increase a large number of sample points for background noise estimation. Second, an interference point filtering method improves the accuracy of background noise estimation. Sort and filter the sample points according to the amplitude value of the sample points to remove possible target points or interference points. Then, the background noise estimated power value is obtained by the mean method. Finally, the target points in the RDM matrix are extracted by the background noise estimate. In addition, the parameter setting method of the algorithm is given, i.e., according to the current physical platform and application environment, algorithm parameter values are obtained through repeated statistics. The configuration parameter process only needs to be executed once when the radar system environment is unchanged. Compared with the conventional method, simulations and practical experiments show that the method has higher detection sensitivity, higher detection accuracy, and lower detection latency, which improve radar detection efficiency in traffic surveillance.
The structure of this paper is organized as follows: The Section 2 introduces the characteristics of traffic scenes, the principle of radar detection targets, and the characteristics of radar background noise in traffic scenes. Then, in Section 3, we give the principle and model of the new CFAR detection algorithm and give the process of obtaining relevant parameters. In Section 4, we analyze the performance of the new CFAR detection algorithm through simulation and real experiments. Finally, Section 5 summarizes the conclusions of this paper.
2. Traffic Scene Overview, Radar CFAR Detection Principle, and Background Noise Analysis
2.1. Traffic Scene Overview
Usually, traffic sensors are installed on both sides of the road or on a fixed bracket extending to the center of the road (as shown in Figure 1), and they are required to have the following essential functions:
- High detection sensitivity. All targets in the field of view can be completely detected, including partial occlusion of the target;
- Low information delay capability. It can reflect road conditions in real-time, i.e., the delay between data acquisition and road conditions output is required to be as short as possible (ideally, the delay should not exceed 100 ms);
- Weather resistance. The sensor shall minimize the impact caused by night, fog, and other weather.
Millimeter-wave radar is considered to have the potential to be used in urban traffic monitoring since not affected by the environment, has high range resolution, and has low application cost. The CFAR detector as a vital part of radar target extraction has been extensively studied. By studying the traditional CFAR algorithm and analyzing the characteristics of the traffic environment, we give a new CFAR detection algorithm to improve the sensitivity of radar to target detection, multi-target detection ability, and reduce delay. We hope it provides a unique reference for enhancing the adaptability of the radar in urban traffic monitoring.
2.2. Conventional Adaptive CFAR Detection Based on RDM
The FMCW millimeter-wave radar system is composed of an antenna array, a mixer, an Analog-to-Digital Converter (ADC), and digital signal processing [18]. The radar receives and processes target electromagnetic echo signals to acquire target information. The radar antenna receives the target echo information. It mixes echo information with the current transmitted signal in the mixer. The intermediate frequency signal from the mixer is converted into a digital signal by the ADC unit for signal processing. In the data processing system, the chirps signal group is processed by the Fast Fourier Transform (FFT) of the distance dimension and the velocity dimension in turn. Finally, a two-dimensional RDM containing the target position and velocity information is obtained by a single pulse linear detection [19]. The RDM data will be sent to the detection unit to achieve target extraction, usually for the constant false alarm detector. The radar signal processing flow is shown in Figure 2.
The radar target detector performs a test procedure on each cell inside the RDM to distinguish between the target signal and noise based on the threshold T, where the threshold T is composed of the threshold factor and the average noise power , i.e., . The average noise power measures the current radar noise floor, but it will change due to temperature changes or other physical effects. Therefore, the fixed noise power estimate value will cause the detector to produce false alarms. Let means there is no target in the signal, means there is a target in the signal, and Y represents a detection cell in the RDM. According to the Neyman-Pearson criterion, the false alarm probability is:
where represents probability density function, when target radar cross-sectional area is the Swerling II model, is the exponential distribution (square law detection), or Rayleigh distribution (linear detection).
The average noise power needs to be adaptively estimated to maintain a constant false alarm rate. So a CFAR detection technology based on variables in a two-dimensional RDM to estimate the average noise power adaptively is proposed. Here we introduce several typical CFAR algorithms.
Assume that the size of an RDM matrix is , and a reference window with a size of is designed, as shown in Figure 3. The blue cell represents the detection cell (), where m represents the position index of the detection cell X in the RDM matrix, and n represents the velocity index. The red area represents the reference window, and the CFAR detection algorithm evaluates the local average noise power based on the variables in the reference window.
In the two-dimensional CA-CFAR algorithm [20], the unknown local noise expectation value is estimated based on the average of all variables’ power in the two-dimensional reference window:
where represents the background noise estimate value of the CA-CFAR algorithm. Then the adaptive detection threshold can be obtained.
The two-dimensional OS-CFAR algorithm [21] also evaluates the local noise power through the variables in the reference window. Unlike the CA-CFAR, the OS-CFAR algorithm takes out all variables in the reference window and sorts them according to their magnitude:
The Kth value is selected as the average noise power. Then the adaptive detection threshold can be obtained.
The OSCA-CFAR [22] is a detection algorithm combining the CA-CFAR algorithm with the OS-CFAR algorithm. Firstly, it uses the one-dimensional OS-CFAR to sort each N Doppler unit according to the magnitude in the distance direction, as shown in Figure 4. Then, the Kth row is selected in the Doppler direction. Finally, a CA-CFAR procedure is applied to obtain the average noise power:
where represents the background noise estimate value of the OSCA-CFAR algorithm. Then the adaptive detection threshold can be obtained.
The amplitude of the detection cell is compared with the threshold T. If , the detection cell is considered the target. Otherwise, it is noise. Then, move the reference window and perform the detection on the new cell. The reference window performs two-dimensional sliding in the RDM matrix to realize the detection of all cells. In addition, designing appropriate reference windows according to different scenarios can reduce interference and improve detection accuracy. Some typical reference windows are shown in Figure 5.
Theoretically, the more sample points used to estimate the background noise power, the more accurate the background noise estimation will be. The design and application of the reference window prevent the introduction of interference points which is beneficial for complex environments. However, it limits the optional number of background noise sample points and increases the retrieval process. When the target and the background environment are easily separated, or the background environment is relatively simple in some scenes, applying the reference window is not necessary.
2.3. Radar Background Noise Analysis in Traffic Scenea
To analyze the background noise characteristics of traffic roads, we collect data through a self-designed millimeter-wave radar system whose parameters are shown in Table 2. The radar chip (CAL77S244) based Radio Frequency(RF) front-end with three transmitting and four receiving antennas is used to transmit millimeter-wave and receive target echo signals. Additionally, a four-channel high-speed ADC is used for data acquisition. Finally, digital processing algorithms and extraction of target information are implemented on a back-end baseband processing system based on FPGA and ARM architecture. The data acquisition scene and radar system are shown in Figure 6.
Figure 7 illustrates background noise data collection and display. Figure 7a is a flow chart of constant false alarm detection data acquisition. In this radar system, four receiving channels receive the radar’s electromagnetic echoes in the background environment and obtain the RDM matrix through incoherent accumulation. Figure 7b shows the distribution of the power amplitude of the RDM under the condition with no moving targets. The power amplitude value is abrupt and uneven in the zero-Doppler region (stationary objects region), which is caused by a combination of factors such as the number of objects at different distances and the size of the object’s reflection area. Preliminary observation shows that the noise power is distributed evenly in the non-zero Doppler domain (moving targets region), and there is no apparent abrupt change. In addition, the power of stationary objects does not significantly extend to the area where the moving targets are located.
We use distance dimension and velocity dimension data variance, an effective method to measure the degree of data dispersion, to evaluate the distribution of noise power amplitudes in the moving target area in the RDM matrix. We count the variance of each row (velocity dimension) or column (distance dimension) of the dataset in RDM as shown in Figure 8 (average of multiple statistics). It is worth noting that before calculating the variance, taking the average speed of pedestrians as a reference (0.5 m/s), we eliminated the cells where the static object is located in the RDM matrix, i.e., cells with speed below 0.5 m/s. Both the variance of the velocity dimension and the variance of the distance dimension are less than 0.018. We can think that the background noise power amplitude is relatively uniform in the non-zero Doppler domain.
The power density distribution is given as another characteristic of background noise. Previously, we assumed that the radar noise distribution satisfies the Rayleigh distribution:
where is the Rayleigh distribution parameter. The non-zero Doppler cells in RDM are sampled and processed by MATLAB Distribution Fitter Toolbox, and then the distribution of data (purple) and the fitting curve of Rayleigh distribution (red) are shown in Figure 9a. Figure 9b shows the matching degree between data probability distribution and Rayleigh distribution, i.e., the closer the data is to a curve line, the more consistent it is with Rayleigh distribution.
Through the analysis, we can get the following two conclusions:
- In the static target region of the RDM matrix, the variation amplitude of noise power fluctuates greatly. However, in the moving target area of the RDM matrix, the amplitude distribution of background noise power is uniform, the dispersion is small, and there is no edge effect;
- In the moving target area in the RDM matrix, the noise amplitude of each unit is independent of each other and meets the probability density distribution (Rayleigh distribution) with similar parameters.
In this scenario, we propose a Monte Carlo-based CFAR detection algorithm to improve radar monitoring efficiency by processing the entire RDM area instead of local reference window data and window sliding.
3. A CFAR Algorithm Based on Monte Carlo Sampling
3.1. Expectation Calculation Principle Based on Monte Carlo Sampling
Assuming that n samples are drawn from a population with a total number of N elements without replacement, each sample has the same probability of being sampled each time. This sampling method is called random sampling, and the sample drawn is called random sample. When each sampling process is independent of the other, the process is called Monte Carlo sampling. Monte Carlo sampling can be used to obtain the expectation of random variables.
For example, we can use Monte Carlo sampling to find the expectation of function [23]. Let X denote a random variable and the probability distribution . To calculate the expectation of , we only need to continuously sample from :
where N represents the number of sample points, represents the value of the ith sample point. When the sample N is large enough, the mean A is equivalent to the expectation of , i.e., . Further, we know that the Monte Carlo sampling principle obtains the statistical characteristics of parameters through many random independent experiments and uses the statistical value to replace the real result [24]. In addition, in probability theory and statistics, the expectation is related to probability distribution parameters that reflect the sample population amplitude characteristics. Therefore, obtaining unknown quantities by Monte Carlo sampling provides a new idea for calculating the average noise power in the RDM matrix.
Through the previous analysis, we approximately believe that the noise power of each detection cell in the RDM dataset follows the same probability distribution (Rayleigh distribution) with roughly the same parameters, which is also the premise of using the Monte Carlo principle. However, unlike the Monte Carlo sampling principle, we transform the independent random sampling in the time dimension into the random sampling on the RDM dataset at the current moment. For each detection unit in the RDM matrix as a random variable X, the unknown average noise power is considered the expected value of the function . The detection unit in the RDM matrix performs random sampling to obtain the estimated value of the background noise power in the moving target area at the current moment. We name this method MC-CFAR.
3.2. MC-CFAR Algorithm Model
A complete MC-CFAR processing model mainly includes background noise sample extraction part, interference point removal part, average noise estimation part, and threshold output part (as shown in Figure 10). Moreover, the processing flow of using the MC-CFAR algorithm to detect moving targets is as follows:
Step 1: Background noise sample point extraction. In the MC-CFAR algorithm, all detection units in the RDM matrix are regarded as the total sample size. Additionally, each detection cell is viewed as an individual sample to be sampled. Considering the RDM matrix as a two-dimensional coordinate system, once the scale of the RDM matrix is determined (), the coordinates of all detection units are also determined. Any cell can be represented as , where r represents the distance index, ; d represents the speed index, . Samples are drawn from the population without repetition according to specific rules, and this process is systematic random sampling. Then, M background noise sample points are obtained.
Step 2: Interference point removal. The sample points obtained in step 1 cannot be directly used to evaluate the background noise power value because the target points or abnormal points may be extracted, which will cause the background noise estimation error. Similar to the data processing method in the TM-CFAR algorithm, the sample points are first sorted according to the power amplitude:
Then, k maximum points and q minimum points are removed, and it is considered that the remaining sample points only contain background noise power points.
Step 3: Noise average power estimation. Average the remaining sample points, and the average value will be used as the estimated value of the current background average noise power in the RDM matrix.
Step 4: Threshold output. The threshold factor is multiplied by the average noise power estimate to get the decision threshold T:
Step 5: Target detection. Each detection cell in the RDM matrix is sequentially compared with the threshold value T. If , the target exists, otherwise, the target does not exist.
3.3. MC-CFAR Algorithm Parameter Settings
3.3.1. Random Sampling Strategy
The interference point removal link can eliminate the interference caused by abnormal points or target points to a certain extent, but it cannot completely eliminate it. A good sampling strategy can reduce the probability of the existence of interference points, reduce the burden of interference point removal, and make the estimated value of background noise more accurate.
Figure 11 shows three simple sampling strategies. When the radar monitors the slow-moving road section (urban intersections), sampling points distribution can be consciously expanded to the high-speed area (the left side of Figure 11). Similarly, when the radar monitors the high-moving road section(highway) or variable-speed road section (Mixed vehicles and pedestrians), the sampling strategy in the middle or the right side of Figure 11 can be selected, respectively.
3.3.2. Sampling Points Number M and Threshold Factor
The number of sampling points M and the threshold factor are two essential parameters in the MC-CFAR algorithm, which need to be determined before the algorithm is executed. In the MC-CFAR algorithm, the higher the number of sample points, the closer the background noise estimate is to the actual value, and the size of the threshold factor also affects the probability of the target being detected, both of which will affect the false alarm probability () of the detector. Thus we determine the values of M and according to different requirements.
Different from traditional CFAR algorithms, it isn’t easy to give a definite curve formula between parameters and in the MC-CFAR algorithm. So, we use Monte Carlo experiments to obtain approximate relationships, i.e., get the probability of false alarms under different parameters through independently repeated experiments. Figure 12 shows the relationship between the MC-CFAR algorithm parameters and . Moreover, the following conditions have been used for the simulation: RDM size is with Rayleigh distribution noise; ; Monte Carlo experiments number is for each group parameters.
In Figure 12, when the number of sample points is small, the number of sample points is the main factor. Under the same threshold factor, the less the number of sample points, the higher the false alarm rate of the algorithm. With the increase of sample points, the false alarm rate decreases. When the number of sample points reaches a certain order of magnitude, the impact of the rise of sample points on the false alarm rate becomes smaller, and the threshold factor becomes the main factor. Then, determine MC-CFAR algorithm parameters according to different constant false alarm probabilities.
Considering the difference between the simulation experiment and the actual application, in actual application, before the radar detects the road vehicle, the Monte Carlo experiment is performed on the road environment to obtain the best MC-CFAR algorithm parameters under the radar platform. When the detection environment and platform remain unchanged, this step only needs to be performed once.
4. Numerical Simulations and Real Experiments
This chapter presents the simulation test and actual experimental results of the algorithm. Furthermore, a comparison with the conventional CFAR algorithm is carried out in the same test environment.
4.1. Performance Simulation of MC-CFAR
According to the characteristics of the traffic scene and the requirements for the monitoring system in the application of road vehicle monitoring, we choose the algorithm detection sensitivity, algorithm multi-target detection ability, and algorithm time complexity as the key research objects. The detection performance of the MC-CFAR algorithm is evaluated by simulation and compared with the conventional algorithms (e.g., CA-CFAR, OS-CFAR, OSCA-CFAR).
4.1.1. Algorithm Detection Sensitivity
The detection sensitivity of the radar constant false alarm algorithm reflects the radar’s ability to detect weak signals. The higher the detection sensitivity, the stronger the radar’s ability to detect weak signals. The relationship between the detection probability of the algorithm and the Signal-to-Noise Ratio (SNR) of the target echo is used to measure the detection sensitivity of the constant false alarm detection algorithm.
We use the radar system to obtain a large amount of snapshot data of traffic scenes (the radar system and traffic scene are shown in Figure 6), and these snapshot data do not contain any moving targets. The background noise data of the moving target area is obtained by summing, averaging, and de-zeroing Doppler, which will be used for simulation. Randomly insert target points with different SNR into the background noise data, and then evaluate the detection sensitivity of the algorithm by counting the number of successful detections of the algorithm. For fairness, the of all algorithms is unified to . The number of repetitions for each SNR experiment is .
Figure 13 shows the detection probability of different algorithms for different SNR signals. In the overall trend of change, the algorithm detection probability has the same changing trend: as the target SNR increases, the detection target probability increases. In the low SNR part, the detection probability of the algorithm is generally low. Still, the detection probability of MC-CFAR is the highest, and the detection probability of MC-CFAR rises the fastest. Moreover, as the signal SNR increases, the gap between detection probabilities keeps increasing. With the further improvement of SNR, the detection probability gap between the algorithms approaches gradually. When the target SNR reaches a particular strength, the detection probability of all algorithms reaches 100%. The MC-CFAR algorithm has the highest detection sensitivity through simulation analysis compared with other detection algorithms, primarily due to the more accurate background noise estimation and the ability to obtain more sample points. Under the same false alarm rate, MC-CFAR can detect weak SNR targets.
4.1.2. Multi-target Detection Performance
The masking effect means that the distance between the targets is so close that the detection algorithm cannot detect all the targets simultaneously, making the radar detection have a high false dismissal probability in a multi-target environment.
In the simulation experiment of the multi-target detection ability of the algorithm, the SNR of each target should be as high as possible to eliminate the missed detection of the algorithm caused by low SNR. In the clutter background with a length of 200, four targets are added at 46, 48, 50, and 52 with two as the distance difference between targets; Taking 20 as the distance between the targets, add targets at 90 and 110, respectively; finally, add independent targets at 145. Under the same false alarm rate , the decision threshold of each algorithm at different positions can be obtained, as shown in the blue waveform in Figure 14.
The purpose of detecting the independent point 145 is to eliminate the interference of the target SNR on the algorithm multi-target detection performance judgment. When the distance between targets keeps shrinking, the target masking effect of CA-CFAR gradually manifests, and for targets at points 46, 48, 50, and 52, only points 46 and 52 can be detected. However, the MC-CFAR, the OS-CFAR, and the OSCA-CFAR algorithms still accurately detect four targets. In 1D distance dimension detection, the OSCA-CFAR algorithm is the same as the OS-CFAR algorithm due to the absence of the Doppler dimension, which does not affect the determination of multi-target detection capability. Through simulation analysis, the MC-CFAR has good multi-target detection capabilities.
4.1.3. Algorithm Time Complexity
The quality of an algorithm is often measured by two aspects Two aspects often measure the quality of an algorithm: on the one hand, each input of the algorithm can output the correct result and stop; on the other hand, the efficiency of the algorithm is considered, including the time complexity [25] and space complexity of the algorithm. Suppose the size of the RDM domain is ; For the convenience of calculation, the number of sampling points in the MC-CFAR algorithm is set to , where L is an integer greater than 1. For the conventional CFAR algorithm, set the size of the sliding window to , where n is an integer greater than 1. The time complexity of the algorithm is shown in Formula (9).
To show the low time complexity of the MC-CFRA algorithm, we set in the simulation, i.e., extract half of the points of the RDM matrix. The selection of sampling points in real-time applications is much smaller than this value (refer to Figure 11). The reference window length (n) of the conventional CFAR algorithm takes a range of 12 to 18, here we let . The time complexity of each algorithm versus the size of the RDM matrix as shown in Figure 15. The time complexity of the OS-CFAR algorithm increases sharply with the increase of the area of the RDM detection matrix. When the number of detection units is small, the time complexity difference among MC-CFAR, CA-CFRA, and OSCA-CFAR algorithms is not apparent. However, with the increase of detection matrix area, the low time complexity of the MC-CFAR algorithm becomes more and more prominent. Compared with other algorithms, the MC-CFAR algorithm has the lowest time complexity, which reduces the time delay of the radar in traffic surveillance.
In this chapter, the performance of the MC-CFAR algorithm is simulated and analyzed from three aspects of algorithm sensitivity, multi-target detection performance, and algorithm complexity. Additionally, compared with CA-CFAR, OS-CFAR, and OSCA-CFAR algorithms, it can better meet the needs of radar applications in traffic scenarios.
4.2. Real Experiments
In this chapter, we port the algorithm to the radar system platform and show the application effect of the algorithm in real traffic scenarios.
4.2.1. Define an Evaluation Method and Add a New Scenario
To better describe the algorithm’s performance and evaluate the advantages and disadvantages between the algorithms, we have defined an evaluation method that is easy to statistics and operates before testing. Figure 16 shows the detection process of the CFAR detector. An RDM matrix containing two targets is sent to the CFAR detector. The coordinates (x, y, z) of the two targets are (−1.4928, 48.3398, 6.9442) and (−2.7369, 40.4297, 16.5703) respectively, where x is the target speed, y is the target distance, and z is the target power, as shown in Figure 16a. After passing through the CFAR detector (If the detection cell is the target, it is marked as 1. Otherwise, it is marked as 0), as shown in Figure 16b, the detection results are presented in two target area blocks, and there are errors between the coordinates of some points and the real target points. For example, the distance and speed of the detection points are (−1.4928, 48.3398) and (−2.2393, 39.5508), respectively. The reason for this phenomenon is that in the actual radar detection process, the energy of the target will expand to adjacent cells since the target is not an ideal pulse, which makes the detection result of the constant false alarm detector appear blocky instead of dotted.
Therefore, the 8-domain connectivity method is used for point aggregation to count the number of targets detected by the detector. Moreover, at the same time, allow the actual target coordinate value and the detection result coordinate value to have an error within , where is the range resolution or the radar speed resolution. Given the above description, when analyzing the detection results of each frame, this paper defines the data frame with the target number of the detection result consistent with the real number and the coordinate error within the range as a “good frame”. Additionally, in the experiment, the probability of a “good frame” is used as an index to evaluate algorithm detection performance.
In addition, we add a new scenario (see Figure 17) for testing only pedestrian detection because pedestrian trajectories are random and difficult to control. The results are used to supplement and contrast the road vehicle detection experiments.
4.2.2. Algorithm Testing at an “Ideal Distance”
We first conduct multi-object detection experiments for each algorithm at ideal distances. Due to the difference between simulation and actual measurement, the algorithm detection performance with the same configuration parameters will fluctuate due to changes in radar system platforms or application scenarios. In order to have a fair comparison of all the methods, we need to modify the configuration parameters of each algorithm to achieve the best detection performance in the current scene and radar system. We choose the median of the maximum distances the radar platform can detect as the “ideal distance” to adjust the algorithm parameters. This scenario can minimize external factors, especially the target SNR. The radar platform parameters are shown in Table 2, and the maximum detection range of the radar system to pedestrians is 90–100 m, and the maximum detection range of the radar platform to vehicles is 180–200 m. The median detection distance is selected as the best detection distance of the radar platform for experiments. i.e., 40–50 m is considered the “ideal detection environment” for pedestrian detection, and 90–100 m is regarded as the “ideal distance” for vehicle detection.
Different algorithms are tested in the “ideal detection environment”, and the detection performance of the algorithms is evaluated by “good frame” rate. Each algorithm is tested on the radar platform, and the “good frame” rate of the algorithm under different parameter configurations is shown in Figure 18. For CA-CFAR, OS-CFAR, and OSCA-CFAR, the detection effect is mainly affected by the reference window and threshold factor. Different threshold factors and reference window sizes yield different “good frame” rates, and with this parameter configuration, the higher the good frame rate, the better the radar detection performance, as shown in Figure 18a–c. Figure 18d shows the relationship between the MC-CFAR good frame rate and the number of sampling points, and the threshold factor. For MC-CFAR, when the number of sampling points reaches a certain number, the detection performance of the algorithm is mainly affected by the threshold factor.
After many experiments and statistics, the optimal parameter configuration and detection effect of different algorithms on this radar platform can be obtained, as shown in Table 3. The MC-CFAR has the best detection performance at “ideal distances” through experiments.
4.2.3. Algorithm Detection Probability at Different Distances
This section explores how the algorithm detects objects at different distances. For fairness, we configure the optimal parameters for each detection algorithm, which are the configuration parameters when the “good frame” rate is the highest in “ideal distance” detection. The parameter selection is shown in Table 4.
In the same environment, algorithm detection experiments are carried out at different distances. The experimental results are shown in Figure 19.
Figure 19 shows the trend of the “good frame” rate of different algorithms at different distances. Figure 19a shows the detection result of the algorithm on pedestrians. When the target is close, the OS-CFAR algorithm has the best detection performance, and the MC-CFAR detection algorithm has the worst effect. However, as the distance increases, the detection performance of the MC-CFAR algorithm gradually exceeds other algorithms and becomes the best. When the distance increases, the detection performance of all algorithms begins to decline, but MC-CFAR still maintains the best detection effect. Figure 19b shows the detection results of different algorithms on the vehicle at different distances. Consistent with the former phenomenon: when the target is close to the radar, the detection effect of MC-CFAR is poor. As the distance increases, the detection effect of MC-CFAR gradually rises and becomes the best among the algorithms.
Through the analysis of close-range target data, we preliminarily give the reasons for the decline in detection accuracy of the MC-CFAR algorithm. On the one hand, with the decrease in the distance between the target and the radar, the power of the target echo becomes stronger, which leads to a larger diffusion range of the sidelobe energy around. On the other hand, when the target is in close range, the shape of the target can not be ignored, that is, the target changes from point target to block target in the detector. Due to the different reflected energy intensity in different areas, the probability of isolated clutter points around the target will be increased. Compared with vehicles, pedestrians have more irregular shapes and generate more clutter points. The power of these clutter points is higher than the background noise power and lower than the target main lobe energy, they are easier to be detected by MC-CFAR with the highest detection sensitivity. So the “good frame” rate of the MC-CFAR algorithm is reduced at a close distance, especially for pedestrian detection.
The experimental results show that compared with other CFAR algorithms, the MC-CFAR algorithm has higher detection sensitivity, especially for medium and long-range targets. However, the accuracy of the MC-CFAR algorithm in the detection of close-range targets is reduced, especially for the detection of irregular moving targets. Fortunately, although the false alarm rate has increased, the target information is not lost. In addition, it is worth noting that the MC-CFAR has the lowest algorithm complexity in the actual test process, as shown in Table 5.
In this chapter, the multi-target detection experiments of pedestrians and vehicles are carried out on the CFAR detection algorithm through the real radar platform. Compared with the traditional algorithm, the MC-CFAR algorithm has higher detection sensitivity and accuracy and better adapts to the traffic environment.
5. Conclusions
In this work, a CFAR algorithm based on the Monte Carlo principle is proposed for millimeter-wave radar moving targets detection in the road traffic environment. Numerical simulations and real experiments are also provided and analyzed. The algorithm has the following characteristics and advantages: (i) Random sampling of the entire RDM matrix area instead of conventional reference window design and sliding is the most significant feature of the MC-CFAR algorithm. (ii) In the road traffic environment, compared with the conventional CFAR algorithm, MC-CFAR has higher detection sensitivity because it can obtain more background noise sample points, which is attributed to the overall sampling of RDM. (iii) In particular, the MC-CFAR algorithm greatly reduces the time complexity of detection, which is of great help to improve the timeliness of radar traffic applications.
In future work, on the one hand, we study about algorithm performance improvement: (1) further analyze the reasons for the degradation of the algorithm in close-range target detection performance, reduce the false alarm rate of the algorithm close view detection, and improve the algorithm full section detection performance. (2) optimize the sample point extraction strategy and interference point suppression method to improve the algorithm robustness. On the other hand, extending the application area of the algorithm: due to the high sensitivity and low CFAR loss characteristics of the MC-CFAR algorithm, more target details can be retained when applied to target-background separation, which makes it possible to apply the algorithm to the field of radar imaging. We hope the work can provide a new idea for radar CFAR research.
Author Contributions
Conceptualization, B.Y. and H.Z.; investigation, H.Z.; writing—original draft preparation, B.Y. and H.Z.; writing—review and editing, B.Y. All authors have read and agreed to the published version of the manuscript.
Funding
This work was supported partially by the National Natural Science Foundation of China, Constellation cooperative autonomous navigation using time-varying astronomical signals in relativistic space-time (No. 61771371). And Civil aerospace technology advanced research project (No. D020403). The authors greatly appreciate the above financial support.
Data Availability Statement
Not applicable.
Conflicts of Interest
This manuscript has not been published or presented elsewhere in part or in its entirety, and is not under consideration by another journal. There are no conflict of interest to declare.
Abbreviations
The following abbreviations are used in this manuscript:
| ITS | Intelligent Transportation Systems |
| CFAR | Constant False Alarm Detection |
| RDM | Range–Doppler Matrix |
| ADC | Analog-to-Digital Converter |
| FFT | the Fast Fourier Transform |
| RF | Radio Frequency |
| SNR | Signal-to-Noise Ratio |
| False Alarm Probability | |
| Detection Probability | |
| CA-CFAR | Cell Average Constant False Alarm Detection |
| OS-CFAR | Ordered Statistical Constant False Alarm Detection |
| OSCA-CFAR | An algorithm to combine the CA-CFAR algorithm and the OS-CFAR algorithm |
| MC-CFAR | The algorithm proposed in this paper |
References
- Wang, J.; Ding, M.; Yarovoy, A. Matrix-Pencil Approach-Based Interference Mitigation for FMCW Radar Systems. IEEE Trans. Microw. Theory Tech. 2021, 69, 5099–5115. [Google Scholar] [CrossRef]
- Wang, J.; Ding, M.; Yarovoy, A. Interference Mitigation for FMCW Radar With Sparse and Low-Rank Hankel Matrix Decomposition. IEEE Trans. Signal Process. 2022, 70, 822–834. [Google Scholar] [CrossRef]
- Xu, Z.; Shi, Q. Interference Mitigation for Automotive Radar Using Orthogonal Noise Waveforms. IEEE Geosci. Remote Sens. Lett. 2018, 15, 137–141. [Google Scholar] [CrossRef]
- Xu, Z.; Yuan, M. An Interference Mitigation Technique for Automotive Millimeter Wave Radars in the Tunable Q-Factor Wavelet Transform Domain. IEEE Trans. Microw. Theory Tech. 2021, 69, 5270–5283. [Google Scholar] [CrossRef]
- Xu, Z.; Baker, C.J.; Pooni, S. Range and Doppler Cell Migration in Wideband Automotive Radar. IEEE Trans. Veh. Technol. 2019, 68, 5527–5536. [Google Scholar] [CrossRef]
- Moustafa, A.; Ahmed, F.M.; Moustafa, K.H.; Halwagy, Y. A new CFAR processor based on guard cells information. In Proceedings of the 2012 IEEE Radar Conference, Atlanta, GA, USA, 7–11 May 2012; pp. 133–137. [Google Scholar]
- Farina, A.; Studer, F.A. A review of CFAR detection techniques in radar systems. Microw. J. 1986, 29, 115. [Google Scholar]
- Gandhi, P.; Kassam, S. Analysis of CFAR processors in nonhomogeneous background. IEEE Trans. Aerosp. Electron. Syst. 1988, 24, 427–445. [Google Scholar] [CrossRef]
- Finn, H.M. Adaptive detection mode with threshold control as a function of spatially sampled-clutter-level estimates. RCA Rev. 1968, 29, 414–465. [Google Scholar]
- Trunk, G. Range Resolution of Targets Using Automatic Detectors. IEEE Trans. Aerosp. Electron. Syst. 1978, AES-14, 750–755. [Google Scholar] [CrossRef]
- Pace, P.; Taylor, L. False alarm analysis of the envelope detection GO-CFAR processor. IEEE Trans. Aerosp. Electron. Syst. 1994, 30, 848–864. [Google Scholar] [CrossRef]
- Rohling, H. Radar CFAR Thresholding in Clutter and Multiple Target Situations. IEEE Trans. Aerosp. Electron. Syst. 1983, AES-19, 608–621. [Google Scholar] [CrossRef]
- Blake, S. OS-CFAR theory for multiple targets and nonuniform clutter. IEEE Trans. Aerosp. Electron. Syst. 1988, 24, 785–790. [Google Scholar] [CrossRef]
- Yan, J.; Li, X.; Shao, Z. Intelligent and fast two-dimensional CFAR procedure. In Proceedings of the 2015 IEEE International Conference on Communication Problem-Solving (ICCP), Guilin, China, 16–18 October 2015; pp. 461–463. [Google Scholar] [CrossRef]
- Liu, Y.; Zhang, S.; Suo, J.; Zhang, J.; Yao, T. Research on a New Comprehensive CFAR (Comp-CFAR) Processing Method. IEEE Access 2019, 7, 19401–19413. [Google Scholar] [CrossRef]
- Gouri, A.; Mezache, A.; Oudira, H. Radar CFAR detection in Weibull clutter based on zlog(z) estimator. Remote Sens. Lett. 2020, 11, 581–589. [Google Scholar] [CrossRef]
- Carretero, M.V.i.; Harmanny, R.I.A.; Trommel, R.P. Smart-CFAR, a machine learning approach to floating level detection in radar. In Proceedings of the 2019 16th European Radar Conference (EuRAD), Paris, France, 2–4 October 2019; pp. 161–164. [Google Scholar]
- Lin, J.J.; Li, Y.P.; Hsu, W.C.; Lee, T.S. Design of an FMCW radar baseband signal processing system for automotive application. Springerplus 2016, 5, 42. [Google Scholar] [CrossRef] [PubMed] [Green Version]
- Liao, H.E.; Lin, G.Y.; Sheu, M.H.; Siao, S.M.; Wan, S.S. A Computation Efficiency AND-CFAR for FMCW Radar Receiver. In Proceedings of the 2013 Ninth International Conference on Intelligent Informatio Hiding and Multimedia Signal Processing, Beijing, China, 16–18 October 2013; pp. 108–112. [Google Scholar] [CrossRef]
- Acosta, G.G.; Villar, S.A. Accumulated CA–CFAR Process in 2-D for Online Object Detection From Sidescan Sonar Data. IEEE J. Ocean. Eng. 2015, 40, 558–569. [Google Scholar] [CrossRef]
- Villar, S.A.; Acosta, G.G.; Solari, F.J. OS-CFAR process in 2-D for object segmentation from Sidescan Sonar data. In Proceedings of the 2015 XVI Workshop on Information Processing and Control (RPIC), Cordoba, Argentina, 6–9 October 2015; pp. 1–6. [Google Scholar] [CrossRef]
- Kronauge, M.; Rohling, H. Fast Two-Dimensional CFAR Procedure. IEEE Trans. Aerosp. Electron. Syst. 2013, 49, 1817–1823. [Google Scholar] [CrossRef]
- Ma, H.; Liu, Y. Research Based on the Monte-Carlo Method to Calculate the Definite Integral. In Proceedings of the 2011 Third Pacific-Asia Conference on Circuits, Communications and System (PACCS), Wuhan, China, 17–18 July 2011; pp. 1–3. [Google Scholar]
- Djurić, P.M. Monte Carlo methods for signal processing: Recent advances. In Proceedings of the 2004 12th European Signal Processing Conference, Vienna, Austria, 6–10 September 2004; pp. 853–860. [Google Scholar]
- Xiang, W. Analysis of the Time Complexity of Quick Sort Algorithm. In Proceedings of the 2011 International Conference on Information Management, Innovation Management and Industrial Engineering, Shenzhen, China, 26–27 November 2011; Volume 1, pp. 408–410. [Google Scholar]
Figure 1.
Traffic road scene.

Figure 2.
Radar signal processing.

Figure 3.
RDM detection matrix.

Figure 4.
OSCA-CFAR detection.

Figure 5.
Typical reference window model. (a) Cross window. (b) Rectangular window.

Figure 6.
(a) Radar system. (b) Data collection scenario.

Figure 7.
(a) RDM data acquisition process. (b) Data collection scenario.

Figure 8.
Background noise amplitude dispersion in RDM matrix (a) Noise amplitude variance in range direction. (b) Noise amplitude variance in Doppler direction.
Figure 8.
Background noise amplitude dispersion in RDM matrix (a) Noise amplitude variance in range direction. (b) Noise amplitude variance in Doppler direction.
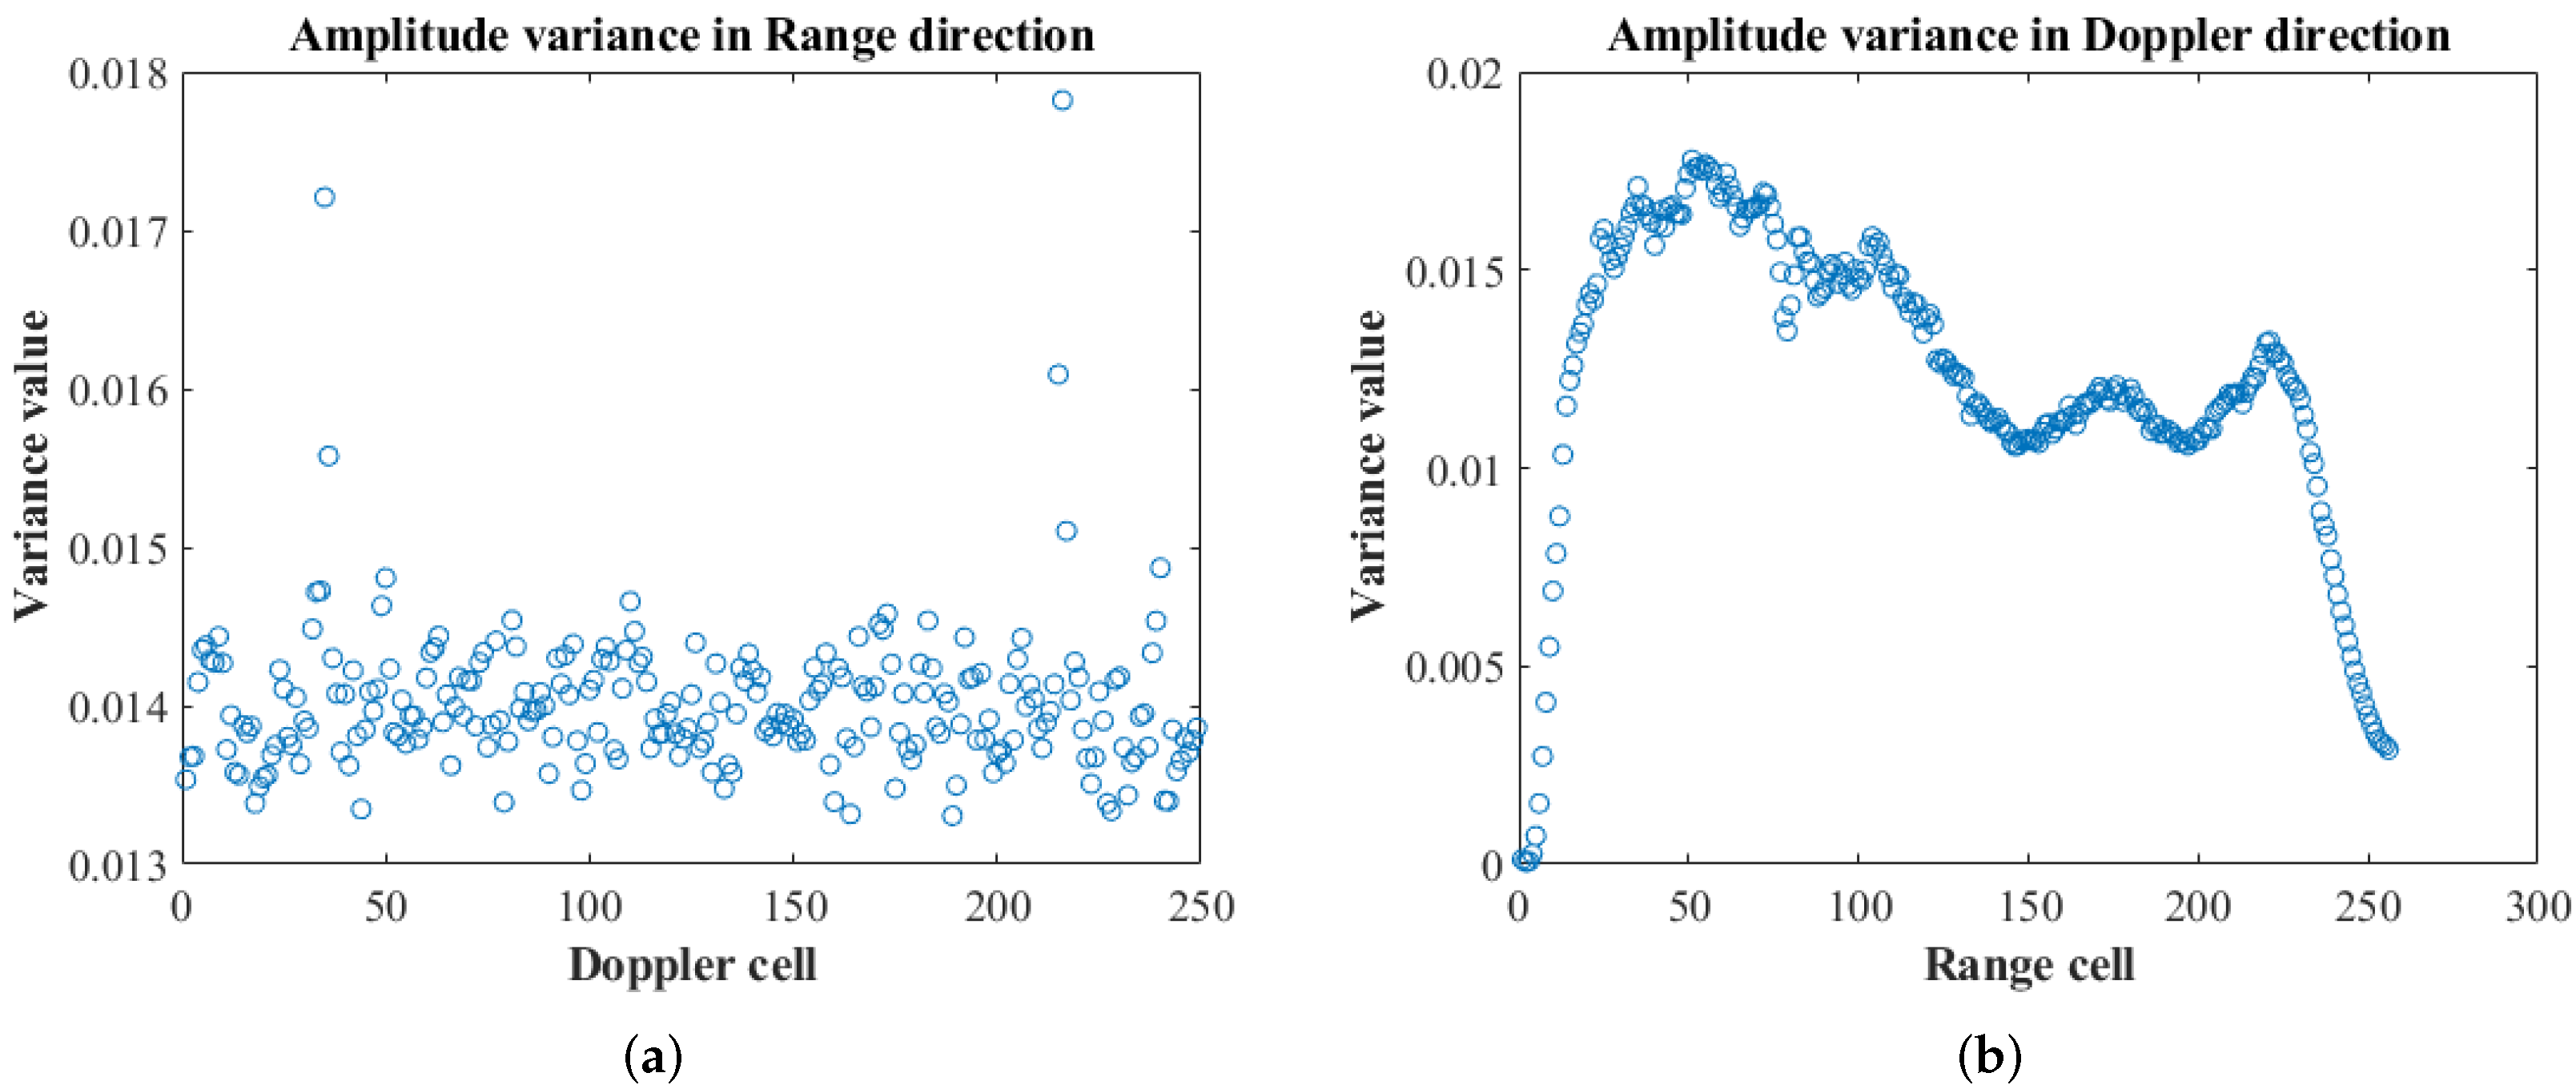
Figure 9.
Simulation and fitting experiment example of RDM matrix noise density function (a) Noise distribution curve. (b) Matching degree of Rayleigh distribution.
Figure 9.
Simulation and fitting experiment example of RDM matrix noise density function (a) Noise distribution curve. (b) Matching degree of Rayleigh distribution.

Figure 10.
MC-CFAR processing model.

Figure 11.
Three simple sampling strategies.

Figure 12.
Relationship between threshold factor and false alarm rate in MC-CFAR.

Figure 13.
The relationship between detection probability and SNR.

Figure 14.
Multi-target detection simulation of MC-CFAR algorithm.

Figure 15.
The relationship between the time complexity of the algorithm and the size of the detection matrix.
Figure 15.
The relationship between the time complexity of the algorithm and the size of the detection matrix.

Figure 16.
CFAR detection example. (a) RDM data. (b) CFAR result.

Figure 17.
Additional experiments for pedestrian detection.

Figure 18.
The relationship between algorithm performance and different parameter configurations at “ideal distance ”. (a) CA-CFAR test results. (b) OS-CFAR test results. (c) OSCA-CFAR test results. (d) MC-CFAR test results.
Figure 18.
The relationship between algorithm performance and different parameter configurations at “ideal distance ”. (a) CA-CFAR test results. (b) OS-CFAR test results. (c) OSCA-CFAR test results. (d) MC-CFAR test results.

Figure 19.
Algorithm testing at different distances. (a) Pedestrian detection results. (b) Vehicle detection results.
Figure 19.
Algorithm testing at different distances. (a) Pedestrian detection results. (b) Vehicle detection results.


Table 1.
A brief summary of the characteristics of CFAR algorithms.
| CFAR Algorithms | Advantages | Disadvantages | Reference Window |
|---|---|---|---|
| CA-CFAR | High detection SNR in uniform noise | Low multi-target detection capability, High detection performance in non-uniform noise | YES |
| GO-CFAR | Good false alarm control in clutter edge | Low multi-target detection capability | YES |
| SO-CFAR | High multi-target detection capability | Low false alarm control ability | YES |
| OS-CFAR | Strong robustness to multi-target detection | High resulting CFAR loss | YES |
| OSCA-CFAR | High robust in multi-target situations, Low resulting CFAR loss | Performance degradation in non-pure noise situations | YES |
| Comp-CFAR | Suppression of clutter interference with long smearing effect characteristics | High algorithm complexity | YES |
| zlog(z)-CFAR | Reduce the false alarm rate in Weibull clutter | High algorithm complexity | YES |
| Machine learning | High detection accuracy | Low timeliness | YES |
Table 2.
Radar system parameters.
| Item | Parameters | Item | Parameters |
|---|---|---|---|
| Chirp number | 256 | Range FFT points | 512 |
| B | 160 MHz | 20 MHz | |
| 200 m | 0.732 m | ||
| 31.847 m/s | 0.249 m/s |
Table 3.
Radar system parameters.
| Algorithm | Window Length/Samples Number | Threshold Factor | Good Frame Rate (%) |
|---|---|---|---|
| CA-CFAR | 10–14 | 5–6 | 30–33 |
| OS-CFAR | 10–16 | 8–10 | 30–33 |
| OSCA-CFAR | 10–14 | 7–9 | 28–31 |
| MC-CFAR | 384–896 | 6–8 | 40–43 |
Table 4.
Parameter selection.
| Algorithm | Window Length/Samples Number | Threshold Factor |
|---|---|---|
| CA-CFAR | 14 | 5 |
| OS-CFAR | 16 | 8 |
| OSCA-CFAR | 12 | 8 |
| MC-CFAR | 768 | 7 |
Table 5.
Algorithm running clock cycles (time complexity).
| Algorithm | Clock Cycle |
|---|---|
| CA-CFAR | 11,478,544 |
| OS-CFAR | 524,288 |
| OSCA-CFAR | 234,837 |
| MC-CFAR | 8448 |
Publisher’s Note: MDPI stays neutral with regard to jurisdictional claims in published maps and institutional affiliations. |
© 2022 by the authors. Licensee MDPI, Basel, Switzerland. This article is an open access article distributed under the terms and conditions of the Creative Commons Attribution (CC BY) license (https://creativecommons.org/licenses/by/4.0/).
Share and Cite
MDPI and ACS Style
Yang, B.; Zhang, H. A CFAR Algorithm Based on Monte Carlo Method for Millimeter-Wave Radar Road Traffic Target Detection. Remote Sens. 2022, 14, 1779. https://doi.org/10.3390/rs14081779
AMA Style
Yang B, Zhang H. A CFAR Algorithm Based on Monte Carlo Method for Millimeter-Wave Radar Road Traffic Target Detection. Remote Sensing. 2022; 14(8):1779. https://doi.org/10.3390/rs14081779
Chicago/Turabian StyleYang, Bo, and Hua Zhang. 2022. "A CFAR Algorithm Based on Monte Carlo Method for Millimeter-Wave Radar Road Traffic Target Detection" Remote Sensing 14, no. 8: 1779. https://doi.org/10.3390/rs14081779
Note that from the first issue of 2016, this journal uses article numbers instead of page numbers. See further details here.