
Glacier Mass Balance in the Manas River Using Ascending and Descending Pass of Sentinel 1A/1B Data and SRTM DEM


Key Laboratory of Remote Sensing of Gansu Province, Heihe Remote Sensing Experimental Research Station, Northwest Institute of Eco-Environment and Resources, Chinese Academy of Sciences, Lanzhou 730000, China
*
Author to whom correspondence should be addressed.
Remote Sens. 2022, 14(6), 1506; https://doi.org/10.3390/rs14061506
Submission received: 21 January 2022
/
Revised: 6 March 2022
/
Accepted: 14 March 2022
/
Published: 20 March 2022
(This article belongs to the Special Issue Remote Sensing for Mountain Vegetation and Snow Cover)
Abstract
:Mountain glaciers monitoring is important for water resource management and climate changes but is limited by the lack of a high-quality Digital Elevation Model (DEM) and field measurements. Sentinel 1A/1B satellites provide alternative data for glacier mass balance. In this study, we tried to generate DEMs from C-band Sentinel 1A/1B ascending and descending pass SLC images and evaluate the overall accuracy of INSAR DEMs based on Shuttle Radar Topography Mission (SRTM) DEM and ICESat/GLAS. The low Standard Deviation (STD)and Root Means Square Error (RMSE) displayed the feasibility of Sentinel 1A/1B satellites for DEM generation. Glacier elevation changes and glacier mass balance were estimated based on INSAR DEM and SRTM DEM. The results showed that the most glaciers have exhibited obvious thinning, and the mean annual glacier mass balance between 2000 and 2020 was −0.18 ± 0.1 m w.e.a−1. The south-facing and-east facing aspects, slope and elevation play an important role on glacier melt. This study demonstrates that ascending and descending orbit data of Sentinel-1A/1B satellites are promising for the detailed retrieval of surface elevation changes and mass balance in mountain glaciers.
1. Introduction
Mountain glaciers are sensitive indicators for climate change, and the retreat of glaciers because of global warming will bring about a series of scientific issues related to climate change, water resources, sea lever rise and natural disasters. Mountain glaciers have experienced lost mass and receded [1,2,3]; therefore, mapping, monitoring and inventorying glaciers in mountain glaciers are primary and urgent. However, the remoteness, inclement weather and complex terrain of glacier area hamper filed measurement. The development of remote sensing technology provides new technical means for glacier monitoring.
Glacier area and length changes can be derived relatively easily from remote sensing imagery [4,5,6]. However, changes in glacier area cannot fully reflect changes in glacier budgets. Compared with glacier area, changes in ice reserves are more sensitive to climate change, have the most direct impact and are more effective in reflecting contribution to glacier meltwater [7]. Two-dimensional parameters such as the range, area and number of glaciers can be easily and quickly obtained from optical remote sensing images, but it is quite challenging to obtain three-dimensional parameters from remote sensing imagery [8]. The emergence of high-resolution optical images with stereoscopic observation capabilities has brought vitality to the study of glacier elevation. However, an accurate DEM is hard to generate due to the poor quality of optical image caused by cloud and fog over high relief and steep-slope regions. The interferometric synthetic aperture radar (INSAR) with the characteristics of all-weather, all-day and night capability has promoted the generation of global high-resolution DEM. Although high-resolution satellites have greatly improved spatial resolution, interference coherence and orbital positioning accuracy, INSAR technology still has its inherent defects for mountainous areas with complex terrain [9] and will not obtain real surface space information due to factors such as perspective shrinkage, overlap and shadows [10]. The combination of ascending and descending pass SAR data is one of the promising and widely used techniques for overcoming the inherent geometric distortions [11]. Sentinel-1A was launched in 2014, and Sentinel-1B was launched in 2016. The launch of Sentinel-1B reduces revisit time from 12 days for Sentinel-1A to only 6 days for Sentinel 1A/1B. The availability of Sentinel 1A/1B satellites provides the opportunity to improve the quality of INSAR DEM generation.
The high temporal and spatial resolution of the Sentinel 1A/1B data has been used in various InSAR applications. However, using Sentinel-1 data for generating DEM is still in the early stages [12,13]. The quality of DEM from Sentinel 1A/1B SAR data is crucial for glacier mass balance. The main objectives of this study are to assess the feasibility of Sentinel 1A/1B data for mountain glacier change and estimate the glacier mass budget for the Manas River located in the northern foot of the Tienshan Mountains. In addition, we aim to define the influencing factors of glacier melt. The study on glacier changes is conducive to our comprehensive understanding of glacier budget changes and provides scientific basis and decision-making basis for climate change and water balance in arid areas.
2. Data and Methods
2.1. Study Area
The Manas River was selected as the test area for our study, which is located in the northern foot of the Tienshan Mountains, Xinjiang Province, in Northwest China (Figure 1). The Manas River is the largest inland river at the northern foot of Tienshan Mountains, and its main water sources are glacier melt and rainfall [14]. The highest amount (800) and the largest-scale glaciers (11.27%) were observed in this river in the northwest of Tienshan mountains according to the first China glacier inventory (FGI-China) [15]. Glacier inventory showed that the glacier area had a retreat of about 25 percent from 1964 (671.38 km2) to 2009 (502.01 km2). The upstream of this river above 3600 m was covered by glaciers and snow cover, and the mean snow line was 3907 m. The glacier tongues were covered by ice, ice-mixed-debris and debris. The largest artificial oasis area of China was located in the Manas River. Any change in the state of the glacier has a direct effect on agricultural production and the ecosystem in northern Xinjiang.
2.2. Data Sets
2.2.1. Optical Images
The glacier mask was derived from optical images including Landsat 8, Landsat TM and Landsat ETM+ images. The optical images were used to define the glacier boundaries over different years. In order to remove the impacts of seasonal snow on glacier mapping and the penetration depth estimation, we selected the optical images acquired at the end of the glacier ablation period. Landsat Enhanced Thematic Mapper Plus (ETM+) images acquired on 6 July 2000 and Landsat 8 Operational Land Imager (OLI) acquired on 3 July 2019 were utilized for glacier mapping. The source of the data was listed in Table 1.
2.2.2. Sentinel-1 Interferometric Wide Swath Images
The sentinel-1 satellite, which was launched in April 2014 and carries a single C-band synthetic aperture radar instrument operating at a center frequency of 5.405 GHz, can map global landmasses once every 12 days. The mission is composed of a constellation of two satellites, Sentinel-1A and Sentinel-1B, sharing the same orbital plane. The Sentinel-1 SAR instrument and short revisit time will greatly advance users’ capabilities and provide data routinely and systematically for glacier change. Sentinel-1 operates in four exclusive acquisition modes: Stripmap (SM), Interferometric Wide Swath (IW), Extra-Wide swath (EW) and Wave (VV). The Interferometric Wide Swath mode with a large swath width (250 km) and a moderate geometric resolution (5 m by 20 m) as the one main operational mode satisfies most current service requirements, avoids conflicts and preserves revisit performance, simplifies mission planning, decreases operational costs and builds up a consistent long-term archive [16].
IW model Level-1 Single Look Complex (SLC) products, which consist of focused SAR data, which are geo-referenced using orbit and attitude data from the satellite, and provided in slant-range geometry, were employed in this study. Two different view directions in ascending and descending orbits can eliminate the data gap caused by perspective shrinkage, overlay and shadow in the mountain areas. The combination of ascending and descending pass data is essential to generate more accurate DEM [17]. Ascending and descending pass Sentinel 1A/1B images were applied to generate DEM for glacier changes research. The Sentinel 1A/1B images would be selected according to the perpendicular baselines of interferometric pairs.
2.2.3. SRTM DEM
The Shuttle Radar Topography Mission (SRTM) launched on 11 February 2000 employed two synthetic aperture radars, a C band system (5.6 cm) and an X band system (3.1 cm) for deriving global elevation models using the single pass technique. The data acquired in C- and X-bands are processed into the first global digital elevation models (DEMs) at 1 arc sec resolution by NASA-JPL and German aerospace center (DLR), respectively. The C band system could only manage to cover the land mass between 54° S and 60° N and generated a contiguous mapping coverage, while the X-SAR instrument had a narrower ground track and generated discrete narrow width data swaths (50 km) [18]; therefore, C-band SRTM DEM with 30 m resolution (1 arc-second) was used as the reference DEM to generate INSAR DEMs and calculate glacier elevation changes.
2.2.4. ICESat/GLAS
The Ice, Cloud and Land Elevation Satellite (ICESat) was launched in 2003. GLAS (the Geoscience Laser Altimeter System) is the first laser-ranging (lidar) instrument for continuous global observations of Earth; laser pulses at 40 times per second will illuminate spots (footprints), 70 m in diameter and spaced at 170-m intervals along Earth’s surface. Release-33 ICESat level-2 Global Land Surface Altimetry Data product (GLA14) from 2003 to 2009 was used as the reference DEM data.
The position parameters of the laser points including the acquisition time, latitude and longitude, elevation, geoid and other information were extracted from the original binary file using the elevation extraction program NGAT1.3 provided by NSIDC [19]. The ICESat/GLAS data were referenced to the TOPEX/Poseidon ellipsoid and EGM96 Geoid’ therefore, ICESat/GLAS data were transformed from the TOPEX/Poseidon ellipsoid to the WGS 84 ellipsoid, and then the height values were transformed from ellipsoidal height to geoid height.
2.2.5. Glacier Inventory
The latest glacier inventory for our study area is the second China glacier inventory (SCGI) constructed by CAREERI, and CAS was used for manual correction of glacier outlines. SCGI was compiled based on Landsat TM/ETM+ and ASTER images acquired between 2006 and 2010, and the digital elevation models (DEMS) were acquired from SRTM. In our study area, Landsat TM and ETM+ images were acquired in 2009.
2.3. Methods
This section describes the methods for estimating glacier elevation and glacier mass balance. The first step is to map the glacier outline, including the extraction of outlines of debris cover and clean ice; the second step is to generate DEM from ascending and descending pass of Sentinel-1 data for glacier elevation changes. The third step is to correct INSAR DEM and evaluate the accuracy of INSAR DEM based on SRTM DEM and ICESat/GLAS in stable terrain. Then, glacier elevation was estimated. Finally, glacier mass balance and the uncertainty of glacier mass balance were calculated. The detailed flow chart of this study is shown in Figure 2.
2.3.1. Glacier Mapping
To delineate the boundaries of glaciers derived from Landsat ETM+ and Landsat 8 OLI images, Landsat images were first radiometrically calibrated to convert the digital number (DN) values to spectral radiance and then atmospherically corrected to obtain planetary reflectance. The study area was covered by clean ice and debris-covered glaciers. The band ratio method ETM+3/ETM+5 (OLI4/6) with a threshold of 2.0 was employed in automatically mapping glaciers; however, the band ratio method failed in mapping the end of the ice tongue due to some debris; thus, the boundaries of the end of ice tongue were corrected manually by visual interpretation. Visual interpretation mainly depended on texture characters, brightness/color variations, elevation and slope information. We also used the second China glacier inventory as reference data to validate the boundaries of glaciers. Finally, the boundaries of clean ice and debris-covered glaciers were delineated for 2000 year and 2019 year.
2.3.2. INSAR DEM Generation
DEM generation from ascending and descending passes of Sentinel-1 data included selection image pairs for INSAR DEM, DEM generation and bias correction. The selection of SAR images pairs has an important impact on the accuracy of INSAR DEM generation. The optimum interferometric pair for DEM creation has a large perpendicular baseline and a small temporal baseline. Interferograms with very small perpendicular baseline values (<30 m), although easy to unwrap, are almost useless due to their high sensitivity to phase noise and atmospheric effects. The optimum perpendicular baseline is in the range between 150 m and 300 m for ERS satellites [20]. However, the baselines for the Sentinel 1A and Sentinel 1B interferometric pairs are not high and mostly in the range of ±150 m. ASF’s baseline tool was used to check the perpendicular baseline of ascending and descending pass images. After inquiring the period from 2016 to 2020, we collected six pairs of ascending and descending orbits data; however, perpendicular baselines values of three pairs were very small (<10 m). Therefore, the other three pairs of INSAR images were employed to generate INSAR DEMS according to the image selection criteria. Three Sentinel 1A images acquired on 10 August 2019, 22 August 2019 and 3 October 2019 in ascending pass and two Sentinel 1B images acquired on 16 August 2019 and 27 September 2019 in the descending pass composed three pairs of ascending and descending orbits data for DEM generation. The first interferometric pair is based on Sentinel 1B data acquired on 10 August 2019 and Sentinel 1A data acquired on 16 August 2019; the second interferometric pair is based on Sentinel 1A data acquired on 16 August 2019 and Sentinel 1B data acquired on 22 August 2019; and the third interferometric pair is based on Sentinel 1B data acquired on 27 September 2019 and Sentinel 1A data acquired on 7 October 2019, The perpendicular baselines values of interferometric pairs were 99 m, 94 m and 69 m, respectively. The two interferometric pairs with perpendicular baselines values of 99 m and 94 m were selected to generate DEM for glacier elevation changes. The detail information of SAR data is shown in Table 2.
After selecting the SLC data pairs, five main processing steps were necessary to create a DEM from Sentinel-1 INSAR images. The processing steps are described below. One arc-second SRTM-C DEM was applied as the vertical reference in processing, including co-registration, interferogram formation and terrain correction.
- Co-registration
The first step was to accurately co-register two or more images into a stack. One image is selected as the master, and the other images are the slaves. The co-registration step is fundamental in interferogram generation, as it ensures that each ground target contributes to the same (range and azimuth) pixel in both the master and the slave image. The operator co-registers two S-1 SLC split products (master and slave) of the same sub-swath using the orbits of the two products and a Digital Elevation Model (DEM). The one arc-second SRTM-C DEM was employed as a vertical reference.
- 2.
- Interferogram generation
The interferogram is formed by cross multiplying the master image with the complex conjugate of the slave. Interferogram formation was performed based on Sentinel 1A and Sentinel 1B. In the interferogram formation step, we removed the flat-Earth phase, which is the phase present in the interferometric signal due to the curvature of the reference surface. The flat-Earth phase is estimated using the orbital and metadata information and subtracted from the complex interferogram [20].
- 3.
- Phase filtering and multilooking
Phase filtering is a preprocessing technique that greatly reduces the residues in the later-on unwrapping step phase and enhances phase unwrapping accuracy. To reduce this inherent speckled appearance, we performed multilooking processing.
- 4.
- Phase unwrapping
After creating a wrapped interferogram stack, the SNAPHU export was used to prepare data for unwrapping with SNAPHU. After phase unwrapping of the interferograms, phase to elevation was applied to convert the interferometric phase to a digital elevation map. This is the first step towards obtaining a DEM. The SAR elevation map should then be referred to C-band SRTM and resampled to a spatial resolution of 30 m.
- 5.
- Terrain corrections
Terrain corrections were intended to compensate for these distortions so that the geometric representation of the image would be as close as possible to the real world.
The above processing steps were performed for the selected two interferometric pairs. Finally, the generated INSAR DEMs were projected to the same UTM projection with C-band SRTM and resampled into the same spatial resolution with C-band SRTM.
2.3.3. DEM Correction
The errors and biases exist between the DEMS because of different data sources, data processing methods and different resolutions of DEMs [21], and the errors and biases may persist from the accurate estimation of the DEMs’ accuracy and DEMs’ differences. Bias corrections were necessary before the estimation of glacier elevation changes. DEM corrections include the co-registration between DEMs, terrain parameter-dependent biases, C-band penetration into snow and ice and seasonality correction due to the different images acquisition time.
Non-glacier areas were selected to correct INSAR DEM, and glacier areas are removed using glacier polygon masks. The elevation differences between each DEM and SRTM-C DEM were calculated. Elevation differences raster data were converted into points. Meanwhile, the corresponding terrain parameters (elevation, slope and aspect) of each point were extracted from SRTM-C DEM by bilinear interpolation. All pixels with a slope angle less than 5° were excluded, because their aspect values might be falsified by inherent elevation errors [3]. The outliers of the elevation differences were excluded based on a difference image between master and slave DTMs. We first eliminated the most extreme outliers where the 5% and 95% quantiles were set. The remaining pixels were then utilized to calculate the interquartile range (IQR), and all pixels lying between the two-tailed 1.5 times IQR were retained [3].
Co-registration of DEMs is the most important correction to ensure that the pixels of each DEM represent the same location and area. A robust 3-D co-registration method was used to co-register each DEM with reference to C band SRTM [22]. The method demonstrated that a functional relation existed between elevation differences and terrain parameters over stable terrain off glaciers. Cosine parameters are solved using least-squares minimization, and the iteration was stopped if the magnitude of the improvement of the standard deviation for the elevation differences was less than 2% [22].
After co-registration, the relationships between elevation differences and terrain parameters (elevation, slope, aspect and maximum curvature) in stable terrain were tested. It was observed that the maximum curvature and slope had more clear function relationships with elevation differences in the stain area outside glaciers (Figure 3). We removed the elevation bias for each pixel by the functions between elevation differences and terrain parameters. The standard deviation of the elevation differences reduced from 3.56 m to 2.10 m after adjusting DEMs horizontally and vertically, and there was an improvement of 40.5% in standard deviation.
2.3.4. Sentinel 1A/1B INSAR DEM Accuracy Assessment
After the biases between DEMs have been corrected, elevation differences in stable terrain area were calculated and analyzed. To validate the effectiveness and the vertical accuracy of InSAR DEM derived from Sentinel 1A/1B images, the INSAR DEM in stable terrain area was compared with ICESat/GLAS and SRTM DEM. Due to the lack of the ground truth data, ICESat GLA14 footprints located in non-glacier areas were also used as the reference points and the data were collected for the study area from 2003 and 2009. First, the corresponding elevation values, slope information from INSAR DEMs and SRTM DEM at the location of each ICESat/GLAS point were extracted by bilinear interpolation. Then, the elevation differences were calculated by subtracting the corresponding elevation values of ICESat/GLAS point and SRTM DEM from INSAR DEMs. Moreover, we also excluded pixels with elevation difference exceeding ±150 m.
We applied Mean Error (ME), Root Means Square Error (RMSE) and Standard Deviation (STD) to measure the elevation error.
RMSE is defined as follows.
STD is defined as follows:
where is the elevation of ICESat/GLAS and SRTM DEM, is the elevation for each INSAR, n is the total number of ICESat/GLAS points and is the arithmetic mean of elevation difference.
To define the uncertainty of elevation change, we calculated mean error and standard deviation of elevation difference for each 100 m altitude bin over non-glacier terrain.
2.3.5. Glacier Elevation Changes and Mass Balance Estimation
After the biases between DEMs have been corrected, glacial elevation changes can be computed. To estimate the glacier elevation changes, DEMs of the glacier areas were first masked based on the above glacier outlines. The glacier elevation changes in 2000–2019 were estimated by differentiating Sentinel 1A/1B INSAR DEM of 2019 and SRTM DEM of 2000. The penetrate depth of C- band was not considered due to the same SAR band of Sentinel 1A/1B and SRTM. To reduce the effect on the final result, glaciers that were truncated by the boundary of the study area were excluded from mass balance calculations [21]. Before calculating elevation changes on glacier area, the biases of DEMS were corrected depending on the correction functions of the non-glacier area. The corresponding elevation difference, elevation, slope, aspect and curvature derived from DEM of each pixel on glacier area were extracted by bilinear interpolation. Glacier elevation changes were then analyzed for each 100 m altitude bin. For each altitude band, the glacier elevation changes were averaged after excluding pixels where absolute elevation differences differ by more than three standard deviations from the mean [23,24,25]. For data gap, we filled the pixels using the mean elevation change in the same altitude interval and using zeros, respectively [23,26].
The volume change was calculated by integrating the average elevation change (hi) with the corresponding glacier area (Si) for each altitude band, and a density conversion factor of 850 kg/m3 was applied to convert the volume change to mass balance [27]:
where i is each altitude band, is the average elevation change, is the corresponding glacier area of the elevation bin, is , is the total glacier area for a given glacier or region and is the water density (1000 kgm−3).
The influence of different season could also be important to estimate glacier mass balance. Sentinel 1 INSAR DEMs were acquired in August, and SRTM DEM was acquired on February. The seasonal correction necessarily had to be estimated in order to eliminate the effect of glacier mass change during this six-month period. To avoid the impact on glacier mass balance estimation of different satellite image acquisition dates, a seasonality correction was considered. The mean winter precipitation in Tien Shan is low [2,28,29], and the mean winter accumulation at the Tien Shan climate station is 0.05 m w.e. (0.01 m w.e. per winter month) [29]; therefore, we used a value of 0.01 m w.e. per winter month for the seasonality correction of glacier mass balance.
2.3.6. Mass Balance Uncertainty
We estimated the penetration depth of C band based on SRTM X-band; however, Sentinel 1 SLC data and SRTM DEM have the same C band. Hence, the uncertainty of the penetration depth of Sentinel 1 SAR data is neglected. The uncertainty of glacier mass changes included the uncertainty of elevation changes and the uncertainty of ice density conversion. The bias of elevation change in stable terrain was the elevation change’s uncertainty. The standard deviation of the average elevation change in stable terrain was used to approximately represent the error related to glacier elevation change.
The glacier mass balance uncertainty Um was estimated using the following equation [29,30,31]:
where is glacier elevation change, the ice density is 850 kg/m3, Δρ the ice density uncertainty is 60 kg/m3, t is the observation period, ρw the density of water is 1000 kg/m3 and UDEM is the standard deviation of glacier elevation [27].
3. Results
3.1. Accuracy Assessment for INSAR DEM Based on SRTM-C and ICESat
SRTM-C DEM and ICESat were applied to evaluate the vertical accuracy of INSAR DEMs from Sentinel 1A/1B, respectively. The total 1669 ICESat points in stable terrain were selected as reference data. The accuracies of two INSAR DEMs including minimum, maximum, mean, standard deviation (STD) and root mean square error (RMSE) were showed in Table 3 and Table 4.
The comparison between SRTM C-band and INSAR DEMs revealed a similar standard deviation and RMSE. The standard deviation and RMSE of INSAR DEMs were the same values. Compared with SRTM and ICESat, INSAR DEM derived from 16 August 2019 and 22 August 2019 sentinel 1A/1B images had higher quality with the lower RMSE (2.15 m) and STD (2.15 m), RMSE (4.5 m) and STD (4.98 m) than INSAR DEM derived from 10 August 2019 and 16 August 2019 sentinel 1A/1B images. Therefore, the generated DEM derived from 16 August 2019 and 22 August 2019 sentinel 1A/1B was used to compute glacier elevation change.
3.2. Glacier Elevation Changes and Glacier Mass Balance
The glacier elevation difference for each pixel was computed based on SRTM DEM and Sentinel 1 DEM. The map of glacier elevation changes between 2000 and 2019 is shown in Figure 4. The glacier elevation change was averaged for each 100 m elevation interval to understand glacier elevation changes at different elevations (Figure 5).
The investigation showed that most of glaciers (65.42%), especially at their tongues on the main source and the left bank of the river, have exhibited obvious thinning. The maximum surface thinning was about 80 m. The other glaciers have thickened, ranging 0 m to 120 m over the past two decades. The mean change rate of glacier elevation in past twenty years ranged from −4.0 ± 2.15 ma−1 to 6.0 ± 2.15 ma−1.
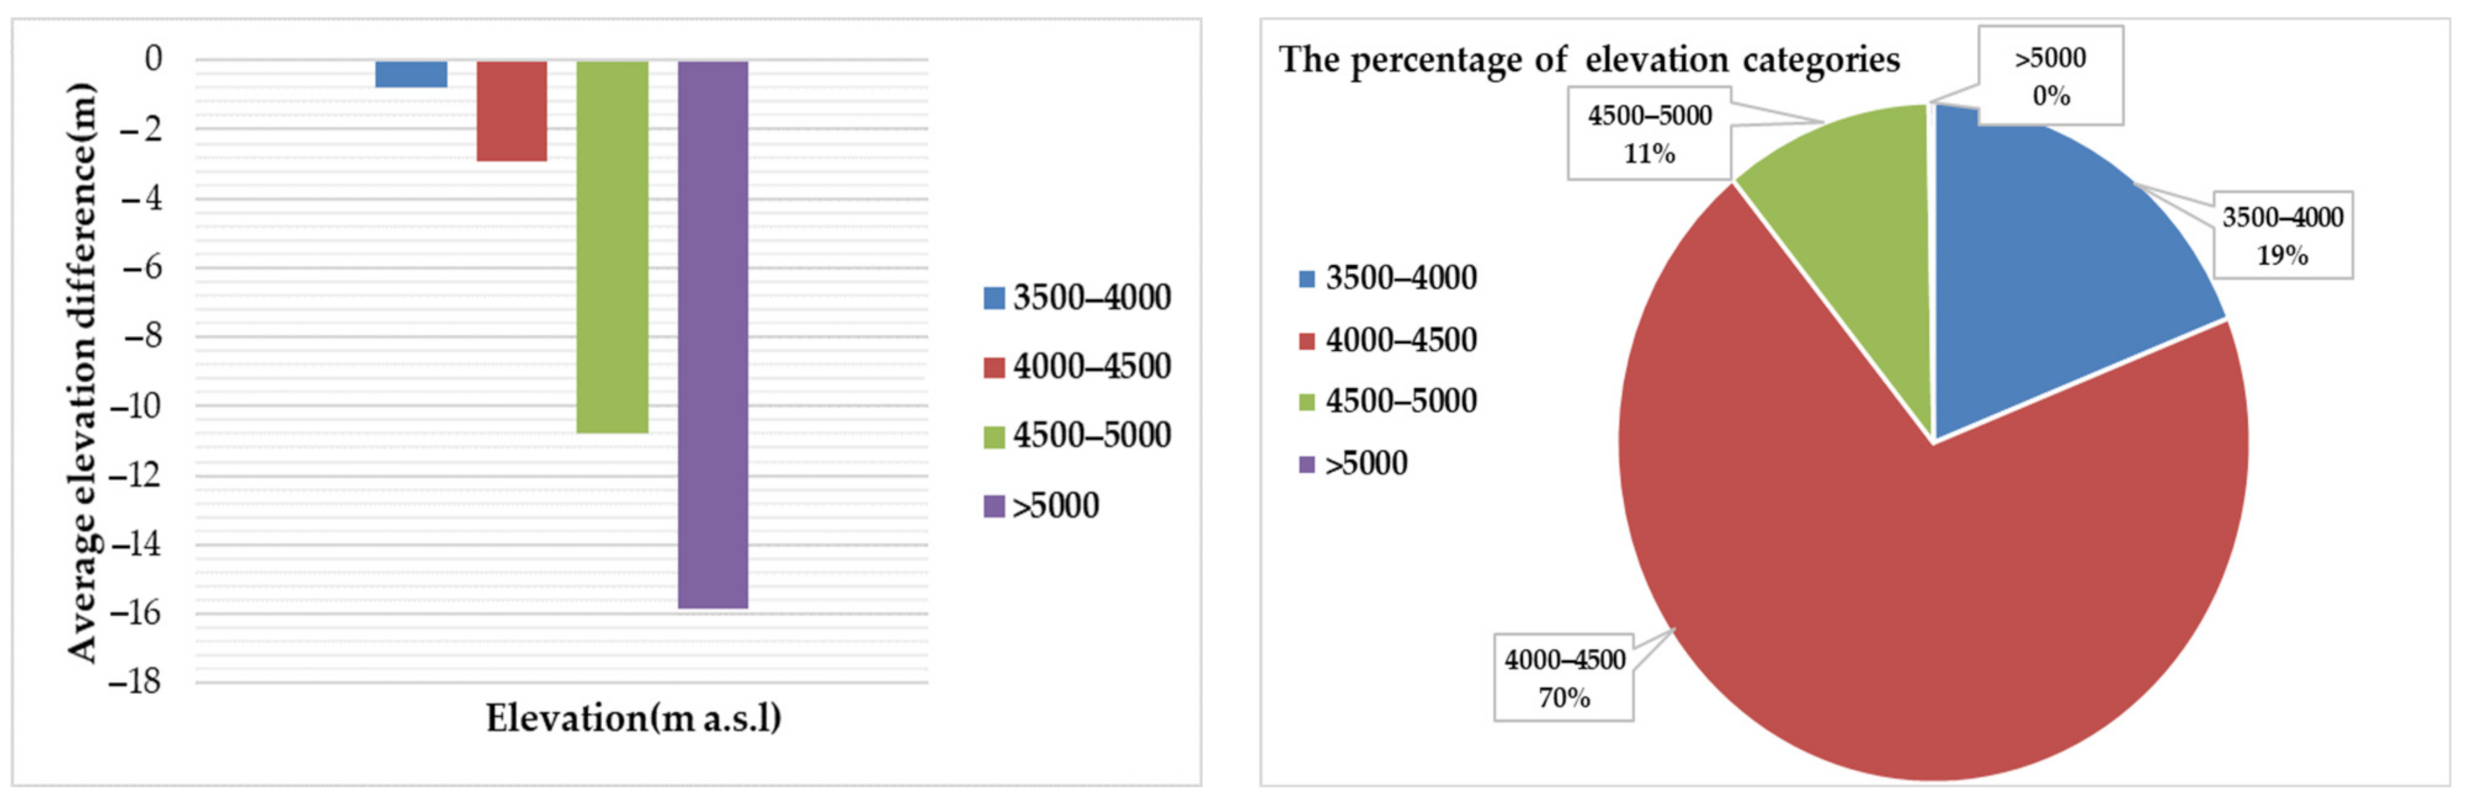
We divided the glacier region into four parts in each 500 m interval and estimated glacier mass balance at different elevations (Table 5). The result showed that all mean glacier elevation differences (dh/dt) and glacier mass balance at different elevations were negative. The glacier surface between 3500 m a.s.l. and 4000 m a.s.l. had the smallest loss, and glacier mass balance was −0.04 ± 0.10 w.e.a−1, while the glacier surface above 5000 m a.s.l. has the largest loss and glacier mass balance was −0.69 ± 0.10 w.e.a−1. This resulted in a negative total mass balance of 0.18 ± 0.10 w.e.a−1 on the main source and the left bank of the river over the past two decades.
4. Discussion
4.1. The Suitability of Sentinel-1 Data for Glacier Change
Related studies that applied Sentinel-1 data to estimate glacier elevation change and glacier balance mass were not found. To validate the effectiveness of INSAR DEMs derived from Sentinel 1A/1B data, we tried to generate INSAR DEM from ascending and descending passes of Sentinel-1 Data. This demonstrated that the vertical RMSEs and standard deviations of INSAR DEMs derived from Sentinel 1A/1B satellites were below 5 m over stable terrain areas by comparing INSAR DEMs with ICESat/GLAS and SRTM DEM. The result demonstrated the feasibility of ascending and descending passes of Sentinel 1 data for glacier elevation changes. To understand the changes of mountain glaciers better, it is necessary to validate INSAR DEMs based on ground-control points and carry out research on different study areas to test the suitability of Sentinel-1 data for future study.
4.2. Influences of Terrain Parameters on Glacier Elevation Changes
To investigate the influence factors of glacier melting, the relationships of topographic characteristics including elevation, slope and aspect and the mean glacier elevation change were analyzed respectively.
4.2.1. Influence of Elevation on Glacier Elevation Change
Figure 5 displayed that the glacier elevation difference was strongly correlated with elevation, and the correlation coefficient was 0.95. The mean glacier elevation changes for each 100 m elevation bin displayed that all glacier elevation differences were all negative. Glacier surface elevation thinning ranged from 0.87 ± 2.15 m to 2.19 ± 2.15 m between 3500 m a.s.l. and 3900 m a.s.l., and the mean glacier elevation change had a decreasing trend with increasing elevation. Conversely, the mean glacier elevation changes ranged from 1.99 m ± 2.15 m to 16.11 m ± 2.15 m between 3900 m a.s.l. and 5100 m a.s.l. and the mean glacier elevation change had an increasing trend with increasing elevation above 3900 m a.s.l. We also observed the increasing trends of glacier elevation change and glacier mass balance with increasing elevation in Table 5.
4.2.2. Influence of Slope on Glacier Elevation Change
In order to clarify the relationship between glacier elevation change and slope, the glacier elevation change for each 1-degree bin was averaged. Figure 6 showed the strong positive correlation between the mean glacier thickness change and slope (R2 = 0.93). The mean glacier elevation varied with different slopes. The mean glacier surface was thinning on a slope less than 35°, while the mean glacier surface was thickening on a slope greater than 35°; moreover, the elevation difference on the slope greater than 10° increased as slope increased. To understand the distribution of glacier change, the distribution of slope for each 10-degree interval, the average elevation difference and the percentage of slope categories were also demonstrated in Figure 7 and Figure 8.
4.2.3. Influence of Aspect on Glacier Elevation Change
Aspect slope was also an important factor of glacier melt [31,32]. In order to explore the impact of aspect on glacier melt for our study area, we first averaged the glacier elevation changes for each 10-degree interval (Figure 9). To define the distribution of melting glaciers, the aspect then was divided into eight classes according to the direction of slopes, and the distributions of the aspect of glaciers were demonstrated (Figure 10). Furthermore, the mean glacier elevation change (dh) and the percentage of different aspect categories for each direction were counted and shown in Figure 11.
The curve demonstrated a strong relationship between aspect slope and glacier elevation change (R2 = 0.93). The result showed that the glaciers distributed on aspect slopes ranging from 40° to 260° experienced thinning. It was also found that the glaciers distributed over south, southeast, southwest, east and northeast slopes (68% of the glacier area) experienced varying degrees of thinning. The glaciers distributed over the southeast aspect had the highest thinning rate of 0.81 ± 0.46 ma−1. The glaciers on northeast aspect had the largest area (18% of the glacier area) and the lowest thinning rate of 0.07 ± 0.46 ma−1. Overall, the glaciers distributed on south-facing and east-facing aspects had a mass loss.
We investigated the number, the mean glacier elevation changes and the number of south slope and slope categories of different elevation ranges in glacier area. Detailed information is revealed in Figure 12. The analysis of slope and south distributions with different elevation showed that about 89% of the total glacier area was distributed at elevations below 4500 m a.s.l. and the mean slope less than 25°. In addition, we found that the elevation, the thinning rate of glacier and the percentage of south facing had similar change trends. The thinning rate of glacier and the percentage of south-facing increased as elevation increases.
In summary, the results indicated that the glaciers located at the south-facing and east-facing aspects, with slopes less than 35° and high elevation, have experienced a mass loss over the past twenty years. The terrain parameters had important impacts on glacier melt.
4.3. Influences of Debris on Glacier Changes
Debris is distributed extensively over mountain glaciers and plays an important role in glacier ablation on local scales. However, the role of debris in determining glacier ablation is more complex and uncertain [7,33,34]. Previous glacier monitoring studies have demonstrated three effects of the debris: accelerating melting [35], insulting melting [36] and no evident effect [37,38]. Our results showed that partly debris-covered glaciers and clean ice displayed similar thinning trends (ranged from −2 ma−1 to −0.5 ma−1), while part ice tongues covered by debris displayed less thinning than clean ice (ranged from 0.5 ma−1 to 0 ma−1). The phenomenon may be related to the thickness of debris layers.
4.4. Comparison to Previous Mass Balance Estimates
Previous glacier mass balance records with the same study area and the same observation period were not found; therefore, we compared our results with glacier mass balance records in the northern Tien Shan and central Tien Shan. Glacier mass balance records reveal a high inter-annual variability −0.43 ± 0.09 w.e.a−1 from 2000 to 2014, −0.45 ± 0.13 w.e.a−1 from 2012 to 2016 and 0.49 ± 0.13 w.e.a−1 from 2016 to 2020 in Bhattacharya [39]. For central Tien Shan, a mass loss of −0.23 ± 0.19 m w.e.a−1 between 1999 and 2009 was recorded [5]. A comparison of our results with the previous results show that our result with 0.18 ± 0.10 w.e.a−1 was lower negative than the result of the northern Tien Shan area, and it was with the results of central Tien Shan. This was related to the quality of DEM, the study area and the observation period. The reliability of our results is mainly influenced by the quality of INSAR DEM. For future work, we will extend our work to other regions with filed measures and previous study areas to assess the reliability of our method.
5. Conclusions
In this study, for glacier changes in mountain area, INSAR DEM from Sentinel-1 satellites was evaluated and the accuracy of INSAR DEM demonstrated the potential of Sentinel-1 SAR data for the accurate estimation of glacier elevation changes in our study area. We estimated glacier mass balance based on INSAR DEM and SRTM. The result indicated that most glacier surface elevations in the Manasi river have experienced thinning and induced a moderate mass loss of −0.18 ± 0.10 w.e.a−1 for the period 2000–2020. The glaciers were located in the south-facing and east-facing aspects, with slopes less than 35° and high elevation. Our study provides an additional mean to estimate glacier mass balances of other mountains regions. The quality of INSAR DEM from ascending and descending pass SLC data is quite encouraging. More detailed verification and further investigation should be performed. In addition, more temporal of ascending and descending pass SLC data should be selected and validated for continuous glacier monitoring.
Author Contributions
Conceptualization, L.Y. and J.W.; methodology, L.Y. and J.W.; validation, L.Y. and D.S.; formal analysis, L.Y.; investigation, D.S.; resources, L.Y.; data curation, L.Y.; writing—original draft preparation, L.Y.; writing—review and editing, L.Y.; visualization, L.Y.; supervision, D.S.; project administration, L.Y.; funding acquisition, L.Y. All authors have read and agreed to the published version of the manuscript.
Funding
This research was funded by the National Natural Science Foundation of China, grant number 41801273 and 41471291, and National Science and Technology Major Project of China’s High Resolution Earth Observation System (Project Number: 21-Y20B01-9001-19/22).
Institutional Review Board Statement
Not applicable.
Informed Consent Statement
Not applicable.
Data Availability Statement
The data supporting the findings of this study are available from the first author (L.Y.).
Acknowledgments
We thank USGS for freely providing SRTM-C DEM and Landsat data and ESA for free access to Sentinel 1A/1B data. We thank CAREERI, CAS, for freely providing the second China glacier inventory (SCGI).
Conflicts of Interest
The authors declare no conflict of interest.
References
- Shangguan, D.; Liu, S.; Ding, Y.; Ding, L.; Xiong, L.; Cai, D.; Li, G.; Lu, A.; Zhang, S.; Zhang, Y. Monitoring the glacier changes in the Muztag Ata and Konggur mountains, east Pamirs, based on Chinese Glacier Inventory and recent satellite imagery. Ann. Glaciol. 2006, 43, 79–85. [Google Scholar] [CrossRef] [Green Version]
- Narama, C.; Kaeaeb, A.; Duishonakunov, M.; Abdrakhmatov, K. Spatial variability of recent glacier area changes in the Tien Shan Mountains, Central Asia, using Corona (~1970), Landsat (~2000), and ALOS (~2007) satellite data. Glob. Planet. Change 2010, 71, 42–54. [Google Scholar] [CrossRef]
- Pieczonka, T.; Bolch, T.; Wei, J.F.; Liu, S.Y. Heterogeneous mass loss of glaciers in the Aksu-Tarim Catchment (Central Tien Shan) revealed by 1976 KH-9 Hexagon and 2009 SPOT-5 stereo imagery. Remote Sens. Environ. 2013, 130, 233–244. [Google Scholar] [CrossRef] [Green Version]
- Bhambri, R.; Bolch, T. Glacier mapping: A review with special reference to the Indian Himalayas. Prog. Phys. Geogr. 2009, 5, 672–704. [Google Scholar] [CrossRef] [Green Version]
- Bolch, T.; Yao, T.; Kang, S.; Buchroithner, M.F.; Scherer, D.; Maussion, F.; Huintjes, E.; Schneider, C. A glacier inventory for the western Nyainqentanglha Range and the Nam Co Basin, Tibet, and glacier changes 1976–2009. Cryosphere 2019, 4, 419–433. [Google Scholar] [CrossRef] [Green Version]
- Paul, F.; Huggel, C.; Kääb, A. Combining satellite multispectral image data and a digital elevation model for mapping debris-covered glaciers. Remote Sens. Environ. 2004, 89, 510–518. [Google Scholar] [CrossRef]
- Scherler, D.; Bookhagen, B.; Strecker, M.R. Spatially variable response of Himalayan glaciers to climate change affected by debris cover. Nat. Geosci. 2011, 4, 156–159. [Google Scholar] [CrossRef]
- Cao, M.; Li, X.; Chen, X.; Che, T.; Wang, J. Remote Sensing of Cryosphere; Science Press: Beijing, China, 2006; pp. 129–150. [Google Scholar]
- Jiang, H.J. High-resolution Spaceborne SAR Interferometry for DEM Generation and Updating. Ph.D. Thesis, Wuhan University, Wuhan, China, 2012. [Google Scholar]
- Ferretti, A.; Savio, G.; Barzaghi, R.; Borghi, A.; Rocca, F. Submillimeter accuracy of InSAR time series: Experimental validation. TGRS 2007, 45, 1142–1153. [Google Scholar] [CrossRef]
- Crosetto, M. Calibration and validation of SAR interferometry for dem generation. ISPRSJ Photogramm. 2003, 57, 213–227. [Google Scholar] [CrossRef]
- Kyriou, A.; Nikolakopoulos, K. Assessing the suitability of Sentinel-1 data for landslide mapping. Eur. J. Remote Sens. 2018, 51, 402–411. [Google Scholar] [CrossRef] [Green Version]
- Marko, M.; Juha, K. Incidence angle dependence of first-year sea ice backscattering coefficient in Sentinel-1 SAR imagery over the kara sea. IEEE T. Geosci. Remote 2017, 55, 6170–6180. [Google Scholar] [CrossRef]
- Jilili, A.; Ayiguli, M.; Tang, Y. Soil salinization in the Manas River Basin in spring. Arid Zone Res. 2013, 30, 189–195. [Google Scholar]
- Lanzhou Institute of Glaciology and Geocryology, Chinese Academy of Sciences. Glacier Inventory of China III. Tianshan Mountains (Interior Drainage Area of Junggar Basin in Northwest); Science Press: Beijing, China, 1986; pp. 30–111. [Google Scholar]
- Yague-Martinez, N.; Prats-Iraola, P.; Gonzalez, F.R.; Brcic, R.; Shau, R.; Geudtner, D.; Bamler, R. Interferometric processing of Sentinel-1 TOPS data. IEEE Trans. Geosci. Remote 2016, 54, 2220–2234. [Google Scholar] [CrossRef] [Green Version]
- Deo, R.; Rossi, C.; Eineder, M.; Fritz, T.; Rao, Y.S. Framework for Fusion of Ascending and Descending Pass TanDEM-X Raw DEMs. IEEE J.-Stars 2015, 8, 3347–3355. [Google Scholar] [CrossRef] [Green Version]
- Rabus, B.; Eineder, M.; Roth, A.; Bamler, R. The shuttle radar topography mission—a new class of digital elevation models acquired by spaceborne radar. ISPRS J. Phtogramm. 2003, 57, 241–262. [Google Scholar] [CrossRef]
- Yan, L.L. Glacier Mapping and the Research of Glacier Elevation Changes Based on Multiple Data. Ph.D. Thesis, Chinese Academy of Sciences, Beijing, China, 2014. [Google Scholar]
- Ferretti, A.; Monti-Guarnieri, A.; Prati, C.; Rocca, F. InSAR Principles: Guidelines for SAR Interferometry Processing and Interpretation; ESA Publications: Noordwijk, The Netherlands, 2007. [Google Scholar]
- Gardelle, J.; Berthier, E.; Arnaud, Y. Impact of resolution and radar penetration on glacier elevation changes computed from DEM differencing. J. Glaciol. 2017, 58, 419–422. [Google Scholar] [CrossRef] [Green Version]
- Nuth, C.; Kääb, A. Co-registration and bias corrections of satellite elevation data sets for quantifying glacier thickness change. Cryosphere 2011, 5, 271–290. [Google Scholar] [CrossRef] [Green Version]
- Gardelle, J.; Berthier, E.; Arnaud, E. Slight mass gain of Karakoram glaciers in the early twenty-first century. Nat. Geosci. 2012, 5, 322–325. [Google Scholar] [CrossRef]
- Berthier, E.; Arnaud, Y.; Baratoux, D.; Vincent, C.; Rémy, F. Recent rapid thinning of the “Mer de Glace” glacier derived from satellite optical images. Geophys. Res. Lett. 2004, 31, L17401. [Google Scholar] [CrossRef] [Green Version]
- Gardelle, J.; Berthier, E.; Arnaud, Y.; Kääb, A. Region-wide glacier mass balances over the pamirkarakoram-himalaya during 1999–2011. Cryosphere 2013, 7, 1263–1286. [Google Scholar] [CrossRef] [Green Version]
- Zhou, Y.; Li, Z.; Li, J.; Zhao, R.; Ding, X. Glacier mass balance in the qinghai–tibet Plateau and its surroundings from the mid-1970s to 2000 based on Hexagon KH-9 and SRTM DEMs. Remote Sens. Environ. 2018, 210, 96–112. [Google Scholar] [CrossRef]
- Huss, M. Density assumptions for converting geodetic glacier volume change to mass change. Cryosphere 2013, 7, 877–887. [Google Scholar] [CrossRef] [Green Version]
- Kutuzov, S.; Shahgedanova, M. Glacier retreat and climatic variability in the eastern Terskey-Alatoo, inner Tien Shan between the middle of the 19th century and beginning of the 21st century. Glob. Planet. Change 2009, 69, 59–70. [Google Scholar] [CrossRef]
- Pieczonka, T.; Bolch, T. Region-wide glacier mass budgets and area changes for the Central Tien Shan between ~1975 and 1999 using Hexagon KH-9 imagery. Glob. Planet. Change 2015, 128, 1–13. [Google Scholar] [CrossRef]
- Rolstad, C.; Haug, T.; Denby, B. Spatially integrated geodetic glacier mass balance and its uncertainty based on geostatistical analysis: Application to the western Svartisen ice cap, Norway. J. Glaciol. 2009, 55, 666–680. [Google Scholar] [CrossRef] [Green Version]
- Abdullah, T.; Romshoo, S.A.; Rashid, I. The satellite observed glacier mass changes over the Upper Indus basin during 2000–2012. Sci. Rep. 2020, 10, 41285. [Google Scholar] [CrossRef] [PubMed]
- Kumar, R.; Singh, S.; Kumar, R.; Singh, A.; Randhawa, S. Surface Mass Balance Modelling at Naradu Glacier, Western Himalaya. Sci. Rep. 2021, 11, 12710. [Google Scholar] [CrossRef]
- Zhang, Y.; Yukiko., H.; Fujita, K.; Liu, S.Y.; Qiao., L. Heterogeneity in supraglacial debris thickness and its role in glacier mass. changes of the Mount Gongga. Sci. China Earth Sci. 2016, 59, 170–184. [Google Scholar] [CrossRef]
- Huang, L.; Li, Z.; Han, H.; Tian, B.; Zhou, J. Analysis of thickness changes and the associated driving factors on a debris covered glacier in the Tienshan Mountain. Remote Sens. Environ. 2018, 206, 63–71. [Google Scholar] [CrossRef]
- Nuimura, T.; Fujita, K.; Yamaguchi, S.; Sharma, R. Elevation changes of glaciers revealed by multitemporal digital elevation models calibrated by GPS survey in the Khumbu region, Nepal Himalaya, 1992–2008. J. Glaciol. 2012, 58, 648–656. [Google Scholar] [CrossRef] [Green Version]
- Vincent, C.; Wagnon, P.; Shea, J.M.; Immerzeel, W.W.; Kraaijenbrink, P. Reduced melt on debris-covered glaciers: Investigations from Changri Nup Glacier, Nepal. Cryosphere 2016, 10, 1845–1858. [Google Scholar] [CrossRef] [Green Version]
- Kääb, A.; Berthier, E.; Nuth, C.; Gardelle, J.; Arnaud, Y. Contrasting patterns of early twenty-first-century glacier mass change in the Himalayas. Nature 2012, 488, 495–498. [Google Scholar] [CrossRef]
- Muhammad, S.; Tian, L.D.; Ali, S.; Latif, Y.; Wazir, M.A.; Goheer, M.A.; Saifullah, M.; Hussain, I.; Liu, S.Y. Thin debris layers do not enhance melting of the Karakoram glaciers. Sci. Total Environ. 2020, 746, 141119. [Google Scholar] [CrossRef]
- Bhattacharya, A.; Bolch, T.; Mukherjee, K.; King, O.; Yao, T. High mountain Asian glacier response to climate revealed by multi-temporal satellite observations since the 1960s. Nat. Commun. 2021, 12, 4133. [Google Scholar] [CrossRef]
Figure 1.
The geographical location of study area. The background is a Landsat OIL image acquired in 2019 with a false color composite of bands 432.
Figure 1.
The geographical location of study area. The background is a Landsat OIL image acquired in 2019 with a false color composite of bands 432.
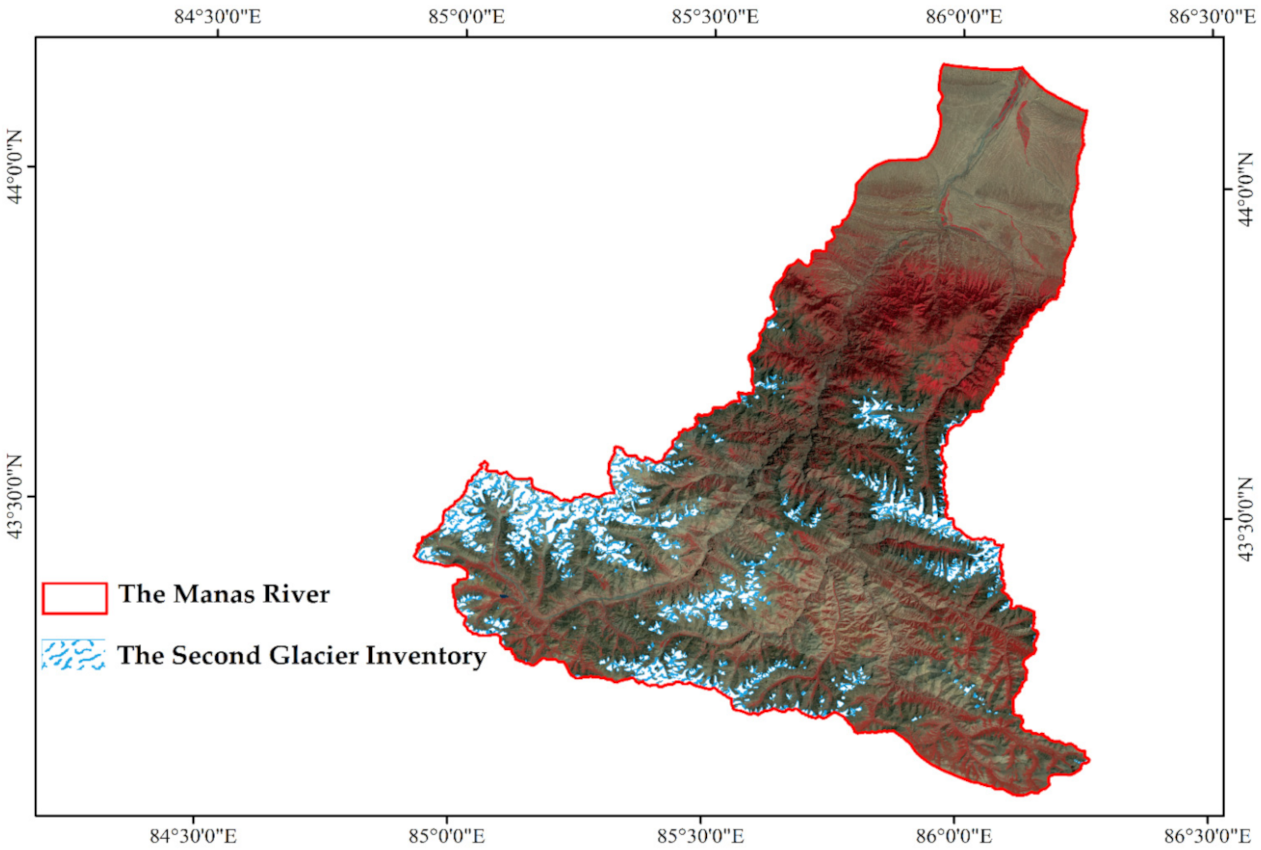
Figure 2.
The flow chart of estimating glacier mass balance.
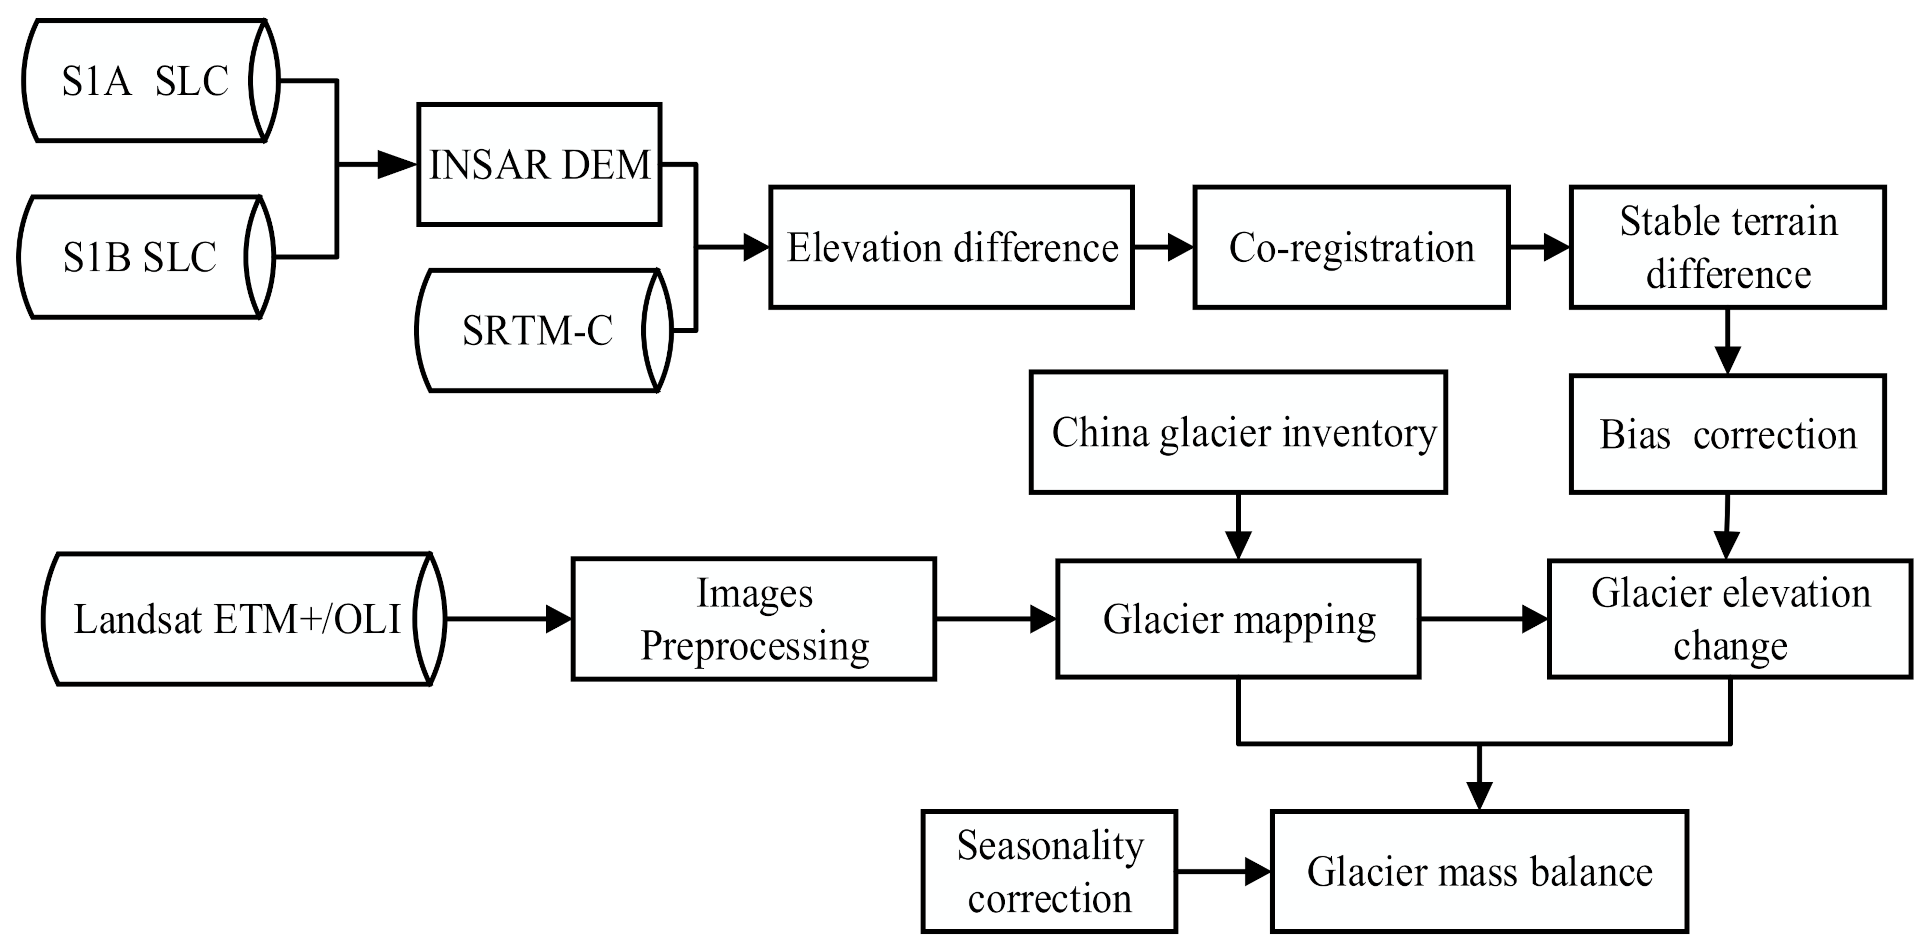
Figure 3.
The relationships between elevation difference and slope and maximum curvature.
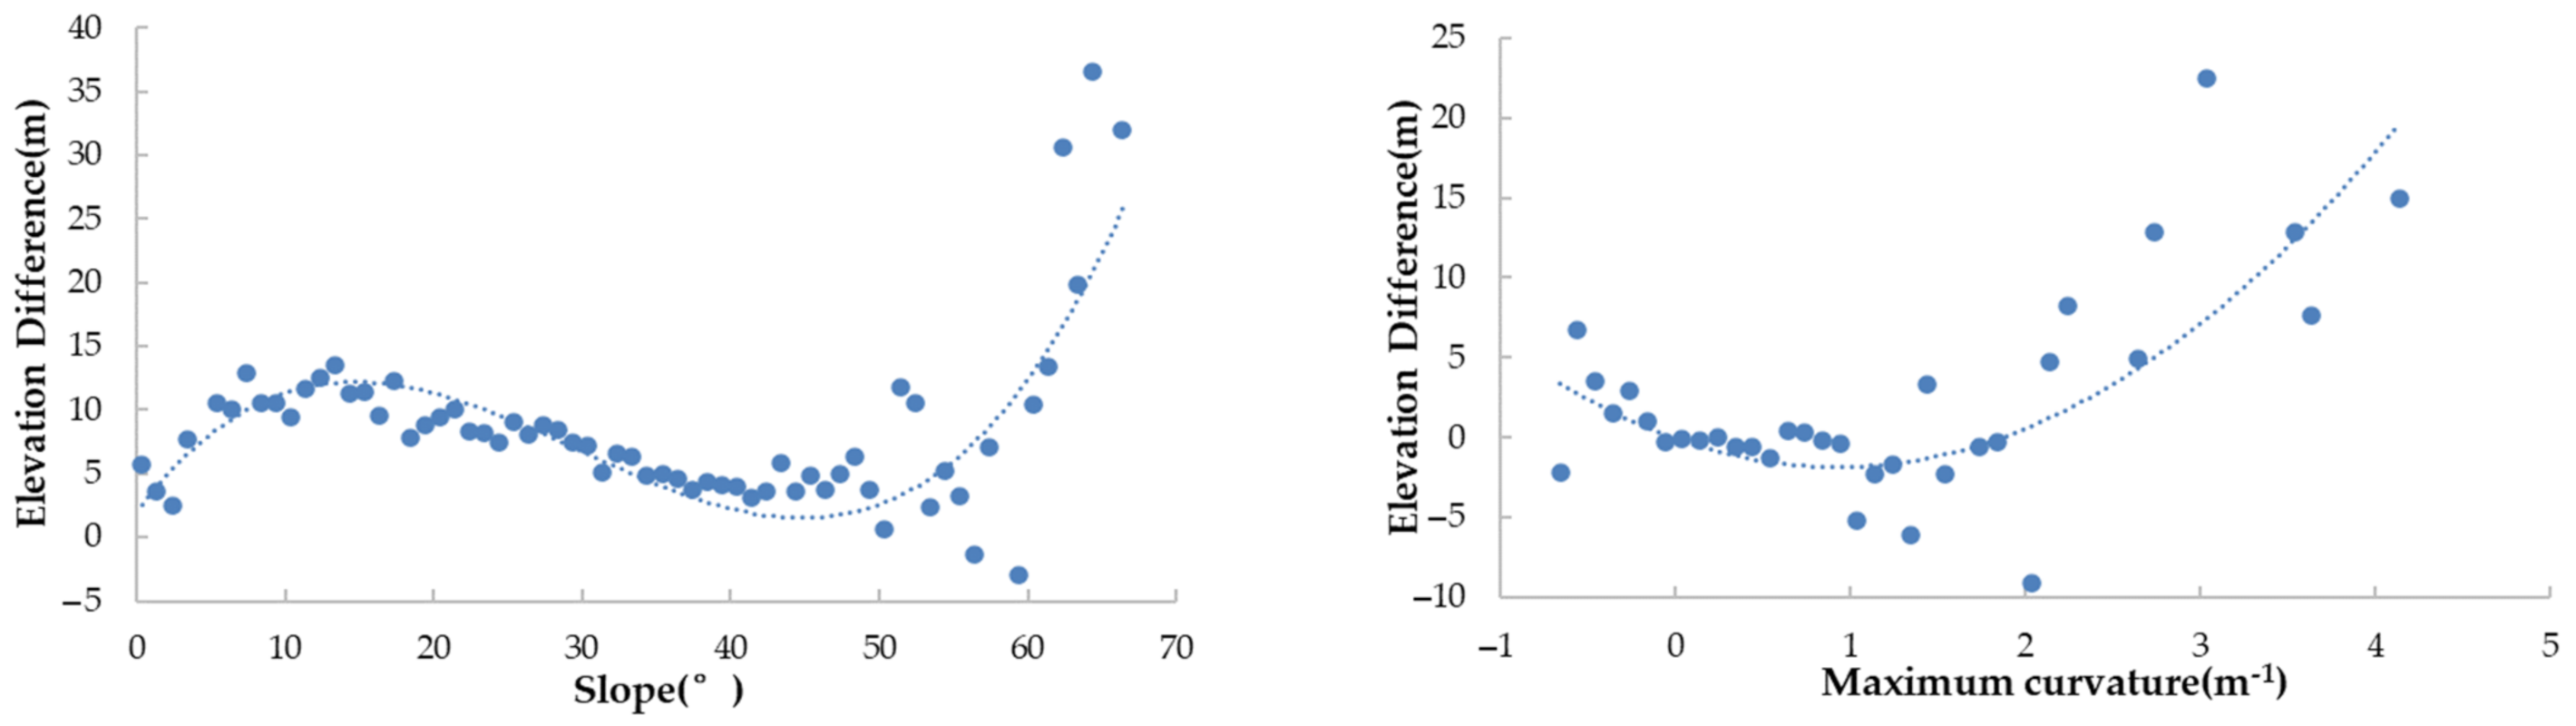
Figure 4.
Glacier elevation changes between February 2000 and August 2019.

Figure 5.
The mean glacier elevation difference in each 100 m elevation bin.
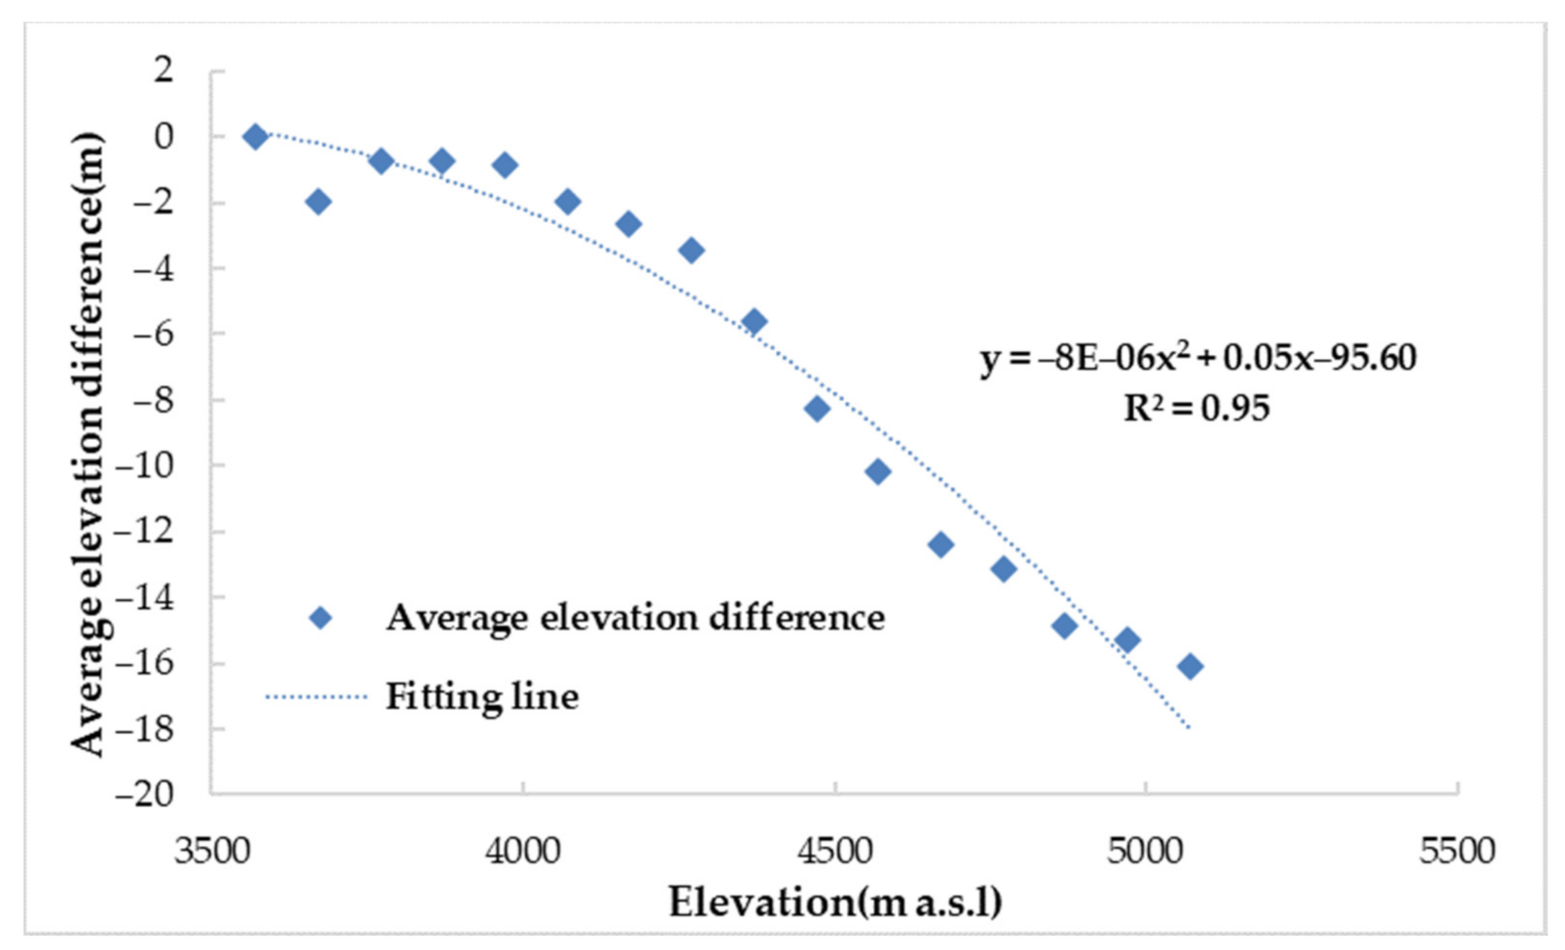
Figure 6.
The relationship between elevation difference and slope.
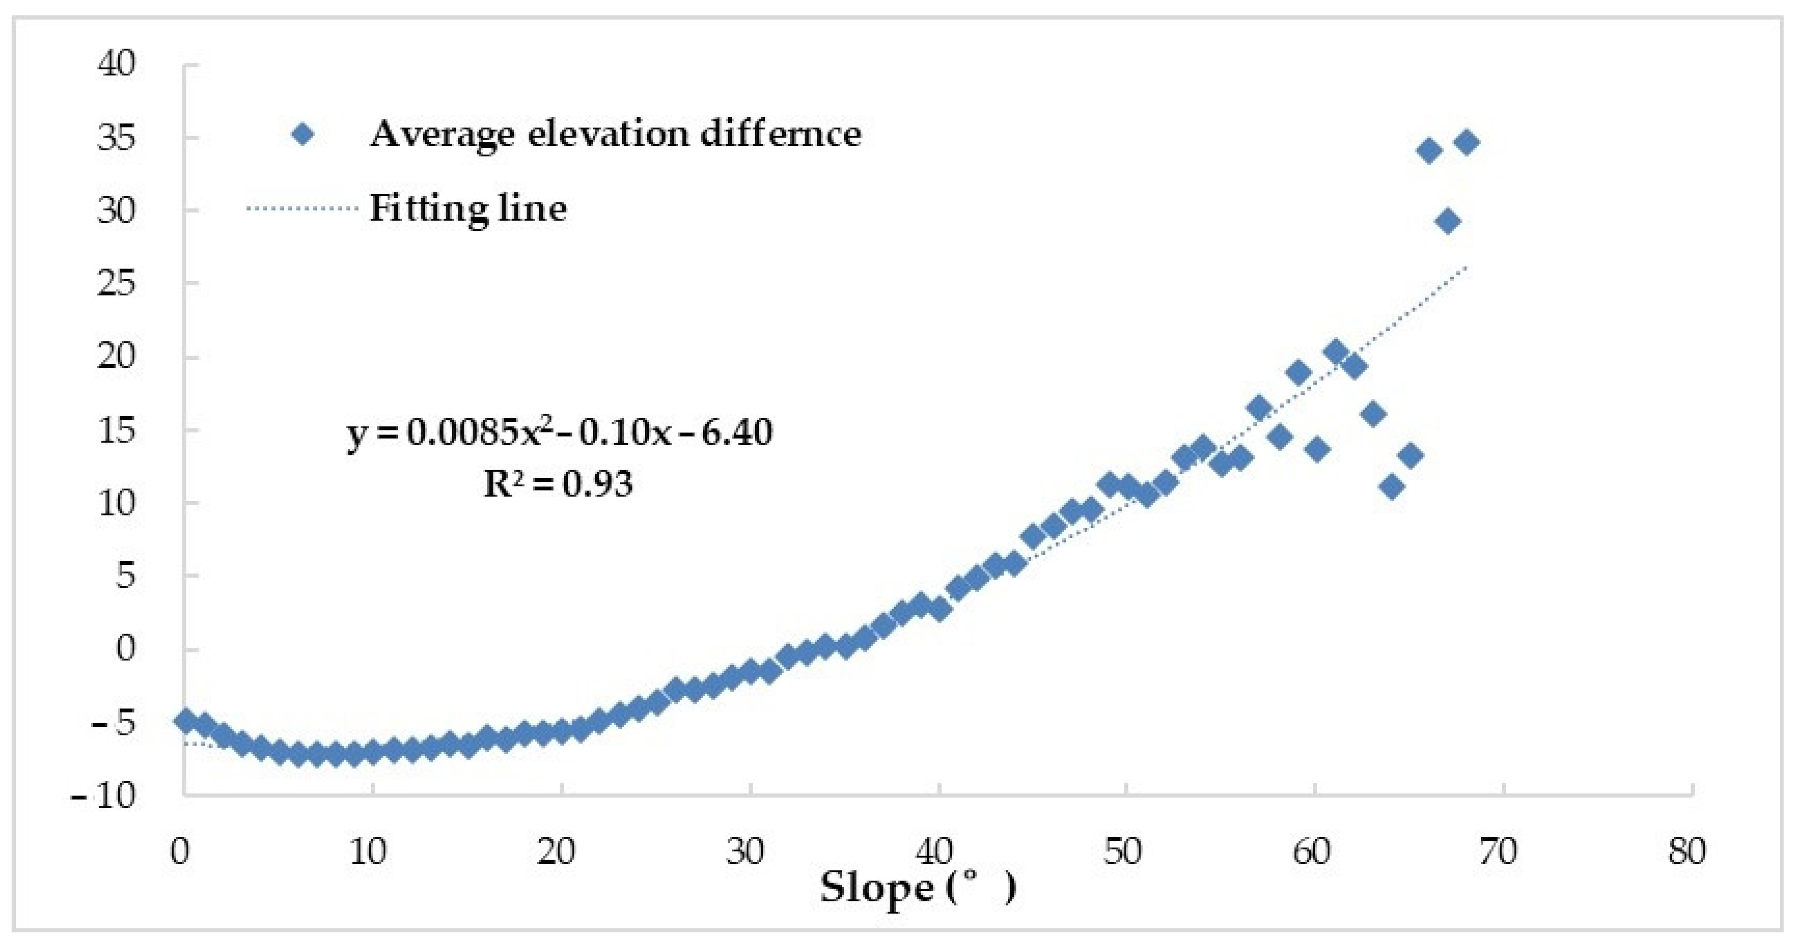
Figure 7.
The slope distribution map of the glacier area.
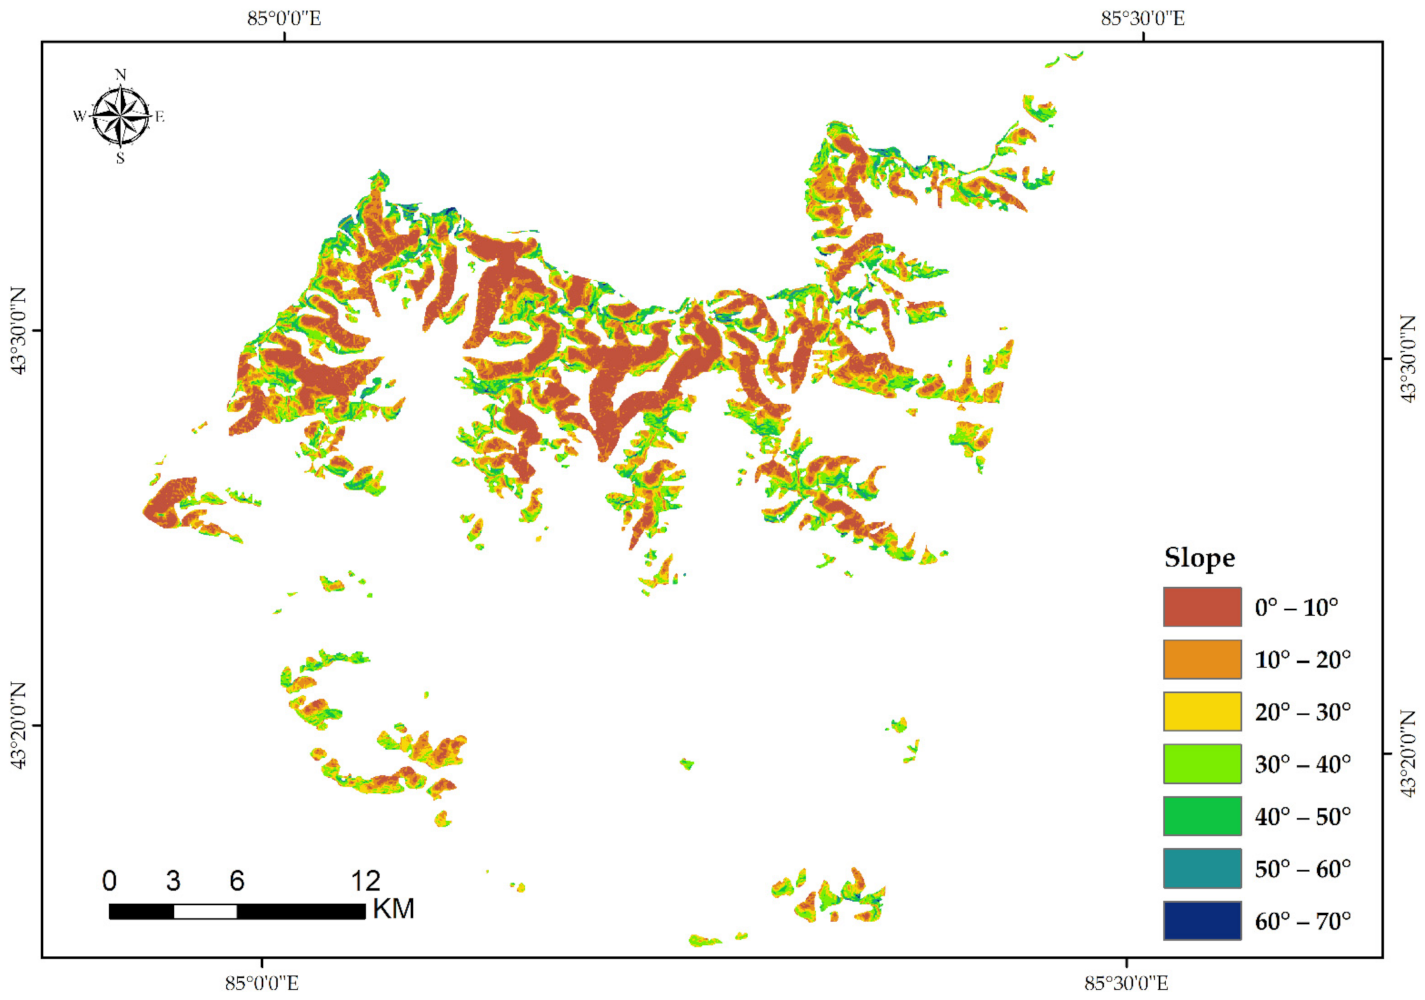
Figure 8.
The average elevation difference and of the percentage of slope categories.
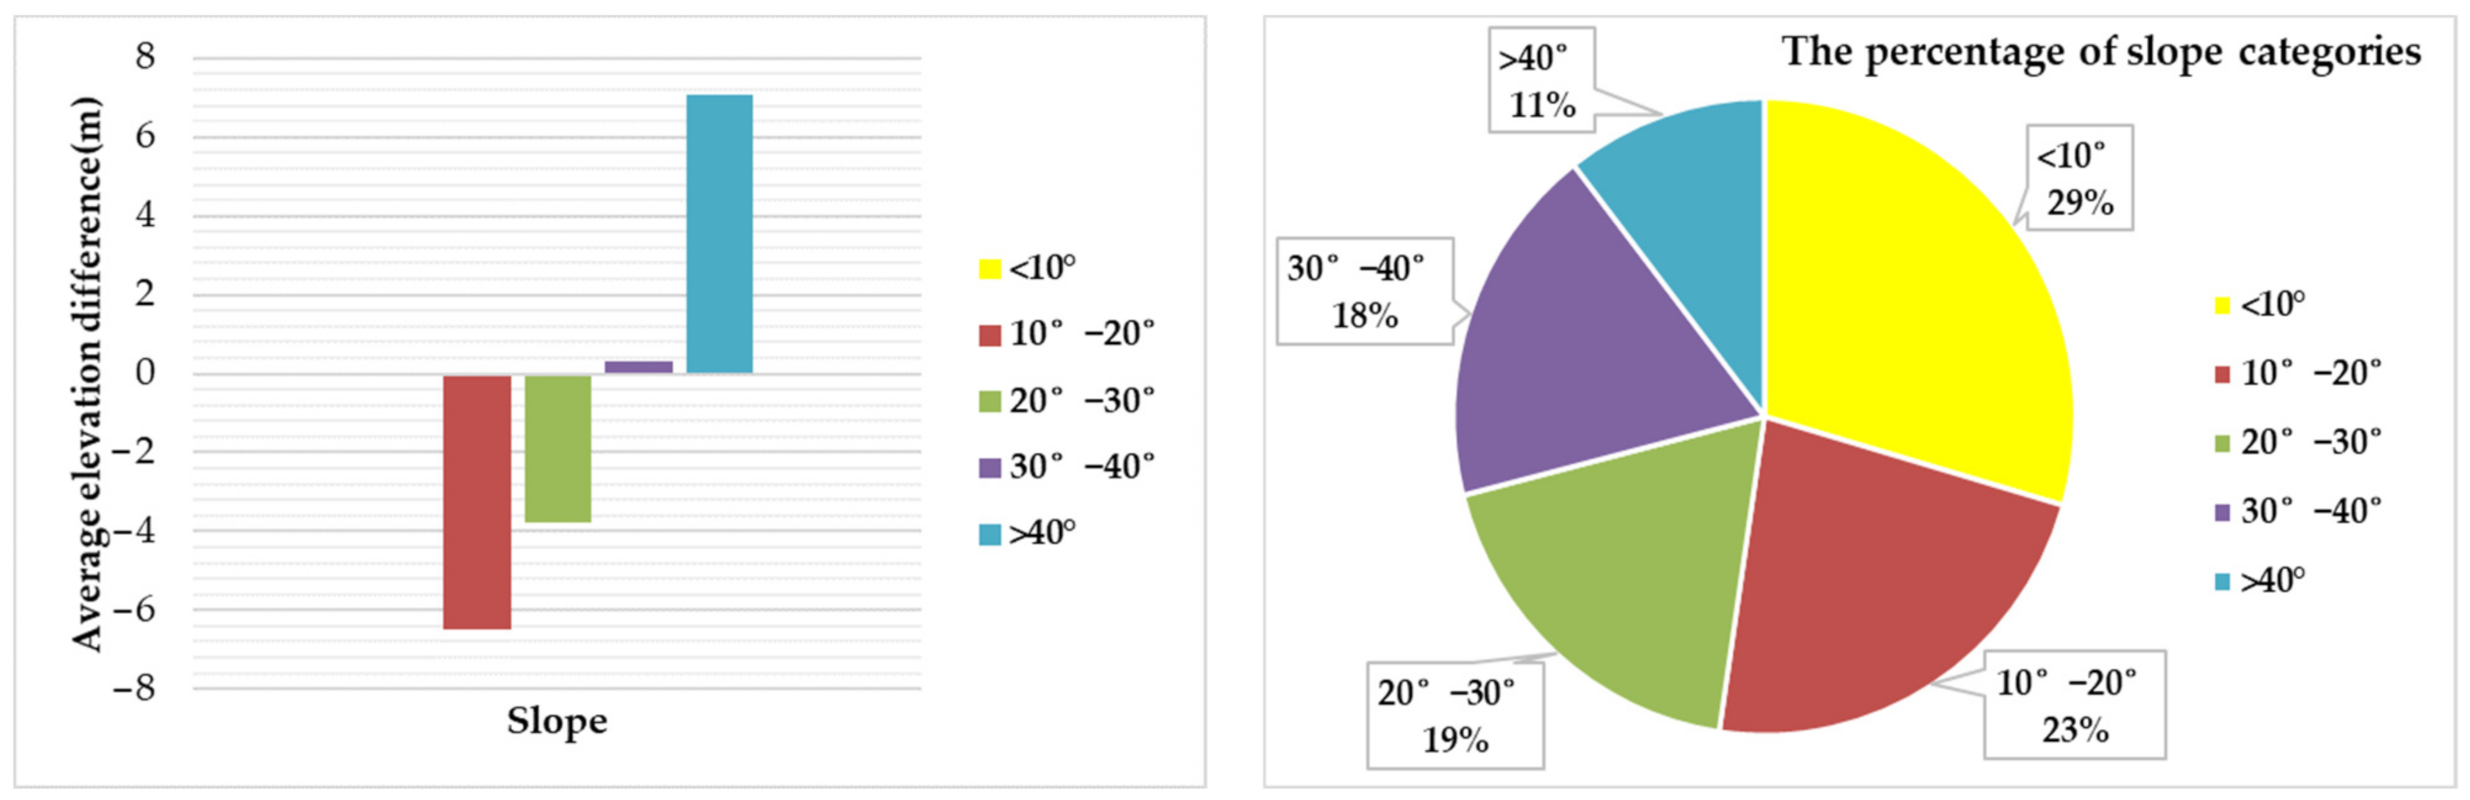
Figure 9.
The relationship between elevation difference and aspect.

Figure 10.
The aspect distribution map of glacier area.
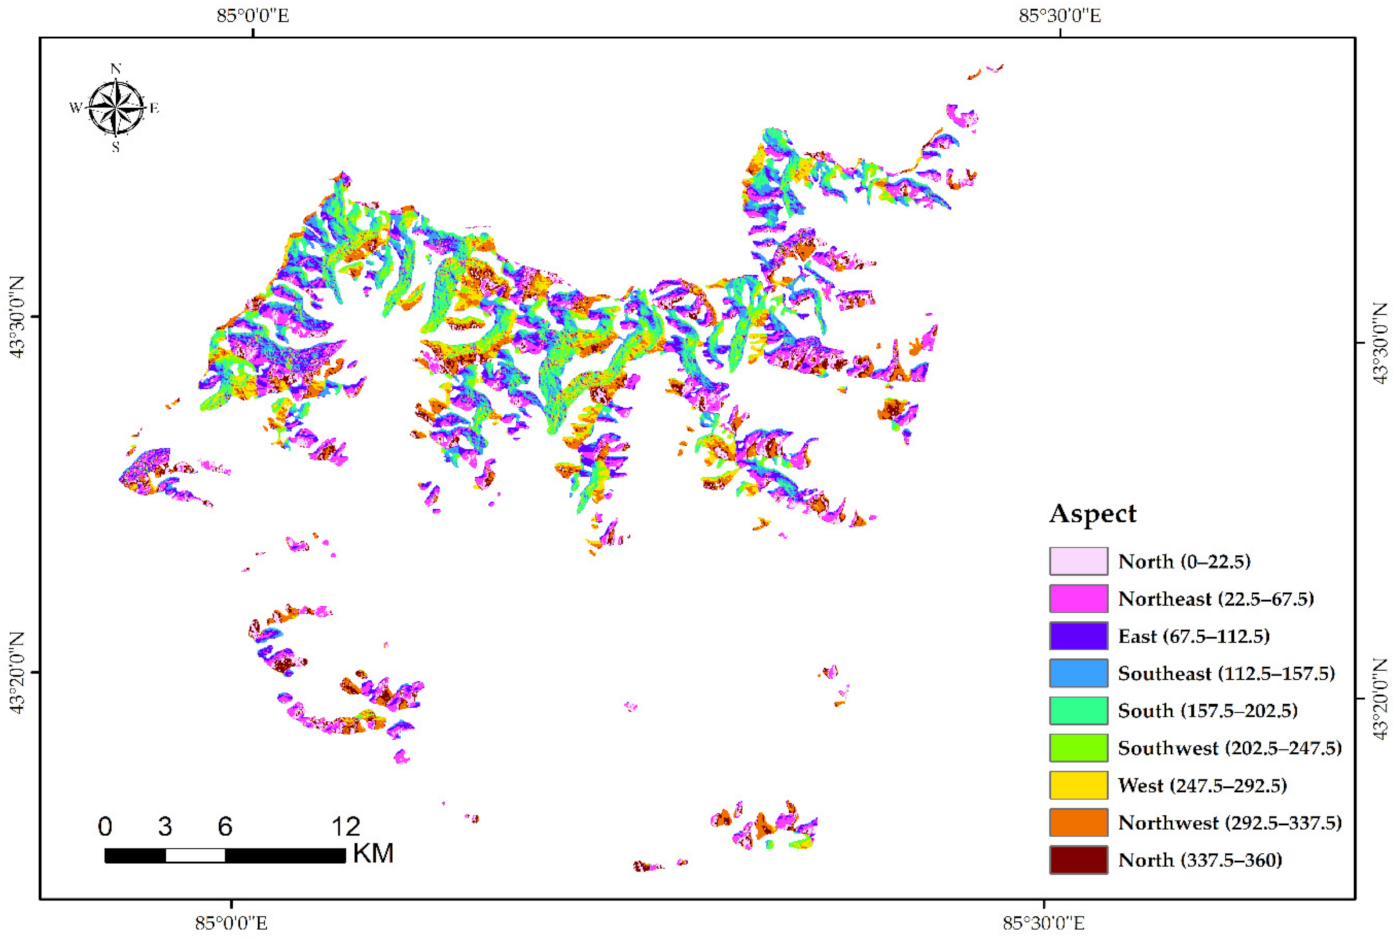
Figure 11.
The average glacier elevation difference and the percentage for each aspect category in the glacier area.
Figure 11.
The average glacier elevation difference and the percentage for each aspect category in the glacier area.
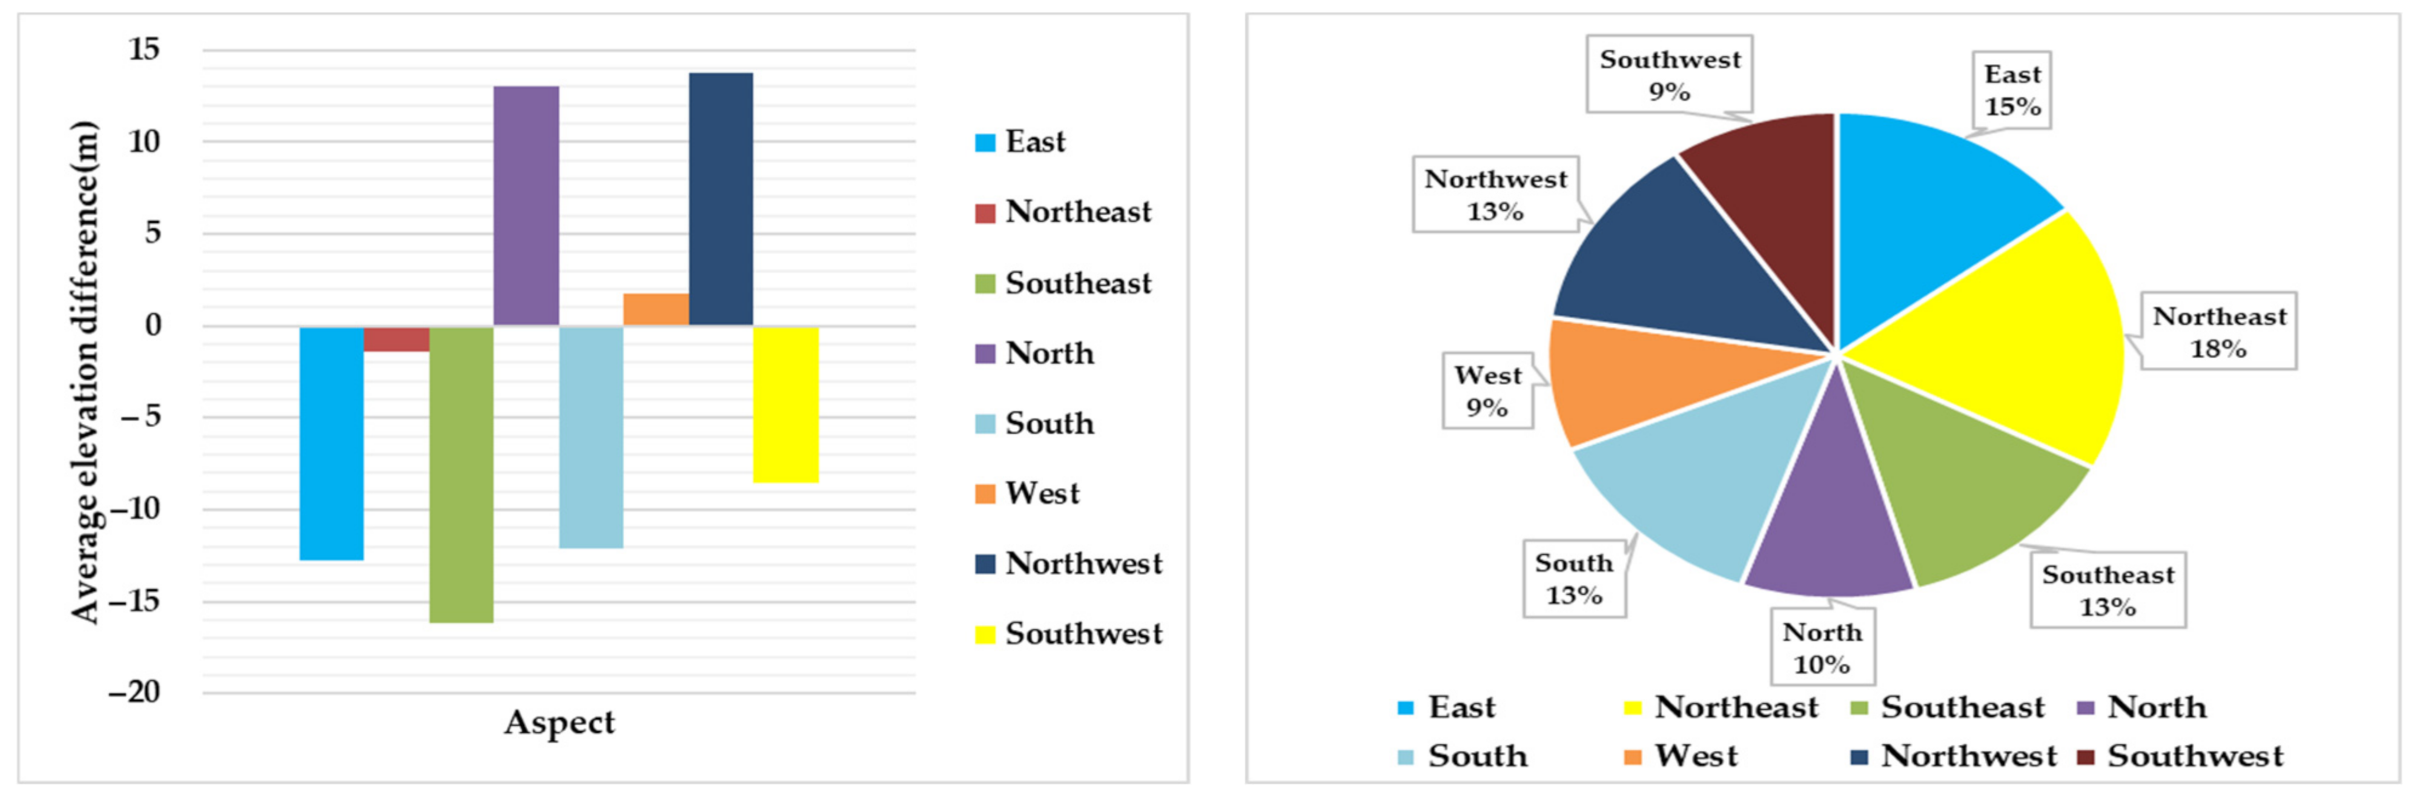
Figure 12.
The mean glacier elevation difference, the percentage of elevation categories, the mean slope and the percentage of south slope of different elevation ranges in glacier area.
Figure 12.
The mean glacier elevation difference, the percentage of elevation categories, the mean slope and the percentage of south slope of different elevation ranges in glacier area.


Table 1.
The sources of data used in this study.
| Data | Date | Data Sources |
|---|---|---|
| Landsat ETM+ | 26 February 2022 | https://www.gscloud.cn/ |
| Landsat 8 | 26 February 2022 | https://www.gscloud.cn/ |
| Sentinel 1A/1B | 21 February 2022 | https://scihub.copernicus.eu/ |
| SRTM-C | 11 August 2021 | https://lpdaac.usgs.gov/ |
| ICESat/GLAS | 11 December 2021 | https://lpdaac.usgs.gov/ |
| Glacier Inventory | 28 December 2021 | http://www.cryosphere.csdb.cn/ |
Table 2.
SAR data used in this study.
| Sensor | Acquisition Date | Pass | Polarisation |
|---|---|---|---|
| Sentinel 1A | 16 August 2019 | Ascending | VV + VH |
| Sentinel 1B | 10 August 2019, 22 August 2019 | Descending | VV + VH |
Table 3.
The elevation accuracy for INSAR DEM derived from 10 August 2019 and 16 August 2019 Sentinel 1A/1B satellites.
Table 3.
The elevation accuracy for INSAR DEM derived from 10 August 2019 and 16 August 2019 Sentinel 1A/1B satellites.
| INASR DEM | Minimum (m) | Maximum (m) | Mean (m) | STD (m) | RMSE (m) |
|---|---|---|---|---|---|
| ICESat | −16.86 | 25.58 | −2.09 | 4.89 | 5.21 |
| SRTM | −5.92 | 6.20 | −0.08 | 2.21 | 2.21 |
Table 4.
The elevation accuracy for INSAR DEM derived from 16 August 2019 and 22 August 2019 Sentinel 1A/1B satellites.
Table 4.
The elevation accuracy for INSAR DEM derived from 16 August 2019 and 22 August 2019 Sentinel 1A/1B satellites.
| INASR DEM | Minimum (m) | Maximum (m) | Mean (m) | STD (m) | RMSE (m) |
|---|---|---|---|---|---|
| ICESat | −13.67 | 26.23 | 2.14 | 4.50 | 4.98 |
| SRTM | −4.75 | 7.54 | −0.12 | 2.15 | 2.15 |
Table 5.
The glacier elevation change and mass balance at different elevation bin.
| Elevation (m a.s.l) | dh/dt (m a−1) | Number | Mass Balance (m w.e.a−1) |
|---|---|---|---|
| 3500–4000 | −0.04 | 52956 | −0.04 |
| 4000–4500 | −0.15 | 194775 | −0.17 |
| 4500–5000 | −0.54 | 29733 | −0.50 |
| >5000 | −0.79 | 692 | −0.69 |
Publisher’s Note: MDPI stays neutral with regard to jurisdictional claims in published maps and institutional affiliations. |
© 2022 by the authors. Licensee MDPI, Basel, Switzerland. This article is an open access article distributed under the terms and conditions of the Creative Commons Attribution (CC BY) license (https://creativecommons.org/licenses/by/4.0/).
Share and Cite
MDPI and ACS Style
Yan, L.; Wang, J.; Shao, D. Glacier Mass Balance in the Manas River Using Ascending and Descending Pass of Sentinel 1A/1B Data and SRTM DEM. Remote Sens. 2022, 14, 1506. https://doi.org/10.3390/rs14061506
AMA Style
Yan L, Wang J, Shao D. Glacier Mass Balance in the Manas River Using Ascending and Descending Pass of Sentinel 1A/1B Data and SRTM DEM. Remote Sensing. 2022; 14(6):1506. https://doi.org/10.3390/rs14061506
Chicago/Turabian StyleYan, Lili, Jian Wang, and Donghang Shao. 2022. "Glacier Mass Balance in the Manas River Using Ascending and Descending Pass of Sentinel 1A/1B Data and SRTM DEM" Remote Sensing 14, no. 6: 1506. https://doi.org/10.3390/rs14061506
Note that from the first issue of 2016, this journal uses article numbers instead of page numbers. See further details here.