
An Assessment of Electric Power Consumption Using Random Forest and Transferable Deep Model with Multi-Source Data


1
School of Computer Science, China University of Geosciences, Wuhan 430074, China
2
Hubei Key Laboratory of Intelligent Geo-Information Processing, China University of Geosciences, Wuhan 430074, China
3
Key Laboratory of Digital Earth Science, Aerospace Information Research Institute, Chinese Academy of Sciences, Beijing 100094, China
4
University of Chinese Academy of Sciences, Beijing 100049, China
*
Author to whom correspondence should be addressed.
Remote Sens. 2022, 14(6), 1469; https://doi.org/10.3390/rs14061469
Submission received: 13 January 2022
/
Revised: 14 March 2022
/
Accepted: 16 March 2022
/
Published: 18 March 2022
(This article belongs to the Special Issue Monitoring and Assessment of Energy Consumption through Remote Sensing)
Abstract
:Reliable and fine-resolution electric power consumption (EPC) is essential for effective urban electricity allocation and planning. Currently, EPC data exists mainly as statistics with low resolution. Many studies estimate fine-resolution EPC based on the positive correction between stable nighttime light and EPC distribution. However, EPC is related to various factors other than nighttime light and is spatially non-stationary. Yet this has been ignored in current research. This study developed a novel method to estimate EPC at 500 m resolution by considering spatially non-stationary through fusing geospatial data and high-resolution satellite images. Deep transfer learning and statistical methods were used to extract socio-economic, population density, and landscape features to describe EPC distribution from multi-source geospatial data. Finally, a random forest regression (RFR) model with features and EPC statistics is established to estimate fine-resolution EPC. A study area of Shenzhen city, China, is employed to evaluate the proposed method. The between predicted EPC and statistical EPC is at sub-district level in 2013, which is higher than an existing EPC product (Shi’s product) with , illustrating the effectiveness of the proposed method. Moreover, the EPC distribution for Shenzhen from 2013 to 2019 was estimated. Furthermore, the spatiotemporal dynamic of EPC was analyzed at the pixel and sub-district levels.
1. Introduction
The rapid progress of industrialization and urbanization has led to a significant increase in urban electric power consumption (EPC). According to a survey conducted by the National Bureau of Statistics of China, the per capita domestic electricity consumption has increased from 515.0 kWh in 2013 to 732.1 kWh in 2019 [1]. The increase in EPC is not only related to economic activity but also climate change. The Sustainable Development Goal 11 (SDG 11) calls for making cities inclusive, safe, resilient, and sustainable by 2030 [2]. Ensuring that residents have access to electricity service facilities is essential for achieving this goal. Accurate and reliable EPC distribution estimation on a fine-scale provides the data basis for achieving this goal. In this study, EPC mainly referred to domestic usage and was closely related to residents, which were closely related to the urban economy, population, and living environment. Current urban EPC data mainly exists as statistical data in the form of administrative units, which cannot meet the need for fine-scale urban sustainability research due to coarse resolution. Therefore, developing a fine-scale gridded EPC estimation method is urgently needed.
With the development of remote sensing satellite technology, abundant nighttime light data has provided a new way to conduct socio-economic spatialization research. Previous studies have demonstrated a strong positive correction between nighttime light intensity and EPC at multiple levels [3,4], and the relationship between EPC and nighttime light intensity has been based on linear multiple regression models built to estimate the EPC distribution [5]. The Defense Meteorological Satellite Program/Operational Linescan System (DMSP/OLS) and Suomi National Polar-orbiting Partnership Visible and Infrared Imager/Radiometer Suite (Suomi NPP-VIIRS) imagery are primary data sources in EPC distribution research [6]. Letu et al. [7] found that light areas on DMSP/OLS imagery in Asia were highly correlated with EPC distribution. Furthermore, Sahoo et al. [8] estimated EPC in Uttar Pradesh, India using annual Suomi NPP-VIIRS nighttime light composites. In addition, some researchers utilized nighttime light data to achieve global EPC mapping: Shi et al. [5] assumed that levels of urban development were similar worldwide and divided the world into 40 sub-regions to estimate the global EPC distribution from DMSP-OLS nighttime stable data. Similarly, Hu et al. [9] adopted a local adaptive correction method for nighttime light data (using different correction strategies for each local area) and established a linear relationship between nighttime light and statistical data to achieve a global EPC estimation. Lu et al. [10] utilized nighttime lights in connection with population and built datasets to map EPC at a spatial resolution of 1 km.
However, the above studies assumed spatial stability of nighttime light and population variables. The relationship between nighttime light intensity and EPC is spatial and non-stationary, but current research has ignored this. Researchers have constructed a relationship between EPC and nighttime light intensity based on linear models to achieve regional EPC estimation for the positive correlation between nighttime light intensity and EPC. The accuracy of EPC estimation is limited because the complexity of interactions between EPC and nighttime light data has not been completely considered. Additionally, current methods assume that EPC is only related to the brightness of nighttime light and do not consider other related factors, leading to low accuracy.
Several studies have demonstrated that population, economy, and living landscape are the main factors affecting urban development in China [11,12]. Furthermore, the EPC distribution is closely related to urban development [13]. High-resolution satellite imagery contains an abundance of information about landscape features that could be correlated with economic activities [14,15]. Hence, exploring an appropriate estimated model based on multi-source factors and considering spatial non-stationary data would provide a better understanding and a new insight for grid EPC estimation. Meanwhile, the development of deep learning technology provides support for image semantic feature extraction. Landscape features can be extracted from high-resolution remote sensing images. The nighttime light data and population density products can reflect the economic position and population distribution, respectively.
In summary, this study develops a novel approach to estimate EPC distribution at pixel level with multi-source geospatial data. To estimate EPC distribution more accurately, many factors are considered, including socio-economic factors and landscape factors. The main steps of the method were as follows. First, the monthly Suomi NPP-VIIRS raw data for 2013–2019 were inter-calibrated and were synthesized annual data. Second, calibrated annual synthetic images and WorldPop population products were used to characterize economic and population density characteristics. Landscape features relating to EPC changes were extracted from high-resolution satellite imagery using the transfer learning of ResNet-50 deep neural network model. Third, considering the non-linear relationship between economic, population, and landscape features and EPC estimation, a random forest regression (RFR) model was adopted to estimate the EPC at a spatial resolution of 500 m with EPC statistics. The spatial resolution of the pixel-level EPC results corresponds to the Suomi NPP-VIIRS nighttime light images. Living landscape features, population distribution features, and socio-economic features at the sub-district level were used as independent variables. All electricity consumption statistics at the sub-district level were used as the dependent variable. Finally, the trained RFR model is used to estimate pixel-level EPC from 2013 to 2019. This study evaluated the estimation results against an existing EPC product quantitatively and qualitatively.
2. Study Area and Data
2.1. Study Area
Shenzhen, China, was selected as the study area, which is located in southern Guangdong Province in Southern China adjacent to Hong Kong (Figure 1). In 2019, it consisted of nine districts, covering an area of 1997.47 km2, with a total resident population of 13.0266 million. It experienced rapid electricity energy consumption growth in recent years and is one of the most economically efficient cities in mainland China. The region boundary data used in this study was the sub-district administration, which is the minor administrative division that belongs to the local township division. According to the most recent administrative district boundary data, there are 73 sub-districts in Shenzhen [16]. Some new sub-districts were merged, and 55 sub-districts were used in the final analysis to ensure the sub-district data consistency from 2013 to 2019.
2.2. Data Source
Detailed information regarding the datasets used in this study has been shown in Table 1, which shows three types: Geographic Information System (GIS) data (vector format), statistics, and remote sensing imagery (raster format). GIS data included Shenzhen administrative boundaries that exist in vector format. Statistics included demographics and annual per capita domestic electric power consumption data collected from the National Bureau of Statistics. Remote sensing data existed in raster format, including Suomi NPP-VIIRS nighttime light data, high-resolution satellite images from Google Static Maps, and WorldPop gridded population data.
2.2.1. GIS Data and Statistics
- Administrative boundaries. Shenzhen administrative boundaries were used for two reasons. First, they restricted the spatial scope of the data used, and second, they stratified the data, which ensured that features from the raster dataset were on a sub-district level administrative district (level 4 in China). The administrative unit exists as a polygon and is in the World Geodetic System 1984 (WGS 84) geographic coordinate system (EPSG:4326).
- Electric power consumption data. National Bureau of Statistics provides annual per capita power consumption based on power consumed by the population at the national level. Therefore, in this study, the EPC at sub-district scale was calculated by multiplying the annual per capita domestic electricity consumption and resident population. EPC statistics from 55 sub-districts were obtained for the training model. This data was used as a label for training the RFR model and was used to calibrate results for the EPC estimation. The number of electricity scales (unit: kWh) was used to present local electricity energy consumption levels. Figure 1a maps the sub-district level EPC covering Shenzhen in 2016.
- Housing price data. The house price data in Shenzhen is obtained from the Fang.com website (https://Fang.com/) (accessed on 10 February 2021), which is the largest online housing market website in China. The data is vector point format with longitude, latitude, and house price. An average total of 8519 sets of valid data are obtained after preprocessing every year.
2.2.2. Remote Sensing Imagery
- Nighttime light imagery. Nighttime light can reveal regional EPC to a certain extent [17]. Accordingly, nighttime light imagery serves as a critical data source for EPC estimation in this study. Currently, there is much multi-source nighttime light data available. However, considering the limitations of data quality, spatial resolution, and temporal continuity, Suomi NPP-VIIRS nighttime light data was selected. This data was obtained using a new generation of US polar-orbiting operating environment project satellite (National Polar-orbiting Operational Environmental Satellite System Preparatory Project, NPP). The VIIRS provided by NPP can receive nearly 22 bands of image data, among which the day/night band can identify even weak light sources. The spatial resolution of the nighttime light products is 500 m. Monthly Suomi NPP-VIIRS composite products were used in this study, which was a one-month interval from 2013 to 2019. Due to the increase in spatial resolution, noise in the original data was unavoidable. The noise here mainly refers to the light seen from the earth and not from a stable light source (such as light from flames and gas burning). Therefore, to ensure the best results, it was necessary to remove noise from the original data. The process used to do so has been described in detail in the data processing section.
- High-resolution satellite imagery. High-resolution satellite imagery contain rich semantic information about the building environment on the ground [18]. The urban landscape environment can also reflect the gap between the rich and poor, which can indirectly reflect electricity consumption [19]. Google Earth provides a rich source of high-resolution satellite imagery and is constantly updated. The high-resolution satellite imagery was utilized in our method to extract surface observation features [18]. Considering the research unit and the presence of noise in super-spatial resolution remote sensing data, the Google Static Maps covering Shenzhen city at a zoom level of 14 (spatial resolution of 17 m × 17 m) were used. Datasets can be downloaded via the Google Static Maps API (https://developers.google.com/maps/documentation/static-maps/intro?hl=zh-cn/) (accessed on 1 May 2021) with three multispectral bands (red, green, blue).
- Gridded population. WorldPop population data, which holds population density data from AfriPop, AsiaPop, and AmeriPop mapping and started in 2013 with a spatial resolution of 100 m (http://www.worldpop.org.uk/) (accessed on 1 May 2021). This open archive of spatial demographic datasets for Central and South America, Africa, and Asia is intended to support development, disaster response, and health applications.
3. Methodology
The proposed approach consists of three main steps (see Figure 2): (1) data processing and feature extraction was conducted for multi-source geospatial data (house price vector data, Suomi NPP-VIIRS data, high-resolution satellite imagery, and grid population data). Especially, a multi-step CNN based transfer learning model is adopted to extract the landscape features for high resolution remote sensing images together with nighttime light data; (2) the RFR model is used to construct the EPC estimation model based on the economic, landscape, and population features obtained from Step (1); and finally (3) the accuracy evaluation of the EPC estimation model at the sub-district scale is conducted. Multi-source data covering a typical city in Shenzhen, China, is used in the experiment. This study also analyzed the spatiotemporal dynamics of EPC from 2013 to 2019.
3.1. Data Processing
The preprocessing for remote sensing data and gridded population products is an essential step before feature extraction. This study used the geographic coordinate system and spatial resolution of Suomi NPP-VIIRS nighttime light data as references for the EPC map. First, all data were calibrated by the data processing tools in ArcGIS software, resulting in the same geographic coordinate system. Then, based on the administrative boundaries of Shenzhen, all satellite images were extracted using the Extract-by-Mask tool in ArcGIS software. All data was organized within the exact Shenzhen geographic boundaries and under a unified geographic coordinate system.
The increased spectral resolution of Suomi NPP-VIIRS nighttime light imagery effectively avoids the saturation of pixels in the city center. Nevertheless, there were still outlier values and abnormal value pixels that needed to be corrected. The Suomi NPP-VIIRS product’s official website provides the annual synthetic data products after correction for 2015 and 2016. Therefore, this study conducted raw nighttime monthly image composite data calibration and synthesized annual data from the calibrated data. The specific method is as follows. First, the monthly data was averaged to produce nighttime annual image composites. Lighting data in China is seriously distorted (pixel values are 0) due to the influence of clouds, which occurs in May, June, and July [20]. Therefore, this study eliminated the data from May to July and synthesized the annual data using the other nine months of each year in the synthetic annual data processing. The calculation formula was as follows:
where represents the ith month light brightness value, is the average light brightness value in the jth year, and j varies from 2013 to 2019, excluding 2015 and 2016.
Second, outliers in the annual synthetic data were calibrated based on the 2015 and 2016 global annual calibrated composites data provided by the Suomi NPP-VIIRS official website. Calibrated composites data for 2015 and 2016 was produced into binary images via the raster-calculator tool in ArcGIS software. The binary image is an image in which negative pixels were marked as 0; otherwise, pixels were marked as 1, eliminating negative outliers in the raw nighttime light composites data. The raw nighttime light composites data for 2014 and 2017 were multiplied by the corresponding pixel values of calibrated composites data for 2015 and 2016 to eliminate negative outliers. Similarly, negative outliers processing was conducted on the nighttime light composites data for 2013–2019.
Third, the outliers in the annual synthetic data are corrected according to the maximum nighttime light brightness of major cities. This preprocessing was mainly based on two assumptions: first, there was an assumption that pixels with stable nighttime light that appeared for a long time in a year were worth keeping. However, pixels with abnormal values that suddenly changed in value, which may have been caused by weather and other factors, were removed. Because the nighttime light brightness value represents the economic development of an area, the instantaneous high light value or low light value cannot represent the overall economic development. Thus, the pixels with stable nighttime light that appeared for a long time in a year were worth keeping.
Next, according to economic development, maximum nighttime light brightness values in Beijing, Shanghai, and Guangzhou were used as the threshold value of the nighttime light brightness in Shenzhen. Outliers in nighttime light annual image composites were replaced using the eight-neighborhood filtering approach. It has been proved that the nighttime light intensity in Chinese cities is strongly correlated with urban economic development. The three cities of Beijing, Shanghai, and Guangzhou are the most developed in China, so it is reasonable to regard the maximum light brightness value of the three cities as extreme.
After synthesizing the annual nighttime data, these annual nighttime data are clustered. The extraction of landscape features from high-resolution images was based on the nighttime composite data clustering results. Inspired by the work of Jean et al. [14], the nighttime lighting data from 2013 to 2019 were clustered by Gaussian Mixture Model (GMM). The clustering results were analyzed based on the silhouette coefficient to determine the optimal clusters. The silhouette coefficient calculates the overall distance between clusters and neighboring clusters to verify the validity of the clustering result [21]. Given a point i, the silhouette coefficient of i was defined as follows:
where was the average distance between i and others in the same cluster, and was the minimum average distance between i and others in a different cluster. The silhouette coefficients corresponding was averaged to all points to verify the validity of cluster results. The annual nighttime lighting data are clustered considering the effect of economic development on the nighttime lighting brightness. The silhouette coefficient score corresponding to each cluster was calculated, where the number of clusters ranged from 2 to 9 (Figure 3). As illustrated in Figure 3, the silhouette coefficient score was the highest, when the cluster number was four, which means that this was the optimal cluster number. Thus, the annual nighttime composites data was clustered into four clusters. After nighttime light data clustering, the nighttime light clusters corresponding to each pixel were used as corresponding high-resolution image patch labels. The four nighttime light values clusters represent different development levels of the region, respectively. Furthermore, a different landscape environment also represents a different development level for a region. Thus, the nighttime light cluster results are used as the label data of high-resolution remote sensing images to extract the surface observation features. This paper has proved that using the nighttime light data cluster results as the label for remote sensing images can effectively extract regional economic development level characteristics.
3.2. Feature Extraction from Multi-Source Data
Spatial distribution of EPC is a complex phenomenon related to the population density, the natural environment, and the built environment. The brightness of nighttime lights has been shown to reveal the socio-economic conditions of an area [22]. Generally, places with low nighttime light have a low intensity of human activities at night and a low infrastructure density, so the poverty potential is relatively high [23]. Existing research [9,24] suggested that EPC is related to socio-economic, demographic, and built environment factors. Three types of variables from multi-source data were extracted. Table 2 lists the detailed information about those variables. Each variable was calculated at the pixel level and sub-district level. Economic variables were extracted from the nighttime light data and housing price data, respectively. Moreover, population density features related to domestic EPC were extracted from the WorldPop population product. Landscape features were extracted from the high-resolution satellite imagery via transfer learning of ResNet-50 deep neural network. Ultimately, 28 dimensional features (25 dimensional landscape features, economic features, and population density) were selected to estimate EPC. The detailed feature extraction process has been described in the following sections.
Figure 4 shows the relationship between statistical EPC and independent variables (nighttime light intensity, population density, and house price) at sub-district level. It should be noted that the mean data value of nighttime light and the maximum values of house price data in each sub-district are used. The results show that population density and house price variables are more strongly correlated with EPC than nighttime light intensity at sub-district level. However, existing studies have demonstrated a strong correlation between nighttime light intensity and EPC on a fine scale [10,25], which is also the basis for this study.
3.2.1. Social-Economic and Population Variables Extraction
Socioeconomic variabels were calculated from Suomi NPP-VIIRS and housing price data using ArcGIS software. Specifically, socio-economic variables at the sub-district level were calculated using the spatial analysis tool in ArcGIS software based on the sub-district administrative boundaries vector data. Pixel-level variables were extracted based on the spatial resolution of Suomi NPP-VIIRS nighttime light data. Pixel-level variables were calculated based on the Suomi NPP-VIIRS nighttime light data spatial resolution. This study applied the same method as nighttime light data processing to extract the maximum house price value at the pixel and sub-district level to supplement the socio-economic variables. Since the pixel block in WorldPop data corresponds to a pixel in Suomi NPP-VIIRS image, the average value of the pixel block is used as the pixel-level population density variable. Sub-district level population density is calculated by the ratio of sub-district level statistical population to the area.
3.2.2. Landscape Features Extracted Using CNN-Based Transfer Learning
High-resolution satellite images provide an abundance of living environment information about landscape features that was related to economic activity. Recently, the application of deep learning techniques to remote sensing image datasets has made significant progress in computer vision tasks [26]. However, CNN-based (convolutional neural network) deep learning techniques are usually the most effective in supervised learning task with an abundance of labeled training data [27]. The EPC statistic at sub-district level is sparse as labeled data. The generated dataset is many orders of magnitude smaller than data used in deep learning applications. Therefore, the lack of training label data makes this technique challenging. Transfer learning provides opportunities for supervised learning tasks with a small amount of labeled data [28]. This study adopted a multi-step transfer learning, where nighttime light intensities were used as a proxy for EPC. Here, the nighttime light data cluster results were used as a label for the source task in this transfer learning. This study developed a multi-step CNN-based transfer learning model that integrated high-resolution images with nighttime light to extract landscape features related to EPC distribution. Figure 5 shows the proposed approach, which consists of two parts: transfer learning (Figure 5a) and feature extraction (Figure 5b).
Following previous research [29], this study transferred two related learning tasks. Using a pretrained CNN model on a large dataset as a feature extractor has been shown to be better than training from scratch, especially when the target task has fewer labeled samples [30]. Assuming that there are two related learning tasks, called the source task and the target task , the corresponding domains are and , respectively. The purpose of transfer learning is to learn the conditional probability distribution in based on the information obtained in and ( or ). Generally, the number of labeled samples for the target task is limited and exponentially less than the labeled samples of the source task. The goal of transfer learning is to improve the learning ability of the target prediction function using knowledge from the source task.
To avoid limited sample problems, the pretrained ResNet-50 model based on a large-scale Places-365 dataset was used to initialize the weights of the proposed CNN model (Figure 5a). The high-resolution satellite images and nighttime light clustering results are applied to fine tune the CNN-based model. The approach weights from a ResNet-50 model which was pretrained on the Places-365 dataset [31] were transfer learned with all weights available except for turning during the backpropagation algorithm on high resolution images. For this transfer learning model, the source domain is the Places-365 dataset and the target domain is high-resolution imagery. The Places-365 challenge dataset has eight million training images and identifies the scene category depicted in a photograph [31]. Transfer learning processing allows researchers to relabel weights from the source domain to the target domain and adapt the backpropagation algorithm to improve the target task.
Considering the simple structure and high computational efficiency of the model, ResNet-50 was used as a classifier in this study. Compared with other variants of CNN-based models, ResNet-50 has fewer parameters and higher computational efficiency [32]. The architecture of the ResNet-50 model has been shown in Figure 6. ResNet-50 consists of 16 residual blocks, which contain a residual branch and a shortcut branch. Compared with the traditional convolution structure, there is one more shortcut branch, which is used to transmit low-level features so that the network can be trained deeply [33]. Specifically, the default input size of ResNet-50 is with three channels. The input image size was adjusted to to transfer a deep model to classify a high-resolution images patch. The rest of the structures of the model were the same.
The in-depth features useful for EPC estimation were extracted based on the pretrained model that classified nighttime light intensity classes from daytime imagery (high-resolution satellite images) (supplement in Figure 5b). Inspired by the work of Zhao et al. [34], the Principal Component Analysis (PCA) was applied to reduce the dimensionality of input data and prevent overfitting by performing an orthogonal transformation of the original features into the principal components. Following Zhao’s work [34], the minimum number of principle components (25-dimensional vector) were selected to limit the computational cost of the procedure.
The fine-tuned CNN-based model was then used as a feature extractor to extract these features. The landscape features at the pixel level and sub-district level were extracted separately using the fine-tuned CNN-based model from high-resolution images. The size of pixel is the same as Suomi NPP-VIIRS nighttime light data. Since the nighttime light data was available at a spatial resolution of nearly 500 m × 500 m cell size, our inputs were pixel tiles daytime satellite image from Google Static Maps at a zoom level of 14 (spatial resolution of 17 m × 17 m), which approximately corresponded to 0.25 km2 areas. Google imagery is acquired from the Quickbird satellite, which provides real-time high-resolution maps that facilitate the acquisition of the surface features used in this article. Because this paper aims to obtain an EPC of 500 m, it is easy to extract some redundant features from Google images with a very high resolution, which are not conducive to our direct use. Therefore, by investigating related research on surface feature extraction, 17 m resolution images are more favorable for extracting surface features of middle-level semantics.
Due to the irregular sub-district boundaries, 25 pixel tiles covering each sub-district were filtered based on the rule that the overlapping area of the tile and the sub-district accounts for more than sixty percent of the tile area. The daytime satellite images used in this study were primarily collected from 2013 to 2019. Each of these pixel tiles were matched with nighttime light images using coordinates. This ensures that each pixel tile from the high-resolution image corresponds to each pixel of the nighttime light image. The output from the pretrained ResNet-50 network for each subset of images consisted of a 4096-dimensional vector, which was used as an input to the fully connected layers. The smaller 512-dimensional vector was aggregated by averaging. Batch normalization was used in all the added connected layers. This study used the CrossEntropyLoss loss function and Adam optimizer with a learning rate of and trained the network for 100 iterations. The weights of the last convolutional layer and fully connected layers were only trained. The network used a subset of images from Shenzhen, which were fed into the final full connected layers that yielded a 512-dimension vector. Finally, the PCA method was used for the 512-dimension vectors to calculate the main components of 25 dimensions used as part of the training samples for the RFR model. It should be noted that the sample labels of high-resolution remote sensing images are the nighttime light data clustering results. Moreover, the night light clustering results represent the regional economic development level. Therefore, the 25 dimensional features represent the characteristics of the built environment corresponding to different development levels expressed as FC0–FC24.
3.3. EPC Estimation Using RFR Model
The Pearson correlation coefficient and significance tests (P-values) between indicators and EPC were calculated before building the random forest model (see Table 3). The indicators include socio-economic (nighttime light and house price), landscape (FC0–FC24), and population density factors extracted in the previous section. The results showed that each factor was significant at the 0.05 level, indicating that each factor had a significant correlation with EPC. However, the Pearson correlation coefficient showed that the correlation coefficient calculated by a single factor was relatively low, indicating a low positive or negative correlation between a single factor and EPC. However, the effect of the sum of each factor on EPC was not ruled out. Existing studies have also shown that the weak correlation of a single factor cannot represent the positive effect of the combined effect of the factors on the dependent variable [34].
The association between the features and EPC at pixel level should be built to estimate the EPC distribution. This study adopts the random forest regression (RFR) algorithm to fit the EPC estimation model. RFR is a bagging ensemble learning algorithm for regression tasks, which consists of a large number of regression trees [35]. Each tree generates its prediction results, and the final prediction is made through a voting scheme. The final prediction will not be based on any single tree but on the forest, which helps avoid overfitting the model to the training dataset. It has several advantages over other machine learning methods. For example, in the RFR model, raw data does not need to be standardized, which is beneficial when processing multi-source data of different dimensions. The model has a simple structure and runs quickly. Additionally, the RFR structure is easier to understand and interpret and can be used to explain the importance of features and teaching features to the results.
The National Bureau of Statistics provides the census data for population and per capita domestic electric consumption at sub-district scale. Sub-district EPC can be obtained by multiplying the two statistics from 2013 to 2019. Thus, it is significant to estimate pixel-level EPC through sub-district EPC data. For this reason, this study takes 55 sub-districts in the study area as training samples. That is, The RFR model trained by taking the sub-district EPC in the study area as the dependent variables and the multiple features in Section 3.2 (social-economic, population density, and landscape features) as the independent variables. In this model, there are 289 decision trees and the number of variables randomly chosen to split nodes is 2. The detailed information of optimal parameters for the trained RFR model is shown in Table 4. Each unsampled sample constitutes the Out-Of-Bag (OOB) data. Prediction accuracy was evaluated by assessing OOB accuracy, which is calculated as the mean square error between the OOB data and the data used to grow the regression tree [36]. The RFR model was implemented using a Python package named scikit-learn [37]. All the variables were used to start the RFR model. Several parameters need to be determined when training the RFR model. Here, this study achieved optimal hyperparameters of RFR using the GridSearchCV method [38] using all the samples as the training data. This method randomly selects 70% of samples for training and 30% for the validation set and repeats this step for each training. Grid search refers to adjusting the parameters within the specified parameter range and using the adjusted parameters to train the model. This method finds the parameter with the highest accuracy on the validation set from all the parameters, which is a training and comparison process. This combination of training and cross-validation facilitates finding optimal parameters.
The relationship between the EPC at the sub-district scale and the multiple features was obtained by training the model. The trained model is applied to predict the EPC distribution at the pixel scale. The RFR result is the average of all the estimated values for decision trees, so the final output could not exceed the range of the output value in the training data. Further, it could not completely reach the output value range in the training data, which is an inherent limitation of the model [39]. The trained RFR model with sub-district level samples was used to predict pixel-level EPC, which will cause the predicted value to be in an inherent range. The above analysis showed that the RFR model could expand and compress the range of estimated values. The range of the estimated EPC was higher than the actual EPC. For deviations from the training model, the total EPC was normalized at the sub-district level. The normalization factor was calculated using the following Equation (3):
where was the statistical EPC for a sub-district s in year y, was the total estimated EPC for each sub-district, and was the normalization factor for a sub-district s in year y. Based on the calculated factor , the pixel-level EPC for each sub-district was estimated using the following equation:
where was the normalized EPC for i pixel for a sub-district s in year y.
4. Experimental Results
In the following sections, the proposed model has been demonstrated. This has been followed by an accuracy assessment of EPC estimation and a spatial and temporal analysis for the estimated EPC. Specifically, pixel-level EPC results were compared and evaluated with an existing EPC product, and spatiotemporal variations of EPC were examined at the sub-district level.
4.1. EPC Estimation at Pixel Scale
Figure 7a–f demonstrates the estimated EPC distribution in Shenzhen from 2014 to 2019. It reveals some areas with high concentrations of EPC, such as Futian District and Nanshan District in the center of Shenzhen. Futian District is the administrative, financial, cultural, and commercial center of Shenzhen. With the economic development of Shenzhen, its EPC distribution was generally in a growth and expansion trend from 2014 to 2019. Figure 7a1–f1 shows EPC changes in Futian District and Luohu District from 2014 to 2019. These two districts belong to the center urban area of Shenzhen. It can be seen that the high-value EPC areas marked in red are expanding continuously. This also shows that electric power consumption is also increasing with the economic development. In addition, Longgang District, located in the east of Shenzhen, is a suburb far away from the center urban area. Duo to its rapid development period from 2014 to 2019, it can be seen that EPC is growing and expanding every year.
4.2. Accuracy Assessment for EPC Estimation
The EPC estimation results of the proposed model are compared with an open global EPC dataset (Shi’s product). [5] produced global EPC maps with a 1-km spatial resolution from 1992 to 2013 (hereafter, this paper refers to this as Shi’s product) by utilizing the linear regression model with nighttime light. Both quantitative and qualitative analyses were adopted to assess the proposed validity of the method and EPC estimation results.
The pixel-scale demographic data is not available, and the sub-district is the finest administrative unit available. Thus, the precision comparison is carried out at sub-district level for quantitative analysis. Survey data was from the demographic and statistical analysis of electricity consumption per capita conducted between 2013 and 2019. The demographic data was from 2013 to 2019 at sub-district scale. Sub-district EPC can be obtained by multiplying the demographic by per capita electric power consumption. The estimation result and Shi’s product in 2013 were compared for experimental comparability. Figure 8 shows the linear fit between the survey and modeled data, compared to evaluate EPC results at sub-district level. The linear fit model indicated a coefficient of determination of compared with Shi’s product (). Results reveal that the proposed model performed well in terms of estimating EPC.
In addition to the coefficient of determination , the root mean squared error (RMSE) and Mean Absolute Error (MAE) values were calculated for sub-district to assess accuracy. Table 5 shows the accuracy assessment of estimated EPC results for Shenzhen. It reveals that our model was much better than Shi’s in terms of both the RMSE and MAE. The RMSE (Equation (5)) and MAE (Equation (6)) values were calculated for sub-districts as follows:
where N () was the number of sub-districts, was the total EPC estimated by the model (calculated based on the sub-district level), and y was the statistical EPC data obtained from the yearbook.
In addition, this paper also calculates the relative standard deviation (RSD) of the results to obtain the degree of deviation of each point from the mean. Smaller values represent less bias in the predictions and more concentrated data distribution. The relative standard deviation (RSD) is expressed as follows:
where is the mean of the data.
Figure 9 shows the results of this paper (Estimated EPC) and the comparison data (Shi’s product) compared with the statistical EPC. It reveals that the results of this paper are consistent with the statistical data distribution, while the comparison data are quite different. We take into account that the comparison data is calculated assuming that the development of the city is consistent, which ignores the spatial heterogeneity of EPC distributions within cities.
For qualitative comparison, data from Shi’s global products for the study area are obtained for comparison. The two results for pixel level were then divided into five grades using the Natural Breaks (Jenks) method from low to high. The estimated EPC at pixel level was plotted to make a better qualitative comparison with Shi’s results, as shown in Figure 10. The EPC data in this study are distributed at 500 m resolution, while Shi’s product is 1 km. It shows that our results can portray richer spatial change information due to the advantage of higher resolution. Specifically, our results map (see Figure 10a) showed the changing trend in EPC in the central district, and EPC boundaries can also be identified in the suburbs, such as Dapeng New District. In contrast, Shi’s results (see Figure 10b) did not sufficiently describe the trend in EPC in the district area due to their coarse resolution.
The results reveal that the spatial resolution of the EPC distribution of our model is finer but leads to a higher estimation accuracy. The global EPC dataset (Shi’s product) takes into account the social-economic factor from nighttime light data but does not consider others, especially the population density and landscape features. Our model integrates multi-source geospatial data and high-resolution remote sensing data and fully considers the EPC distribution factors, including socio-economic, population density, and landscape features. The proposed model estimates EPC at a finer scale and comprehensively considers the factors affecting EPC distribution. As a result, our model results are better than Shi’s product dataset, which shows the effectiveness of the proposed model. The results show that although this study uses the relationship at sub-district scale to predict, the pixel-level EPC will cause an error of scale conversion, which is within an acceptable range in the study area.
In addition, Figure 11 shows the accuracy of our results by comparing them with sub-district census data from 2014 to 2019 in Shenzhen. For our estimated EPC, values were between 0.6 and 0.8 with an average of value 0.66. In contrast to the suggestions of previous research by Lu [10] and Xie [25], these validated results showed that acceptable estimates can be achieved using the proposed method. The main error is caused by the relatively large cloud coverage in the selected high-resolution satellite imagery resulting in the lower than 0.6 in 2017 and 2018.
5. Discussion
5.1. Method Validation
This study adapted gradient-weighted class activation mapping (Grad-CAM) to verify that the proposed CNN model could extract high-level semantically meaningful features from high-resolution imagery related to EPC distribution. Grad-CAM follows the CNN gradient flow that returns from an individual output class to the original image tile to establish an activation map, highlighting the input features most relevant to each class prediction. The areas with significant divergence between the rich and the poor in Longgang District, Shenzhen were analyzed as shown in Figure 12. Grad-CAM was used to compute activation map for the poorest and wealthiest socio-economic classes. The overlaid activation map highlighted the visual features that most triggered the poorest and richest class predictions (Figure 12B); these activation patterns could be associated with the slums map shown in Figure 12C. The red highlighting in the heat map indicates that the proposed model could learn economic features related to the EPC distribution.
Gini importance was used to assess important weight of each variable. The higher Gini importance value indicates that the variable is relatively more important. Variables ordered by Gini importance have been shown in Figure 13. There are 28 selected features. Population density is the most critical feature with an importance weight of , followed by nighttime light intensity and landscape feature (FC11), whose importance weights are and , respectively. The above analysis showed that population density was an essential feature that affected the distribution of residential electricity consumption in Shenzhen. Moreover, 25-dim landscape features (FC0 - FC24) extracted from high-resolution satellite images had a total importance of , and the values were are all between and , indicating that these features have various influences on EPC distribution.
This study removed FC0–FC24 features and calculated the model accuracy further to illustrate the importance of landscape features (FC0–FC24). Results show that the model accuracy falls from 0.66 to 0.45 after removing landscape features. The above analysis revealed that features extracted from remote sensing images benefit EPC estimation.
5.2. Spatiotemporal Dynamics Analysis of EPC from 2013 to 2019
The linear regression analysis method was adopted to explain the spatiotemporal dynamic of EPC in Shenzhen from 2013 to 2019. As in Hu et al. [9] and He et al. [24], the index was used to measure the change trends of each grid from 2013 to 2019. The slope of the regression model for every area was calculated to determine the EPC changing type from 2013 to 2019 [9,24]. The calculation formula of the slope was as follows:
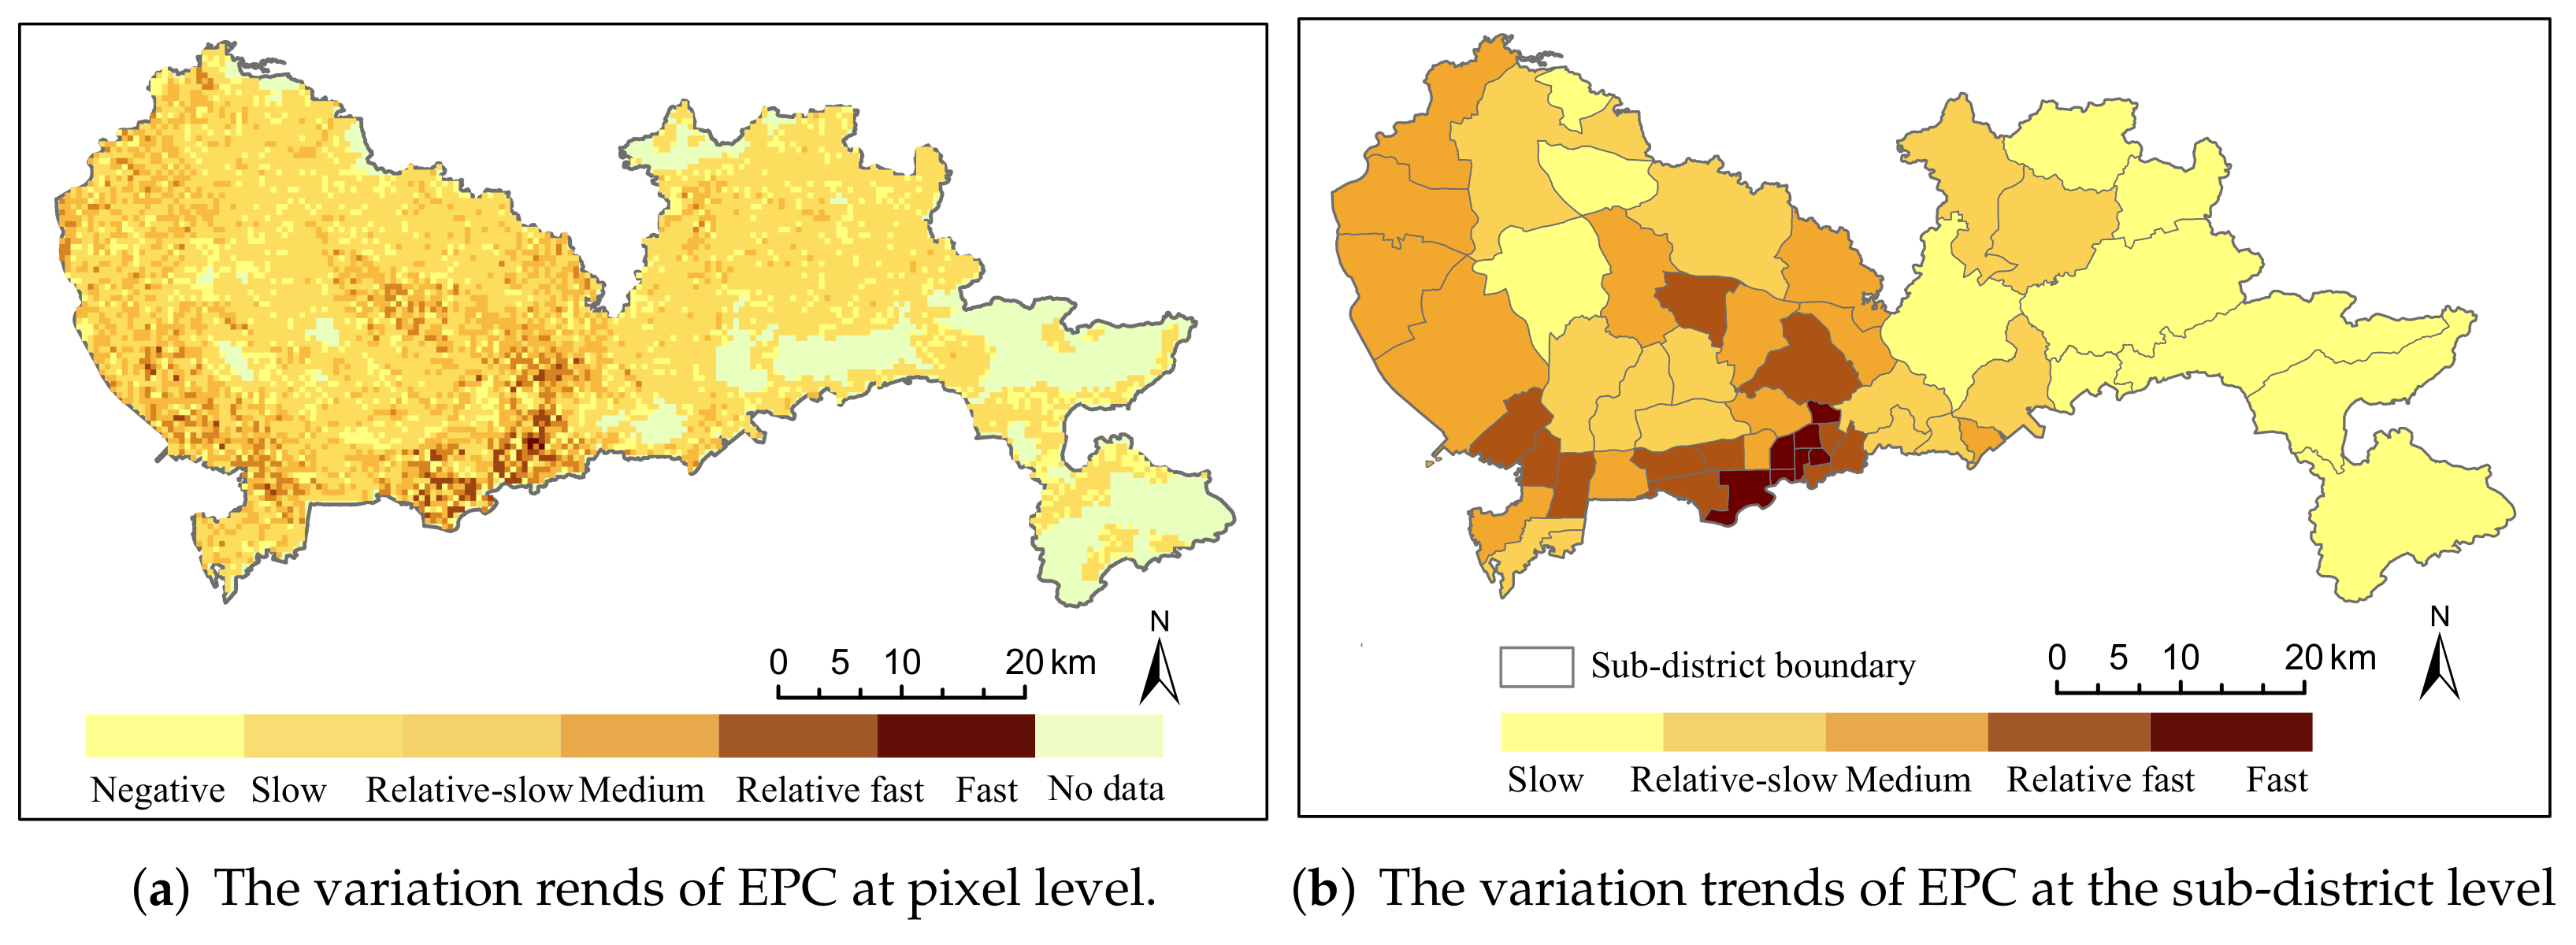
where n was the number of years (in this study ), represented the kth year between 1 and 7, and was the ith grid of the kth year. stood for an increasing trend, whereas indicated a decreasing tendency. Moreover, the slope coefficient for each grid was divided into five grades based on the Natural Breaks (Jenks) method: negative growth, slow growth, medium growth, relatively fast growth, and fast growth (Figure 14). Based on the grid-level index, the average index for each sub-district level was calculated to represent variation trends as shown in Figure 14b.
Figure 14 displays the temporal variation types of the sub-district level EPC in Shenzhen, according to the index. In general, EPC in the Shenzhen urban west has been growing faster than in the east. The sub-districts belong to the rapid growth type mainly located in the south of central coastal regions of Shenzhen, including Futian sub-district and Yuanling sub-district in the Futian District and Sungang sub-district and Dongmen sub-district in the Luohu District. The regions that experienced relatively rapid growth were mainly concentrated in the high-tech park coverage area in Nanshan District (Nantou and Yuehai Sub-districts), the typical high-density residential area in Bao’an District (Xin’an Sub-district), and some sub-districts in the Longgang District near the main city center (Buji and Longhua sub-districts). The EPC in Dapeng New District, Pingshan District and the northern part of Longgang District in Shenzhen’s eastern suburbs has slowly grown.
6. Conclusions
High-precision EPC distribution with a high resolution is the essential primary data for urban research. Electricity is the most widely used energy source in modern society and the primary energy source for Chinese households [40]. Some literature shows that electricity consumption is positively correlated with economic growth [41]. Similar to income, household electricity consumption is also one of the indicators to measure people’s comfort and welfare [42]. Therefore, EPC distribution can better reflect the actual situation of inequality than other indicators. Due to the rapid development and energy consumption in cities, many urban problems have been brought out, such as uneven infrastructure allocation and uneven development. Therefore, refined EPC distribution data is essential for appropriate urban governance and planning, which can help balance infrastructure resources and cities. For example, in the construction of public facilities, considering the EPC distribution can assist the allocation of public service facilities more reasonably. To measure the level of regional development, the distribution of electricity consumption can provide the government with a considerable reference.
Reliable EPC estimation on a fine scale is essential for urban planning and response to the unbalanced distribution of energy utilization. This study presented a methodology for estimating electric power consumption at spatial resolution from 2013 to 2019 using multi-source data. High-resolution remote sensing data can reflect landscape characteristics related to urban EPC. The advantages of the proposed method for estimating EPC are that it combines multi-source remote sensing data and machine learning, and it not only takes socio-economic and population density into account but also considers landscape features from high-resolution images, which improves estimation accuracy. The EPC estimation model was evaluated using statistical data from the National Bureau of Statistics at a sub-district scale. The average is above , which suggested considerable accuracy. To evaluate the validity of our results, this study conducted a comparative analysis with an existing EPC product, which showed that our results were excellent in both qualitative and quantitative terms. However, the advantage of comparing products is achieving global EPC estimation. Due to the limitation of house price data, our method does not achieve global EPC estimation. The results confirmed that multi-source data and an RFR model could be combined to map EPC at the pixel level and demonstrated that improved modeling was achievable when landscape features extracted from high-resolution images were used in combination. Additionally, the spatiotemporal dynamic of EPC from 2013 to 2019 in Shenzhen was attempted to be detected. The analysis showed that the EPC dynamic change area was mainly in the west of Shenzhen. The regions with relatively minor changes were mainly located in the east, occupied mainly by forest land. All data used in this study, including Suomi NPP-VIIRS nighttime light data, high-resolution satellite imagery, and WorldPop population data, is public and globally available. Similar data reflecting local economic conditions can be used for house price data. Therefore, the proposed method is easily transferable to other regions.
Author Contributions
Conceptualization, L.C. and L.W.; methodology, D.L.; validation, formal analysis, investigation, resources, L.C. and J.Y; writing—original draft preparation, L.C.; writing—review and editing, R.F. and J.Y.; supervision, L.W. and D.L.; funding acquisition, L.W. All authors have read and agreed to the published version of the manuscript.
Funding
This study was funded by the National Natural Science Foundation of China (No. 41925007 and No. U21A2013).
Institutional Review Board Statement
Not applicable.
Informed Consent Statement
Not applicable.
Data Availability Statement
The multi-source data used in this paper are publicly available, and the dataset information is shown in Table 1. The EPC results for Shenzhen and the necessary code are available for free at the Github website (https://github.com/MissChengLX/EPC_estimation (accessed on 10 January 2022)).
Conflicts of Interest
The authors declare no conflict of interest.
References
- Liu, A.; Ye, Z. China statistical yearbook—2020. China Stat. Yearb. 2020, 4, 978–5037. [Google Scholar]
- United Nations. The Sustainable Development Goals Report 2018; Technical Report; United Nations: New York, NY, USA, 2018. [Google Scholar]
- Tso, G.K.; Yau, K.K. Predicting electricity energy consumption: A comparison of regression analysis, decision tree and neural networks. Energy 2007, 32, 1761–1768. [Google Scholar] [CrossRef]
- Huang, M.; He, Y.; Cen, H. Predictive analysis on electric-power supply and demand in China. Renew. Energy 2007, 32, 1165–1174. [Google Scholar] [CrossRef]
- Shi, K.; Chen, Y.; Yu, B.; Xu, T.; Yang, C.; Li, L.; Huang, C.; Chen, Z.; Liu, R.; Wu, J. Detecting spatiotemporal dynamics of global electric power consumption using DMSP-OLS nighttime stable light data. Appl. Energy 2016, 184, 450–463. [Google Scholar] [CrossRef]
- Stokes, E.C.; Seto, K.C. Characterizing urban infrastructural transitions for the Sustainable Development Goals using multi-temporal land, population, and nighttime light data. Remote. Sens. Environ. 2019, 234, 111430. [Google Scholar] [CrossRef]
- Letu, H.; Hara, M.; Yagi, H.; Naoki, K.; Tana, G.; Nishio, F.; Shuhei, O. Estimating energy consumption from night-time DMPS/OLS imagery after correcting for saturation effects. Int. J. Remote. Sens. 2010, 31, 4443–4458. [Google Scholar] [CrossRef]
- Sahoo, S.; Gupta, P.K.; Srivastav, S. Comparative analysis between VIIRS-DNB and DMSP-OLS night-time light data to estimate electric power consumption in Uttar Pradesh, India. Int. J. Remote. Sens. 2020, 41, 2565–2580. [Google Scholar] [CrossRef]
- Hu, T.; Huang, X. A novel locally adaptive method for modeling the spatiotemporal dynamics of global electric power consumption based on DMSP-OLS nighttime stable light data. Appl. Energy 2019, 240, 778–792. [Google Scholar] [CrossRef]
- Lu, L.; Weng, Q.; Xie, Y.; Guo, H.; Li, Q. An assessment of global electric power consumption using the Defense Meteorological Satellite Program-Operational Linescan System nighttime light imagery. Energy 2019, 189, 116351. [Google Scholar] [CrossRef]
- Sun, Y.; Wang, S.; Zhang, X.; Chan, T.O.; Wu, W. Estimating local-scale domestic electricity energy consumption using demographic, nighttime light imagery and Twitter data. Energy 2021, 226, 120351. [Google Scholar] [CrossRef]
- Wang, W.; Zhang, X.; Wu, Y.; Zhou, L.; Skitmore, M. Development priority zoning in China and its impact on urban growth management strategy. Cities 2017, 62, 1–9. [Google Scholar] [CrossRef] [Green Version]
- Wang, J.; Ren, Y.; Shen, L.; Liu, Z.; Wu, Y.; Shi, F. A novel evaluation method for urban infrastructures carrying capacity. Cities 2020, 105, 102846. [Google Scholar] [CrossRef]
- Jean, N.; Burke, M.; Xie, M.; Davis, W.M.; Lobell, D.B.; Ermon, S. Combining satellite imagery and machine learning to predict poverty. Science 2016, 353, 790–794. [Google Scholar] [CrossRef] [PubMed] [Green Version]
- Yeh, C.; Perez, A.; Driscoll, A.; Azzari, G.; Tang, Z.; Lobell, D.; Ermon, S.; Burke, M. Using publicly available satellite imagery and deep learning to understand economic well-being in Africa. Nat. Commun. 2020, 11, 1–11. [Google Scholar] [CrossRef]
- Chi, G.; Peiya, Z.; Junhui, X.; Youliang, X. Office for National Statistics. Local Authority Districts Boundaries Shenzhen 2020. [EB/OL]. 2020. Available online: http://pnr.sz.gov.cn/ywzy/chgl/index.html/ (accessed on 4 April 2020).
- Elvidge, C.D.; Baugh, K.E.; Kihn, E.A.; Kroehl, H.W.; Davis, E.R.; Davis, C.W. Relation between satellite observed visible-near infrared emissions, population, economic activity and electric power consumption. Int. J. Remote. Sens. 1997, 18, 1373–1379. [Google Scholar] [CrossRef]
- Malarvizhi, K.; Kumar, S.V.; Porchelvan, P. Use of high resolution Google Earth satellite imagery in landuse map preparation for urban related applications. Procedia Technol. 2016, 24, 1835–1842. [Google Scholar] [CrossRef]
- Zhao, F.; Ding, J.; Zhang, S.; Luan, G.; Song, L.; Peng, Z.; Du, Q.; Xie, Z. Estimating rural electric power consumption using NPP-VIIRS night-time light, toponym and POI data in ethnic minority areas of China. Remote. Sens. 2020, 12, 2836. [Google Scholar] [CrossRef]
- Hu, W.; Liu, C.; Zhan, Q. Synthetic method and comparison verification of NPP-VIIRS annual nighttime lighting data in China. J. Guilin. Univ. Technol 2020, 510, 1–10. [Google Scholar]
- Rousseeuw, P.J. Silhouettes: A graphical aid to the interpretation and validation of cluster analysis. J. Comput. Appl. Math. 1987, 20, 53–65. [Google Scholar] [CrossRef] [Green Version]
- Lan, F.; Gong, X.; Da, H.; Wen, H. How do population inflow and social infrastructure affect urban vitality? Evidence from 35 large- and medium-sized cities in China. Cities 2020, 100, 102454. [Google Scholar] [CrossRef]
- Liang, H.; Guo, Z.; Wu, J.; Chen, Z. GDP spatialization in Ningbo City based on NPP/VIIRS night-time light and auxiliary data using random forest regression. Adv. Space Res. 2020, 65, 481–493. [Google Scholar] [CrossRef]
- He, C.; Ma, Q.; Li, T.; Yang, Y.; Liu, Z. Spatiotemporal dynamics of electric power consumption in Chinese Mainland from 1995 to 2008 modeled using DMSP/OLS stable nighttime lights data. J. Geogr. Sci. 2012, 22, 125–136. [Google Scholar] [CrossRef]
- Xie, Y.; Weng, Q. Detecting urban-scale dynamics of electricity consumption at Chinese cities using time-series DMSP-OLS (Defense Meteorological Satellite Program-Operational Linescan System) nighttime light imageries. Energy 2016, 100, 177–189. [Google Scholar] [CrossRef]
- He, D.; Shi, Q.; Liu, X.; Zhong, Y.; Zhang, X. Deep subpixel mapping based on semantic information modulated network for urban land use mapping. IEEE Trans. Geosci. Remote. Sens. 2021, 59, 10628–10646. [Google Scholar] [CrossRef]
- He, D.; Shi, Q.; Liu, X.; Zhong, Y.; Zhang, L. Generating 2m fine-scale urban tree cover product over 34 metropolises in China based on deep context-aware sub-pixel mapping network. Int. J. Appl. Earth Obs. Geoinf. 2022, 106, 102667. [Google Scholar] [CrossRef]
- Shin, H.C.; Roth, H.R.; Gao, M.; Lu, L.; Xu, Z.; Nogues, I.; Yao, J.; Mollura, D.; Summers, R.M. Deep convolutional neural networks for computer-aided detection: CNN architectures, dataset characteristics and transfer learning. IEEE Trans. Med. Imaging 2016, 35, 1285–1298. [Google Scholar] [CrossRef] [PubMed] [Green Version]
- Xie, S.M.; Jean, N.; Burke, M.; Lobell, D.B.; Ermon, S. Transfer Learning from Deep Features for Remote Sensing and Poverty Mapping. In Proceedings of the Thirtieth AAAI Conference on Artificial Intelligence, Phoenix, AZ, USA, 12–17 February 2016; Schuurmans, D., Wellman, M.P., Eds.; AAAI Press: Palo Alto, CA, USA, 2016; pp. 3929–3935. [Google Scholar]
- Yosinski, J.; Clune, J.; Bengio, Y.; Lipson, H. How transferable are features in deep neural networks? Advances in Neural Information Processing Systems 27. In Proceedings of the Annual Conference on Neural Information Processing Systems 2014, Montreal, QC, Canada, 8–13 December 2014; Ghahramani, Z., Welling, M., Cortes, C., Lawrence, N.D., Weinberger, K.Q., Eds.; Curran Associates, Inc.: Red Hook, NY, USA, 2014; pp. 3320–3328. [Google Scholar]
- Zhou, B.; Khosla, A.; Lapedriza, A.; Torralba, A.; Oliva, A. Places: An image database for deep scene understanding. arXiv 2016, arXiv:1610.02055. [Google Scholar] [CrossRef]
- Simonyan, K.; Zisserman, A. Very Deep Convolutional Networks for Large-Scale Image Recognition. In Proceedings of the 3rd International Conference on Learning Representations, ICLR 2015, San Diego, CA, USA, 7–9 May 2015. [Google Scholar]
- Yapıcı, M.M.; Tekerek, A.; Topaloğlu, N. Performance comparison of convolutional neural network models on GPU. In Proceedings of the 2019 IEEE 13th International Conference on Application of Information and Communication Technologies (AICT), Baku, Azerbaijan, 23–25 October 2019; pp. 1–4. [Google Scholar]
- Zhao, X.; Yu, B.; Liu, Y.; Chen, Z.; Li, Q.; Wang, C.; Wu, J. Estimation of Poverty Using Random Forest Regression with Multi-Source Data: A Case Study in Bangladesh. Remote Sens. 2019, 11, 375. [Google Scholar] [CrossRef] [Green Version]
- Breiman, L. Random Forests. Mach. Learn. 2001, 45, 5–32. [Google Scholar] [CrossRef] [Green Version]
- Ishwaran, H.; Lu, M. Standard errors and confidence intervals for variable importance in random forest regression, classification, and survival. Stat. Med. 2019, 38, 558–582. [Google Scholar] [CrossRef]
- Pedregosa, F.; Varoquaux, G.; Gramfort, A.; Michel, V.; Thirion, B.; Grisel, O.; Blondel, M.; Prettenhofer, P.; Weiss, R.; Dubourg, V.; et al. Scikit-learn: Machine learning in Python. J. Mach. Learn. Res. 2011, 12, 2825–2830. [Google Scholar]
- Lerman, P. Fitting segmented regression models by grid search. J. R. Stat. Soc. Ser. 1980, 29, 77–84. [Google Scholar] [CrossRef]
- Wang, F.; Wang, Y.; Zhang, K.; Hu, M.; Weng, Q.; Zhang, H. Spatial heterogeneity modeling of water quality based on random forest regression and model interpretation. Environ. Res. 2021, 202, 111660. [Google Scholar] [CrossRef] [PubMed]
- Lin, B.; Omoju, O.E.; Okonkwo, J.U. Factors influencing renewable electricity consumption in China. Renew. Sustain. Energy Rev. 2016, 55, 687–696. [Google Scholar] [CrossRef]
- Shiu, A.; Lam, P.L. Electricity consumption and economic growth in China. Energy Policy 2004, 32, 47–54. [Google Scholar] [CrossRef]
- Zhang, C.; Su, B.; Zhou, K.; Yang, S. Analysis of electricity consumption in China (1990–2016) using index decomposition and decoupling approach. J. Clean. Prod. 2019, 209, 224–235. [Google Scholar] [CrossRef]
Figure 1.
Location of the study area. (a) EPC statistics in Shenzhen at sub-district scale. The map was completed with the ArcGIS (version 10.5) software.
Figure 1.
Location of the study area. (a) EPC statistics in Shenzhen at sub-district scale. The map was completed with the ArcGIS (version 10.5) software.
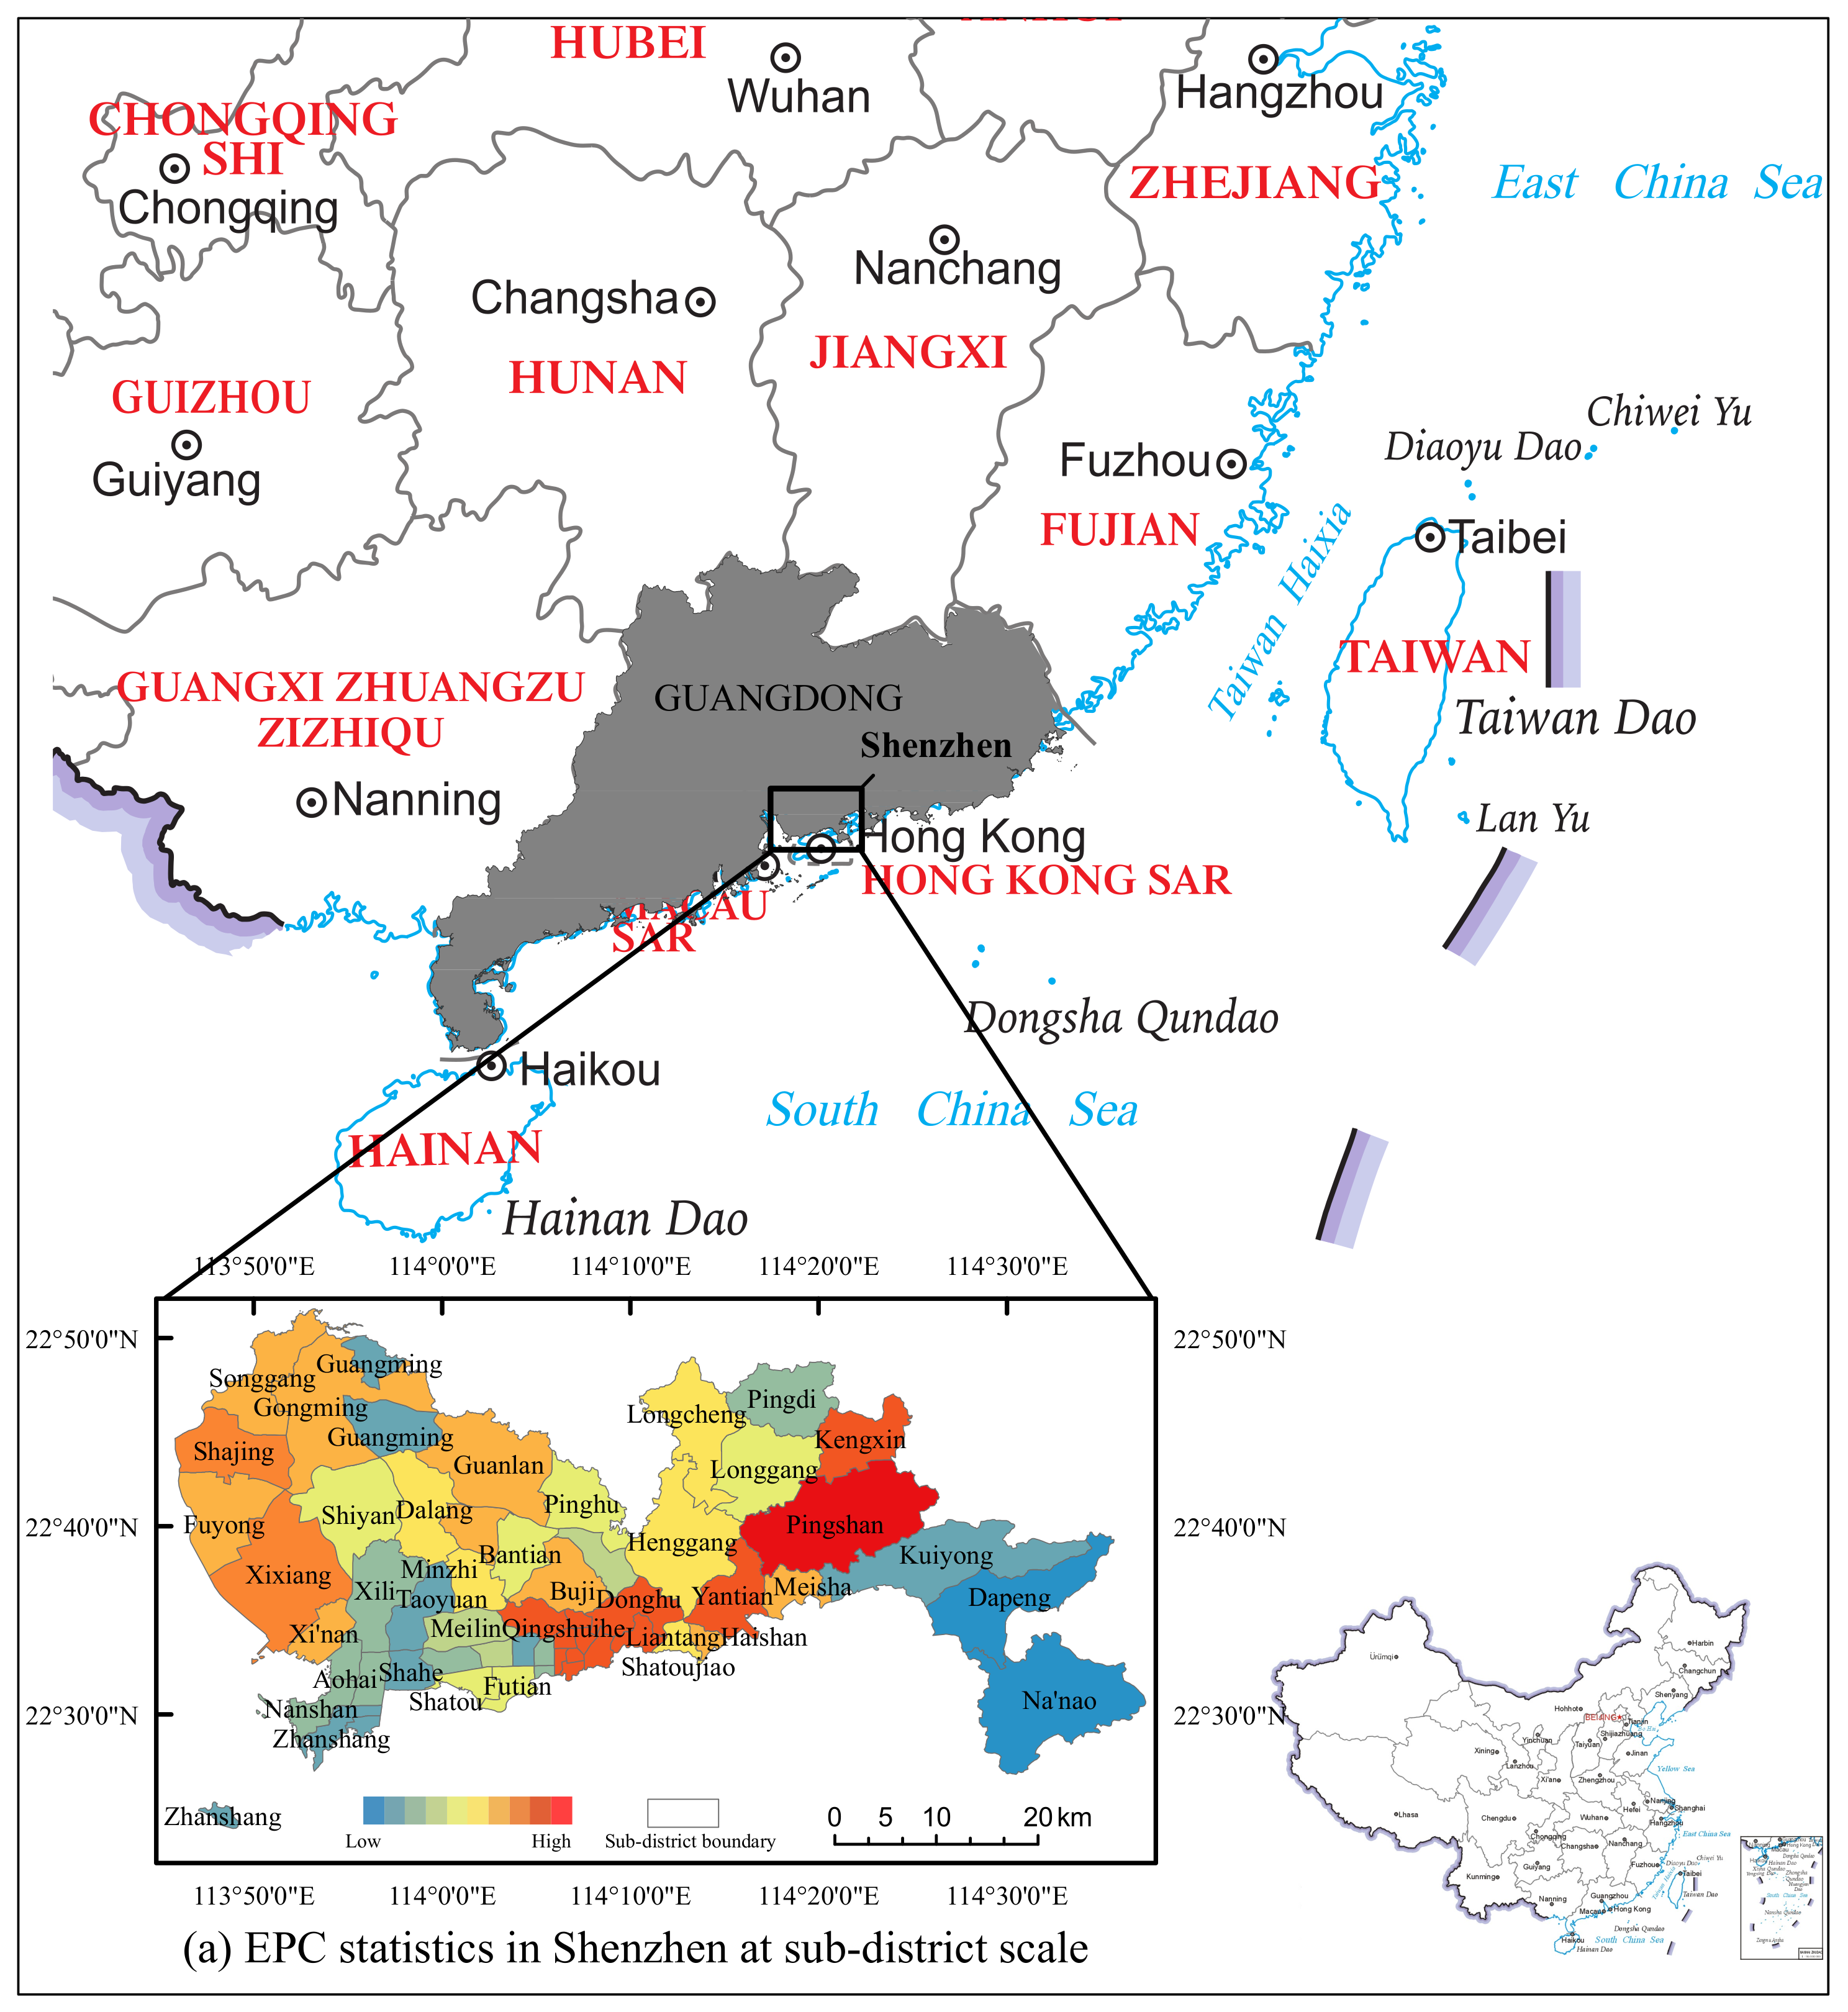
Figure 2.
The methodological framework for EPC estimation at pixel level.
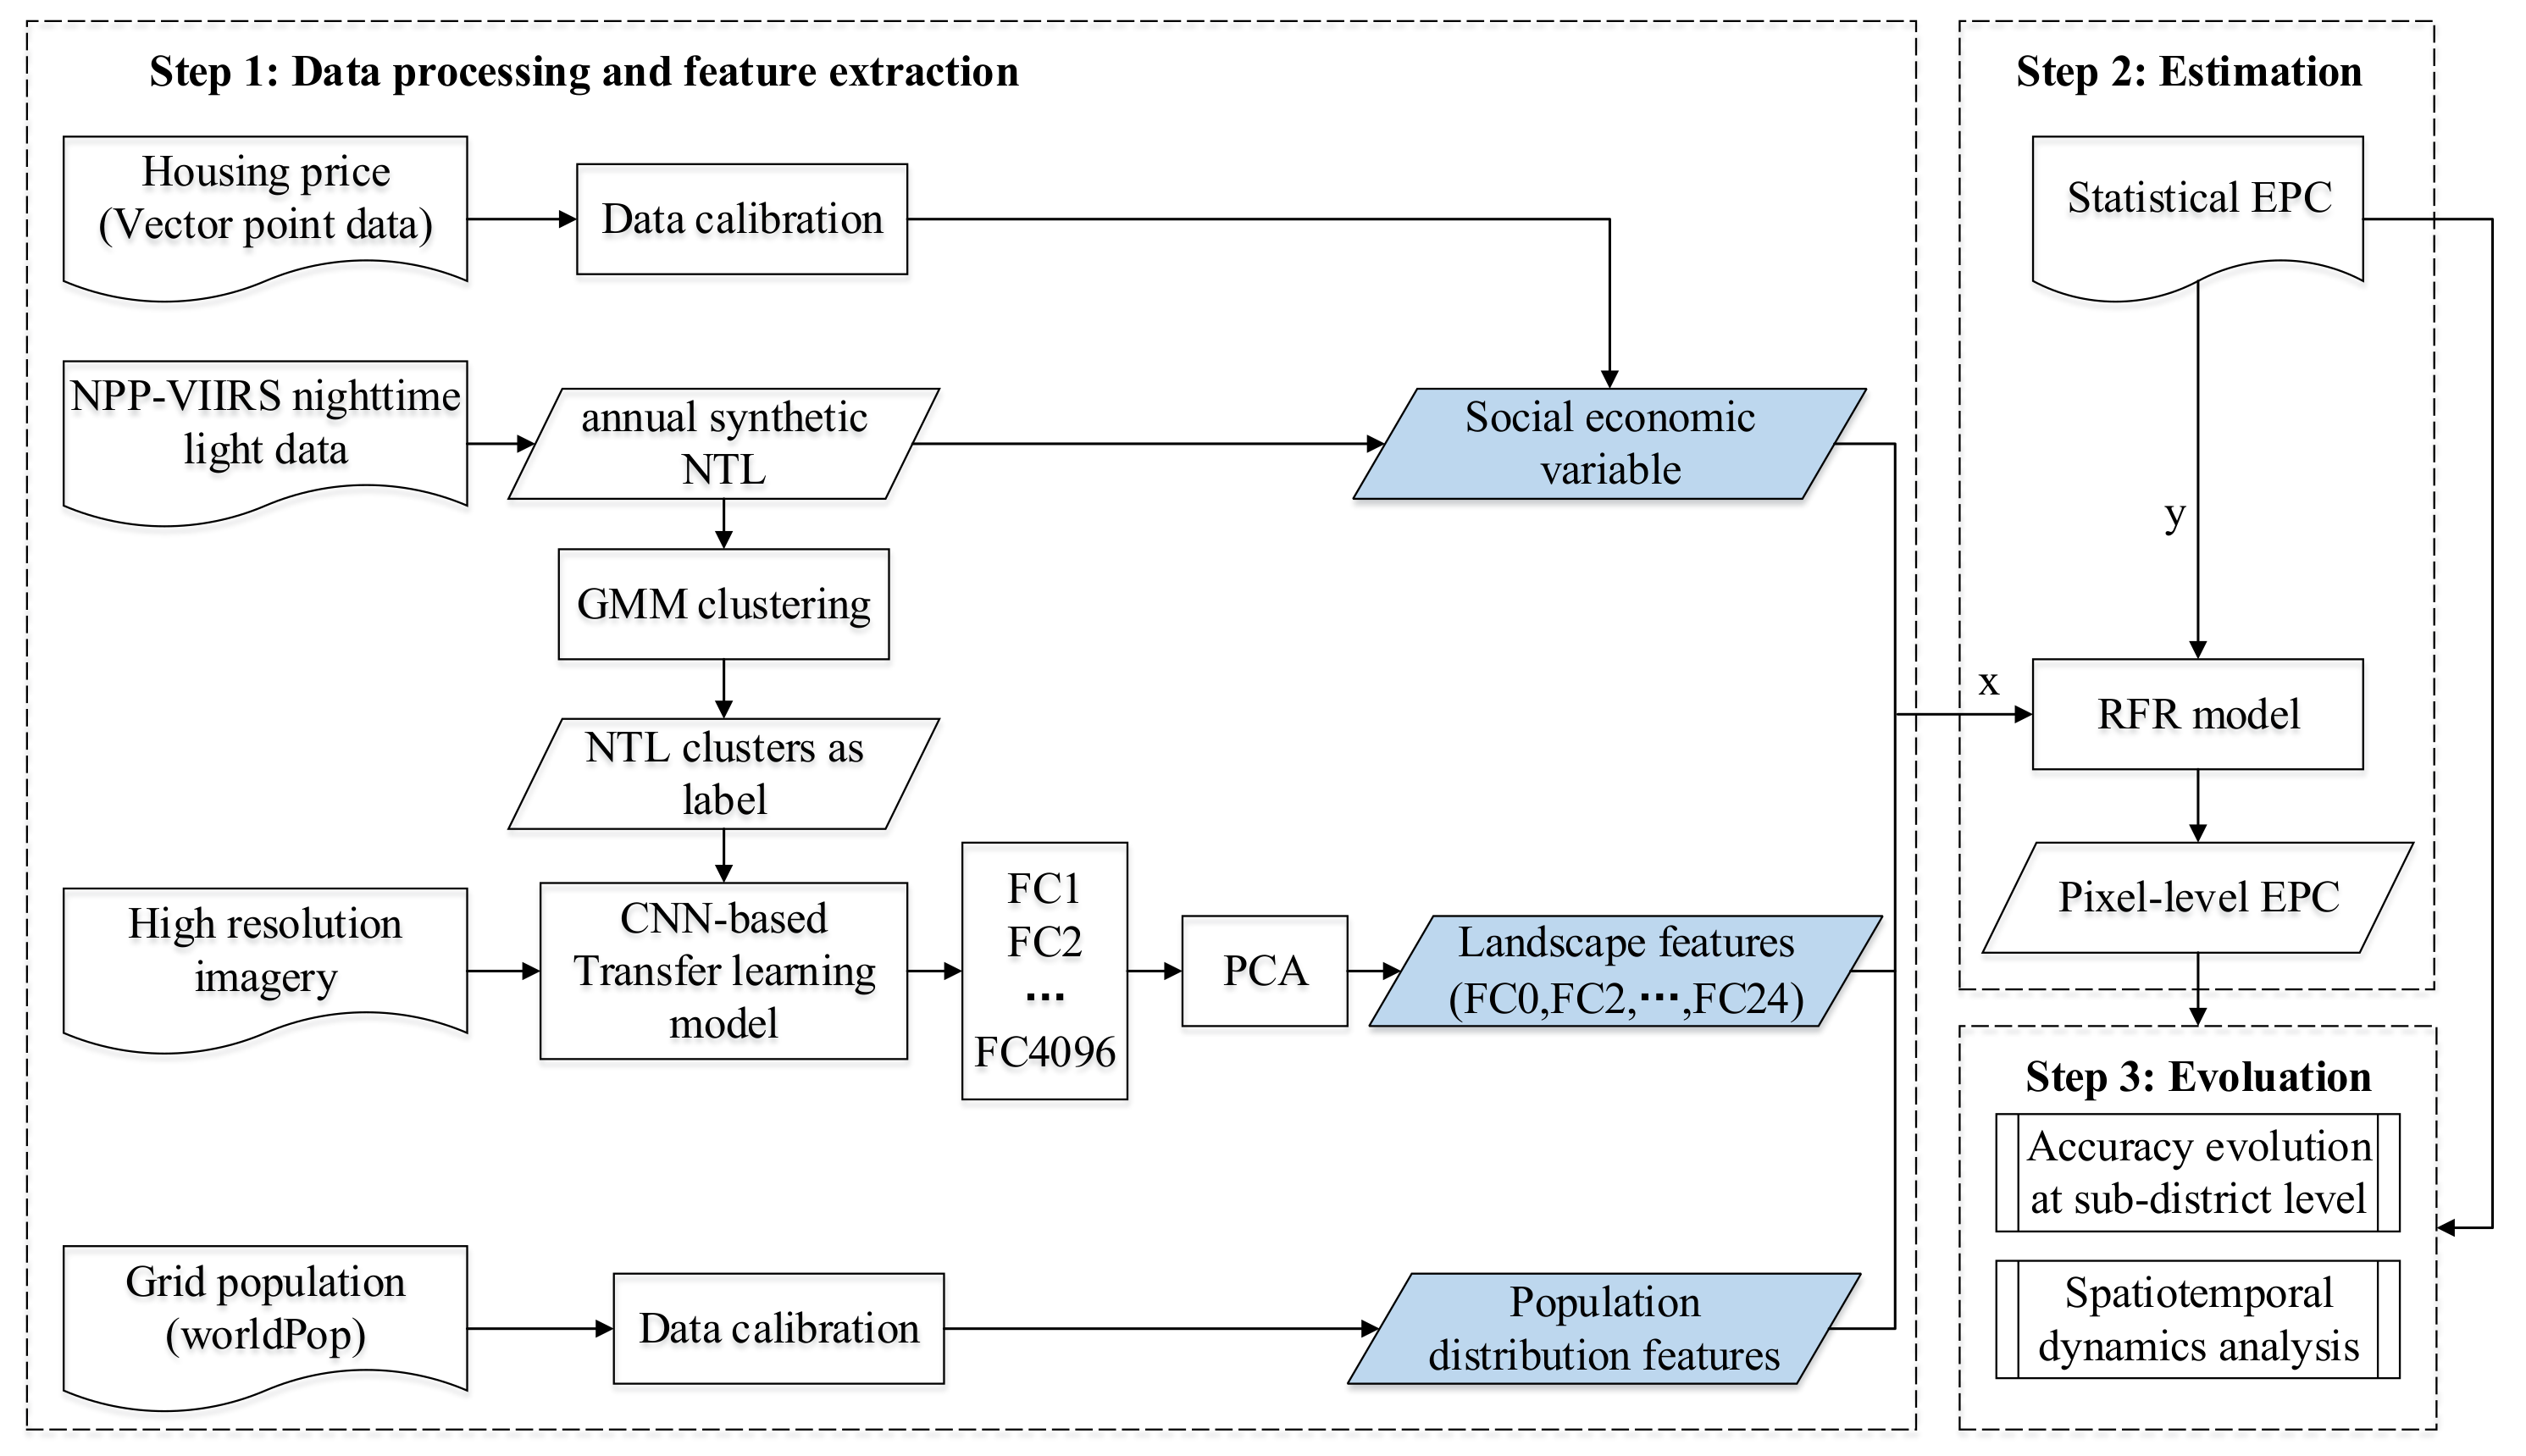
Figure 3.
The silhouette score comparison of GMM for different numbers of clusters in 2013.
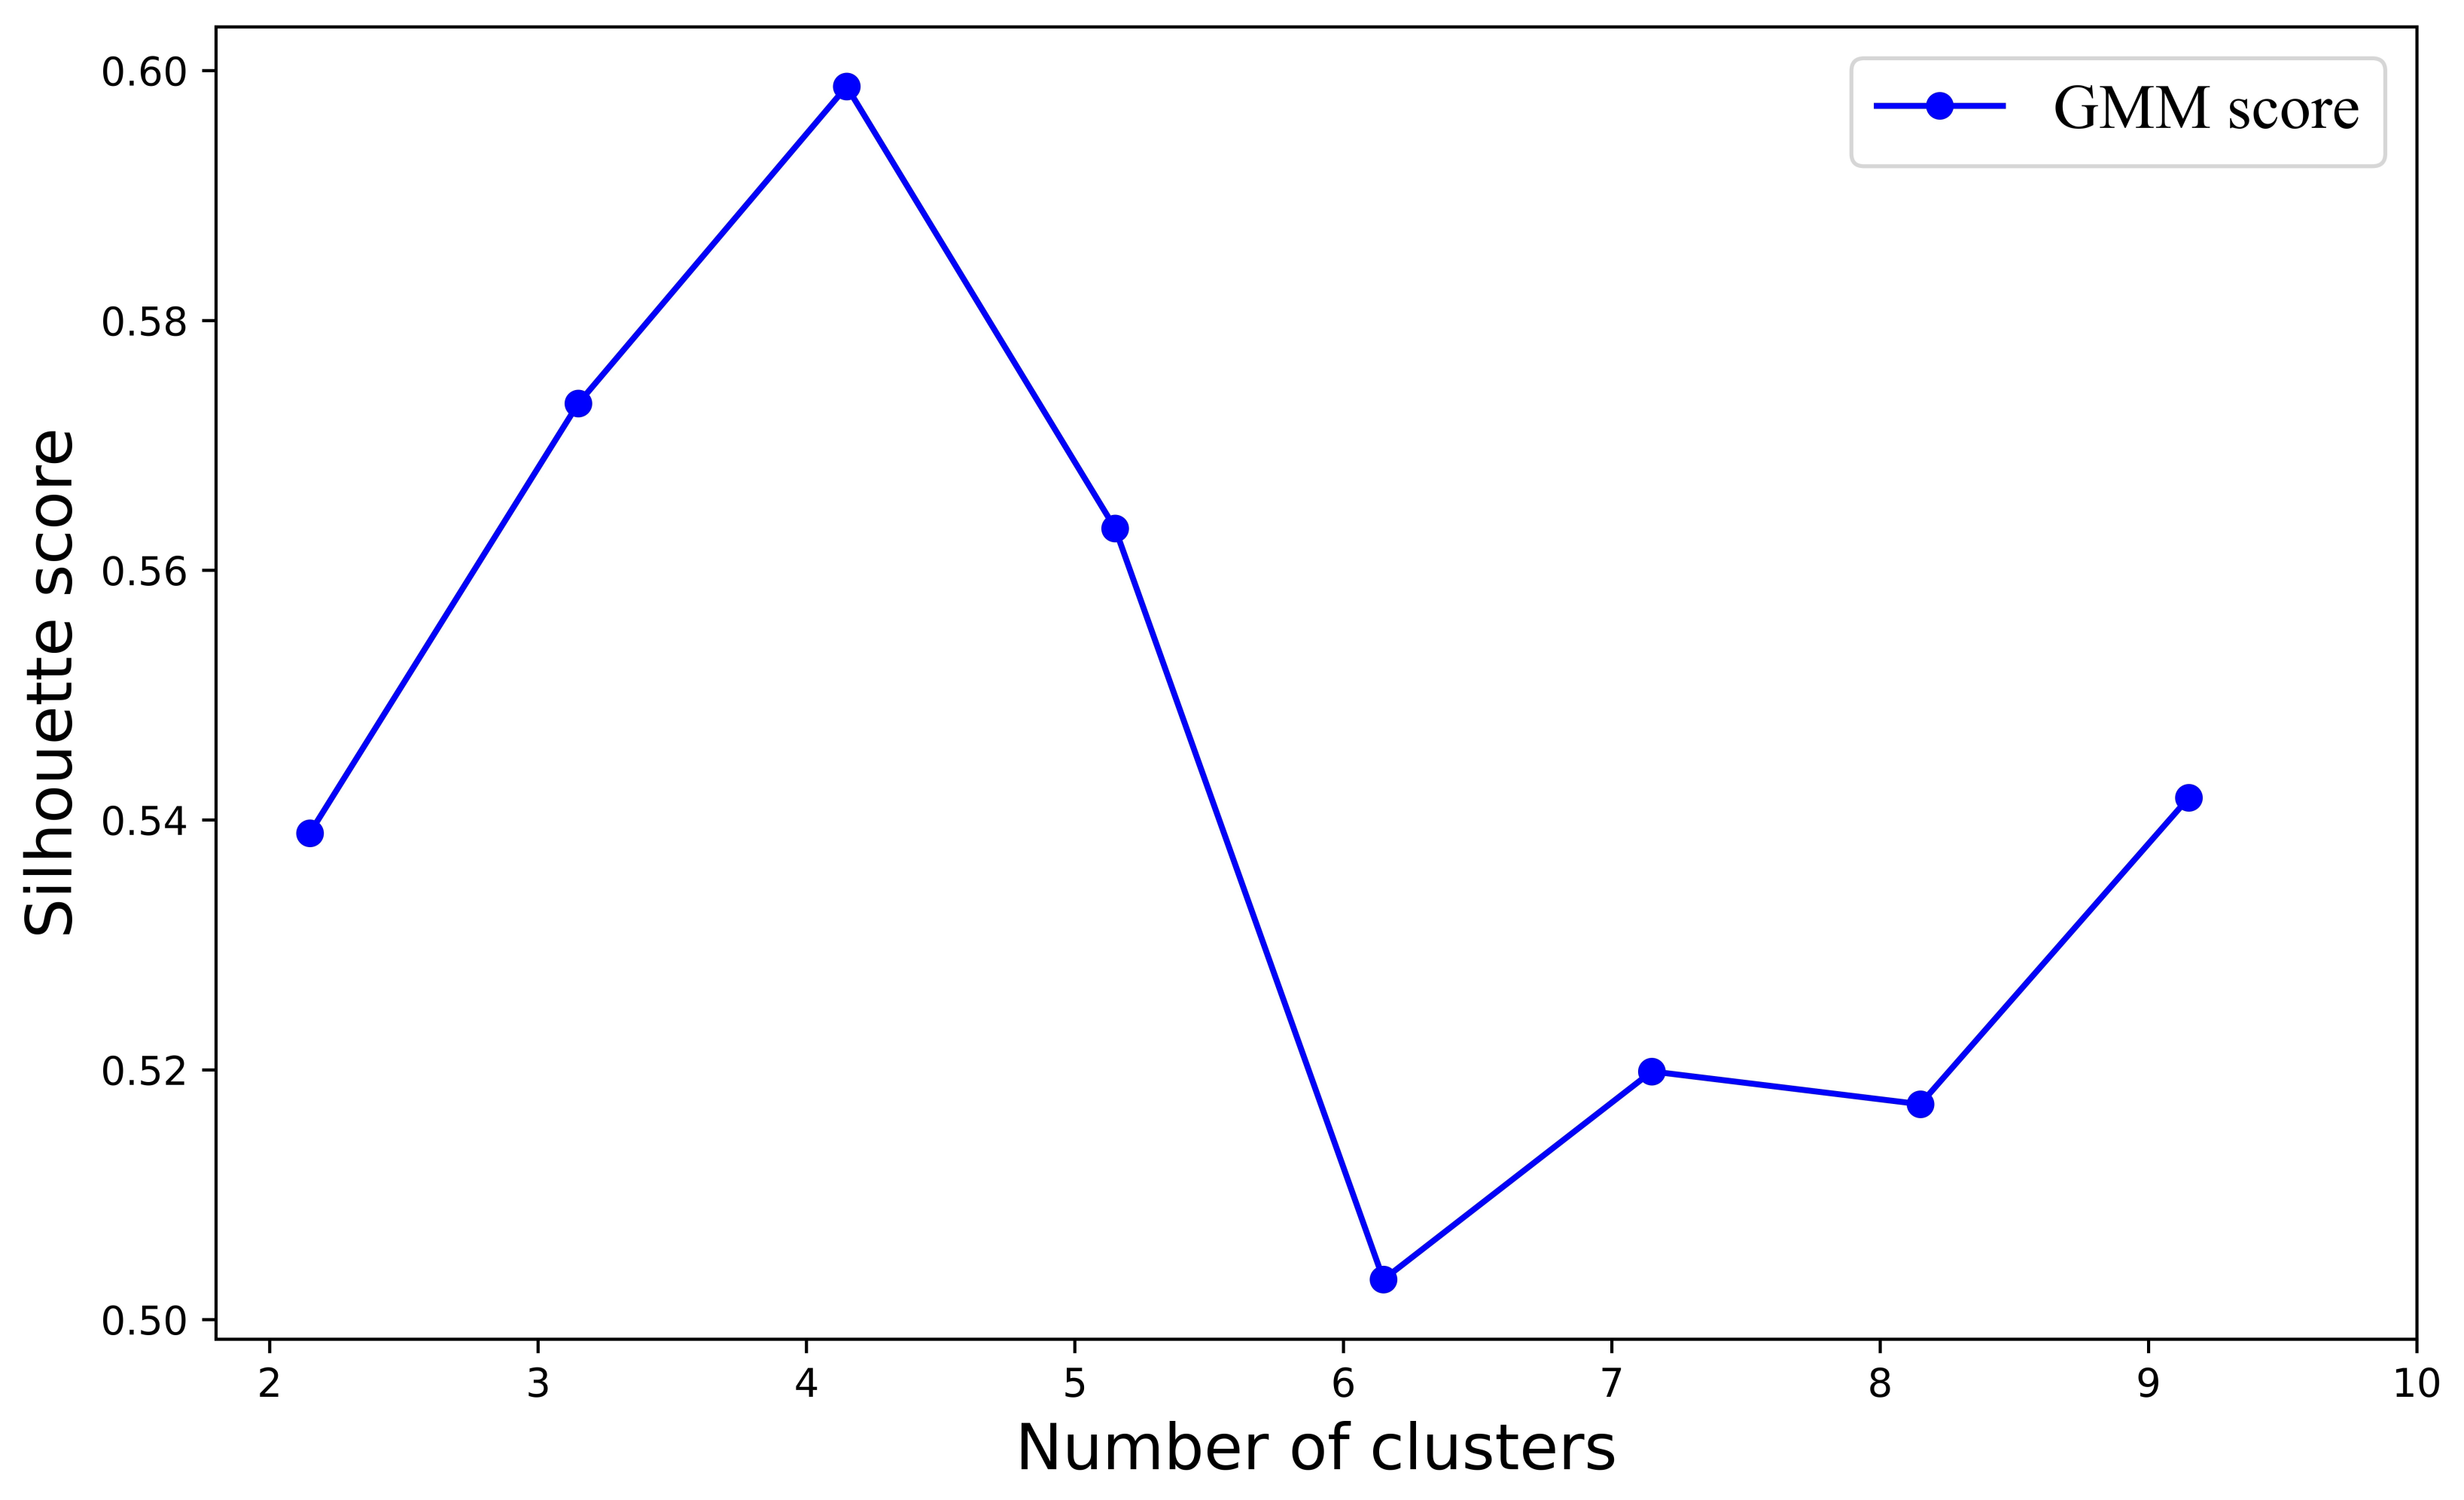
Figure 4.
The relationship between statistical EPC and independent variables (nighttime light intensity, population density, and house price) at sub-district level. The blue lines are fits to the data with corresponding 95% confidence intervals in light blue.
Figure 4.
The relationship between statistical EPC and independent variables (nighttime light intensity, population density, and house price) at sub-district level. The blue lines are fits to the data with corresponding 95% confidence intervals in light blue.
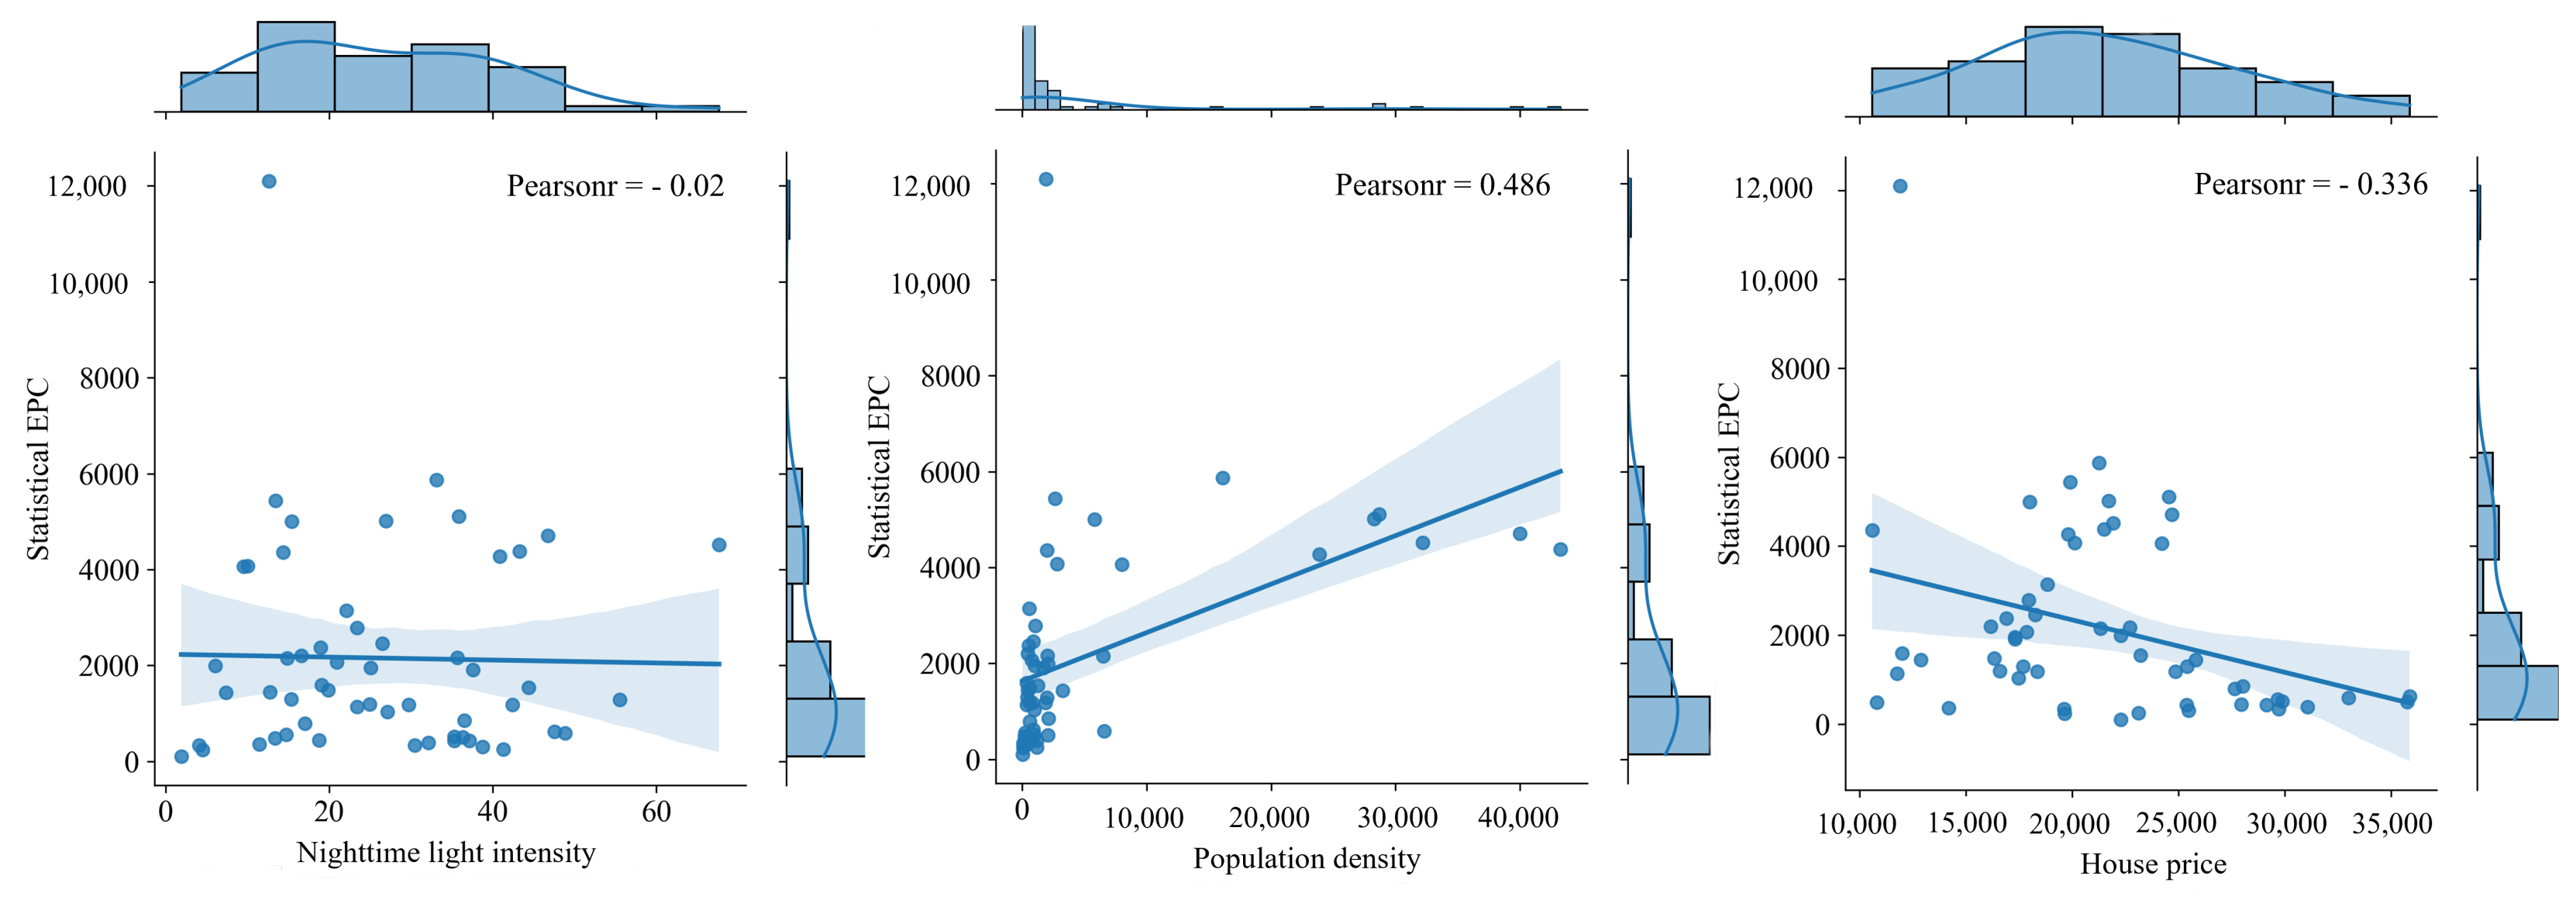
Figure 5.
ResNet-50 based deep transfer learning for landscape features extraction. (a) Fine tuning of pretrained CNN. (b) Pretrained CNN-based model as a feature generator.
Figure 5.
ResNet-50 based deep transfer learning for landscape features extraction. (a) Fine tuning of pretrained CNN. (b) Pretrained CNN-based model as a feature generator.
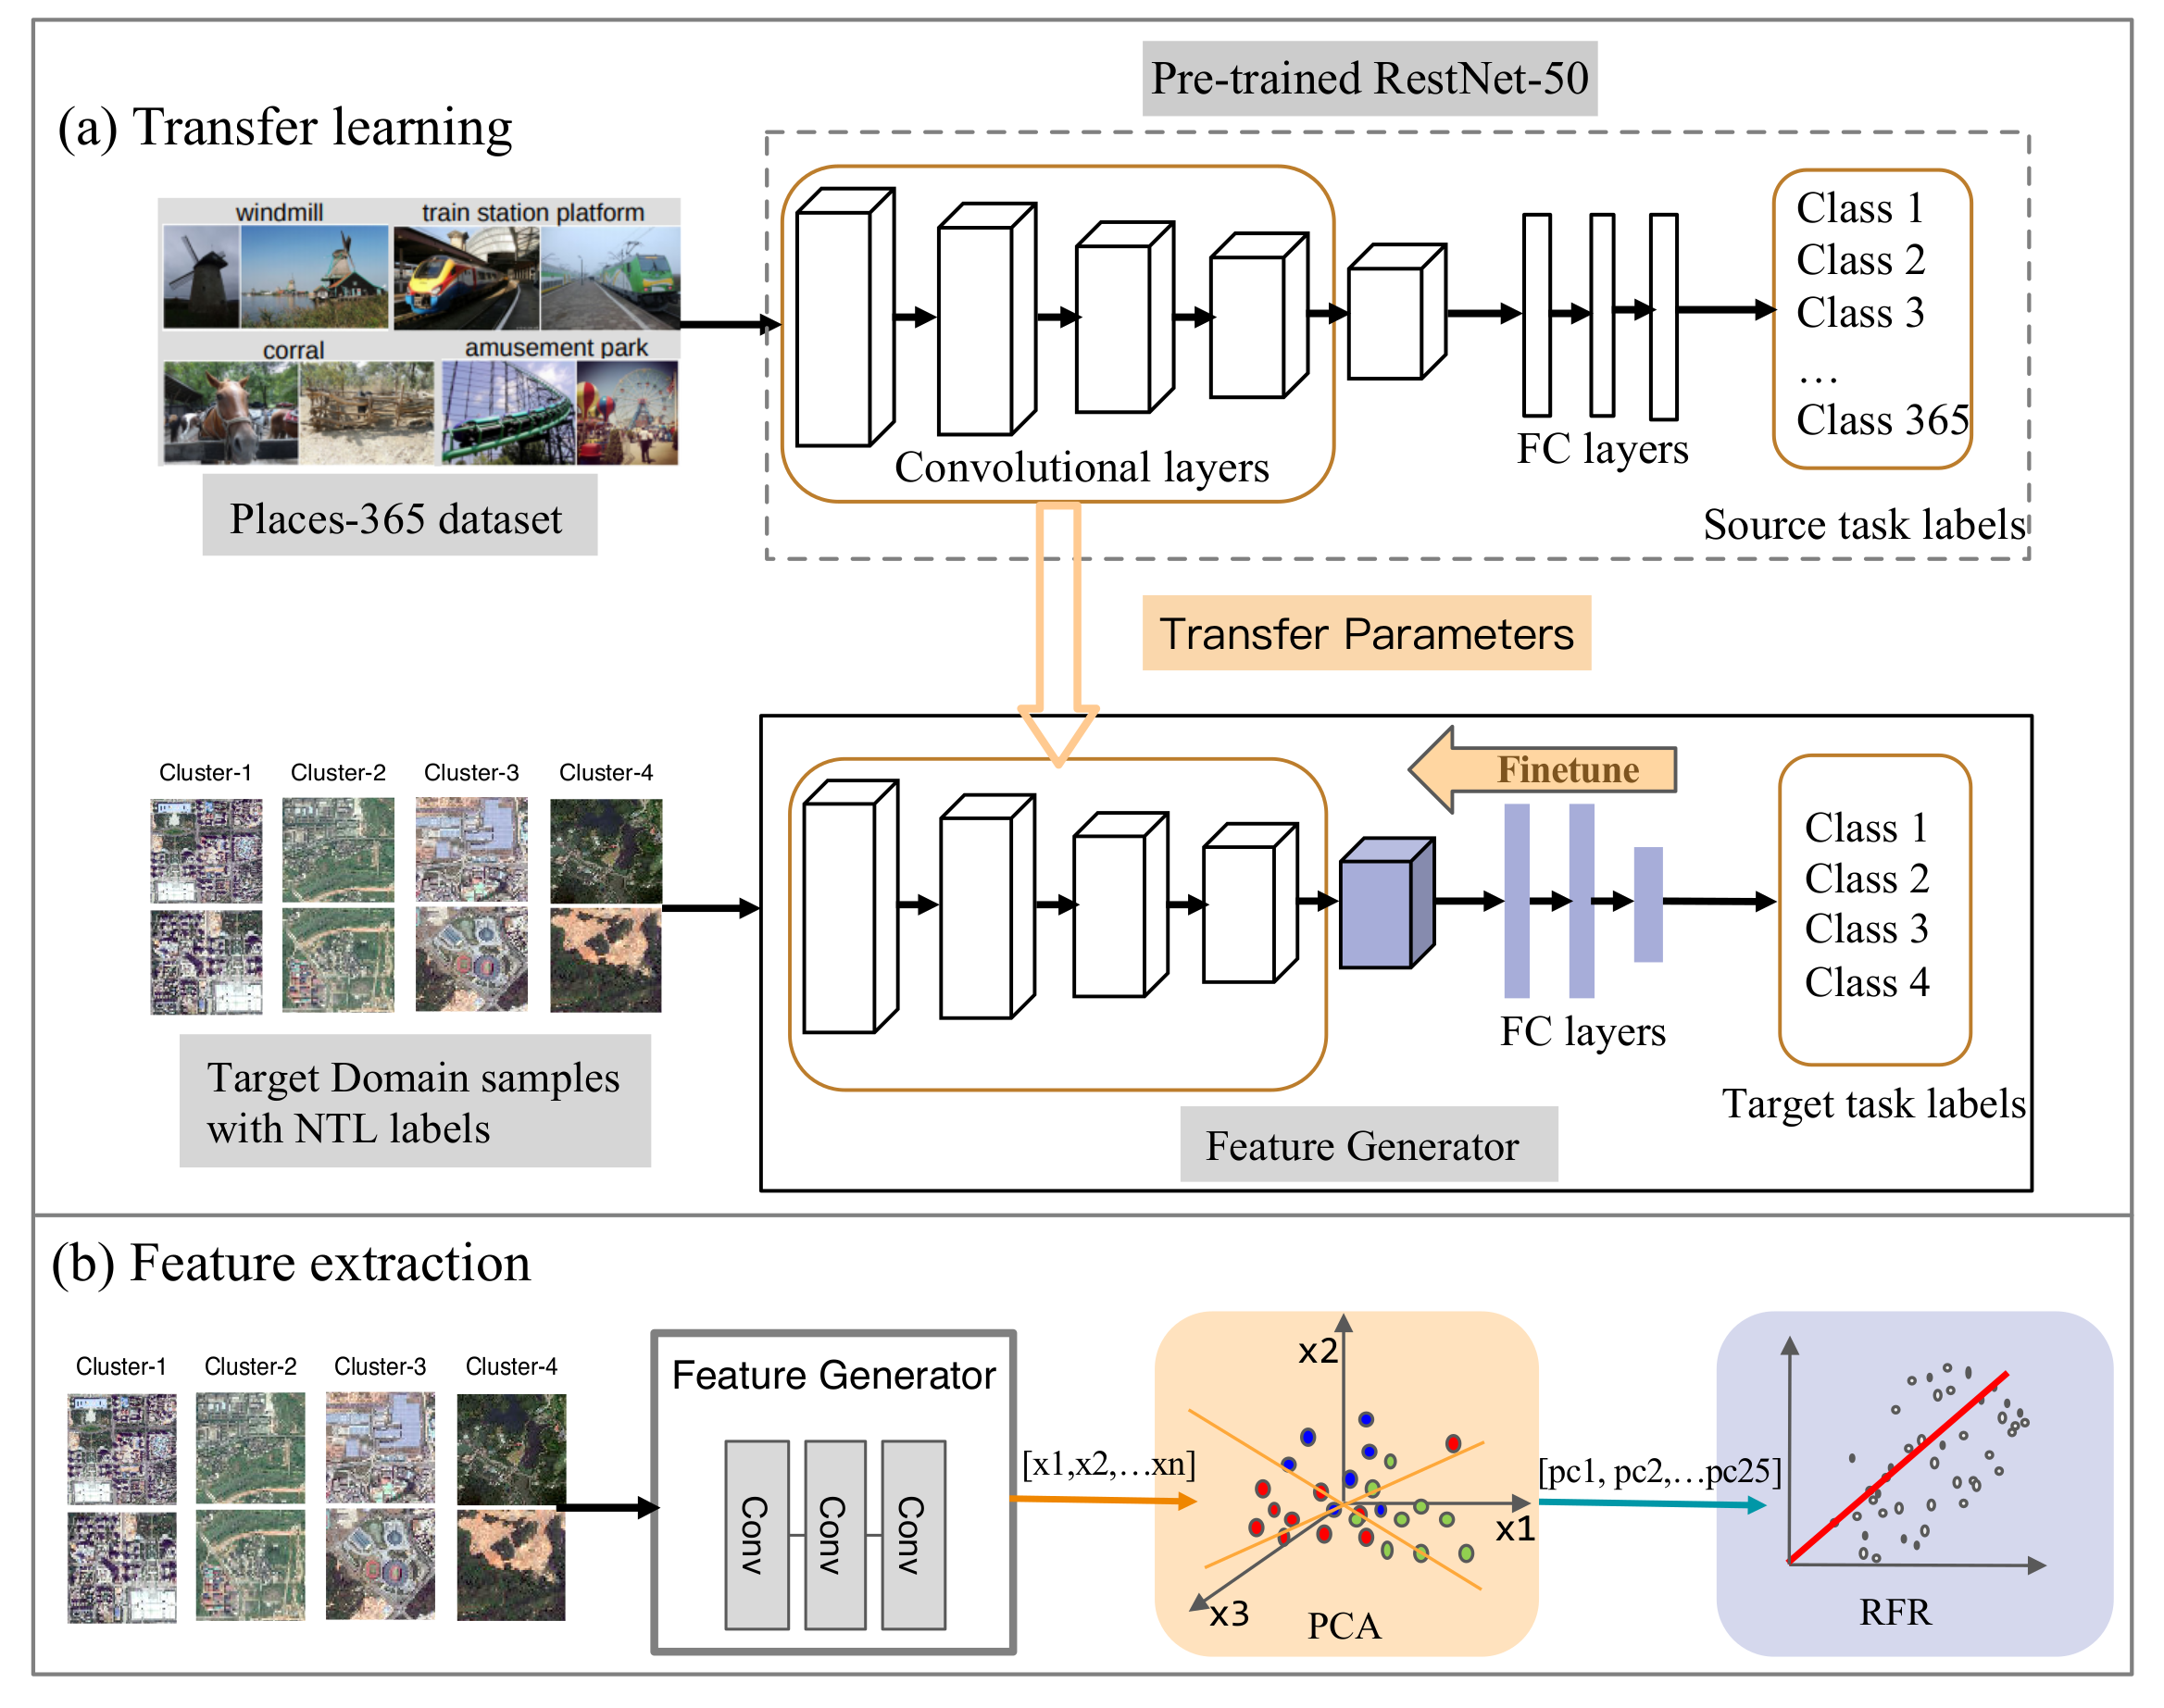
Figure 6.
The structure of ResNet-50.

Figure 7.
The estimated EPC map in the WGS 84 geographic coordinate system for (a): 2014, (b): 2015, (c): 2016, (d): 2017, (e): 2018, and (f): 2019 by utilizing the proposed method. The area in the red box mainly includes Futian District and Luohu District, and (a1–f1) shows the results of the red box in more detail. The maps were completed with the support of ArcGIS (version 10.5) software.
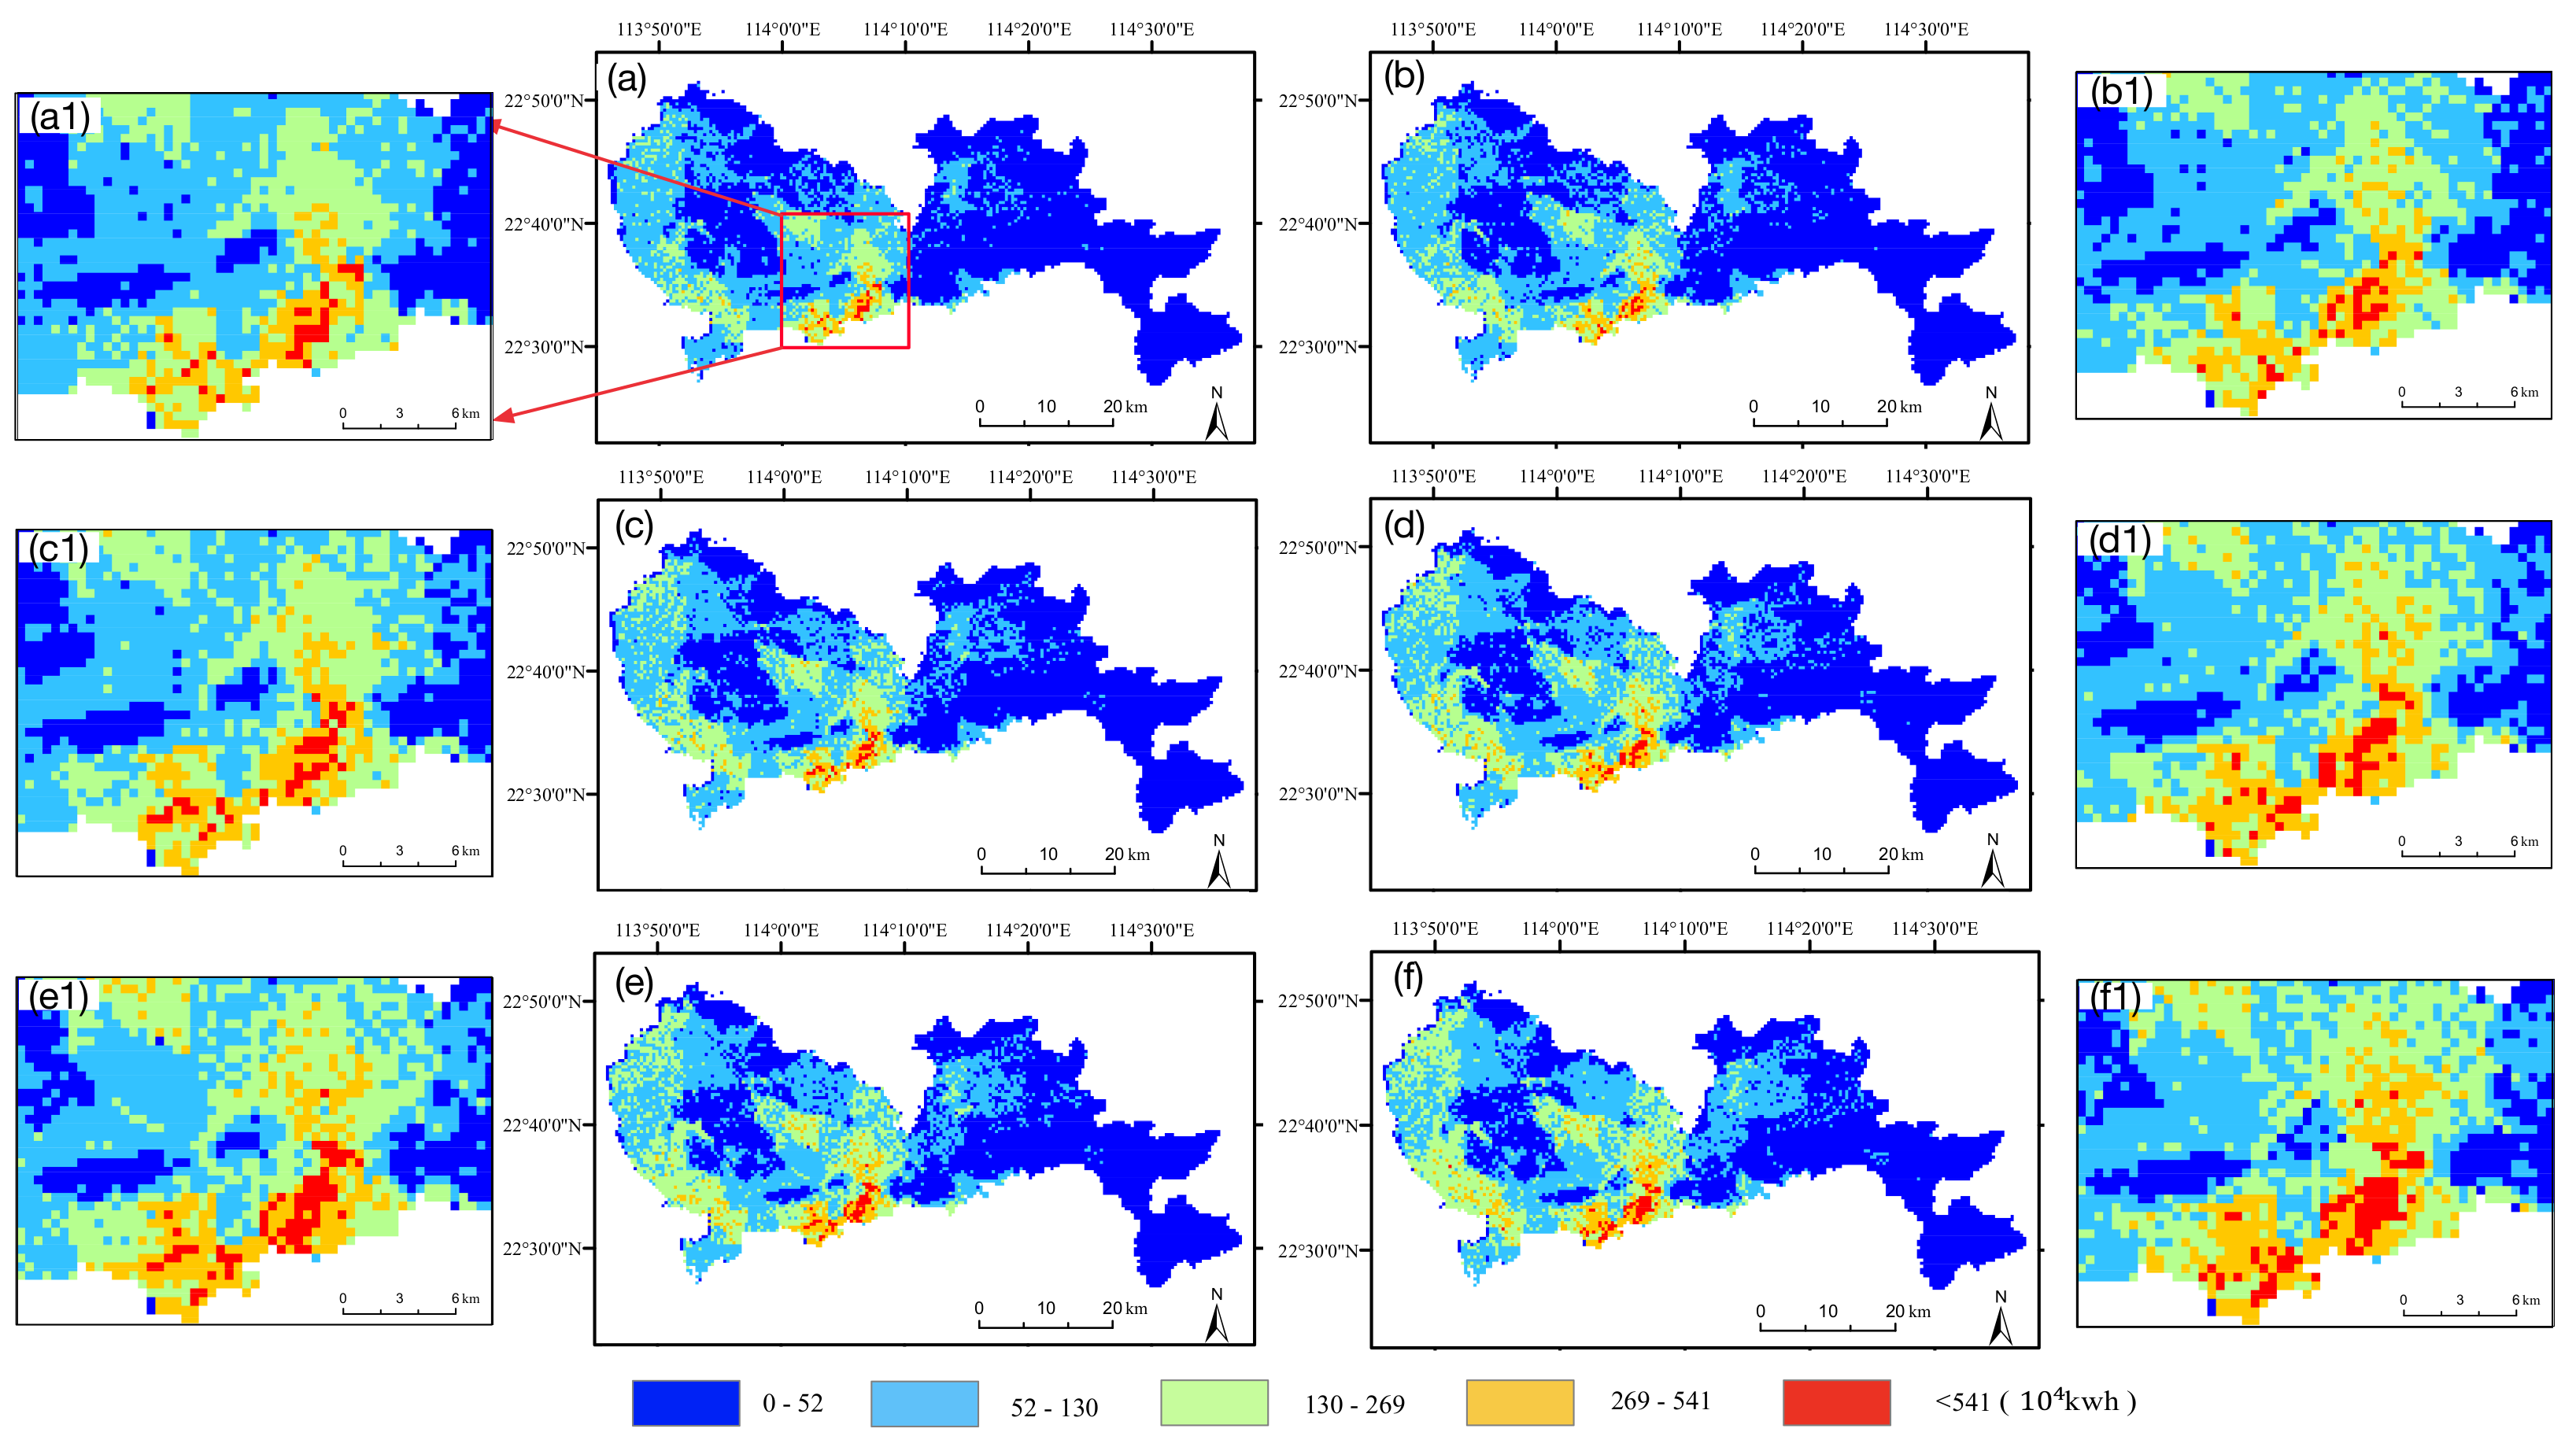
Figure 8.
Accuracy assessment between the estimated EPC and statistical EPC at the sub-district level in 2013. The blue line in each figure is the result of the linear fitting. (a) EPC results estimated by Shi’s product (Shi et al. 2016); (b) EPC estimation results based on RFR model (ours).
Figure 8.
Accuracy assessment between the estimated EPC and statistical EPC at the sub-district level in 2013. The blue line in each figure is the result of the linear fitting. (a) EPC results estimated by Shi’s product (Shi et al. 2016); (b) EPC estimation results based on RFR model (ours).
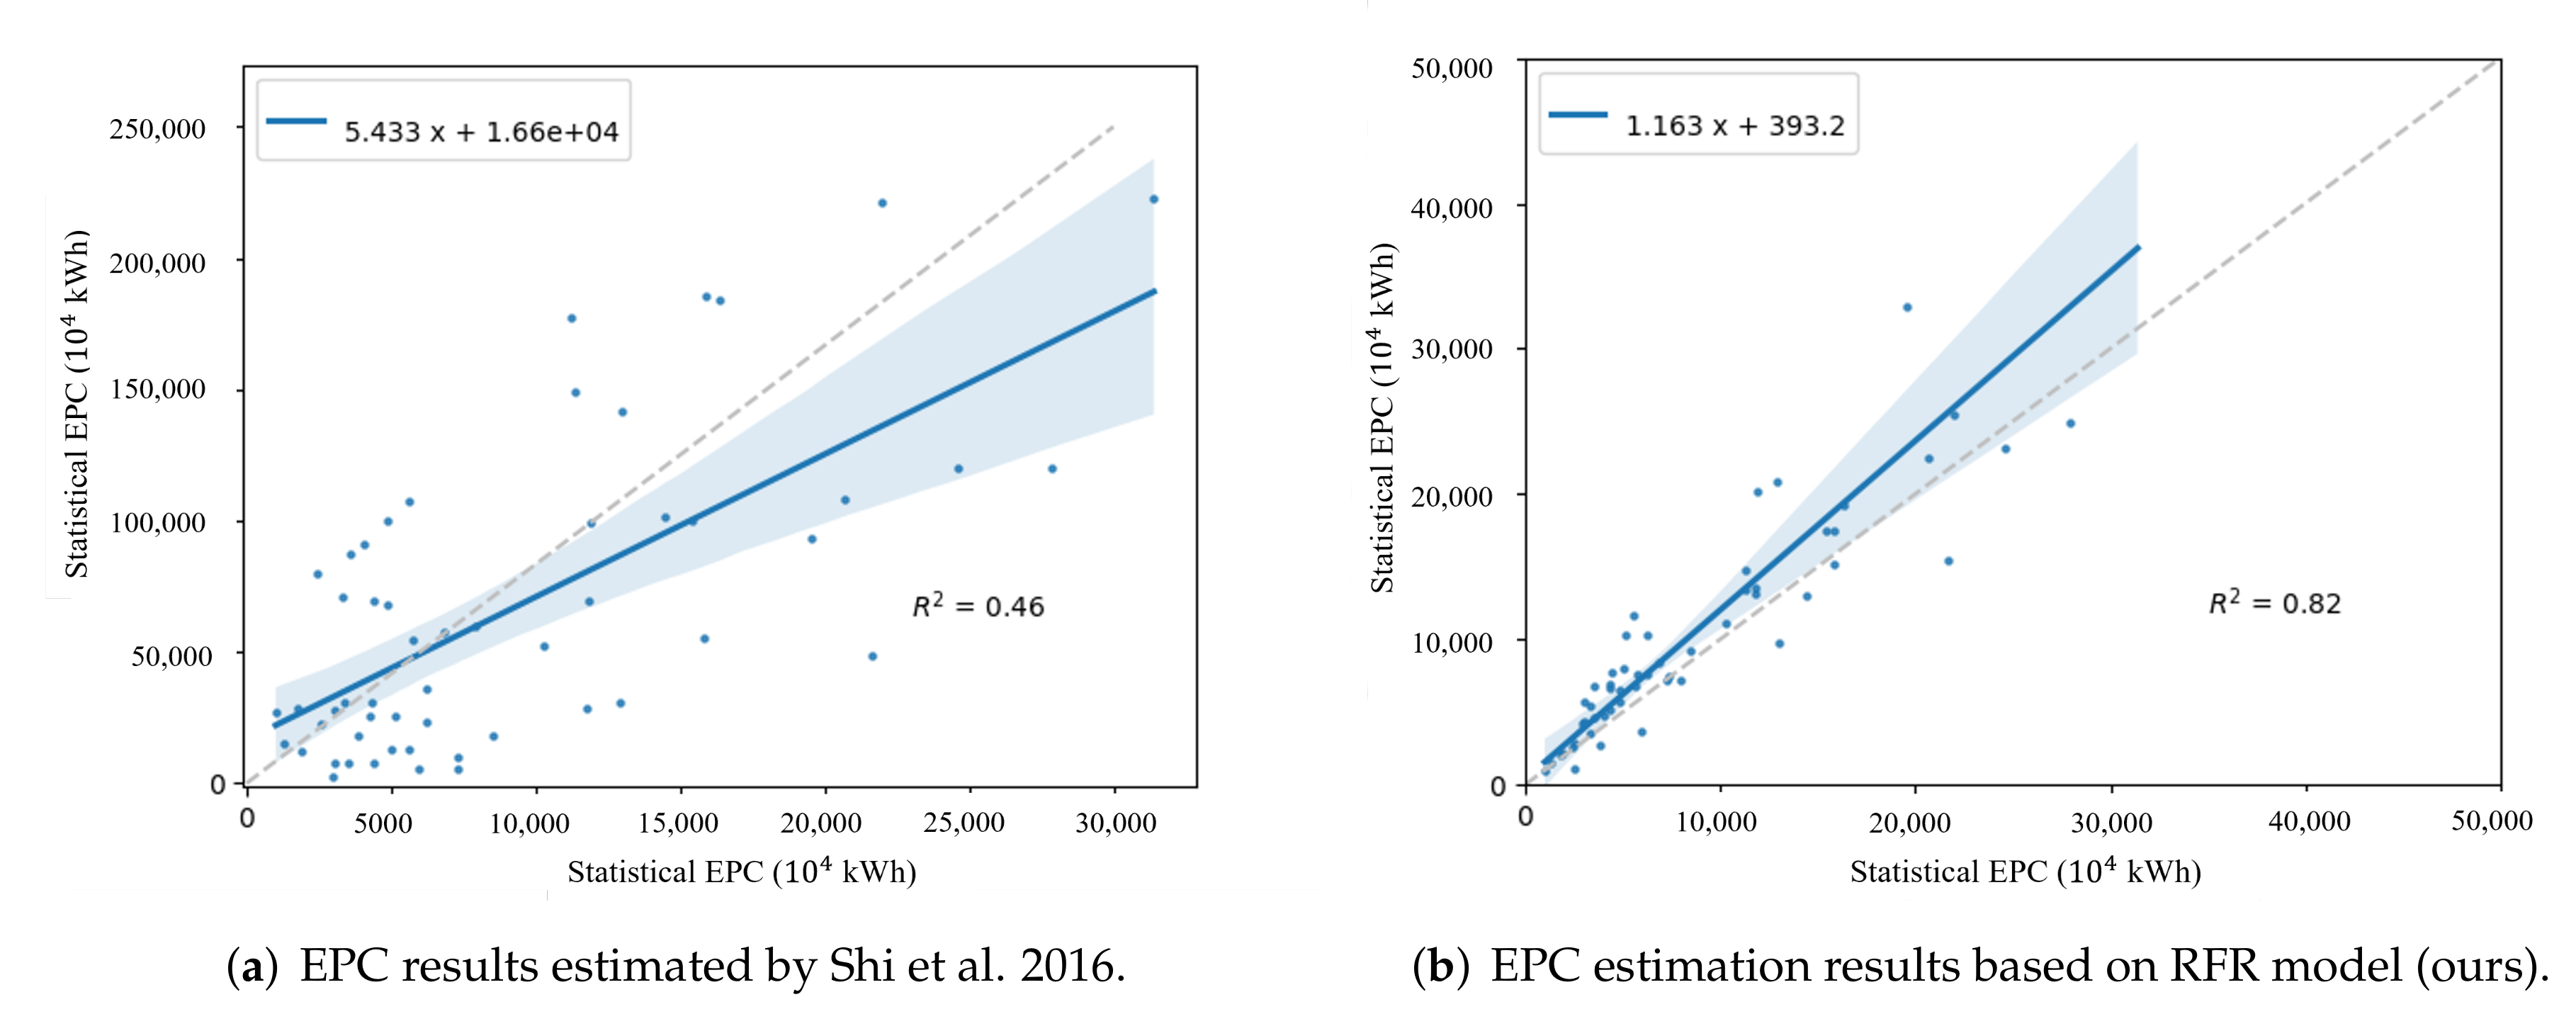
Figure 9.
The comparison histogram for results at district level.

Figure 10.
The estimated Shenzhen EPC maps at the pixel level in 2013. (a) The EPC result of the proposed model (the spatial resolution is consistent with the Suomi NPP-VIIRS data about 500 m); (b) The EPC result produced by Shi et al. at 1 km resolution. The maps were completed with the support of ArcGIS (version 10.5) software.
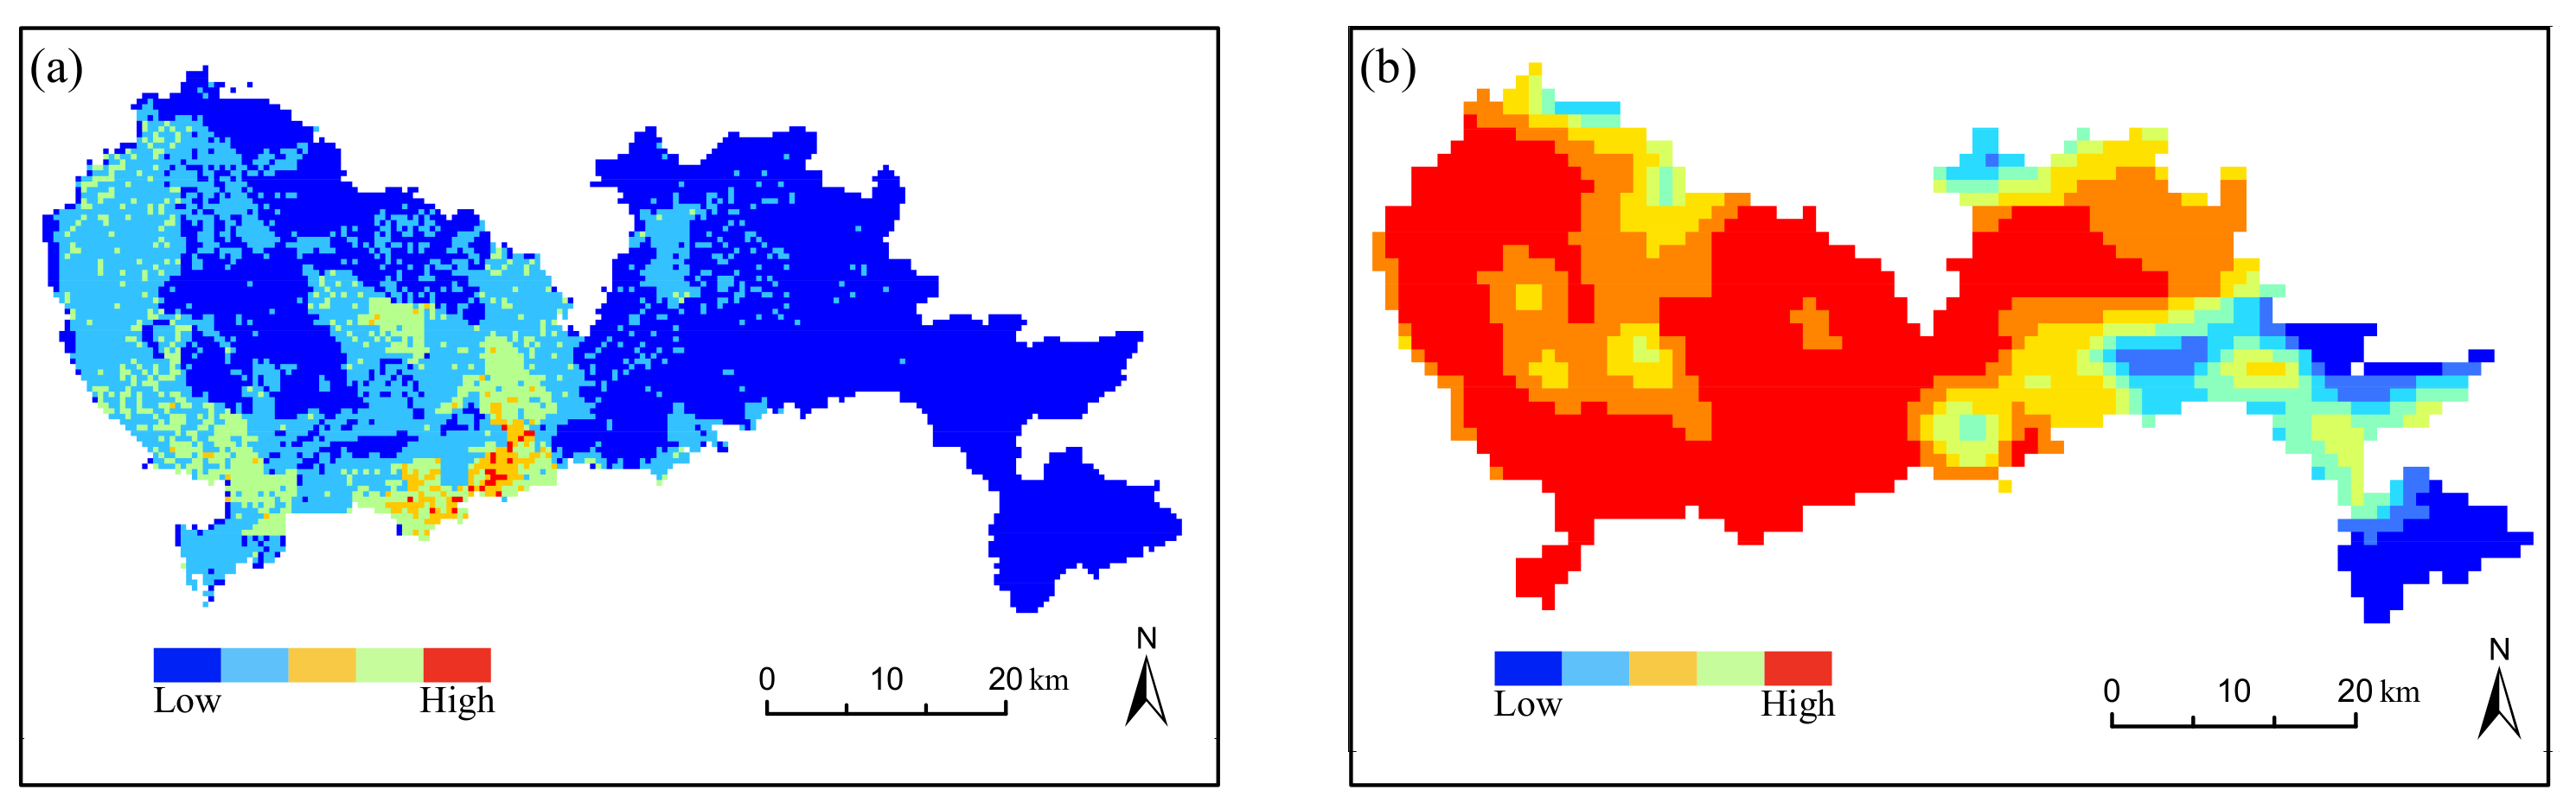
Figure 11.
Accuracy assessment of estimated EPC from 2014 to 2019 (a–f) in Shenzhen.
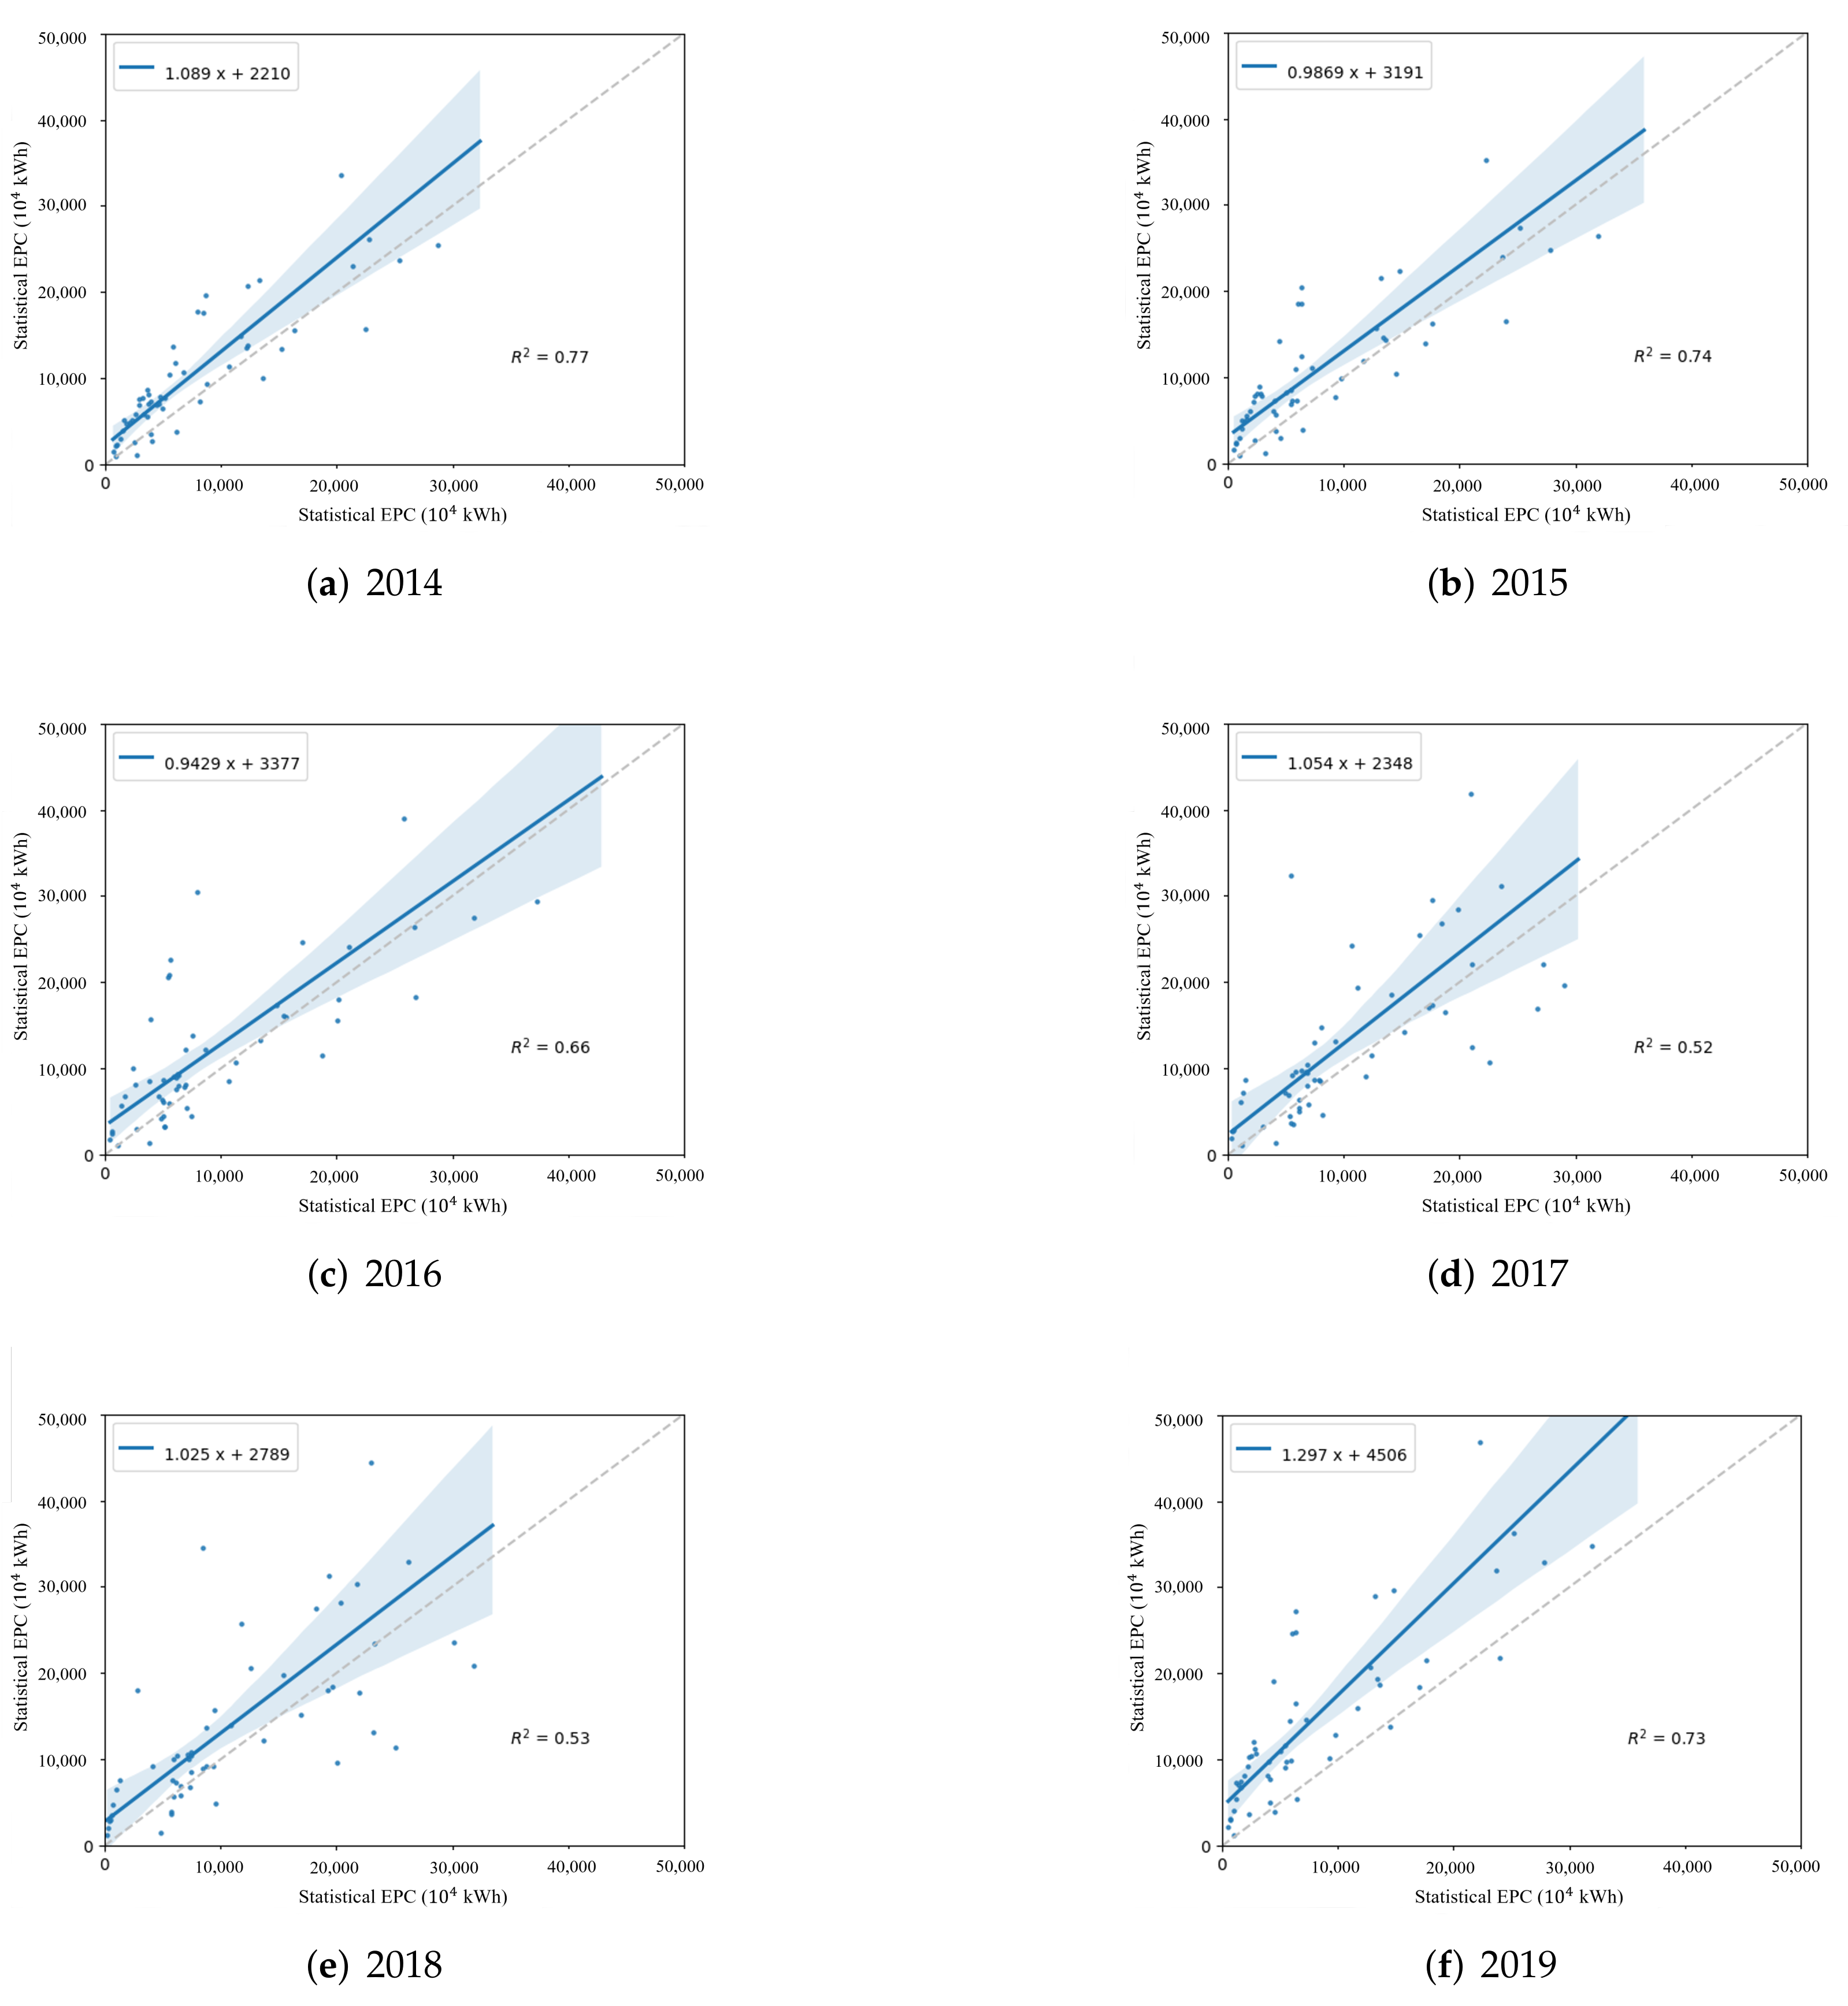
Figure 12.
The model interpretability studies using Grad-CAM. (A): an aerial tile from high-resolution imagery. (B): Grad-CAM is used to compute activation map for the poorest and wealthiest socio-economic class. The activation maps are then overlaid with the high-resolution image tiles (A). (C): The discontinuous urban fabric slums area division from the Shenzhen Planning Documents is mapped to this area.
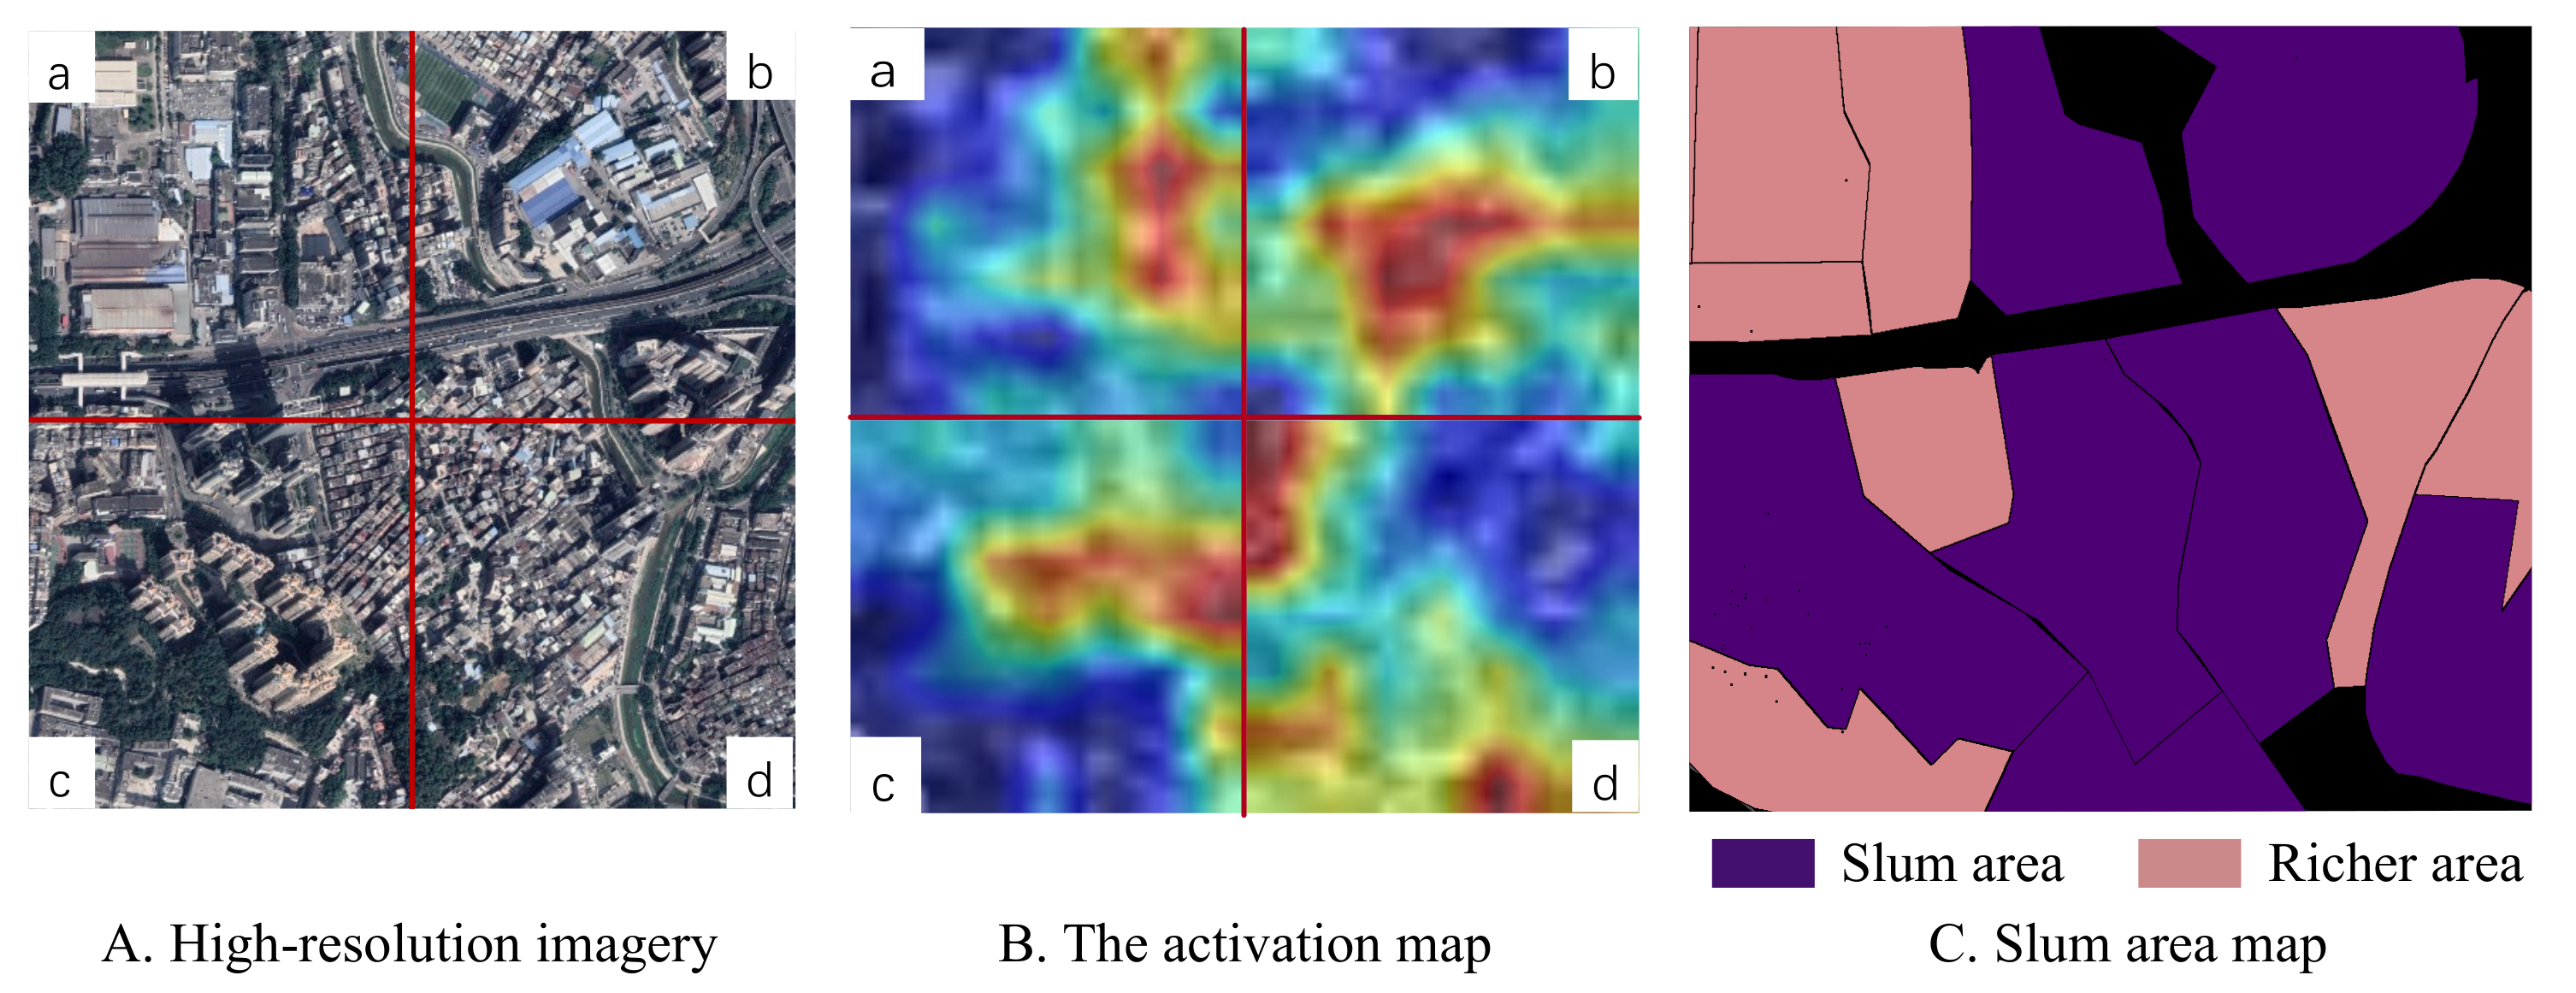
Figure 13.
The Gini importance of variables (FC0–FC24 represents the landscape features) in the RFR model.
Figure 13.
The Gini importance of variables (FC0–FC24 represents the landscape features) in the RFR model.
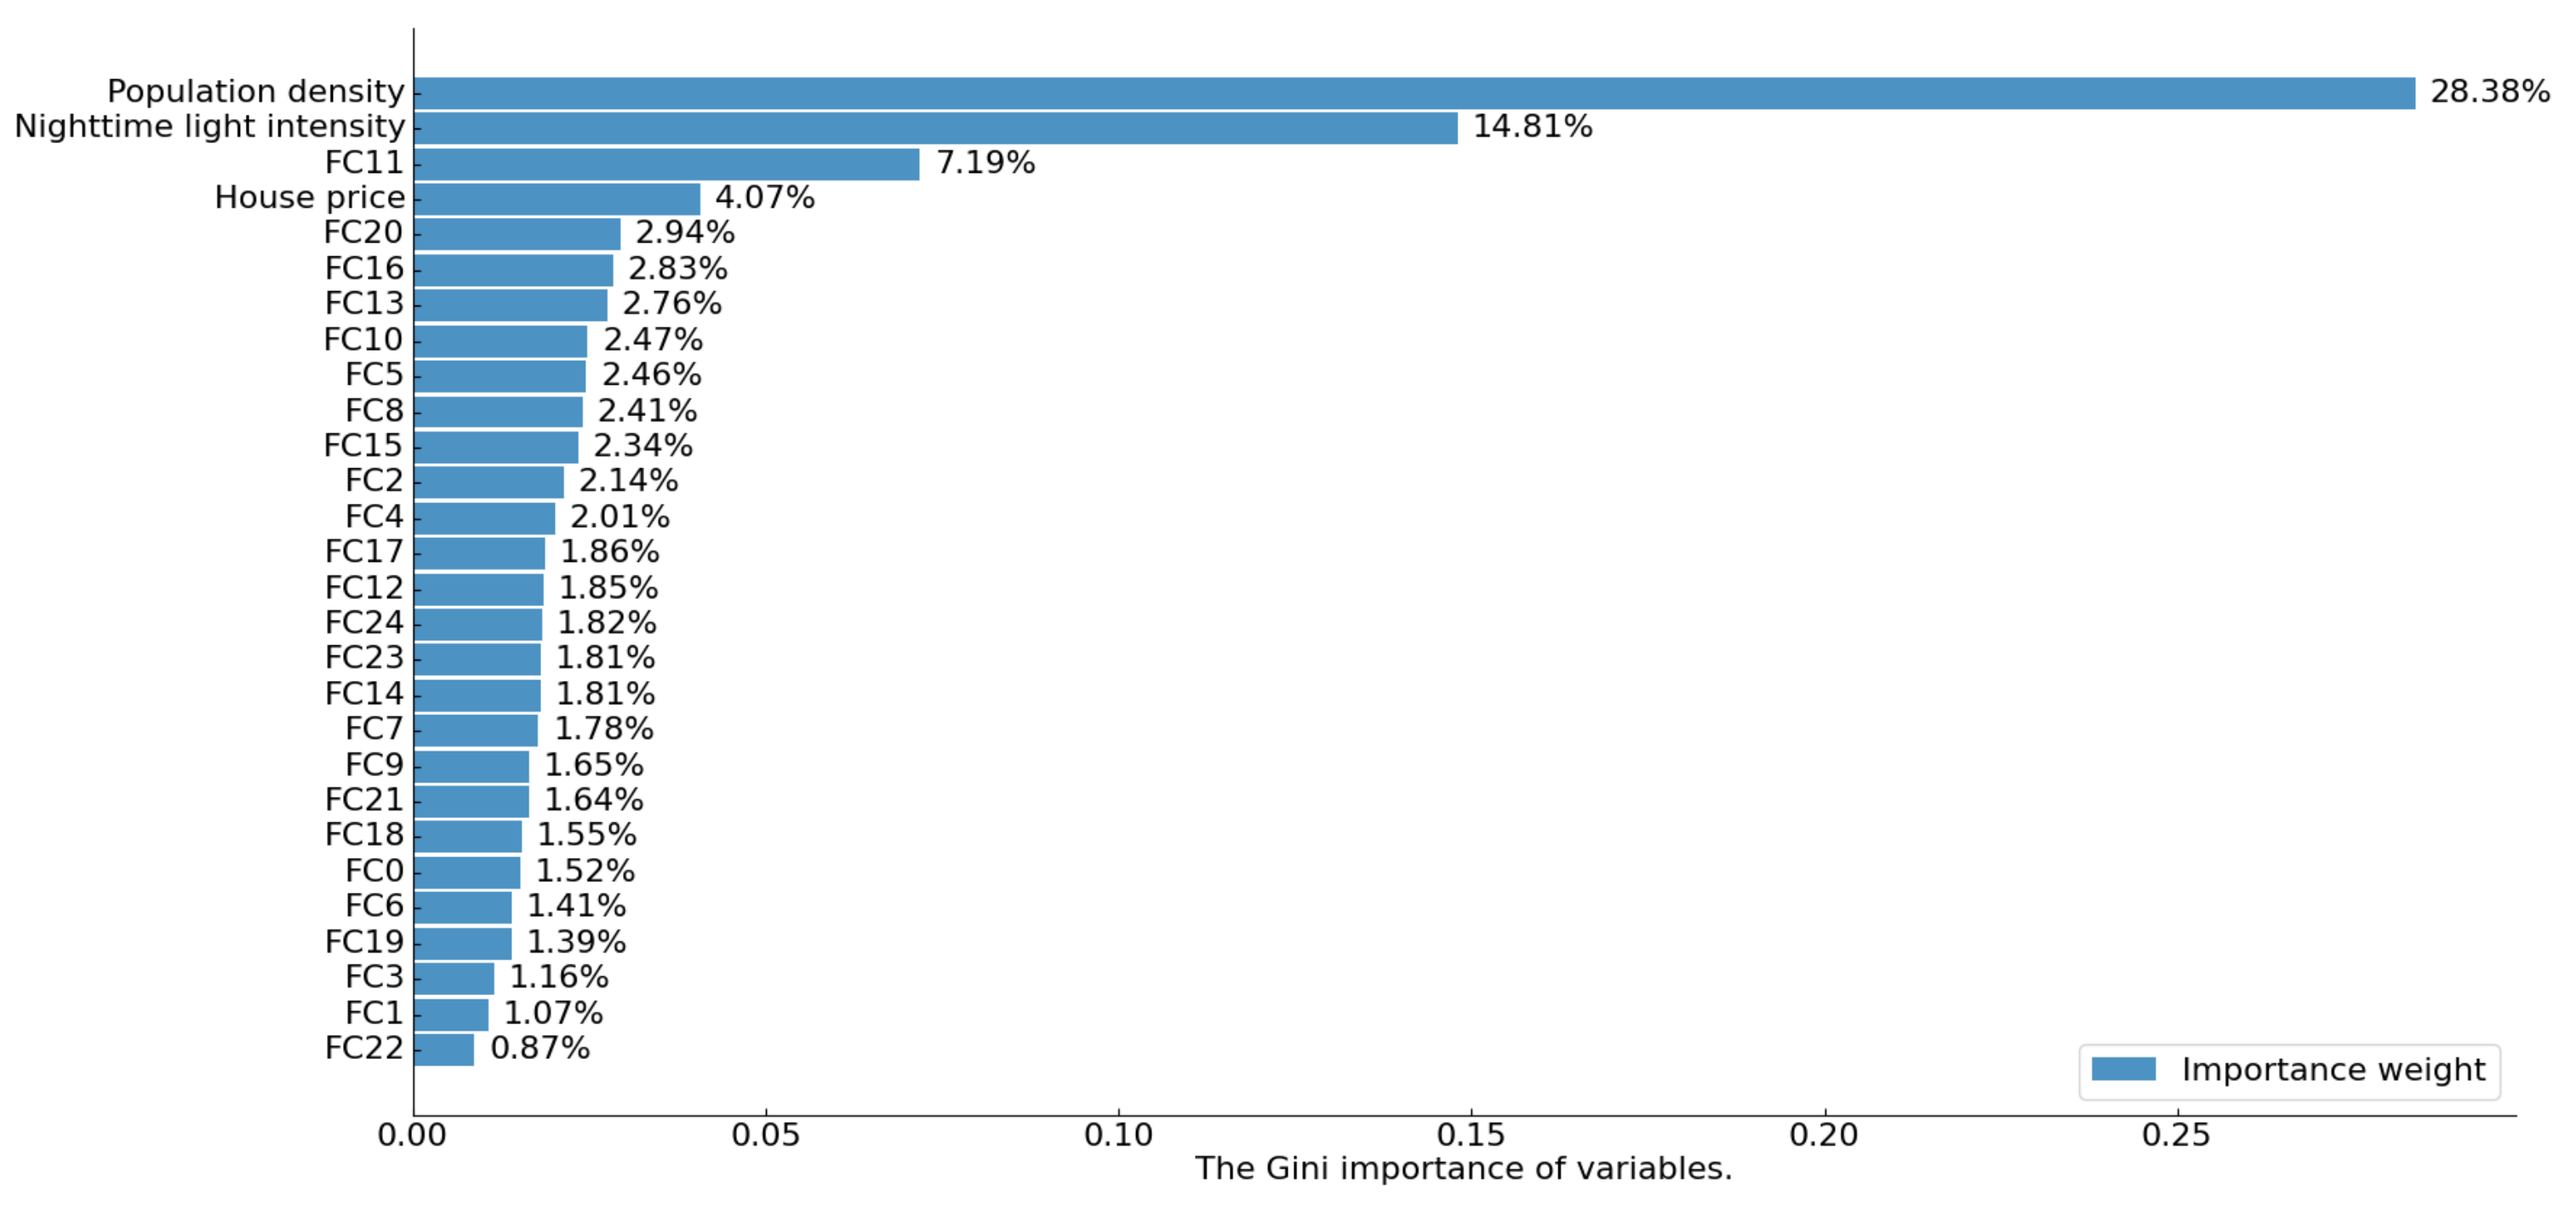
Figure 14.
The variation trends of EPC in Shenzhen from 2013 to 2019. (a) The variation of EPC at pixel level; (b) The variation trends of EPC at the sub-district level. The maps were completed with the support of ArcGIS (version 10.5) software.
Figure 14.
The variation trends of EPC in Shenzhen from 2013 to 2019. (a) The variation of EPC at pixel level; (b) The variation trends of EPC at the sub-district level. The maps were completed with the support of ArcGIS (version 10.5) software.

Table 1.
Multi-source data for EPC estimation.
| Data Description | Data Source | Spatial Resolution | Year Used |
|---|---|---|---|
| Monthly Suomi NPP-VIIRS nighttime lights | NOAA/NGDC (https://ngdc.noaa.gov/eog/viirs/(accessed on 10 December 2020)) | 500 m | 2013–2019 |
| High-resolution satellite imagery (Level-14) | Google Static Maps API (http://www.google.cn/intl/zh-CN/earth/(accessed on 1 May 2021)) | 17 m | 2013–2019 |
| WorldPop gridded population | WorldPop (https://www.worldpop.org/(accessed on 1 May 2021)) | 100 m | 2013–2019 |
| Demographic at Sub-district level | National Bureau of Statistics (http://www.stats.gov.cn/(accessed on 10 May 2021)) | Sub-district level | 2013–2019 |
| Per capita domestic electric power consumption | National Bureau of Statistics (http://www.stats.gov.cn/(accessed on 10 February 2021)) | National-level | 2013–2019 |
| Shenzhen administrative boundaries | Geospatial Data Cloud (http://www.gscloud.cn/(accessed on 10 February 2021)) | – | 2015 |
| Shenzhen house price | Fang.com website (http://Fang.com/(accessed on 10 February 2021)) | – | 2013–2019 |
Table 2.
Independent variables derived from multi-source data.
| Indicators | Feature Name | Description | Data Source |
|---|---|---|---|
| Economic variables | Nighttime light | The data value of nighttime light in each pixel; The mean data value of nighttime light in each sub-district. | Suomi NPP-VIIRS nighttime light data |
| House price | The max housing price at pixel level and sub-district level, respectively. | Shenzhen house price | |
| Population density | Population density | Population density at pixel level and sub-district level, respectively. | worldPop product |
| Landscape features | FC0–FC24 | 25 principal components extracted from high-resolution satellite images at pixel level and sub-district level, respectively. | Google Static Maps |
Table 3.
The correlation coefficient and significance test (P-values) for each indicator.
| Indicators | Correlation Coefficient | p-Values | Indicators | Correlation Coefficient | p-Values |
|---|---|---|---|---|---|
| FC0 | 0.164 * | 0.004 | FC14 | 0.107 * | 0.007 |
| FC1 | −0.110 * | 0.030 | FC15 | 0.076 * | 0.039 |
| FC2 | −0.153 * | 0.000 | FC16 | 0.218 * | 0.000 |
| FC3 | 0.239 * | 0.005 | FC17 | 0.013 * | 0.005 |
| FC4 | 0.076 * | 0.005 | FC18 | −0.228 * | 0.004 |
| FC5 | 0.001 * | 0.001 | FC19 | −0.026 | 0.605 |
| FC6 | −0.138 * | 0.007 | FC20 | −0.149 * | 0.003 |
| FC7 | −0.326 * | 0.008 | FC21 | −0.116 * | 0.023 |
| FC8 | 0.201 * | 0.000 | FC22 | −0.144 * | 0.005 |
| FC9 | 0.119 * | 0.020 | FC23 | −0.207 * | 0.000 |
| FC10 | 0.010 * | 0.008 | FC24 | −0.039 * | 0.005 |
| FC11 | 0.204 * | 0.000 | Nighttime light | 0.264 * | 0.000 |
| FC12 | 0.364 * | 0.009 | House price | 0.102 * | 0.000 |
| FC13 | 0.312 * | 0.000 | Population density | 0.082 * | 0.004 |
* Represents correlation is significant at 0.05. p-values ≤ 0.05, FC0–FC24: refers to the landscape features.
Table 4.
The random forest model parameters.
| Parameter Name | Description | Optimal Value |
|---|---|---|
| N_estimators | Number of trees | 289 |
| Max_depth | Maximum depth of the tree | 22 |
| Min_samples_split | Minimum number of samples required to split an internal node | 2 |
| Min_samples_leaf | Minimum number of samples required to be at a leaf node | 2 |
Table 5.
Comparison of the EPC estimated accuracy between Shi’s product and ours.
| Model | RMSE | MAE | RSD | |
|---|---|---|---|---|
| Shi’s | 72,178.27 | 52,149.42 | 0.46 | 87.30% |
| Ours | 4357.10 | 3250.34 | 0.82 | 63.15% |
Publisher’s Note: MDPI stays neutral with regard to jurisdictional claims in published maps and institutional affiliations. |
© 2022 by the authors. Licensee MDPI, Basel, Switzerland. This article is an open access article distributed under the terms and conditions of the Creative Commons Attribution (CC BY) license (https://creativecommons.org/licenses/by/4.0/).
Share and Cite
MDPI and ACS Style
Cheng, L.; Feng, R.; Wang, L.; Yan, J.; Liang, D. An Assessment of Electric Power Consumption Using Random Forest and Transferable Deep Model with Multi-Source Data. Remote Sens. 2022, 14, 1469. https://doi.org/10.3390/rs14061469
AMA Style
Cheng L, Feng R, Wang L, Yan J, Liang D. An Assessment of Electric Power Consumption Using Random Forest and Transferable Deep Model with Multi-Source Data. Remote Sensing. 2022; 14(6):1469. https://doi.org/10.3390/rs14061469
Chicago/Turabian StyleCheng, Luxiao, Ruyi Feng, Lizhe Wang, Jining Yan, and Dong Liang. 2022. "An Assessment of Electric Power Consumption Using Random Forest and Transferable Deep Model with Multi-Source Data" Remote Sensing 14, no. 6: 1469. https://doi.org/10.3390/rs14061469
Note that from the first issue of 2016, this journal uses article numbers instead of page numbers. See further details here.