
Assessment of Canopy Health with Drone-Based Orthoimagery in a Southern Appalachian Red Spruce Forest


1
Department of Geography, Virginia Tech, Blacksburg, VA 24061, USA
2
Department of Forest Resources and Environmental Conservation, Virginia Tech, Blacksburg, VA 24061, USA
*
Author to whom correspondence should be addressed.
Remote Sens. 2022, 14(6), 1341; https://doi.org/10.3390/rs14061341
Submission received: 22 January 2022
/
Revised: 28 February 2022
/
Accepted: 3 March 2022
/
Published: 10 March 2022
(This article belongs to the Special Issue Drones for Ecology and Conservation)
Abstract
:Consumer-grade drone-produced digital orthoimagery is a valuable tool for conservation management and enables the low-cost monitoring of remote ecosystems. This study demonstrates the applicability of RGB orthoimagery for the assessment of forest health at the scale of individual trees in a 46-hectare plot of rare southern Appalachian red spruce forest on Whitetop Mountain, Virginia. We used photogrammetric Structure from Motion software Pix4Dmapper with drone-collected imagery to generate a mosaic for point cloud reconstruction and orthoimagery of the plot. Using 3-band RBG digital orthoimagery, we visually classified 9402 red spruce individuals, finding 8700 healthy (92.5%), 251 declining/dying (2.6%), and 451 dead (4.8%). We mapped individual spruce trees in each class and produced kernel density maps of health classes (live, dead, and dying). Our approach provided a nearly gap-free assessment of the red spruce canopy in our study site, versus a much more time-intensive field survey. Our maps provided useful information on stand mortality patterns and canopy gaps that could be used by managers to identify optimal locations for selective thinning to facilitate understory sapling regeneration. This approach, dependent mainly on an off-the-shelf drone system and visual interpretation of orthoimagery, could be applied by land managers to measure forest health in other spruce, or possibly spruce-fir, communities in the Appalachians. Our study highlights the usefulness of drone-produced orthoimagery for conservation monitoring, presenting a valid and accessible protocol for the monitoring and assessment of forest health in remote spruce, and possibly other conifer, populations. Adoption of drone-based monitoring may be especially useful in light of climate change and the possible displacement of southern Appalachian red spruce (and spruce-fir) ecosystems by the upslope migration of deciduous trees.
Keywords:
conservation management; Picea rubens; drone; UAV; orthoimagery; mortality; Whitetop Mountain; kernel density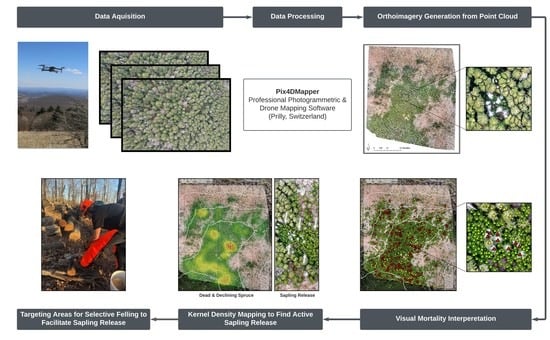
1. Introduction
Globally rare southern Appalachian spruce-fir forests (Picea rubens Sarg.-Abies fraseri (Pursh) Poir.) are represented by clusters of disjunct populations confined to the highest elevations of southwestern Virginia, eastern Tennessee, and western North Carolina. Thought to have originated during the last glacial episode [1,2,3], these Pleistocene relicts are now isolated from similar spruce-fir forests characteristic of northern latitudes. Mountaintop spruce-fir habitats host federally listed endangered species and are targeted by management agencies for conservation [4]. These southern spruce-fir forests provide critical breeding grounds for a variety of vulnerable land birds, such as the northern saw-whet owl, the red-breasted nuthatch, and the brown creeper, with some endemic to these highland forests [5,6,7]. Southern Appalachian spruce-fir forests have been cited as the second most-threatened habitat type in the United States [8] due to historical logging, recreational development, air pollution, the proliferation of invasive insects (such as the balsam woolly adelgid), damage from native insects, increasing temperatures, and isolation owing to a narrow range of appropriate conditions [9,10,11]. Recent genomic research on red spruce populations throughout its North American range suggests that the species comprises three geographically distinct phylogenetic subgroups, with only remnants still present on the landscape today [12], and cites reduced genetic diversity due to the dwindling exchange between disjunct populations as a driver of gradual species decline over the past several thousand years. This finding points toward the need for careful monitoring of the health and regeneration of the remaining red spruce populations.
Consumer-grade, “off-the-shelf” UAVs provide a means of regular, cost-effective landscape monitoring in a broad array of land cover types. From a conservation management perspective, the efficiency and effectiveness of consumer-grade drone-based landscape modeling favor its broadscale use compared to conventional field surveying methods. The use of UAV Structure-from-Motion (SfM) data is gaining attention for landscape monitoring and change detection [13,14,15,16], and forest structure modeling [17,18]. SfM algorithms use consecutive georeferenced images to model 3-D subjects effectively. UAV-based SfM modeling of forested environments is an ongoing area of research and is more error-prone when compared to modeling of less “deep” scenes where less optical penetration is required [19]. Thus, different forest types will have varying degrees of reconstruction accuracy. For example, deciduous forest canopies are typically random and congested, while coniferous forests are more patterned and more discernable to SfM algorithms. UAV flight parameters also impact the accuracy of the 3-D model reconstruction and subsequent orthoimagery generation [20].
Drone images and subsequent photogrammetric landscape reconstruction (structure from motion or SfM) provide high spatial resolution and temporal specificity at a lower cost than lidar and may be especially helpful in forested environments where tree branches have little overlap and thus represent discrete individuals (common in some conifer forests), and where the lower canopy scene is not obstructed by foliage [20]. At appropriate sites, researchers and land managers can gain a detailed understanding of forest structure and health, substantially reducing the fieldwork required to gain the same, or oftentimes, lower-resolution information.
Orthoimagery generated from the point cloud is processed from georeferenced UAV images. The proportion of the forest understory visible from the drone perspective is related to the forest type and morphology of constituent trees, the UAV camera parameters, and the camera perspective relative to the reconstructed area with individual tree crowns that can be easily distinguished from neighbors, overlapping very little [21,22]. For this reason, UAVs equipped with optical (RGB) and multispectral sensors have shown particular utility in modeling coniferous forest structures. Specifically, three-band (RGB) orthoimagery can provide valuable insights about forest stand dynamics, including individual tree delineation and vitality/mortality information [23,24]. RGB data are easily attainable as most consumer-grade drones “out of the box” are equipped with an optical sensor. Studies using drone-based RGB orthoimagery as a source of spruce forest health data [22] are still sparse, but our research aims to contribute to this body of research.
This paper presents an analysis of red spruce forest health and structure in a large (46 ha) sample plot at Whitetop Mountain from UAV photogrammetry. The red spruce-dominated site at Whitetop is essentially a boreal (evergreen, coniferous) forest at high elevation rather than latitude and is thus, a prime candidate for high accuracy forest reconstruction using a consumer-grade UAV. Here, we present evidence of the utility of UAV-collected RGB imagery to remotely assess forest health at the scale of individual trees and to reproduce forest structure and composition for other types of analyses, such as linking mortality to site factors and pinpointing areas of regeneration. Our primary goals were to (1) quantify the health (healthy, declining, or dead) at the individual-tree scale in our study area, and (2) develop a protocol to relatively rapidly assess and monitor the health of other spruce populations that can be adopted for conservation management in high-elevation Appalachian spruce forests and possibly in spruce-fir and other conifer systems.
2. Materials and Methods
2.1. Study Area
Whitetop Mountain (1682 m), Virginia’s second-highest peak, is located in the Virginia Balsam Mountains, to the west of the Blue Ridge escarpment and one ridge to the east of the Iron Mountain range. It hosts one of the state’s few extant red spruce populations [3]. The mountain, composed primarily of light-colored silica-rich rhyolite, is part of the Mt. Rogers volcanic center: a remnant of ancient volcanoes that erupted over 700 million years ago [25]. Atop the headwaters for several surrounding watersheds, this often-clouded forest regulates the health of downstream aquatic ecosystems [26]. Unlike other highland forests in the Mount Rogers area, where red spruce co-dominates with Fraser fir, Whitetop Mountain is free of Fraser fir [3,4,27]. The absence of fir on Whitetop remains unexplained. In the Great Smoky Mountains of Tennessee, a spruce-fir forest lost its Fraser fir component to an adelgid infestation [10] causing increased exposure of red spruce to violent windthrow and a consequent spike in spruce mortality. It is unclear whether the homogeneity of the red spruce forest on Whitetop increases its vulnerability to mortality, such as from exposure to windthrow, but it is certainly subject to the same disturbances that threaten other southern Appalachian spruce-fir forests. The most recent outbreak of the southern pine beetle in 2003–2004 caused considerable spruce decline on Whitetop and warranted immediate mitigation by the U.S. Forest Service, including removing dozens of mature spruce [10]. Monitoring the health of red spruce and spruce/fir forests, such as the one on Whitetop, is important for conservation efforts aimed at the maintenance of biodiverse Southern Appalachian highlands. The red spruce forest at Whitetop is managed by the interagency Southern Appalachian Spruce Restoration Initiative (SASRI), comprising personnel from the U.S. Forest Service, the U.S. Fish and Wildlife Service, the 501(c)(3) non-profit Appalachian Trail Conservancy, and various academic institutions.
Our 46-ha sample plot contains a central dense red spruce stand on a rounded peak surrounded by a mosaic of smaller red spruce stands on the backdrop of a northern hardwood forest (Figure 1). Three major ecosystem types are represented on the upper slopes and peak of Whitetop Mountain: northern hardwood forest, southern Appalachian red spruce forest, and southern Appalachian grass bald. The northern hardwood forest, characterized by yellow birch (Betula alleghaniensis), sugar maple (Acer saccharum), American beech (Fagus grandifolia), and the red spruce stand at the peak, are typical of higher-latitude regions and border the bald spanning the southern slopes of Whitetop [28,29]. The high-elevation red spruce forest and grassland provide unique habitats for many endemic plants and animals and add considerable biodiversity to the region [30]. At least three fires burned Whitetop’s red spruce forest in the early 1900s, with one of them severe enough in some areas to cause a conversion to disturbance-dependent hardwoods [10]. Land managers planted red spruce in the adjacent grass bald to expand the spruce forest (clearly visible in Figure 1). Management of these high-elevation ecosystems requires an integrated approach that favors expansion of the red spruce forest to its historical extent while preserving the extent of the adjacent grass bald and rare heliophytes the bald supports.
2.2. Orthoimagery Collection/Generation
We collected optical UAV data and subsequently generated orthoimagery of the 46-hectare plot on the northeast slope of Whitetop Mountain, 13 January 2020, during unseasonably warm and low-wind conditions (summit temperature approximately 4.4 degrees C, winds 8–16 km/h). A clearing in the generally dense spruce forest provided a launch point for our UAV and allowed compliance with FAA visual flight rules. We flew the UAV at a maximum height of 120 m above ground level (AGL). Two single grids were flown using a consumer-grade UAV (DJI Mavic 2 Pro, Shenzhen, Guangdong, China) equipped with a Hasselblad L1D-20c RGB camera. Both grids had a similar spatial extent. Overlap was 80%, sidelap was 70%, and the camera angle was set to 90 degrees for both flights. The flight was automated using the Pix4Dcapture application and several software parameters appropriate for forest reconstruction (Table 1). We used photogrammetric Structure from Motion (SfM) software Pix4Dmapper (Lausanne, Switzerland) with consumer-grade UAV collected imagery of the sample plot to generate a mosaic for point cloud reconstruction and orthoimagery generation. Pix4D identifies like pixels in multiple images (keypoints) and generates three-dimensional structures of surveyed objects. These 3-dimensional landscape representations, called point clouds, can be used to produce orthoimagery and digital surface models.
2.3. Visual Interpretation of Spruce Health Status from Orthomosaic
The completed orthoimagery (Figure 2) allowed for a manual interpretation of sample points into classes based on observable morphology: (1) standing dead red spruce trees in the forest canopy, (2) standing red spruce trees showing signs of decline via dead limbs, (3) healthy (no dead limbs) standing red spruce trees, (4) leaf-off deciduous trees (primarily yellow birch, personal observations) in the canopy, and (5) fallen red spruce trees, clearly in a horizontal position. We created a feature class for each category, though we did not include the leaf-off deciduous or fallen red spruce trees in this analysis. Overall, of the 9439 identified red spruce stems, 7.4% (702), were either dead or declining (Table 2, Figure 3). Manual class interpretation involved visual inspection of orthoimagery with an overlain fishnet and abiding by the following parameters for each classification schema in ArcGIS Pro: 1. All points denoting a spruce crown in all classes were placed as close to the centroid of the spruce crown as possible; 2. Trees classified as ‘dead’ could not have sprawling limbs characteristic of a few deciduous yellow birch trees mixed in; 3. Trees classified as ‘dying’ were identified by signature white-colored dead spruce limbs present in a significant portion of an individual crown with green foliage in the surrounding pixels as part of the same crown; 4. Trees were marked as ‘dying’ if we estimated 50% or more of spruce limbs radiating from the crown centroid appeared dead; 5. If an individual was discolored, but there were no signs of dead spruce limbs, it was marked as healthy.
2.4. Kernel Density Estimation of Spruce Classes
Mapping the distribution of individual spruce within all health classes allows the identification of areas of spruce recruitment. In ArcGIS, the kernel density tool generates a raster mosaic where each pixel is symbolized by the number of points in the surrounding neighborhood. We applied the kernel density tool in ArcGIS Pro (V2.2, Redlands, CA, USA) to the classification data to produce maps of the density of (1) all spruce and (2) dead and declining spruce within the forest. The search radius was set to 10 m, cell size to 1 m2, and output cell values tool to densities. Non-spruce forest areas were excluded from the analysis to mitigate edge effects.
3. Results
3.1. Interpretation of Spruce Health Status from Orthomosaic and Kernel Density Estimation
Our UAV-derived high-resolution orthoimagery allowed visual classification of all red spruce individuals into four categories (healthy, dead, declining, fallen) based on morphology and color. Of the 9439 identified red spruce stems in our study plot, 7.4% (702) were either dead or declining (Table 2, Figure 4).
3.2. Kernel Density Estimation and Spruce Regeneration
A kernel density map for all red spruce classes indicated a high-density spruce forest in proximity to the central forest clearing (Figure 5). Kernel density populates a pixel value with the number of features surrounding the pixel, within the specified search radius. In Figure 4, kernel density highlights clusters of dead and dying individual spruce.
4. Discussion
Significance of Forest Health Survey and Conservation Management Implications
In alignment with SASRI forest monitoring goals, we developed a protocol to rapidly assess current conditions in management sites to identify instances of spruce mortality and advanced spruce regeneration. Our results provided a high-resolution, individual-scale interpretation of the health of more than 9000 red spruce trees in a 46-ha sample plot on Whitetop Mountain, Virginia. We established a mortality rate of 7.4% in the sample site, allowing for comparison with other neighboring sites across a landscape gradient. For example, a combined analysis of satellite imagery and ground surveys to examine red spruce forest health on a much larger (44,793 ha) tract of spruce forest in the Monongahela National Forest in West Virginia found 33% of red spruce by volume were dead and declining [31], a much higher rate than at Whitetop (7.4%). The dramatic difference may indicate that Whitetop’s red spruce were simply in much better condition than those at the West Virginia site. Our sample plot, while large in proportion (~33%) to the whole, may not be representative of the entire Whitetop spruce forest, but our visual estimates suggest that our sample plot was representative. It is worth pointing out that [31] classified polygons containing forest with a spruce component, whereas in this study we classified at the individual tree level. This study [31] was able to survey a much more extensive study area with results at coarser resolution, while ours, though a much smaller area, has a much higher spatial resolution (individual tree) [31]. The authors may also have reported higher mortality and decline rates because the analysis included ground surveys or because their definition of “decline” was less conservative than ours. Another study, ref. [32] of three sites across the southern Appalachians found that 25% of red spruce sampled by stem count (n = 263) showed signs of decline related to aging. A recent study [12] suggests that the long-term evolutionary viability of disjunct spruce “sky islands” in the southern Appalachians is at risk due to a lack of population-level genetic variation.
Our map of individual tree kernel density, aimed at identification of areas of advanced spruce regeneration and active sapling release, showed a pattern of concentrated areas of (1) healthy and (2) dead/declining spruce trees (Figure 5), highlighting areas where trees were experiencing substantial competition for light and resources. A second kernel density map, produced with the point vector layer of all spruce within the dead/declining health class (Figure 5), highlights the high-density areas of dead/declining spruce trees within the spruce stand. The spatial patterns of spruce sapling release depicted in our maps can be used to target areas for facilitative release (by selective thinning, for example). Such thinning by land managers may increase stand resiliency by promoting a mixed-aged stand structure and alleviating competition that may lead to stressed trees and vulnerability to disturbance. On the other hand, if canopy gaps are too large, they could increase individual spruce mortality to wind-throw and thus facilitate invasion by northern hardwoods [33]. Thus, thinning should be strategically applied, a process that can be guided by high-resolution stand maps such as presented here.
Often, spruce saplings can survive stunted in the understory for decades until over-story spruce die, leaving canopy gaps for the saplings to fill [34]. Our analysis allowed visualization of canopy gaps and mapping of released saplings visible within. The pattern of crown shyness (non-overlapping canopy branches) was prominent in the imagery. Individual trees maintained clear separation allowing our high-resolution health survey. In this case, the generated 3-D point cloud from which the orthoimagery was derived also shows potential usefulness in finding and measuring active sapling release in canopy gaps. Although imagery collected from lower-resolution 4-band (NIR) imagery collected by manned-aircraft provides enough resolution to detect individual tree crowns (e.g., [35]), discernment of individuals at the sapling level becomes more practical using drone-based orthoimagery at a much higher resolution (under 5 cm). Future work investigating methods of modeling active sapling release in the understory through 3-D geospatial modeling could verify whether forest treatments encourage understory sapling release.
Future predictive modeling work could also examine biophysical predictor variables and aid in relating biophysical relationships to instances of mortality. The introduction of interaction terms between variables could also aid in identifying variables and combinations of variables that could relate to mortality cases. Future research could also assess and compare the capability, and potentially calibrate, against other types of pre-collected remote sensing data, such as NAIP, for conducting health/mortality surveys within spruce populations and elsewhere in forests with similar structures.
5. Conclusions
This study contributes to the limited body of literature investigating the health of southern Appalachian red spruce forests, especially in Virginia, and illustrates the utility of consumer-grade RGB-sensor-equipped UAVs to assess forest health and examine stand structure in spruce and potentially other evergreen forests. We have shown that kernel density mapping of individual spruce can reveal patterns relating to red spruce regeneration and used the point cloud as a verification/reconnaissance tool. New high-resolution data presented here on spruce mortality provides a landscape baseline for comparison with future drone orthoimagery surveys. The spatial insights describing the distribution of live and dead/declining spruce trees within the sample plot will allow interagency land management collaborators to take a targeted approach when addressing and manipulating ecological dynamics to promote spruce growth. One density map includes the entire spruce dataset and highlights areas where trees are under increased stress from competition for light, water, and nutrient resources. The density map also provides precise locations of active releases of spruce saplings that have remained suppressed in the understory for decades.
This study illustrates a drone-based image analysis approach with strong potential to aid in conservation objectives through the assessment of individual tree health, mortality, and regeneration in spruce-dominant forests. While visually interpreting imagery to assess forest health at the individual tree scale is relatively time-intensive, it takes much less than a field assessment of over 9000 trees. Our approach analyzing UAV-generated orthoimagery to survey red spruce health has proven effective for a moderately-sized study area and has the potential to be generalized to areas of similar vegetation structure.
Author Contributions
Conceptualization, R.C.H., L.M.K., T.J.P. and V.A.T.; Methodology, R.C.H., L.M.K., T.J.P. and V.A.T.; Project administration, R.C.H.; Resources, T.J.P.; Software, R.C.H. and V.A.T.; Supervision, L.M.K.; Writing—original draft, R.C.H. and L.M.K.; Writing—review and editing, L.M.K., T.J.P. and V.A.T. All authors have read and agreed to the published version of the manuscript.
Funding
This research was funded by grants from Virginia Tech Department of Geography’s Sidman P. Poole Endowment and the Virginia Tech Graduate Research Development Program.
Institutional Review Board Statement
Not applicable.
Informed Consent Statement
Not applicable.
Data Availability Statement
Data available upon request.
Acknowledgments
USDA Forest Service, Mount Rogers District Personnel: Barry Garten, Tom Blevins, and Brittany Phillips. The Southern Appalachian Red Spruce Restoration Initiative and their steering committee for support in the research process. Maya L. Atkins, Virginia Tech undergraduate, for assistance with red spruce visual interpretation process. We are grateful to the Virginia Tech Library’s Open Access Subvention Fund for assistance with publication costs.
Conflicts of Interest
The authors declare no conflict of interest. The funders had no role in the design of the study; in the collection, analyses, or interpretation of data; in the writing of the manuscript, or in the decision to publish the results.
References
- Watts, W.A. Late Quaternary Vegetation of Central Appalachia and the New Jersey Coastal Plain. Ecol. Monogr. 1979, 49, 427–469. [Google Scholar] [CrossRef]
- Delcourt, H.R.; Delcourt P., A. Late-Quaternary history of the spruce-fir ecosystems in the southern Appalachian mountain region. In The Southern Appalachian Spruce-Fir Ecosystem: Its Biology and Threats; Research/Resource Management Report SER-71; White, P.S., Ed.; United States Department of the Interior, National Park Service: Washington, DC, USA, 1984; pp. 22–35. [Google Scholar]
- Adams, H.S.; Stephenson, S.L.; Rollins, A.W.; Adams, M.B. The isolated red spruce communities of Virginia and West Virginia. In Proceedings of the Conference of Ecological High-Elevation Forests in the Central and Southern Appalachian Mountains, Slatyfork, WV, USA, 14–15 May 2009; GTR- NRS-P-64. USDA Forest Service: Asheville, NC, USA, 2010; pp. 1–12. [Google Scholar]
- Pyle, C.; Schafale, M.P. Land Use History of Three Spruce-Fir Forest Sites in Southern Appalachia. For. Conserv. Hist. 1988, 32, 4–21. [Google Scholar] [CrossRef]
- Rives, W.C., Jr. Notes on the Birds of White Top Mountain, Virginia. Auk 1889, 50–53. [Google Scholar]
- Pashley, D.N.; Beardmore, C.J.; Fitzgerald, J.A.; Ford, R.P.; Hunter, W.C.; Morrison, M.S.; Rosenberg, K.V. Partners in Flight: Conservation of the Land Birds of the United States; American Bird Conservancy: The Plains, VA, USA, 2000. [Google Scholar]
- Rich, T.D.; Beardmore, C.J.; Berlanga, H.; Blancher, P.J.; Bradstreet, M.S.W.; Butcher, G.S.; Demarest, D.W.; Dunn, E.H.; Hunter, W.C.; Inigo-Elias, E.E.; et al. Partners in Flight North American Landbird Conservation Plan; Cornell Lab of Ornithology: Ithaca, NY, USA, 2004. [Google Scholar]
- Noss, R.F.; Peters, R.L. Endangered Ecosystems: A Status Report on America’s Vanishing Habitat and Wildlife; Defenders of Wildlife: Washington, DC, USA, 1995. [Google Scholar]
- Adams, M.B.; Eagar, C. Impacts of acidic deposition on high-elevation spruce-fir forests: Results from the SpruceFir Research Cooperative. Ecol. Manag. 1992, 51, 195–205. [Google Scholar] [CrossRef]
- Busing, R.; Pauley, E. Mortality trends in a southern Appalachian red spruce population. For. Ecol. Manag. 1994, 64, 41–45. [Google Scholar] [CrossRef]
- Johnson, A.; Cook, E.; Eagar, C.; Cogbill, C.; Jensen, K. Ecology and Decline of Red Spruce in the Eastern United States; Springer: New York, NY, USA, 2012. [Google Scholar]
- Capblancq, T.; Butnor, J.R.; Deyoung, S.; Thibault, E.; Munson, H.; Nelson, D.M.; Fitzpatrick, M.C.; Keller, S.R. Whole-exome sequencing reveals a long-term decline in effective population size of red spruce (Picea rubens). Evol. Appl. 2020, 13, 2190–2205. [Google Scholar] [CrossRef] [PubMed]
- Aristizábal-Botero, A.; Páez-Pérez, D.; Realpe, E.; Vanschoenwinkel, B. Mapping microhabitat structure and connectivity on a tropical inselberg using UAV remote sensing. Prog. Phys. Geogr. Earth Environ. 2020, 45, 427–445. [Google Scholar] [CrossRef]
- Fabbri, S.; Grottoli, E.; Armaroli, C.; Ciavola, P. Using High-Spatial Resolution UAV-Derived Data to Evaluate Vegetation and Geomorphological Changes on a Dune Field Involved in a Restoration Endeavour. Remote Sens. 2021, 13, 1987. [Google Scholar] [CrossRef]
- Pingel, T.J.; Saavedra, A.; Cobo, L. Deriving Land and Water Surface Elevations in the Northeastern Yuca-tán Peninsula Using PPK GPS and UAV-Based Structure from Motion. Pap. Appl. Geogr. 2021, 7, 294–315. [Google Scholar] [CrossRef]
- Prior, E.; Aquilina, C.; Czuba, J.; Pingel, T.; Hession, W. Estimating Floodplain Vegetative Roughness Using Drone-Based Laser Scanning and Structure from Motion Photogrammetry. Remote Sens. 2021, 13, 2616. [Google Scholar] [CrossRef]
- Liu, T.; Sun, Y.; Wang, C.; Zhang, Y.; Qiu, Z.; Gong, W.; Lei, S.; Tong, X.; Duan, X. Unmanned aerial vehicle and artificial intelligence revolutionizing efficient and precision sustainable forest management. J. Clean. Prod. 2021, 311, 127546. [Google Scholar] [CrossRef]
- Wang, C.; Morgan, G.; Hodgson, M. sUAS for 3D Tree Surveying: Comparative Experiments on a Closed-Canopy Earthen Dam. Forests 2021, 12, 659. [Google Scholar] [CrossRef]
- Fraser, B.; Congalton, R. Estimating Primary Forest Attributes and Rare Community Characteristics Using Unmanned Aerial Systems (UAS): An Enrichment of Conventional Forest Inventories. Remote Sens. 2021, 13, 2971. [Google Scholar] [CrossRef]
- Alonzo, M.; Andersen, H.E.; Morton, D.C.; Cook, B.D. Quantifying boreal forest structure and composition using UAV structure from motion. Forests 2018, 9, 119. [Google Scholar] [CrossRef] [Green Version]
- Ivosevic, B.; Han, Y.-G.; Kwon, O. Calculating coniferous tree coverage using unmanned aerial vehicle photogrammetry. J. Ecol. Environ. 2017, 41, 10. [Google Scholar] [CrossRef] [Green Version]
- Safonova, A.; Hamad, Y.; Dmitriev, E.; Georgiev, G.; Trenkin, V.; Georgieva, M.; Dimitrov, S.; Iliev, M. Individual Tree Crown Delineation for the Species Classification and Assessment of Vital Status of Forest Stands from UAV Images. Drones 2021, 5, 77. [Google Scholar] [CrossRef]
- Camarretta, N.; Harrison, P.; Bailey, T.; Potts, B.; Lucieer, A.; Davidson, N.; Hunt, M. Monitoring forest structure to guide adaptive management of forest restoration: A review of remote sensing approaches. New For. 2019, 51, 573–596. [Google Scholar] [CrossRef]
- Komárek, J.; Klápště, P.; Hrach, K.; Klouček, T. The Potential of Widespread Ready-Made UAVs in Quantifying Conifers and Delineating Their Crowns. 2021. Available online: https://www.researchsquare.com/article/rs-723971/v1 (accessed on 21 January 2022).
- Rankin, D.W. The volcanogenic Mount Rogers Formation and the overlying glaciogenic Konnarock For-mation—Two Late Proterozoic units in southwestern Virginia. US Geol. Surv. Bull. 1993, 2029, 26. [Google Scholar]
- Rheinhardt, R.D. Comparative study of composition and distribution patterns of subalpine forests in the Bal-sam Mountains of southwest Virginia and the Great Smoky Mountains. Bull. Torrey Bot. Club 1984, 111, 489–493. [Google Scholar] [CrossRef]
- Potter, K.M.; Frampton, J.; Sidebottom, J.; Onken, B.; Reardon, R. Impacts of balsam woolly adelgid on the southern Appalachian spruce-fir ecosystem and the North Carolina Christmas tree industry. In Proceedings of the Third Symposium on Hemlock Woolly Adelgid in the Eastern United States, Asheville, NC, USA, 1–3 February 2005; USFS Forest Health Technology Enterprise Team: Asheville, NC, USA, 2005; pp. 1–3. [Google Scholar]
- Krustchinsky, A.R. Post-Fire Recovery and Successional Dynamics of an Old-Growth Red Spruce Forest in the Southern Appalachian Mountains. Master’s Thesis, Texas A & M University, College Station, TX, USA, 2010. [Google Scholar]
- Robertson, D.P.; Hull, R.B. Which Nature? A Case Study of Whitetop Mountain. Landsc. J. 2001, 20, 176–185. [Google Scholar] [CrossRef]
- Cartwright, J.M.; Wolfe, W.J. Insular Ecosystems of the Southeastern United States—A Regional Synthesis to Support Biodiversity Conservation in a Changing Climate; US Department of the Interior-Southeast Climate Science Center, US Geological Survey: Reston, VA, USA, 2016. [Google Scholar] [CrossRef] [Green Version]
- Mielke, M.E. Decline and Mortality of Red Spruce in West Virginia. Report 86 4; Methods Application Group; Department of Agriculture, Forest Service, Forest Pest Management: Fort Collins, CO, USA, 1986. [Google Scholar]
- Leblanc, D.C.; Nicholas, N.; Zedaker, S. Prevalence of individual-tree growth decline in red spruce populations of the southern Appalachian Mountains. Can. J. For. Res. 1992, 22, 905–914. [Google Scholar] [CrossRef]
- Battles, J.J.; Fahey, T.J. Gap dynamics following forest decline: A case study of red spruce forests. Ecol. Appl. 2000, 10, 760–774. [Google Scholar] [CrossRef]
- Rentch, J.; Ford, W.; Schuler, T.; Palmer, J. Release of Suppressed Red Spruce Using Canopy Gap Creation—Ecological Restoration in the Central Appalachians. Nat. Areas J. 2016, 36, 29. [Google Scholar] [CrossRef]
- Gray, C.A.; Toone, C.; Jenkins, M.J.; Null, S.E.; Yocom, L.L. Spatial and temporal fuels changes in white-bark pine (Pinus albicaulis) from mountain pine beetle (Dendroctonus ponderosae). For. Ecol. Manag. 2021, 482, 118789. [Google Scholar] [CrossRef]
Figure 1.
Dark-colored red spruce caps the summit of Whitetop Mountain. Note the presence of standing dead spruce within the stand. A communications tower is visible in the center and a small spruce reforestation project in the lower right extends down into the grass bald. Spruce-covered Mount Rogers, Virginia’s tallest mountain, is visible in the background. Viewing direction is approximately ENE, UAV-generated image (4 April 2020).

Figure 2.
Orthoimagery (3.6 cm2 resolution) of the 46-hectare sample plot within the red spruce forest at Whitetop Mountain is shown on the left. The inset maps/image on the right show (top) the Whitetop Mountain area within the Commonwealth of Virginia, (center) a close-up of dead spruce and surrounding sapling release orthoimagery shown on the left, and (bottom) the sample plot (grey line) outlined over a contour map and delineation of the spruce forest.

Figure 3.
Left: Individual spruce within the sample plot categorized visually based on their apparent health. Bottom right: triangles represent classified spruce (red = dead, yellow = declining, green = live). Contour lines in meters above sea level, background image courtesy of NAIP 2018.
Figure 3.
Left: Individual spruce within the sample plot categorized visually based on their apparent health. Bottom right: triangles represent classified spruce (red = dead, yellow = declining, green = live). Contour lines in meters above sea level, background image courtesy of NAIP 2018.

Figure 4.
Left: Kernel density map of only dead and declining spruce points within the Whitetop sample plot with green-yellow-red color ramp; green and red indicate low and high concentrations of dead/declining spruce, respectively. A 2.5 m resolution pixel size was set to represent the approximate horizontal area of spruce. Triangles (see right close-up) represent classified spruce: red = dead, yellow = declining, and green = live; contour lines in meters above sea level.

Figure 5.
Left: Kernel density of all red spruce individuals (live, declining, and dead) within the Whitetop sample plot, highlighting more densely concentrated spruce saplings. Red areas indicate concentrations of spruce. A 2.5 m resolution pixel size was set to represent the approximate horizontal area of spruce. Right: close-up of spruce sapling release under dead overstory trees indicated by white arrows.


Table 1.
Classification parameters were set within photogrammetric software Pix4D to generate high-quality geospatial products, including digital orthoimagery, for the Whitetop sample plot.
Table 1.
Classification parameters were set within photogrammetric software Pix4D to generate high-quality geospatial products, including digital orthoimagery, for the Whitetop sample plot.
| Pix4D Mapper Classification Parameters | |
|---|---|
| Sampling Image Scale | ½ (Half size grid) |
| Matching | Aerial Grid Corridor |
| Calibration method | Standard |
| Point cloud image scale | 1 |
| Point density | High |
| Min. number matches | 3 |
| Matching window size | 7 × 7 pixels |
| Resolution | 3.59 cm/pixel |
| Images | 448 |
| Relative Geolocation Error (RMSE) | - |
| x | 1.866518 |
| y | 1.876386 |
| z | 0.972783 |
Table 2.
Numbers and percentages of red spruce trees in each health category.
| Status | Count | Criteria |
|---|---|---|
| Healthy | 8700 | Spruce had no observable dead foliage. |
| Declining | 251 | Dead spruce limbs present with green foliage in the surrounding crown pixels. |
| Dead | 451 | Dead spruce limbs present with no foliage in the surrounding pixels of the crown. |
| Fallen | 37 | Visually apparent, white-colored spruce in a horizontal position. |
| Total Standing | 9402 | Includes dead, declining, and healthy. |
| Total Spruce | 9439 | Includes all four classes. |
Publisher’s Note: MDPI stays neutral with regard to jurisdictional claims in published maps and institutional affiliations. |
© 2022 by the authors. Licensee MDPI, Basel, Switzerland. This article is an open access article distributed under the terms and conditions of the Creative Commons Attribution (CC BY) license (https://creativecommons.org/licenses/by/4.0/).
Share and Cite
MDPI and ACS Style
Harris, R.C.; Kennedy, L.M.; Pingel, T.J.; Thomas, V.A. Assessment of Canopy Health with Drone-Based Orthoimagery in a Southern Appalachian Red Spruce Forest. Remote Sens. 2022, 14, 1341. https://doi.org/10.3390/rs14061341
AMA Style
Harris RC, Kennedy LM, Pingel TJ, Thomas VA. Assessment of Canopy Health with Drone-Based Orthoimagery in a Southern Appalachian Red Spruce Forest. Remote Sensing. 2022; 14(6):1341. https://doi.org/10.3390/rs14061341
Chicago/Turabian StyleHarris, Ryley C., Lisa M. Kennedy, Thomas J. Pingel, and Valerie A. Thomas. 2022. "Assessment of Canopy Health with Drone-Based Orthoimagery in a Southern Appalachian Red Spruce Forest" Remote Sensing 14, no. 6: 1341. https://doi.org/10.3390/rs14061341
Note that from the first issue of 2016, this journal uses article numbers instead of page numbers. See further details here.