Article

Dust Radiative Effect Characteristics during a Typical Springtime Dust Storm with Persistent Floating Dust in the Tarim Basin, Northwest China

1
College of Resource and Environment Sciences, Xinjiang University, Urumqi 830002, China
2
Institute of Desert Meteorology, China Meteorological Administration, Urumqi 830002, China
3
National Observation and Research Station of Desert Meteorology, Taklimakan Desert of Xinjiang, Urumqi 830002, China
4
Taklimakan Desert Meteorology Field Experiment Station of China Meteorological Administration, Urumqi 830002, China
5
Collaborative Innovation Center on Forecast and Evaluation of Meteorological Disasters, Key Laboratory for Aerosol-Cloud-Precipitation of China Meteorological Administration, Nanjing University of Information Science & Technology, Nanjing 210044, China
6
Xinjiang Key Laboratory of Desert Meteorology and Sandstorm, Urumqi 830002, China
7
Key Laboratory of Tree-Ring Physical and Chemical Research, China Meteorological Administration, Urumqi 830002, China
*
Author to whom correspondence should be addressed.
Remote Sens. 2022, 14(5), 1167; https://doi.org/10.3390/rs14051167
Submission received: 23 January 2022 / Revised: 23 February 2022 / Accepted: 24 February 2022 / Published: 26 February 2022

Abstract

:
A special topography and ultra-high atmospheric boundary layer conditions in the Tarim Basin (TB) lead to the unique spatial–temporal distribution characteristics of dust aerosols. A typical dust storm with persistent floating dust over the TB from 27 April to 1 May 2015 was used to investigate the characteristics of the dust radiative effect using the Weather Research and Forecasting Model with Chemistry (WRF-Chem). Based on reasonable evaluations involving in situ sounding observations, as well as remotely sensed MODIS observations of meteorology, dust aerosols, and the ultra-high atmospheric boundary layer, the simulation characterized the complete characteristics of the dust direct radiative effect (DDRE) during the dust storm outbreak stage and persistent floating dust stage over the TB. During the daytime, the shortwave (SW) radiative effect heated the atmosphere and cooled the land surface (SUR), whereas the longwave (LW) radiative effect had the opposite effect on the TB. Regarding low-level dust, the LW radiative effect was greater than the SW DDRE in the atmosphere, while for high-level dust the situation was reversed. During the nighttime, the LW DDRE at the top of the atmosphere (TOA), at the SUR, and in the atmosphere was less than that during the daytime, when the DDRE at the SUR was the most significant. In contrast to the daytime, the near-surface dust aerosols exerted an LW warming effect in the atmosphere during the nighttime; however, the dust LW radiative effect had a cooling effect from above a 100 m altitude until the top of the dust layer. In contrast, the DDRE heating rate peaked at the top of the dust layer within the TB. The event-averaged net DDRE was 0.53, −5.90, and 6.43 W m−2 at the TOA, at the SUR, and in the atmosphere over the TB, respectively. The dust SW radiative effect was stronger than the dust L4W radiative effect over the TB at the SUR and in the atmosphere. Moreover, the DDRE at the TOA was weaker than that at the SUR. Overall, the study revealed noteworthy radiative effect features of dust aerosols during typical dust storms with persistent floating dust over the TB.

1. Introduction

The sources, compositions, and contents of atmospheric aerosols and their impacts on the atmospheric environment, ecology, and climate change are prominent topics of research in the fields of environmental science, ecology, meteorology, and geography [1,2]. Approximately 1–3 billion tons of aerosols are being released into the atmosphere each year [3], of which approximately 800 million tons are dust aerosols [4]. As an important aerosol component, dust aerosols mainly influence the radiation budget through direct, indirect, and semidirect effects, thereby contributing to climate change [5,6,7,8]. For example, the direct effect, i.e., dust aerosols reducing the solar radiation reaching the ground through absorption and scattering, is largely responsible for the so-called “parasol effect” [9]. The indirect aerosol effect, i.e., changing cloud optical properties and lifetimes in the form of cloud condensation nodules, is largely responsible for the “ice nucleation effect” [10]. Dust aerosols contain a high amount of Fe2+, which is necessary for seawater plankton. The supply of iron to the ocean controls the nitrogen fixation by plankton at the ocean surface; in turn, nitrogen fixation controls plankton production at the ocean surface, while the plankton production controls the CO2 concentration in the atmosphere by storing and depositing carbon, thereby affecting the climate. This is known as the “iron fertilizer effect” of dust aerosols [11,12]. Dust aerosols affect the land, ocean, and atmosphere through geochemical processes, and have gradually evolved into a key component of the global material cycle and climate change.
The West China deserts, surrounding the Taklimakan Desert, are important sources of dust in Asia [13]. In China, the Taklimakan Desert is a major source of dust and is located in the center of the Tarim Basin (TB) with a 1.1 km average altitude, covering an area of 33.6 × 10⁴ km2. The Taklamakan Desert is bounded by the Tianshan Mountains to the north, the Pamir Plateau to the west, and the Kunlun Mountains, as well as the Altun Mountains to the south of the desert, which are connected to the Tibetan Plateau (TP, i.e., 5.5 km a.s.l.). The east side of the desert is open, with high and low terrains in the west and east, respectively, characterized by a dustpan shape and abundant quicksand.
In the TB, an “ultra-high” atmospheric boundary layer with 3–5 km thickness is formed in the summer half year [14,15]. This is due to the unique topography of the TB, which is ringed on three sides by mountains, and the influence of the TP in the south on the meteorological field in the TB and its surroundings, combined with the intense heating of the desert surface and the strong convective as well as turbulent movements [16]. Dust emissions, transport, and dry/wet deposition, along with the dust direct radiative effect (DDRE), are restricted by the TB topography and atmospheric boundary layer conditions. The interaction of the updraft over the TB with the divergent downdraft at the north of the TP leads to persistent floating dust in the basin [17,18].
Dust aerosols account for 30% of the atmospheric aerosol content material and optical thickness [19], which is a crucial climate effect issue. The vertical distribution structure of dust aerosols in the atmosphere is an essential element in calculating the vertical atmospheric heating rate. Changing the distribution of dust in various atmospheric layers has a significant impact on the atmospheric heating rate [20,21,22,23,24]. In recent years, the spatiotemporal changes in the DDRE have been predicted using numerical models combined with data from solar photometers, radar, satellites, and other sources. Errors in dust emissions, transport, and deposition in the simulation, the aerosol particle size distribution, and optical properties have a major effect on the DDRE, leading to extensive variations in the quantitative assessment of the DDRE [25]. The statistical results of the IPCC (2001) report regarding global model simulations confirmed that the whole global annual average DDRE was—0.6 to 0.4 W m−2 [26]. As the study progressed, the IPCC updated the DDRE from −0.3 Wm−2 to 0.1 Wm−2 in its fourth and fifth reports [27,28]. The impacts of the global DDRE are major in dust source areas and downstream areas, such as the TB and the downstream eastern part of China, the Tibetan Plateau, the Sahara, India, the Arabian Sea, and so on. The Sahara transported a large amount of dust to the African continent and other regions, and the dust was deposited into the Atlantic Ocean and even the West Indies. The research indicated major perturbations to the radiation balance both at the top of the atmosphere (TOA) and at the surface (SUR) [29,30]. At midday, reflected fluxes at the TOA increased by 100 Wm−2, while the incoming solar fluxes at the surface decreased by around 250 Wm−2 [29]. Dust storms are periodic events over India, especially in its northern regions [23,24]. The mean DDRE was −14.49 W m−2 and −53.29 W m−2 at the TOA and SUR in May, respectively. The mean net DDRE (38.79 W m−2 maximum during May) corresponded to a heating rate of ~1.06K d−1 in the atmosphere [23]. In the Arabian Sea, the DDRE at the TOA and SUR was about two–five times higher than the corresponding effect values on nondust days [31].
The DDRE in East Asia accounted for 42% of the total aerosol radiative effect and played a key role in the radiative balance, as well as regional climate change [32,33,34]. Zhang et al. [35] evaluated the DDRE in China based on the international atmospheric chemistry–climate model: they showed that the annual average shortwave (SW), longwave (LW), and net (SW + LW) DDREs at the TOA were −1.3 ± 0.8, 0.7 ± 0.4, and −0.5 ± 0.7 W m−2 over China, respectively, while the SW, LW, and net DDREs at the SUR were −1.5 ± 1.0, 1.8 ± 0.9, and 0.2 ± 0.2 W m−2, respectively. Cheng et al. [36] analyzed and calculated the local DDRE of Otindag Sandy Land in the north of China. At the SUR, the dust aerosols induced a positive downward LW radiative effect (i.e., 16.76 W m−2) during the daytime and a negative LW radiative effect (i.e., −67.84 W m−2) during the nighttime. In the Tibetan Plateau (TP), located in the north of the TB, the energy budget can also be modified by the dust transported from the TB to the TP. TB dust had an SW cooling effect, with an average value of 11.71 W m−2, and an LW warming effect, with an average value of 6.13 W m−2, at the SUR over the TP [37]. There have been very few studies analyzing the specific signatures of DDRE during dust storms over the TB. In recent years, Huang et al. [38] and Chen et al. [39] estimated the dust radiative effect over the TB and only calculated the mean DDRE in all-sky conditions during the simulation period, mainly focusing on summer and fall dust storms. Given the special topography and ultra-high atmospheric boundary layer in the TB, there is still a scarcity of data on the radiative effect characteristics of dust aerosols during typical dust storms with persistent floating dust within the TB.
The TB is an important dust source area and has a unique topography as well as atmospheric boundary layer structure. The unique spatiotemporal structure of dust aerosols, particularly the persistent floating dust in the atmosphere and how it impacts the aerosol radiative effect, still requires comprehensive investigations. A complete understanding of the DDRE characteristics in the TB is essential for fully comprehending regional/global climate change and further improving and refining weather prediction models. For this purpose, we used WRF-Chem simulations with and without dust particles for comparing and analyzing the average radiative effect characteristics of dust over the TB during the daytime and nighttime. In the following, we revealed the DDRE characteristics over the TB during a typical dust storm with persistent floating dust.

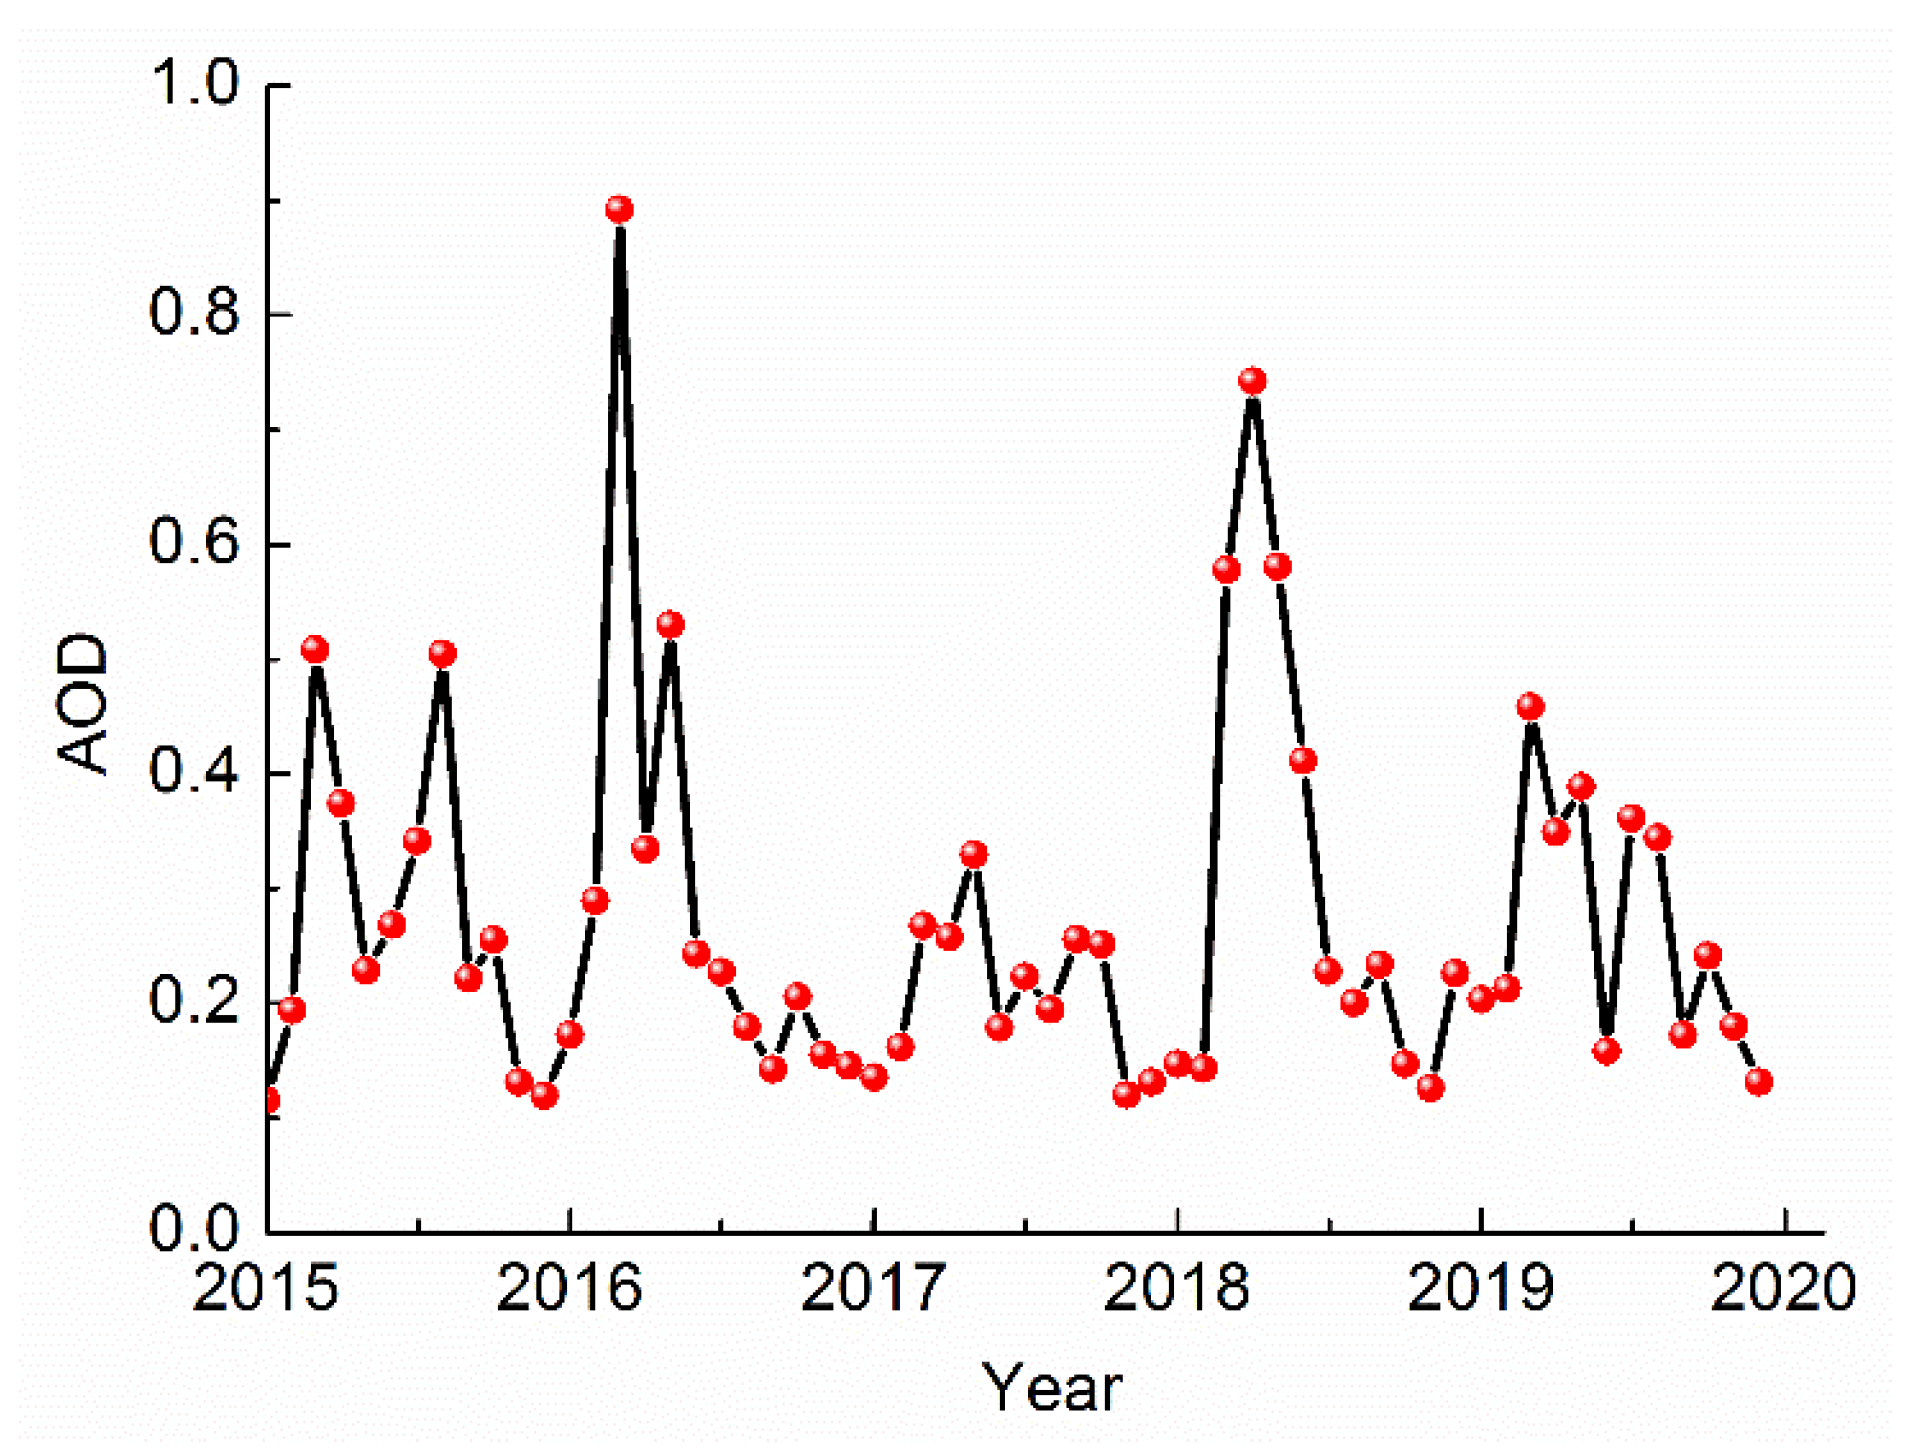
2. Climate Characteristic of AOD over the Tarim Basin

Figure 1 shows the temporal trends in the AOD averaged over the TB from 2015 to 2019. The MCD19A2 aerosol product in the Moderate Resolution Imaging Spectroradiometer (MODIS) was used to provide AOD data [40]. The average AOD over the TB was 0.27 from 2015 to 2019, and it varied between 0.21 and 0.31. The lowest AOD year was 2017, with a mean value of 0.21, which was a year with a lower frequency of dust storms. There were large seasonal differences in the AOD over the TB, being generally greater in spring and summer than in autumn and winter. Among them, the highest values were found in spring, implying that there was high-frequency dust weather in spring. The maximum value occurred in March 2016, with a value of 0.89. The lowest averaged AOD values were found in winter and varied more slowly, with the lowest values occurring in January 2015.

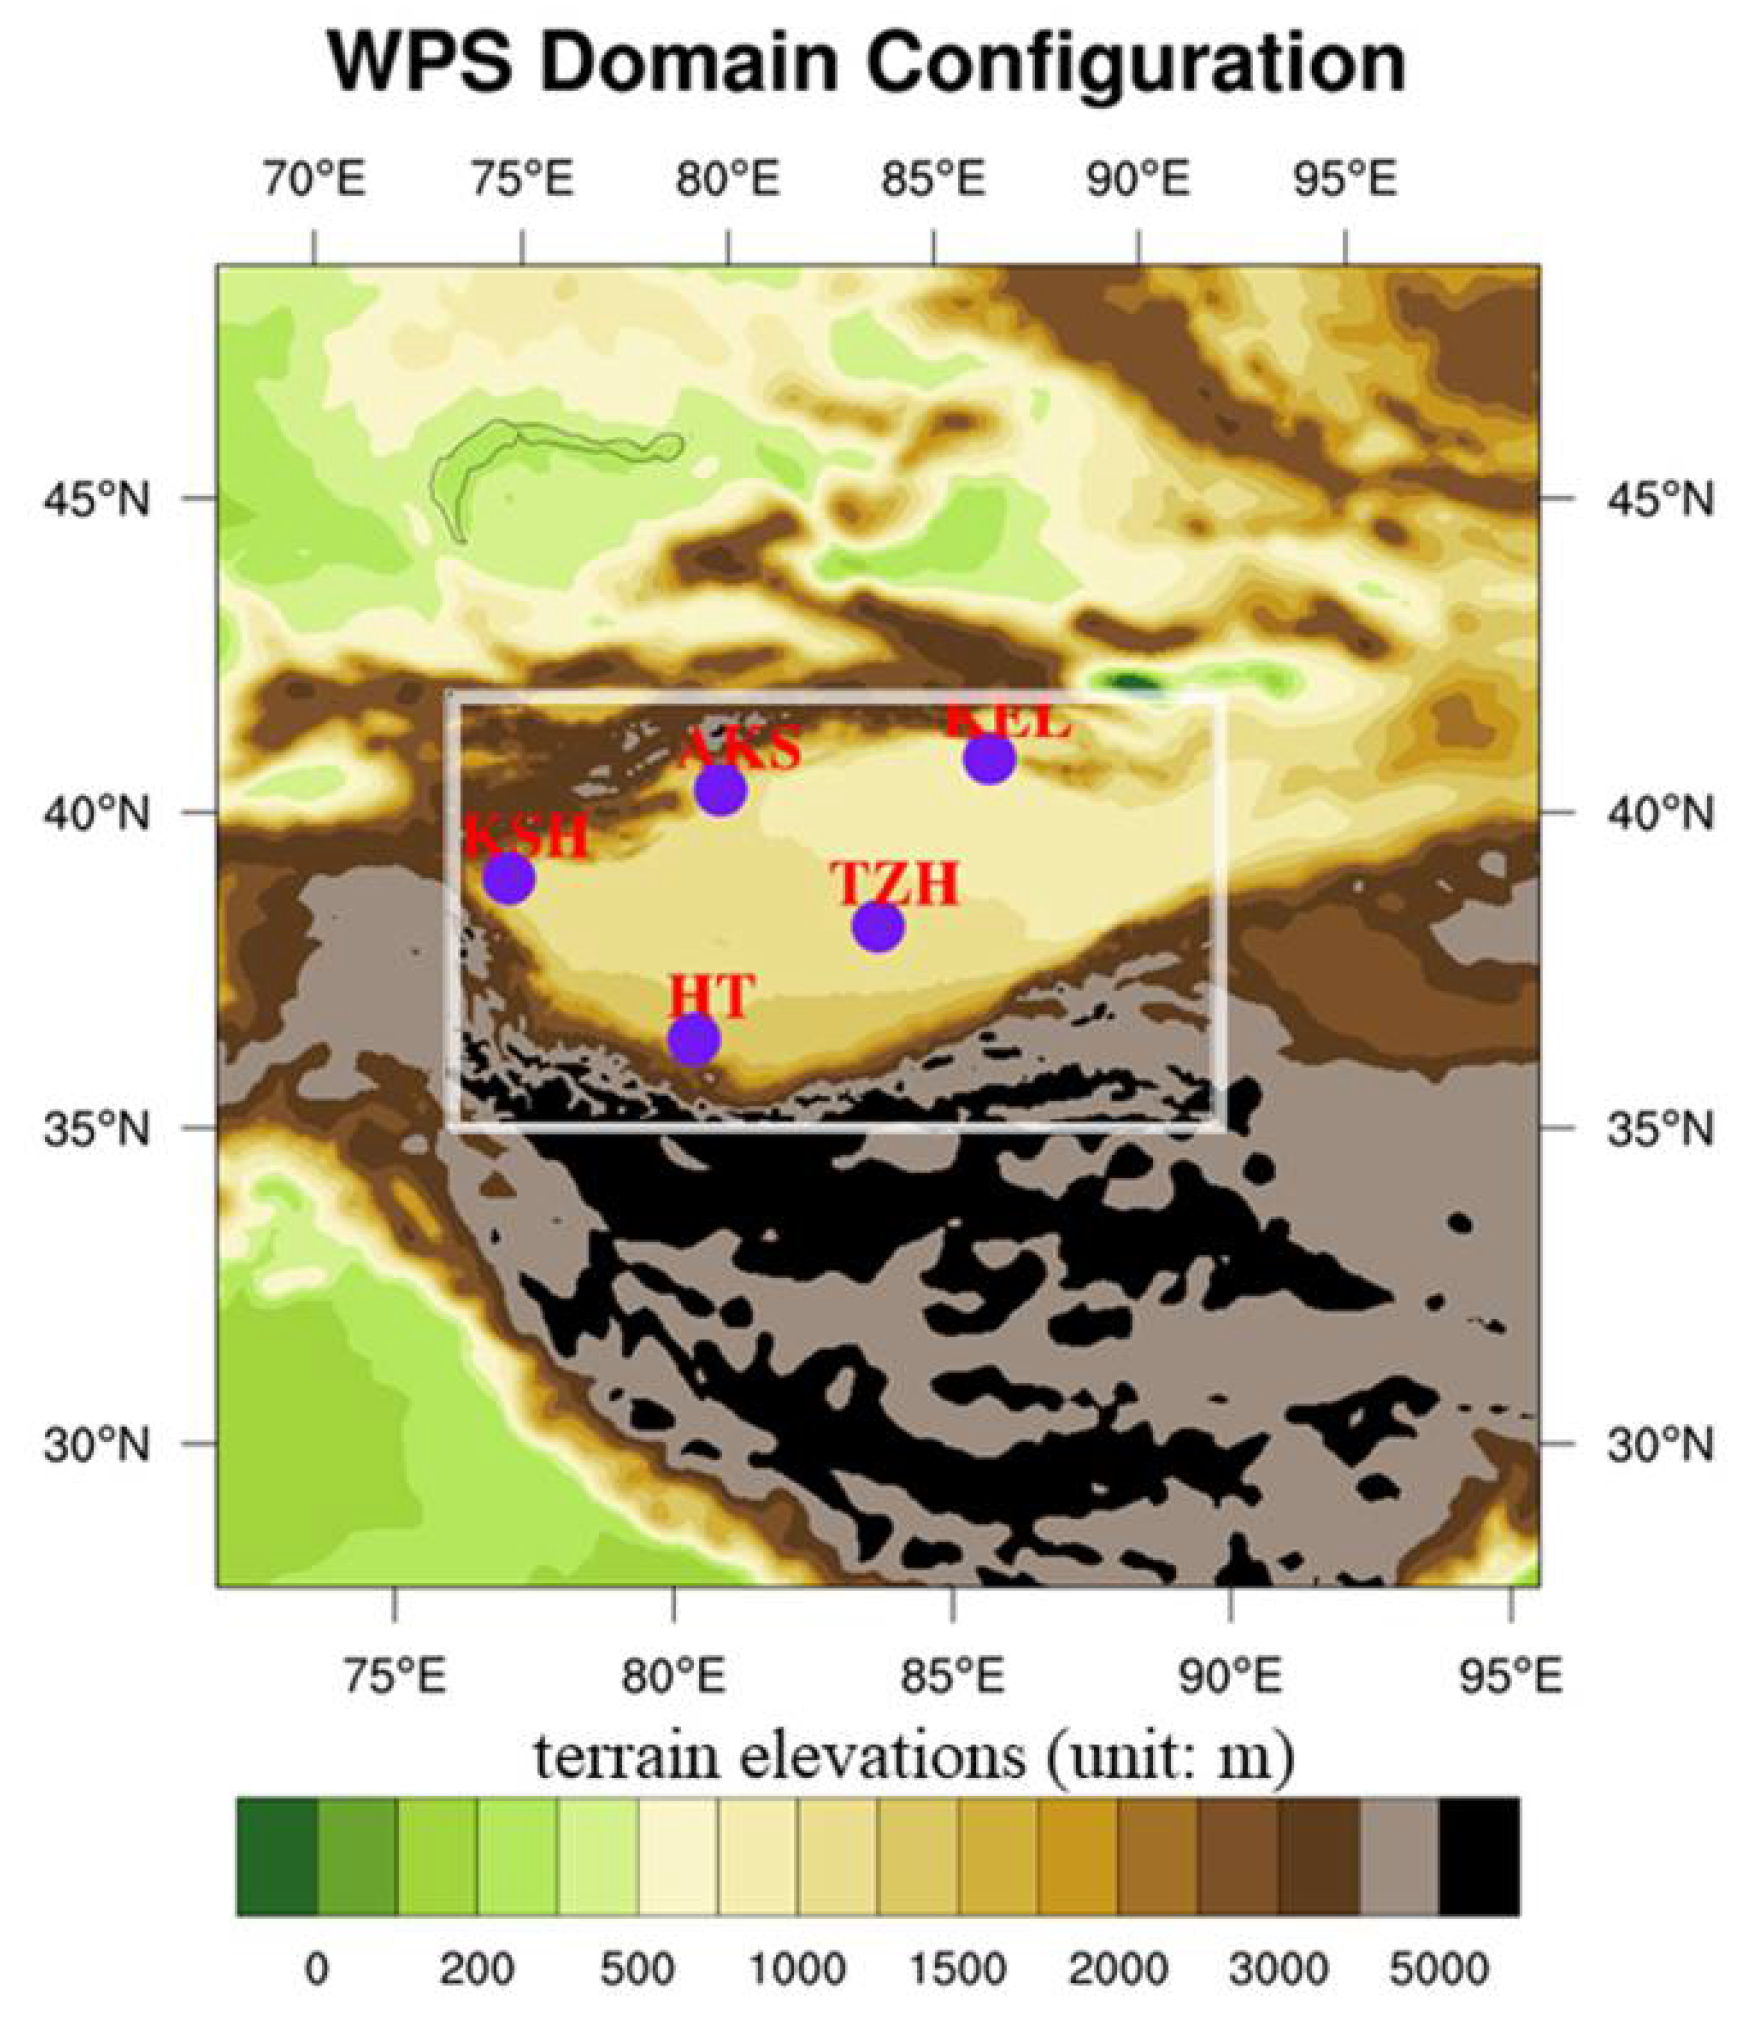
3. Model Settings and Validation

3.1. WRF-Chem Model

The WRF-Chem model v3.8.1 simulates trace gases, particulates, and meteorological fields simultaneously [41,42], and we used it for simulating the DDRE during a typical dust storm in the TB. The WRF-Chem chemistry module considers dust as the only emission aerosol. We considered gravity deposition and vertical mixing between the primary and secondary grids in the simulation area, while to minimize the machine time needed for the simulation, we tended to set the integration duration from 24 April to 1 May 2015. We only considered the results from 26 April to 1 May 2015. The WRF-Chem simulation was carried out via the use of two-way nesting: the outer domain (1) had a horizontal resolution of 16,000 m and the internal domain (2) had a horizontal resolution of 4000 m (Figure 2). This region included the dust source areas over the TB, while the center was located in Tazhong (TZH) (39°00′ N, 83°40′ E). The consequences from the internal domain (2) were used to investigate the DDRE over the TB, whereas the consequences from the outer domain (1) were used to describe large-scale characterization. The simulation divides the atmosphere into 50 layers, and the pressure at the TOA is 100 hPa. ERA-Interim reanalysis data provided the initial data as well as the lateral boundary conditions required for simulation with 6-hourly temporal intervals and a 0.25 × 0.25° horizontal resolution. Table 1 lists the parameterization schemes employed in WRF-Chem.
Simulations with and without dust particles were used for comparing and analyzing the DDRE over the TB during the simulation period. We compared the results of two sets of numerical experiments to calculate the DDRE at the TOA, at the SUR, and in the atmosphere over the TB. The calculation formulas were as follows:
R TOA = Δ F TOA ( dust ) Δ F TOA ( no dust )  
R SUR = Δ F SUR ( dust ) Δ F SUR ( no dust )  
R ATM = R TOA R SUR
where R is the DDRE, and RTOA, RSUR, and RATM represent the DDRE at the TOA, SUR, and in the atmosphere, respectively. ΔF represents the sum of the SW or LW radiation flux. We calculated the SW and LW DDREs based on Formulas (1) to (3). The net DDRE is the sum of the SW and LW DDREs. The radiation scheme of the model can only be used for calculating the DDRE, disregarding the effect of the cloud radiative effect.

3.2. Observations

Conventional sounding balloon observations were available at the Hetian (HT), Kuerle (KEL), and Kashi (KSH) meteorological stations. The specific site locations are shown in Figure 2. The three meteorological stations released sounding balloons with detectors to monitor the changes in meteorological elements at 07:00 CST (Chinese standard time: UTC + 8:00) and 19:00 CST every day. Each sounding balloon transported a sounding instrument through the atmosphere. During ascent, the sounding instrument measured the air temperature, pressure, humidity, and other meteorological data, while also recording its three-dimensional position (i.e., longitude, latitude, and altitude), and transmitted all the data back to the ground through radio signals, thereby providing the meteorological element values in the atmosphere.
The Moderate Resolution Imaging Spectroradiometer (MODIS) aerosol level-4 retrievals provided aerosol optical depth (AOD) data, which were also used to verify the simulation results [43]. The MODIS instruments onboard the NASA Terra and Aqua satellites work with more accurate spatial–temporal resolutions with a 0.1 × 0.1° horizontal resolution in this study and supply almost daily the whole global coverage and monitoring of the Earth’s changes, including changes in tropospheric aerosols [44,45]. Ascribed to the difficulty in retrieving aerosol characteristics on the desert, as well as clouds, MODIS satellite observations corresponding to the simulation period had a restricted spatial–temporal coverage area [46]. The dark-blue algorithm in MODIS is more appropriate for desert areas, allowing for the identification of dust storms and the accurate retrieval of the characteristics of dust aerosols over the desert [47,48]. The AOD data retrieved using the dark-blue algorithm excluded cloud contamination. If the signal distribution is discontinuous in the region of high AOD values, this discontinuous region may be affected by the cloud cover. In order to avoid the uncertainty caused by missing AOD data, we chose the data from 27 April to 30 with high coverage to compare and verify the simulation results.

3.3. Model Validation

To evaluate the simulation performance of the spatial–temporal distributions of dust aerosols within the TB throughout the chosen dust storm, we first compared the vertical profiles of wind speed and potential temperature from sounding balloon observations and simulations at the HT, KEL, and KSH stations on 29 April 2015, at 11:00 UTC (Figure 3a,c) and 23:00 UTC (Figure 3b,d). The WRF-Chem model was capable to reproduce well the vertical wind speed profiles within the TB, especially at 11:00 UTC, while the differences between the observations were smaller in the lower atmosphere. The simulated wind speed exhibited a sharp increase to 10 m s−1 within a layer around 1 km thick at the HT station at 23:00 UTC. Meanwhile, the observations did not indicate an increased wind speed layer in the low-level atmosphere at the corresponding time. Wind speed was overestimated or underestimated in the upper atmosphere owing to the complex terrain. The differences between the simulated and observed vertical profiles of the potential temperature over the TB are also shown in Figure 3c,d. In summary, the simulated potential temperature fits well with the observations, and the maximum difference between them was −15 K to 15 K. The lower atmosphere of the basin was comparatively stable in Figure 3. The height of the boundary layer was up to 3–4 km altitude in the TB on 29 April 2015. The simulated assessment of the time variation trends in the wind speed and potential temperature for the selected dust storm has been described in detail in a companion paper [15,49].
The optical properties of the simulated daily mean 550 nm AODs were compared with those from MODIS satellite retrievals for validating the WRF-Chem model simulations (Figure 4). In general, the WRF-Chem model reappeared the spatial distribution of dust over the TB well, including the dust plumes over the basin (Figure 4). There was an agreement regarding the greatest AOD, which appeared at the southern and eastern entrance of the basin on 27 April 2015, resulting from the westerly winds across the Pamirs Plateau and strong northeastern winds entering the TB from the northeastern mouth [15]. Subsequently, a giant quantity of dust aerosols was injected into the TB on 28 April 2015. As a result, the AOD value was greater than 3.0 in most areas of the basin. The simulated AOD over the western TB on 28 April 2015 was exaggerated compared to the corresponding MODIS AOD. Over the TB, MODIS retrievals revealed the highest AOD in the western TB on 29 April 2015. The simulated dust aerosols exhibited similar spatial distribution characteristics over the TB, with 4.2 being the highest value. A high-value region was previously additionally captured via the WRF-Chem model at the western TB on 30 April 2015. Notably, the model overestimated the AOD in the southern TB on 29 April 2015. One probable cause for the overestimation of the AOD could be the simulated wind speed biases in the upper atmosphere, such as at the HT station (Figure 3a,b). The complex topography of the TB, which is encircled by mountains, was also one of the explanations for the simulation errors. The simulation bias and uncertainty caused by the complex topography of the TB were not considered in this paper but will be the main focus of forthcoming research.
Furthermore, the WRF-Chem model successfully captured the vertical distribution of dust within the TB, compared with the corresponding CALIPSO retrieval data [15]. The modeling evaluations were described in detail in a companion paper [15,49], involving remotely sensed and in situ observations for the spring 2015 dust storm. These conclusions confirmed that the WRF-Chem model could successfully simulate the meteorological field along with the spatiotemporal distribution characteristics of PM10 data.

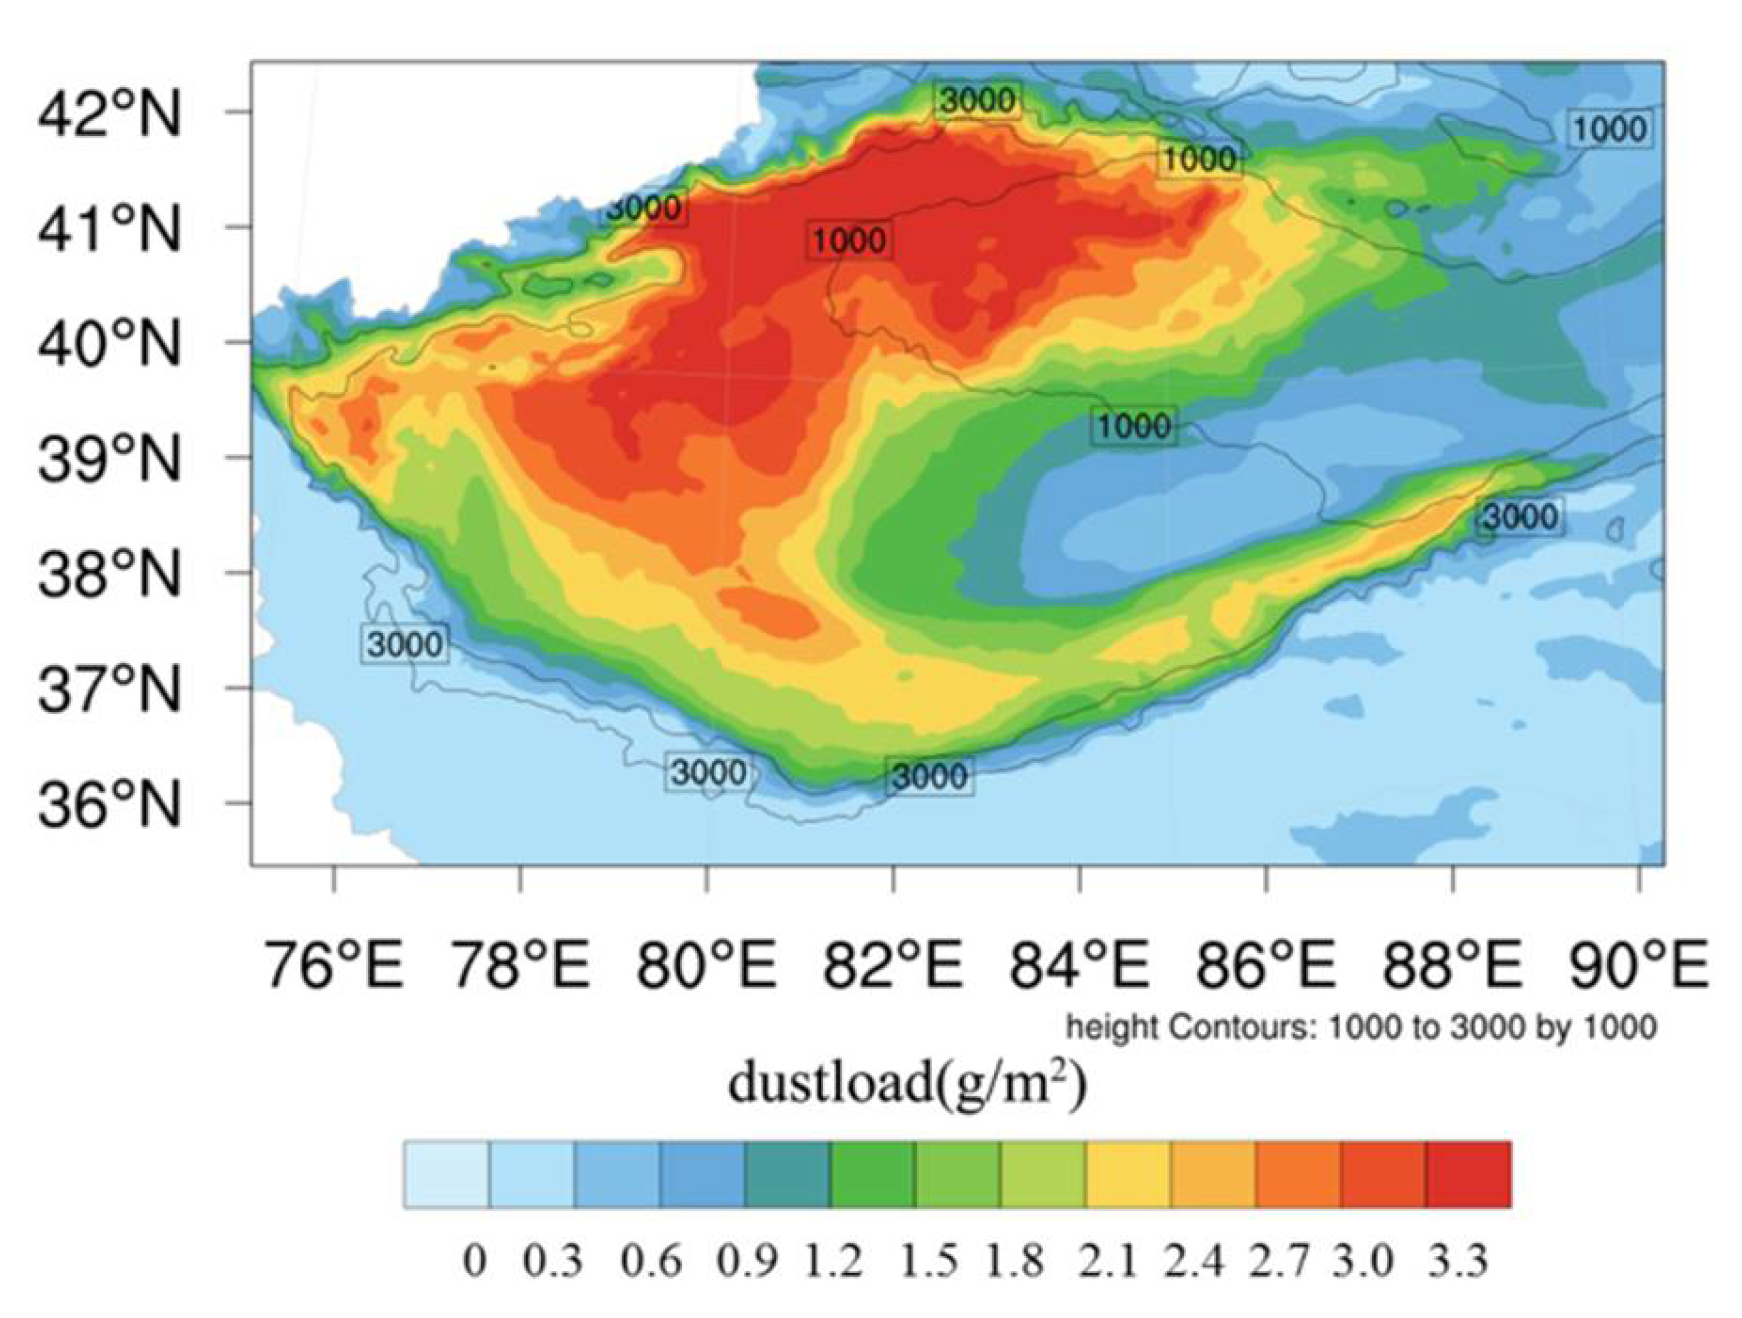
4. Simulation Analysis and Discussion

4.1. Synoptic Variations during the Dust Storm

Based on the observation of weather monitoring networks, the synoptic patterns at 500 hPa and at the sea pressure level were described in detail in a companion paper [15]. A deep, low-pressure trough at 500 hPa over Central Asia was split into two parts on 25 April. On 26–27 April, the two troughs moved eastward, and the corresponding cold front with a high-pressure system in the Ural Mountains moved towards Northwest China at the surface. Meanwhile, a low-pressure system developed over the TB, building strong near-surface winds in the northwest part of the TB. In the meantime, part of the cold air blew into the basin through crossing the Tianshan Mountains. With the continuing southeastward movement of the high-pressure center, strong northeast winds entered the northeast opening to the basin on 28 April. In the following days, the high-pressure system finally controlled the TB, with its main body located in the north of the basin.

4.2. Daily Variation Characteristics of the Dust Radiative Effect

Figure 5 shows the temporal trends in the mean net (SW + LW) DDRE over the TB at the TOA, at the SUR, and in the atmosphere during the selected dust storm. The corresponding dust load averaged over the TB is also presented in Figure 5. Additionally, the mean net (SW + LW) DDRE (W m−2) within the TB at the TOA, at the SUR, and in the ATM throughout the selected dust storm is shown in Table 2. The intense dust storm episode, with persistent floating dust in the TB from 27 April to 1 May 2015, was deemed to be representative of the general conditions in spring. This typical dust storm process was divided into two stages: The first stage was defined as the dust storm outbreak stage (i.e., 27–28 April 2015), which was characterized by a gradual dust load increase from April 27, 2015, to peak values exceeding 2 g m−2 on 28 April 2015, at 15:00 UTC, followed by a slow decrease (Figure 5). Meanwhile, the net DDRE over the TB reached its peak from 28 to 29 April 2015. The mean net (SW + LW) DDRE reached a maximum of −32.95 W m−2 at the SUR during the daytime on 29 April 2015. The second stage was defined as the persistent floating dust aerosols stage (i.e., 29 April–1 May 2015), when persistent floating dust lasted for two days or more in the TB. In particular, the dust load remained around 1.0–1.5 g m−2 from 29 April to 1 May 2015, over the TB, and there was no decrease. During the daytime, the net DDRE over the TB at the TOA and in the atmosphere was positive, while negative values were observed at the SUR. During the day, the amount of solar SW radiation reaching the SUR was reduced due to absorption and scattering by dust aerosols [31,32,33,34]. The SW DDRE at the SUR over the TB was normally negative. In comparison, the LW DDRE at the SUR was positive. The magnitude of the net DDRE at the SUR was determined by the SW DDRE, which was much greater than the dust LW radiative effect. During the nighttime, the dust SW radiative effect was zero. Dust aerosols released heat stored during the daytime. The dust layers could enhance the downward LW radiation reaching the land SUR and exert a warming effect at the SUR during the nighttime [33,50]. Thus, the net DDRE in the atmosphere turned negative, while the corresponding radiative effect at the SUR shifted to positive. The nocturnal net DDRE at the TOA fluctuated around zero. Overall, the net DDRE was much stronger in the daytime than at nighttime.

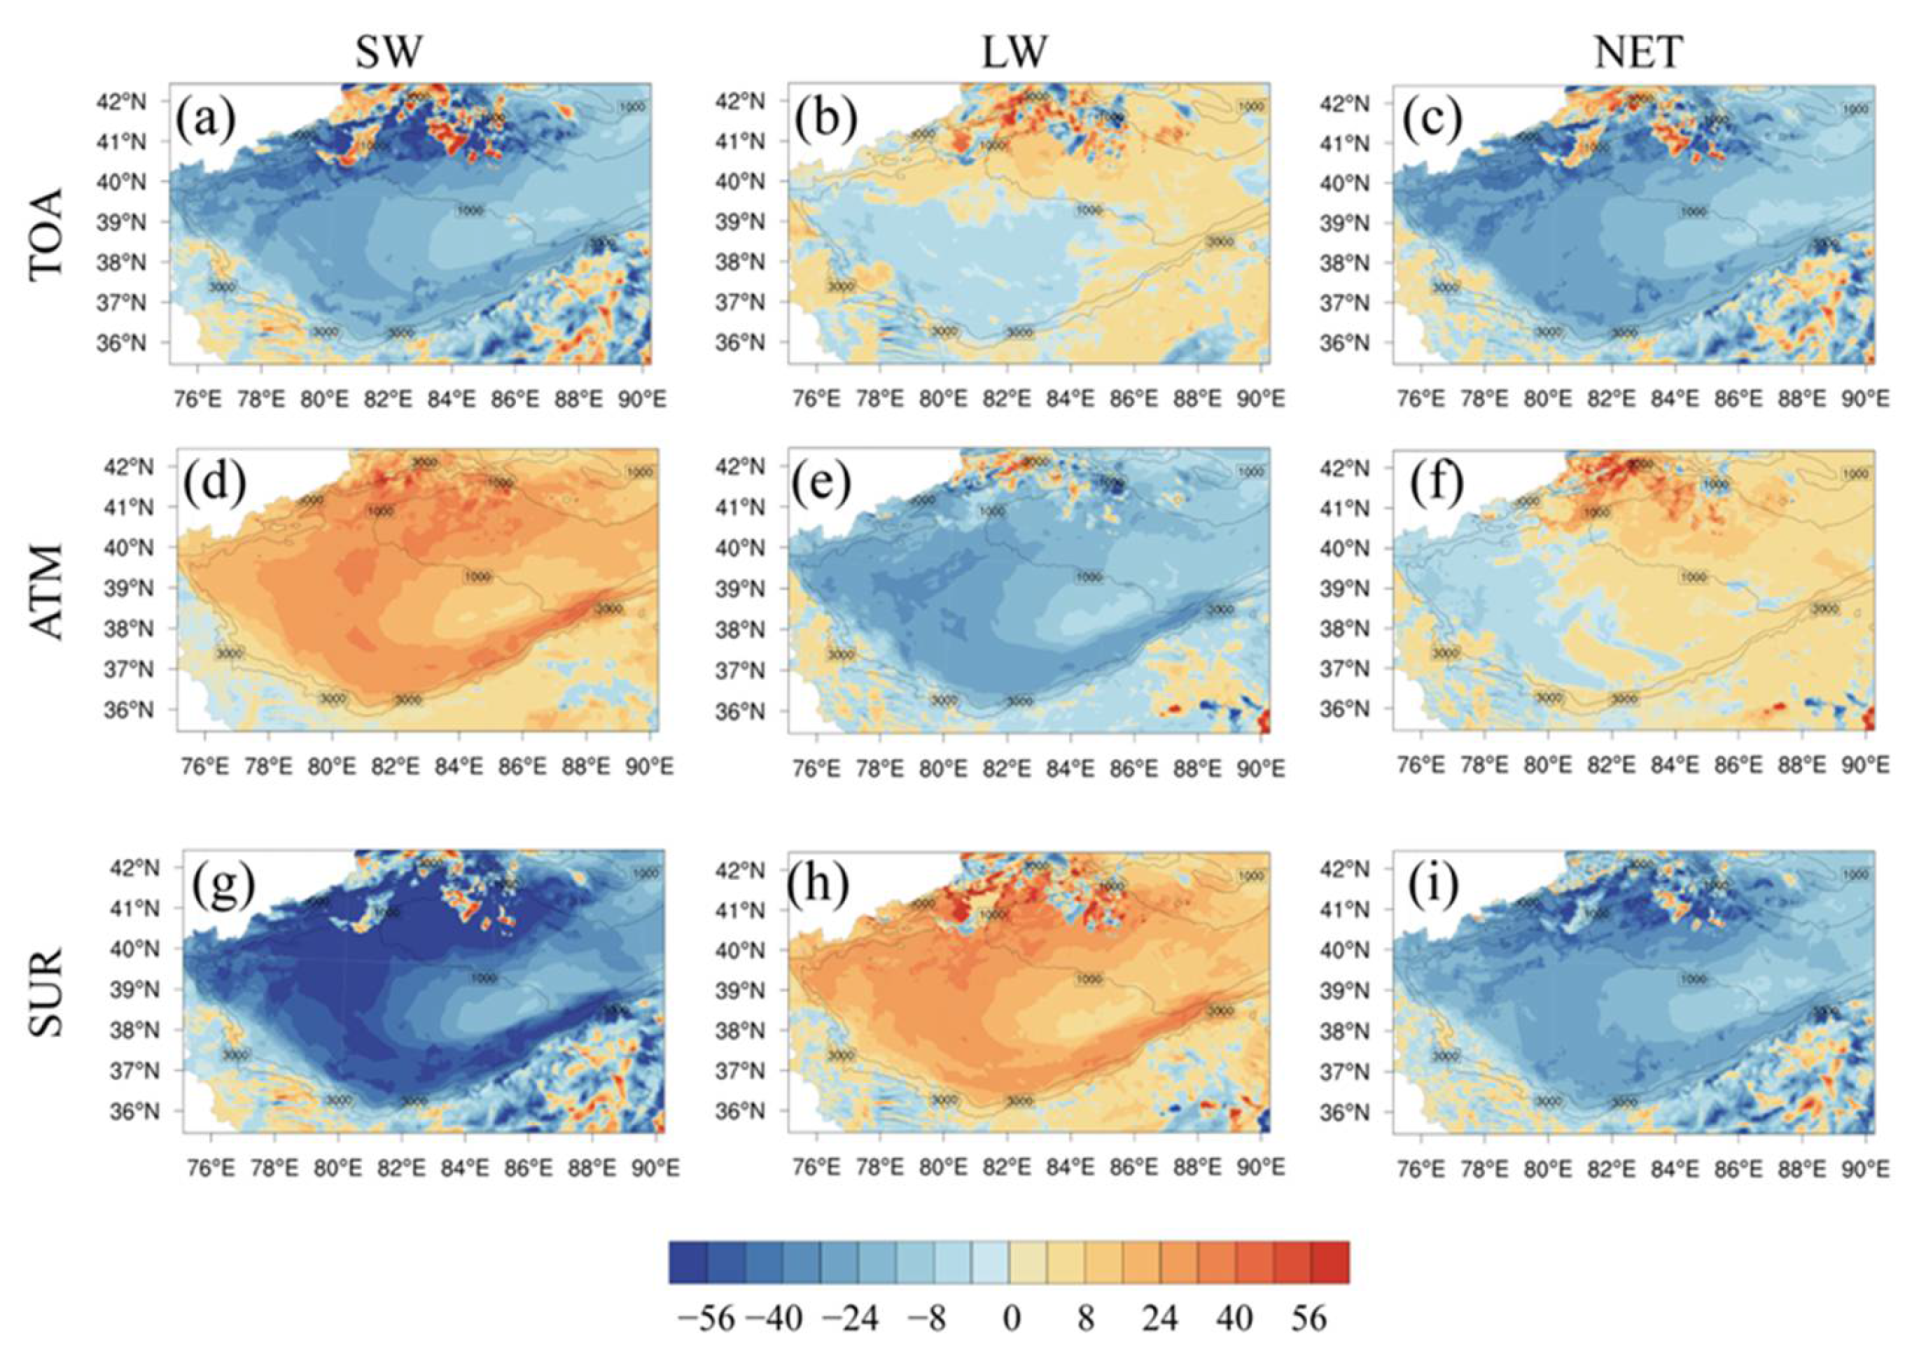
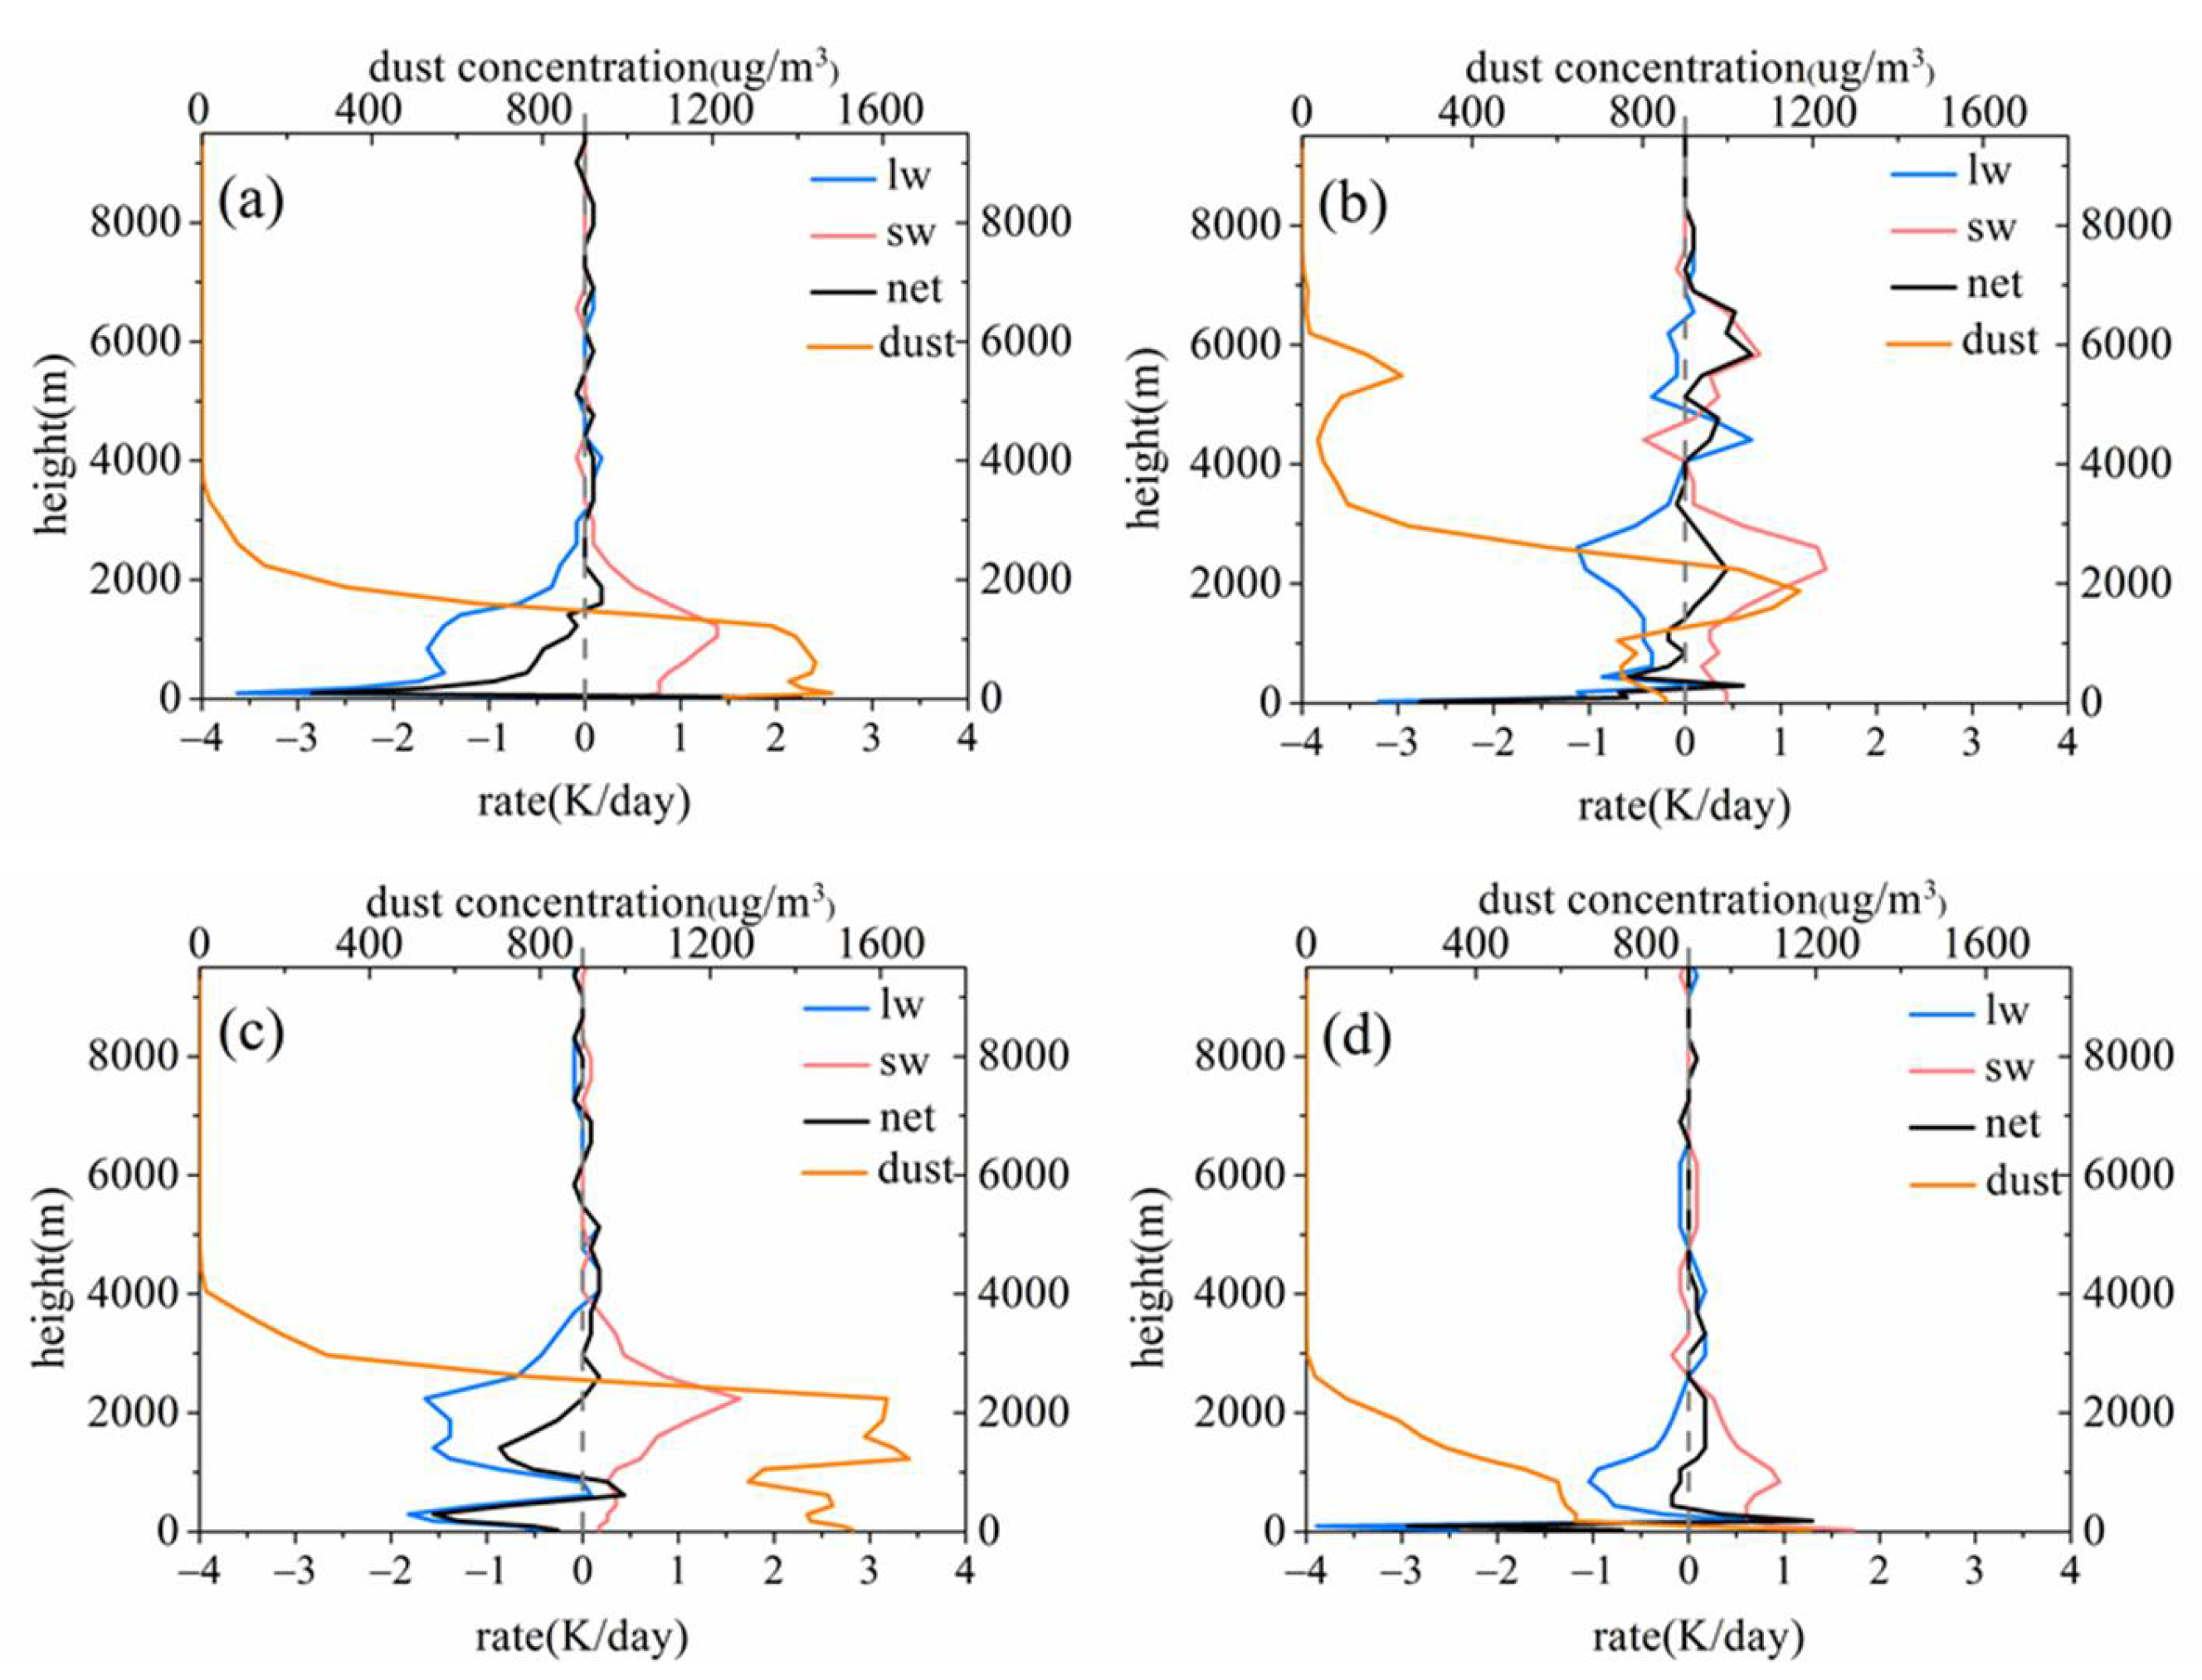
4.3. Direct Radiative Effect Induced by Dust during the Daytime

To avoid the influence of clouds on the DDRE, an individual daytime case on 30 April 2015, at 01:00 UTC, which was a moment of low cloudiness, was selected for analysis. Figure 6 provides the spatial distribution of total vertical column dust load on 30 April 2015, at 01:00 UTC. By analyzing the dust transport process during the selected dust storm [15,49], it was revealed that the cold front passed through the basin and that the TB conditions were controlled by the continuous cold airflow. Westerly winds crossed the Pamirs Plateau and entered the TB, while part of the northerly air flowed across the Tianshan Mountains and invaded the TB from the north. The strong northeastern cold airflow passed through the northeastern mouth of the TB and followed a southwestward trajectory through the basin. Until 30 April 2015, at 01:00 UTC, the TB conditions were dominated by cold–high pressure combined with the blocking action of the topography on airflow; dust particles accumulated in the south of the TB were transported to the north. Figure 7 presents the spatial distribution of the average SW, LW, and net DDREs at the TOA, at the SUR, and in the atmosphere within the TB at the corresponding time. Positive and negative values represent the heating and cooling effects of dust aerosols, respectively. The spatial distribution of the DDRE was comparable to the distribution of the dust load within the TB (Figure 6). The SW DDRE at the SUR over the TB was normally negative; owing to the radiative effect induced by high-level clouds, a small number of positive values appeared in the TB. Generally, due to absorption and scattering by dust aerosols, the quantity of solar SW radiation reaching the land SUR was reduced [1,8,9,20,21,22,23,24,25]. While substantial solar radiation was reflected back into space, the minimum values were less than −60 W m−2. In comparison, the LW DDRE at the SUR was positive, ranging from 0 to 40 W m−2. Dust aerosols emitted LW radiation, while at the same time they reduced the SW radiation reaching the land SUR; hence, the land SUR temperature decreased and resulted in decreased upward LW radiation [33,34]. The LW DDRE at the SUR was 1/3–1/2 of the SW DDRE. The magnitude of the net DDRE at the SUR was determined by the SW DDRE, which was much greater than the dust LW radiative effect [29,34]. The minimum net DDRE over the TB at the SUR reached −40 W m−2.
The DDRE at the TOA was influenced not only by the spatial distribution of aerosols, but also by surface albedo, cloud cover, and aerosol optical properties; however, there was no simple corresponding relationship with the distribution of the dust column load. Figure 7 shows that there were negative SW and net DDREs at the TOA during the daytime, and their spatial distribution characteristics were similar to those of the dust column concentrations (Figure 6). In the atmosphere, positive SW radiative effects and negative LW radiative effects were induced by dust through absorption.
The heating rate induced by the DDRE has a major impact on the vertical distribution of the atmospheric temperature. Figure 8 describes the vertical profiles of the heating rate induced by the DDRE at the (a) HT, (b) KEL, (c) KSH, and (d) TZH stations in the TB on 30 April 2015, at 01:00 UTC; as shown, dust was mainly concentrated below a 3 km altitude over the TB, which had a significant impact on the SW and LW radiative effects in the atmosphere. Generally, dust induces SW radiative heating along with LW radiative cooling of the atmosphere during the daytime, with rate extrema close to the top of the dust layer. We note that the LW DDRE exhibited a weak warming effect on the near-surface atmosphere at all four stations. It was found that the heavy near-surface aerosol loading enhanced downward LW radiation and weakened upward LW radiation at the SUR, thus increasing the atmospheric LW greenhouse effect with an effect equivalent to that of a thin, low cloud [50]. The LW DDRE exhibited a cooling effect on the atmosphere above 500 m. Below the top of the dust layer, the dust-induced LW cooling rates were much greater than those of the SW heating induced by the DDRE in the atmosphere. There was persistent suspended dust at a 5–6 km altitude in the KEL; there, the rates of the floating-dust-induced SW heating were greater than those of the floating-dust-induced LW cooling.

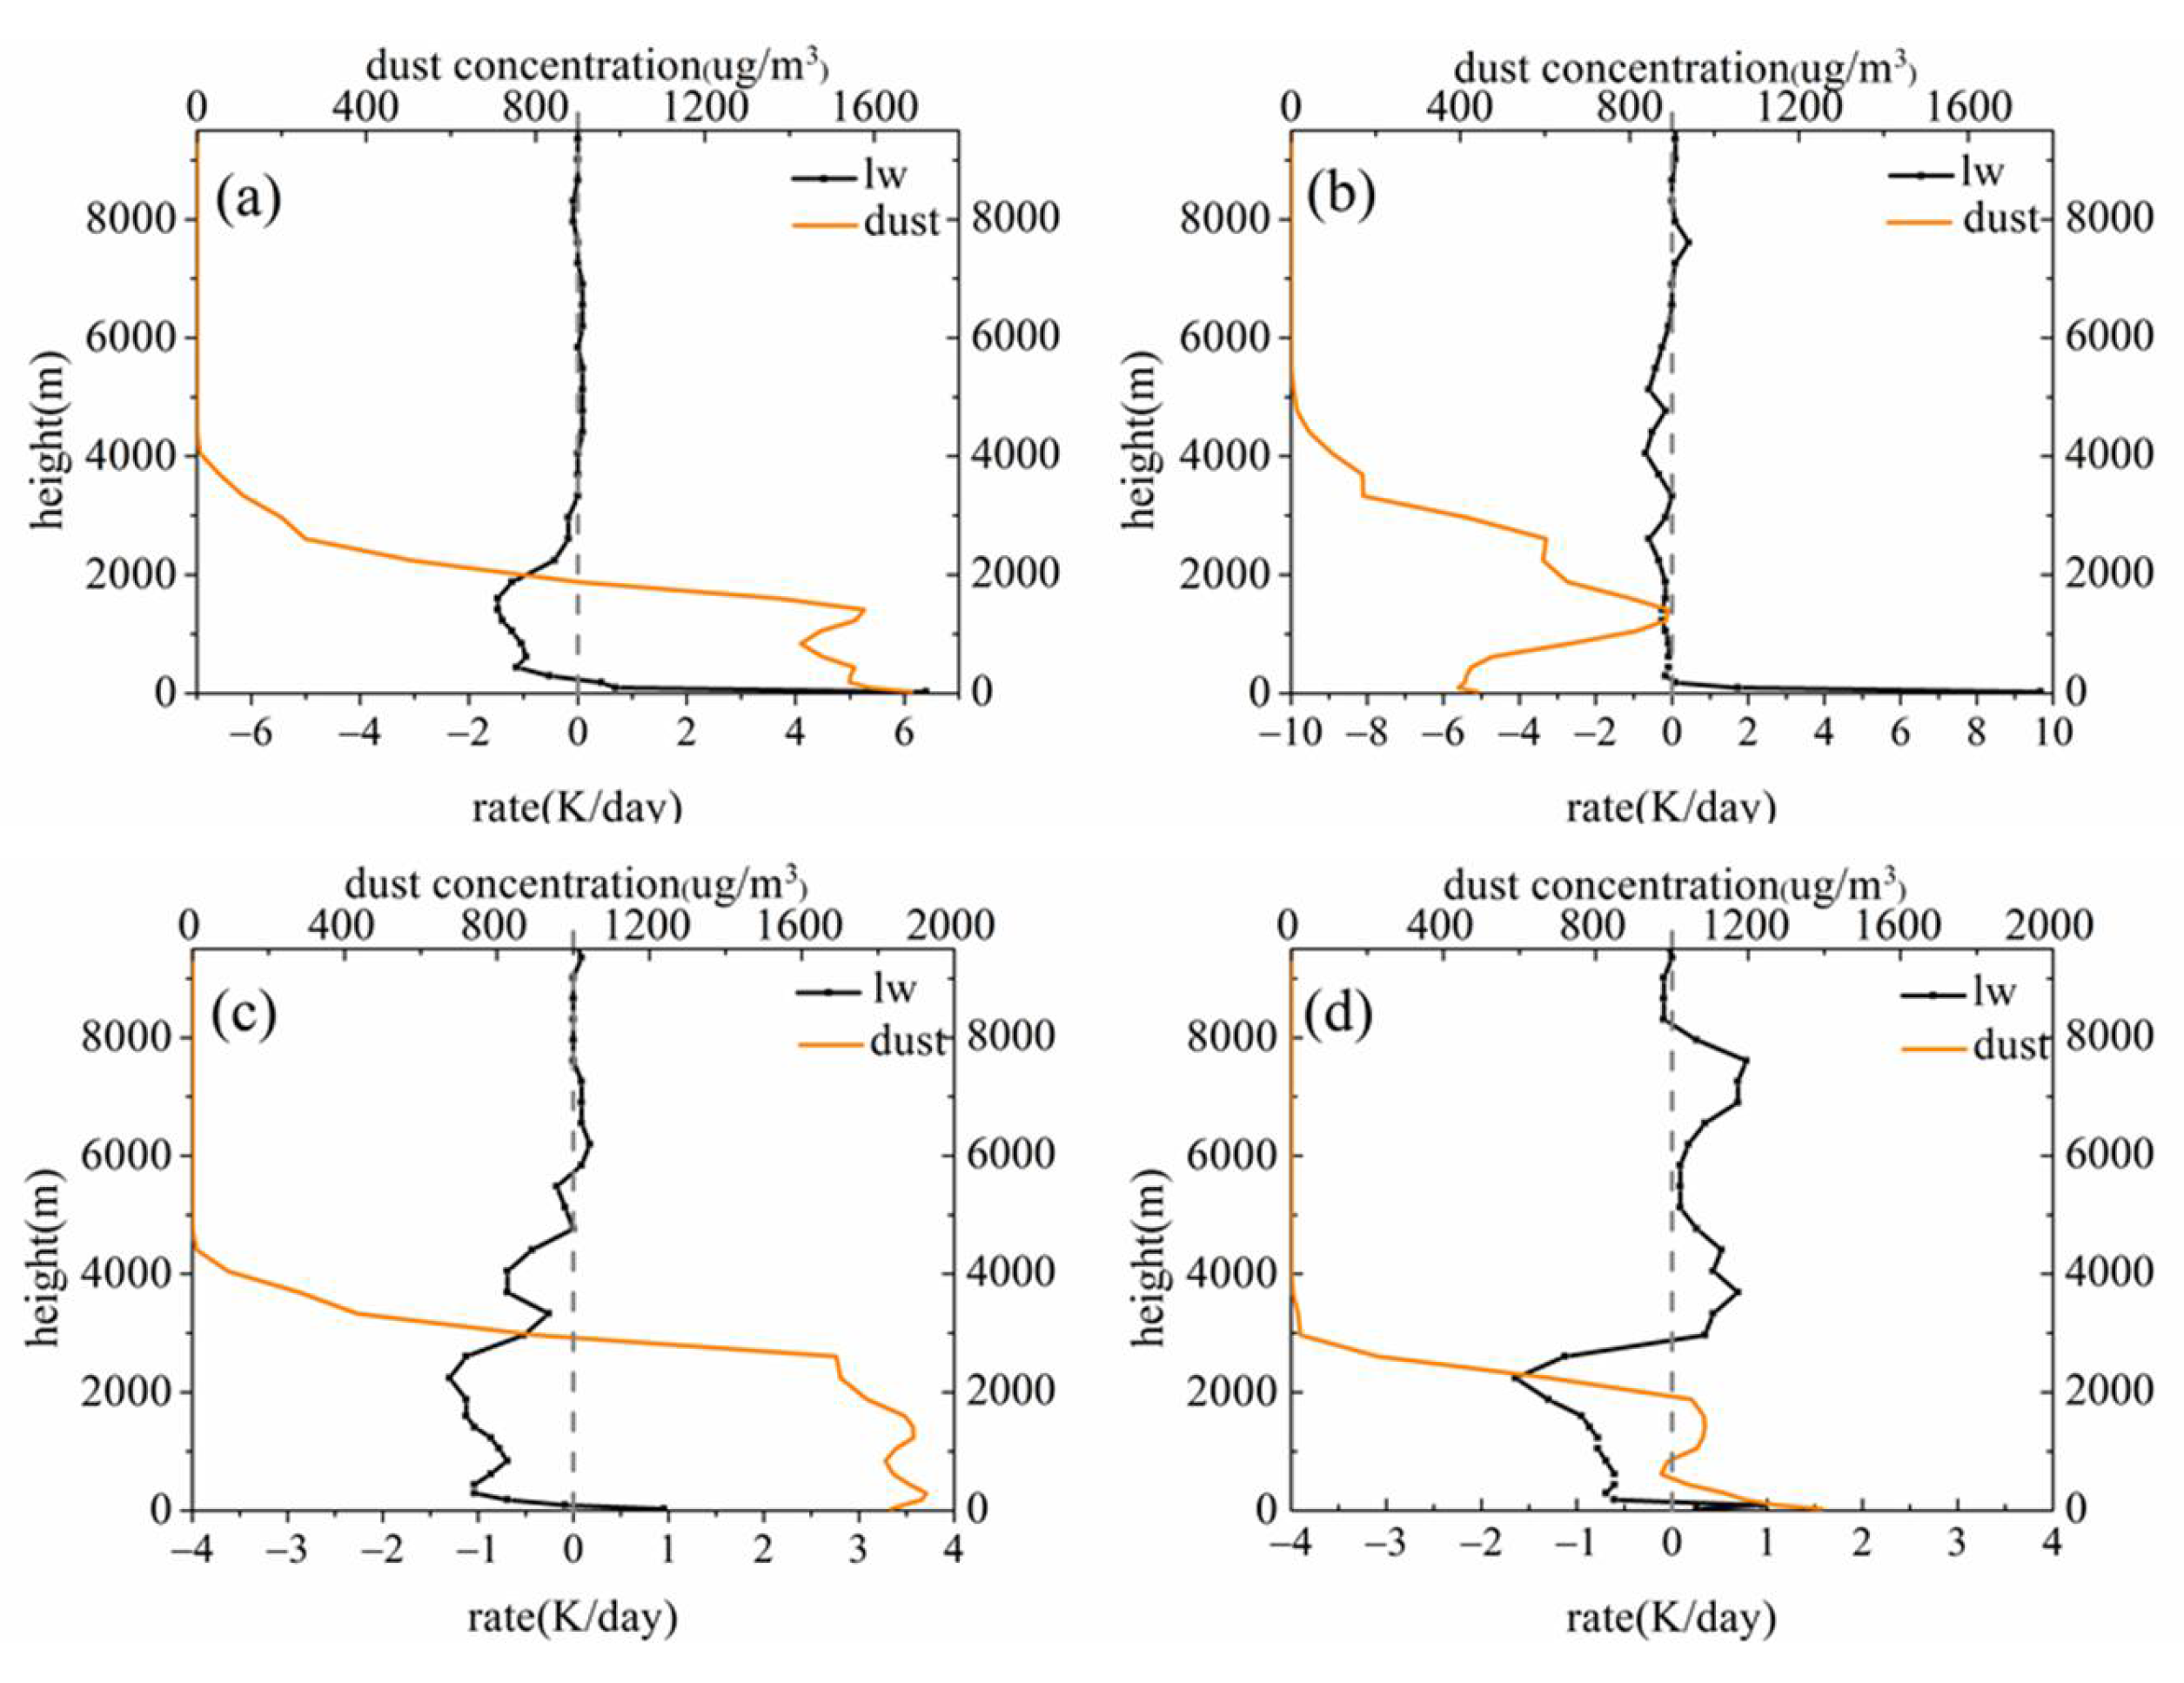
4.4. Direct Radiative Effect Induced by Dust during the Nighttime

To avoid the influence of clouds on the DDRE, a nighttime case was selected for analysis on 29 April 2015, at 18:00 UTC, i.e., a moment of low cloudiness (Figure 9). Figure 10 shows the distribution of the DDRE over the TB at the TOA, at the SUR, and in the atmosphere during the nighttime, when the dust SW radiative effect was zero. As shown in the figure, the dust layers could enhance the downward LW radiation reaching the land SUR; thus, the SUR temperature enacted, to a small extent, a warming effect. Dust aerosols affect the downward SW flux by scattering and absorbing solar radiation. At the same time, they can also absorb and scatter the upward LW flux at the SUR, as well as emit LW radiation through themselves [32,50,51]. At night, dust aerosols released heat stored during the day and subsequently increased the downward LW radiation flux reaching the land SUR and exerted a warming effect at the SUR during the nighttime. There was no SW radiation in addition to lower temperatures at night, resulting in lower upward LW flux at the surface. The presence of dust aerosols caused the downward LW radiation to be greater than the upward LW radiation at the SUR. In the atmosphere, the scattered and released LW radiation of dust was much larger than the absorbed LW radiation, leading to a negative LW DDRE. The decreased LW radiation flux from the entire Earth–atmosphere system to space at night was apparently caused by the LW radiation released by mineral dust, which was able to significantly increase the upward LW radiation at the TOA. In addition, due to the lower temperature at the SUR and in the near-surface atmosphere during the nighttime, the LW radiative effects at the TOA, at the SUR, and in the atmosphere were smaller than those during the daytime, with the LW radiative effect being most pronounced at the SUR.
The vertical profiles of the dust concentration and atmospheric LW radiative heating rate at the four stations in the TB on 29 April 2015, at 18:00 UTC, are presented in Figure 11. In contrast to the vertical profiles of the LW heating rate induced by the DDRE during the daytime, the LW DDRE exhibited a warming effect in the near-surface atmosphere during the nighttime. Moreover, the LW radiative heating rate induced by dust in the near-surface atmosphere was much greater during the nighttime than during the daytime at the HT and KEL stations, with 6.39 and 9.68 K day−1, respectively. The heating rates at the four stations all decreased with increasing altitude. From a 100 m altitude up until the top of the dust layer, the LW DDRE exhibited a cooling effect, and eventually fluctuated around zero. Coinciding with the daytime simulations, the top of the dust layer was the part of the entire atmosphere most significantly affected by the DDRE.

4.5. Regional Average Dust Radiative Effect

The dust-induced variations in the radiative effect within the TB at the TOA, at the SUR, and in the atmosphere averaged over the simulation period (27 April–1 May 2015), inferred from the inner-domain simulations, are summarized in Table 3a–c show the SW, LW, and net DDREs within the TB at the TOA, at the SUR, and in the atmosphere, respectively, during the daytime and during the nighttime. The SW, LW, and net DDREs at the SUR during this dust storm were −35.28, 13.83, and −21.45 W m−2, respectively (Table 3a). The SW DDRE was more significant in the daytime, while there was no SW radiation at night. The SW and net DDREs were positive over the TB in the atmosphere averaged during the daytime (39.44 and 24.47 W m−2, respectively). The SW warming effect of dust was dominant within the TB in the atmosphere, exceeding 39.44 W m−2, and was much stronger than the LW cooling effect (i.e., −14.97 W m−2) during the daytime. At the TOA, the dust aerosols induced a negative SW radiative effect and a positive LW radiative effect during the daytime, thereby resulting in warming (Table 3b). However, there was a cooling effect at the TOA during the nighttime. Overall, the magnitude of the DDRE at the SUR and in the atmosphere was predominated by the SW radiative effect. In addition, the DDRE at the TOA was significantly weaker than that at the SUR (Table 3a). This conclusion coincides with that of Xie et al. [52], who simulated the DDRE in East Asia. The improved CAM4-BAM model was used to investigate the dust radiative feedbacks over East Asia, compared with those over North Africa. Xie et al. [52] revealed that the DDRE in East Asia was the complete opposite of that in North Africa. The dust radiative effect had a warming effect at the SUR in North Africa and a cooling effect at the SUR in East Asia. Further mechanistic analysis revealed that the contrast of the dust radiation effects between East Asia and North Africa likely stemmed from their differences in regional surface albedo, vertical dust distribution, and particle size distribution. Apart from that, the SW and net DDREs were negative at the SUR over the Sahara [29], India [23,24], the Arabian Sea [31], and the Tibetan Plateau [37] of China, which was consistent with the results of this paper. At the TOA, dust aerosols induced a negative net radiative effect over India, the Arabian Sea, and the Tibetan Plateau of China, as well as a positive net radiative effect over the Sahara. It is worth noting that the different regions, time periods, and different methods used to calculate the DDRE can contribute to differences in the results. In this study, only one case of dust storms was simulated. More cases need to be simulated and verified.
The dust had an evident SW warming effect combined with an LW cooling effect in the atmosphere during the selected dust storm, which was consistent with the radiative heating rates by dust aerosols over the Saharan and Afghan deserts [53]. Figure 12 displays the mean heating rate profile of the SW, LW, and net DDREs over the TB during this dust storm period. As depicted in Figure 12, the dust LW heating rate was generally negative in the atmosphere, implying that dust aerosols exerted an LW cooling effect in the atmosphere, with the minimum values (i.e., <−1.0 K day−1) occurring in the surface layer. A positive SW radiative effect induced by dust led to atmospheric warming. The maximum dust SW heating rate appeared at a 100–1000 m altitude, while it gradually decreased with increasing altitude. This positive SW heating rate coincided with that of Huang et al. [38], who investigated the impact of dust aerosols on the radiative energy budget over the TB during dust episodes in late July 2006. However, in a somewhat different conclusion from this study, Huang et al. [38] calculated the positive LW heating rate in the near-surface atmosphere. These differences may be caused by diverse models, research time, dust storm intensity, and so on. Overall, in this study, dust induced cooling in the near-surface atmosphere, where the cooling rate exceeded −0.5 K day−1, while it gradually decreased with increasing altitude. The radiative heating rates became positive above a 100 m altitude and reached a maximum of 0.3 K day−1 at a 1500 m altitude. With rising altitude, the heating rate gently reduced to zero at an approximately 6 km altitude, while it became negative and continued to decrease, and then increased again. The heating rate floated slightly around zero and finally approximated zero above a 9 km altitude.

5. Conclusions

The Tarim Basin (TB), Northwest China, has a special topography that allows for the formation of an ultra-high atmospheric boundary layer containing persistent floating dust aerosols. Research on the unique dust radiative effect in the TB is still incomplete. We simulated a typical springtime dust storm with persistent floating dust, which occurred over the TB from 27 April to 1 May 2015, by employing WRF-Chem v3.8.1. The simulation could capture the ultra-high atmospheric boundary layer, meteorological field, and dust aerosols over the basin. The results indicated that the dust induced a positive SW radiative effect in the atmosphere and a negative SW radiative effect at the SUR, combined with a negative LW radiative effect in the atmosphere and a positive LW radiative effect at the SUR within the TB during the daytime. Regarding low-level dust, the LW radiative effect was greater than the SW radiative effect in the atmosphere, while for high-level dust the situation was reversed. During the nighttime, the dust LW radiative effects at the TOA, at the SUR, and in the atmosphere were all weaker than those during the daytime, with the dust radiative effect at the SUR being the most significant, thereby heating the near-surface atmosphere. These nighttime results were different from the daytime results. The dust LW radiative effect from above a 100 m altitude up until the top of the dust layer cooled the atmosphere. In contrast, the heating rate induced by the DDRE peaked at the top of the dust layer over the TB. Generally, the average SW, LW, and net DDREs over the TB were approximately −35.28, 13.83, and −21.45 W m−2, respectively, at the SUR during the selected dust storm. The SW DDRE at the SUR and in the atmosphere was much higher than the LW DDRE, while the DDRE at the TOA was much lower than that at the SUR. This study revealed the noteworthy radiative effect features of dust aerosols during typical dust storms with persistent floating dust over the TB, contributed to a full comprehending of regional/global climate change, and further improved as well as refined weather prediction models.
Overall, the presence of dust aerosols in the atmosphere plays a key role in the energy balance and regional climate changes over the affected regions. DDRE-related studies have been conducted globally on the Taklamakan Desert, Sahara, India, North Africa, Arabia, and so on. We have comprehensively investigated the DDRE characteristics during a typical springtime dust storm with persistent floating dust in the Tarim Basin, while the climate effects generated by the DDRE still need further study. In addition, the indirect radiative effect of dust, that is, the process of dust acting as cloud condensation nuclei or ice nuclei is still a poorly understood issue and will be further discussed in the future.

Author Contributions

Conceptualization, L.M. and T.Z.; methodology, Q.H.; software, L.M.; validation, L.M., X.Y. and A.M.; formal analysis, M.W., H.P. and W.H.; investigation, F.Y.; resources, C.Z.; writing—original draft preparation, L.M. and T.Z.; writing—review and editing, Q.H. and X.Y.; visualization, L.M. and H.P.; supervision, A.M. and M.W.; funding acquisition, Q.H. All authors have read and agreed to the published version of the manuscript.

Funding

This research was funded by the National Natural Science Foundation of China, grant numbers 41905014, 42030612, and 41875019; the Natural Science Foundation of Xinjiang Region, grant number 2021D01A197; the Guiding Planning Project of the Xinjiang Meteorological Bureau, grant number YD202206; the Meteorological Youth Backbone Talent Fund of the Xinjiang Meteorological Bureau, grant number 2021-46; and the Central Asia Atmospheric Science Research Foundation, grant number CAAS201913.

Data Availability Statement

Some observation data in this paper were obtained from the Institute of Desert Meteorology, China Meteorological Administration. These data are limited by the Institute and can be available from the author with permission.

Acknowledgments

This research was also supported by the Weather Research and Forecasting Model with Chemistry (WRF-Chem), Moderate Resolution Imaging Spectroradiometer (MODIS), and ECMWF’s ERA-Interim projects. MODIS Level 1 and atmosphere products were available through the LAADS web. ERA-Interim was a global atmospheric reanalysis that was available from 1 January 1979 to 31 August 2019 through the ECMWF web.

Conflicts of Interest

The authors declare no conflict of interest.

References

  1. Christopher, S.A.; Wang, J.; Ji, Q.; Tasy, S.C. Estimation of diurnal shortwave dust aerosol radiative forcing during PRIDE. J. Geophys. Res. Atmos. 2003, 108, 8596. [Google Scholar] [CrossRef]
  2. Dey, S.; Tripathi, S.N.; Singh, R.P.; Holben, B.N. Influence of dust storms on the aerosol optical properties over the Indo-Gangetic basin. J. Geophys. Res. Atmos. 2004, 109. [Google Scholar] [CrossRef] [Green Version]
  3. Duce, R.A. Sources, distributions, and fluxes of mineral aerosols and their relationship to climate. Aerosol Clim. 1995, 17, 43–72. [Google Scholar]
  4. Zhang, D.E. Preliminary analysis of the weather climatology of dust fall in China since the historical period. Chin. Sci. Chem. Biol. Agron. Med. Geol. 1984, 14, 88–98. (In Chinese) [Google Scholar]
  5. Zhou, M.; Chen, Z.; Huang, R.; Wang, Q.; Arimoto, R.; Parungo, F.; Lenschow, D.; Okada, K.; Wu, P. Effects of two dust storms on solar radiation in the Beijing-Tianjin area. Geophys. Res. Lett. 1994, 21, 2697–2700. [Google Scholar] [CrossRef]
  6. Wang, X.; Wang, T.; Tang, J.; Gu, F. Thermal diffusion characteristics of atmosphere-particle two phase flow in dust storm. Heat Mass Transf. 2005, 41, 306–314. [Google Scholar] [CrossRef]
  7. Huang, J.; Minnis, P.; Lin, B.; Wang, T.; Yi, Y.; Hu, Y.; Sun-Mack, S.; Ayers, K. Possible influences of Asian dust aerosols on cloud properties and radiative forcing observed from MODIS and CERES. Geophys. Res. Lett. 2006, 33, 272–288. [Google Scholar] [CrossRef] [Green Version]
  8. Wang, N.; Zhang, L. A preliminary review of the radiative properties of dust aerosols and their observation methods. Arid Weather 2007, 25, 68–73. (In Chinese) [Google Scholar]
  9. Crutzen, P.J.; Ramanathan, V. The parasol personal effect on climate. Science 2003, 2003, 1679–1681. [Google Scholar] [CrossRef]
  10. Rosenfeld, D.; Rudich, Y.; Lahav, R. Desert dust suppressing precipitation: A possible desertification feedback loop. Proc. Natl. Acad. Sci. USA 2001, 98, 5975–5980. [Google Scholar] [CrossRef] [Green Version]
  11. Martin, J.H. Glacial-interglacial CO2 change: The Iron Hypothesis. Paleoceanography 1990, 5, 1–13. [Google Scholar] [CrossRef]
  12. Watson, A.J.; Bakker, D.C.E.; Ridgwell, A.J.; Boyd, P.W.; Law, C.S. Effect of iron supply on Southern Ocean CO2 uptake and implications for glacial atmospheric CO2. Nature 2000, 407, 730–733. [Google Scholar] [CrossRef] [PubMed]
  13. Zhang, X. Review on sources and transport of loess materials on the Chinese loess plateau. Quat. Sci. 2007, 27, 181–186. [Google Scholar]
  14. Garratt, J.R. Review: The atmospheric boundary layer. Earth Sci. Rev. 1994, 37, 89–134. [Google Scholar] [CrossRef]
  15. Meng, L.; Yang, X.H.; Zhao, T.L.; He, Q.; Lu, H.; Mamtimin, A.; Huo, W.; Yang, F.; Liu, C. Modeling study on three-dimensional distribution of dust aerosols during a dust storm over the Tarim Basin, Northwest China. Atmos. Res. 2018, 218, 285–295. [Google Scholar] [CrossRef]
  16. Zhang, Q.; Wang, S. Atmospheric boundary layer structure and land surface process characteristics in the Northwest Arid Zone during summer. J. Meteorol. 2008, 66, 599–608. (In Chinese) [Google Scholar]
  17. Indoitu, R.; Orlovsky, L.; Orlovsky, N. Dust storms in Central Asia: Spatial and temporal variations. J. Arid Environ. 2012, 85, 62–70. [Google Scholar] [CrossRef]
  18. Xu, X.D.; Wang, Y.J.; Wei, W.S.; Zhao, T.L.; Xu, H.X. Summer precipitation process and atmospheric water cycle over Tarim Basin under specific large terrain background. Desert Oasis Meteor 2014, 8, 1–11. (In Chinese) [Google Scholar]
  19. Perlwitz, J.; Tegen, I.; Miller, R.L. Interactive soil dust aerosol model in the GISS GCM: 1. Sensitivity of the soil dust cycle to radiative properties of soil dust aerosols. J. Geophys. Res. Atmos. 2001, 106, 18167–18192. [Google Scholar] [CrossRef]
  20. Liao, H.; Seinfeld, J.H. Radiative forcing by mineral dust aerosols: Sensitivity to key variables. J. Geophys. Res. Atmos. 1998, 103, 31637–31645. [Google Scholar] [CrossRef]
  21. Perrone, M.R.; Tafuro, A.M.; Kinne, S. Dust layer effects on the atmospheric radiative budget and heating rate profiles. Atmos. Environ. 2012, 59, 344–354. [Google Scholar] [CrossRef]
  22. Peris-Ferrús, C.; Gómez-Amo, J.L.; Marcos, C.; Freile-Aranda, M.D.; Utrillas, M.P.; Martínez-Lozano, J.A. Heating rate profiles and radiative forcing due to a dust storm in the Western Mediterranean using satellite observations. Atmos. Environ. 2017, 160, 142–153. [Google Scholar] [CrossRef]
  23. Patel, P.N.; Kumar, R. Estimation of Aerosol Characteristics and Radiative Forcing during Dust Events over Dehradun. Aerosol Air Qual. Res. 2015, 15, 2082–2093. [Google Scholar] [CrossRef]
  24. Sharma, D.; Singh, D.; Kaskaoutis, D.G. Impact of Two Intense Dust Storms on Aerosol Characteristics and Radiative Forcing over Patiala, Northwestern India. Adv. Meteorol. 2014, 2012, 978–988. [Google Scholar] [CrossRef] [Green Version]
  25. Sokolik, I.N.; Winker, D.M.; Bergametti, G.; Gillette, D.A.; Carmichael, G.; Kaufman, Y.J.; Gomes, L.; Schuetz, L.; Penner, J.E. Introduction to special section: Outstanding problems in quantifying the radiative impacts of mineral dust. J. Geophys. Res. Atmos. 2001, 106, 18015–18027. [Google Scholar] [CrossRef]
  26. Solomon, S.; Qin, D.; Manning, M.; Chen, Z.; Marquis, M.; Avery, K.; Alley, R.B.; Berntsen, T.; Bindoff, N.L.; Chidthaisong, A.; et al. Climate Change 2001: The Physical Science Basis. Contribution of working group I to the Third Assessment Report of the Intergovernmental Panel on Climate Change. Intergov. Panel Clim. Change Clim. Change 2001, 996, 95–123. [Google Scholar]
  27. IPCC. Climate Change 2007: The Physical Science Basis by IPCC WG I; Cambridge University Press: Cambridge, UK, 2007; Volume 785. [Google Scholar]
  28. IPCC. Climate Change 2013: The Physical Science Basis by IPCC WG I; Cambridge University Press: Cambridge, UK, 2013; Volume 1535. [Google Scholar]
  29. Lingo, A.; Ackerman, T.P.; Allan, R.P.; Kassianov, E.I.; McFarlane, S.A.; Robinson, G.J.; Barnard, J.C.; Miller, M.A.; Harries, J.E.; Russell, J.E.; et al. Observations of the impact of a major Saharan dust storm on the atmospheric radiation balance. Geophys. Res. Lett. 2006, 33, 409–421. [Google Scholar]
  30. Zhao, C.; Liu, X.; Leung, L.R.; Johnson, B.; Mcfarlane, S.A.; Gustafson, W.I.; Fast, J.D.; Easter, R. The spatial distribution of mineral dust and its shortwave radiative forcing over North Africa: Modeling sensitivities to dust emissions and aerosol size treatments. Atmos. Chem. Phys. 2010, 10, 8821–8838. [Google Scholar] [CrossRef] [Green Version]
  31. Jose, S.; Gharai, B.; Rao, P.V.N.; Dutt, C.S.B. Satellite-based shortwave aerosol radiative forcing of dust storm over the Arabian Sea. Atmos. Sci. Lett. 2016, 17, 43–50. [Google Scholar] [CrossRef]
  32. Dufresne, J.L.; Gautier, C.; Ricchiazzi, P.; Fouquart, Y. Longwave Scattering Effects of Mineral Aerosols. J. Atmos. Sci. 2002, 59, 1959–1966. [Google Scholar] [CrossRef]
  33. Wang, H.; Shi, G.Y.; Zhu, J.; Chen, B.; Che, H.Z.; Zhao, T.L. Case study of longwave contribution to dust radiative effects over East Asia. Sci. Bull. 2013, 58, 3673–3681. [Google Scholar] [CrossRef] [Green Version]
  34. Chen, S.; Zhao, C.; Qian, Y.; Leung, R.; Huang, J.P.; Huang, Z.W.; Bi, J.; Zhang, W.; Shi, J.; Yang, L.; et al. Regional modeling of dust mass balance and radiative forcing over East Asia using WRF-Chem. Aeolian Res. 2014, 15, 15–30. [Google Scholar] [CrossRef]
  35. Zhang, T.H.; Liao, H.; Chang, W.Y. Assessment of direct radiative forcing of dust aerosols in China based on International Comparison of Atmospheric Chemistry-Climate Models (ICPAC) model data. Atmos. Sci. 2016, 40, 1242–1260. (In Chinese) [Google Scholar]
  36. Cheng, T.T.; Lu, D.R.; Xu, Y.F. Radiative forcing of dust aerosols in the Hunsandak Sands. Highl. Meteorol. 2005, 24, 920–926. (In Chinese) [Google Scholar]
  37. Chen, S.Y.; Huang, J.P.; Zhao, C.; Qian, Y.; Leung, R.; Yang, B. Modeling the transport and radiative forcing of Taklimakan dust over the Tibetan Plateau: A case study in the summer of 2006. J. Geophys. Res. Atmos. 2013, 118, 797–812. [Google Scholar] [CrossRef]
  38. Huang, J.; Fu, Q.; Su, J.; Tang, Q.; Minnis, P.; Hu, Y.; Yi, Y.; Zhao, Q. Taklimakan dust aerosol radiative heating derived from CALIPSO observations using the Fu-Liou radiation model with CERES constraints. Atmos. Chem. Phys. 2009, 9, 5967–6001. [Google Scholar] [CrossRef]
  39. Chen, S.; Huang, J.; Kang, L.; Wang, H.; Ma, X.; He, Y.; Yuan, T.; Yang, B.; Huang, Z.; Zhang, G. Emission, transport, and radiative effects of mineral dust from the Taklimakan and Gobi deserts: Comparison of measurements and model results. Atmos. Chem. Phys. 2017, 17, 1–43. [Google Scholar] [CrossRef] [Green Version]
  40. Lu, Z.Q.; Li, J.L.; He, Q.; Zhao, Z.J. Spatiotemporal distribution of AOD in southern Xinjiang and meteorological influencing factors. Acta Sci. Circumstantiae 2022, 42. (In Chinese) [Google Scholar] [CrossRef]
  41. Skamarock, W.C.; Klemp, J.B.; Dudhia, J.; David, O.G.; Dale, B.; Wang, W.; Jordan, G.P. A Description of the Advanced Research WRF Version 2. Ncar Tech. 2018, 113, 7–25. [Google Scholar]
  42. Grell, G.A.; Peckham, S.E.; Schmitz, R.; Mckeen, S.A.; Frost, G.; Skamarock, W.C.; Eder, B. Fully coupled ‘online’ chemistry within the WRF model. Atmos. Environ. 2005, 39, 6957–6975. [Google Scholar] [CrossRef]
  43. Werner, M.; Kryza, M.; Guzikowski, J. Can Data Assimilation of Surface PM2.5 and Satellite AOD Improve WRF-Chem Forecasting? A Case Study for Two Scenarios of Particulate Air Pollution Episodes in Poland. Remote Sens. 2019, 11, 2364. [Google Scholar] [CrossRef] [Green Version]
  44. Kaufman, Y.J.; Tanre, D.; Remer, L.A.; Vermote, E.F.; Chu, A.; Holben, B.N. Operational remote sensing of tropospheric aerosol over land from EOS moderate resolution imaging spectroradiometer. J. Geophys. Res. Atmos. 1997, 102, 51-17. [Google Scholar] [CrossRef]
  45. Eibedingil, I.G.; Gill, T.E.; Pelt, R.; Tong, D.Q. Comparison of Aerosol Optical Depth from MODIS Product Collection 6.1 and AERONET in the Western United States. Remote Sens. 2021, 13, 2316. [Google Scholar] [CrossRef]
  46. Yao, Z.; Li, J.; Zhao, Z.; Zhu, L. Extracting Taklimakan Dust Parameters from AIRS with Artificial Neural Network Method. Remote Sens. 2019, 11, 2931. [Google Scholar] [CrossRef] [Green Version]
  47. Hsu, N.C.; Tsay, S.C.; King, M.D.; Herman, J.R. Aerosol properties over bright-reflecting source regions. IEEE Trans. Geosci. Remote Sens. 2004, 42, 557–569. [Google Scholar] [CrossRef]
  48. Hsu, N.C.; Tsay, S.C.; King, M.D.; Herman, J.R. Deep Blue Retrievals of Asian Aerosol Properties during ACE-Asia. IEEE Trans. Geosci. Remote Sens. 2006, 44, 3180–3195. [Google Scholar] [CrossRef]
  49. Meng, L.; Yang, X.H.; Zhao, T.L.; He, Q.; Mamtimin, A.; Wang, M.; Huo, W.; Yang, F.; Zhou, C.; Pan, H. Simulated regional transport structures and budgets of dust aerosols during a typical springtime dust storm in the Tarim Basin, Northwest China. Atmos. Res. 2020, 238, 104892. [Google Scholar] [CrossRef]
  50. Zhou, Y.; Savijarvi, H. The effect of aerosols on long wave radiation and global warming. Atmos. Res. 2014, 135–136, 102–111. [Google Scholar] [CrossRef] [Green Version]
  51. Han, Z.; Li, J.; Xia, X.; Zhang, R. Investigation of direct radiative effects of aerosols in dust storm season over East Asia with an online coupled regional climate-chemistry-aerosol model. Atmos. Environ. 2012, 54, 688–699. [Google Scholar] [CrossRef]
  52. Xie, X.; Liu, X.; Che, H.; Xie, X.; Wang, H.; Li, J.; Shi, Z.; Liu, Y. Modeling East Asian Dust and Its Radiative Feedbacks in CAM4-BAM. J. Geophys. Res. Atmos. 2018, 123, 1079–1096. [Google Scholar] [CrossRef]
  53. Quijano, A.L.; Sokolik, I.N.; Toon, O.B. Radiative heating rates and direct radiative forcing by mineral dust in cloudy atmospheric conditions. J. Geophys. Res. Atmos. 2000, 105, 12207–12219. [Google Scholar] [CrossRef] [Green Version]
Figure 1. Temporal variation trend in the AOD, averaged over the TB from 2015 to 2019.
Remotesensing 14 01167 g001
Figure 2. Nesting domain 1 (i.e., whole area) and domain 2 (i.e., region within the black rectangular), with the locations of five monitoring stations in the Tarim Basin (TB). Colored contours indicate terrain elevation in m a.s.l.
Remotesensing 14 01167 g002
Figure 3. Vertical profiles of the (a,c) wind speed at the HT, KEL, and KSH stations on 29 April 2015, at 11:00 UTC, and the (b,d) potential temperature at the HT, KEL, and KSH stations on 29 April 2015, at 23:00 UTC. Red dotted lines represent simulated values (sim). Black lines represent observed values (obs).
Remotesensing 14 01167 g003
Figure 4. Spatial distributions of the daily average 550 nm AODs retrieved from MODIS (left column) with the corresponding simulations by WRF-Chem (right column) within the TB throughout the selected dust storm.
Remotesensing 14 01167 g004
Figure 5. Diurnal variations in the mean net (SW + LW) DDRE over the TB at the top of the atmosphere (TOA: green curve), at the surface (SUR: red curve), and in the atmosphere (ATM: blue curve) in W m−2, and diurnal variation in the dust load (dust load: black dotted line) in g m−2, averaged over the TB simulated by WRF−Chem from 26 April to 1 May 2015.
Remotesensing 14 01167 g005
Figure 6. Spatial distribution of the total vertical column dust load in g m−2 over the TB on 30 April 2015, at 01:00 UTC.
Remotesensing 14 01167 g006
Figure 7. Spatial distributions of the mean SW, LW, and net (SW + LW) DDREs in W m−2 over the TB (ac) at the top of the atmosphere (TOA: top panels), (gi) at the surface (SUR: bottom panels), and (df) in the atmosphere (ATM: middle panels) on 30 April 2015, at 01:00 UTC.
Remotesensing 14 01167 g007
Figure 8. Vertical profiles of dust concentration (orange line) and of the dust-induced changes in the SW (red line), LW (blue line), and net (black line) atmospheric radiative heating at the (a) HT, (b) KEL, (c) KSH, and (d) TZH stations in the TB on 30 April 2015, at 01:00 UTC.
Remotesensing 14 01167 g008
Figure 9. Spatial distribution of the total vertical column dust load (g m−2) over the TB on 29 April 2015, at 18:00 UTC.
Remotesensing 14 01167 g009
Figure 10. Spatial distributions of the mean LW DDRE in W m−2 over the TB (a) at the top of the atmosphere (TOA), (b) at the surface (SUR), and (c) in the atmosphere (ATM) on 29 April 2015, at 18:00 UTC.
Remotesensing 14 01167 g010
Figure 11. Vertical profiles of the dust concentration (orange lines) and dust-induced changes of the atmospheric LW radiative heating profiles in K day−1 (black lines) at the (a) HT, (b) KEL, (c) KSH, and (d) TZH stations in the TB on 29 April 2015, at 18:00 UTC.
Remotesensing 14 01167 g011
Figure 12. Vertical profiles of dust concentration (orange solid line) and dust-induced changes in the SW (red line), LW (black line), and net (SW + LW, blue line) radiative heating profiles within the TB averaged throughout the selected dust storm.
Remotesensing 14 01167 g012
Table 1. Physical parameters and variables utilized in WRF-Chem.
Physical ParameterNamelist VariableModel/Scheme
Dust emission schemedust_optGOCART
Land surfacesf_surface_physicsNoah land-surface model
PBL modelbl_pbl_physicsACM2 scheme
Surface similaritysf_sfclay_physicsPleim-Xiu
Microphysicsmp_physicsMorrison 2-moment scheme
Shortwave radiationra_sw_physicsRRTMG scheme
Longwave radiationra_lw_physicsRRTMG scheme
Table 2. The mean net (SW + LW) DDRE (W m−2) within the TB at the TOA, at the SUR, and in the ATM throughout the selected dust storm.
TOAATMSUR
4−26Daytime0.402.44−2.04
Nighttime−0.91−2.942.03
4−27Daytime1.418.19−6.78
Nighttime−0.60−11.8011.19
4−28Daytime3.9734.92−30.95
Nighttime−1.40−16.0914.70
4−29Daytime3.8636.81−32.95
Nighttime−2.88−15.8813.00
4−30Daytime1.7125.75−24.04
Nighttime−0.04−7.897.85
5−1Daytime1.2023.88−22.67
Nighttime−2.44−10.137.69
Table 3. The mean SW, LW, and net (SW + LW) DDREs (W m−2) within the TB at the top of the atmosphere (TOA), at the surface (SUR), and in the atmosphere (ATM) during the selected dust storm, the daytime and the nighttime, respectively.
Table 3a. The mean SW, LW, and net (SW + LW) DDREs (W m−2) within the TB at the top of the atmosphere (TOA), at the surface (SUR), and in the atmosphere (ATM) during the selected dust storm.
TOAATMSUR
SW−1.2933.99−35.28
LW1.56−12.2713.83
Net0.2721.72−21.45
Table 3b. Same as Table 3a, but for the daytime. Unit: Wm−2.
TOAATMSUR
SW−1.5239.44−40.96
LW3.89−14.9718.86
Net2.3724.47−22.10
Table 3c. Same as Table 3a, but for the nighttime. Unit: Wm−2.
TOAATMSUR
SW000
LW−1.53−12.8511.32
Net−1.53−12.8511.32
Publisher’s Note: MDPI stays neutral with regard to jurisdictional claims in published maps and institutional affiliations.

