Article

Evaluation of Sentinel-2/MSI Atmospheric Correction Algorithms over Two Contrasted French Coastal Waters

1
Department of Climate Change, Ministry of Natural Resources and Environment of Viet Nam, Hanoi 10000, Vietnam
2
Université Littoral Côte d’Opale, CNRS, Université Lille, UMR 8187, Laboratoire d’Océanologie et de Géosciences (LOG), 62930 Wimereux, France
3
Université Lille, CNRS, Université Littoral Côte d’Opale, UMR 8187, Laboratoire d’Océanologie et de Géosciences (LOG), 59000 Lille, France
*
Author to whom correspondence should be addressed.
Remote Sens. 2022, 14(5), 1099; https://doi.org/10.3390/rs14051099
Submission received: 4 January 2022 / Revised: 10 February 2022 / Accepted: 19 February 2022 / Published: 23 February 2022
(This article belongs to the Special Issue Atmospheric Correction for Remotely Sensed Ocean Color Data)

Abstract

:
The Sentinel-2A and Sentinel-2B satellites, with on-board Multi-Spectral Instrument (MSI), and launched on 23 June 2015 and 7 March 2017, respectively, are very useful tools for studying ocean color, even if they were designed for land and vegetation applications. However, the use of these satellites requires a process called “atmospheric correction”. This process aims to remove the contribution of the atmosphere from the total top of atmosphere reflectance measured by the remote sensors. For the purpose of assessing this processing, seven atmospheric correction algorithms have been compared over two French coastal regions (English Channel and French Guiana): Image correction for atmospheric effects (iCOR), Atmospheric correction for OLI ‘lite’ (ACOLITE), Case 2 Regional Coast Colour (C2RCC), Sentinel 2 Correction (Sen2Cor), Polynomial-based algorithm applied to MERIS (Polymer), the standard NASA atmospheric correction (NASA-AC) and the Ocean Color Simultaneous Marine and Aerosol Retrieval Tool (OC-SMART). The satellite-estimated remote-sensing reflectances were spatially and temporally matched with in situ measurements collected by an ASD FieldSpec4 spectrophotometer. Results, based on 28 potential individual match-ups, showed that the best performance processor is OC-SMART with the highest values for the total score Stot (16.89) and for the coefficient of correlation R2 (ranging from 0.69 at 443 nm to 0.92 at 665 nm). iCOR and Sen2Cor show the less accurate performances with total score Stot values of 2.01 and 7.70, respectively. Since the size of the in situ observation platform can be significant compared to the pixel resolution of MSI onboard Sentinel-2, it can create bias in the pixel extraction process. Thus, to study this impact, we used different methods of pixel extraction. However, there are no significant changes in results; some future research may be necessary.

1. Introduction

In recent decades, remote sensing has been incorporated into various important research studies on the ocean such as ecological investigation or water quality monitoring [1,2,3]. Satellite data play an important role in providing both spatial and temporal information necessary to monitor the change in water quality parameters [4]. Earth observation (EO) provides several key ocean parameters [5]. One of these parameters is the ocean color: ocean color studies the interaction of the sunlight with the marine particles that are optically-active. It can provide information on the concentration and the bio-optical properties of these particles, such as the chlorophyll-a, the total suspended matter, or the colored dissolved organic matter [6]. However, deriving reliable information on the ocean color from remote sensing data is very challenging because of atmospheric influences. The contribution from absorption and scattering of haze, aerosol, water vapor, and other atmospheric components directly affect the estimation of the signal of interest for the ocean color: The Remote Sensing Reflectance (Rrs) [7,8]. Therefore, the step of atmospheric correction (AC) is a prerequisite to then access the bio-optical or biogeochemical properties of seawaters. This accounts for why, in recent decades, many different atmospheric correction algorithms have been developed to remove the impact of the atmosphere (mainly the aerosols) over optically-complex waters such as the coastal environments [9,10].
ESA’s Sentinel-2 mission includes two polar-orbiting satellites, Sentinel-2A and Sentinel-2B, which were launched on 23 June 2015, and on 7 March 2017, respectively. These two satellites provide regular high-spatial-resolution information from the Multi-Spectral Instrument (MSI), which has 13 channels across the visible and short-wave-infra-red spectrum with different spatial resolutions (Table 1). Combining both sensors provides a temporal resolution of 5 days at the equator and ~2 days at mid-latitude [11,12].
For deriving the aerosol contribution to the signal measured by a space-borne sensor, the black pixel assumption (i.e., the ocean is totally absorbent in the near-infrared bands (NIR)) is used in the open ocean waters [8]. However, in optically-complex waters such as turbid coastal waters (the areas observed by MSI, up to 20 km offshore), this hypothesis is not valid anymore [13,14] and this leads to large errors when retrieving the output products [9,15,16]. To deal with this issue, many different algorithms have been developed for the ocean color remote sensors, which can handle the non-zero Rrs in turbid coastal water areas [14,17,18,19,20,21,22,23,24,25,26,27,28]. As shown in published studies [10,15,16,22], these algorithms show strong discrepancies in terms of performance, but did not cover the entire variability of the coastal waters and there is still a need in assessing these algorithms.
Although, as mentioned, there are currently many algorithms that have been developed with high processing efficiency, not all algorithms are open-source, easy to use and well-supported for Sentinel-2 products. Some examples can be mentioned such as Fast Line-of-sight Atmospheric Analysis of Hy-percubes (FLAASH) and Maccs-Atcor Joint Algorithm (MAJA). FLAASH is an algorithm used for cloud detection and atmospheric correction [29]. However, this processor is a proprietary commercial software and it only accepts radiance images in band-interleaved-by-line (BIL) or band-interleaved-by-pixel (BIP) format as the input, which means it is not well-supported for Sentinel-2 images [30]. MAJA is an open-source processor, however, this method is a bit complicated to use, and requires memory, disk space and computer power [31]. Therefore, in order to make it easy for readers to apply the results, access and use the processors, the criterion for choosing AC algorithms applied in this study are free to use and easy to operate.
In this paper, a comparison of seven different atmospheric correction algorithms is presented for MSI images. The retrievals with the seven AC are compared to in situ measurements from sea campaigns in the French coasts of the English Channel and French Guiana using a match-up exercise. By using a set of statistical parameters and scheming score, the validation of these seven processors are evaluated based on their accuracy and performances over these coastal areas. We also studied the impact of the pixel extraction in the match-up exercise on the retrievals as we deal with high-spatial-resolution sensors (and the structure used to collect the in situ measurements can be the same size as one or several pixels).
The in situ and satellite datasets and the match-up exercise are fully detailed in Section 2. The associated statistical parameters used in this study are described in Section 3. Section 4 presents the background on atmospheric correction and the principles of seven AC processors used in our study. Section 5 introduces the performances and statistical results of the AC on the match-up dataset. Then the results are discussed in Section 6. Finally, the conclusion of the ranking score and performances and recommendations for future researches are provided in Section 6.

2. Data

2.1. In Situ Measurements

The radiometric dataset included in this study has been collected from two French coastal areas: French Guiana and the English Channel as shown in Figure 1. The data in French Guiana are primarily collected from the coastal area near the Maury and Cayenne rivers, while for the English Channel, between Calais to Brest, with most of the sampling collected in the coastal areas of Wimereux and Boulogne-sur-Mer, in the Eastern part of the English Channel.
The English Channel is an area with strong tidal currents and low bathymetry with two strong freshwater inputs from two rivers, the Seine and the Escaut. Under water mixing from natural factors such as water inputs and strong tidal currents, the formation of suspended matter in the water in this area increases. Besides, this area also has the appearance of bloom events of phytoplankton in spring, making the density of planktons increase rapidly during this time. Combining all these factors has made the English Channel an area of relatively high turbidity with a mean near-surface suspended sediments concentration of 10–35 mg l−1 [32,33].
Similar to the English Channel, the French Guiana area has low bathymetry and two strong water inputs from two rivers, the Amazon and the Maury. In addition, the French Guiana area also receives a large amount of suspended sediment from North Brazilian and Guiana currents. All these factors have made French Guiana a highly turbid area [34,35].
The radiometric in situ data were collected using the Analytical Spectral Devices (ASD) FieldSpec4 spectro-photometer in the Visible/Near Infrared (VNIR, 350–1050 nm) and the Shortwave Infrared (SWIR, 900–2500 nm) parts of the spectrum. The sampling principle for the ASD spectra is the one described in [36].
The downwelling irradiance above the surface (Ed) was measured using an almost 100% reflecting Spectralon reference panel. Then, the total upwelling radiance from the water (Lt) (i.e., from the water surface) was measured by pointing the sensor at the water surface at 40° from nadir, maintaining an azimuth of 90° or 135° from the solar plane, depending on the pontoon orientation with respect to the sun. Downwelling sky radiance (Lsky) was measured at a zenith angle of 40° to account for the skylight reflection [36]. The water-leaving reflectance is then calculated using the following equation:
ρw = ℼ × (Lt – ρasLsky)/Ed
where ρas is the air-sea interface reflection coefficient. The full protocol is described in [36].
Then the remote-sensing reflectance Rrs is obtained using the following equation:
Rrs = ρw/ℼ

2.2. Satellite

In this study, MSI images are downloaded from the Copernicus Open Access Hub (https://scihub.copernicus.eu/, accessed on 25 August 2020) for both Sentinel-2A and Sentinel-2B images, corresponding to the field trip measurements of 28 days, as shown in Table 2. The temporal window for selecting a match-up was ±2 h between the satellite overpass and the in situ measurements.

2.3. Match-Ups Selection

The match-up selection process is performed to compare satellite estimates and in situ data. The location of the in situ measurements is co-located with the satellite image pixels. A match-up is obtained following several consecutive steps. First, satellite estimates are extracted over a 3 × 3 pixels box, with the central pixel corresponding to the location of the field station. Second, to guarantee data uniformity between field and satellite data, a time variation of ±2 h is set [37]. Third, a pixel is considered as “valid” when it is not a pixel with values Rrs < 0 or flags. The flags pixels include instrument data missing or invalid, water mask, land mask, cloud, possible sea-ice or snow contamination, whitecap, and saturation (within any band from 400 to 754 nm) [16]. Fourth, a match-up is considered “valid” when in the 3 × 3 pixels box at least 6 pixels are considered valid. Finally, a coefficient of variation (CV; standard deviation over mean) is calculated for each wavelength, and the final value of the match-up is “valid” only if the CV is < 0.2 at each wavelength [15,16].

2.4. Extraction Method

For the match-up exercise, we first used the protocol described above from Bailey and Werdell [37] and Jamet et al. [16]. However, while the resolution of MSI used for validation in this article is 60 m for all MSI bands, the size of structures used to collect the in situ measurements can be considerable to the pixel (for instance, research vessels, towers, lighthouse). It means that the structures can impact the value of one or more pixels in the extraction box, leading to inaccurate valid pixels (or no valid pixels at all). This has been shown by Concha et al. [38]. In this latter study, different match-up validation protocols have been tested for different ACs, and the results showed that the number of available match-ups was in a direct influence with the position of the measuring platforms. In our study, we studied the impact of shifting the extraction box from a few pixels in order to avoid these disturbances from the measurement structures. We evaluated extraction boxes that are shifted from the centered pixel by 2 pixels to the left, right, up, or down to check the effect on the match-ups analysis. We also look at removing only the central pixel with the box still centered. Figure 2 illustrates the different extraction boxes used for this analysis.

3. Atmospheric Correction

3.1. Basics of Atmospheric Correction

The signal measured by the satellite can be decomposed into several terms [7,8]:
ρt (λ) = ρr(λ) + ρa(λ) + ρra(λ) + T(λ)ρg + td(λ)ρwc(λ) + td(λ)ρw(λ)
where ρt(λ) is the top of atmosphere reflectance measured by satellite; ρr(λ) is the Rayleigh reflectance, ρa(λ) is the reflectance from multiple scattering by aerosols, ρra(λ) is the aerosol-molecular scattering, ρwc(λ) is the reflectance from whitecaps, ρg is the sun-glint reflectance and ρw(λ) is the water-leaving reflectance; td and T are diffuse and direct transmittance, respectively. The sun-glint, whitecaps, and gas absorptions corrections are pre-processed and then removed from ρtoa (λ). Then, the Rayleigh corrected reflectance (ρrc) is obtained:
ρrc(λ) = ρA(λ) + td(λ)ρw(λ)
where ρA(λ) = ρa (λ) + ρra(λ). In addition to the mentioned parameters, there is another factor that can influence the retrievals, which come from the proximity of land and scattering of surface-reflected radiance, is adjacency effect. However, the impact of the adjacency effect is low from around 10 km from the coasts [39,40,41]. Most of used in situ data were collected around this distance; thus, the adjacency effect is quite negligible. Therefore, the main purpose of atmospheric correction is to remove the multiple scattering aerosol contributions from the Rayleigh corrected reflectance. In our study, we considered that the adjacency effect was negligible.
In this study, we applied seven atmospheric correction algorithms to MSI/S2 images: Image correction for atmospheric effects (iCOR) [42,43]; Atmospheric correction for OLI ‘lite’, ACOLITE [12,27,44,45]; Case 2 Regional Coast Colour, C2RCC [19]; Sentinel 2 Correction, Sen2Cor [46]; Polynomial-based algorithm applied to MERIS, Polymer [26], the standard NASA atmospheric correction, NASA-AC [17], and the Ocean Color Simultaneous Marine and Aerosol Retrieval Tool, OC-SMART [20,47].

3.2. Description of the Algorithms

Image correction for atmospheric effects (iCOR) is a scene generic atmospheric correction that aims for land, coastal, inland, or transitional waters [42,43], and it has been tested over different coastal waters [48,49,50]. Furthermore, iCOR atmospheric correction processing can be divided into four steps [42]. First, all pixels with land and water values are identified and separated; then, the AOT values will be extracted from the soil pixels according to an improved version of the method developed by Guanter [51]; then, SIMEC is used to implement the adjacency correction approach for water pixels and fixed background land [43]; finally, the radiative transfer equation is solved. Regarding the reference data, iCOR uses the MODTRAN5 LUT to perform the atmospheric correction process mentioned above [52]. In this work, S2 images were processed by using default parameters with iCOR (v.0.3) through SNAP.
Atmospheric correction for OLI ‘lite’ (ACOLITE) is an atmospheric correction processor for coastal and inland waters, which was developed by the REMSEM group [12,27,44,45]. It operates atmospheric correction by using the “dark spectrum fitting” approach by default, but it can also be configured to use the exponential extrapolation [44]. In this research, the ACOLITE v.20211124 has been applied using the default approach without the negative mask for rhow (l2w_mask_negative_rhow=False) to check its performance.
C2RCC is a development of Case 2 Regional processor, which relies on a large database of ρw(λ) and related top-of-atmosphere radiances [19]. The inversion of the water leaving signal and the satellite signal is performed by artificial neural networks. A characterization of optically complex water through its inherent optical properties is used to parameterize radiative transfer models for the atmosphere over the water body [53]. For this work, the normal net version with typical ranges of IOPs has been used through the Sentinel Application Platform (SNAP v.8.0). All the satellite images have been processed with default parameters.
Sentinel 2 Correction (Sen2Cor) is an atmospheric correction algorithm developed by ESA specifically for Sentinel-2 Level 2A land product [46]. In general, the atmospheric correction algorithm assumes that the vegetation pixels in the satellite image have adequate darkness and that the ratio of the bottom-atmospheric reflectance between the wavelengths is constant, called dark dense vegetation (DDV) [46,54]. Accordingly, this algorithm will require the presence of vegetation, corresponding to the dark areas in satellite images. In case the input satellite image meets the above requirements, the algorithm will automatically extract the AOT data from the dark pixels and correct the image [52]. In this study, the satellite images were processed by Sen2Cor with default parameters.
Polynomial-based algorithm applied to MERIS (Polymer) is an atmospheric correction for oceanic water, specially designed for the high sun-glint condition [26]. It is based on spectral matching, which applies all the spectral bands to atmospheric and sun-glint correction. In detail, the atmospheric component of this algorithm is a polynomial function used to derive spectral reflectance of the atmosphere and sun glint. The satellite images herein were processed following default parameters in Polymer v.4.13.
SeaDAS-integrated NASA atmospheric correction algorithm applied in this study is based on the method presented by Bailey et al. [17] (NASA-AC). To calculate the value of remote sensing reflectance (Rrs), this algorithm applies a bio-optical model in the red and NIR bands. First, to be able to apply this model, an initial atmospheric correction with the black pixel assumption is needed for the calculation of chlorophyll-a concentration (Chl-a). Then, Chl-a is used to calculate the spectral particulate backscattering, which is then used to derive the remote sensing reflectance through an iterative scheme [17]. In this study, indicators for performing atmospheric correction were set as default.
OC-SMART algorithm focuses on analyzing data from ocean color satellites such as Landsat-8, Sentinel-2/3, SeaWiFS, MODIS-AQUA [20,47]. OC-SMART platform can provide remote sensing reflectance (Rrs) and Chlorophyll-a (Chl-a) based on a multilayer neural network (MLNN) method. A coupled ocean-atmospheric radiative transfer model has been used to calculate simultaneously Rrs and the Rayleigh radiance corrected at the top of the atmosphere and thereby being used to train a MLNN. The MLNN directly estimates Rrs from ρrc [47]. In this study, the integrated atmospheric correction algorithm in OC-SMART has been applied using default setting for assessment.

4. Statistical Parameters

Four statistical parameters have been calculated to assess the performance of each atmospheric correction algorithm: the correlation coefficient (R2), the Bias, and the relative error (RE):
Bias = 1 N   × i = 1 N R rs AC -   R rs ASD R rs ASD   ×   100
RE = 1 N   × i = 1 N R rs AC -   R rs ASD R rs ASD   ×   100
where N is the number of match-ups, R rs AC is the remote sensing reflectance retrieved by the atmospheric correction algorithms and   R rs ASD is the remote sensing reflectance from ASD in situ measurements.
Quality Assurance Score (QAS) [55], Chi-square mean (χ2) [56], and spectral angle mean (SAM) [57] were also calculated to assess the full spectrum of the retrieved Rrs. QAS gives quantification of the spectrum quality of Rrs retrievals with reference to a reference in situ dataset [55]. For the best performance, QAS value has to be close to one. SAM provides the difference between the in situ and the retrieved Rrs spectra, SAM value has to go towards 0° [57]. χ2 indicates relative error values of the full spectrum of Rrs retrievals and has to be null [56].
In this work, QAS, χ2, and SAM were calculated using 4 wavelengths: 443, 490, 560, and 665 nm, which are the closest to the QAS reference Rrs wavelengths. However, in χ2 case, the wavelength at 560 nm is excluded due to its use for error normalization.
χ 2 = 1 N   × i = 1 N j = 1 N X j AC i   -   X j ASD i 2 X j ASD ( i )
X j = R rs λ j R rs λ 560 nm
SAM = 1 N   × i = 1 N arccos   ( R rs ASD i , R rs AC i R rs ASD i × R rs AC ( i ) )
where j and i are the indexes of λ and spectrum between 443 and 665 excluding 560 nm, respectively. X is the normalized Rrs at 560 nm. ⟨RrsASD, RrsAC⟩ is the dot product of corresponding Rrs, and ∥ RrsASD ∥ × ∥ RrsAC ∥ is the Euclidean norm of RrsASD and RrsAC.

Scoring Scheme

Similar to QAS, χ2, and SAM, the total score (Stot) indicates AC performances over the full spectrum of Rrs [36,56]. Stot is calculated based on the scoring of the slope α and intercept β of the regression line, RE, Bias, and R2 for each algorithm. It is calculated on the variation between the minimum and maximum of those sixth statistical parameters, as shown in the following equations:
S α ( λ j ) S α ( λ j ) = | 1 - α AC ( λ j ) | - max ( | 1 - α ( λ j ) | ) min ( | 1 - α ( λ j ) | ) - max ( | 1 - α ( λ j ) | )
S β ( λ j ) = β AC ( λ j ) | - max ( | β ( λ j ) | ) min ( | β ( λ j ) | ) - max ( | β ( λ j ) | )
S Bias λ j = Bias AC λ j - max Bias λ j min Bias λ j - max Bias λ j
S RE ( λ j ) = RE AC λ j - max RE λ j min RE λ j - max RE λ j
S R 2 λ j = R AC 2 λ j - min R 2 λ j max R 2 λ j - min R 2 λ j
S tot = S . α + S β + S Bias + S RE + S R 2
Four wavelengths were considered for five statistical parameters, which lead to a maximum Stot value of 20.

5. Results

5.1. Number of Potential Match-Ups

Table 3 shows the number of in situ measurements, days, and available match-ups. A majority of the field measurements are from French Guiana. However, these data were mainly for the aim of research for Sentinel-3 satellite [36], which led to a significant decrease in the potential number of match-ups for Sentinel-2.
For the assessment, seven different ACs were applied to the Sentinel-2 satellite images for the evaluation of their performances. Accordingly, the match-up dataset is divided into two categories: individual match-ups and common match-ups. The common match-up in this study aims to focus on evaluating the efficiencies of the correction algorithms under the condition of the same number of output data. This condition helps to assess, more uniformly, the ability to extract remote sensing reflectance from TOA signal between ACs. Meanwhile, individual match-up provides a more comprehensive view. Besides the performance of ACs, the individual match-up can also help to determine which ACs are better at handling atmospheric influences and the overall performances of 7 ACs help to evaluate their ability to remove invalid pixels. Thus, in this section, the match-up results will be divided for these 2 cases.

5.2. All Match-Ups: Individual Performance

After selecting the appropriate match-ups based on the protocol mentioned in Section 2.3, the total amount of valid data for each atmospheric correction algorithm is shown in Table 4.
The number of valid match-ups varies between the ACs and between wavelengths for a given ACs. NASA-AC is the AC that provided the least number of match-ups (9 at 665 nm) while Sen2Cor, Polymer, OC-SMART, and iCOR are the AC providing the highest number of match-ups (between 21 and 22 depending on the wavelength).
Figure 3 shows the comparison between the estimated Rrs from atmospheric correction algorithms and the Rrs from in situ measurements for MSI bands from 443 nm to 665 nm. The accuracy of the AC is wavelength-dependent. For wavelengths at 443 nm and 490 nm, the retrieved Rrs from all ACs are mostly under-estimated except for ACOLITE and iCOR. For higher wavelengths the scattering around the 1:1 line decreases with increasing wavelength, leading to better performances of the atmospheric correction algorithms. Those results agree with the work of Pahlevan et al. [10].
Figure 4 and Table 5 indicate the variation in the statistical parameters (RE, Bias, and R2) for all ACs with MSI bands from 443 nm to 665 nm. Similar to the scatter plots, the value of R2 in the blue ranges from about 0.28 to 0.57 for all AC except for OC-SMART with a value of 0.69 (Table 5). The value of R2 increases with wavelength and reaches 0.61 to 0.94 in the red region for all AC. Thus, the correlation between the in situ and estimated Rrs is relatively high in the red band, showing better estimates compared to those in the blue band. Regarding the error-related statistical parameters, in general, the output of the algorithms has relatively high errors in the blue and red bands. The relative error forms the standard U-shape [15,16] for most ACs. In contrast, the errors are significantly lower at 560 nm compared to the blue band and red band.
In general, the seven ACs can be categorized into two groups depending on their performances: (1) NASA-AC, C2RCC, Polymer, ACOLITE, and OC-SMART with small scattering at higher wavelengths and low biases (especially OC-SMART); (2) Sen2Cor and iCOR showing lower performances compared to the first group, with higher scattering around the 1:1 line and lower performances in term of statistical results (Figure 4 and Table 5 and Table 6).
The first group includes NASA-AC, C2RCC, Polymer, ACOLITE, and OC-SMART. In this group, OC-SMART shows the best performances compared to the other algorithms. For instance, R2 varies between 0.69 at band 443 nm and 0.92 at band 665 nm, and it shows the lowest values in terms of RE. For the other ACs of this group, C2RCC, NASA-AC, Polymer, and ACOLITE present acceptable values of R2 across all visible bands. R2 values for Polymer vary between 0.57 at band 443 nm and 0.92 at band 665 nm. The values for C2RCC, NASA-AC, and ACOLITE are a bit lower, from 0.4 at band 443 nm to nearly 0.88 at band 665 nm for C2RCC, from 0.28 at band 443 nm to 0.94 at band 665 nm for NASA-AC and from 0.55 at band 443 nm to 0.74 at band 665 nm for ACOLITE. Regarding the other statistical parameters, Polymer, C2RCC, and NASA-AC show quite similar values. Meanwhile, ACOLITE shows relatively low performances in the red band. This can be seen in the RE value of ACOLITE, which is 88.04%, almost 2 times higher compared to other ACs in this group. Regarding the RE value, the statistical results have shown that the ACs have superior performances with the smallest RE value in the 560 nm band, this applies to all evaluated algorithms. For the Bias value, Polymer, NASA-AC, and OC-SMART showed the highest value in the 665 nm band. Meanwhile, ACOLITE gives the largest Bias value at 443 nm. This is similar to what was presented by Pahlevan et al. [10] for both RE and Bias. Specifically, Pahlevan et al. showed that the value of retrieval errors showed a limited performance of ACs in the blue band, and this performance reached the highest at band 560 nm for the AERONET-OC match-ups. For the Bias value, Pahlevan et al. also concluded that ACOLITE returns the minimum Bias value between 490 and 664 nm, in contrast, NASA-AC shows the smallest Bias value between 443 and 560 nm, and overall, there are no consistent positive and negative trends for Bias value across the ACs.
The second group includes iCOR and Sen2Cor. For this group, both Acs show lower statistical results compared to the first group. All parameters values such as relative error, and bias are substantially higher for this group. For the relative error, iCOR and Sen2Cor showed significantly higher values than the algorithms in group 1. This difference in RE value can be seen in blue bands with RE values 3 to 4 times higher than the Acs of group 1. The same trend can be seen for the Bias value. Accordingly, the Bias value of iCOR and Sen2Cor ranges from 43.06% at 560 nm to 112.94% at 665 nm and 47.22% at 560 nm to 118.57% at 443 nm, respectively, while the Bias value of the algorithms of group 1 ranges only from −10% to 30% except for ACOLITE. The difference in the values of the statistical parameters between group 1 and group 2 was most evident in the Bias value of iCOR at band 665 nm and Sen2Cor at band 443 nm, which are 112.94% and 118.57%, respectively. This value is 5 to 6 times higher than Bias value of group 1. Besides, the lower performances of ACs in group 2 are also clearly shown through the value of R2, which is only 0.36 for Sen2Cor at 443 nm.
Table 6 gives the values of QAS, χ2, SAM, and Stot for each atmospheric correction algorithms. C2RCC and NASA-AC show the highest value of QAS (1.00 and 0.94, respectively), while Sen2Cor has the lowest value (0.58). For χ2, NASA-AC and OC-SMART have yielded the lowest value of 0.04, while iCOR shows the highest value (0.38). For SAM, NASA-AC and OC-SMART show the lowest values which are 4.99 and 4.44, respectively. On the opposite, Sen2Cor shows the highest value (9.66). The SAM value needs to be as low as possible to get estimated spectra as similar as possible as in situ spectra. For Stot, OC-SMART is the atmospheric correction with the highest value, 16.89 over 20, Polymer has the second-highest value of Stot (14.90). The atmospheric correction with the lowest Stot value (2.01) is Sen2Cor.

5.3. Common Match-Ups: Performance Inter-Comparison

In this section, we compare the ACs on the same match-ups dataset. The number of common match-ups decreases considerably compared to the case of individual match-ups with the number of match-ups varying between 7 at 665 nm and 16 at 560 nm, as shown in Table 7. This is due to the number of overall match-ups from NASA-AC (Table 4). Figure 5 and Figure 6 are similar to Figure 3 and Figure 4 but for the common match-ups. Figure 5 shows the comparison between the in situ Rrs value and the ACs estimated Rrs. As for the case of individual match-ups, the accuracy of the ACs increases with increasing wavelength. At 443 nm, most of the ACs provide under-estimation of Rrs (except ACOLITE), and this under-estimation tends to decrease with increasing wavelength. The scattering around the 1:1 line is the smallest at 665 nm.
Figure 6 shows the variation in the statistical parameters (RE, Bias, R2) with the wavelength on the common match-ups dataset. Overall, the values of the statistical parameters, in this case, show lower performances for all ACs of the first group, and higher performances for the second group compared to the all match-ups case. This can be seen through the evaluation of the correlation between the in situ Rrs and AC estimates. For the first group, R2 values increase from 443 to 665 nm, but are lower than the case of individual match-ups dataset, especially at 443 nm and 490 nm, except for NASA-AC and C2RCC. In detail, R2 value at the blue band (443 nm) for Polymer, ACOLITE, and OC-SMART decreased from 0.57 to 0.41, 0.55 to 0.45, and 0.69 to 0.46, respectively. The other statistical results show also lower performances. For instance, RE and Bias values of ACOLITE at band 665 nm increase from 89.29% to 109.63% and from 41.2% to 104.82%, respectively. The Bias values show the same trend, but its values significantly increase at band 560 nm and 665 nm for the ACs of the first group. In contrast, the RE and Bias values on the common match-ups dataset decrease substantially for the ACs of the second group, especially at band 665 nm.
In terms of spectra shapes, QAS values increased considerably for all ACs, except for OC-SMART. This is especially true for iCOR, which QAS increased from 0.65 to 0.89. The same improvement in the shape can be observed for the other ACs, with a decrease in SAM values from 9.59 to 6.7, 7.07 to 5.44, 9.35 to 4.95, 4.99 to 4.73 for Sen2Cor, ACOLITE, iCOR, and NASA-AC, respectively. For χ2, the value decreases for all ACs of group 2 and ACOLITE. The most substantial change in χ2 is the case of iCOR, where the value decreases from 0.375 to 0.046. Overall, with the exception of Polymer, iCOR, OC-SMART, and ACOLITE, the performance of the ACs tend to improve with respect to Stot value. iCOR shows the highest decrease in Stot from 7.7 to 3.37 and NASA-AC shows the highest increase in Stot from 14.36 to 17.13 (Table 6 and Table 8).

5.4. Sensitivity to the Position of 3-by-3 Pixels Box

As mentioned in Section 2.4, the existence of research vessels, towers, and lighthouses at sea can cause interferences in the match-ups exercise, directly affecting the statistical results of the AC processing. Therefore, to address this issue, we studied the impact of shifting the 3-by-3 pixels box from the in situ measurements. The results presented in the previous sub-sections were estimated using a 3-by-3 pixel box centered on the in situ measurements, which is the standard protocol for classic ocean color images [37]. Herein, we shift the center from the location of the in situ measurements and we calculated the statistics for five different positions for each AC.
Figure 7 illustrates the differences in the statistical parameters for two cases: (1) the extraction box is shifted to the right of the in situ measurement by two pixels; (2) the extraction box is shifted downward of the in situ measurements by two pixels. The statistical results show that the location of the 3-by-3 pixels box does not change much the statistical parameters, except for NASA-AC and Sen2Cor. For NASA-AC, in the case when the box is shifted to the right by two pixels, the Bias value increases steadily at 443, 490, and 560 nm bands by about 2–4.7%, especially for the Bias value at 665 nm, which increased by 10,3%. Meanwhile, in the case when the box is shifted downward by two pixels, the Bias value increases steadily at 490, 560, and 665 nm bands by about 3.8–5%, and its value increases the most at band 443 nm by 8%. Accordingly, the correlation between in situ Rrs and NASA-AC estimates also substantially decreases—the strongest decrease being at 443 nm from 0.40 to 0.28 for the case when the box is shifted downward by two pixels, and from 0.54 to 0.40 at band 490 nm for the case when the box is shifted downward by two pixels. For Sen2Cor, the Bias value highly increases at 665 nm by around 40% for both cases. However, unlike NASA-AC, the correlation between the in situ Rrs and the Sen2Cor AC estimates increases considerably, with values of R2 increasing on average by 0.015 for the right-shifted case and by 0.03 for the down-shifted case for wavelengths from 443 nm to 560 nm, and decreases by 0.075–0.088 at 665 nm band for both cases.
For other cases of pixel extraction, as shown in Figure 7, the statistical parameters show no significant changes or stable trends.
Table A1 shows the statistical indicators on the shape of the estimated Rrs spectra depending on the position of the 3-by-3 pixels box. Except for the right-shifted and down-shifted cases, the statistics for the other positions of the box do not change much compared to the standard position (centered of the in situ measurement). For the right-shifted case, the combined results of nearly all algorithms are slightly improved: Stot of iCOR, ACOLITE, C2RCC, Polymer, and OC-SMART increase from 7.70 to 8.25, 14.52 to 14.75, 13.31 to 13.89, 14.90 to 15.58 and 16.89 to 17.20, respectively. By contrast, Sen2Cor and NASA-AC show a decreased performance and have lower Stot values, from 2.01 to 1.25 and 14.36 to 13.28, respectively. Similarly, the down-shifted case also shows an improvement in the performances for iCOR, ACOLITE, C2RCC, Polymer, and OC-SMART with Stot value increasing from 7.70 to 7.73, 14.52 to 15, 13.31 to 14.29, 14.9 to 15.30, and 16.89 to 17.06, respectively. No improvements are observed for NASA-AC and Sen2Cor for this given case. On our limited dataset, the shift of the 3-by-3 pixels box does not seem to impact the accuracy of the AC retrievals. This might be due to the homogeneity of the seawaters during the collection of the in situ Rrs measurements. For the case of the box with no center pixel, the statistical parameters show no significant improvements for five AC out of seven. For the other two cases, the left-shifted and down-shifted cases, the statistics show improvements for only two AC out of seven. For the left-shifted case, only iCOR and OC-SMART show improvement in performance with Stot value increasing from 7.7 to 7.8 and 16.89 to 17.03, respectively. The Stot value of ACOLITE, C2RCC, Polymer, and NASA-AC slightly decreased from 14.52 to 14.10, 13.31 to 12.81, 14.90 to 14.74, and 14.36 to 13.83, respectively. For the up-shifted case, only iCOR and NASA-AC show a slight increase in Stot value, from 7.7 to 7.83 and 14.36 to 15.42, respectively.

6. Discussion

6.1. Comparison of the First Group of AC: OC-SMART, NASA-AC, Polymer, ACOLITE and C2RCC

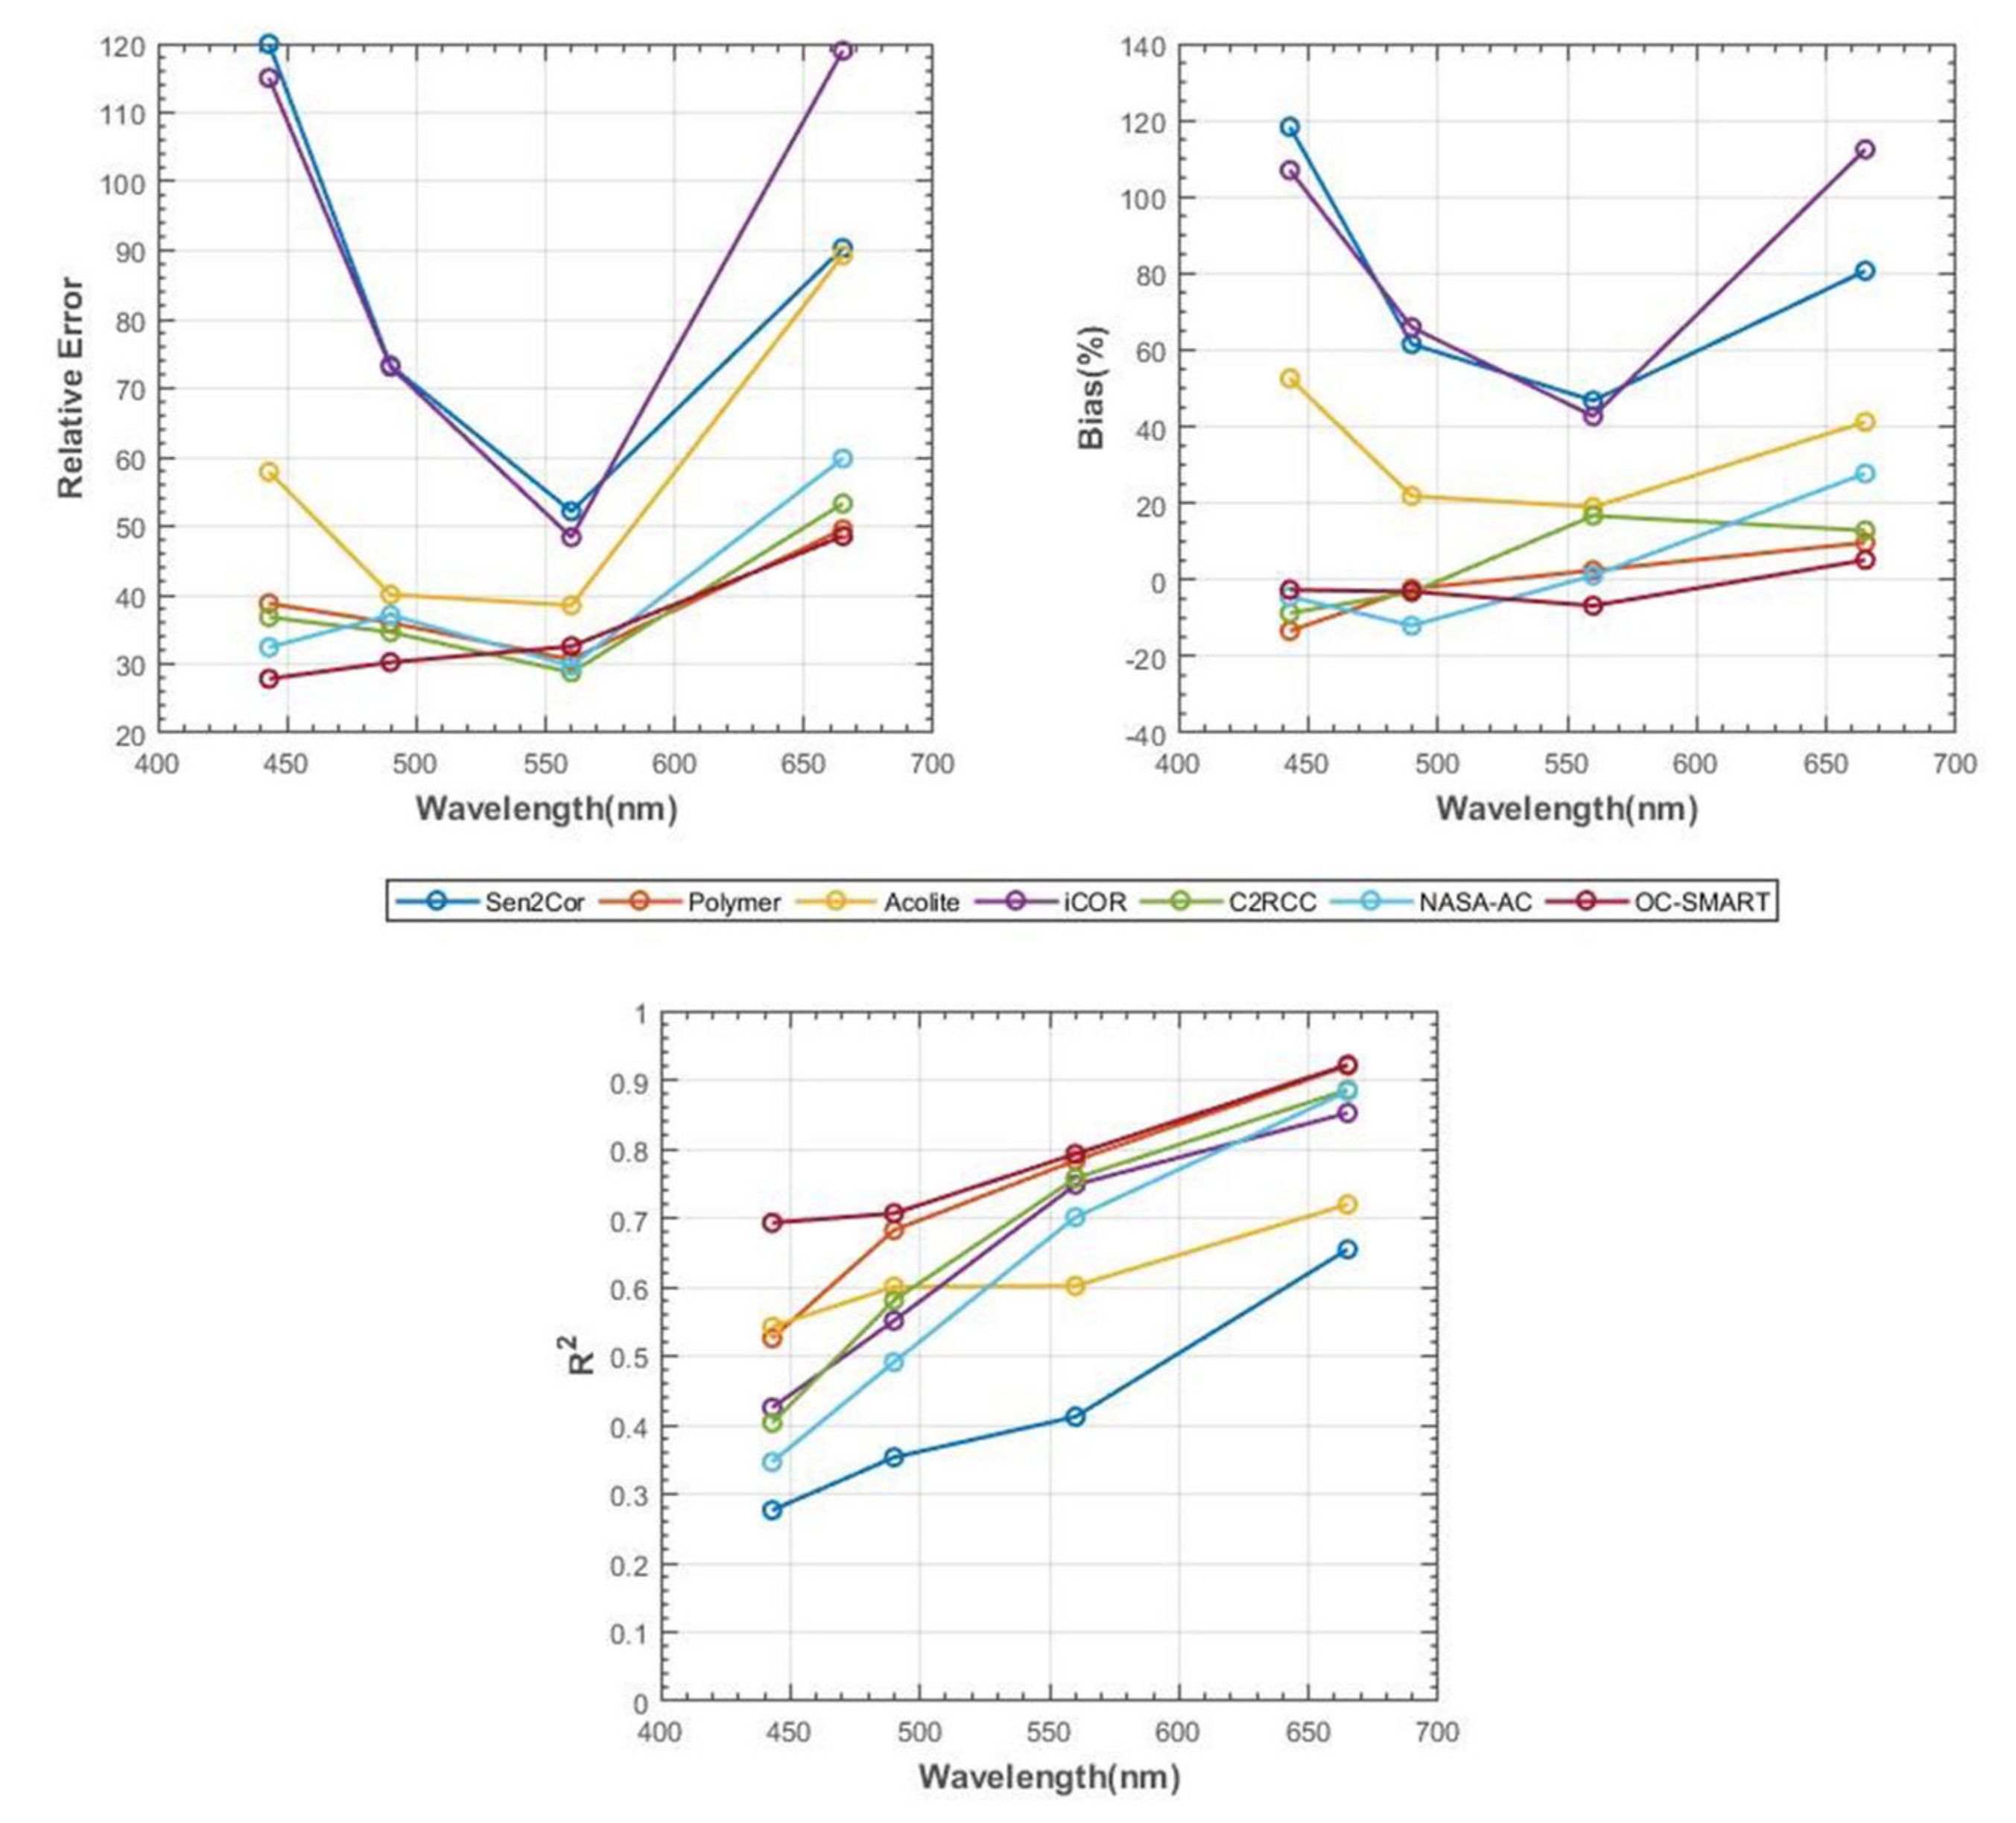
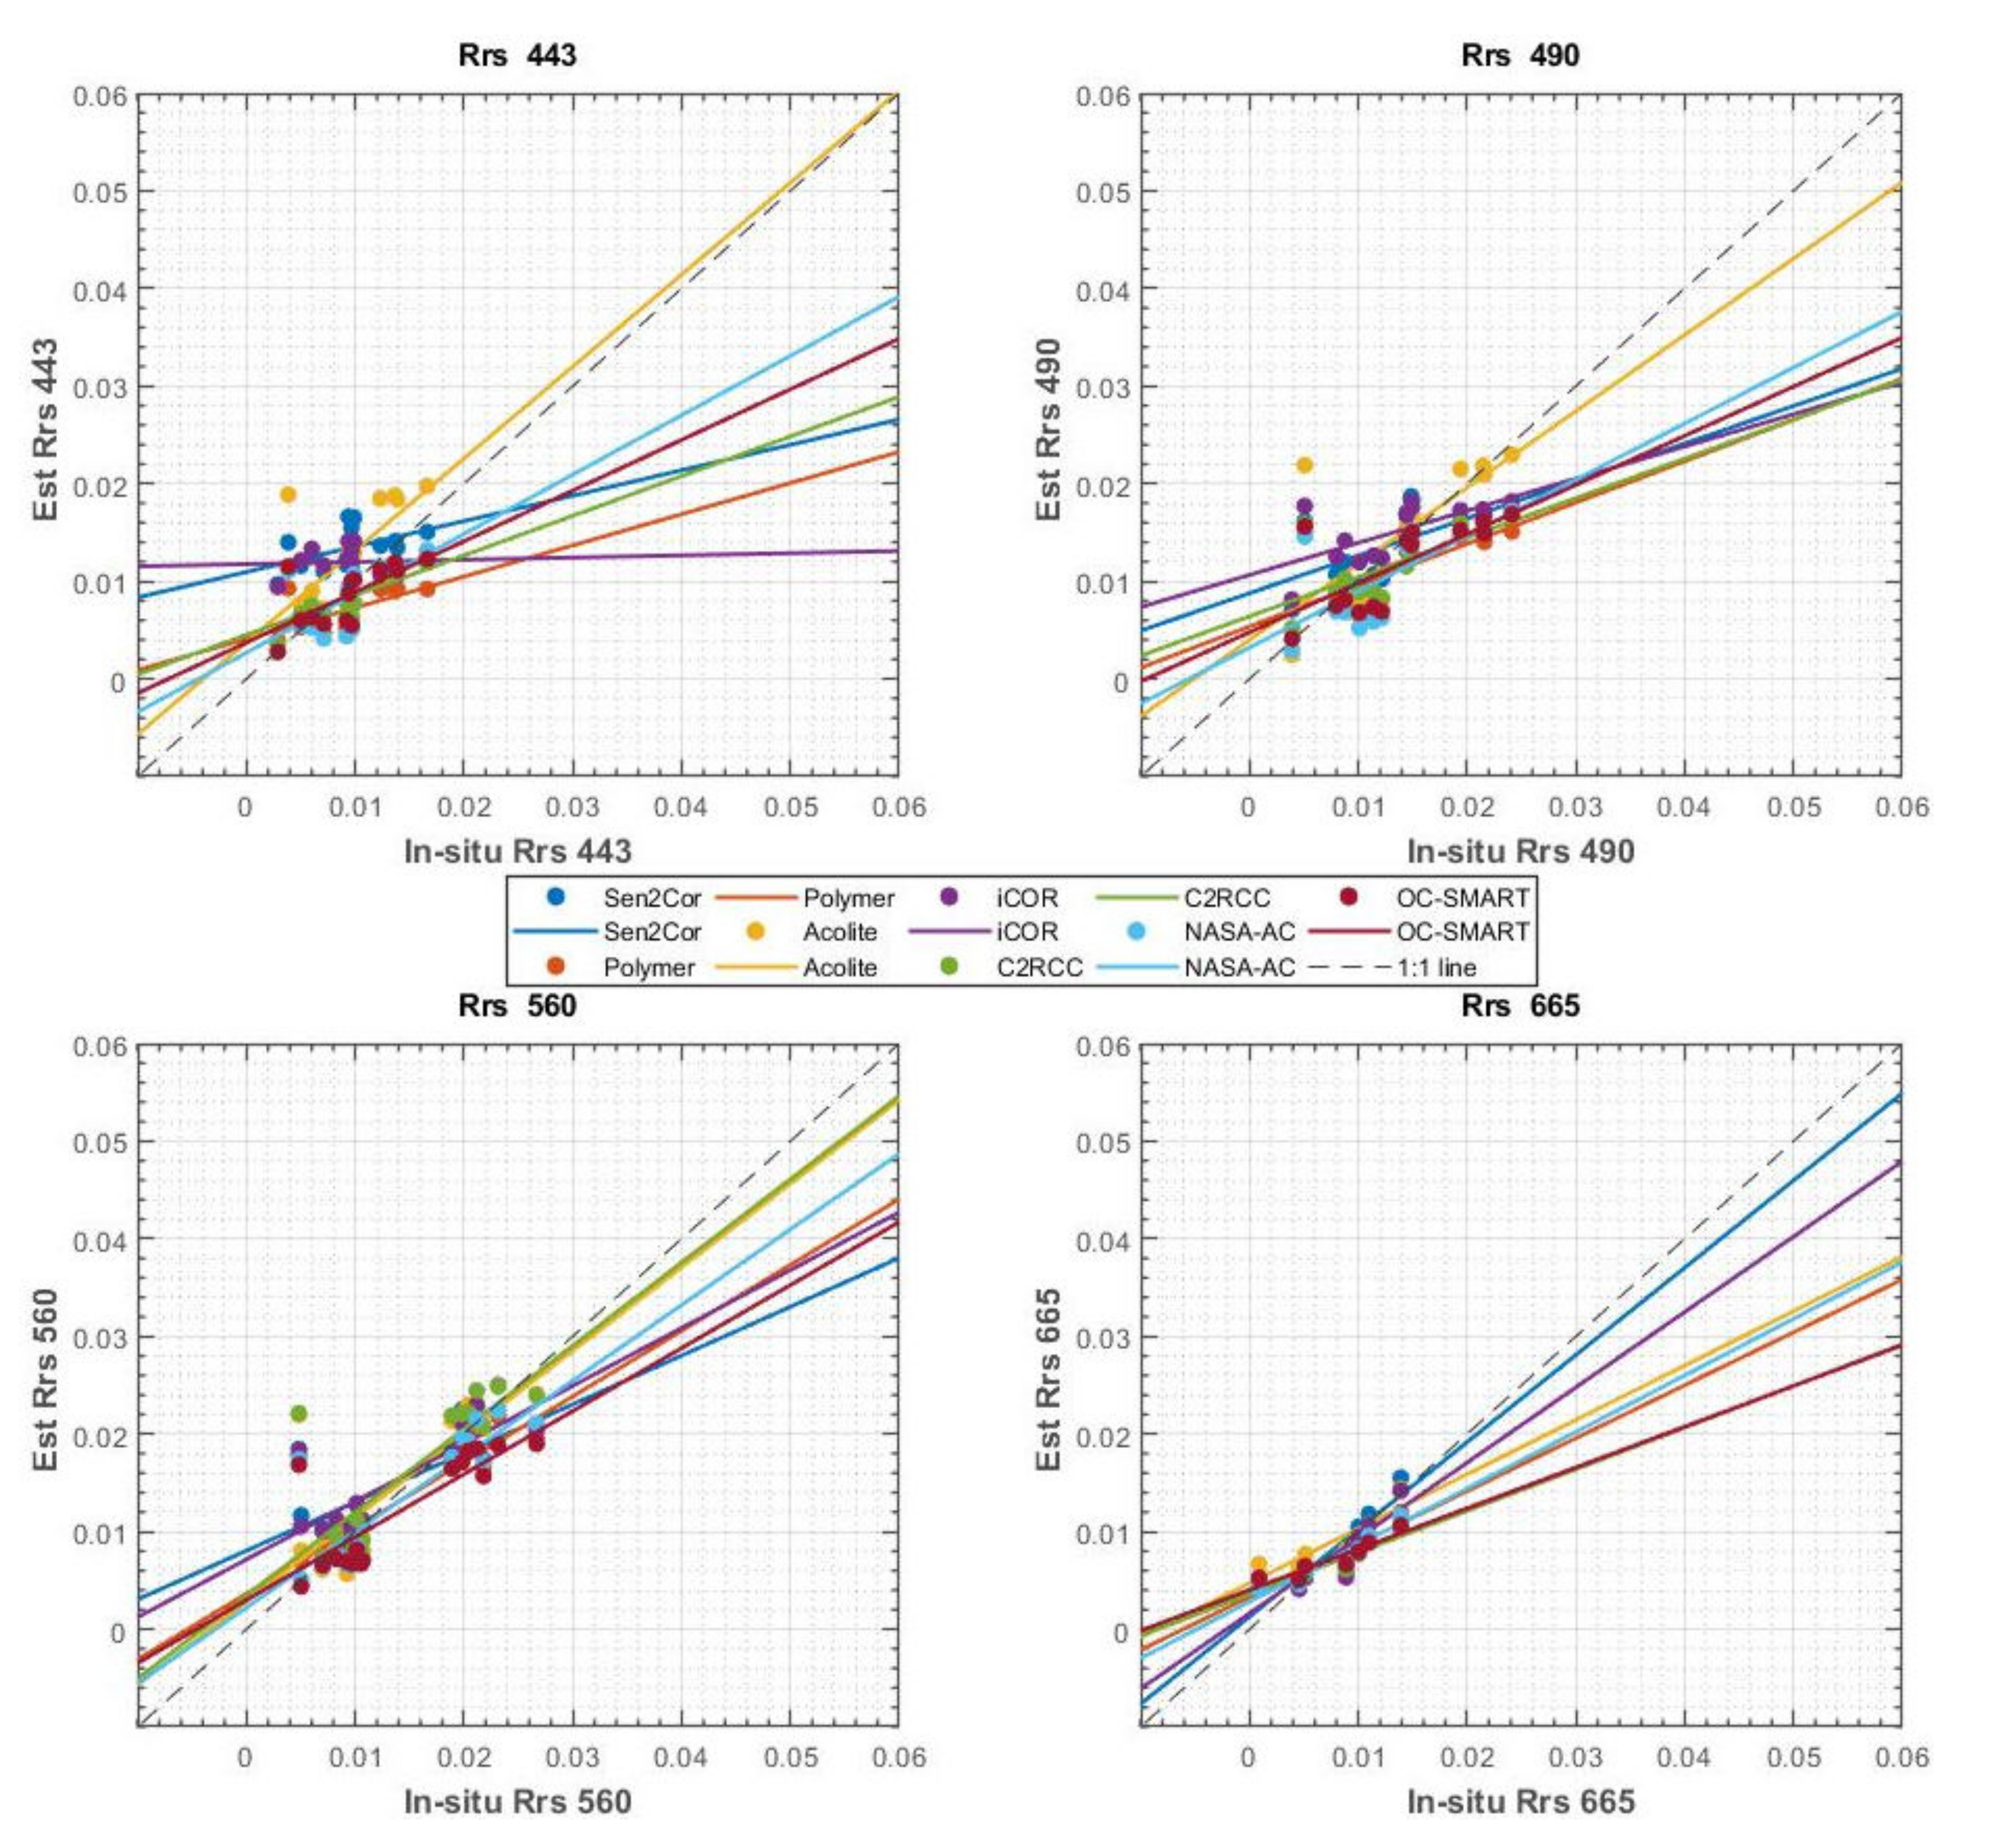
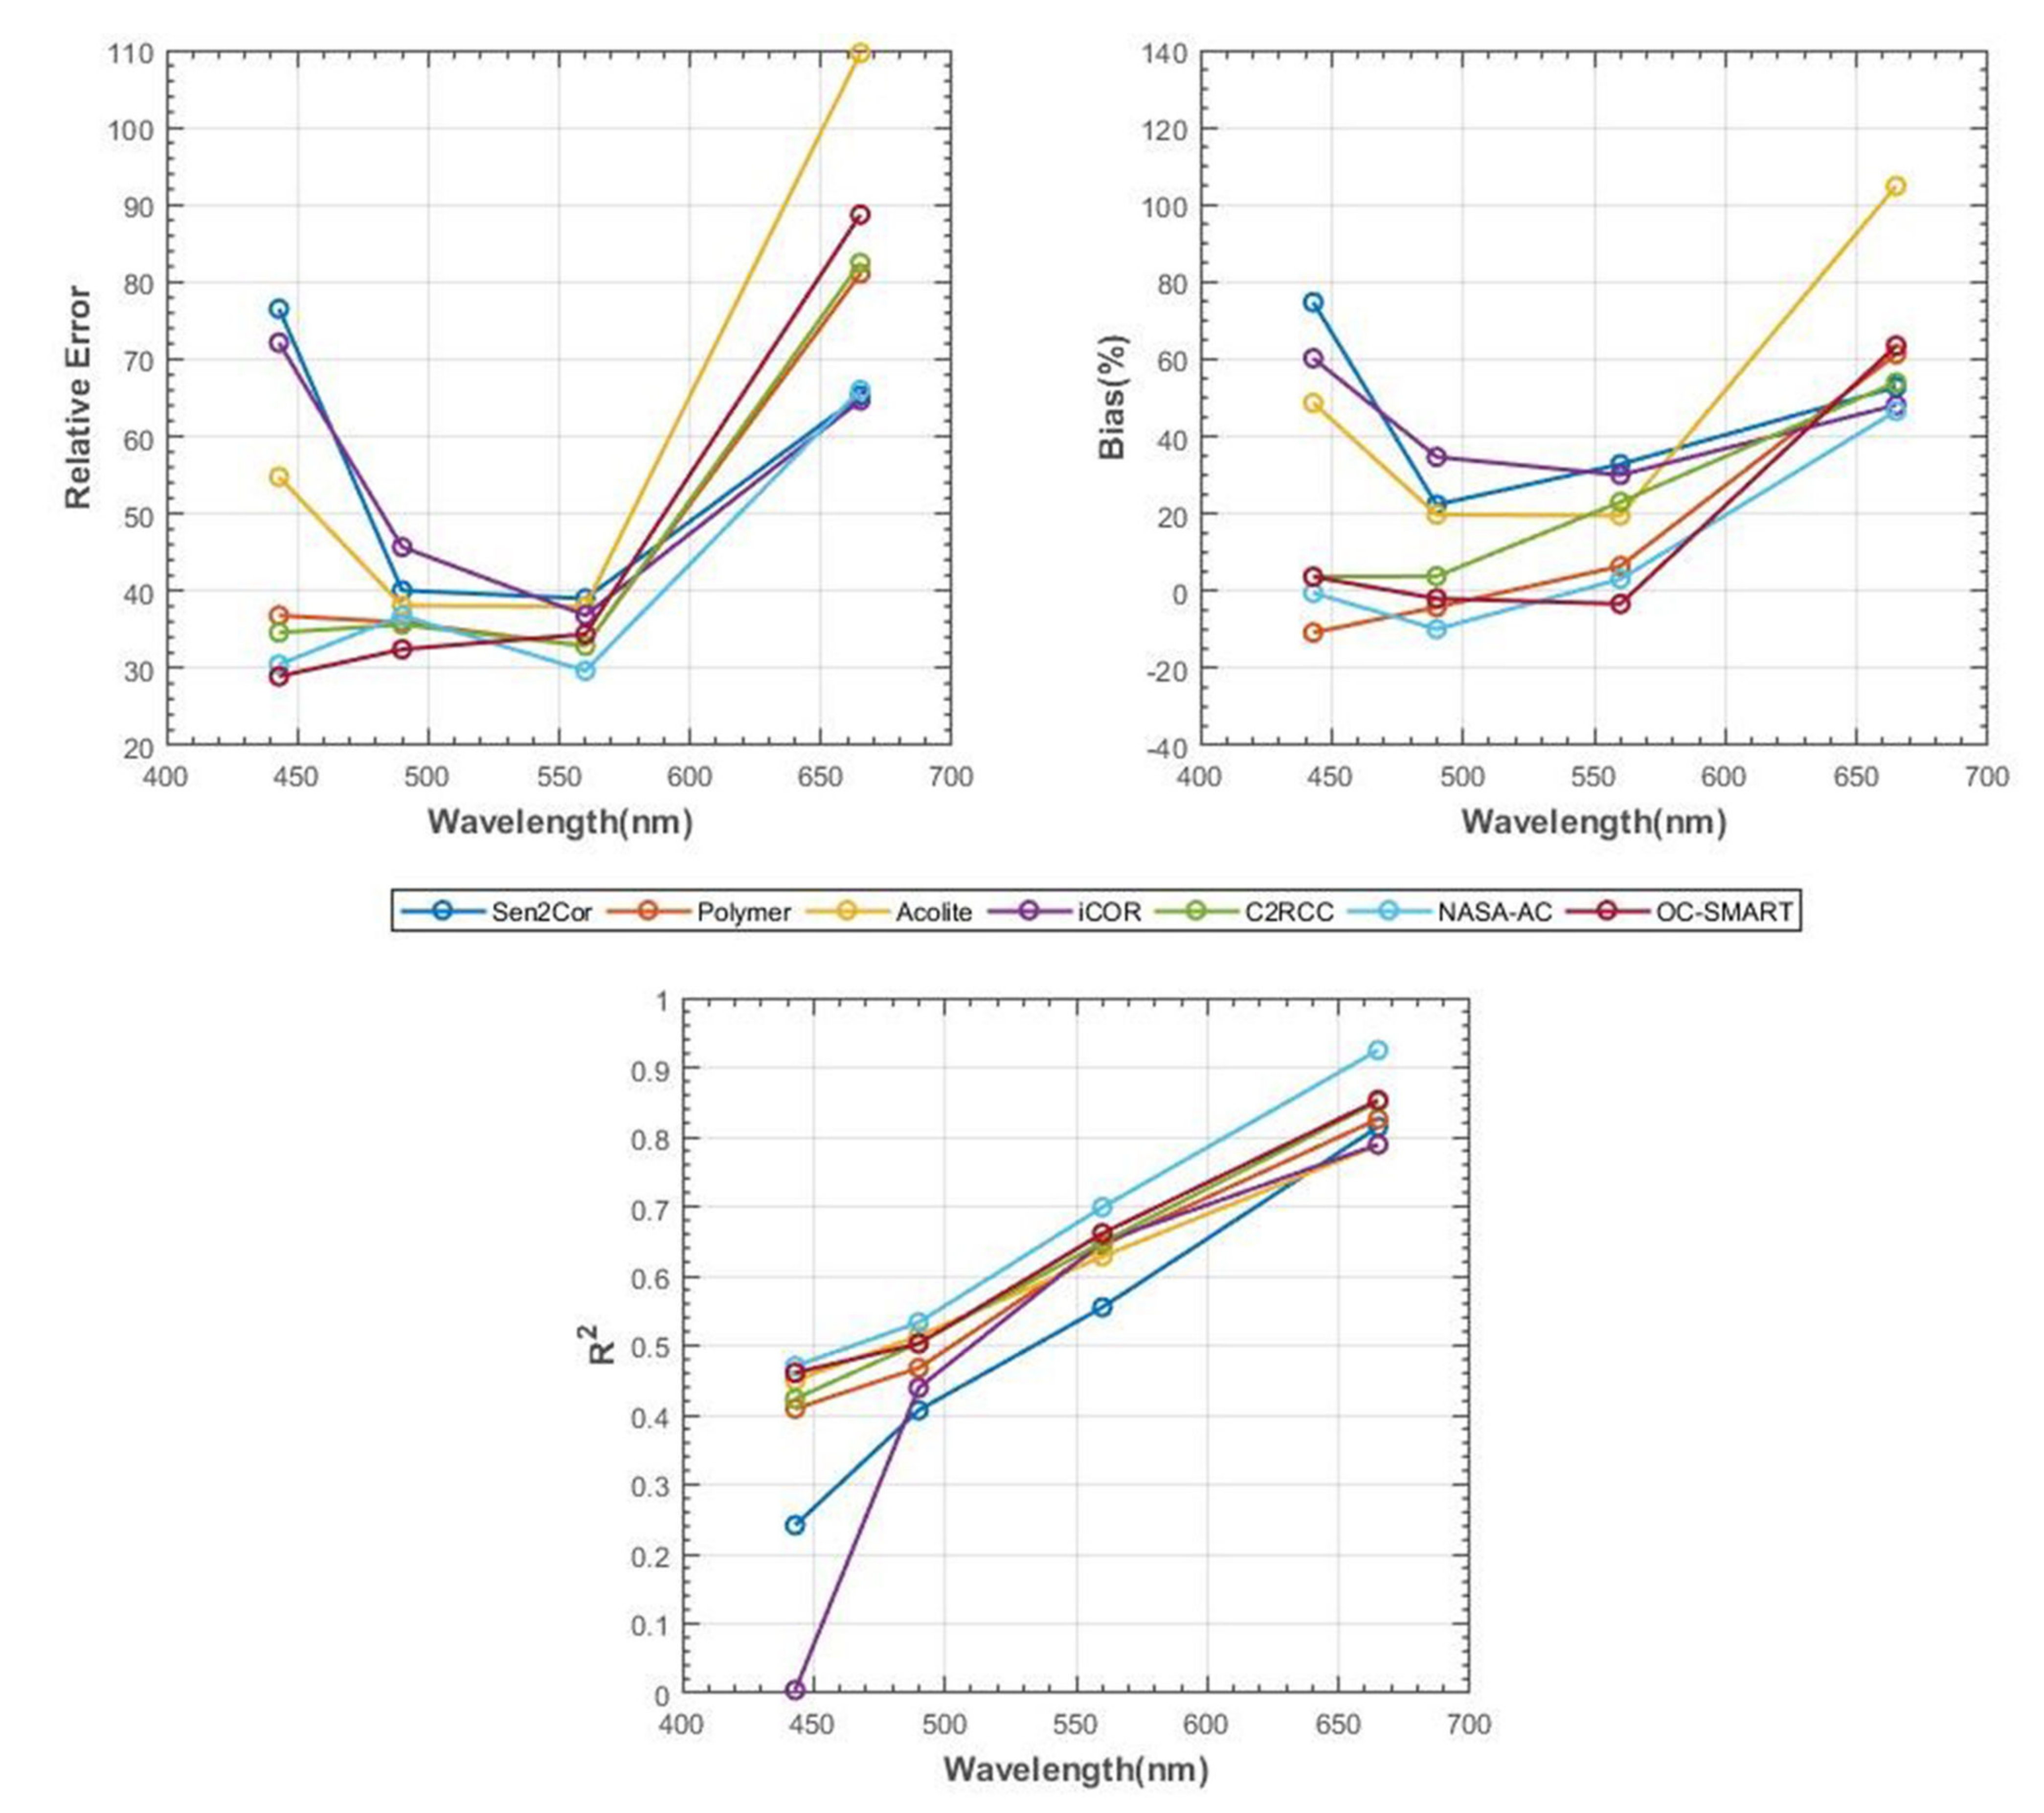
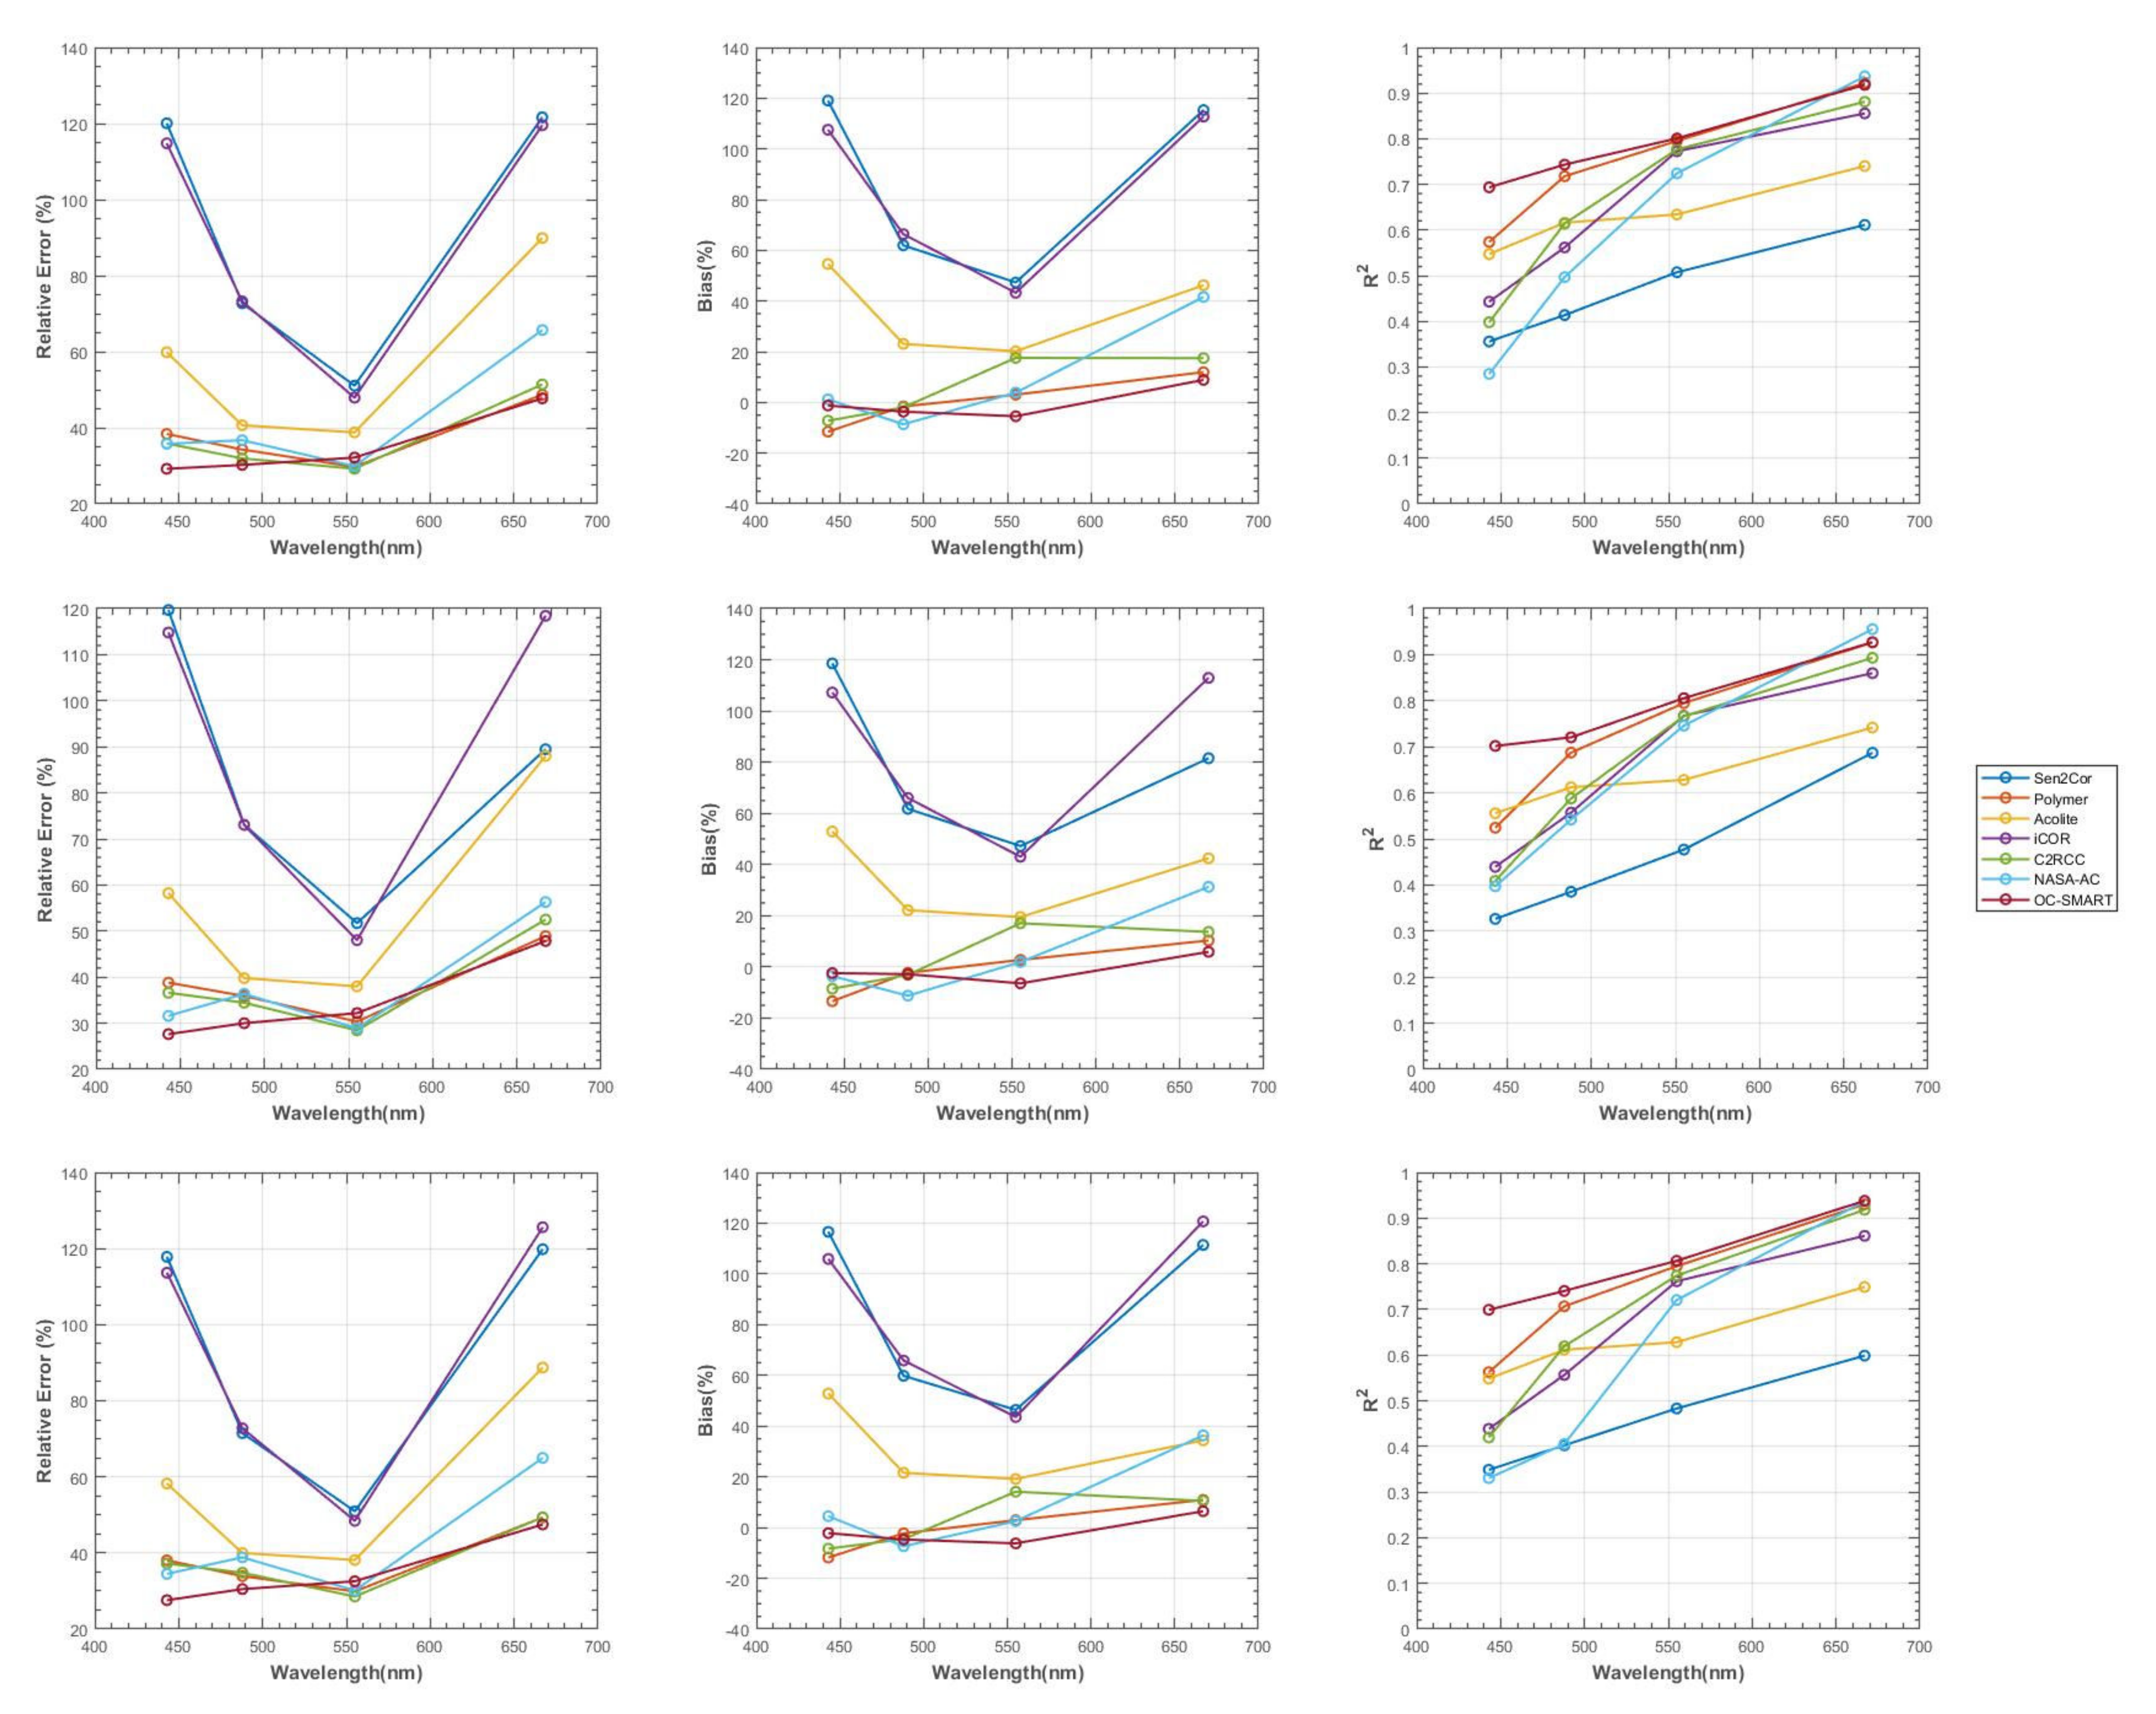
OC-SMART shows the overall best performances on our in situ dataset. For the case of individual match-ups datasets, OC-SMART yields the lowest errors and bias at two bands 443 nm and 665 nm. R2 also shows the higher values across all the bands with values ranging between 0.69 at 433 nm and 0.92 at 665 nm for the case of individual match-ups, and between 0.46 at 443 nm and 0.85 at 665 nm for the common match-ups case. The scatterplots for OC-SMART also show a satisfactory adjustment to the 1:1 line with low scattering for all wavelengths. These results show that the estimated Rrs from OC-SMART is highly accurate compared to the in situ measurement data. For the scoring scheme, OC-SMART provides the highest Stot result, which is 16.89/20 for the individual, and the second-highest Stot value (14.76) for the common match-ups dataset.
NASA-AC shows good performances as demonstrated by the statistical parameters and the scoring scheme on the common match-ups dataset. Accordingly, for the individual match-up case, the estimated Rrs show a good correlation with the in situ data with R2 values ranging from 0.28 at 443 nm to more than 0.92 at 665 nm. The error and Bias values are also relatively low, which ranges from 31.6% at 443 nm to 56.3% at 665 nm and −3.59% at 443 nm to 31.30% at 665 nm, respectively. These values are 12% to 15% higher than OC-SMART. Especially, NASA-AC yields the highest Stot value (17.13) for the common match-up case. NASA-AC provides good estimations of the spectra of Rrs, as shown in the values of SAM, QAS, and χ
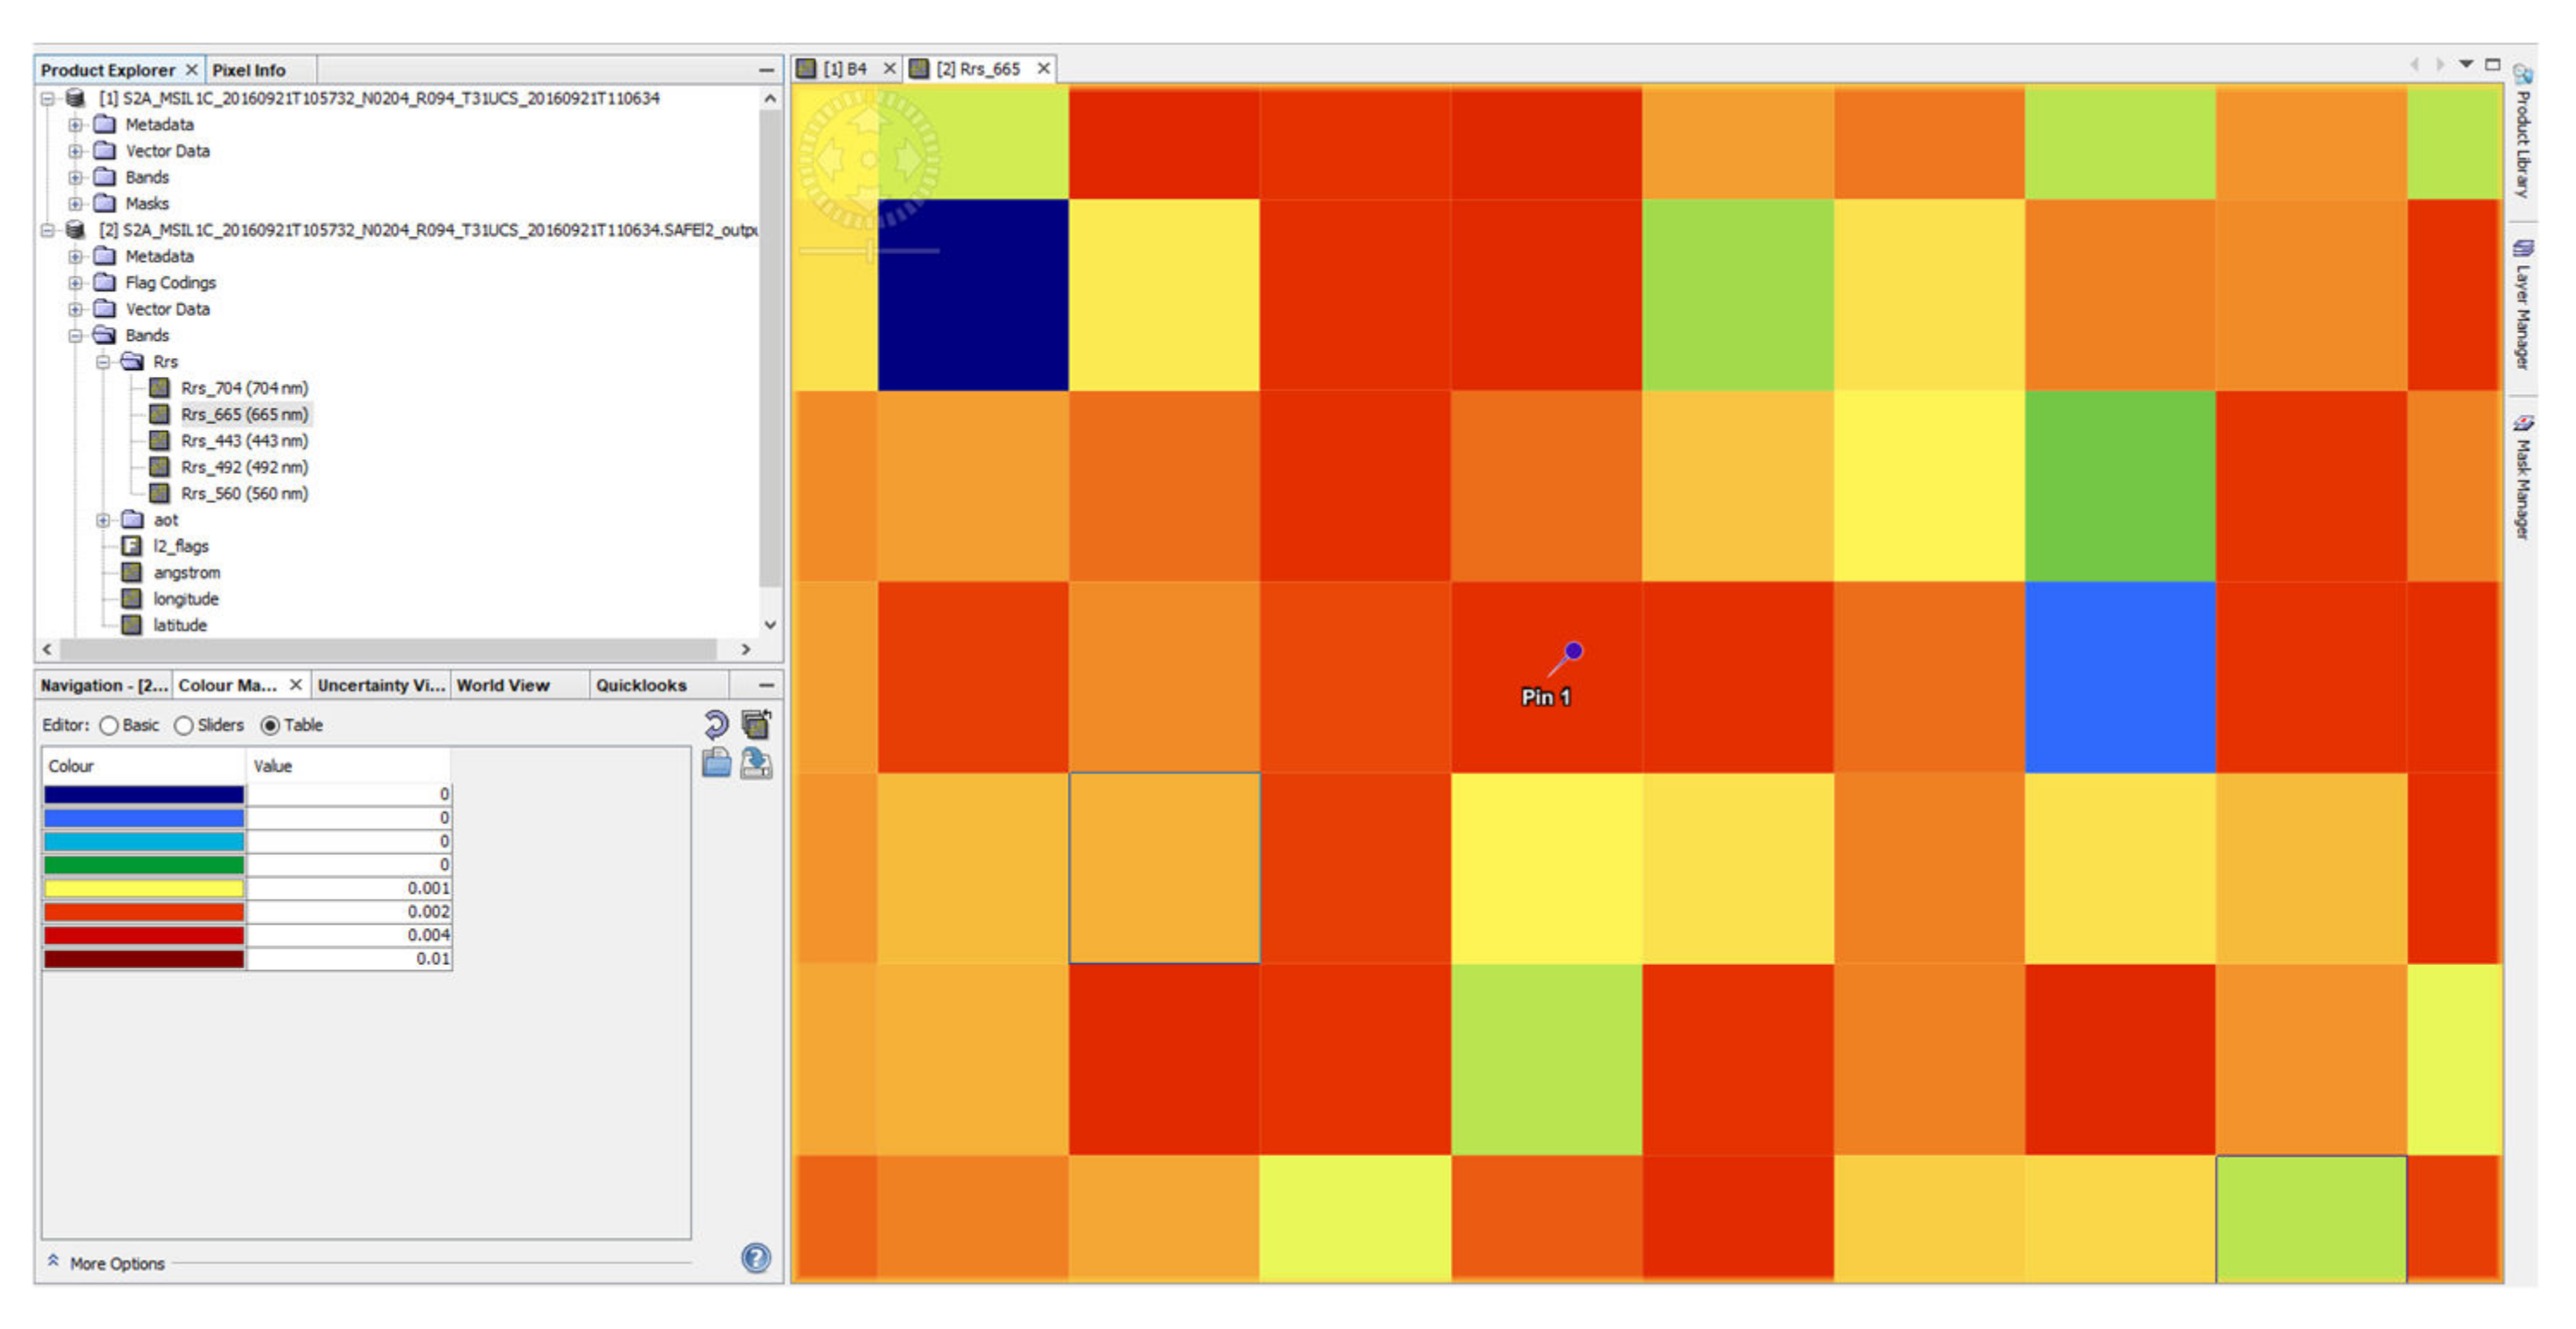
2. Overall, however, NASA-AC has a tradeoff that can be seen in the individual case. Despite the high efficiency in atmospheric correction, the ability to mask pixels with atmospheric noise components is still not good. This can be seen in the number of match-ups shown in Table 4. Accordingly, the number of valid match-ups after processing by NASA-AC is the lowest, and it is strongly reduced for high wavelengths (band 665 nm only has 9 valid match-ups in the individual match-up case). This result is similar to what was mentioned by Ilori et al. [58] and by Pahlevan et al. [
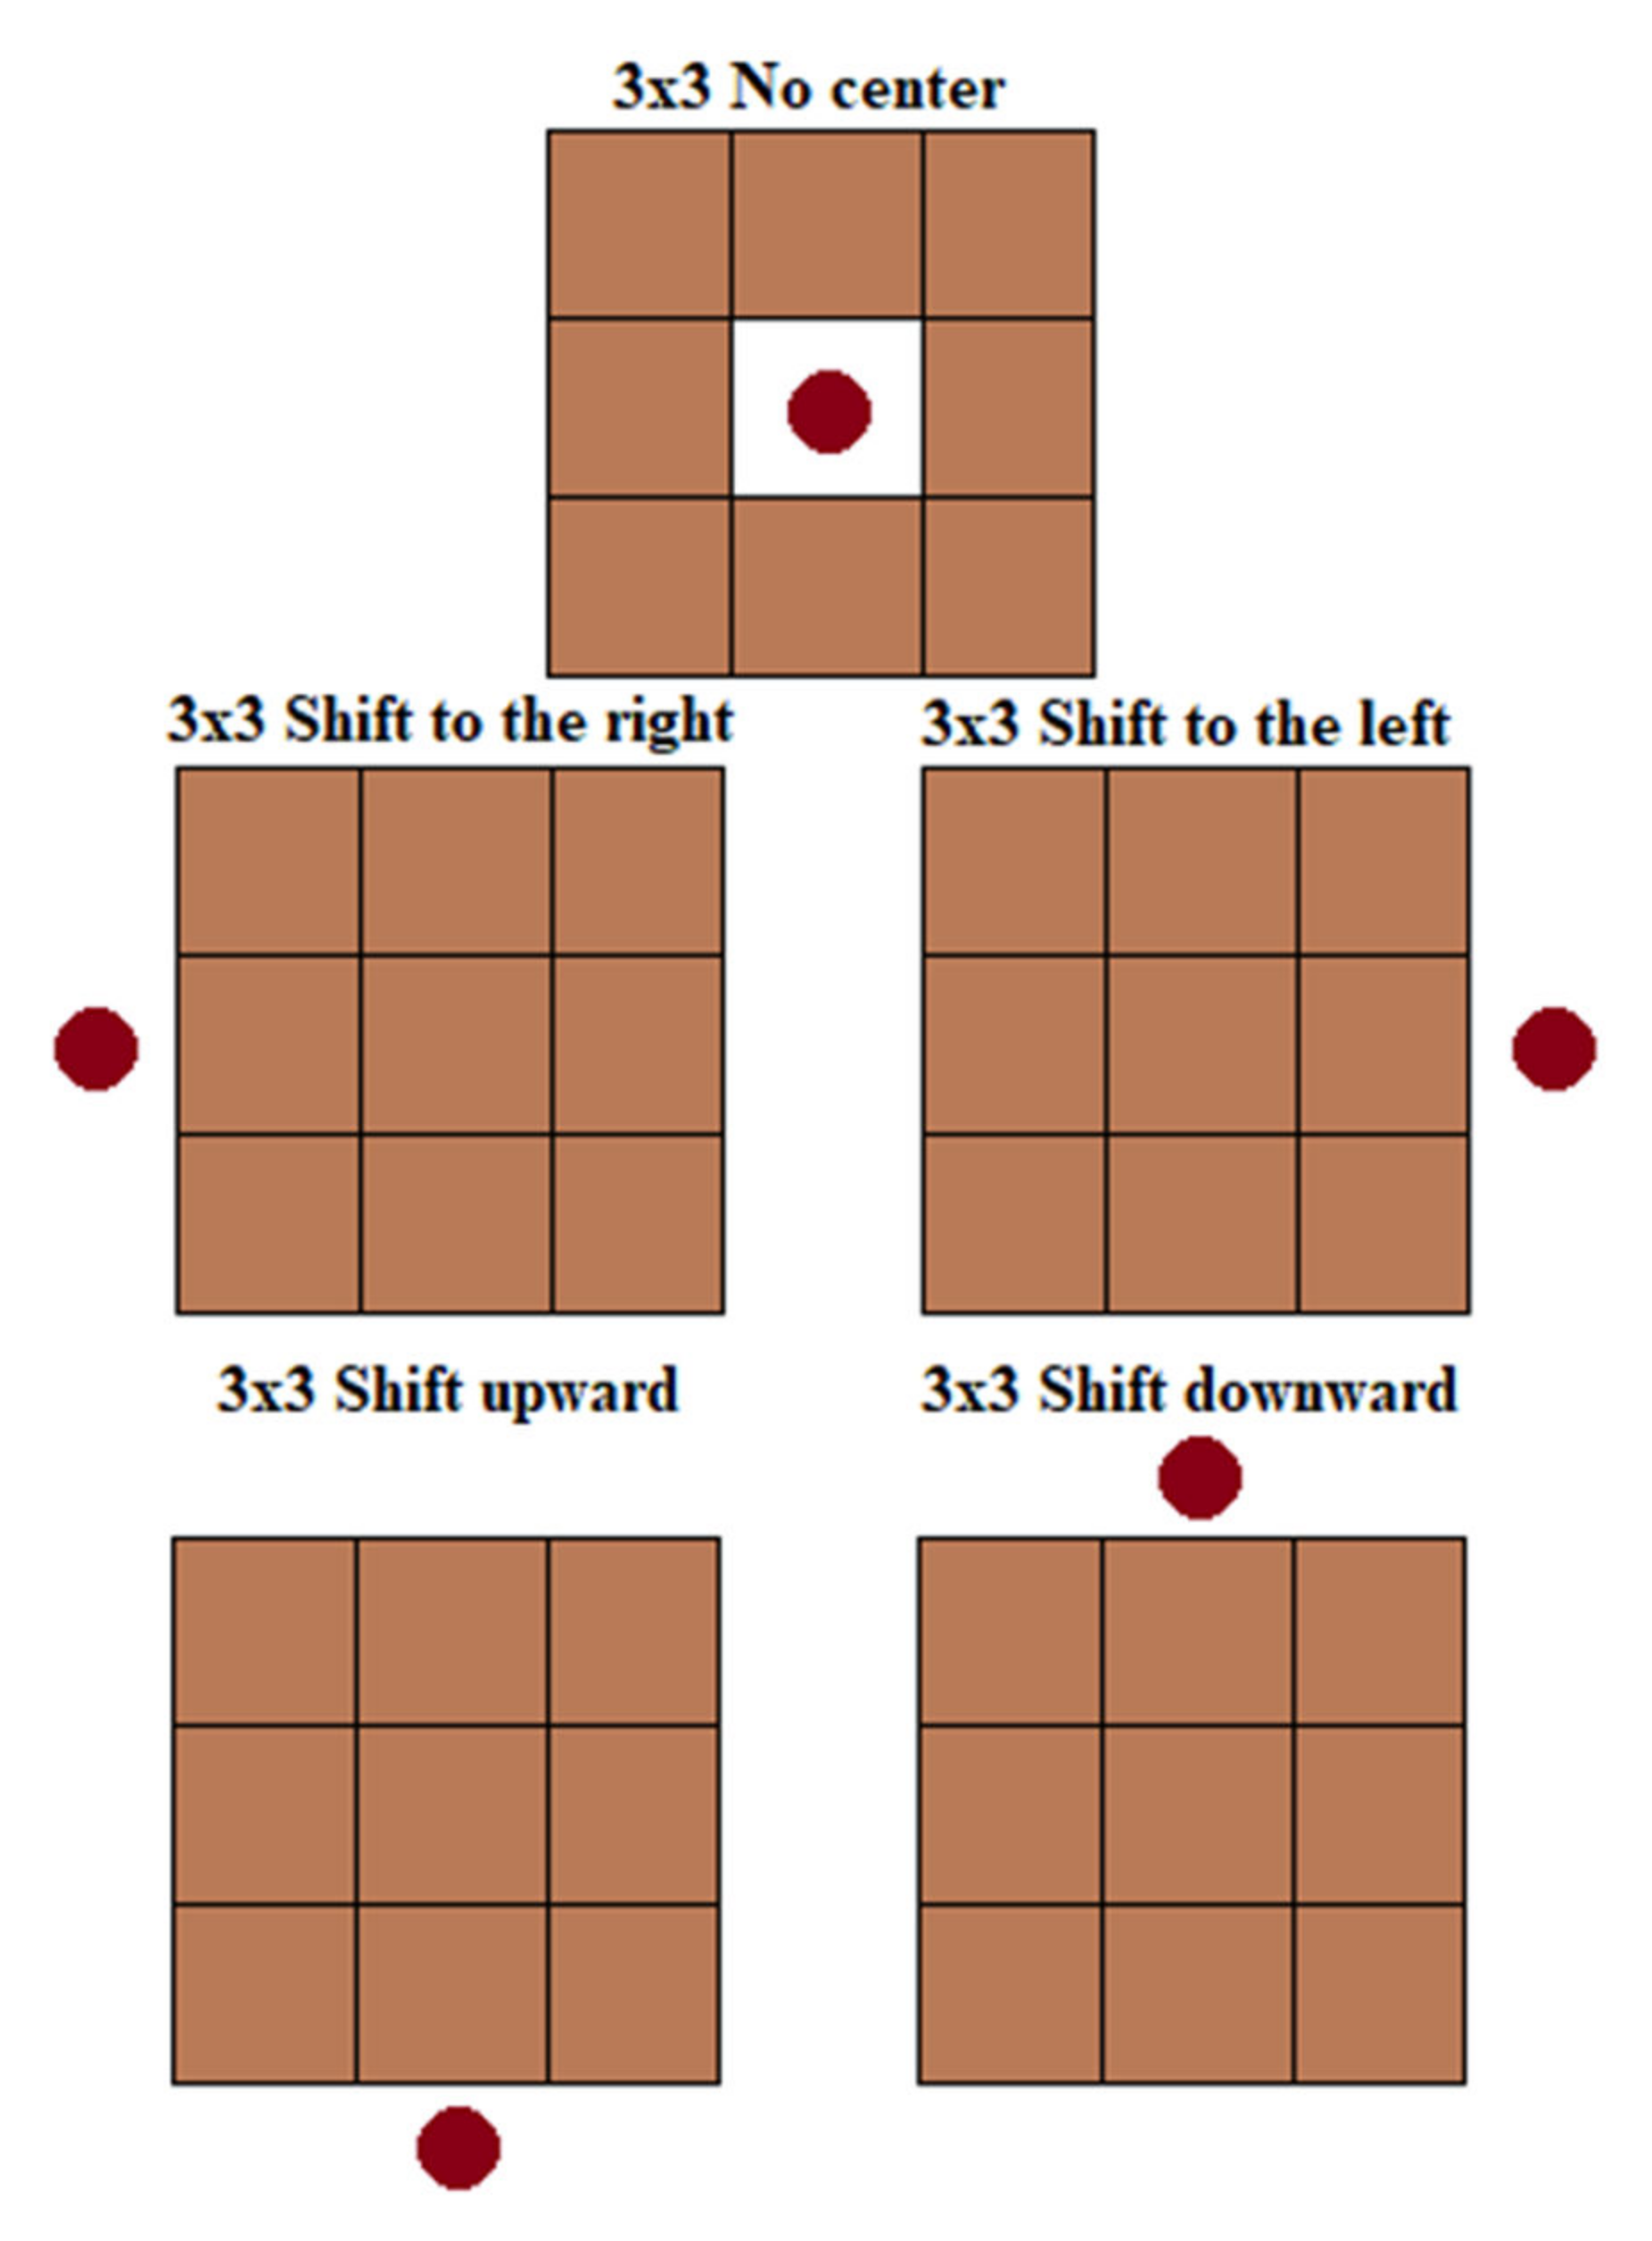
10]. This low number of match-ups can be caused by the inhomogeneity of the estimated remote sensing reflectance (Rrs) in the 3-by-3 pixels box, as shown in Figure 8. Besides the low number of match-ups, a part of the problem can be caused by the fact that the NASA-AC methodology requires an initial correction process which assumes water-leaving radiances are null in the NIR region [17]. Thus, it may not be good to apply to some typical types of nearshore coastal water due to turbidity. NASA-AC can be considered as the second-best atmospheric correction algorithm on our in situ dataset.
Polymer has good statistical results and relatively high scores in the scoring scheme. The correlation between the in situ and the estimated Rrs is relatively high. This is shown by the value of R2, which gradually increases from 0.57 at 443 nm to 0.92 at 665 nm. This result is similar to those obtained by Pereira-Sandoval et al. [49], who validated Polymer using in situ data from field campaigns, obtaining R
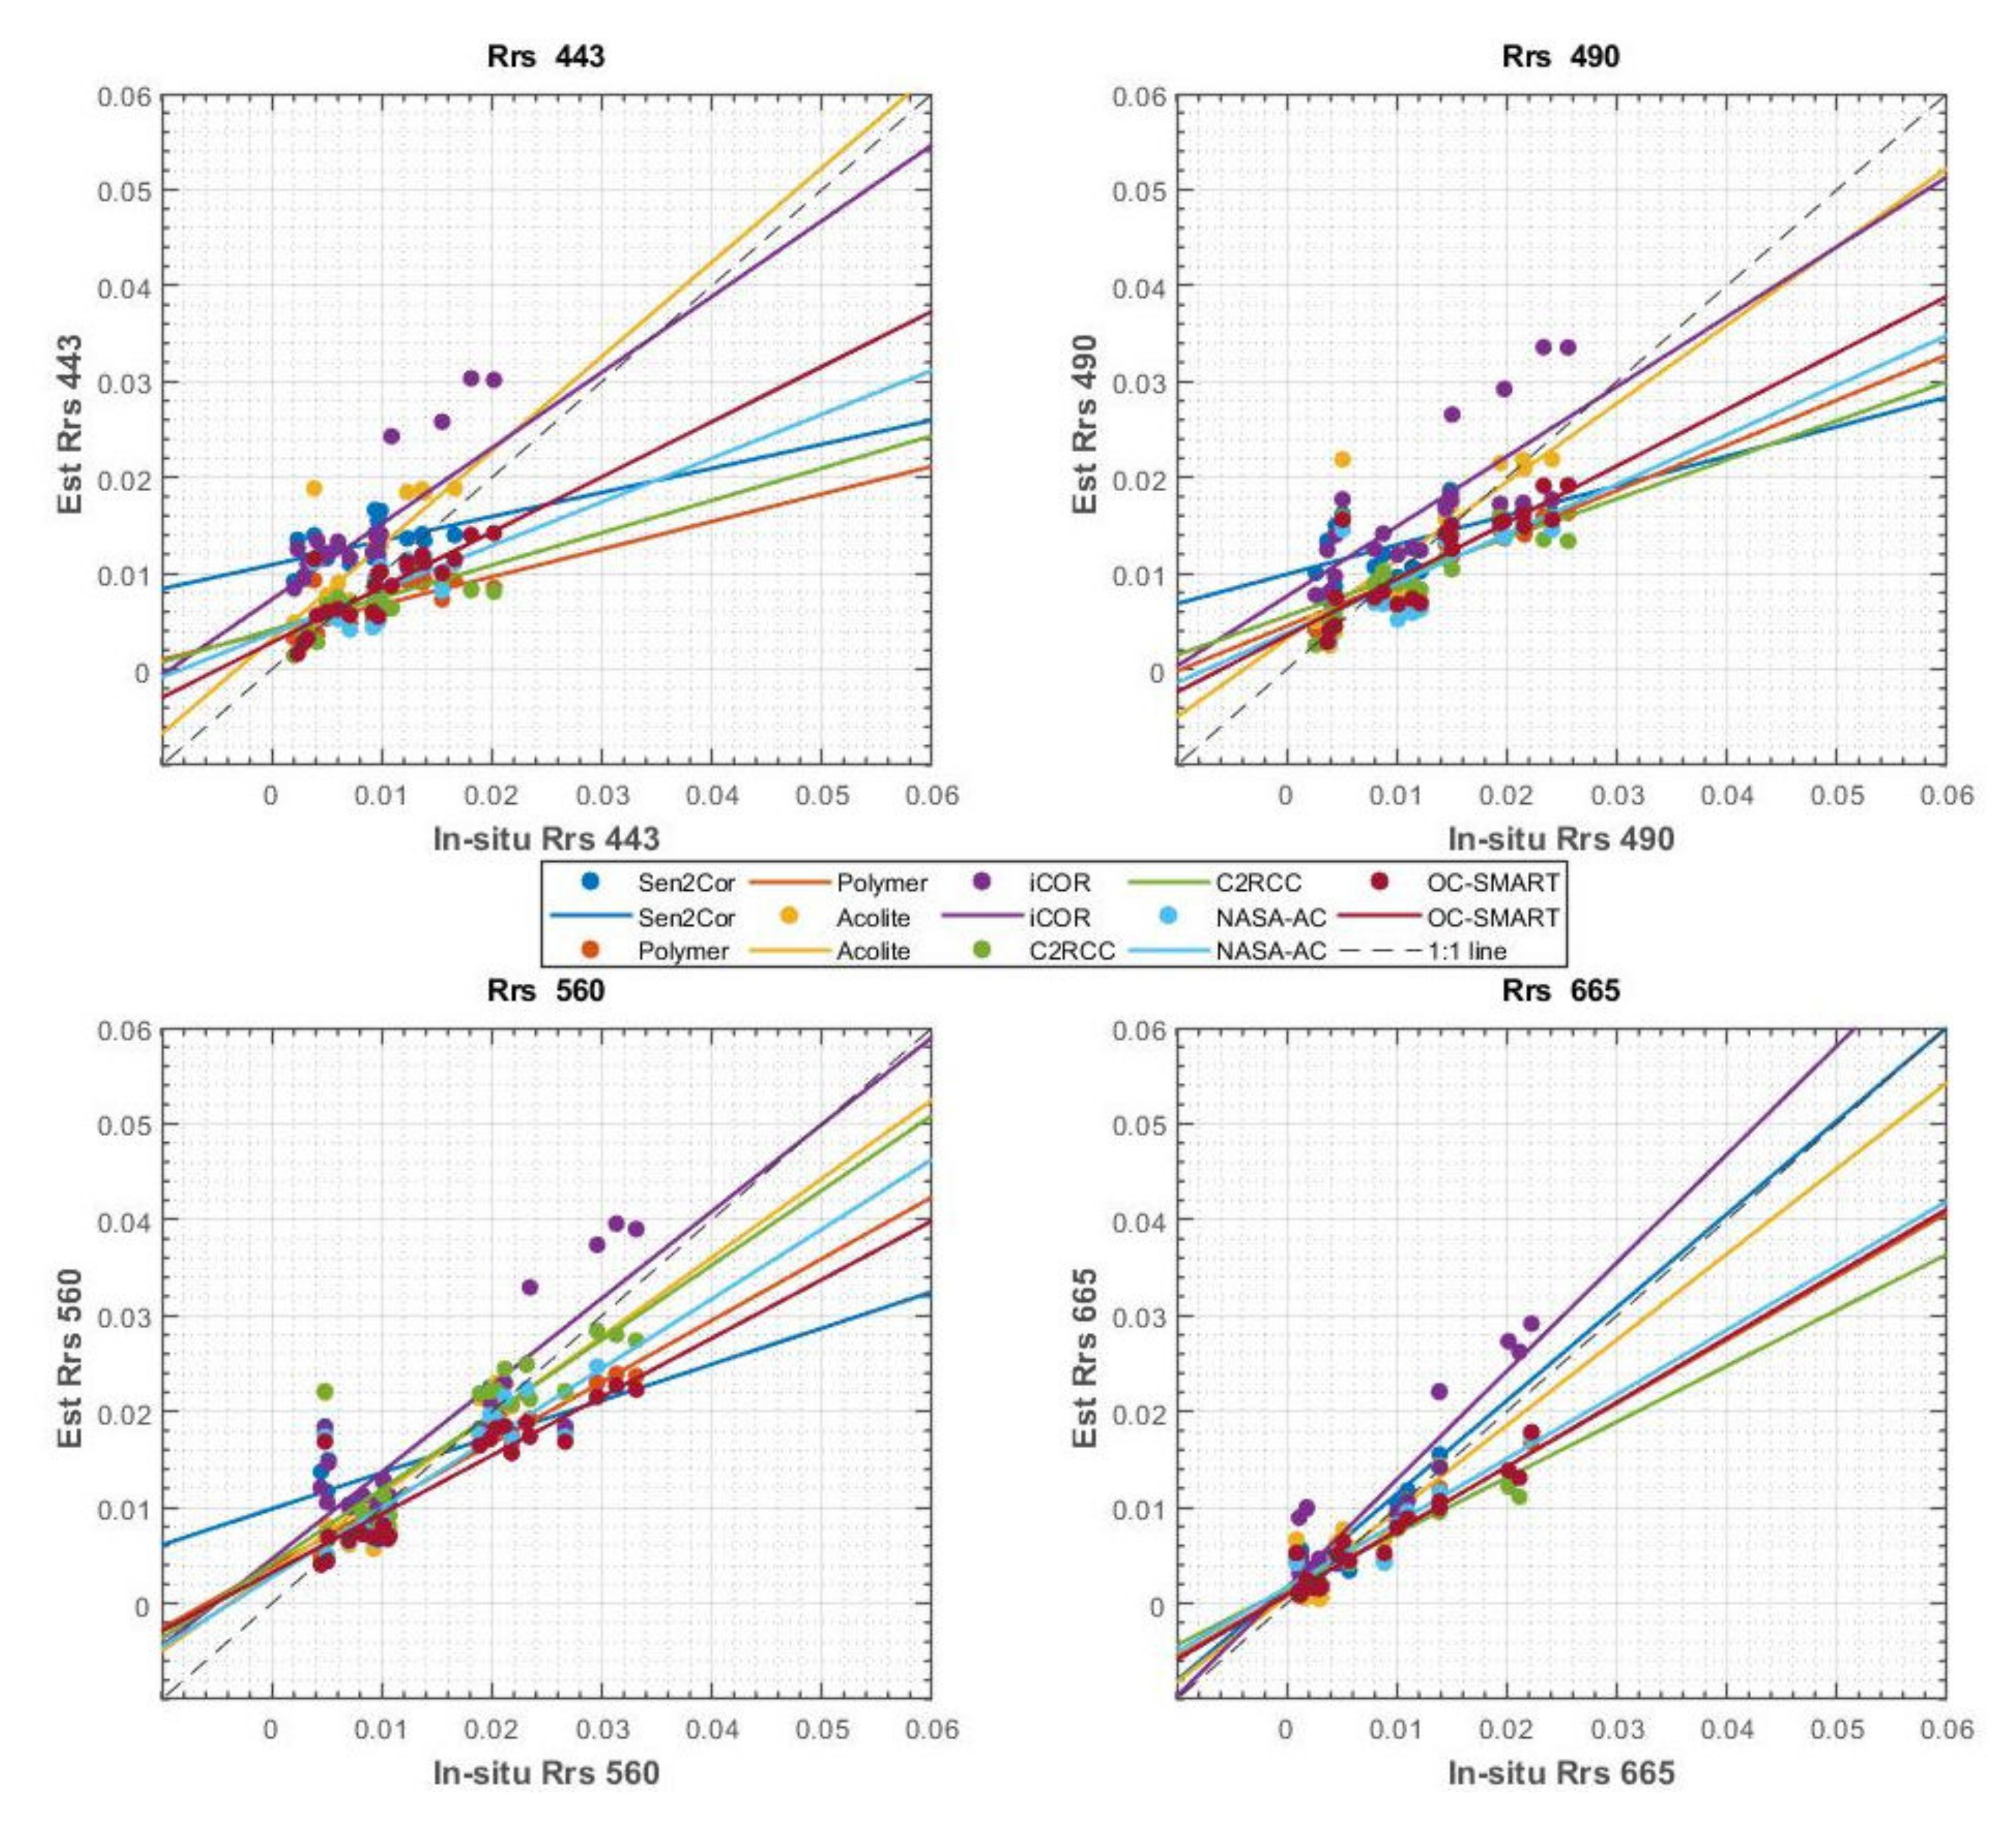
2 values equal to 0.3 for 443 nm, 0.4 for 490 nm, 0.8 for 560 nm, and 0.93 for 665 nm, which shows an increase for the coefficient of variation value. Besides, those results are in the same trend of values as the ones observed here for both match-ups cases. The algorithm shows quite low performances in the blue band and the accuracy gradually increases in the green and red bands, as shown in Figure 3 and Figure 4. From the statistical results, Polymer retrieves accurate spectra of Rrs compared to a reference in situ dataset [55] and low spectra differences between the in situ measurements and the retrieved Rrs with values of QAS and SAM of 0.87 and 5.99, respectively (Table 6). Overall, Polymer shows the value of Stot of 14.90 and 13.74 for individual and common match-ups datasets, respectively.
Similar to Polymer, C2RCC is also an atmospheric correction algorithm with acceptable and stable performances, not affected by wavelength as much as NASA-AC. C2RCC has a relatively high correlation between the estimated Rrs and the in situ measurements with R2 ranging from 0.4 at 443 nm to nearly 0.88 at 665 nm. Similar to Polymer, C2RCC exhibits relatively low accuracy in the blue bands, and this accuracy increases with increasing wavelength. One reason for this can be the strong Rayleigh scattering in the blue band by atmospheric gases, which might not be properly corrected [49]. Therefore, to solve this problem, as mentioned in the study by Pereira-Sandoval et al. [49], C2RCC is being developed and tested to create a new version capable of more accurate correction for sun-glint in the blue wavelength range. Overall, C2RCC still shows an acceptable scoring scheme with the value of Stot are 13.31 and 14.11 for individual and common match-ups cases.
Polymer and C2RCC have quite similar statistical values for some parameters, such as relative error. However, for others, Polymer shows higher accuracies compared to C2RCC such as lower values of SAM values, which are 5.99 for Polymer and 8.76 for C2RCC (Table 6), and higher R2 ranging from 0.57 to 0.92, while R2 for C2RCC ranging only from 0.4 to 0.88. Compared to C2RCC, Polymer has a better ability to remove invalid pixels. This is shown by the number of available match-ups after the match-up selection process, as given in Table 4, wherein the available match-up number of Polymer is around 21 and 22, while this value for C2RCC ranges from 17 to 21. Therefore, Polymer is a more accurate atmospheric correction algorithm than C2RCC in our study.
This agrees with what was presented by Pahlevan et al. [10]. The study of Pahlevan has assessed the performance of a total of six different ACs on Landsat-8 and Sentinel-2. Over 1000 match-ups from seven different optical water types for both fresh and coastal water have been applied. The results of this study show that OC-SMART and NASA-AC are the two best atmospheric corrections for working in coastal waters. Polymer also provides high-quality estimates of the remote-sensing reflectance. However, overall, it does not surpass the performances of OC-SMART and NASA-AC [10].
Unlike other ACs in this group, ACOLITE shows lower performances. For the correlation between estimated and in situ Rrs, R2 values vary between 0.55 at 443 nm and 0.74 at 665 nm. It can be seen from this result that the correlation of ACOLITE Rrs is low in the blue band. This also can be seen from scatterplots in Figure 3, with the regressed line for ACOLITE being distinguishable from the 1:1 line. SAM value of ACOLITE is the second-highest value (7.07) compared to the other atmospheric correction algorithms in this group. The Stot value of ACOLITE for the individual and common match case are 14.52 and 13.26, respectively. Although the S
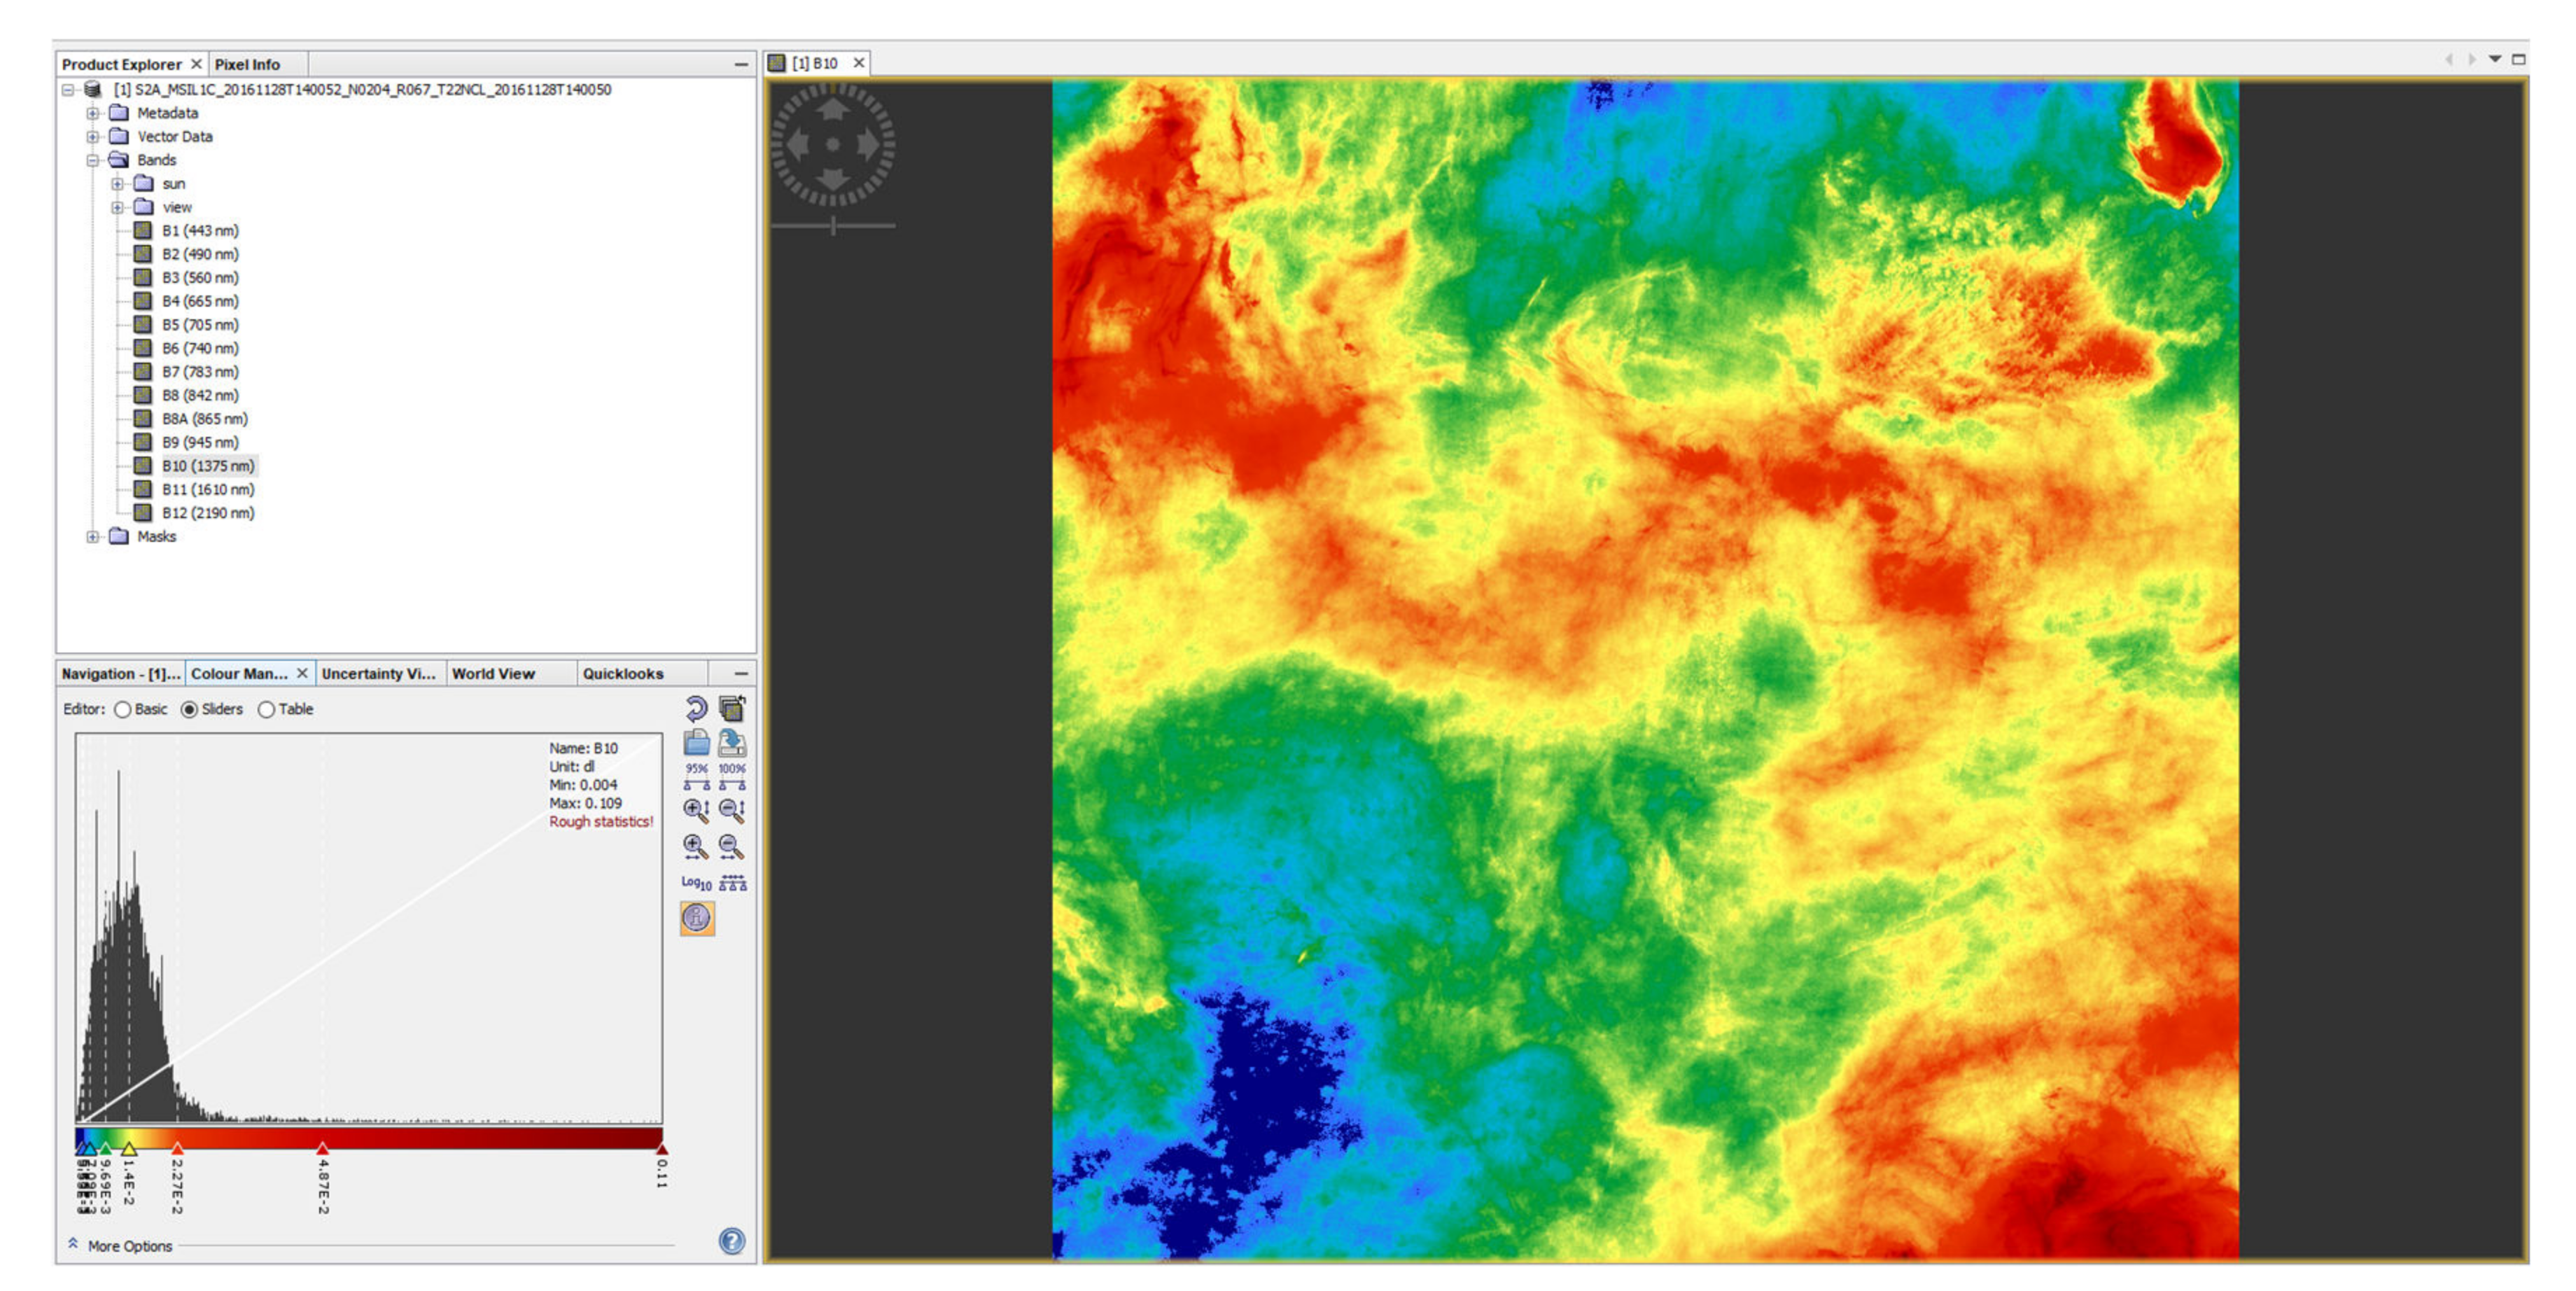
tot value of ACOLITE in the all match-up case is relatively high compared to C2RCC and NASA-AC, the statistical parameters of ACOLITE are lower than these 2 ACs. For instance, the RE values of ACOLITE at 443 and 655 nm are 2 times higher than that of C2RCC and NASA-AC. The Bias values of C2RCC and NASA-AC at 443 and 490 nm are negative and range from −11% to −2%, while the Bias values of ACOLITE at these two bands range from 22% to 53%. This low performance could be due to the ACOLITE’s mechanism, which masks pixels containing clouds, fog, or cirrus. ACOLITE’s masking process allows the removal of areas with cirrus clouds using cirrus detection from the 1375 nm band. These cirrus clouds pixels at 1375 nm are applied to mask the remaining bands of MSI. Therefore, as shown in Figure 9 of French Guiana scene on 28, November 2016, when some of the S2 satellite images at 1375 nm are almost entirely covered by cloud or haze, the masking process of ACOLITE will remove the whole scene. This will result in all extracted values being NaN. Overall, ACOLITE shows the lowest performances in the first group.

6.2. Comparison of the Second Group of AC: Sen2Cor and ICOR

The second group of AC (Sen2Cor and iCOR), in general, shows lower performances compared to the first group. This is understandable as both Sen2Cor and iCOR mechanisms mostly depend on the presence of land, as those algorithms are land-based method [54] and improved by Guanter [
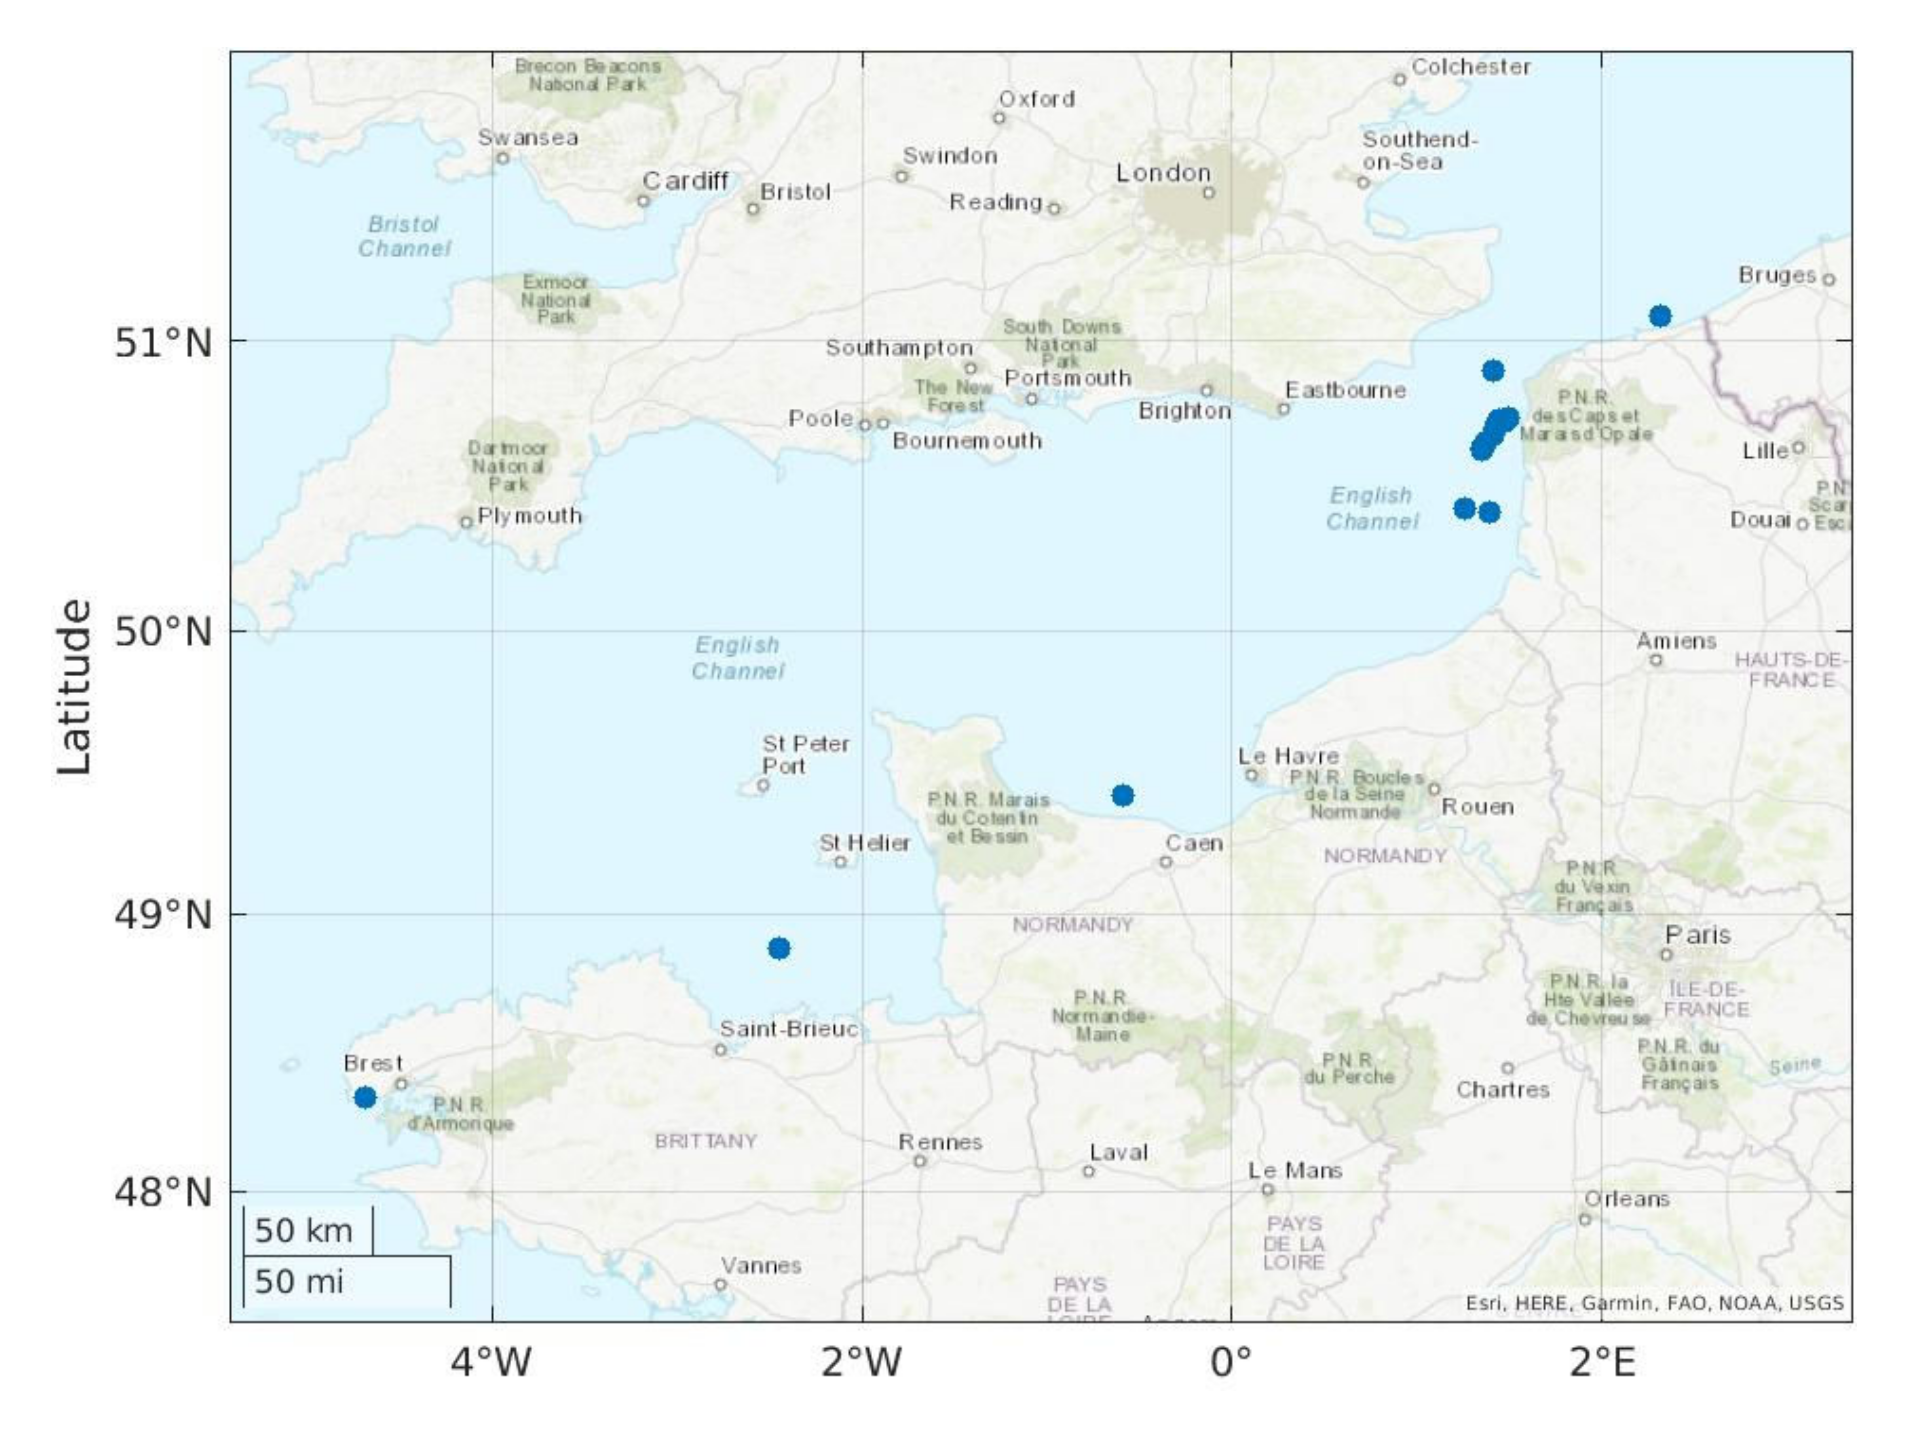
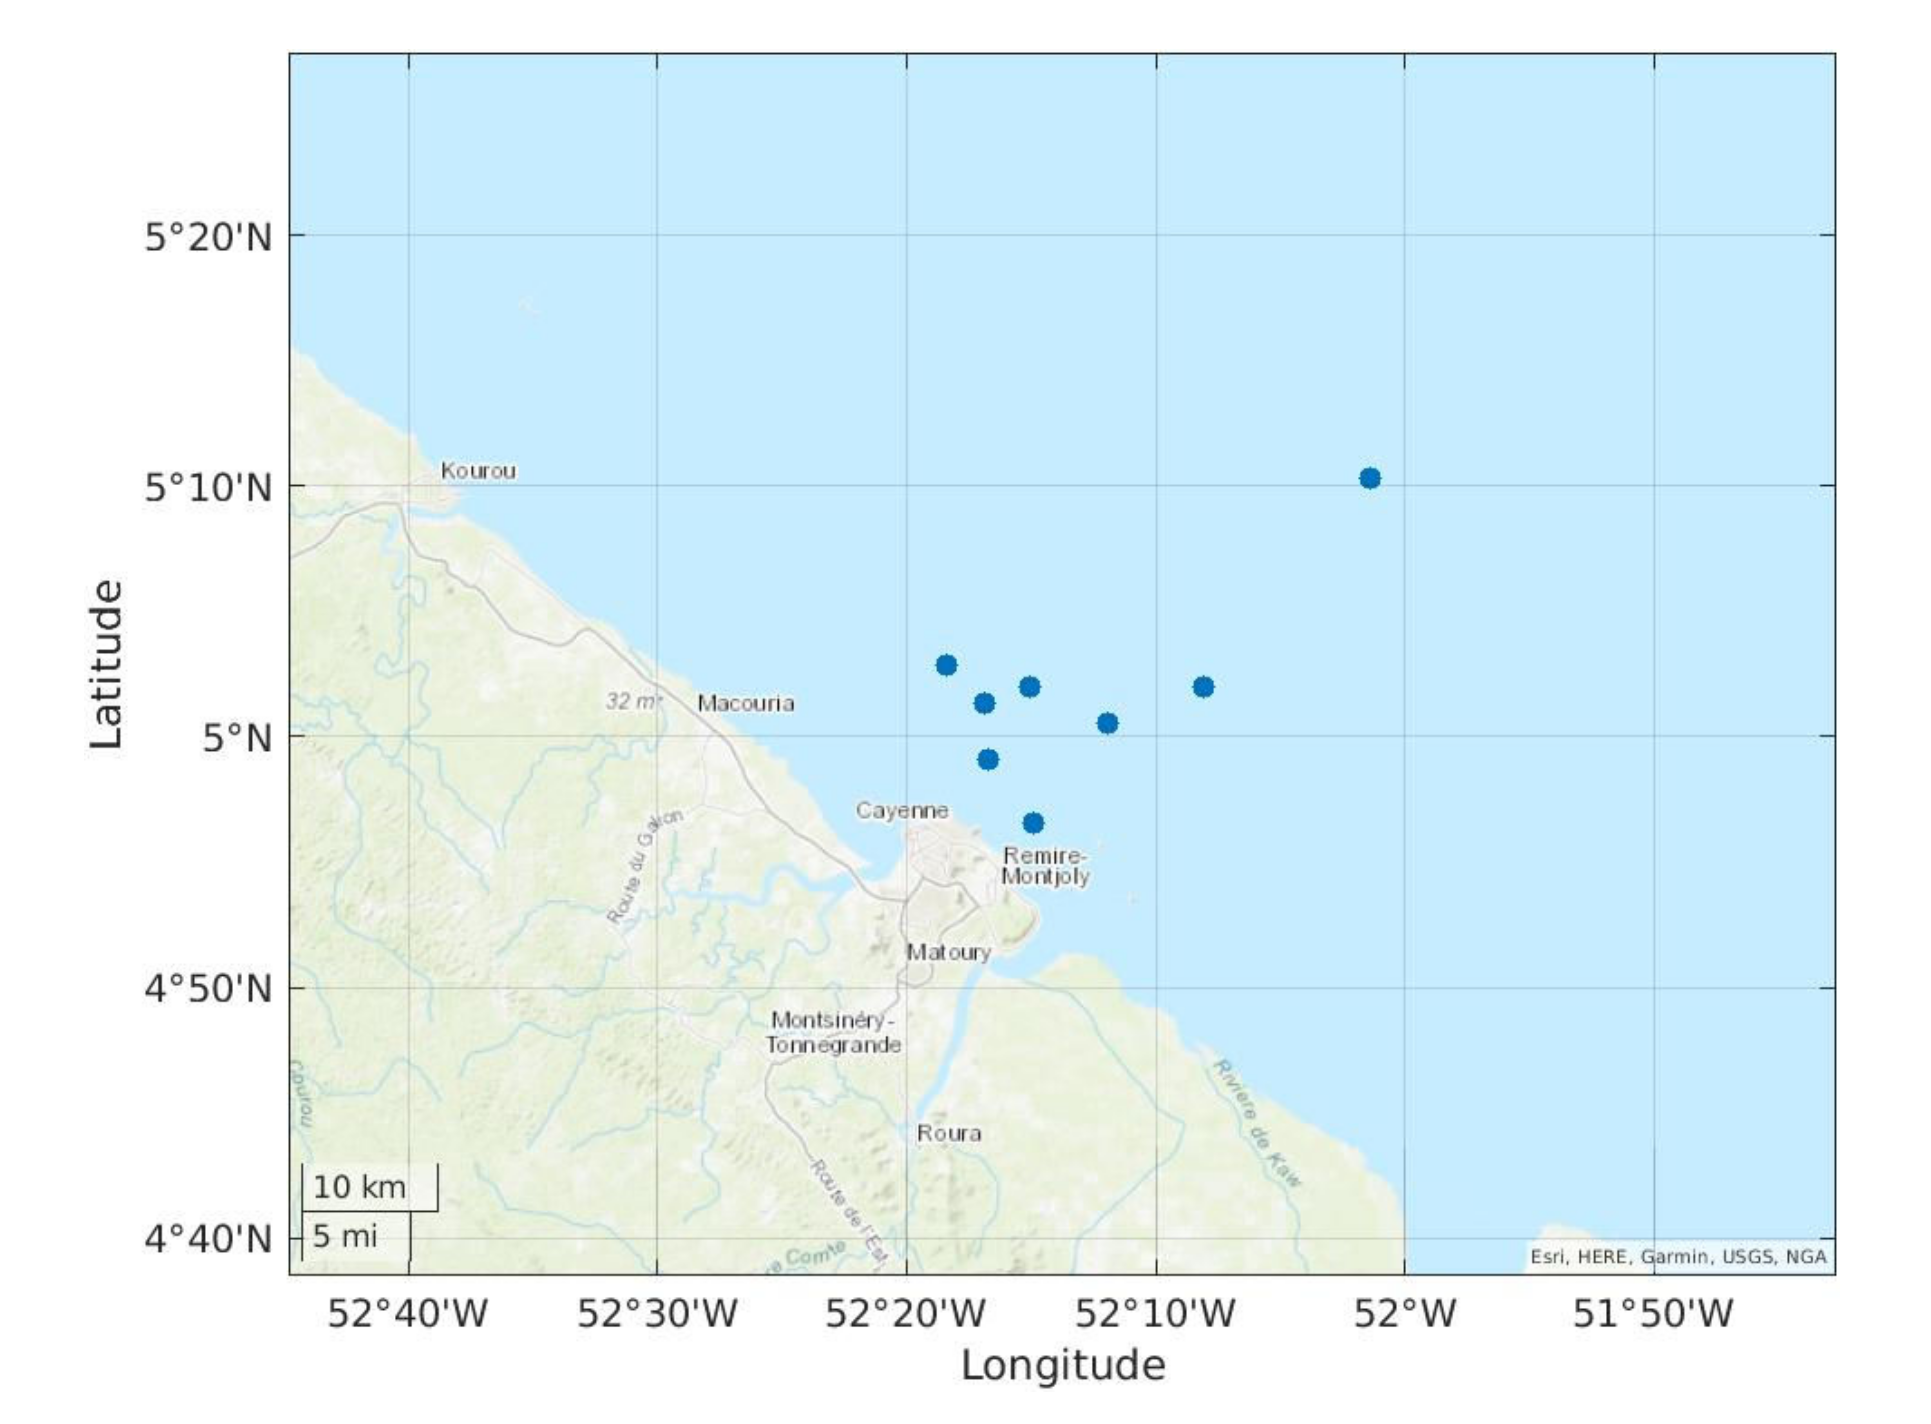
51] method for Sen2Cor and iCOR, respectively. These methods generate scene parameters requiring a distribution of pixels containing land. In the absence of land, these algorithms use default values of the aerosol optical thickness, which was the case for three match-ups in the English Channel and one match-up in French Guiana in this study. Therefore, it is suggested that the tested versions of these processors should better be applied for inland scenes.
In detail, in the second group, Sen2Cor shows relatively low performances in the visible bands, especially for the blue band. At 443 nm, R2 is nearly 0.36, which indicates a low accuracy and correlation between estimated and in situ Rrs, as suggested by Figure 4. The data points are highly scattered around the 1:1 line for bands between 443 and 560 nm. Furthermore, the total scheming score (Stot) is very low (2.01 and 4.19 for individual and common match-ups cases, respectively) on our dataset. This suggests that this algorithm shows poor performances in reproducing the spectral shape of the in situ data. This poor performance could partly come from the fact that the approach of this algorithm is based on the “Dense Dark Vegetation”, which means that the AC will perform better in the high presence of vegetation. One example is in Ruescas et al. [59] as the authors used Sen2Cor to correct the atmosphere in Albufera lagoon. They showed good accuracies in the retrievals and concluded that it was due to the high concentration of chlorophyll-a all year round in the lagoon, especially in spring and summer when there is an additional resonance of crop rice around the lagoon [59]. Therefore, in the condition of lesser vegetation, the accuracy of Sen2Cor can significantly decrease.
Compared to Sen2Cor, iCOR has a relatively high correlation between the estimated and in situ Rrs, as shown by the value of R2 which gradually increases from 0.44 at 443 nm to 0.86 at 665 nm, while the R2 value of Sen2Cor varies from 0.36 at 443 nm to 0.61 at 665 nm. However, except for this statistical parameter, iCOR showed higher values in all other indicators such as Bias and RE in 665 nm, which is 30% higher compared to Sen2Cor. This leads to a low value of Stot (7.7 and 3.37 for individual and common dataset cases respectively). Notably, iCOR is the only algorithm that does the adjacency correction, which is SIMilarity Environmental Correction (SIMEC), before performing the atmospheric correction [43]. This means that in order to perform the correction process, iCOR needs two conditions to be met. First, one condition is to have at least one spectral band in the wavelength range between 680 nm and 730 nm, where strong reflections from land plants and weak reflections from water can be obtained. Second, there must be at least one reference band in the NIR region [60]. However, in the case of extremely high turbidity such as coastal waters, the reflectance spectrum of NIR varies considerably [61] and, maybe, this could be the reason for lower performances. Besides, the other reason can be that iCOR uses a fixed aerosol model for the rural area, which is not suitable for the coastal area, which needs a marine or pollution aerosol model [62]. Another reasonable explanation for these lower performances is that iCOR requires a combination of pure green vegetation and bare soil endmember, and when these conditions cannot be satisfied to calculate the AOT value, it is recommended to manually set the appropriate AOT value for the area [42]. However, in this study, instead of using a specific AOT value for each region, the AOT value used by iCOR was set to default.

6.3. Processing Time

In terms of the ease of using AC algorithms, with the processor of i7-7700HQ with 8 cores and 16 GB RAM, the time processing of OC-SMART with default setting is the fastest out of the seven algorithms. The normal process time OC-SMART takes for 1830 × 1830 pixels of Sentinel-2 is in the range of 150 to 450 s. ACOLITE with default setting is the second fastest algorithm, followed by Polymer and Sen2Cor. In fourth place, iCOR and C2RCC took approximately 40 to 50 min to process the whole Sentinel-2 scene. NASA-AC took the longest processing time, which could reach around 2 h with the “-2” option for aerosol that is based on Bailey et al. [17] method. Regardless of the time processing and also the performance, OC-SMART is highly recommended for atmospheric correction in the coastal area.

7. Conclusions

This research aimed to test and validate the performance of seven S2/MSI atmospheric correction processors by using in situ measurements collected in two contrasted French coastal water: the English Channel and French Guiana. We used statistical parameters on the absolute values of Rrs and on the Rrs spectra and a ranking scheme to evaluate the performances of each AC.
The scoring scheme system applied in this study has been effective in evaluating and ranking atmospheric correction algorithms for coastal waters. This scheme was taken into consideration for scoring the AC processors and then ranking them with respect to their performances. The ranking system given in this article should be applied in atmospheric correction of coastal area.
The results showed that out of seven algorithms, OC-SMART and NASA-AC are the best suitable processor on our in situ dataset. This is similar with the conclusion in ACIX-Aqua research of Pahlevan et al. [10]. In detail, OC-SMART has the highest total score of 16.89/20, NASA-AC is the second most suitable AC with the value Stot is 17.13/20 in the case of common match-ups dataset. However, there is a tradeoff for using NASA-AC since its available match-ups number is considerably lower compared to the other ACs. Polymer and C2RCC are, respectively, third and fourth in the ranking system. However, the accuracy of these algorithms is not high in the blue band (443 nm) and increases towards the red and green bands. This trend can also be observed for the other ACs algorithms. ACOLITE is the fifth in the ranking system. The two left ACs show lower performances on our dataset, especially in the blue band. It is suggested that the tested versions of these two left ACs should be better applied to inland scenes.
We tested the sensitivity of the performances on the position of the extraction box to the in situ measurement location. As the size of the structure that helped to collect the in situ measurements can be substantial to the pixel size of S2/MSI, it is necessary to study the impact of these structures on the performances of the AC. However, most of the results obtained for the data extraction methods tested in this study did not show significant changes, except for the case of right-shifted and down-shifted boxes, with a small improvement in the overall scoring scheme results. Therefore, it is not possible to conclude with certainty whether this right shift box or down shift box test method are better than the conventional data extraction method. This might be because our seawaters were too homogeneous or because we processed all the MSI images at a 60-m spatial resolution. However, it is necessary to consider the size of the measurements platforms when validating MSI images over the ocean.
We recommend using the ranking system result of this research over our regions of interest or similar regions.

Author Contributions

Conceptualization, C.J.; methodology, C.J. and Q.-T.B.; validation, Q.-T.B., C.J.; in situ data collection, C.J., V.V., X.M., A.C. and M.A.M.; writing—original draft preparation, Q.-T.B.; writing—review and editing, Q.-T.B. and C.J.; All authors have read and agreed to the published version of the manuscript.

Funding

This research was funded by ESA for funding through the 4th MERIS Reprocessing project (Contract: ARG/003-025/1406/LOG), by the ESRIN Contract 4000115822/15/I-Sbo—“Scientific Exploitation of Operational Missions (SEOM) S2-4Sci Land and Water Atmospheric corrections for coastal and inland waters” and by CNES through the TOSCA program. The authors thank the crew of Wayki village for their help and patience during the field campaigns in French Guiana. The Sepia II and Côte de la Manche ship crews are acknowledged for their help and kindness during sea cruises in the Eastern English Channel.

Data Availability Statement

Satellite data used in this article are retrieved from Copernicus Open Access Hub. This is open-source, which can be accessed through the link: https://scihub.copernicus.eu/dhus/ (accessed on 25 August 2020).

Conflicts of Interest

The authors declare no conflict of interest about the work presented here.

Appendix A

Table A1. Statistical parameters for sixth positions of the colocation box: Number of the available match-up (N); Quality Assurance Score (QAS), Chi-Square (χ2), Spatial Angle Mean (SAM); Total Score (Stot).
BoxNQASχ2 (%)SAM Stot
iCORNormal220.650.389.357.70
No Center220.670.369.018.02
Upshifted220.640.358.997.83
Downshifted220.640.389.707.73
Left-shifted220.650.359.007.80
Right-shifted220.640.379.308.25
ACOLITENormal160.880.127.0714.52
No Center160.880.127.0914.69
Upshifted160.870.127.2113.72
Downshifted160.860.137.2615.00
Left-shifted160.880.127.1614.10
Right-shifted160.920.127.0014.75
C2RCCNormal211.000.148.7613.31
No Center211.000.148.7413.49
Upshifted191.000.158.8011.80
Downshifted211.000.159.0114.29
Left-shifted211.000.148.9812.81
Right-shifted211.000.149.0513.89
Sen2CorNormal220.580.279.592.01
No Center220.580.279.582.03
Upshifted220.570.279.641.56
Downshifted220.570.3310.051.28
Left-shifted220.580.289.602.01
Right-shifted220.610.3310.031.25
PolymerNormal210.870.075.9914.90
No Center210.870.075.9715.08
Upshifted210.870.076.0414.30
Downshifted220.890.076.0415.30
Left-shifted210.880.076.0614.74
Right-shifted220.890.076.0915.58
NASA-ACNormal150.940.044.9914.36
No Center140.940.044.9913.82
Upshifted140.970.034.4615.42
Downshifted110.940.055.1712.14
Left-shifted140.940.044.8713.83
Right-shifted130.920.045.0913.28
OC-SMARTNormal210.870.044.4416.89
No Center200.860.044.3416.66
Upshifted190.910.044.3916.54
Downshifted210.860.044.6117.06
Left-shifted210.870.054.8517.03
Right-shifted210.830.044.5217.20

References

  1. Cohen, W.B.; Goward, S.N. Landsat’s Role in Ecological Applications of Remote Sensing. BioScience 2004, 54, 535–545. [Google Scholar] [CrossRef]
  2. El Serafy, G.Y.H.; Schaeffer, B.A.; Neely, M.-B.; Spinosa, A.; Odermatt, D.; Weathers, K.C.; Baracchini, T.; Bouffard, D.; Carvalho, L.; Conmy, R.; et al. Integrating Inland and Coastal Water Quality Data for Actionable Knowledge. Remote Sens. 2021, 13, 2899. [Google Scholar] [CrossRef]
  3. Melet, A.; Teatini, P.; Le Cozannet, G.; Jamet, C.; Conversi, A.; Benveniste, J.; Almar, R. Earth Observations for Monitoring Marine Coastal Hazards and Their Drivers. Surv. Geophys. 2020, 41, 1489–1534. [Google Scholar] [CrossRef]
  4. Ritchie, J.C.; Zimba, P.V.; Everitt, J.H.J.P.E.; Sensing, R. Remote Sensing Techniques to Assess Water Quality. Photogramm. Eng. Remote Sens. 2003, 69, 695–704. [Google Scholar] [CrossRef] [Green Version]
  5. Hollmann, R.; Merchant, C.; Saunders, R.; Downy, C.; Buchwitz, M.; Cazenave, A.; Chuvieco, E.; Defourny, P.; de Leeuw, G.; Forsberg, R.; et al. The ESA Climate Change Initiative: Satellite Data Records for Essential Climate Variables. Bull. Am. Meteorol. Soc. 2013, 94, 1541–1552. [Google Scholar] [CrossRef] [Green Version]
  6. Platt, T.; Hoepffner, N.; Stuart, V.; Brown, C.C. Why Ocean Colour? The Societal Benefits of Ocean-Colour Technology. In Reports of the International Ocean Colour Coordinating Group; International Ocean Colour Coordinating Group (IOCCG): Dartmouth, NS, Canada, 2008; Volume 7, pp. 3–4. [Google Scholar]
  7. Gordon, H.R. Atmospheric correction of ocean color imagery in the Earth Observing System era. J. Geophys. Res. Atmos. 1997, 102, 17081–17106. [Google Scholar] [CrossRef]
  8. Gordon, H.R.; Wang, M. Retrieval of water-leaving radiance and aerosol optical thickness over the oceans with SeaWiFS: A preliminary algorithm. Appl. Opt. 1994, 33, 443–452. [Google Scholar] [CrossRef] [PubMed]
  9. Wang, M. Atmospheric Correction for Remotely-Sensed Ocean-Colour Products. In Reports of the International Ocean Colour Coordinating Group; International Ocean Colour Coordinating Group (IOCCG): Dartmouth, NS, Canada, 2010; Volume 10, p. 6. [Google Scholar]
  10. Pahlevan, N.; Mangin, A.; Balasubramanian, S.V.; Smith, B.; Alikas, K.; Arai, K.; Barbosa, C.; Bélanger, S.; Binding, C.; Bresciani, M.; et al. ACIX-Aqua: A global assessment of atmospheric correction methods for Landsat-8 and Sentinel-2 over lakes, rivers, and coastal waters. Remote Sens. Environ. 2021, 258, 112366. [Google Scholar] [CrossRef]
  11. Drusch, M.; Del Bello, U.; Carlier, S.; Colin, O.; Fernandez, V.; Gascon, F.; Hoersch, B.; Isola, C.; Laberinti, P.; Martimort, P.; et al. Sentinel-2, ESA’s Optical High-Resolution Mission for GMES Operational Services. Remote Sens. Environ. 2012, 120, 25–36. [Google Scholar] [CrossRef]
  12. Vanhellemont, Q.; Ruddick, K. Atmospheric correction of metre-scale optical satellite data for inland and coastal water applications. Remote Sens. Environ. 2018, 216, 586–597. [Google Scholar] [CrossRef]
  13. Siegel, D.; Wang, M.; Maritorena, S.; Robinson, W. Atmospheric Correction of Satellite Ocean Color Imagery: The Black Pixel Assumption. Appl. Opt. 2000, 39, 3582–3591. [Google Scholar] [CrossRef]
  14. Stumpf, R.; Arnone, R.; Gould, R.; Martinolich, P.; Ransibrahmanakul, V. A partially coupled ocean-atmosphere model for retrieval of water-leaving radiance from SeaWiFS in coastal waters. NASA Tech. Memo 2003, 206892, 51–59. [Google Scholar]
  15. Goyens, C.; Jamet, C.; Schroeder, T. Evaluation of four atmospheric correction algorithms for MODIS-Aqua images over contrasted coastal waters. Remote Sens. Environ. 2013, 131, 63–75. [Google Scholar] [CrossRef]
  16. Jamet, C.; Loisel, H.; Kuchinke, C.; Ruddick, K.; Zibordi, G.; Feng, H. Comparison of three SeaWiFS Atmospheric Correction Algorithms for Turbid Waters using AERONET-OC Measurements. Remote Sens. Environ. 2011, 115, 1955–1965. [Google Scholar] [CrossRef]
  17. Bailey, S.W.; Franz, B.A.; Werdell, P.J. Estimation of near-infrared water-leaving reflectance for satellite ocean color data processing. Opt. Express 2010, 18, 7521–7527. [Google Scholar] [CrossRef]
  18. Brajard, J.; Santer, R.; Crépon, M.; Thiria, S. Atmospheric correction of MERIS data for case-2 waters using a neuro-variational inversion. Remote Sens. Environ. 2012, 126, 51–61. [Google Scholar] [CrossRef]
  19. Doerffer, R.; Schiller, H. The MERIS case 2 water algorithm. Int. J. Remote Sens. 2007, 28, 517–535. [Google Scholar] [CrossRef]
  20. Fan, Y.; Li, S.; Han, X.; Stamnes, K. Machine learning algorithms for retrievals of aerosol and ocean color products from FY-3D MERSI-II instrument. J. Quant. Spectrosc. Radiat. Transf. 2020, 250, 107042. [Google Scholar] [CrossRef]
  21. Goyens, C.; Jamet, C.; Ruddick, K.G. Spectral relationships for atmospheric correction. II. Improving NASA’s standard and MUMM near infra-red modeling schemes. Opt. Express 2013, 21, 21176–21187. [Google Scholar] [CrossRef] [Green Version]
  22. Huang, X.; Zhu, J.; Han, B.; Jamet, C.; Tian, Z.; Zhao, Y.; Li, J.; Li, T. Evaluation of Four Atmospheric Correction Algorithms for GOCI Images over the Yellow Sea. Remote Sens. 2019, 11, 1631. [Google Scholar] [CrossRef] [Green Version]
  23. Kuchinke, C.P.; Gordon, H.; Harding, L.W.; Voss, K. Spectral optimization for constituent retrieval in Case 2 waters II: Validation study in the Chesapeake Bay. Remote Sens. Environ. 2009, 113, 610–621. [Google Scholar] [CrossRef]
  24. Ruddick, K.; Ovidio, F.; Rijkeboer, M. Atmospheric Correction of SeaWiFS Imagery for Turbid Coastal and Inland Waters. Appl. Opt. 2000, 39, 897–912. [Google Scholar] [CrossRef] [PubMed] [Green Version]
  25. Schroeder, T.; Behnert, I.; Schaale, M.; Fischer, J.; Doerffer, R. Atmospheric correction algorithm for MERIS above case-2 waters. Int. J. Remote Sens. 2007, 28, 1469–1486. [Google Scholar] [CrossRef]
  26. Steinmetz, F.; Deschamps, P.-Y.; Ramon, D. Atmospheric correction in presence of sun glint: Application to MERIS. Opt. Express 2011, 19, 9783–9800. [Google Scholar] [CrossRef] [Green Version]
  27. Vanhellemont, Q.; Ruddick, K. Acolite for Sentinel-2, Aquatic Applications of MSI Imagery. In Proceedings of the 2016 ESA Living Planet Symposium, Prague, Czech Republic, 9–13 May 2016. [Google Scholar]
  28. Jamet, C.; Thiria, S.; Moulin, C.; Crepon, M. Use of a Neurovariational Inversion for Retrieving Oceanic and Atmospheric Constituents from Ocean Color Imagery: A Feasibility Study. J. Atmos. Ocean. Technol. 2005, 22, 460–475. [Google Scholar] [CrossRef]
  29. Felde, G.; Anderson, G.; Cooley, T.; Matthew, M.; Adler-Golden, S.; Berk, A.; Lee, J. Analysis of Hyperion Data with the FLAASH Atmospheric Correction Algorithm. In Proceedings of the 2003 IEEE International Geoscience and Remote Sensing Symposium, Toulouse, France, 21–25 July 2003; Volume 1, pp. 90–92. [Google Scholar]
  30. Fast Line-of-Sight Atmospheric Analysis of Hypercubes (FLAASH). n.d. Available online: https://www.l3harrisgeospatial.com/docs/flaash.html (accessed on 7 February 2022).
  31. Hagolle, O. MACCS/MAJA, How It Works. 2015. Available online: https://labo.obs-mip.fr/multitemp/maccs-how-it-works/ (accessed on 7 February 2022).
  32. Guillou, N.; Rivier, A.; Chapalain, G.; Gohin, F. The impact of tides and waves on near-surface suspended sediment concentrations in the English Channel. Oceanologia 2017, 59, 28–36. [Google Scholar] [CrossRef]
  33. Lubac, B.; Loisel, H. Variability and classification of remote sensing reflectance spectra in the eastern English Channel and southern North Sea. Remote Sens. Environ. 2007, 110, 45–58. [Google Scholar] [CrossRef]
  34. Loisel, H.; Meriaux, X.; Poteau, A.; Artigas, L.F.; Lubac, B.; Gardel, A.; Lesourd, a. Analyze of the Inherent Optical Properties of French Guiana Coastal Waters for Remote Sensing Applications. J. Coast. Res. 2009, 56, 1532–1536. [Google Scholar]
  35. Vantrepotte, V.; Gensac, E.; Loisel, H.; Gardel, A.; Dessailly, D.; Mériaux, X. Satellite assessment of the coupling between in water suspended particulate matter and mud banks dynamics over the French Guiana coastal domain. J. South Am. Earth Sci. 2013, 44, 25–34. [Google Scholar] [CrossRef]
  36. Mograne, M.A.; Jamet, C.; Loisel, H.; Vantrepotte, V.; Mériaux, X.; Cauvin, A. Evaluation of Five Atmospheric Correction Algorithms over French Optically-Complex Waters for the Sentinel-3A OLCI Ocean Color Sensor. Remote Sens 2019, 11, 668. [Google Scholar] [CrossRef] [Green Version]
  37. Bailey, S.; Werdell, J. A multi-sensor approach for the on-orbit validation of ocean color satellite data products. Remote Sens. Environ. 2006, 102, 12–23. [Google Scholar] [CrossRef]
  38. Concha, J.; Bracaglia, M.; Brando, V. Assessing the influence of different validation protocols on Ocean Colour match-up analyses. Remote Sens. Environ. 2021, 259, 112415. [Google Scholar] [CrossRef]
  39. Bulgarelli, B.; Kiselev, V.; Zibordi, G. Simulation and analysis of adjacency effects in coastal waters: A case study. Appl. Opt. 2014, 53, 1523–1545. [Google Scholar] [CrossRef]
  40. Bulgarelli, B.; Kiselev, V.; Zibordi, G. Adjacency effects in satellite radiometric products from coastal waters: A theoretical analysis for the northern Adriatic Sea. Appl. Opt. 2017, 56, 854–869. [Google Scholar] [CrossRef]
  41. Bulgarelli, B.; Zibordi, G. On the detectability of adjacency effects in ocean color remote sensing of mid-latitude coastal environments by SeaWiFS, MODIS-A, MERIS, OLCI, OLI and MSI. Remote Sens. Environ. 2018, 209, 423–438. [Google Scholar] [CrossRef]
  42. De Keukelaere, L.; Sterckx, S.; Adriaensen, S.; Knaeps, E.; Reusen, I.; Giardino, C.; Bresciani, M.; Hunter, P.; Neil, C.; Van der Zande, D.; et al. Atmospheric correction of Landsat-8/OLI and Sentinel-2/MSI data using iCOR algorithm: Validation for coastal and inland waters. Eur. J. Remote Sens. 2018, 51, 525–542. [Google Scholar] [CrossRef] [Green Version]
  43. Sterckx, S.; Knaeps, S.; Kratzer, S.; Ruddick, K. SIMilarity Environment Correction (SIMEC) applied to MERIS data over inland and coastal waters. Remote Sens. Environ. 2015, 157, 96–110. [Google Scholar] [CrossRef]
  44. Vanhellemont, Q.; Ruddick, K. Turbid wakes associated with offshore wind turbines observed with Landsat 8. Remote Sens. Environ. 2014, 145, 105–115. [Google Scholar] [CrossRef] [Green Version]
  45. Vanhellemont, Q.; Ruddick, K. Atmospheric correction of Sentinel-3/OLCI data for mapping of suspended particulate matter and chlorophyll-a concentration in Belgian turbid coastal waters. Remote Sens. Environ. 2021, 256, 112284. [Google Scholar] [CrossRef]
  46. Müller-Wilm, U.; Louis, J.; Richter, R.; Gascon, F.; Niezette, M. Sentinel-2 Level-2A Prototype Processor: Architecture, Algorithms and First Results. In Proceedings of the ESA Living Planet Symposium, Edinburgh, UK, 9–13 September 2013. [Google Scholar]
  47. Fan, Y.; Li, W.; Gatebe, C.K.; Jamet, C.; Zibordi, G.; Schroeder, T.; Stamnes, K. Atmospheric correction over coastal waters using multilayer neural networks. Remote Sens. Environ. 2017, 199, 218–240. [Google Scholar] [CrossRef]
  48. Nurgiantoro, N.; Laode, M.; Kurniadin, N.; Putra, S.; Azharuddin, M.; Hasan, J.; Langumadi, Y. Assessment of atmospheric correction results by iCOR for MSI and OLI data on TSS concentration. IOP Conf. Ser. Earth Environ. Sci. 2019, 389, 012001. [Google Scholar] [CrossRef]
  49. Pereira-Sandoval, M.; Ruescas, A.; Urrego, P.; Ruiz-Verdú, A.; Delegido, J.; Tenjo, C.; Soria-Perpinyà, X.; Vicente, E.; Soria, J.; Moreno, J. Evaluation of Atmospheric Correction Algorithms over Spanish Inland Waters for Sentinel-2 Multi Spectral Imagery Data. 2019, 11, 1469. Remote Sens. 2019, 11, 1469. [Google Scholar] [CrossRef] [Green Version]
  50. Wolters, E.; Toté, C.; Sterckx, S.; Adriaensen, S.; Henocq, C.; Bruniquel, J.; Scifoni, S.; Dransfeld, S. iCOR Atmospheric Correction on Sentinel-3/OLCI over Land: Intercomparison with AERONET, RadCalNet, and SYN Level-2. Remote Sens. 2021, 13, 654. [Google Scholar] [CrossRef]
  51. Guanter, L. New Algorithms for Atmospheric Correction and Retrieval of Biophysical Parameters in Earth Observation Application to ENVISAT/MERIS Data. In Departament de Física de la Terra i Termodinàmica; Universitat de Valéncia: Valéncia, Spain, 2007; Available online: https://www.tesisenred.net/handle/10803/9877;jsessionid=402C46F935666E5FF2CEF46F057954A7.tdx2#page=1 (accessed on 3 January 2022).
  52. Berk, A.; Anderson, G.; Acharya, P.; Bernstein, L.; Muratov, L.; Lee, J.; Fox, M.; Adler-Golden, S.; Chetwynd, J.; Hoke, M.; et al. MODTRAN5, 2006 update. Defense and Security Symposium. In Proceedings of the SPIE, Orlando, FL, USA, 17 April 2006; Volume 6233. [Google Scholar]
  53. Brockmann, C.; Doerffer, R.; Peters, M.; Kerstin, S.; Embacher, S.; Ruescas, A. Evolution of the C2RCC Neural Network for Sentinel 2 and 3 for the Retrieval of Ocean Colour Products in Normal and Extreme Optically Complex Waters. In Proceedings of the Living Planet Symposium, Prague, Czech Republic, 9–13 May 2016. [Google Scholar]
  54. Kaufman, Y.J.; Sendra, C. Algorithm for automatic atmospheric corrections to visible and near-IR satellite imagery. Int. J. Remote Sens. 1988, 9, 1357–1381. [Google Scholar] [CrossRef]
  55. Wei, J.; Lee, Z.; Shang, S. A system to measure the data quality of spectral remote-sensing reflectance of aquatic environments. J. Geophys. Res. Ocean 2016, 121, 8189–8207. [Google Scholar]
  56. Müller, D.; Krasemann, H.; Brewin, R.J.W.; Brockmann, C.; Deschamps, P.-Y.; Doerffer, R.; Fomferra, N.; Franz, B.A.; Grant, M.G.; Groom, S.B.; et al. The Ocean Colour Climate Change Initiative: I. A methodology for assessing atmospheric correction processors based on in situ measurements. Remote Sens. Environ. 2015, 162, 242–256. [Google Scholar] [CrossRef] [Green Version]
  57. Kruse, F.A.; Lefkoff, A.B.; Boardman, J.W.; Heidebrecht, K.B.; Shapiro, A.T.; Barloon, P.J.; Goetz, A.F.H. The spectral image processing system (SIPS)—interactive visualization and analysis of imaging spectrometer data. Remote Sens. Environ. 1993, 44, 145–163. [Google Scholar] [CrossRef]
  58. Ilori, C.O.; Pahlevan, N.; Knudby, A. Analyzing Performances of Different Atmospheric Correction Techniques for Landsat 8: Application for Coastal Remote Sensing. Remote Sens. 2019, 11, 469. [Google Scholar] [CrossRef] [Green Version]
  59. Ruescas, A.; Pereira-Sandoval, M.; Tenjo, C.; Ruiz-Verdú, A.; Steinmetz, F.; De Keukelaere, L. Sentinel-2 atmospheric correction inter-comparison over two lakes in Spain and Peru-Bolivia. In Proceedings of the Colour and Light in the Ocean from Earth Observation (CLEO) Workshop, Frascati, Italy, 6–8 September 2016. [Google Scholar]
  60. Sterckx, S.; Knaeps, E.; Ruddick, K. Detection and correction of adjacency effects in hyperspectral airborne data of coastal and inland waters: The use of the near infrared similarity spectrum. Int. J. Remote Sens. 2011, 32, 6479–6505. [Google Scholar] [CrossRef]
  61. Doron, M.; Bélanger, S.; Doxaran, D.; Babin, M. Spectral variations in the near-infrared ocean reflectance. Remote Sens. Environ. 2011, 115, 1617–1631. [Google Scholar] [CrossRef]
  62. Guanter, L.; Alonso, L.; Moreno, J. First Results From the PROBA/CHRIS Hyperspectral/Multiangular Satellite System Over Land and Water Targets. IEEE Geosci. Remote Sens. Lett. 2005, 2, 250–254. [Google Scholar] [CrossRef]
Figure 1. Maps of measurement locations for two coastal areas: French Guiana (top); English Channel (bottom).
Remotesensing 14 01099 g001aRemotesensing 14 01099 g001b
Figure 2. The different configurations of the extraction box for the match-up exercise. The red circles correspond to the location in situ stations and the brown squares are the extracting boxes for retrieving data.
Remotesensing 14 01099 g002
Figure 3. Scatter plots of the estimated (y-axis) vs in situ (x-axis) Rrs for the seven atmospheric correction algorithms at 443 nm, 490 nm, 560 nm, and 665 nm. The dotted line is the 1:1 line and solid lines present the linear regression between the AC retrievals and the field measurements Rrs.
Remotesensing 14 01099 g003
Figure 4. Variation in the statistical parameters with the wavelength on the individual match-ups dataset. From left to right, up to bottom: RE, Bias, R2.
Remotesensing 14 01099 g004
Figure 5. Scatter plots of the estimated (y-axis) vs in situ (x-axis) Rrs for the seven atmospheric correction algorithms at 443 nm, 490 nm, 560 nm, and 665 nm. The dotted line is the 1:1 line and solid lines present the linear regression between the AC retrieval and the in situ Rrs.
Remotesensing 14 01099 g005
Figure 6. Variation in the statistical parameters with the wavelength on the common match-ups dataset. From left to right, up to bottom: RE, Bias; R2.
Remotesensing 14 01099 g006
Figure 7. Summary of statistics of normal extraction method (the middle), the tested down-shifted box (the lower), and right-shifted box (the upper). (Left column): RE; (middle column): Bias; (right column): R2.
Remotesensing 14 01099 g007
Figure 8. Example of an inhomogeneous pixel scene processed with NASA’s atmospheric correction processor in the Eastern English Channel on 21 September 2016. In situ measurement is presented as Pin 1.
Remotesensing 14 01099 g008
Figure 9. The example satellite image of Sentinel-2 at band 10 (1375 nm) over French Guiana on 28 November 2016. The cloud, cirrus, or haze covers all of the images.
Remotesensing 14 01099 g009
Table 1. The spatial resolution of MSI on-board SENTINEL-2 satellite.
WavelengthSpatial Resolution
443 nm60 m
490 nm10 m
560 nm10 m
665 nm10 m
705 nm20 m
740 nm20 m
783 nm20 m
842 nm10 m
865 nm20 m
940 nm60 m
1375 nm60 m
1610 nm20 m
2190 nm20 m
Table 2. Date (dd/mm/yyyy) and time (UTC) of Sentinel-2 satellite observations selected from 2016 to 2018 in 2 regions, English Channel and French Guiana.
OrderIn SituSatellite
DateTimeS2AS2B
121 September 201610:12:0010:57:32
221 September 201609:20:0010:57:32
321 September 201609:50:0010:57:32
421 September 201610:12:0010:57:32
521 September 201611:20:0010:57:32
611 October 201609:50:0010:59:52
711 October 201609:00:0010:59:52
811 October 201609:50:0010:59:52
928 November 201613:20:0014:00:52
1028 November 201613:53:0014:00:52
1128 November 201614:29:0014:00:52
1228 November 201615:09:0014:00:52
1319 January 201711:15:0011:03:51
1419 January 201710:16:0011:03:51
1519 January 201710:45:0011:03:51
1619 January 201710:55:0011:03:51
1719 January 201711:15:0011:03:51
1829 April 201711:40:0010:56:51
1929 April 201712:25:0010:56:51
206 July 201713:30:0014:00:51
216 July 201714:13:0014:00:51
226 July 201715:24:0014:00:51
231 July 201715:30:00 14:00:49
2419 April 201811:38:00 10:56:19
2530 April 201810:33:0011:21:21
2618 July 20189:53:00 11:00:39
2723 July 201810:30:0010:56:21
2826 July 201812:54:0011:06:21
Table 3. Location, number of days, stations, and potential match-ups by areas.
Study AreasDaysStationsPotential Match-Up
English Channel164322
French Guiana14608
Total3010330
Table 4. Number of match-ups for four visible MSI bands of all ACs in all match-ups case.
iCORACOLITEC2RCCSen2CorPolymerNASA-ACOC-SMART
443 nm22162122211521
490 nm22162022211521
560 nm22162122221722
665 nm2113172122922
Table 5. Value of RE, Bias, and R2 for different ACs and different bands. The bold number correspond to the best statistical performance per wavelength and per statistical parameters.
RE (%)Bias (%)
443 nm490 nm560 nm665 nm443 nm490 nm560 nm665 nm
iCOR114.8173.0348.03118.44107.2366.0343.06112.94
ACOLITE58.2439.7838.0088.0452.9322.1719.5042.47
C2RCC36.6134.4528.4452.50−8.52−3.1117.0513.67
Sen2Cor119.6973.0851.7289.48118.5761.8047.2281.54
Polymer38.8035.9030.3548.91−13.39−2.312.7410.31
NASA-AC31.6036.3728.9056.30−3.59−11.251.9331.30
OC-SMART27.6330.0032.1947.85−2.41−2.84−6.415.88
R2
443 nm490 nm560 nm665 nm
iCOR0.440.560.770.86
ACOLITE0.550.620.630.74
C2RCC0.400.610.780.88
Sen2Cor0.360.410.510.61
Polymer0.570.720.800.92
NASA-AC0.280.500.720.94
OC-SMART0.690.740.800.92
Table 6. Value of QAS, χ2, SAM and Stot for different ACs (N is the number of match-ups). The bold number correspond to the best statistical performance per statistical parameters.
BoxQASχ2 (%)SAM Stot
iCOR0.650.389.357.70
ACOLITE0.880.127.0714.52
C2RCC1.000.148.7613.31
Sen2Cor0.580.279.592.01
Polymer0.870.075.9914.90
NASA-AC0.940.044.9914.36
OC-SMART0.870.044.4416.89
Table 7. Number of match-ups for 4 visible MSI bands of all ACs in common match-ups case.
iCORACOLITEC2RCCSen2CorPolymerNASA-ACOC-SMART
443 nm14141414141414
490 nm14141414141414
560 nm16161616161616
665 nm7777777
Table 8. Value of QAS, χ2, SAM and Stot for different ACs (N is the number of match-ups). The bold number correspond to the best statistical performance per statistical parameters.
BoxQASχ2 (%)SAM Stot
iCOR0.890.0464.953.37
ACOLITE1.000.0565.4413.26
C2RCC1.000.1499.7714.11
Sen2Cor0.790.0686.704.19
Polymer0.890.0766.1413.74
NASA-AC1.000.0384.7317.13
OC-SMART0.820.0454.5914.76
Publisher’s Note: MDPI stays neutral with regard to jurisdictional claims in published maps and institutional affiliations.

