
The Characteristics and Evaluation of Future Droughts across China through the CMIP6 Multi-Model Ensemble


1
School of Geography and Tourism, Anhui Normal University, Wuhu 241002, China
2
Academy of Disaster Reduction and Emergency Management, Faculty of Geographical Science, Beijing Normal University, Beijing 100875, China
3
Key Laboratory of Environmental Change and Natural Disaster, Ministry of Education, Beijing Normal University, Beijing 100875, China
*
Author to whom correspondence should be addressed.
Remote Sens. 2022, 14(5), 1097; https://doi.org/10.3390/rs14051097
Submission received: 4 January 2022
/
Revised: 19 February 2022
/
Accepted: 21 February 2022
/
Published: 23 February 2022
(This article belongs to the Topic Climate Change and Environmental Sustainability)
Abstract
:Understanding historical and future drought patterns is crucial to acclimation and the mitigation of drought. The negative impact of China’s droughts on the social economy has attracted attention; however, there is still no comprehensive or long-term monitoring pattern for future droughts. Here we evaluated the precipitation and temperature simulation capability of Coupled Model Intercomparison Project Phase 6 (CMIP6) and evaluated the temporal and spatial pattern of droughts during 1961–2099 across China. The results show that the multi-model ensemble mean (MME) is more representative of the observed precipitation and temperatures across China than the single climate model. China experienced an overall drying trend in the historical period. After 1991, the drought frequency (DF), drought duration (DD), and drought intensity (DI) in the northwest of the Inland River Basin and in the Yangtze River Basin increased significantly. Compared with the historical period, China will suffer more frequent drought events, although the DD and DI will be weakened under SSP1-2.6 and SSP2-4.5, while China will experience longer DD and more serious drought events under SSP3-7.0 and SSP5-8.5. The Hai River Basin and Huai River Basin are expected to have more serious drought trends in summer. Compared with historical periods, the drought trend will increase by 2.9–5.7 times and 1.1–4.2 times, respectively. The results can be used for decision making regarding future drought control.
1. Introduction
The Intergovernmental Panel on Climate Change (IPCC, 2021) in its 6th Assessment Report reported that the global surface temperature (GST) was 1.09 °C (0.95–1.20 °C) higher in 2011–2020 than that in 1850–1900. An accelerated hydrological cycle can be expected in the context of global warming [1,2], which may potentially increase the frequency and/or intensity of climate extremes, such as floods and droughts, at regional and global scales [3,4]. Global economic losses caused by droughts have been estimated to be as high as USD 6–8 billion annually, which is considerably higher than those caused by other meteorological disasters. In the past 50 years, thousands of people have died from the increase in extreme climate incidents around the world, mainly resulting from climate change, such as the flood on the Yangtze River Basin in 1998 [5], the heat wave in Eastern China in 2013 [6], the extreme snowfall anomaly over the northeast Tibetan plateau in early winter, 2018 [7], and the extreme rainstorm event on 20 July 2021 in Zhengzhou [8]. Furthermore, severe, and extreme drought events have occurred frequently in China, causing huge social and economic losses [9]. Therefore, evaluating the ability of precipitation and temperature simulation and drought prediction is of great significance for sustainable development in China [10,11,12].
The Coupled Model Intercomparison Project (CMIP) was published by the World Climate Research Program (WCRP) to promote global circulation model (GCM) data sharing and comparison [13,14,15,16]. Compared with CMIP phase 5 (CMIP5), CMIP phase 6 (CMIP6) is the new start year for the new GCM and future scenarios (CMIP6 in 2015 and CMIP5 in 2006), and incorporates a new scenario for concentration, emission, and LUCC (Land Use/Cover Change) [17]. Compared with CMIP5, CMIP6 can reveal past, present, and future climate changes that are caused by natural, unforced changes [16]. Previous studies have confirmed that the CMIP5 multi-model ensemble (MME, mean precipitation, and temperature from 27 CMIP6 climate models) can simulate the spatial patterns of precipitation and temperature [18,19]. In addition, the CMIP6 framework design develops the Representative Concentration Pathways (RCP) into Shared Socio-Economic Pathways (SSP), which are very suitable for investigating future climatic variation across China and forecasting drought.
In China, many researchers have also paid close attention to the assessment of meteorological drought, especially at regional and basin scales. A series of earlier studies found that the arid zone from southwest to northeast China will continue to show a dryness trend under the RCP4.5 (i.e., scenario in which the total radiation forcing is stable at 4.5 W/m2 after 2100) [20]. It is expected that the future drought in the Pearl River Basin (PRB) (2016–2100) will be more serious than the historical drought (1960–2015) [21]. The drought frequency (DF) and intensity (DI) in most regions of China will increase significantly, and China will face a more serious drought crisis when the total radiation forcing reaches 4.5 W/m2 and 8.5 W/m2 after 2100, especially in northwest China [22]. Most parts of China are expected to suffer more serious droughts with a longer drought duration (DD) from 2021 to2100 under the RCP4.5 [23]. In previous studies, CMIP5 climate models were mostly used for drought forecasting; however, CMIP6 climate models have rarely been used for drought forecasting across China. Although some previous studies have used CMIP6 climate models to forecast drought across China, only four climate models were selected and the climate simulation capabilities of CMIP6 climate models were not evaluated [24], which increased the uncertainty of the drought forecast. Since great spatial differences in droughts exist across China, selecting 27 CMIP6 climate models to calculate MME has important practical significance for drought forecasting.
The general increase in drought events has drawn the utmost attention worldwide. Numerous studies have emphasized the evolution of drought characteristics under different RCP scenarios, whereas negligible effort has been paid to exploring the evolution of drought characteristics under different SSP scenarios. This study aims to evaluate the simulation ability of the precipitation and temperature simulation capability (including spatial and temporal characteristics) of the upgraded GCM outputs from CMIP6, and to clarify the future drought evolution under different SSP scenarios. This study focuses on quantitative evaluation changes in anticipated drought characteristics across China considering the influential effects of different SSP scenarios. Specifically, the following issues are focused on: (1) assessing the precipitation and temperature simulation capability of 27 CMIP6 climate models and MME using a Taylor diagram; (2) investigating the historical drought characteristics (DF, DD, DI) and trends (1961–2014) across China; (3) projecting and evaluating future drought from 2015 to 2099 under different SSP scenarios; and (4) analyzing the differences in drought characteristics and trends between the historical and future periods. The results of this study can be used as an important reference for the development of drought warning systems, drought risk assessments, and agricultural regional planning across China.
2. Materials and Methods
2.1. Study Area
This study was conducted in China (18–54° N, 73–135° E) (Figure 1). The region contains a large land area of approximately 9.6 million km2 and a population of >1.4 billion. To reveal the differences in drought spatial changes in nine basin sub-regions, we divided the study area into nine sub-regions based on the standard of the Chinese Academy of Sciences: Songliao River Basin (SLRB), Hai River Basin (HARB), Huai River Basin (HURB), Yellow River Basin (YRB), Inland River Basin (IRB), Yangtze River Basin (YZRB), PRB, Southeast River Basin (SERB), and Southwest River Basin (SWRB).
2.2. Materials
In this study, the observed data from meteorological stations and simulated data of the upgraded GCM outputs from CMIP6 were used. The historical monthly observations, including temperature and precipitation, used in this paper are available via http://www.nmic.cn/ (accessed on 3 January 2022), and provide long-term and reliable information on the precipitation and temperature status across China with a 0.5° resolution from 1961 to 2014. This dataset was used to assess the applicability of 27 CMIP6 climate models and their averages (MME) across China.
Monthly gridded precipitation and temperature data (Table 1) of 27 CMIP6 climate models for historical periods (1850–2014) and future periods (2015–2100) were obtained from the Earth System Grid Association (https://esgf-node.llnl.gov/search/cmip6/ (accessed on 3 January 2022)). Here, the SSP is a combination of the Representative Concentration Pathways (RCP) and alternative pathways of socioeconomic development [16,17]. The selected SSP are considered as combinations of low societal vulnerability with a low emission level (SSP1-2.6), medium societal vulnerability with a medium emission range (SSP2-4.5), relatively high societal vulnerability with a medium-high forcing range (SSP3-7.0), and higher emissions that impose high mitigation but low adaptation challenges (SSP5-8.5) [25]. By considering the difference in resolution between the models and referring to previous studies, a bilinear interpolation was used to convert the CMIP6 model datasets to a 0.5° resolution [26,27]. The monthly simulations of historical periods (1961–2014) and future periods (2015–2099) from CMIP6 climate models were selected for the follow-up study.
2.3. Methods
2.3.1. SPEI
Previous studies have confirmed that a single numerical value calculated by multiple atmospheric variables is more valuable than the original value for the quantitative evaluation of the drought level [28]. The Standardized Precipitation Evapotranspiration Index (SPEI) was proposed by Vicente Serrano et al. [28] based on the advantages and limitations of the Standardized Precipitation Index (SPI) [29] and the Palmer Drought Severity Index (PDSI) [30]. SPEI is designed to consider both precipitation and temperature, and it also considers the impacts of potential evapotranspiration on drought (which PDSI pays attention to) and the multi-time scale characteristics of SPI. It is one of the most widely used indicators in the monitoring and quantitative description of meteorological drought, and SPEI has been successfully applied and been proved to investigate the spatio-temporal pattern of drought across China [9,31,32,33,34]. First, Vicente Serrano et al. [30] calculated the potential evapotranspiration (PET) via the Thornthwaite [35] method. Secondly, the difference sequences between monthly precipitation and PET were obtained. Finally, D was fitted by loglogistic distribution. SPEI can be calculated on different time scales, which represent the water surplus and deficit of the first N months [36]. The specific calculation process of SPEI is provided elsewhere [29]. The smaller the SPEI value, the more arid and water-deficient the region [29]. Conversely, the larger the value, the wetter the region [37]. Categories of the drought based on the SPEI are shown in Table 2 [38].
2.3.2. Drought Characterization
The 1-month SPEI is usually used to reflect meteorological drought. Changes in soil moisture are better reflected with a 3-month SPEI, and the 6–24-month SPEI reflects the long-term variation of the run-off, groundwater, and freshwater storage [39]. In this paper, we applied the 3-month timescale SPEI to depict the relative short-term variations in the surface soil moisture content and the seasonal differences in drought, which matched China’s agricultural production.
After calculating the 3-month timescale SPEI (SPEI03), drought characteristics can be derived from the run theory, which is a method of analyzing time series [40]. The traditional run theory ignores the fact that severe drought events may be blended with a few non drought phenomena, causing one “serious drought event” to be divided into several “small drought events”, which weakens the impact of the actual drought [41]. Hence, a three-threshold run theory proposed by He et al. [11] was applied to identify the drought characteristics. Drought events were analyzed through four drought characteristics. They are defined below: DD is the persistent time of a drought event, calculated as the timespan between the initiation time and the termination time of a drought event [31]; number (N) is the number of droughts experienced every year, DI is the absolute value of the accumulated sum of all SPEI values in a drought event; and drought frequency (DF) is the proportion of drought months in the total months [42].
Three thresholds were set as 0, −0.5, and −1, respectively. The identification process of the drought events was as follows (Figure 2):
Step 1. When the SPEI was <−0.5, we first preliminarily judged that a drought occurred in that month. In the shaded part of Figure 2, it can be seen that there were 10 months of drought.
Step 2. Then, for the drought event that lasted for 1 month, when the SPEI was >−1, we considered that no drought occurred in that month and excluded it, e.g., the blue shaded portion in Figure 2.
Step 3. Finally, for the case that the interval between two adjacent drought events was 1 month, when the SPEI of that month was <0, the two drought events were combined into one drought event, the DI was the absolute value of SPEI cumulative associated with drought events, and the DD was the sum of the durations of the two drought events + 1, e.g., the first drought event in Figure 2. Otherwise, it was recognized as two independent drought events, e.g., the third and fourth drought events in Figure 2.
2.3.3. Simulation Assessment
The MME is the mean of the precipitation and temperature from 27 CMIP6 climate models and has been applied universally in the simulation and forecast of future climatic variation, because it is able to offset the deviation of a single model to a certain extent [19]. Meanwhile, previous studies have confirmed that the application of CMIP5 MME has produced more outstanding simulations than a single model [19,43].
Standardized Taylor diagrams were applied to evaluate the applicability of CMIP6 models by comparing the differences with the observations from meteorological stations using the correlation coefficient (R), standard deviation (SD), and root mean square error (RMSE) between the simulations (σs) and observations (σo) [43,44].
In Equations (1)–(3), the SD and RMSE of the observations and simulations are divided by the standard deviation of the observations, so that SD = 1 and RMSE = 0 of observations. The purpose was to eliminate the physical quantity unit of each model. The larger the R, the higher the correlation between the simulations and the observations. On the contrary, the larger the RSME, the greater the deviation between the simulations and the observations. However, the closer the SD of each model was to 1, the closer it was to the observations. It is worth noting that SD and RMSE values provided in this study were standardized results.
2.3.4. Mutation Test for Historical SPEI
We applied the Mann–Kendall mutation test to identify whether there were mutations in the historical SPEI from 1961 to 2014 and to determine the time of the mutations. Mann–Kendall is a nonparametric method [45] which constructs a positive sequence (UF) and an inverse sequence (UB) using Equation (4) and judges the change trend and mutation according to the curve of positive and inverse sequence statistics.
In Equation (4), the rank sequence SK is the cumulative number of values at time i greater than the number of values at time j. UF1 = 0. E(Sk) and Var(Sk) are the mean and variance of the SK. When x1, x2, …, xn are independent of each other and have the same continuous distribution, they can be calculated by Equations (5) and (6):
Repeat the above process in the reverse order of time series (xn, xn−1, …, x1) and make UBk = –UFk (k = n, n − 1, …, 1, UB1 = 0). In the current study, the statistical sequence UFk was an analysis result of the historical SPEI from 1961 to 2014, and UBk was that from 2014 to 1961. When UFk or UBk > 0, the sequence shows an upward trend. When UFk or UBk < 0, the sequence shows a downward trend. When UFk or UBk exceeded the 0.05 confidence interval, it indicates that the upward or downward trend is significant. The range beyond the 0.05 confidence interval is determined as the time where the mutation occurs. If UFK and UBK curves intersect and the intersection is between the 0.05 confidence interval, the time corresponding to the intersection is the start time of the mutation.
2.3.5. Trend Analysis and Significance Test
Sen’s trend analysis is a robust non-parametric statistical method for detecting trends and is widely used for meteorological, hydrological, and vegetation data [46]. A key advantage of this slope method is that it does not need to follow a certain distribution and is calculated using Equation (7) [46].
The Mann–Kendall significance test, which has been found to enable a robust quantification of trends in hydro-meteorological series [47,48], was employed. Further details regarding the Mann–Kendall significance are provided in Daufresne et al. [49]. Sen’s trend analysis was used to understand the SPEI changes; however, it was not possible to determine whether the SPEI change was significant. Therefore, areas with significant changes in SPEI were identified by the Mann–Kendall significance test. The statistics were expressed by Z values. The SPEI change trend passed the significance test when |Z| > 1.96.
3. Results
3.1. Assessment of CMIP6 Climate Models
Firstly, we calculated the R, RMSE, and SD of 27 CMIP6 climate models and their averages (MME) pixel-wise, and constructed Taylor diagrams, which are shown in Figure 3. There was a large difference in the precipitation simulation performance between all climate models, but a small difference in the temperature simulation. The majority of the models reflected the spatial distribution of the observations, with R ranging from 0.3 to 0.6 (0.96–0.97) for precipitation (temperature), and with the SD of simulations similar to the observations in temperature. However, the historical MME values were closer to the observations than the simulations of the 27 CMIP6 climate models, with R for precipitation (temperature) of 0.71 (0.98) (p < 0.01). The SD and RMSE of the MME were also closer to the observations than that of the 27 CMIP6 climate models. These results demonstrate that the MME had a strong representativeness in the simulation of monthly temperature and precipitation in the historical period across China.
Taylor diagrams can only evaluate the overall regional simulation capability of precipitation and temperature. Therefore, we also selected four climate models with better simulation capabilities to evaluate the spatial R and RMSE of the simulations and observations according to the results of the Taylor diagrams. Figure 4 shows the spatial R and RMSE between the monthly observations and simulations from 1961 to 2014. The R between the precipitation of the four climate models and the observations was low in the northwestern IRB, followed by those in most of the southern YZRB. However, compared with the CMIP6 climate models, the R value between the MME-simulated precipitation and the observed precipitation increased, especially in most regions south of the YZRB, and R increased to > 0.6. Meanwhile, R was >0.8 in southwest and northeast China (Figure 4(a1–a4)). The temperatures of the four climate models were highly correlated with the monthly observations across China. However, compared with the four climate models, the R of the MME-simulated temperature and observed temperature increased, and the R of MME showed an increasing trend from the south to the north (Figure 4(b1–b4)).
The spatial distribution of precipitation between the four climate models and the observations exhibited few differences in northeast and southwest China, with RMSE values < 1. However, there were greater differences for the observations in northwest China, with RMSE values > 2.5. Compared with the CMIP6 climate models, the RMSE of precipitation simulated by MME was significantly lower, whereby only the RMSE of precipitation in the northwest edge of China was >2.5 (Figure 4(c1–c4)). The spatial distribution for temperature between the four climate models and the observations exhibited greater differences in southwest China, with RMSE values > 1 (Figure 4(d1–d4)). In general, the precipitation and temperature simulated by MME had good applicability across China and could be used to evaluate the historical and future drought characteristics under different SSP scenarios.
3.2. Assessment of Historical Droughts
3.2.1. Historical Drought Characteristics across China
We first utilized Mann–Kendall tests to perform a mutation test on SPEI03 calculated by MME. Then, the UF curve rapidly decreased from 1983 and passed the 0.05 confidence level in 2000, which confirmed that drought was aggravated across China. The intersection of UF and UB that occurred in the confidence level indicated a mutation, and we distinguished 1991 as the starting time of the mutation according to the location of the intersection, which divided the historical period into two stages (Figure 5a). Figure 5b–d show the differences between the changes in the DF, DD, and DI between 1961–1990 and 1991–2014. It can be seen from Figure 5b that drought were common in droughts across China. In particular, larger increasing magnitudes of the DF were identified in the YZRB, and changes in DD and DI followed similar spatial patterns (Figure 5c,d). It is worth noting that the DF, DI, and DD increased in northwest IRB and YZRB. From 1961 to2014 (Figure 5e–g), the pixel means of the DF, DD, and DI across China were 8.5 times/10a, 4.4 months/time, and 4.9/time, respectively, indicating that drought events occurred frequently, continued for a long time, and had high DI across China. In addition, northwest IRB was prone to seasonal drought with long DD and high DI, that southwest and northeast China were prone to seasonal drought with high DF and low DI, and areas near the midstream and downstream of the YZRB were prone to seasonal drought with long DD and low DI.
Figure 6a–c show the differences in the changes in the frequency of moderate, severe, and extreme drought between 1961–1990 and 1991–2014. It can be seen from Figure 6a–c that the spatial patterns of frequency of moderate, severe, and extreme drought caused by mutation were basically the same. Larger increasing magnitudes in the frequency of moderate, severe, and extreme drought were found in northwest IRB, midstream and downstream of the YZRB, PRB, and SERB, and most notably extreme drought in south China. Figure 6d–f show the total DF of different categories across China from 1961–2014, where it is evident that spatial differences existed in total DF of different categories. Moderate drought across China was concentrated between 8 and 13%, where the DF in northwest IRB, midstream and downstream of the YZRB was generally >10%, indicating that moderate drought events occurred frequently in these areas (Figure 6d). The frequency of moderate drought in the YZRB was higher than that in other basins, indicating that although there was sufficient rainfall in the YZRB, short-term rainfall deficiency was more likely to cause moderate drought. A higher frequency of severe drought was found in the IRB. It is worth noting that higher frequencies of extreme drought were observed in the upstream of the YZRB, the upstream of the YRB, southwest China, and southeast China, where the frequencies of extreme drought were >2%. The uneven distribution of DF across China was mainly affected by the uneven spatial distribution of temperature and precipitation.
3.2.2. Historical Drought Trends across China
To investigate the evolutionary rules of drought, Sen’s trend analysis and the Mann–Kendall method was applied to understand the trend of historical droughts in four seasons from 1961–2014. The spatial patterns of the drought trend are shown in Figure 7, in which the significance level for the Sen’s trend is indicated by triangular symbols. The SPEI03 shows the obvious spatial differences in spring, decreasing in 67.90% of the pixels with significant decreases in 30.48% of the area, mainly in midstream and downstream areas of the YZRB, PRB, and the SERB (Figure 7a). Obvious wetting for spring was found mainly in southwest IRB and northern SLRB. Different from spring, the SPEI03 violently changed in the summer and autumn, and the regions with significant changes account for 70.64% and 82.13% of the area, respectively, indicating that the drought trend was aggravated in these two seasons (Figure 7b,c). Obvious wetting for winter was found mainly in northern SLRB and south IRB, whereas there remained a significant drought trend in south China. Surprisingly, SPEI03 decreased significantly in south China during all seasons.
3.3. Future Drought under the Investigated SSP Scenarios
3.3.1. Future Changes in Drought Characteristics across China
Figure 8 shows the drought characteristics calculated by SPEI03 across China for the different SSP scenarios. For comparisons among the SSP scenarios from 2015–2099, a lower DF, a longer drought DD, and a more serious DI across China correspond to the higher emission scenarios. Surprisingly, the drought DD in the PRB, SERB, and northwest IRB continue for >6 months/time under the SSP5-8.5 scenario, indicating that these areas are prone to continuous seasonal drought under the high emission scenarios. In addition, comparing the drought characteristics of the different SSP scenarios, the DD and DI under high emission levels are much greater than those under low emission levels.
Figure 9 shows the spatial pattern of differences in the drought characteristics across China between the future period (2015–2099) and historical period (1961–2014) under all scenarios. A higher DF will occur in the future periods for all scenarios in the SLRB, SWRB, and midstream and upstream of the YZRB. Interestingly, with the enhancement of radiative forcings, IRB, PRB, HURB, SERB, and downstream of the YZRB will suffer from drought events with a longer DD and a greater DI compared with the historical periods. In most regions of China, the DD and DI will increase under the SSP3-7.0 and SSP5-8.5; however, different situations will be found in the midstream of the YZRB. Although there is consistency in the spatial patterns (Figure 9), the anticipated changes in drought characteristics will be more significant in the IRB, PRB, SERB, and HURB. The regional mean DF across China was estimated to be approximately 8.5, 9.1, 8.9, 8.5, and 7.9 times/10a for the historical period and the four scenarios, respectively. The regional mean DDs across China were estimated to be approximately 4.4, 4.2, 4.3, 4.6, and 4.9 months/time for the historical period and the four scenarios, respectively. The regional mean drought intensities for all of China were estimated to be approximately 4.9, 4.5, 4.7, 5.2, and 5.8/time for the historical period and the four scenarios, respectively. It can be seen that compared with the historical period, under the low and medium emission scenarios, China will suffer more frequent drought events, and the DD and DI will be weakened, whereas China will suffer a longer DD and more serious drought events under the medium-high and higher emission scenarios.
The differences of DF in different grades across China under the four scenarios are shown in Figure 10. Under the SSP5-8.5 scenarios, the total DF (i.e., the sum of the frequencies of moderate, severe, and extreme drought), which is >17%, was higher. For comparison among the SSP scenarios from 2015–2099, a higher extreme DF corresponded to the higher emission scenarios in the southeast of China, southwest of IRB, YRB, and HURB, and the extreme DF reached >2% whereas the opposite results were found in the northwest IRB, with a frequency of <2%. A higher severe DF occurred in the northwest IRB in the higher emission scenario. These results show that the DF across China under SSP5-8.5 was higher than that in other scenarios, especially for extreme and severe droughts.
The differences in the changes of DF in the different grades across China between the future period (2015–2099) and historical period (1961–2014) under all scenarios are shown in Figure 11. The frequency of extreme drought in the midstream of the YZRB and IRB decreases. The regional averaged frequencies of total drought (i.e., the sum of the frequencies of moderate, severe, and extreme drought) across China were estimated to be approximately 17.4, 15.8, 16.4, 16.7, and 17.4% for the historical period and the four scenarios, respectively, which are lower than those from the historical period. Hence, it is expected that the number of droughts in future across China will be less than in historical periods, while the frequency of extreme drought in future is expected to increase in most sub-regions compared with the future period.
3.3.2. Trend of Future Droughts across China
Figure 12 shows the spatial distribution of seasonal variation during 2015–2099 under all scenarios. It is evident that there is a decline in the future SPEI in spring, summer, and autumn for the majority of northern China under all the scenarios, indicating an intensification of drought in northern China over the future period. Under the SSP1-2.6, the spring, summer, and autumn droughts in southern China have an obvious mitigation trend, indicating that the trend of waterlogging in the south and drought in the north of China will further expand. For other scenarios, the change in the trend of SPEI shows a similar spatial pattern. From north to south in spring, there is a staggered pattern of drying, wetting, and drying. In summer and autumn, most regions of China show a trend of drought, and only southwest China exhibits a wetness trend. In winter, there is a trend of wetting in northern China and drought in southern China. Different emission scenarios have a great impact on the drought change trend of four seasons across China, and the more obvious aridification across China corresponds to the higher emission scenarios. The SPEI’s range of change in the higher emission scenario is significantly greater than that in the lower emission scenarios, indicating that extremely climatic events are more likely to appear in the higher emission scenarios. The aridity of northern China is more serious than that of southern China, the aridity of the IRB is more serious than that of other regions, and the aridity of western plateau regions is more serious than that of the eastern plain regions, while there is a trend of wetting in the marginal areas of southwest China.
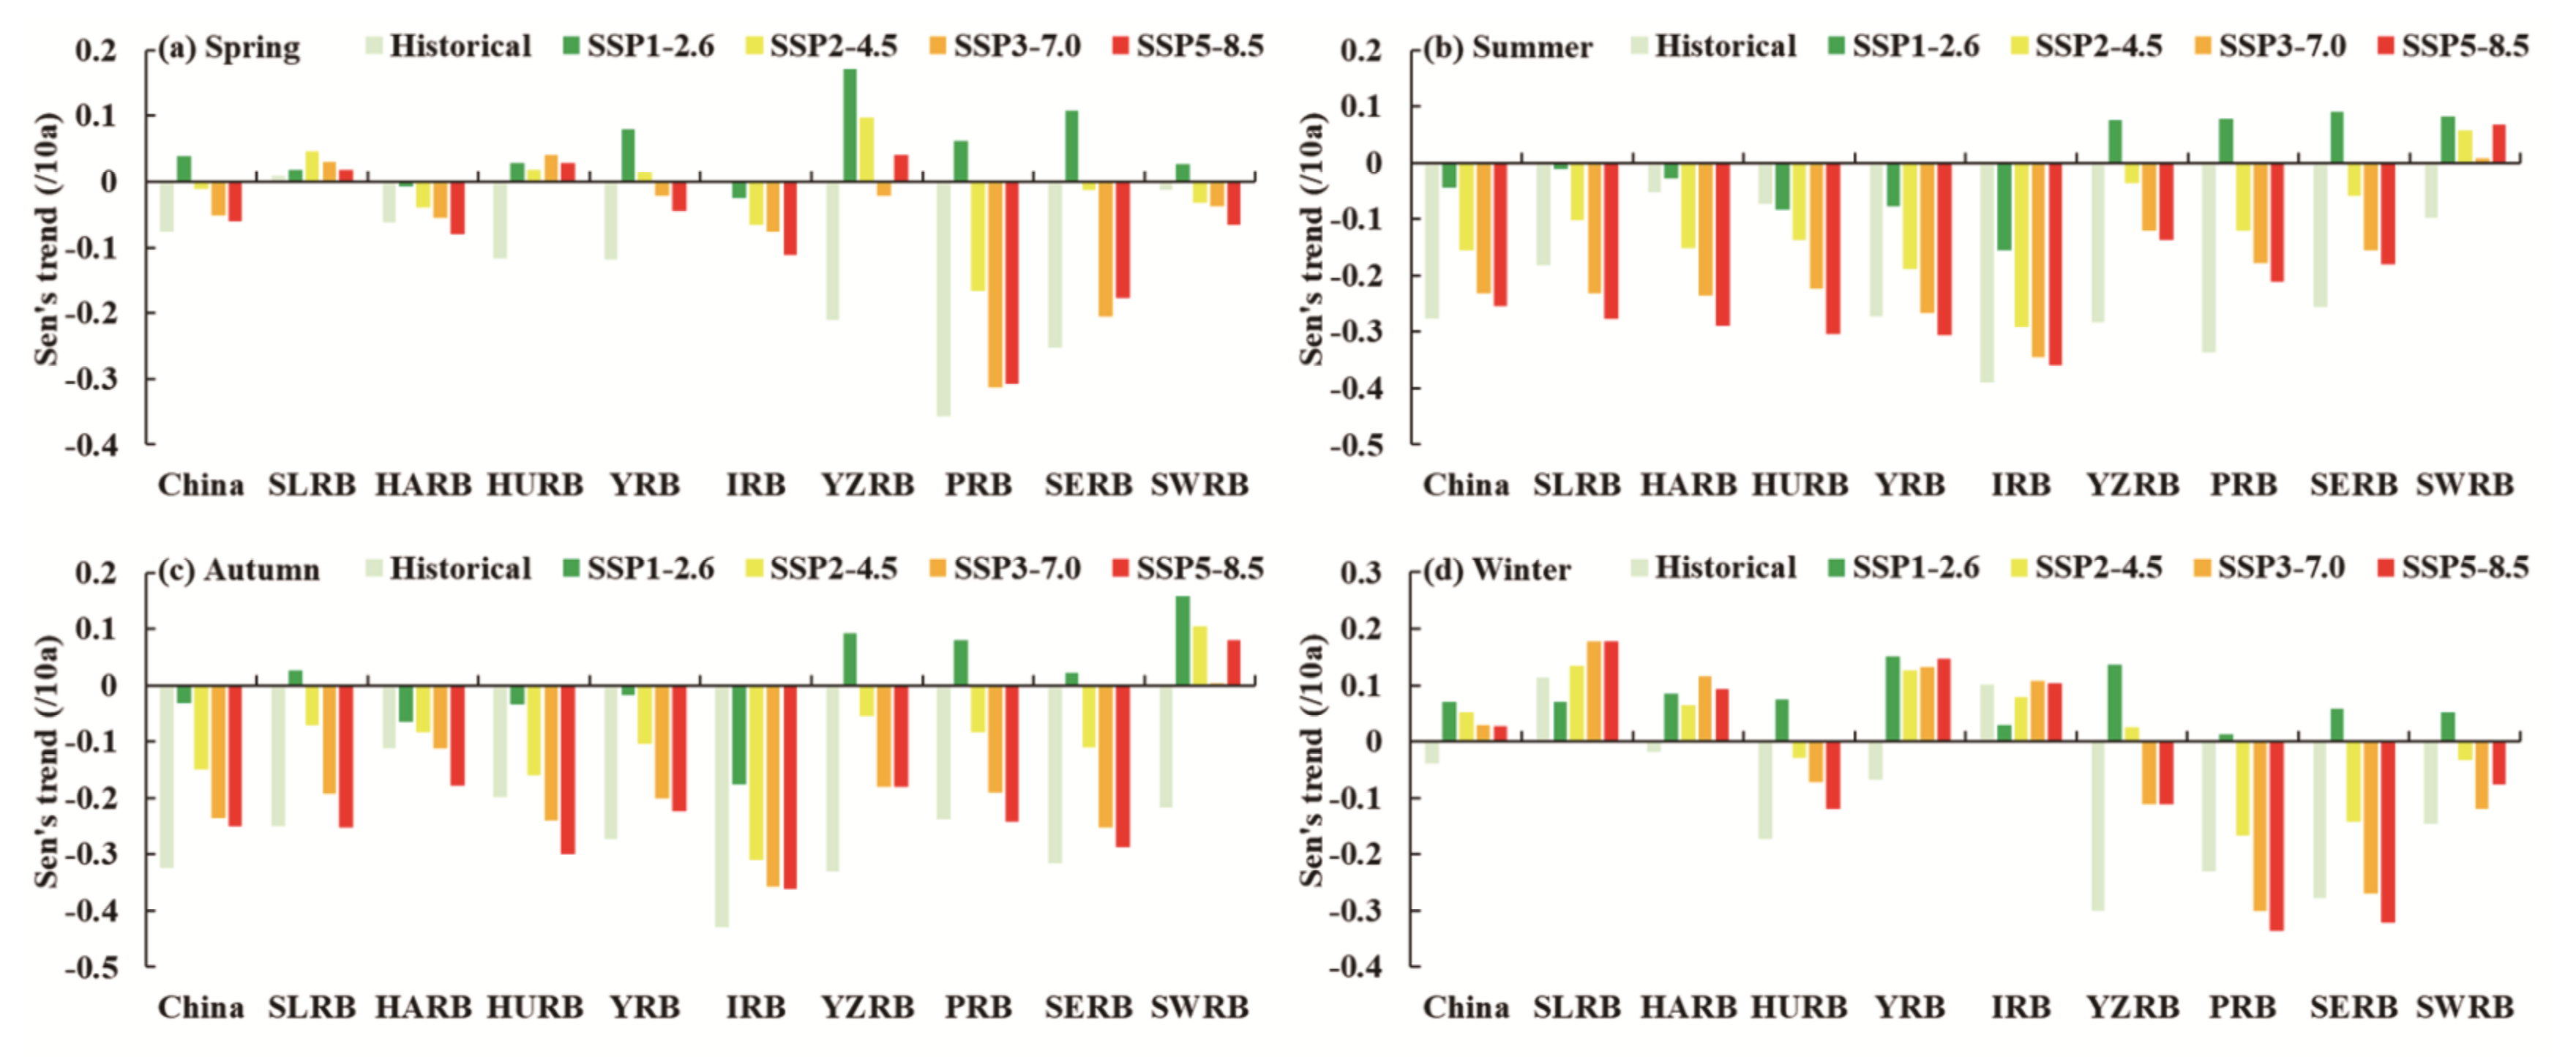
Compared with the historical period (Figure 13), it is expected that the drought trend in summer and autumn will be consistent with the historical periods across China under the medium-high and higher emission scenarios. In spring, wetting trend is a trend that will occur in the YZRB and HRB under most scenarios. Under most scenarios, a more serious drought trend in summer is expected to occur in HARB and HURB, and the drought trend is expected to increase by 2.9–5.7 times and 1.1–4.2 times, respectively. It is worth noting that the drought trend of most sub-regions is weaker than that in historical periods in autumn. However, the drought trend remains serious. In winter, a weaker drought trend is expected to occur in the YZRB. There is a higher change trend across China that corresponds to the higher emission scenarios, and the drought trend in summer and autumn is more serious than that in spring and winter.
4. Discussion
4.1. Uncertainty Analysis of the Simulation Capability of CMIP6
Studying future climate change across China is of particular importance. The present study assessed the precipitation and temperature simulation capability of CMIP6, and the drought conditions over China in different SSP scenarios both in the past and future. The MME can offset the deviation of a single model to some degree and is widely used in simulating and predicting future climate change [24,50]. The MME is more representative of observations than simulations of single-model CMIP6, which is consistent with previous CMIP5 research results. Li et al. [43] discussed the precipitation and temperature simulation capability of CMIP5 and MME and found that historical simulations of MME were more representative of observed precipitation and temperature than the single climate model. However, on this basis, we also discussed the spatial correlation and RMSE between the monthly observed data and the simulated data from 1961 to 2014. We found that compared with other regions across China, the RMSE of the single-model CMIP6 and MME was larger for precipitation in southwest China, and the RMSE of the temperature in the western China was larger. This conclusion corresponds to a previous study, which exhibited that the spatial distribution of the relative deviation of temperature and precipitation for CMIP5 MME was similar to our study [51], indicating that the regional applicability of precipitation and temperature in CMIP5 and CMIP6 was relatively consistent.
4.2. Evolution of Future Drought Characteristics
Previous studies have, through the CMIP6, indicated severe drought conditions in central and southern China, and mitigated drought conditions in northeastern and western China [52,53]. However, Naumann et al. [54] have found that the drought in arid regions is expected to increase rapidly. Su et al. [25] have also clarified that, relative to the reference period, drought events will be more frequent and severe with longer durations in the Northwest River Basin, which is consistent with our study. Furthermore, under the higher emission scenarios, the severe and extreme droughts in frequency will increase, which corresponds with the conclusion of a previous study [52,55]. Different from previous related studies, the extreme DF in southeast China, southwest of IRB, YRB and HURB is higher, while the extreme DF in the northwest IRB is lower.
Furthermore, we also found seasonal differences in future drought trends: China will alternate between dry and wet from north to south in spring, while the SPEI in summer and autumn showed that the drought trend across China will increase, and HARB and HURB are expected to experience more severe drought in summer, increasing by 2.9–5.7 times and 1.1–4.2 times relative to the historical periods. Chen et al. [56], Chen et al. [57], Han et al. [23], and Song [58] reached the same conclusion. Our results showed that under the different SSP scenarios, there will be a downward trend in the drought in southwest China. Under the low emission scenario, drought in south China exhibited a slowing trend. Han et al. [23] found that most areas of China, especially north China, the Tibetan Plateau, and southwest China, will suffer more serious drought in the future, which differs from the results of the present study. It is likely that these discrepancies are caused by using different climatic models. Compared to the CMIP5 models, CMIP6 has a better resolution, dynamic framework, and parameterization scheme [59,60]. In addition to methodological differences, all models and their climate predictions have uncertainties, especially in precipitation predictions. However, Zhu et al. [61] studied extreme climate changes in the three major river basins in China and found that under the low emission scenario, continuous drought (CDD) in southern China will show a downward trend, and the CDD will be more obvious under the higher emission scenarios. Under these four scenarios, the southwest region has the strongest humidity, which is similar to the SPEI results in summer and autumn in the present study. This implies that in the context of the higher emission scenarios, the precipitation distribution in southwest and northeast China will be more uneven in the future.
Under the higher emission scenarios, it is expected that drought in most parts of China (especially the IRB) will be more serious than in the historical period, i.e., the DD will be longer, and the DI will be greater. This may pose a threat to China’s food security. It is worth noting that in the future, the humidification of southwestern China is expected to be particularly serious compared with historical periods. Moreover, the frequency of geological disasters in southwest China is relatively high, which may lead to a more frequent occurrence of geological disasters in this region in the future. Therefore, the research results showed that in the context of global warming, the realization of the “dual-carbon” goal and sustainable development in the future is important for China’s food security and socio-economic development.
4.3. Limitation and Future Research
The present study used the latest CMIP6 model, and on the basis of precipitation and temperature simulated by the MME, calculated the SPEI predictions of future drought under different SSP scenarios. However, SPEI ignores the response of plants to climate change, which may lead to over predictions of drought, mainly because the rising atmospheric CO2 also improves stomatal conductance and plant water use and reduces actual evapotranspiration (ET). The increase in PET does not implicate the increase in ET and plant water stress [62,63]. In order to reduce the uncertainty in future drought monitoring, drought indicators should consider the response of plant transpiration to CO2 change, including a direct consideration of ET and soil moisture [63].
Furthermore, the forecast has some uncertainties for regions with more complex topography and those in the southwest. Further research into this aspect is needed to improve the accuracy of regional drought predictions. Although the model has uncertainty in the precipitation and temperature simulations, most studies have confirmed the reliability of the characteristics and trends observed by MME [64,65]. Due to differences in the spatial resolution of the 27 CMIP6 models that were selected, the resampling of each model to 0.5° × 0.5° may have overestimated or underestimated the drought impact. Therefore, future studies should focus on the use of statistical downscaling, dynamic downscaling, and bias correction methods. However, the statistical downscaling, dynamic downscaling, and bias correction methods require a higher operating memory and are suitable for basin-scale studies in order to more reasonably predict global warming conditions. In the context of global warming, the results of our study provide information that is relevant to future drought risks, water shortages, and water allocation across China.
5. Conclusions
In this study, the precipitation and temperature simulation capability of CMIP6 was evaluated using gridded precipitation and temperature data generated from meteorological stations. We confirmed that the MME was more representative of observations across China than the single climate model. The SPEI values of historical periods and different SSP scenarios were calculated by MME, and the spatiotemporal characteristics of drought across China were analyzed from various perspectives. The key conclusions are as follows:
- (1)
- In terms of historical periods, northwest IRB has been prone to seasonal drought with long DD and high DI, southwest and northeast China have been prone to seasonal drought of high frequency and low DI, and areas near the midstream and downstream of the YZRB have been prone to seasonal drought of long DD and low DI. The DF, DD, and DI in the northwest IRB and YZRB increased significantly after 1991, and the drought trend in China was more serious in summer and autumn.
- (2)
- In terms of the future period, a lower DF, longer DD, and more serious DI across China correspond to the higher emission scenarios. The PRB, SERB, and northwest IRB are more prone to sustained seasonal drought. DF across China under the SSP5-8.5 scenario will be more frequent than that in other scenarios, especially southwest of the IRB, YRB, and HURB, with extreme DF > 2%. The range of change in SPEI in the higher emission scenarios is significantly greater than that in the lower emission scenarios. Aridity of northern China is more serious than that of southern China, that of the IRB is more serious than that of other regions, that of western plateau regions are more serious than that of eastern plain regions, and the wetting of southwest marginal regions of China is more serious.
- (3)
- Compared with the historical period, under the low and medium emission scenarios, China will suffer more frequent drought events, and the DD and DI will be weakened, whereas China will suffer longer DD and more serious drought events under the medium-high and higher emission scenarios, especially in the IRB, PRB, HURB, SERB, and downstream of the YZRB. For all scenarios, there will be greater DF in the future in the SLRB, SWRB, and midstream and upstream of the YZRB. Although the DF in most of China is prone to decreasing, the frequency of extreme droughts is expected to increase under the high emission scenarios. It is worth noting that compared with historical periods, in most scenarios, HARB and HURB are expected to experience a more serious drought trend in summer, with increases of 2.9–5.7 and 1.1–4.2, respectively.
Author Contributions
Conceptualization, Z.M., P.S., Q.Z., Y.Z., Y.L., H.L. and D.C.; methodology, Z.M., P.S., Q.Z., Y.Z. and Y.L.; validation, Z.M., P.S., Q.Z., Y.Z., Y.L., H.L. and D.C.; formal analysis, Z.M., P.S., Q.Z., Y.Z., Y.L., H.L. and D.C.; writing—original draft preparation, Z.M., P.S. and Q.Z.; writing—review and editing, Z.M., P.S. and Q.Z.; visualization, Z.M., P.S., Q.Z., Y.Z., Y.L., H.L. and D.C.; supervision, Z.M., P.S. and Q.Z.; funding acquisition, P.S., Q.Z. and H.L. All authors have read and agreed to the published version of the manuscript.
Funding
This research has been supported by the Nature Science Foundation for Excellent Young Scholars of Anhui, grant number: 2108085Y13; the China National Key R&D Program, grant number: 2019YFA0606900; National Natural Science Foundation of China, grant number: 41601023; The University Synergy Innovation Program of Anhui Province, grant number: GXXT-2021-048; Key projects of the support plan for outstanding young talents in Universities, grant number: gxyqZD2021094; Major science and technology projects in Anhui Province, grant number: 202003a06020002, 2021003.
Institutional Review Board Statement
Not applicable.
Informed Consent Statement
Not applicable.
Data Availability Statement
Not applicable.
Acknowledgments
We will thank for Resource and Environment Science and Data Center for making boundaries of nine basins divisions, and World Clmiate Research Programme for making the upgraded GCM outputs from CMIP6.
Conflicts of Interest
The authors declare no conflict of interest.
References
- IPCC. Climate change 2013: The physical science basis. In Contribution of Working Group I to Thefifth Assessment Report of the Intergovernmental Panel on Climate Change; Cambridge University Press: Cambridge, UK, 2021; pp. 1–195. [Google Scholar]
- Allen, M.R.; Ingram, W.J. Constraints on future changes in climate and the hydrologic cycle. Nature 2002, 419, 224–232. [Google Scholar] [CrossRef]
- Zhang, Q.; Li, J.; Singh, V.P.; Xiao, M. Spatio-temporal relations between temperature and precipitation regimes: Implications for temperature-induced changes in the hydrological cycle. Glob. Planet. Change 2013, 111, 57–76. [Google Scholar] [CrossRef]
- Hu, P.; Zhang, Q.; Shi, P.; Chen, B.; Fang, J. Flood-induced mortality across the globe: Spatiotemporal pattern and influencing factors. Sci. Total Environ. 2018, 643, 171–182. [Google Scholar] [CrossRef] [PubMed]
- Zong, Y.; Chen, X. The 1998 Flood on the Yangtze, China. Nat. Hazards 2000, 22, 165–184. [Google Scholar] [CrossRef]
- Sun, Y.; Zhang, X.; Zwiers, F.W.; Song, L.; Wan, H.; Hu, T.; Yin, H.; Ren, G. Rapid increase in the risk of extreme summer heat in Eastern China. Nat. Clim. Change 2014, 4, 1082–1085. [Google Scholar] [CrossRef]
- Shen, H.; Zhao, J.; Cheung, K.Y.; Chen, L.; Yu, X.; Wen, T.; Gong, Z.; Feng, G. Causes of the extreme snowfall anomaly over the northeast Tibetan plateau in early winter 2018. Clim. Dynam. 2018, 56, 1767–1782. [Google Scholar] [CrossRef]
- Su, X.; Shao, W.; Liu, J.; Jiang, Y.; Wang, K. Dynamic Assessment of the Impact of Flood Disaster on Economy and Population under Extreme Rainstorm Events. Remote Sens. 2021, 13, 3924. [Google Scholar] [CrossRef]
- Yu, M.; Li, Q.; Hayes, M.J.; Svoboda, M.D.; Heim, R.R. Are droughts becoming more frequent or severe in China based on the standardized precipitation evapotranspiration index: 1951–2010. Int. J. Climatol. 2014, 34, 545–558. [Google Scholar] [CrossRef]
- Battisti, D.S.; Naylor, R.L. Historical warnings of future food insecurity with unprecedented seasonal heat. Science 2009, 323, 240–244. [Google Scholar] [CrossRef] [Green Version]
- He, J.; Yang, X.; Li, Z.; Tang, Q. Spatiotemporal Variations of Meteorological Droughts in China During 1961–2014: An Investigation Based on Multi-Threshold Identification. Int. J. Disast. Risk Sci. 2016, 7, 63–76. [Google Scholar] [CrossRef] [Green Version]
- Zhang, Q.; Yu, H.; Sun, P.; Singh, V.P.; Shi, P. Multisource data based agricultural drought monitoring and agricultural loss in China. Glob. Planet. Change 2019, 172, 298–306. [Google Scholar] [CrossRef]
- Lambert, S.J.; Boer, G.J. CIMP1 evaluation and intercomparison of coupled climate models. Clim. Dynam. 2001, 17, 83–106. [Google Scholar] [CrossRef]
- Behrens, L.K.; Martin, T.; Semenov, V.A.; Latif, M. The Arctic sea ice in the CMIP3 climate model ensemble—variability and anthropogenic change. Cryosphere Discuss. 2012, 6, 5317–5344. [Google Scholar] [CrossRef] [Green Version]
- Torres, R.R.; Marengo, J.A. Climate change hotspots over South America: From CMIP3 to CMIP5 multi-model datasets. Theor. Appl. Climatol. 2014, 117, 579–587. [Google Scholar] [CrossRef]
- Eyring, V.; Bony, S.; Meehl, G.A.; Senior, C.; Taylor, K.E. Overview of the Coupled Model Intercomparison Project Phase 6 (CMIP6) experimental design and organization. Geosci. Model Dev. 2016, 9, 1937–1958. [Google Scholar] [CrossRef] [Green Version]
- Oneill, B.C.; Tebaldi, C.; Van Vuuren, D.P.; Eyring, V.; Friedlingstein, P.; Hurtt, G.C.; Knutti, R.; Kriegler, E.; Lamarque, J.; Lowe, J. The Scenario Model Intercomparison Project (ScenarioMIP) for CMIP6. Geosci. Model Dev. 2016, 9, 3461–3482. [Google Scholar] [CrossRef] [Green Version]
- Xu, C.H.; Xu, Y. The projection of temperature and precipitation over China under RCP scenarios using a CMIP5 multi-model ensemble. Atmos. Ocean. Sci. Lett. 2012, 9, 527–533. [Google Scholar] [CrossRef] [Green Version]
- Hu, Q.; Jiang, D.B.; Fan, G.Z. Evaluation of CMIP5 models over the Qinghai–Tibetan Plateau. Chin. J. Atmos. Sci. 2014, 38, 924–938. (In Chinese) [Google Scholar]
- Huang, J.; Zhai, J.; Jiang, T.; Wang, Y.; Li, X.; Wang, R.; Xiong, M.; Su, B.; Fischer, T. Analysis of future drought characteristics in China using the regional climate model CCLM. Clim. Dynam. 2017, 50, 507–525. [Google Scholar] [CrossRef]
- Wang, Z.; Zhong, R.; Lai, C.; Zeng, Z.; Lian, Y.; Bai, X. Climate change enhances the severity and variability of drought in the Pearl River Basin in South China in the 21st century. Agr. For. Meteorol. 2018, 249, 149–162. [Google Scholar] [CrossRef]
- Yao, N.; Li, L.; Feng, P.; Feng, H.; Li, Y. Projections of drought characteristics in China based on a standardized precipitation and evapotranspiration index and multiple GCMs. Sci. Total Environ. 2020, 704, 135245. [Google Scholar] [CrossRef] [PubMed]
- Han, R.C.; Li, Z.L.; Li, Z.J.; Han, Y.Y. Spatial—Temporal Assessment of Historical and Future Meteorological Droughts in China. Atmosphere 2021, 12, 787. [Google Scholar] [CrossRef]
- Su, B.; Huang, J.; Mondal, S.K.; Zhai, J.; Wang, Y.; Wen, S.; Gao, M.; Lv, Y.; Jiang, S.; Jiang, T.; et al. Insight from CMIP6 SSP-RCP scenarios for future drought characteristics in China. Atmos. Res. 2021, 250, 105375. [Google Scholar] [CrossRef]
- Zhu, Y.; Yang, S. Interdecadal and interannual evolution characteristics of the global surface precipitation anomaly shown by CMIP5 and CMIP6 models. Int. J. Climatol. 2021, 41, 1100–1118. [Google Scholar] [CrossRef]
- Mondal, S.K.; Huang, J.; Wang, Y.; Su, B.; Zhai, J.; Tao, H.; Wang, G.; Fischer, T.; Wen, S.; Jiang, T. Doubling of the population exposed to drought over South Asia: CMIP6 multi-model-based analysis. Sci. Total Environ. 2021, 771, 145186. [Google Scholar] [CrossRef] [PubMed]
- Zargar, A.; Sadiq, R.; Naser, B.; Khan, F.I. A Review of Drought Indices. Environ. Rev. 2011, 19, 333–349. [Google Scholar] [CrossRef]
- Vicente-Serrano, S.M.; Beguería, S.; López-Moreno, J.I.; Marta, A.M. A multiscalar drought index sensitive to global warming: The standardized precipitation evapotranspiration index. J. Clim. 2010, 23, 1696–1718. [Google Scholar] [CrossRef] [Green Version]
- McKee, T.B.; Doesken, N.J.; Kleist, J. The Relationship of Drought Frequency and Duration to Time Scales. In Proceedings of the 8th Conference on Applied Climatology, Anaheim, CA, USA, 17–22 January 1993. [Google Scholar]
- Palmer, W.C. Meteorological Drought. In Research Paper No. 45; US Department of Commerce: Washington, DC, USA, 1965; p. 58. [Google Scholar]
- Xu, K.; Yang, D.; Yang, H.; Li, Z.; Qin, Y.; Shen, Y. Spatio-Temporal Variation of Drought in China During 1961–2012: A Climatic Perspective. J. Hydrol. 2015, 526, 253–264. [Google Scholar] [CrossRef]
- Zuo, D.; Cai, S.; Xu, Z.; Li, F.; Sun, W.; Yang, X.; Kan, G.; Liu, P. Spatiotemporal Patterns of Drought at Various Time Scales in Shandong Province of Eastern China. Theor. Appl. Climatol. 2018, 131, 271–284. [Google Scholar] [CrossRef]
- Ye, L.; Shi, K.; Zhang, H.; Xin, Z.; Hu, J.; Zhang, C. Spatio-Temporal Analysis of Drought Indicated by SPEI over Northeastern China. Water 2019, 11, 908. [Google Scholar] [CrossRef] [Green Version]
- Li, L.; She, D.; Zheng, H.; Lin, P.; Yang, Z. Elucidating diverse drought characteristics from two meteorological drought indices (SPI and SPEI) in China. J. Hydrometeorol. 2020, 21, 1513–1530. [Google Scholar] [CrossRef]
- Thornthwaite, C.W. An Approach toward a Rational Classification of Climate. Geograph. Rev. 1948, 38, 55–94. [Google Scholar] [CrossRef]
- Potop, V.; Boroneant, C.; Možný, M.; Štěpánek, P.; Skalák, P. Observed spatiotemporal characteristics of drought on various time scales over the Czech Republic. Theor. Appl. Climatol. 2013, 115, 563–581. [Google Scholar] [CrossRef]
- Jin, X.; Qiang, H.; Zhao, L.; Jiang, S.; Cui, N.; Cao, Y.; Feng, Y. SPEI-based analysis of spatio-temporal variation characteristics for annual and seasonal drought in the Zoige Wetland, Southwest China from 1961 to 2016. Theor. Appl. Climatol. 2019, 139, 711–725. [Google Scholar] [CrossRef]
- Beguería, S.; Vicente-Serrano, S.M.; Reig, F.; Latorre, B. Standardized precipitation evapotranspiration index (SPEI) revisited: Parameter fitting, evapotranspiration models, tools, datasets and drought monitoring. Int. J. Climatol. 2014, 3023, 3001–3023. [Google Scholar] [CrossRef] [Green Version]
- World Meteorological Organization (WMO). Integrated Drought Management Programme Handbook of Drought Indicators and Indices. No 1173. 2016. Available online: https://www.droughtmanagement.info/literature/GWP_Handbook_of_Drought_Indicators_and_Indices_2016.pdf (accessed on 17 December 2021).
- Herbst, P.H.; Bredenkamp, D.B.; Barker, H. A technique for the evaluation of drought from rainfall data. J. Hydrol. 1966, 4, 264–272. [Google Scholar] [CrossRef]
- Wang, F.; Wang, Z.; Yang, H.; Di, D.; Zhao, Y.; Liang, Q.; Hussain, Z. Comprehensive evaluation of hydrological drought and its relationships with meteorological drought in the Yellow River basin, China. J. Hydrol. 2020, 548, 124751. [Google Scholar] [CrossRef]
- Haile, G.G.; Tang, Q.; Leng, G.; Jia, G.; Wang, J.; Cai, D.; Sun, S.; Banyia, B.; Zhang, Q. Long-term spatiotemporal variation of drought patterns over the Greater Horn of Africa. Sci. Total Environ. 2020, 704, 135299. [Google Scholar] [CrossRef]
- Li, Y.; Tong, S.; Bao, Y.; Guo, E.; Bao, Y. Prediction of Droughts in the Mongolian Plateau Based on the CMIP5 Model. Water 2020, 12, 2774. [Google Scholar] [CrossRef]
- Taylor, K.E. Summarizing multiple aspects of model performance in a single diagram. J. Geophys. Res. Atmos. 2001, 106, 7183–7192. [Google Scholar] [CrossRef]
- Wei, F.Y. Statistical Diagnosis and Prediction Technology of Modern Climate; China Meteorological Press: Beijing, China, 1999. [Google Scholar]
- Theil, H. A rank-invariant method of linear and polynomial regression analysis. Nederl. Akad. Wetensch. Proc. 1992, 12, 345–381. [Google Scholar] [CrossRef]
- Hamed, K.H.; Rao, A.R. A modified Mann-Kendall trend test for autocorrelated data. J. Hydrol. 1998, 204, 182–196. [Google Scholar] [CrossRef]
- Zhang, Q.; Singh, V.P.; Peng, J.; Chen, Y.D.; Li, J. Spatial-temporal changes of precipitation structure across the Pearl River basin, China. J. Hydrol. 2012, 440, 113–122. [Google Scholar] [CrossRef]
- Daufresne, M.; Lengfellner, K.; Sommer, U. Global warming benefits the small in aquatic ecosystems. Proc. Natl. Acad. Sci. USA 2009, 106, 12788–12793. [Google Scholar] [CrossRef] [PubMed] [Green Version]
- Bracegirdle, T.J.; Stephenson, D.B.; Turner, J.; Phillips, T. The importance of sea ice area biases in 21st century multimodel projections of Antarctic temperature and precipitation. Geophys. Res. Lett. 2015, 42, 10832–10839. [Google Scholar] [CrossRef] [Green Version]
- Yang, X.; Wood, E.F.; Sheffield, J.; Ren, L.; Zhang, M.; Wang, Y. Bias Correction of Historical and Future Simulations of Precipitation and Temperature for China from CMIP5 Models. J. Hydrometeorol. 2018, 19, 609–623. [Google Scholar] [CrossRef]
- Chen, L.; Wang, G.; Miao, L.; Gnyawali, K.R.; Li, S.; Amankwah, S.O.Y.; Huang, J.; Lu, J.; Zhan, M. Future drought in CMIP6 projections and the socioeconomic impacts in China. Int. J. Climatol. 2021, 41, 4151–4170. [Google Scholar] [CrossRef]
- Zhang, G.; Gan, T.Y.; Su, X. Twenty-first century drought analysis across China under climate change. Clim. Dynam. 2021, 1–21. [Google Scholar] [CrossRef]
- Naumann, G.; Alfieri, L.; Wyser, K.; Mentaschi, L.; Betts, R.A.; Carrao, H.; Spinoni, J.; Vogt, J.; Feyen, L. Global Changes in Drought Conditions Under Different Levels of Warming. Geophys. Res. Lett. 2018, 45, 3285–3296. [Google Scholar] [CrossRef]
- Xu, Y.; Zhang, X.; Hao, Z.; Hao, F.; Li, C. Projections of future meteorological droughts in China under CMIP6 from a three-dimensional perspective. Agr. Water Manage. 2021, 252, 106849. [Google Scholar] [CrossRef]
- Chen, H.P.; Sun, J.Q.; Chen, X.L. Future Changes of Drought and Flood Events in China under a Global Warming Scenario. Atmos. Ocean. Sci. Lett. 2013, 6, 8–13. [Google Scholar] [CrossRef]
- Chen, H.; Sun, J. Characterizing present and future drought changes over eastern China. Int. J. Climatol. 2017, 37, 138–156. [Google Scholar] [CrossRef]
- Song, Z.; Xia, J.; She, D.; Li, L.; Hu, C.; Hong, S. Assessment of meteorological drought change in the 21st century based on CMIP6 multi-model ensemble projections over mainland China. J. Hydrol. 2021, 601, 126643. [Google Scholar] [CrossRef]
- Taylor, K.E.; Stoufer, R.J.; Meehl, G.A. An overview of CMIP5 and the experiment design. B. Am. Meteorol. Soc. 2012, 93, 485–498. [Google Scholar] [CrossRef] [Green Version]
- Eyring, V.; Cox, P.M.; Flato, G.M.; Gleckler, P.J.; Abramowitz, G.; Caldwell, P.; Collins, W.D.; Gier, B.K.; Hall, A.D.; Hoffman, F.M. Taking climate model evaluation to the next level. Nat. Clim. Change 2019, 9, 102–110. [Google Scholar] [CrossRef] [Green Version]
- Zhu, X.; Lee, S.Y.; Wen, X.; Ji, Z.; Lin, L.; Wei, Z.; Zheng, Z.; Xu, D.; Dong, W. Extreme climate changes over three major river basins in China as seen in CMIP5 and CMIP6. Clim. Dynam. 2021, 57, 1187–1205. [Google Scholar] [CrossRef]
- Swann, A.L.; Hoffman, F.M.; Koven, C.D.; Randerson, J.T. Plant responses to increasing CO2 reduce estimates of climate impacts on drought severity. Proc. Natl. Acad. Sci. USA 2016, 113, 10019–10024. [Google Scholar] [CrossRef] [Green Version]
- Swann, A.L. Plants and drought in a changing climate. Curr. Clim. Change Rep. 2018, 4, 192–201. [Google Scholar] [CrossRef] [Green Version]
- Swain, S.; Hayhoe, K. CMIP5 projected changes in spring and summer drought and wet conditions over North America. Clim. Dynam. 2015, 44, 2737–2750. [Google Scholar] [CrossRef]
- Park, C.K.; Byun, H.R.; Deo, R.; Lee, B.R. Drought prediction till 2100 under RCP 8.5 climate change scenarios for Korea. J. Hydrol. 2015, 526, 221–230. [Google Scholar] [CrossRef]
Figure 1.
Meteorological stations, topographical features, and locations of the nine basin sub-regions, i.e., the Songliao River Basin (SLRB), Hai River Basin (HARB), Huai River Basin (HURB), Yellow River Basin (YRB), Inland River Basin (IRB), Yangtze River Basin (YZRB), Pearl River Basin (PRB), Southeast River Basin (SERB), and Southwest River Basin (SWRB). Data were from the Resource and Environment Data Center, Chinese Academy of Sciences.
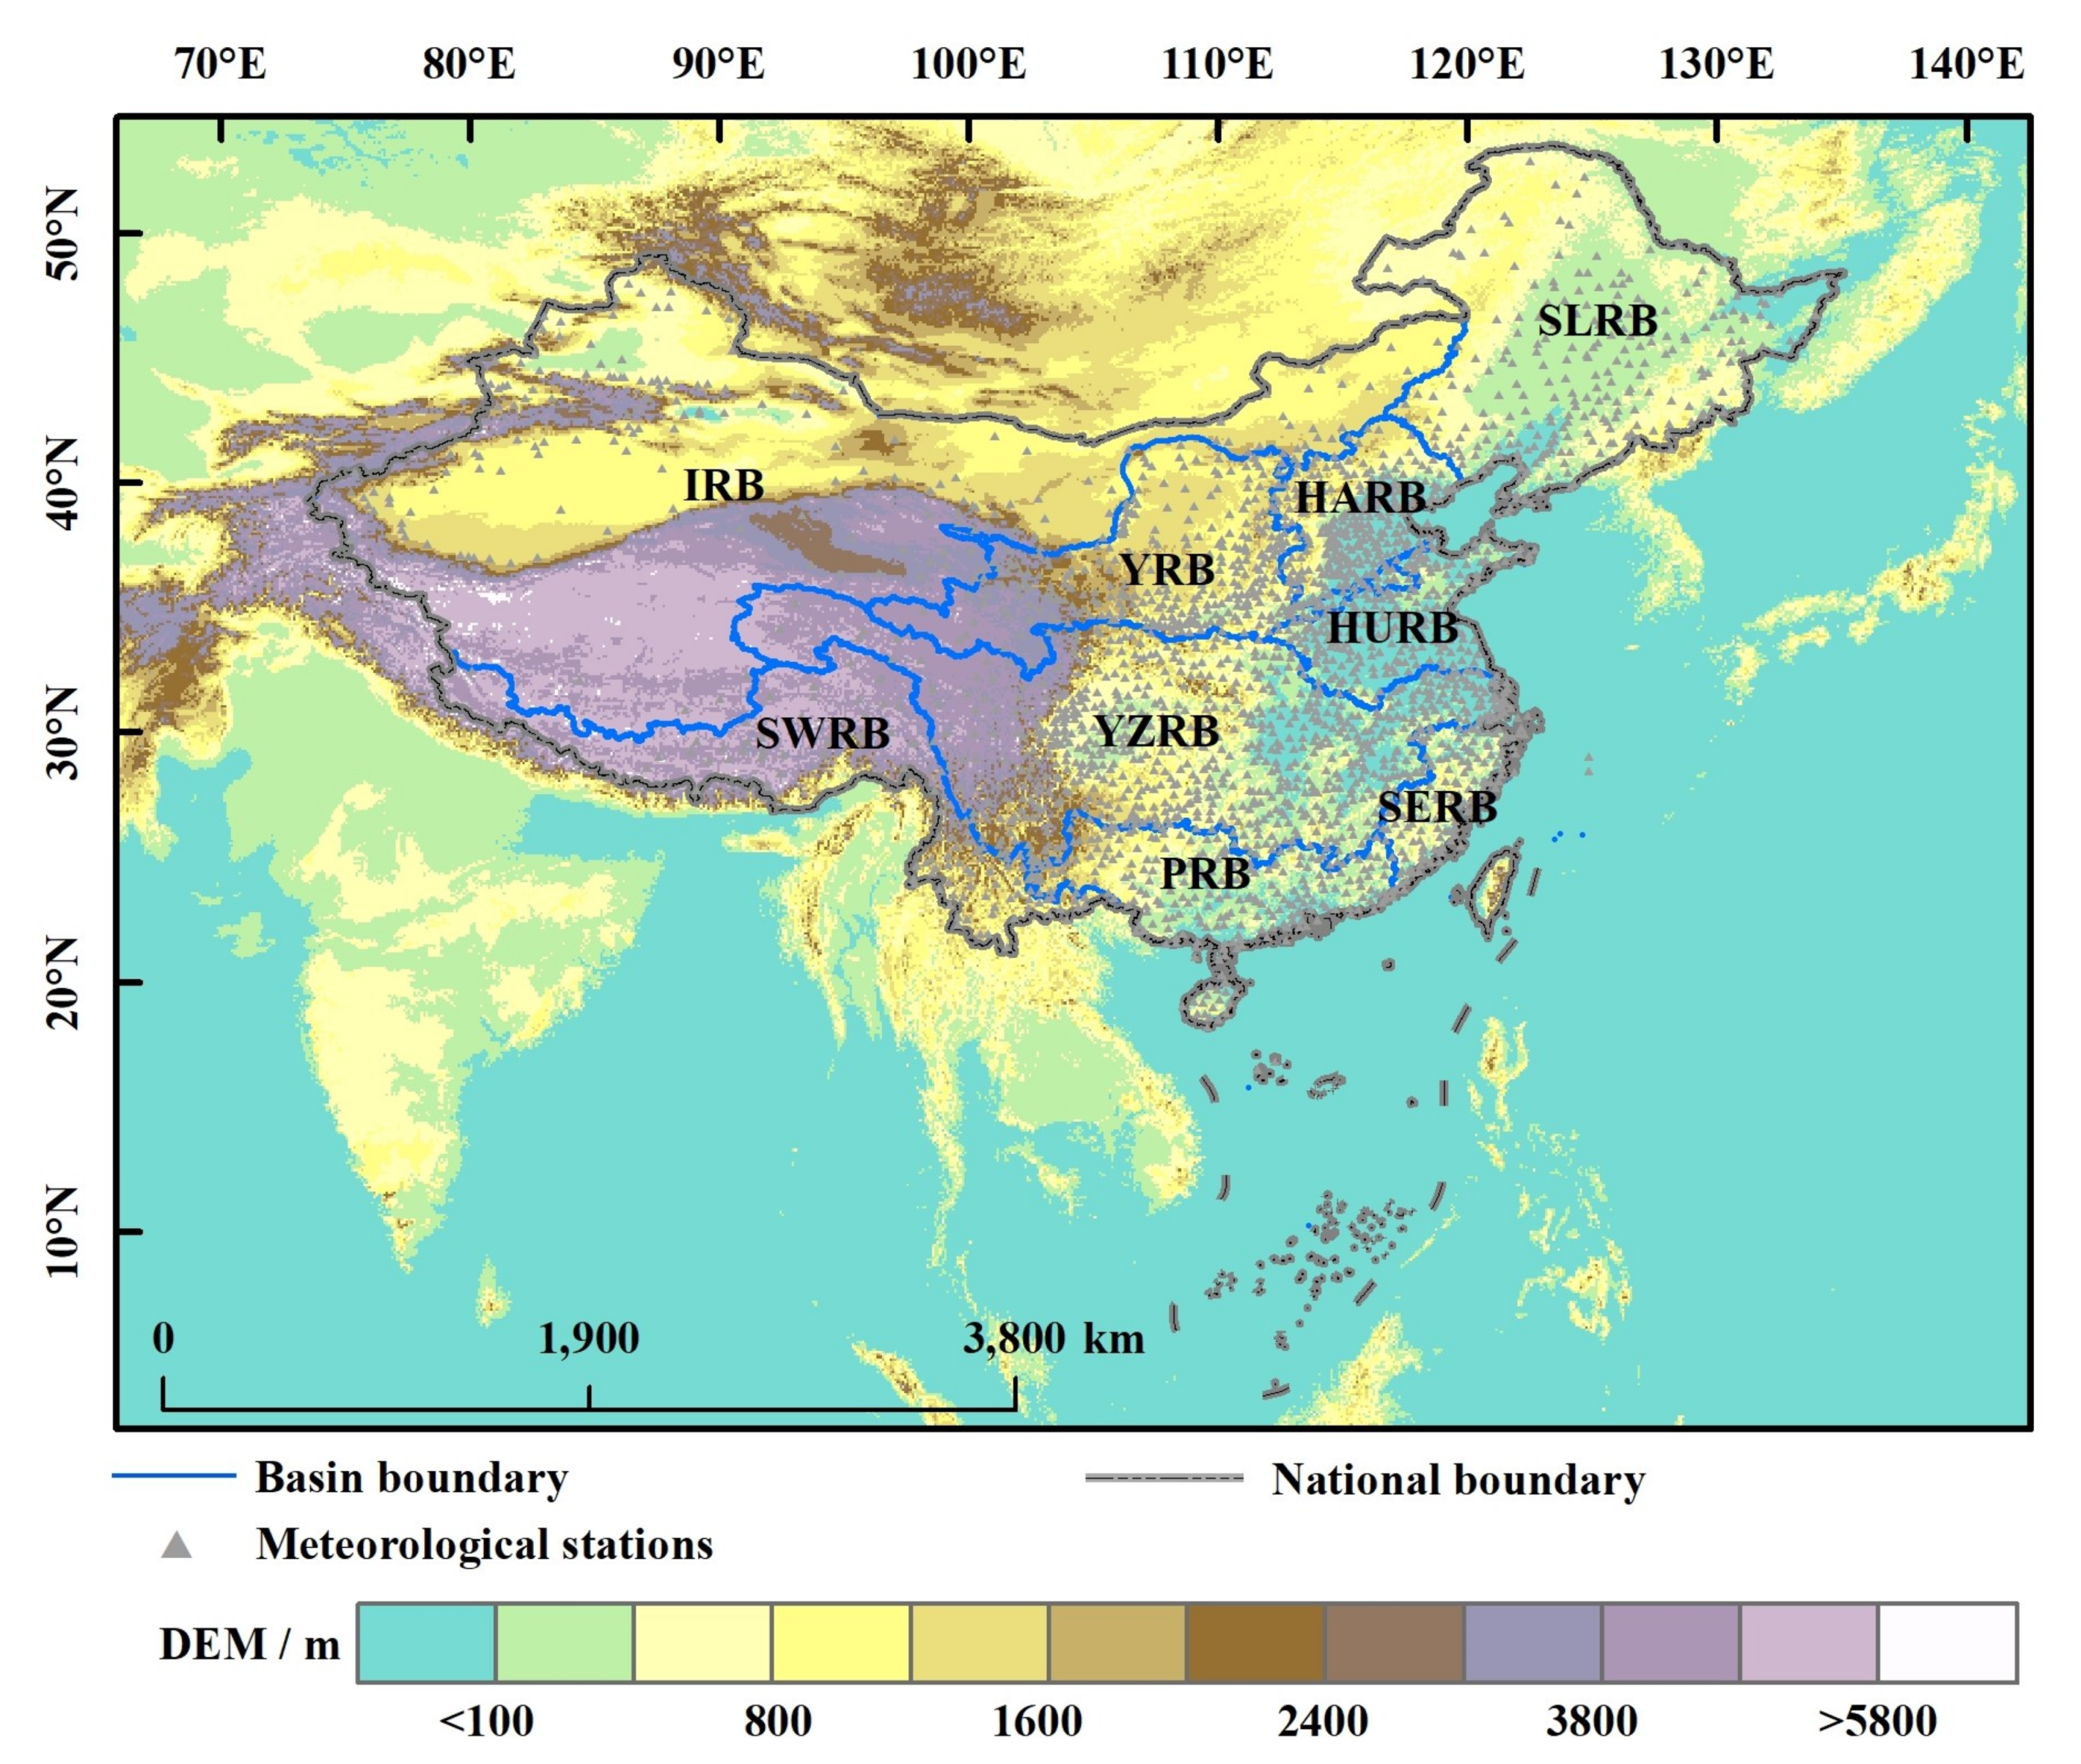
Figure 2.
Identification of the drought events using the three-threshold run theory. DD = drought duration, DI = drought intensity, ND = Non drought events meeting Step 1. SPEI—Standardized Precipitation Evapotranspiration Index.
Figure 2.
Identification of the drought events using the three-threshold run theory. DD = drought duration, DI = drought intensity, ND = Non drought events meeting Step 1. SPEI—Standardized Precipitation Evapotranspiration Index.

Figure 3.
Standardized Taylor diagrams of: (a) precipitation and (b) temperature. Correlation coefficients (R) between monthly simulations and observations across China were calculated using Equation (1). The standard deviation (SD) between monthly simulations and observations across China was calculated using Equation (2). The root mean square error (RMSE) between monthly simulations and observations across China was calculated using Equation (3). The R, SD, and RMSE are the mean of all pixels across China. The R is plotted in blue, the SD is plotted in black, and the RMSE is plotted in green.
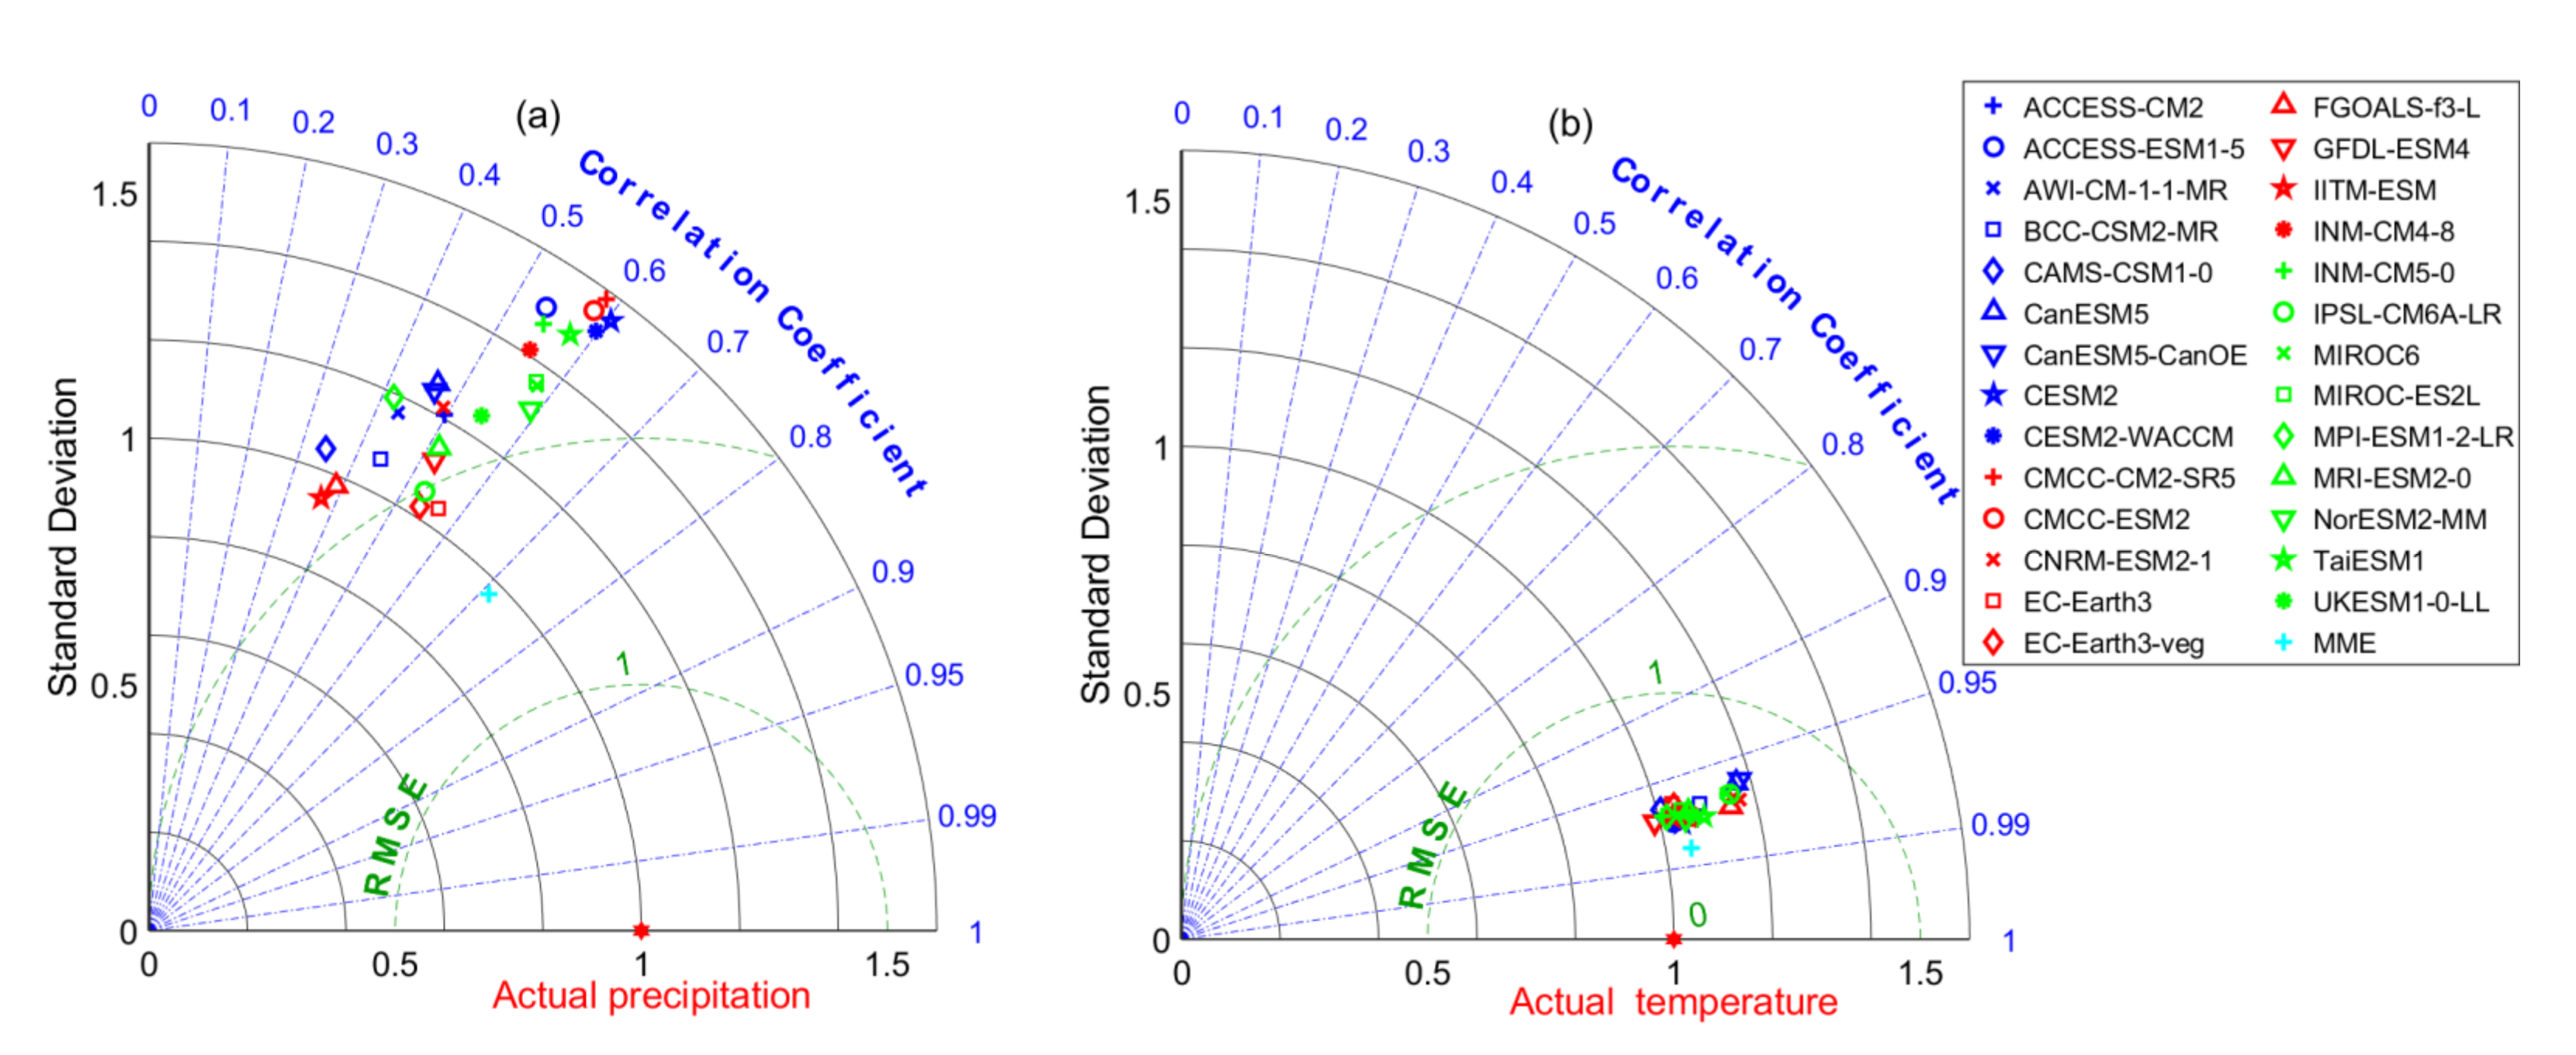
Figure 4.
Correlation coefficients between the observed and simulated (a) precipitation and (b) temperature, and (c,d) root mean square error between the simulations and observations in 1961–2014. The correlation coefficients (R) between monthly simulations and observations across China were calculated using Equation (1). The root mean square error (RMSE) between monthly simulations and observations across China were calculated using Equation (3).
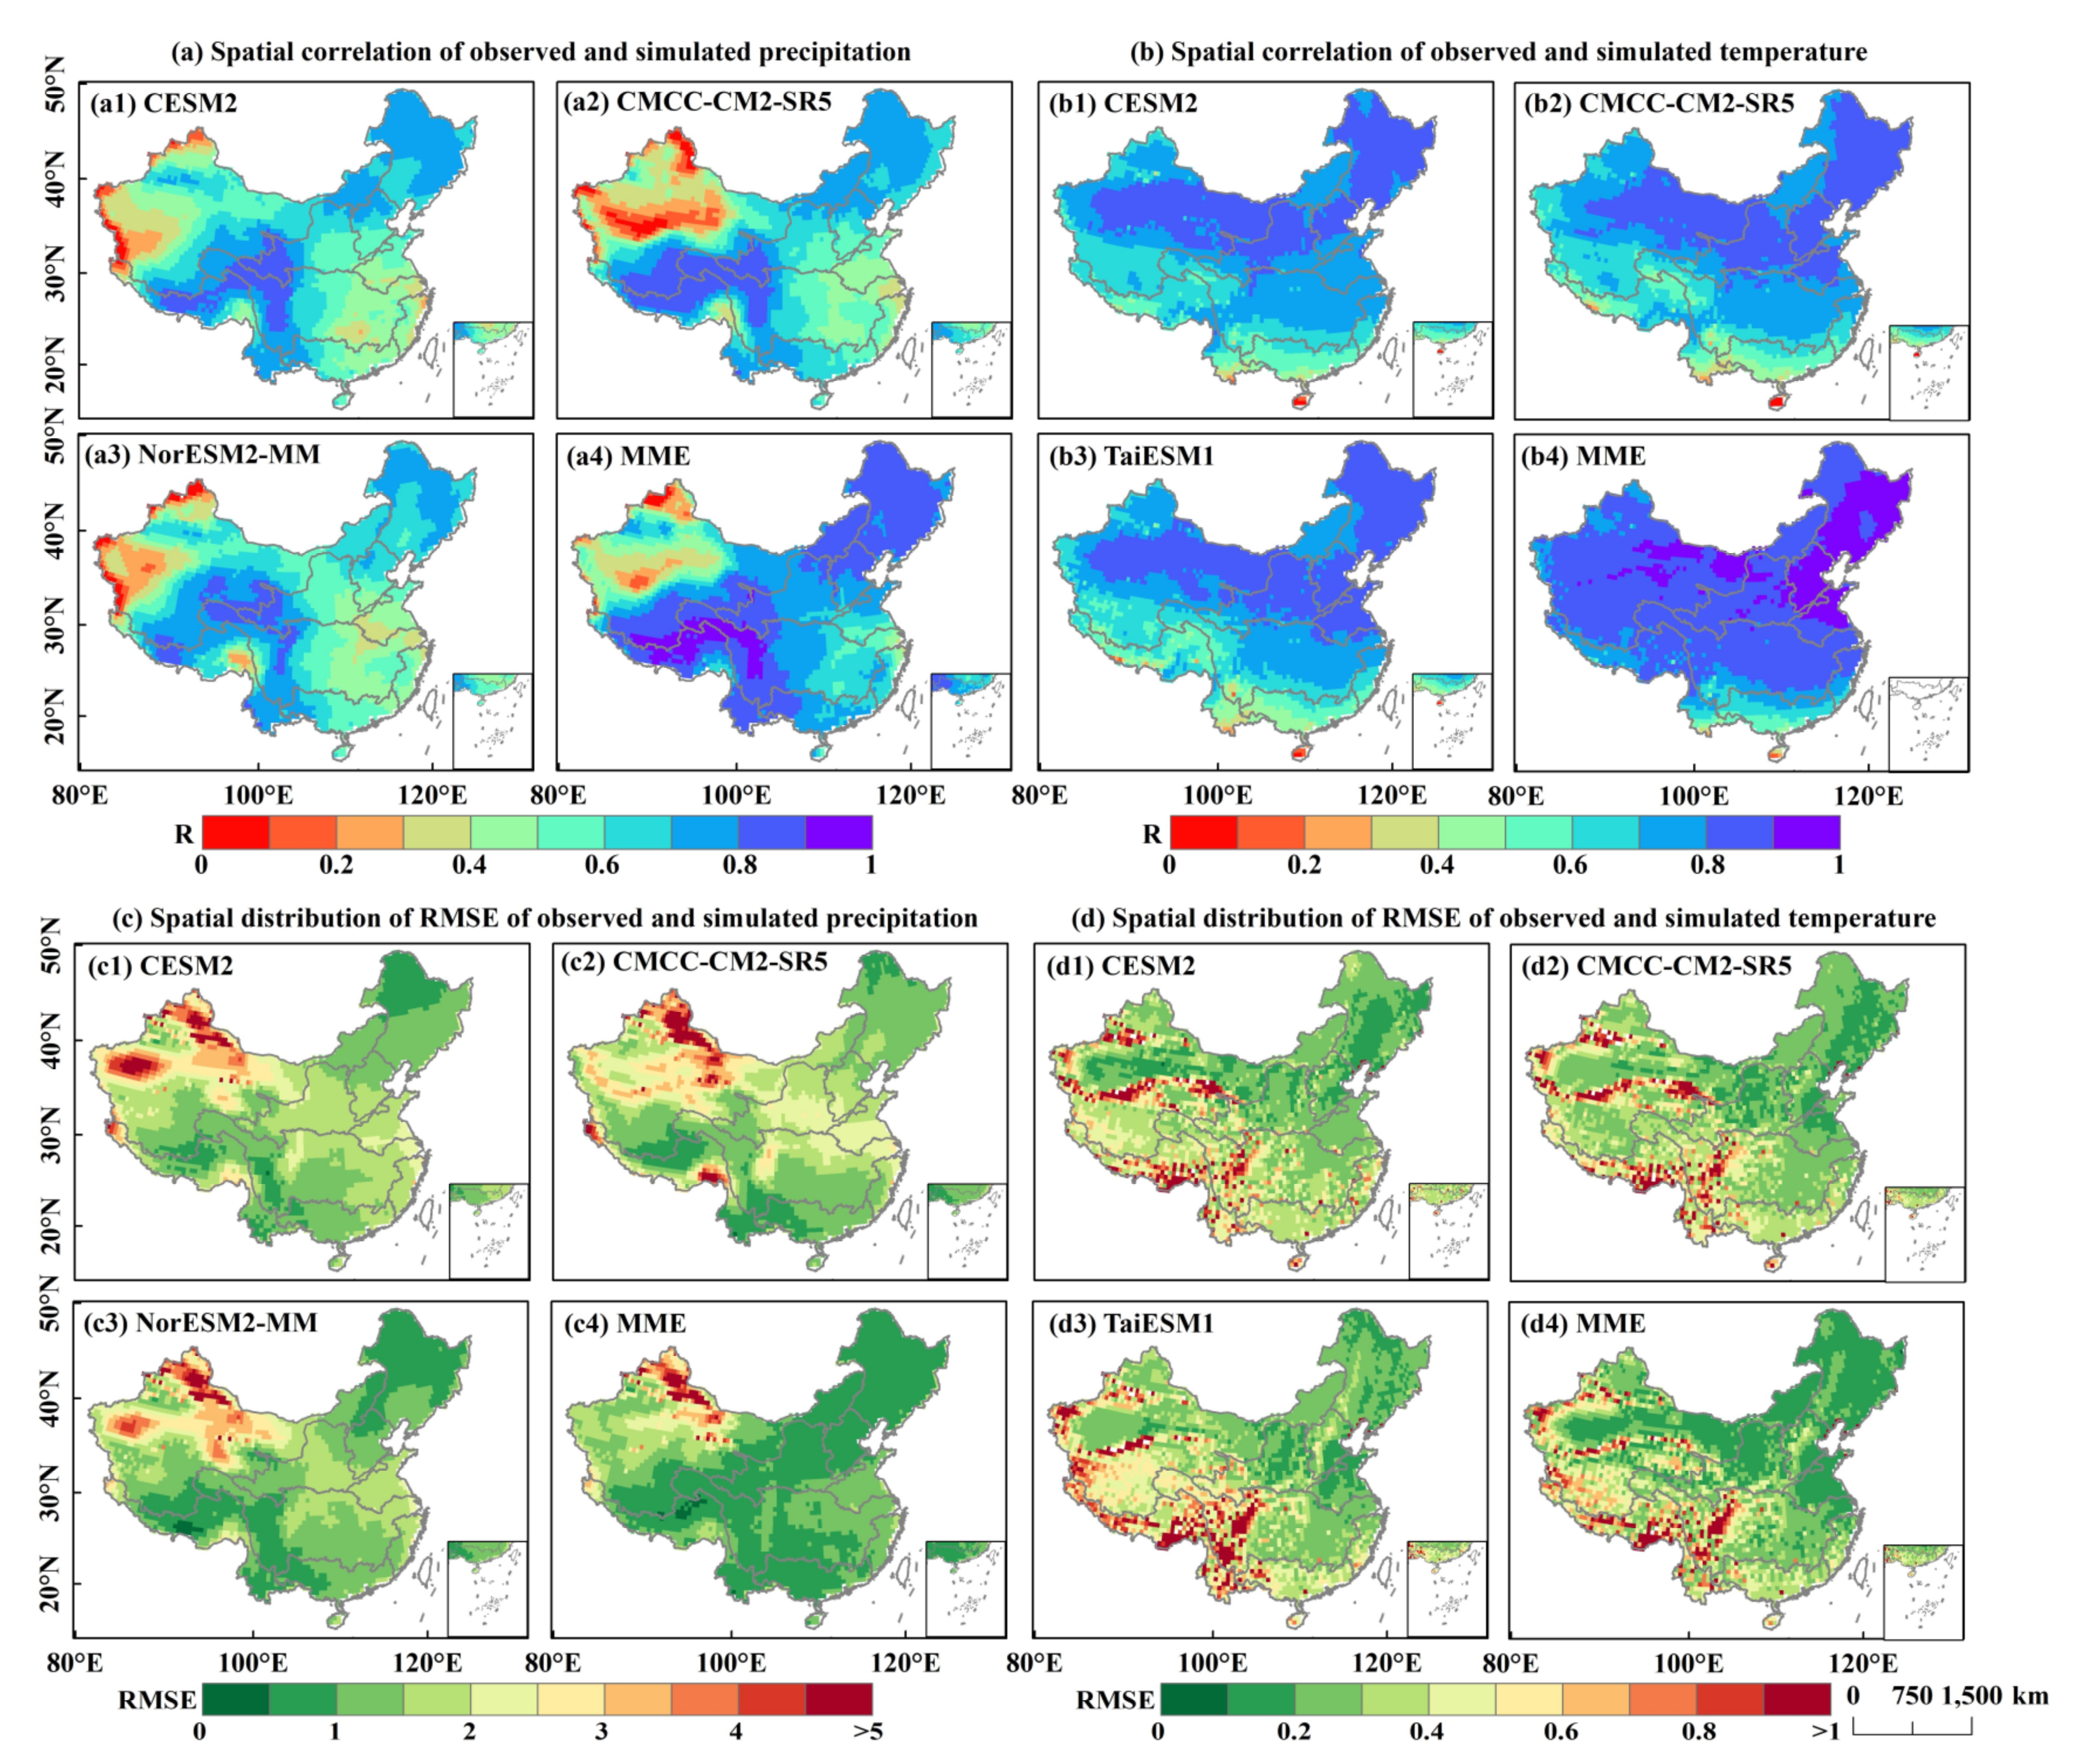
Figure 5.
(a) Mutation test results of annual mean SPEI03 sequences. The UB, UF, and the 0.05 confidence level (U = ±1.96, p < 0.05) were plotted. The annual mean number of droughts, mean DD, and mean DI were calculated using SPEI03 for different periods. (b–d) show the spatial patterns of differences in the drought number, DD, and DI, respectively, from 1961–1994 and 1995–2014. (e–g) show the spatial patterns of the DF, DD, and DI from 1961–2014.

Figure 6.
Spatial patterns of differences in the frequency of moderate (a), severe (b), and extreme drought (c) between 1961–1990 and 1991–2014. Spatial distributions of total DF of moderate (d), severe (e), and extreme drought (f) from 1961–2014. The frequency of moderate drought is the ratio between the total months when −1.5 ≤ SPEI03 < −1 and the total length of the sequences. The frequency of severe drought is the ratio between the total months when −2 ≤ SPEI03 < −1.5 and total length of the sequences. The frequency of extreme drought is the ratio between the total months when SPEI03 < −2 and the total length of the sequences.
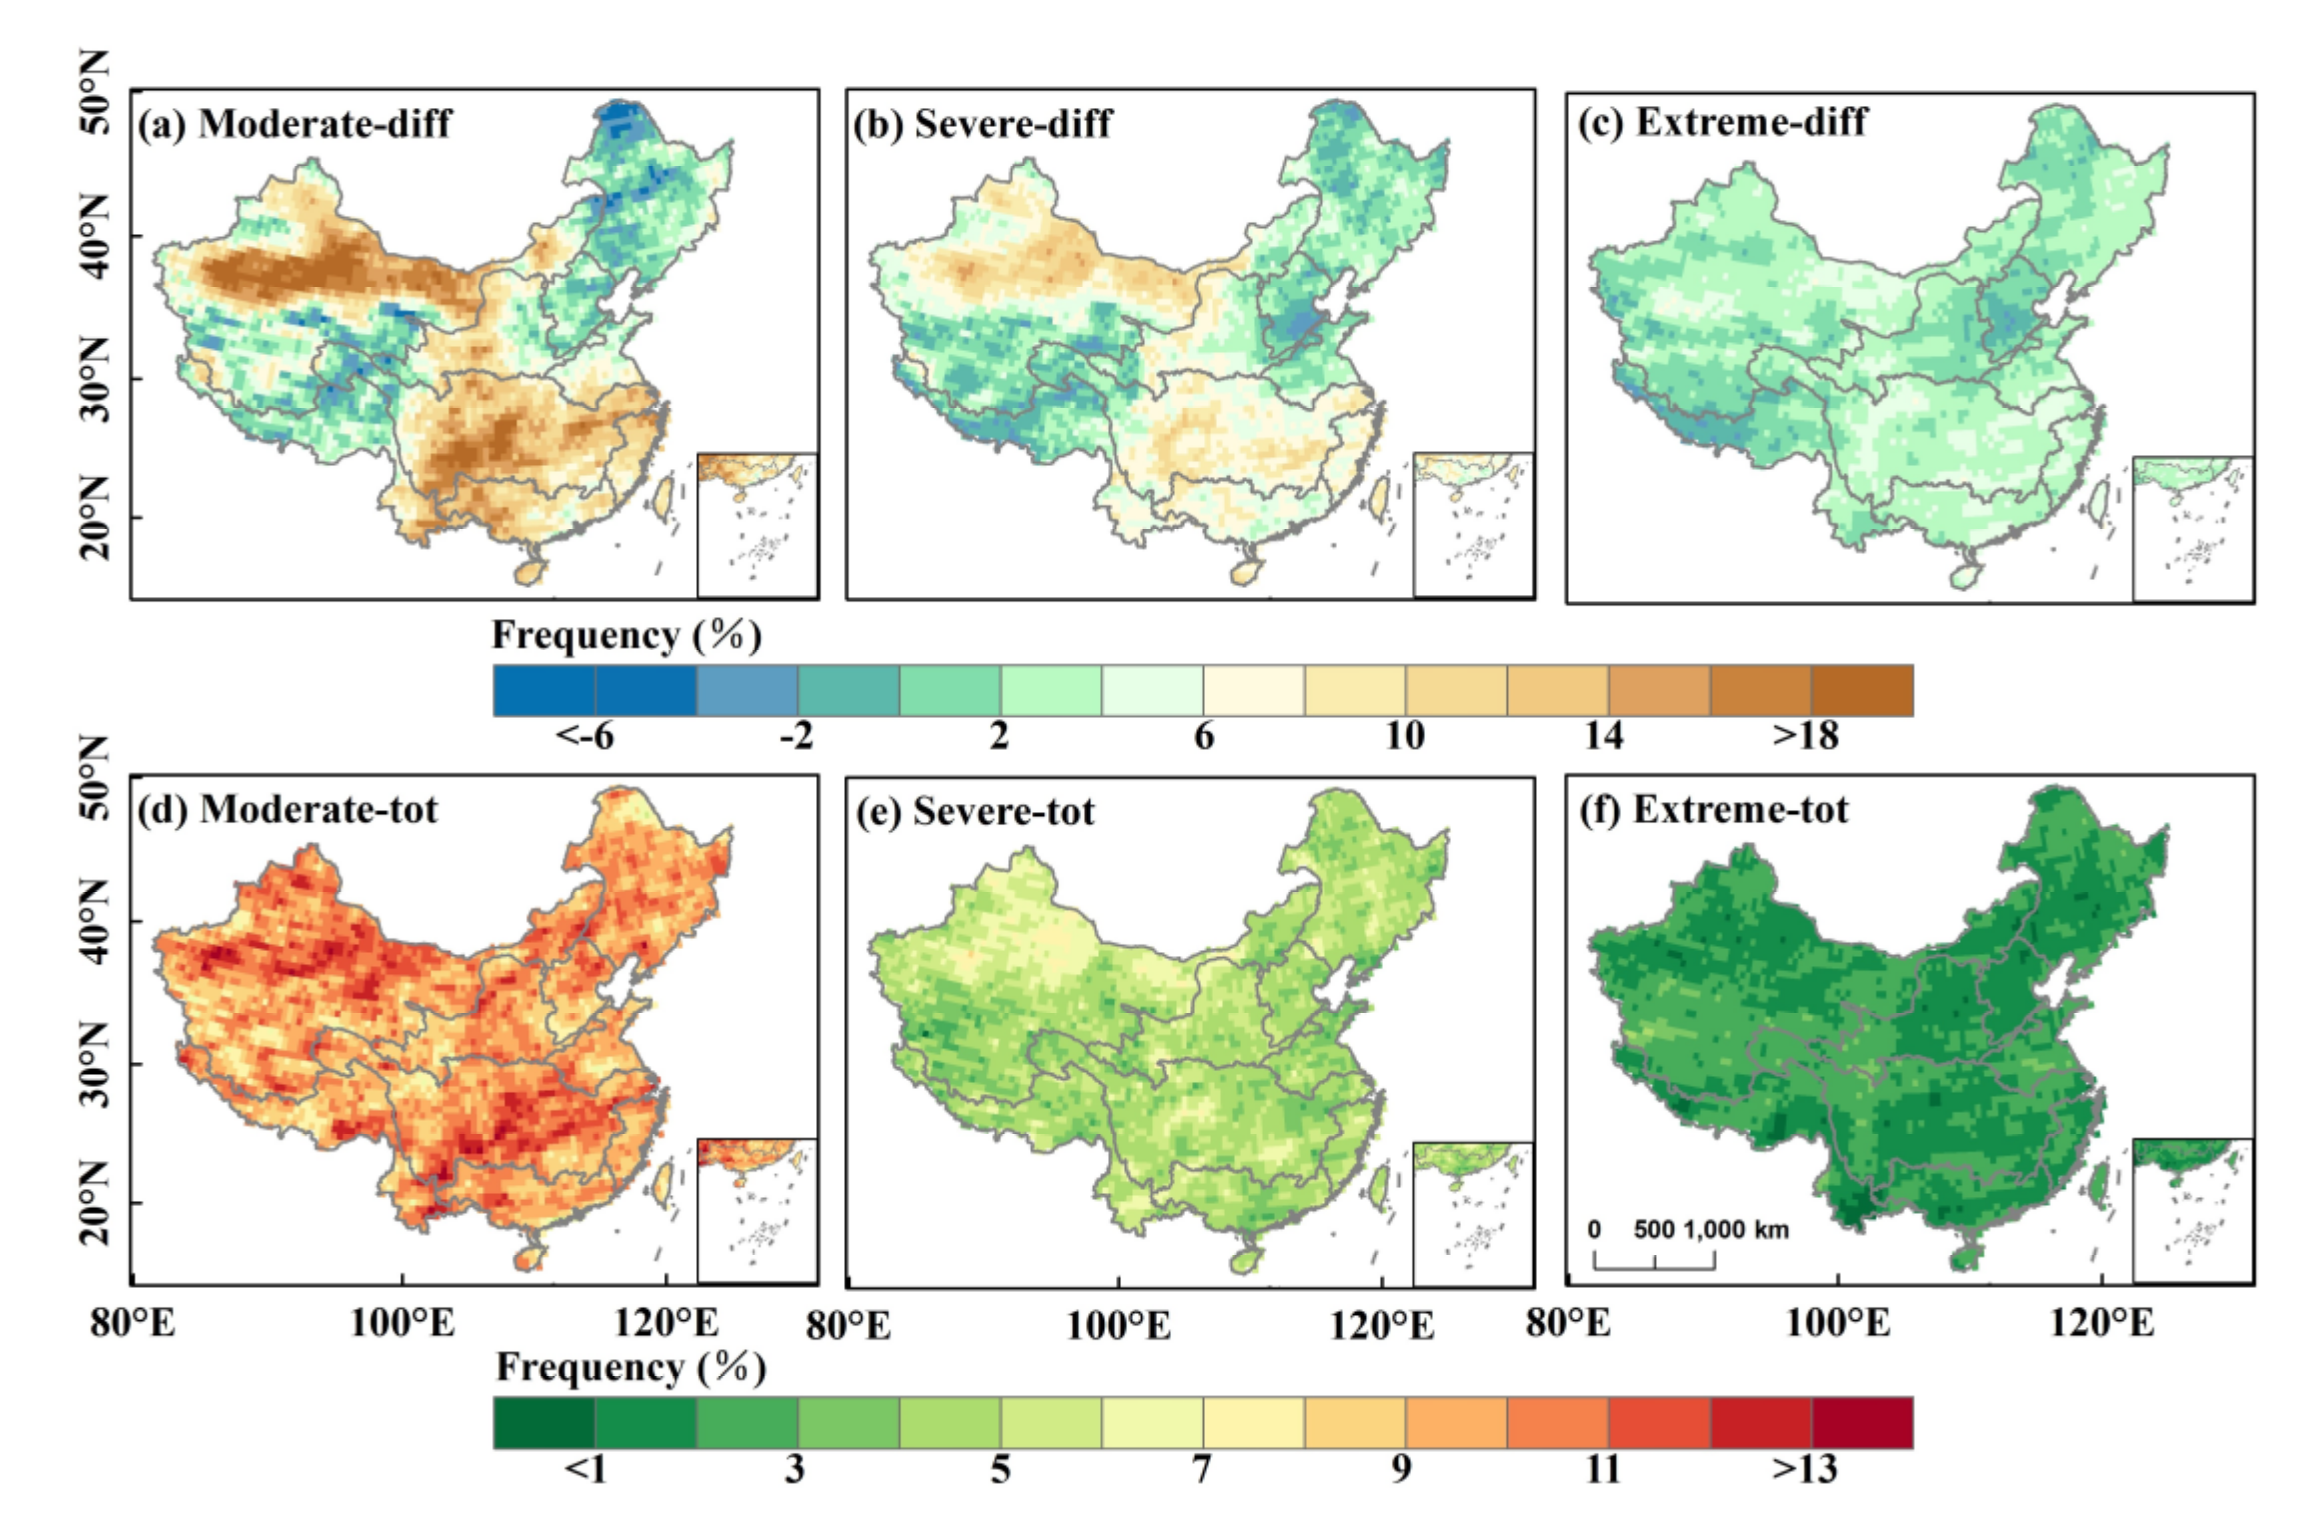
Figure 7.
Spatial patterns of the SPEI03-based drought trend in (a) spring, (b) summer, (c) autumn, and (d) winter across China during 1961–2014, calculated using Equation (7). Gray dots indicate significance at a 99% confidence level using the Mann–Kendall method. Spring was from March–May, summer was from June–August, autumn was from September–November, and winter was from December–February of the following year.
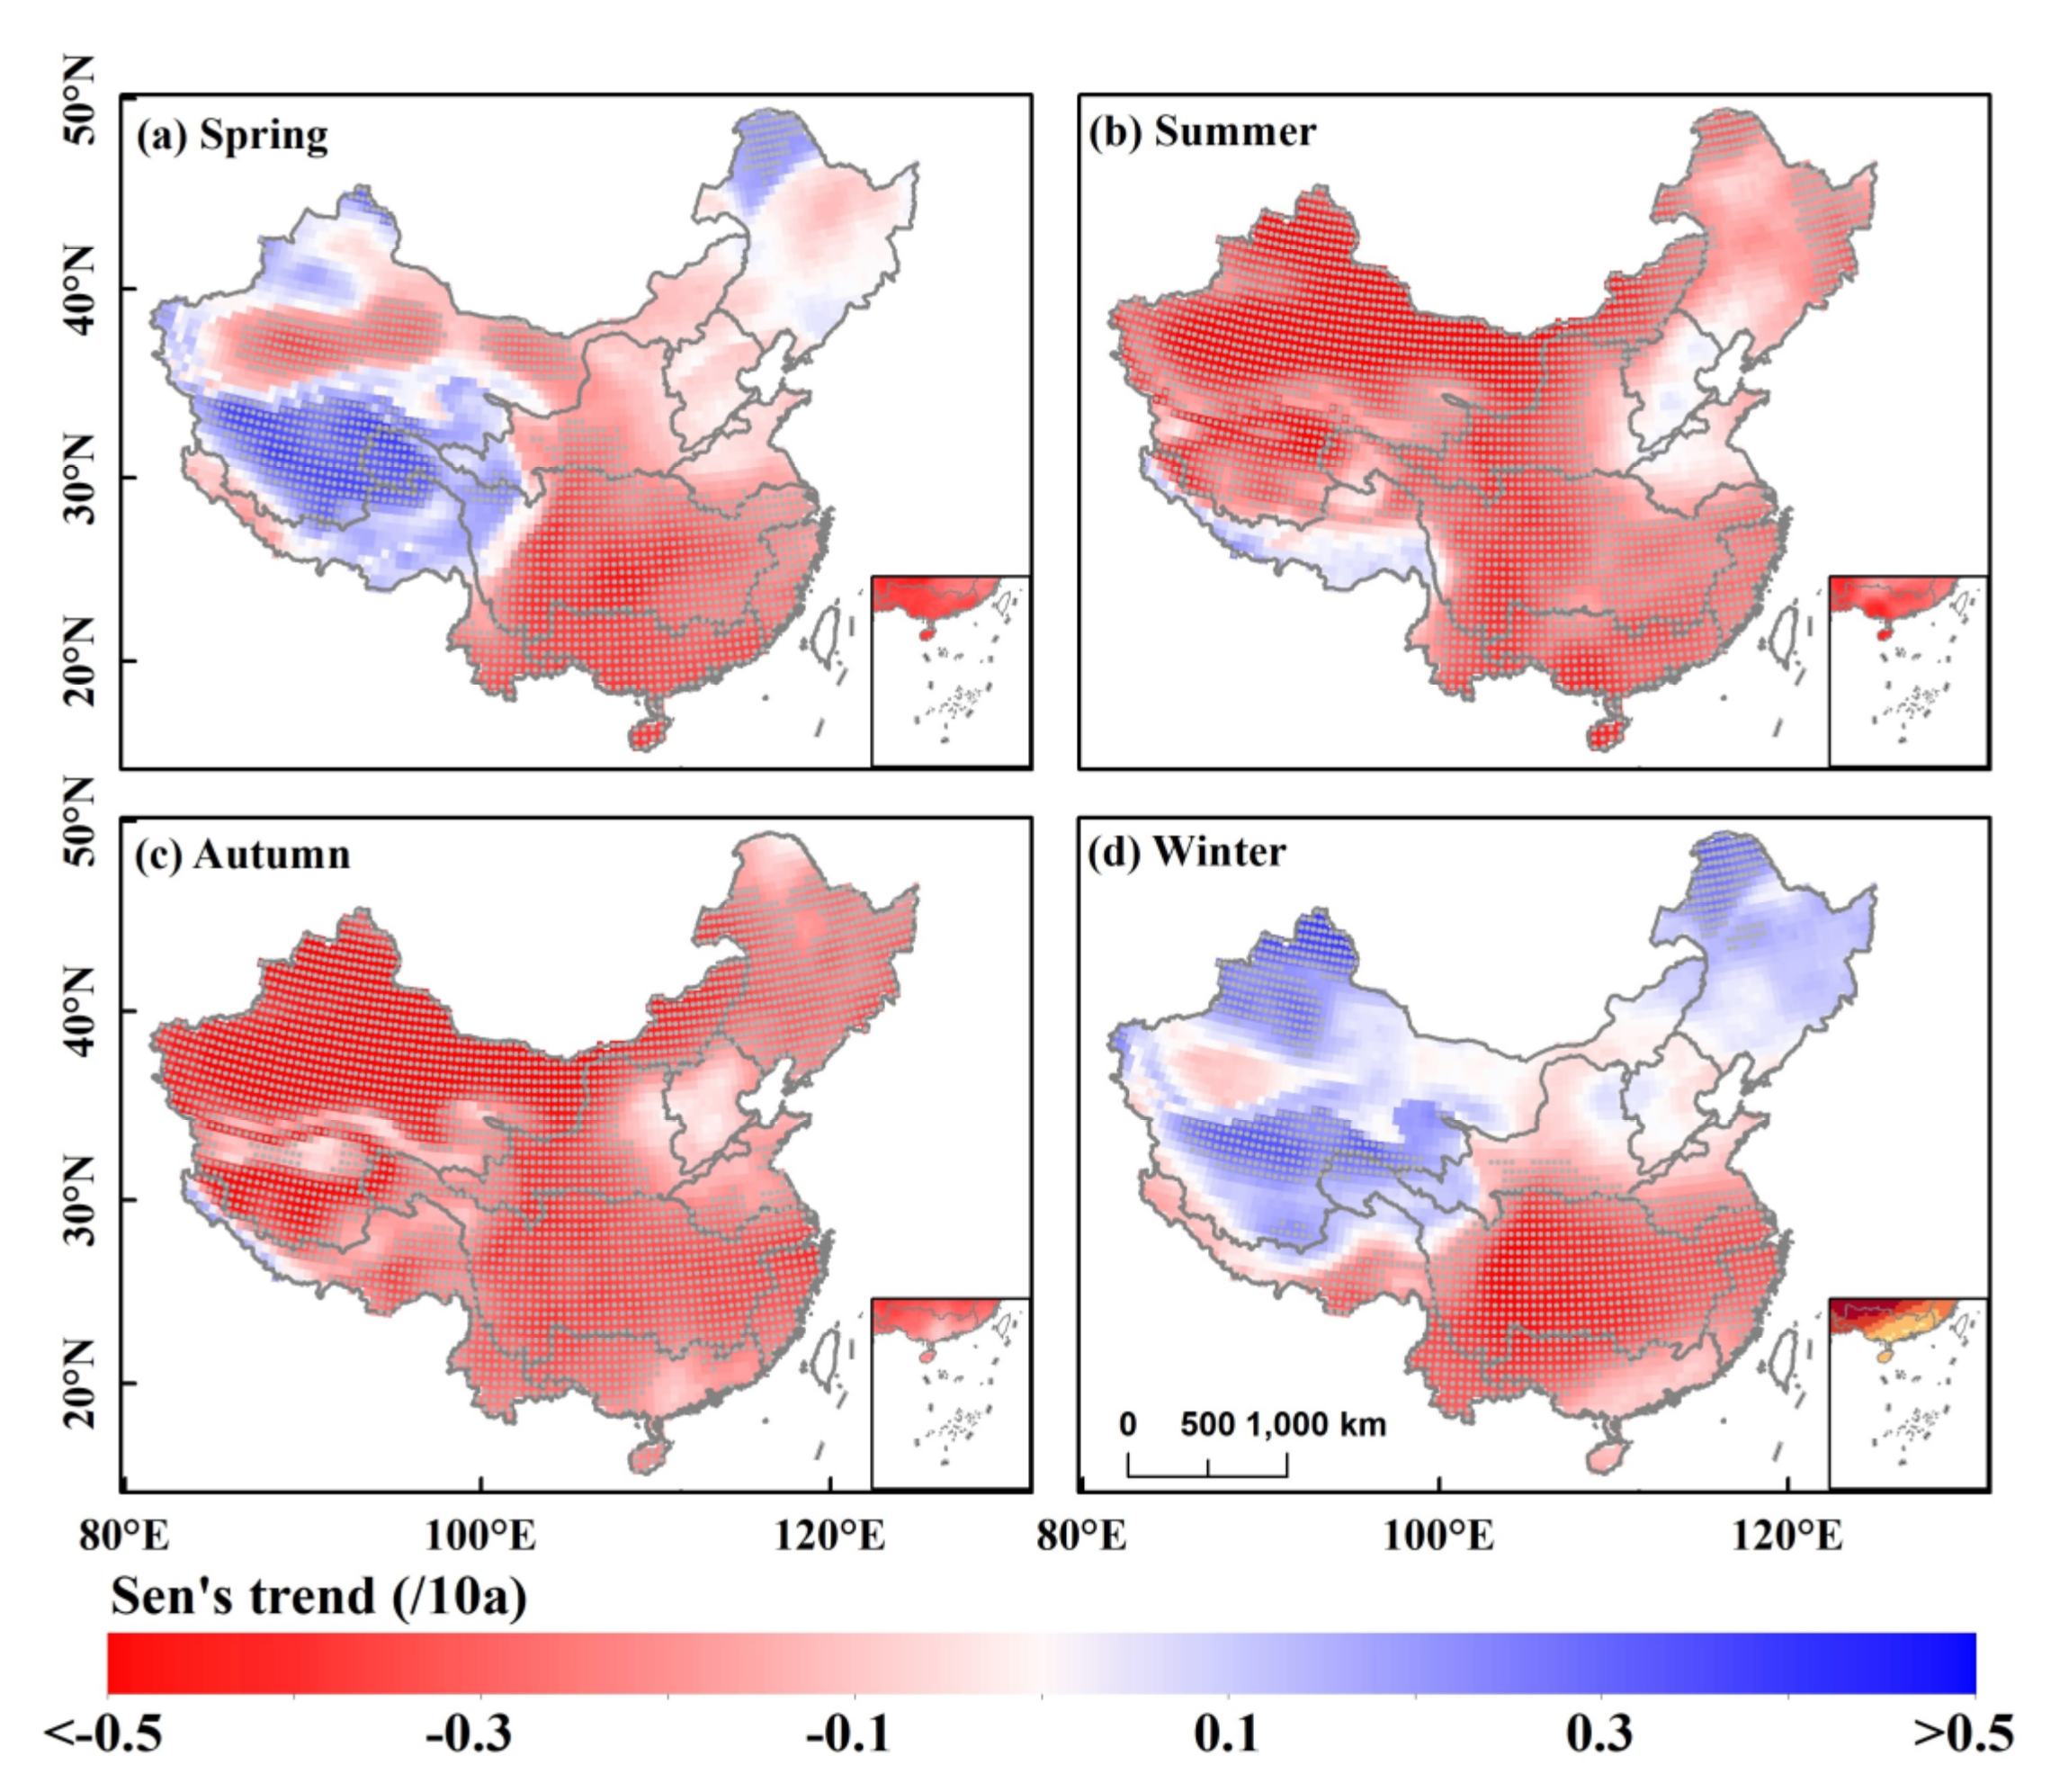
Figure 8.
Comparison of the spatial pattern of DF (a,d,g,j), (b,e,h,k) DD, and (c,f,i,l) DI across China under the (a–c) SSP1-2.6, (d–f) SSP2-4.5, (g–i) SSP3-7.0, and (j–l) SSP5-8.5 scenarios for the future period (2015–2099).
Figure 8.
Comparison of the spatial pattern of DF (a,d,g,j), (b,e,h,k) DD, and (c,f,i,l) DI across China under the (a–c) SSP1-2.6, (d–f) SSP2-4.5, (g–i) SSP3-7.0, and (j–l) SSP5-8.5 scenarios for the future period (2015–2099).
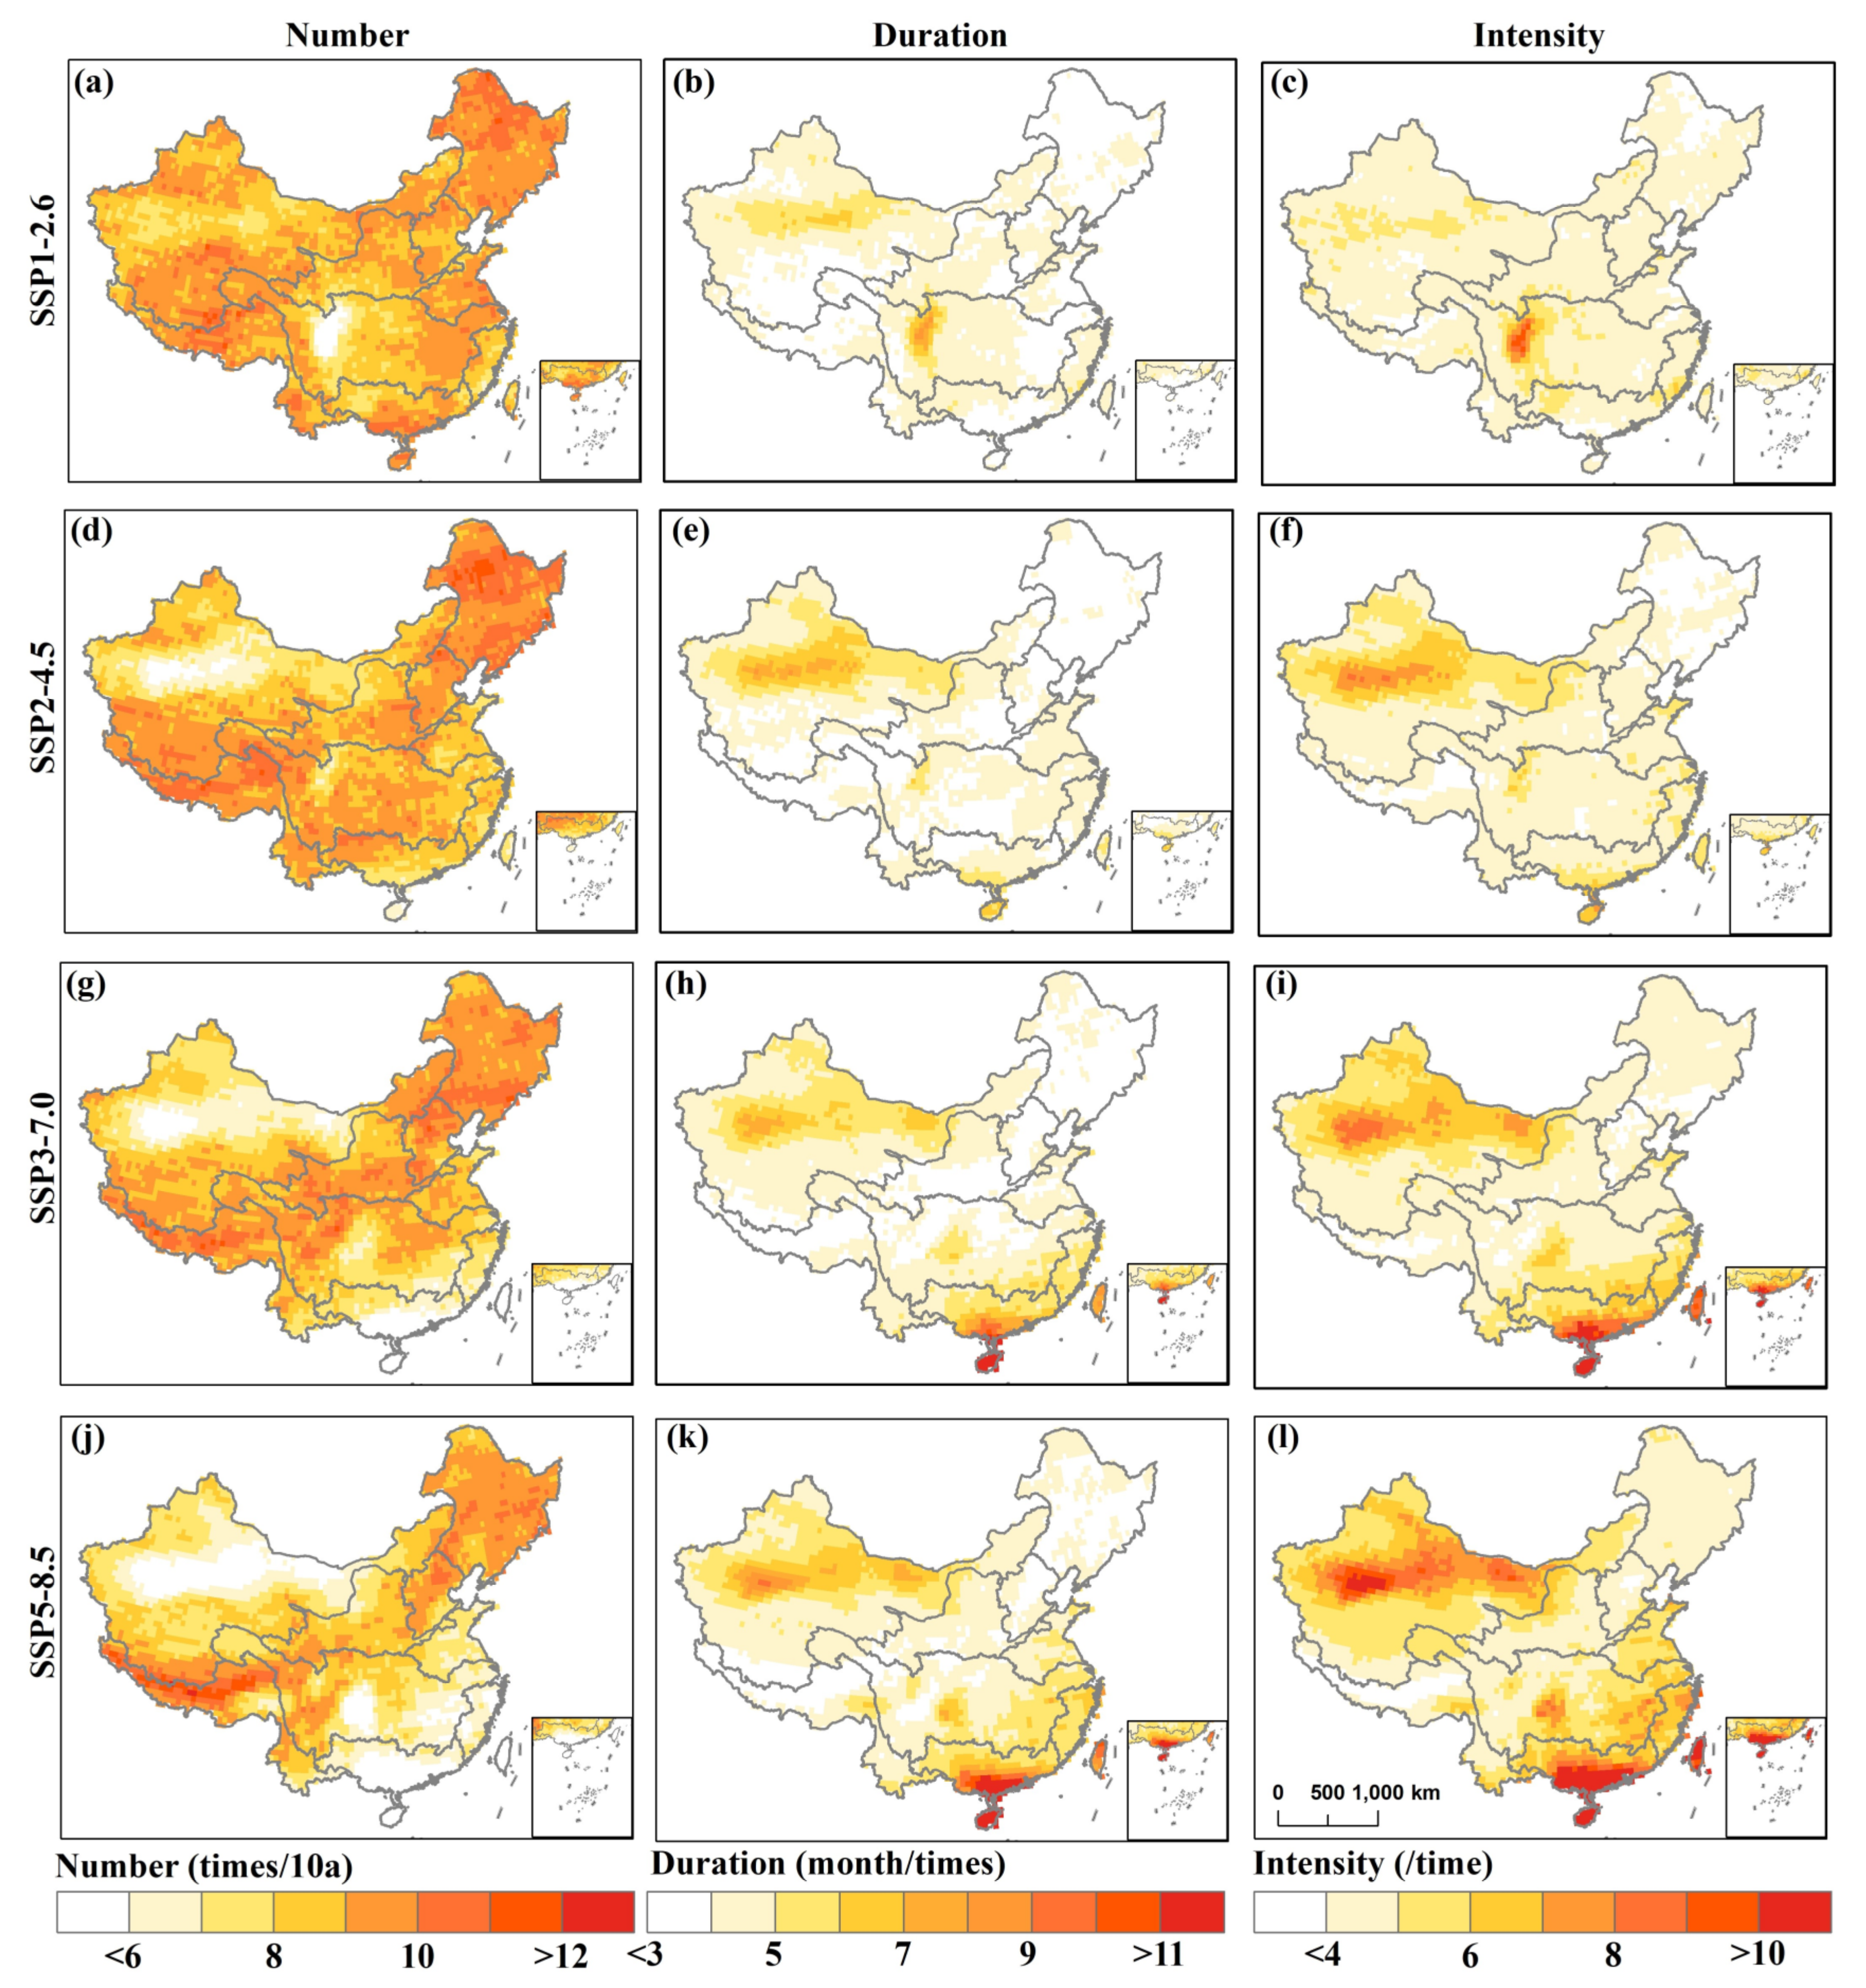
Figure 9.
Spatial patterns of differences in DF (a,d,g,j), (b,e,h,k) DD, and (c,f,i,l) DI across China between the future period (2015–2099) and the historical period (1961–2014) under the (a–c) SSP1-2.6, (d–f) SSP2-4.5, (g–i) SSP3-7.0, and (j–l) SSP5-8.5 scenarios.
Figure 9.
Spatial patterns of differences in DF (a,d,g,j), (b,e,h,k) DD, and (c,f,i,l) DI across China between the future period (2015–2099) and the historical period (1961–2014) under the (a–c) SSP1-2.6, (d–f) SSP2-4.5, (g–i) SSP3-7.0, and (j–l) SSP5-8.5 scenarios.
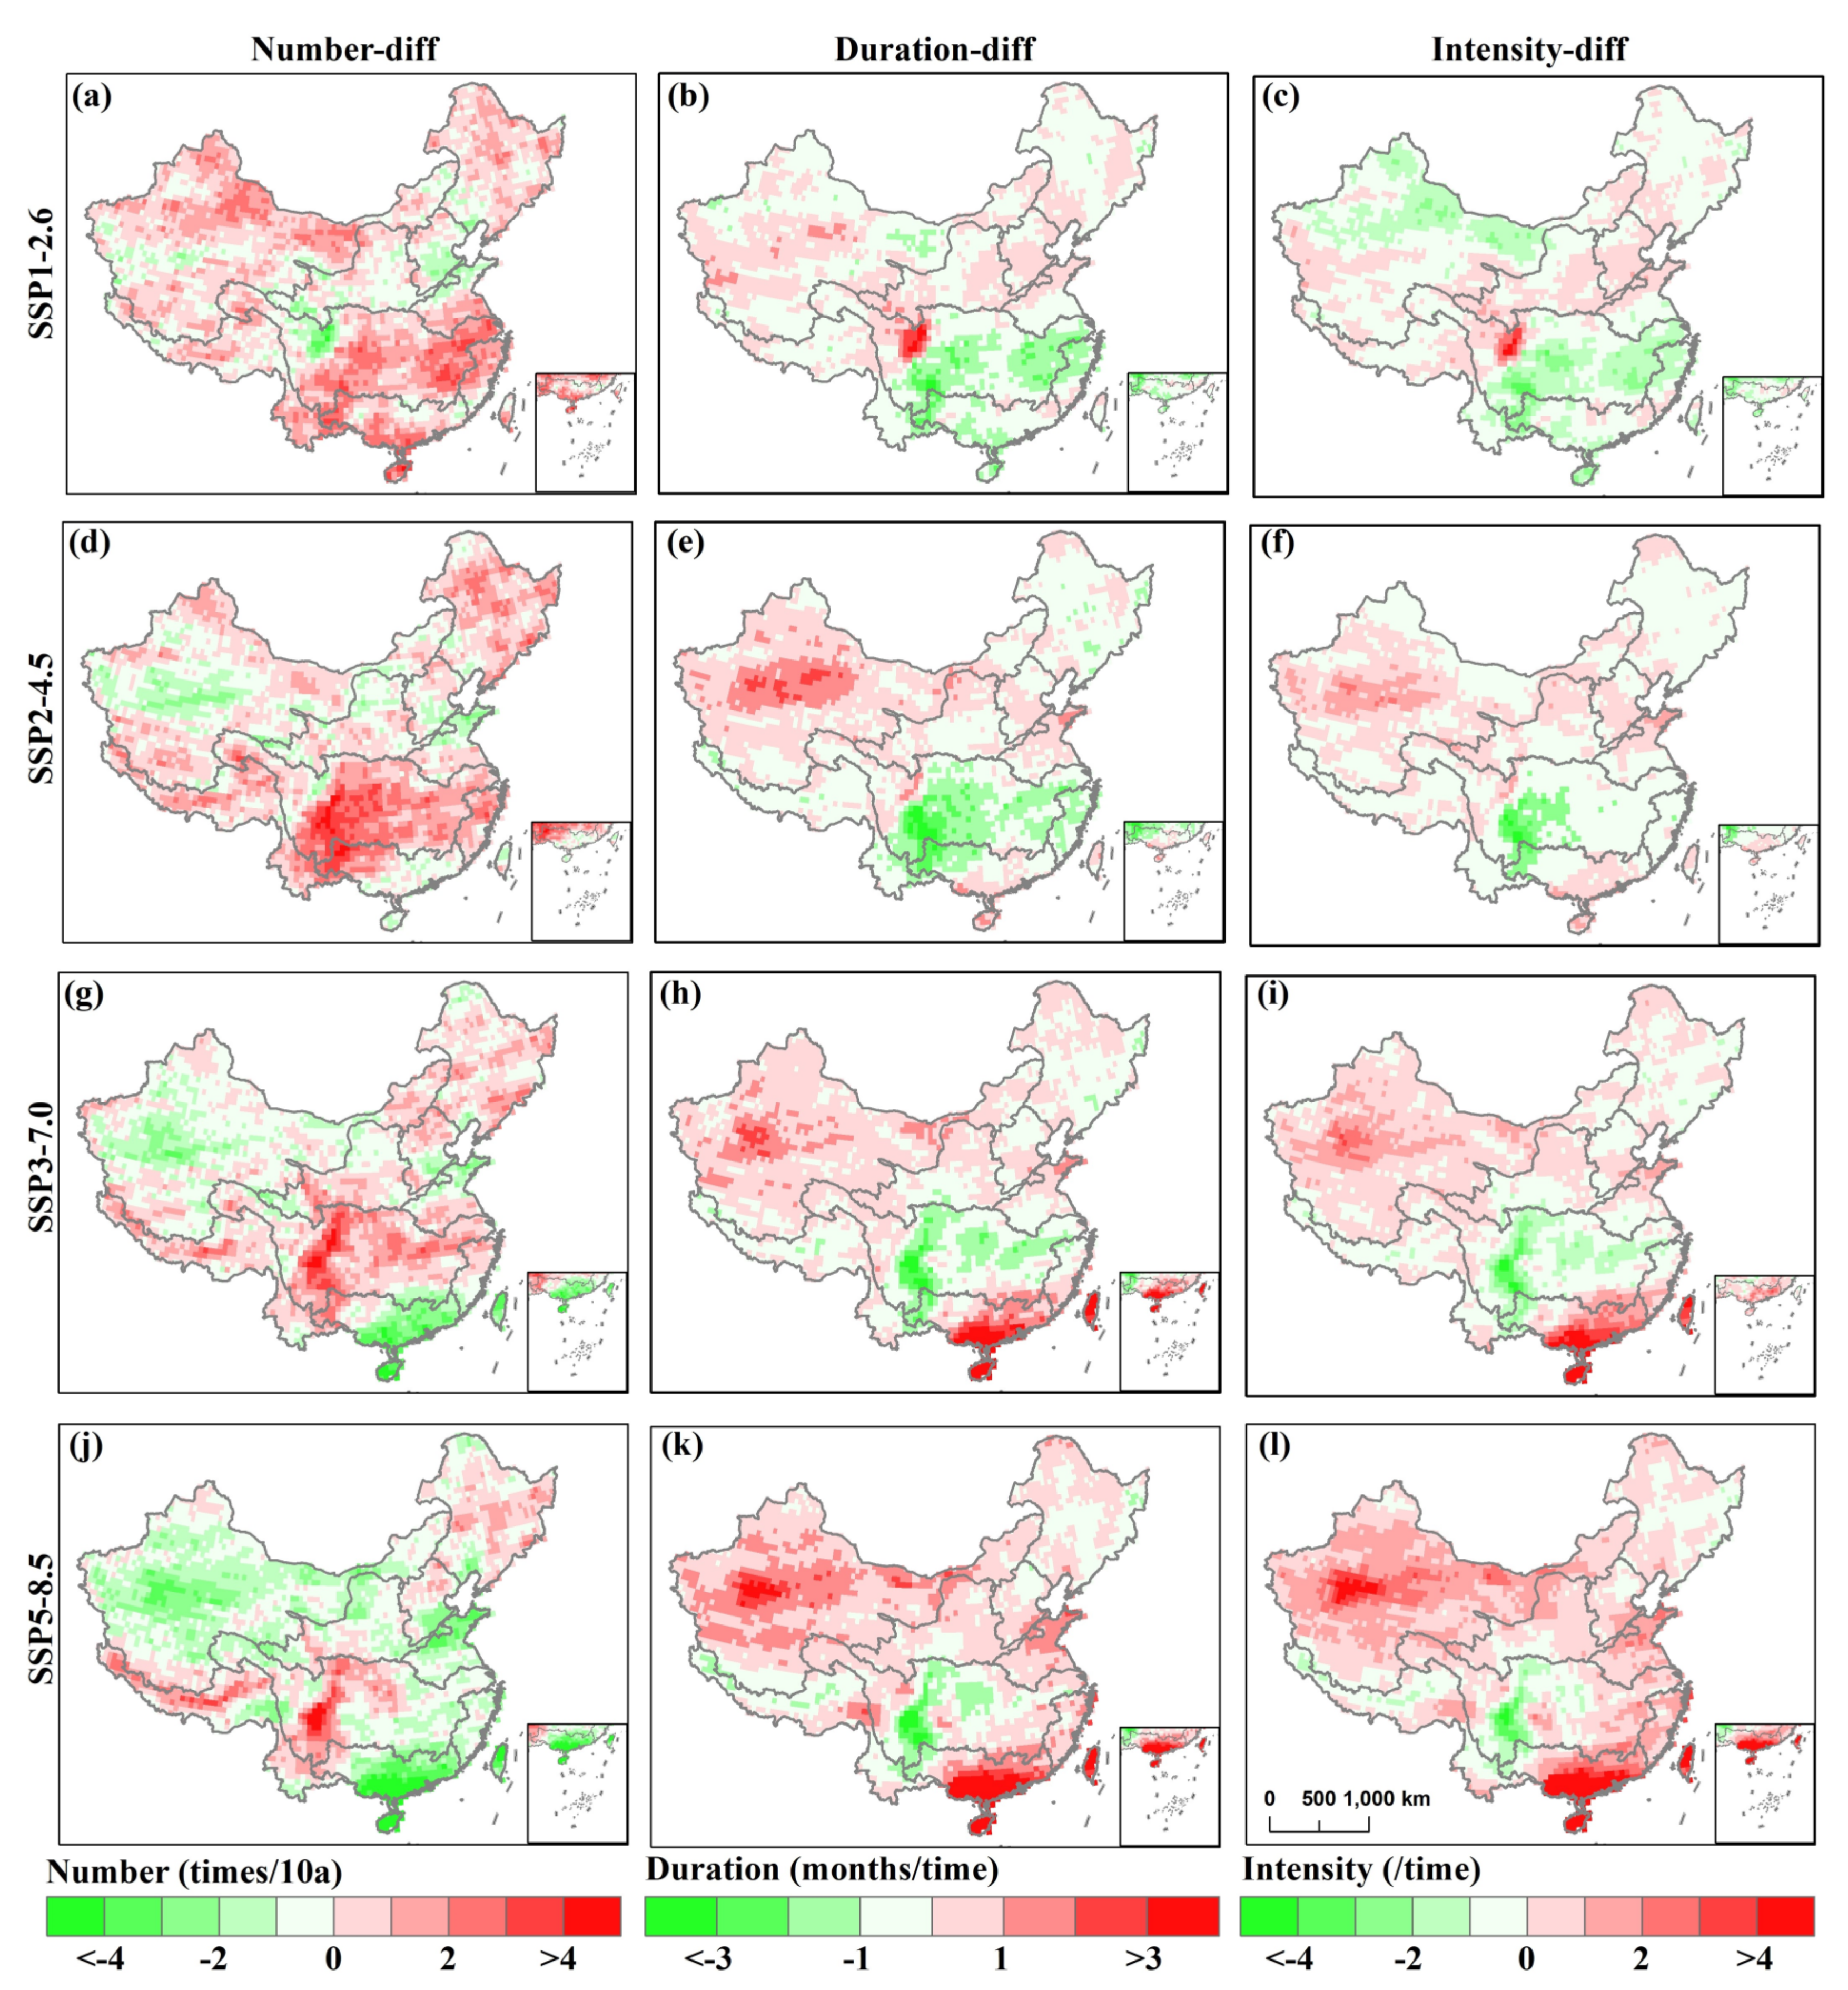
Figure 10.
Comparison of the spatial distribution in the total frequency of (a,d,g,j) moderate drought, (b,e,h,k), severe drought, and (c,f,i,l) extreme drought across China under the (a–c) SSP1-2.6, (d–f) SSP2-4.5, (g–i) SSP3-7.0, and (j–l) SSP5-8.5 scenarios for the future period (2015–2099). The frequency of moderate drought is the ratio between the total months when −1.5 ≤ SPEI03 < −1 and the total length of the time series. The frequency of severe drought is the ratio between the total months when −2 ≤ SPEI03 < −1.5 and the total length of the time series. The frequency of extreme drought is the ratio between the total months when SPEI03 < −2 and the total length of the time series.
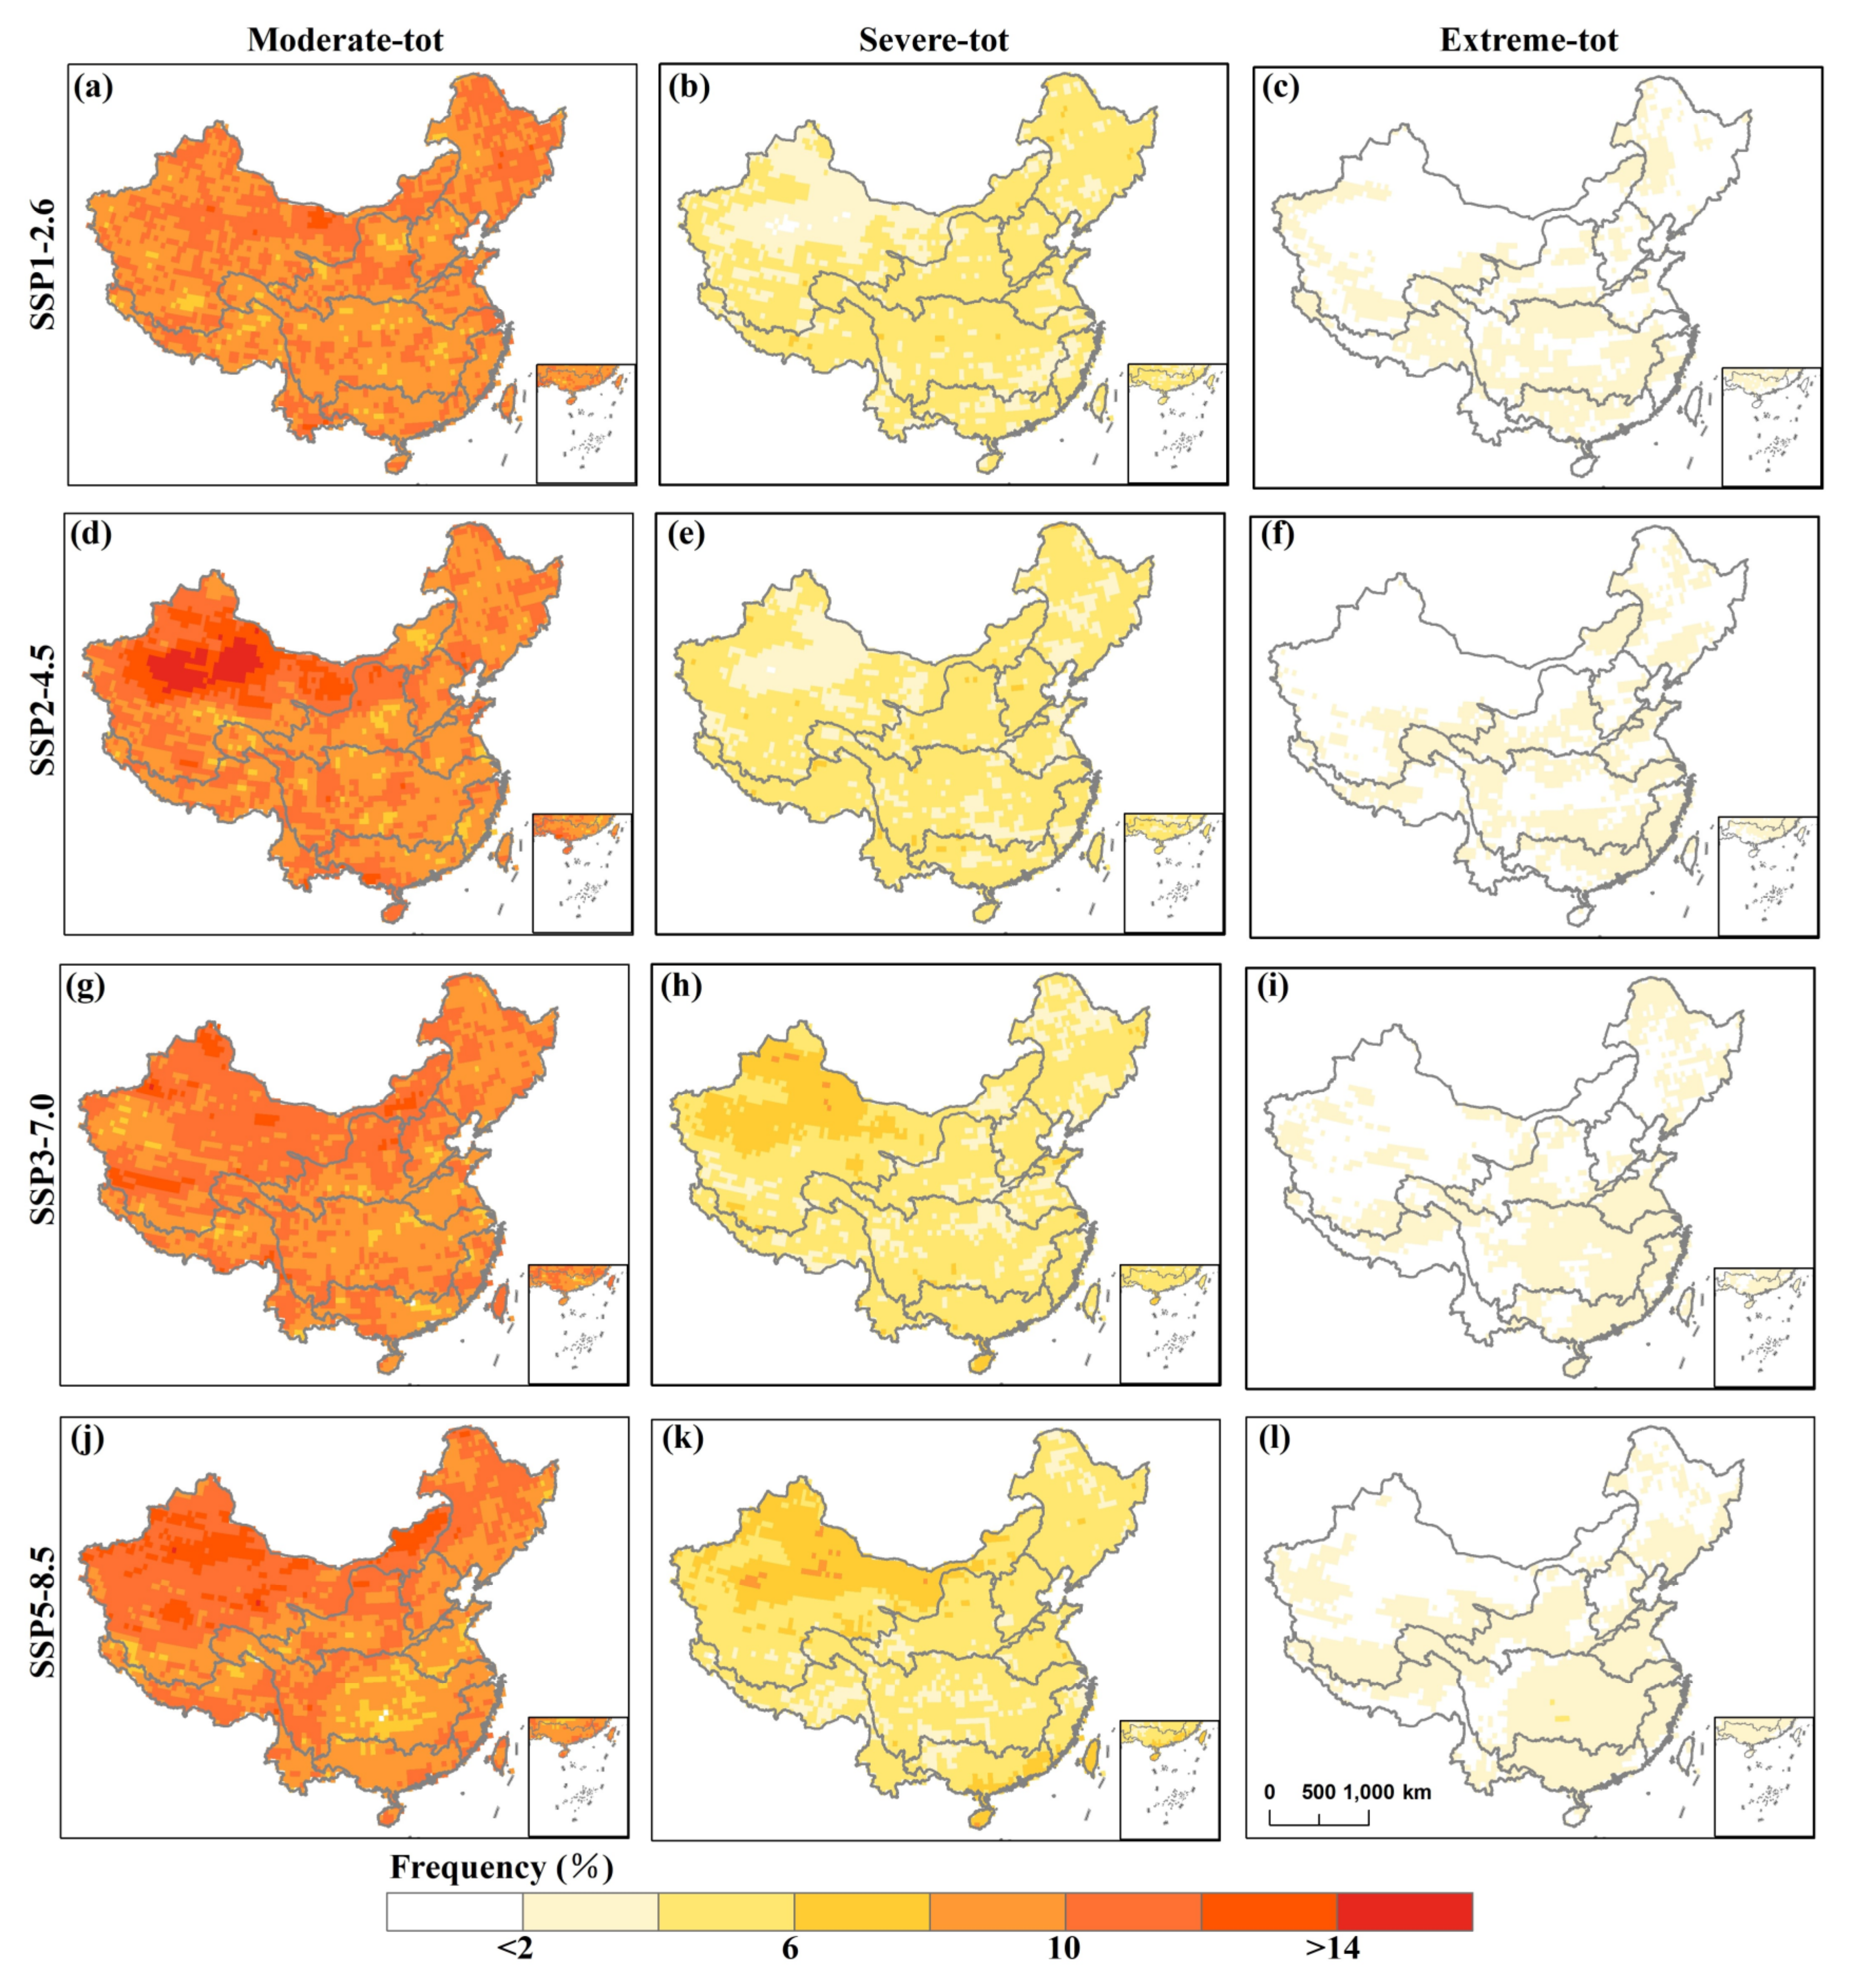
Figure 11.
Comparison of the spatial pattern of the difference in the total frequency of (a,d,g,j) moderate drought, (b,e,h,k) severe drought, and (c,f,i,l) extreme drought across China under the (a–c) SSP1-2.6, (d–f) SSP2-4.5, (g–i) SSP3-7.0, and (j–l) SSP5-8.5 scenarios for the future period (2015–2099). The frequency of moderate drought is the ratio between the total months when −1.5 ≤ SPEI03 < −1 and the total length of the sequences. The frequency of severe drought is the ratio between the total months when −2 ≤ SPEI03 < −1.5 and the total length of the sequences. The frequency of extreme drought is the ratio between the total months when SPEI03 < −2 and the total length of the sequences.
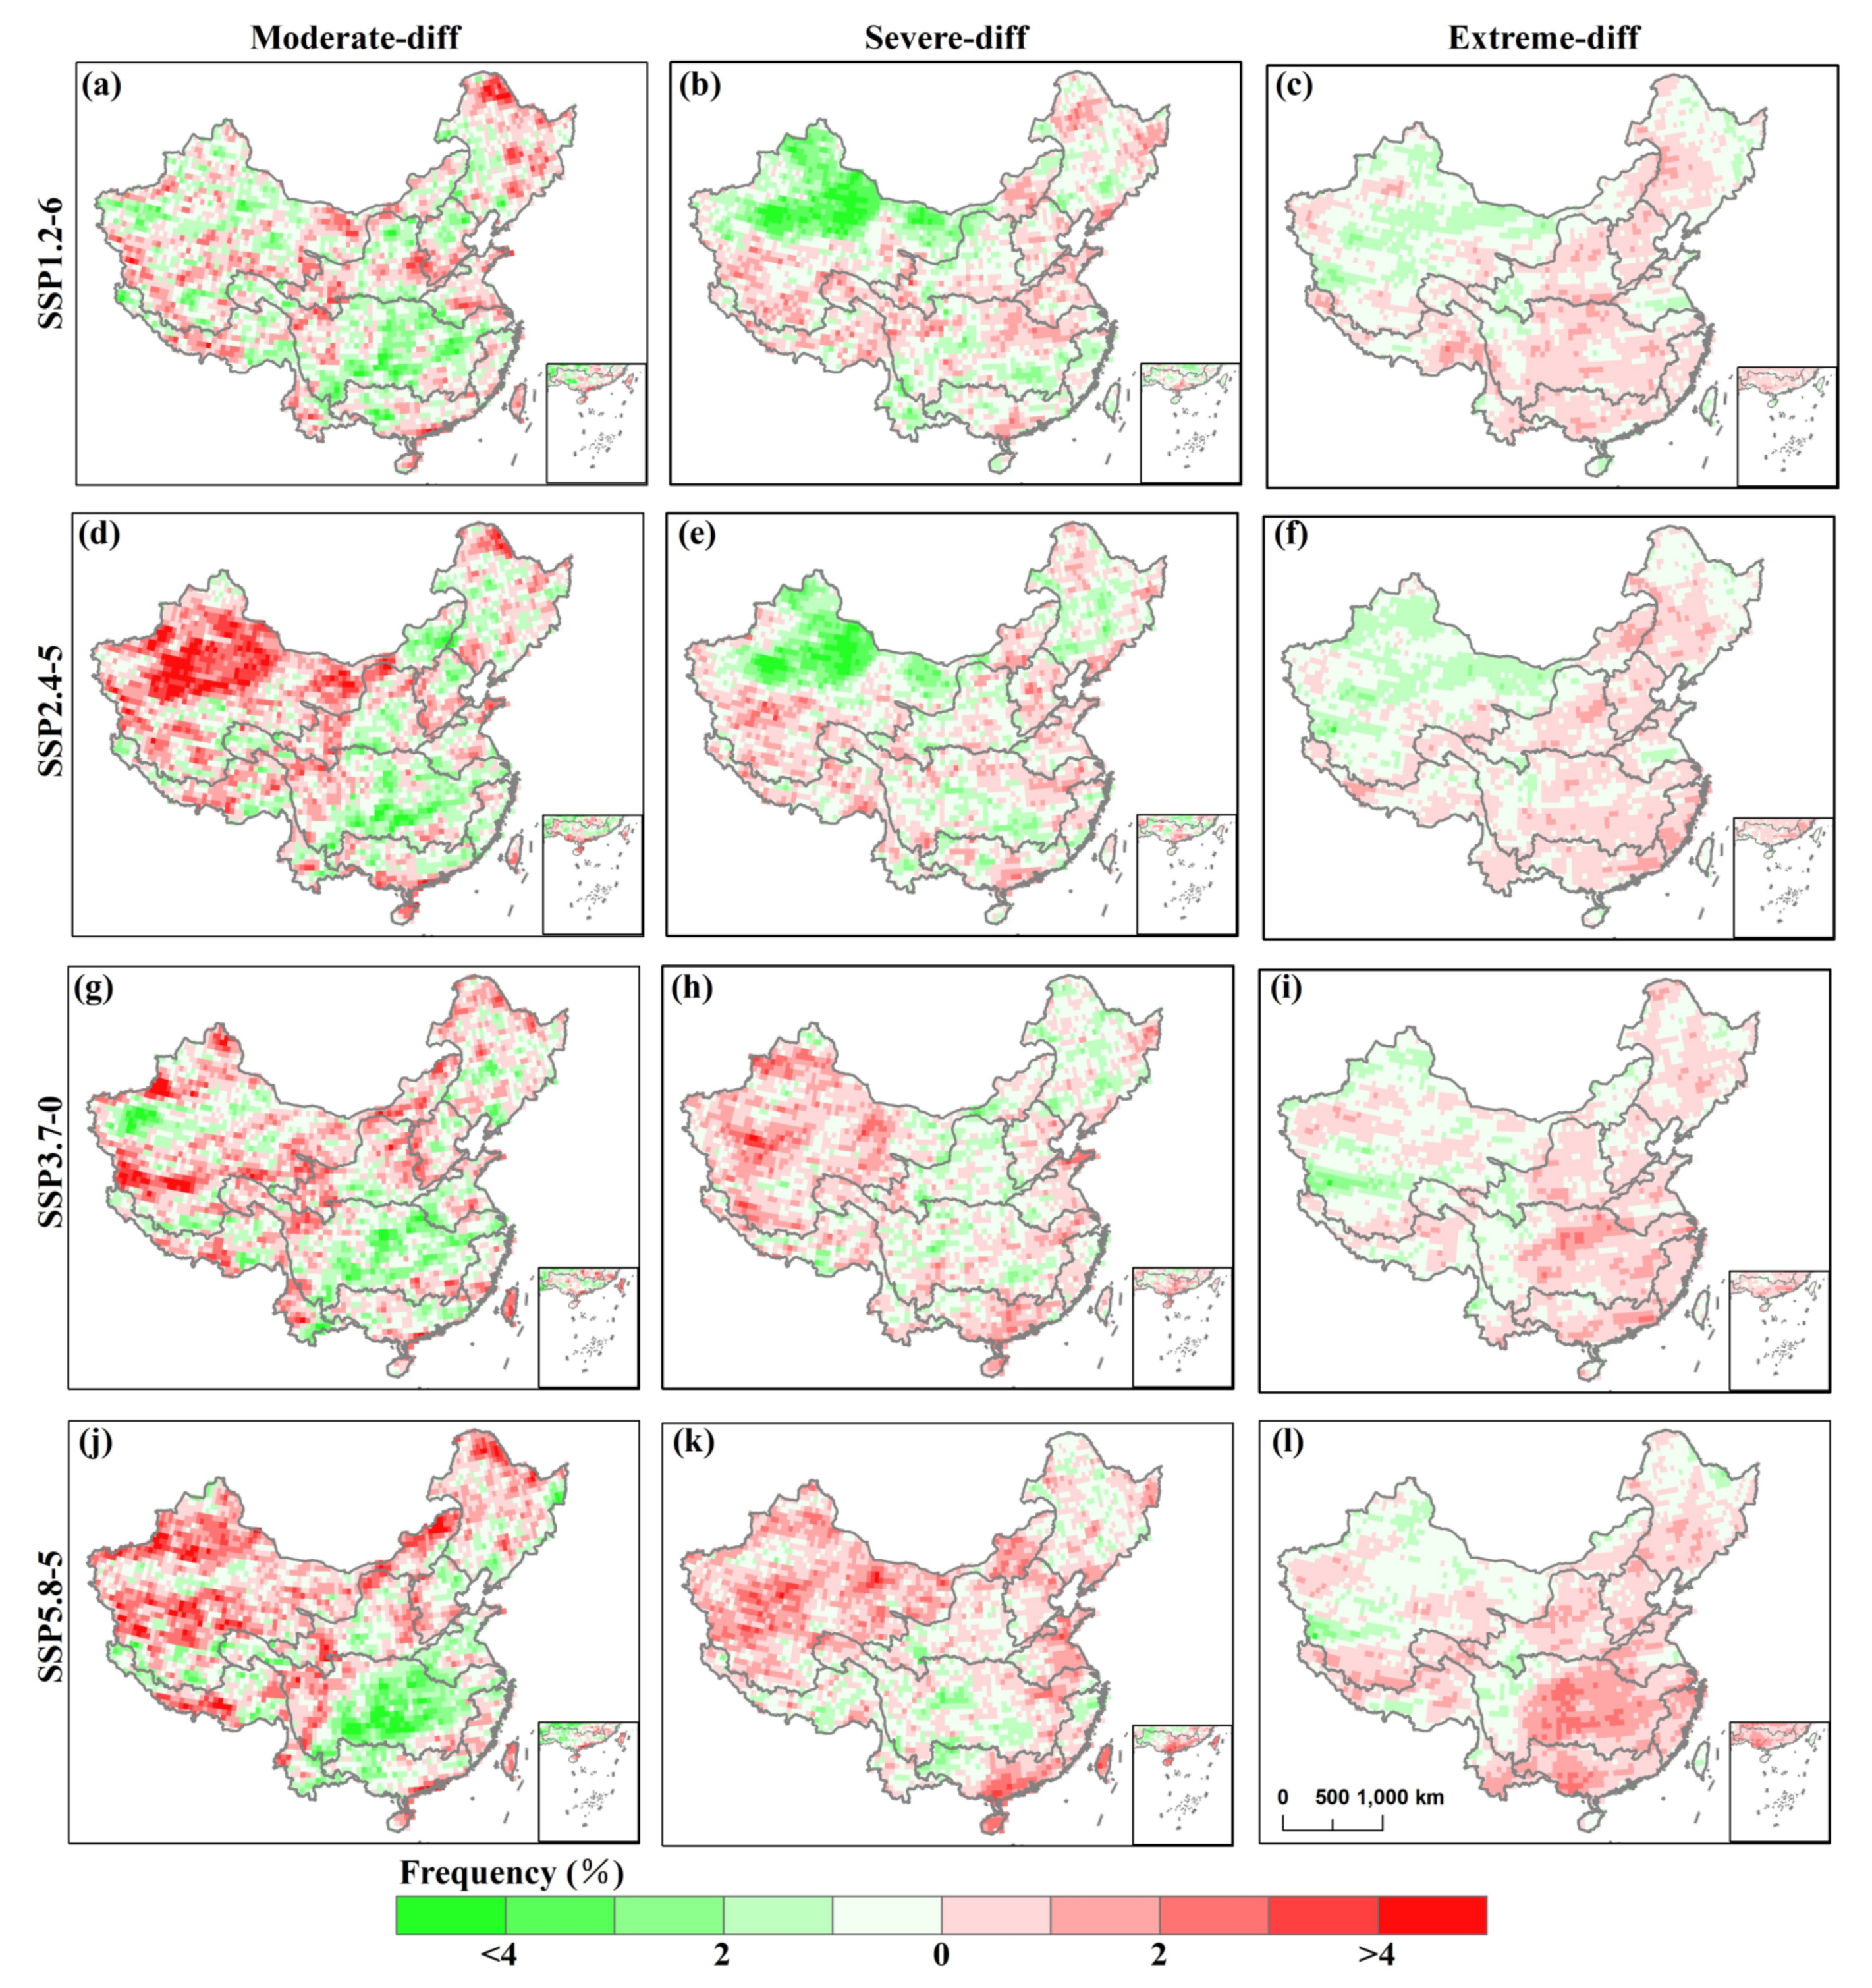
Figure 12.
Spatial patterns of the SPEI03-based drought trend in (a,e,i,m) spring, (b,f,g,n) summer, (c,g,k,o) autumn, and (d,h,l,p) winter across China under the (a–c) SSP1-2.6, (d–f) SSP2-4.5, (g–i) SSP3-7.0, and (j–l) SSP5-8.5 scenarios for the future period (2015–2099). The SPEI03-based drought trend was calculated using Equation (7) across China. Gray dots indicate significance at a 99% confidence level using the Mann–Kendall method. Among them, the division of seasons is consistent with Figure 7.
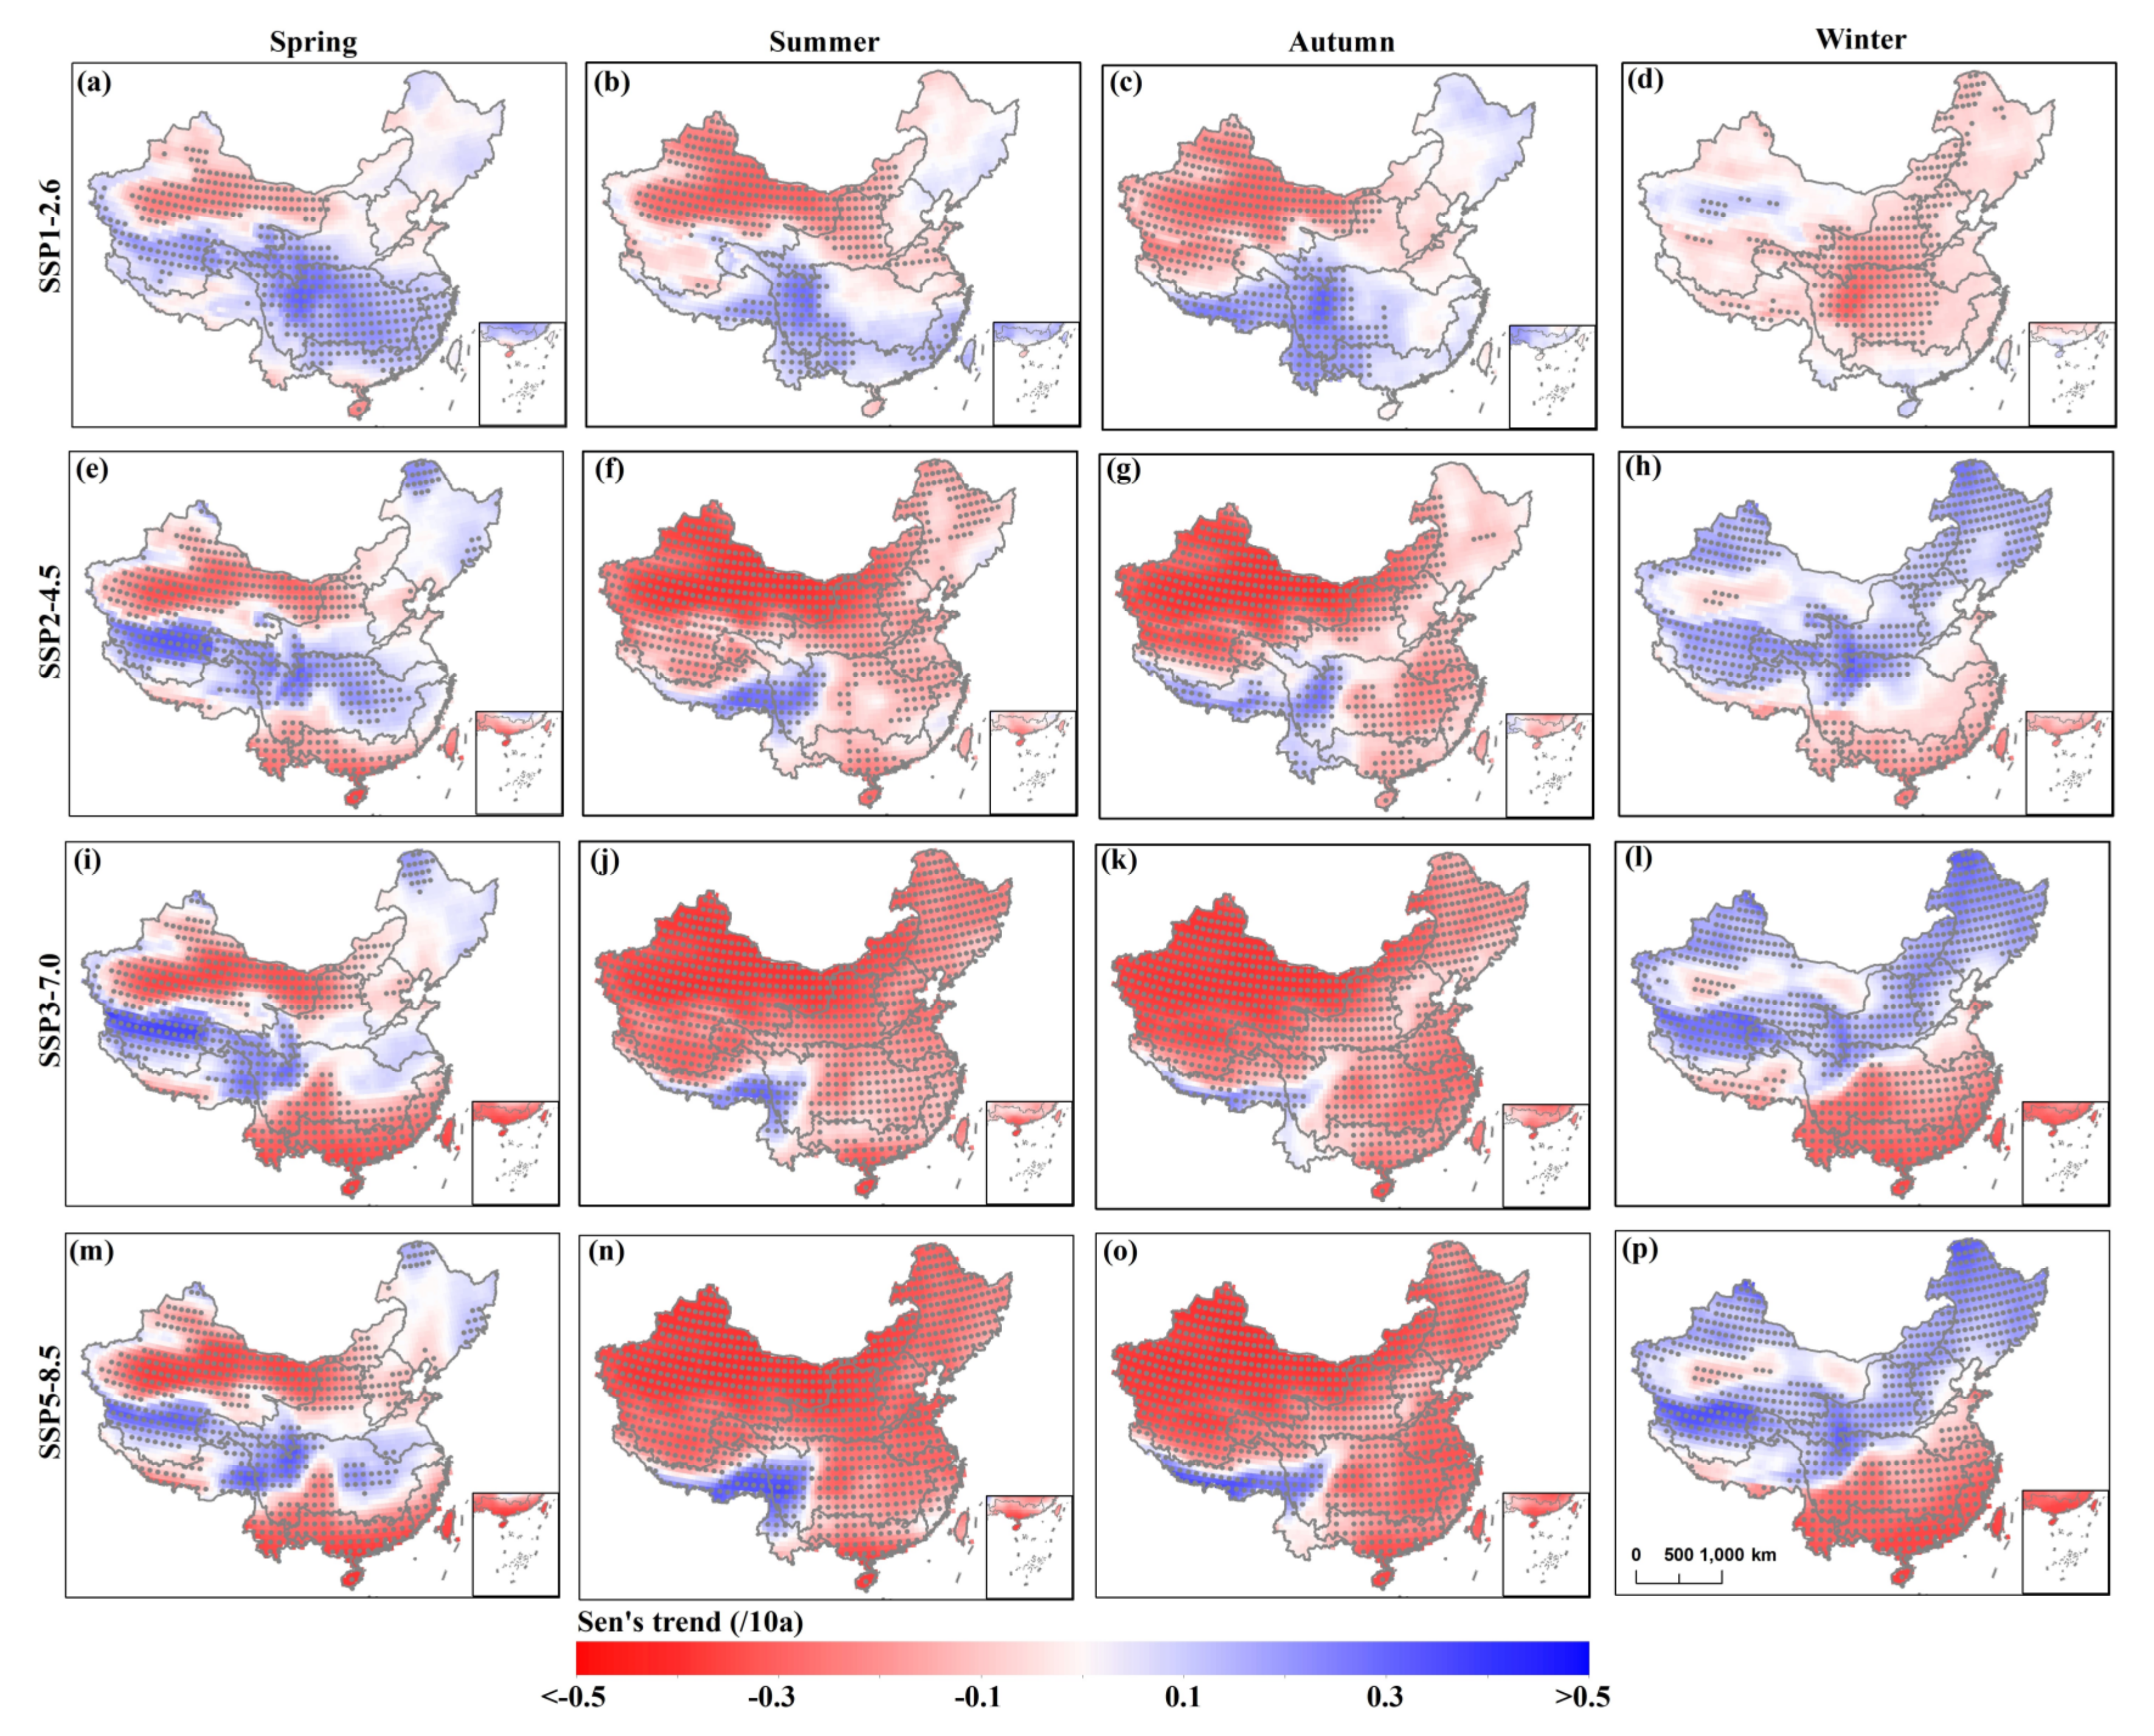
Figure 13.
SPEI03-based drought trends in (a) spring, (b) summer, (c) autumn, and (d) winter in nine sub-regions. Sen’s trend values were obtained by calculating the mean value of all pixels in nine basin sub-regions.
Figure 13.
SPEI03-based drought trends in (a) spring, (b) summer, (c) autumn, and (d) winter in nine sub-regions. Sen’s trend values were obtained by calculating the mean value of all pixels in nine basin sub-regions.

Table 1.
Coupled Model Intercomparison Project (CMIP6) models adopted in this study.
| No | Model | Institution | Country | Resolution |
|---|---|---|---|---|
| 1 | ACCESS-CM2 | CSIRO-BOM | Australia | 1.25° × 1.88° |
| 2 | ACCESS-ESM1-5 | CSIRO-BOM | Australia | 1.25° × 1.88° |
| 3 | AWI-CM-1-1-MR | AWI | USA | 0.94° × 0.94° |
| 4 | BCC-CSM2-MR | BBC | China | 1.10° × 1.10° |
| 5 | CAMS-CSM1-0 | CAMS | China | 1.10° × 1.10° |
| 6 | CanESM5 | CCCma | Canada | 2.81° × 2.81° |
| 7 | CanESM5-CanOE | CCCma | Canada | 2.81° × 2.81° |
| 8 | CESM2 | NCAR | USA | 1.25° × 0.94° |
| 9 | CESM2-WACCM | NCAR | USA | 1.25° × 0.94° |
| 10 | CMCC-CM2-SR5 | CMCC | Italian | 1.25° × 0.94° |
| 11 | CMCC-ESM2 | CMCC | Italian | 1.25° × 0.94° |
| 12 | CNRM-ESM2-1 | CNRM-CERFACS | France | 1.40° × 1.40° |
| 13 | EC-Earth3 | EC-Earth Consortium | Europe | 0.35° × 0.35° |
| 14 | EC-Earth3-Veg | EC-Earth Consortium | Europe | 0.35° × 0.35° |
| 15 | FGOALS-f3-L | CAS | China | 1.25° × 1.00° |
| 16 | GFDL-ESM4 | NOAA-GFDL | USA | 1.25° × 1.00° |
| 17 | IITM-ESM | IITM | Italian | 1.88° × 1.90° |
| 18 | INM-CM4-8 | INM | Russia | 2.00° × 1.50° |
| 19 | INM-CM5-0 | INM | Russia | 2.00° × 1.50° |
| 20 | IPSL-CM6A-LR | IPSL | France | 2.50° × 1.27° |
| 21 | MIROC6 | JAMSTEC | Japan | 1.40° × 1.40° |
| 22 | MIROC-ES2L | JAMSTEC | Japan | 2.81° × 2.81° |
| 23 | MPI-ESM1-2-HR | MPI-M | Germany | 0.94° × 0.94° |
| 24 | MRI-ESM2-0 | MRI | Japan | 1.13° × 1.13° |
| 25 | NorESM2-MM | NCC | Norway | 2.50° × 1.89° |
| 26 | TaiESM1 | CCliCS | China | 1.25° × 0.94° |
| 27 | UKESM1-0-LL | MOHC | Britain | 1.88° × 1.25° |
Table 2.
Categories of the drought based on the SPEI.
| Categories | SPEI Values |
|---|---|
| Normal | −0.5 ≤ SPEI |
| Slight dry | −1.00 ≤ SPEI < −0.50 |
| Moderate dry | −1.50 ≤ SPEI < −1.00 |
| Severe dry | −2.00 ≤ SPEI < −1.50 |
| Extreme dry | SPEI < −2.00 |
Publisher’s Note: MDPI stays neutral with regard to jurisdictional claims in published maps and institutional affiliations. |
© 2022 by the authors. Licensee MDPI, Basel, Switzerland. This article is an open access article distributed under the terms and conditions of the Creative Commons Attribution (CC BY) license (https://creativecommons.org/licenses/by/4.0/).
Share and Cite
MDPI and ACS Style
Ma, Z.; Sun, P.; Zhang, Q.; Zou, Y.; Lv, Y.; Li, H.; Chen, D. The Characteristics and Evaluation of Future Droughts across China through the CMIP6 Multi-Model Ensemble. Remote Sens. 2022, 14, 1097. https://doi.org/10.3390/rs14051097
AMA Style
Ma Z, Sun P, Zhang Q, Zou Y, Lv Y, Li H, Chen D. The Characteristics and Evaluation of Future Droughts across China through the CMIP6 Multi-Model Ensemble. Remote Sensing. 2022; 14(5):1097. https://doi.org/10.3390/rs14051097
Chicago/Turabian StyleMa, Zice, Peng Sun, Qiang Zhang, Yifan Zou, Yinfeng Lv, Hu Li, and Donghua Chen. 2022. "The Characteristics and Evaluation of Future Droughts across China through the CMIP6 Multi-Model Ensemble" Remote Sensing 14, no. 5: 1097. https://doi.org/10.3390/rs14051097
Note that from the first issue of 2016, this journal uses article numbers instead of page numbers. See further details here.