
Intra-Annual Variability of Evapotranspiration in Response to Climate and Vegetation Change across the Poyang Lake Basin, China


1
School of Culture Industry and Tourism Management, Sanjiang University, Nanjing 210012, China
2
Key Laboratory of Watershed Geographic Sciences, Nanjing Institute of Geography and Limnology, Chinese Academy of Sciences, Nanjing 210008, China
3
College of Hydrology and Water Resources, Hohai University, Nanjing 210024, China
4
National Earth System Science Data Center, National Science & Technology Infrastructure of China, Beijing 100101, China
*
Author to whom correspondence should be addressed.
Remote Sens. 2022, 14(4), 885; https://doi.org/10.3390/rs14040885
Submission received: 14 December 2021
/
Revised: 20 January 2022
/
Accepted: 10 February 2022
/
Published: 12 February 2022
(This article belongs to the Special Issue Remotely Monitoring Terrestrial Carbon, Water and Energy Fluxes in Ecologically Sensitive Areas)
Abstract
:Improving understanding of changes in intra-annual variability (IAV) of evapotranspiration (ET) and the underlying drivers is an essential step for modeling hydrological processes in response to global change. Previous studies paid special attention to climatic regulations of IAV of ET. However, ignoring the role of landscape characteristics (e.g., vegetation coverage) can introduce great uncertainty in the explanation of ET variance. In this work, the Poyang Lake Basin, which is a typical humid basin in China, was taken as the study area. It has experienced an obvious climate change and revegetation since the 1980s. Here, trends of IAV of ET and their responses to four climatic variables (i.e., air temperature, precipitation, downward shortwave radiation and wind speed) and vegetation coverage were explored from 1983 to 2014. The results show that IAV of ET exhibited contrary trends during the past decades. It significantly (p < 0.05) declined with a significant linear slope of −0.52 mm/year before 2000, and then slightly increased (slope = 0.06 mm/year, p > 0.05) over the basin, which was generally consistent with the IAV of temperature and radiation. The proposed variables could well capture the change in IAV of ET, while their dominators were different during the two contrasting phases mentioned above. The IAV of radiation and temperature dominated the change of the IAV of ET over 77.82% and 35.14% of the basin, respectively, before and after the turning point. Meanwhile, the rapid increase in vegetation coverage, which was associated with afforestation, significantly (p < 0.05) reduced IAV of ET over about 35% of the study area. The achievements of this study should be beneficial for a sophisticated awareness of responses of intra-annual variability of ET to climate and land cover changes at the basin scale.
1. Introduction
Evapotranspiration (ET) is the only way in which terrestrial water returns to the atmosphere in the earth system [1]. It is a crucial component to maintain land surface water and energy balance [2,3]. Terrestrial ET is mainly composed of two parts [4]. The first is plant transpiration, which is mainly controlled by leaf stomata, and the other is water evaporation from moist surfaces of vegetation and/or soil. Transpiration and evaporation are regulated by both abiotic (e.g., climate and soil) and biotic (e.g., leaf area and coverage) variables [5]. Hence, it is meaningful and challenging to understand comprehensive and complex responses of terrestrial ET to changes in climate and land cover.
Recently, variabilities of ET at the intra-annual time scale have been increasingly paid attention to [6,7,8,9]. It is a rhythmic characteristic of water loss, which is usually indicated by the standard deviation (SD) of ET (termed SDET) in a year [8]. The intra-annual variability (IAV) of ET plays a critical role in water cycle. On the one hand, ET and its components are the source of precipitation. The intra-annual distribution of ET may impact seasonal amounts of rainfall. On the other hand, ET could affect soil water content and consequently surface water reserves and water yield (i.e., streamflow). Hence, it regulates the allocation of surface water between vegetation and human needs, and even mitigates floods to some extent [10]. Therefore, it is quite valuable to investigate changes in IAV of ET and their dominant factors for deepening understandings of water cycle in response to global change.
Variabilities of terrestrial ET and the underlying causes have been widely investigated at multiple scales [11,12]. Generally, climatic variables are considered as the predominant drivers of ET variance. Temperature, precipitation, solar radiation, wind speed, etc., which are associated with evaporation demand and water supplement, have been applied to explain temporal and spatial characteristics of ET [13,14]. In particular, some scholars have explored the impacts of climatic variables on IAV of ET by diverse approaches. Based on the Budyko framework, Zhang et al. [8] pointed out that potential ET (termed ETp) dominated the intra-annual standard deviation of ET under energy-limited conditions, while precipitation was the major contributor of that under equitant and water-limited conditions across China. The study of Zeng et al. [7] showed that the sources of ET variability varied with space at the intra-annual scale. It suggested that the ET variance was regulated by precipitation in low altitude arid regions, whereas it was controlled by ETp in boreal regions. Overall, given the complex of the mechanism, responses of IAV of ET to climatic factors may be inconsistent and even contrary under different climate conditions [8].
In additional to climatic variables, biotic factors (e.g., physiological characteristics of vegetation) also significantly affect land surface ET [15]. At the regional scale, ET is mainly influenced by changes in vegetation coverage. Vegetation coverage could determine the allocation of water and energy between vegetation and soil and consequently affect ET and its components [16]. On the one hand, vegetation absorbs water from soil and increases the amount of water returning to the atmosphere by transpiration. On the other hand, a change in vegetation coverage would affect the partition of radiation between canopy and ground, and thereby impact soil and leaf evaporation. Furthermore, vegetation coverage also determines canopy precipitation interception. As known, afforestation is one of the most representative changes in vegetation coverage due to human activities. This process might change the water balance at the basin scale. Given the importance and complexity, impacts of vegetation cover change for afforestation on IAV of ET deserve special attention.
Recent studies usually investigated influences of climate and other factors on ET by comparative analysis between watersheds under different environments, e.g., dry and wet conditions. Actually, the results could just represent the spatial differences of ET responses [8]. However, a long-term change in IAV of ET and its responses to changes in climate and vegetation cover are still much less understood at the regional scale. In this work, the Poyang Lake Basin, a typical humid basin in central-eastern China, was taken as the study area to explore trends of IAV of ET from 1983 to 2014 and its abiotic and biotic dominators, using meteorological reanalysis and remotely sensed data. This study tried to answer the following questions: (1) how did IAV of ET vary across the basin which experienced a significant change in climate and vegetation coverage during 1983–2014? (2) Was there a dynamic effect of vegetation restoration on ET? (3) What were the major controllers of IAV of ET?
2. Materials and Methods
2.1. Study Area
The Poyang Lake Basin (24.5°N–30.1°N and 113.6°E–118.5°E, Figure 1) was selected as the study area for its outstanding changes in climate and land cover [17,18]. It is an important sub-watershed of the Yangtze River Basin with a quite developed river system. It contains five sub-watersheds, i.e., the Ganjiang Basin, Fuhe Basin, Xinjiang Basin, Raohe Basin and Xiushui Basin, as well as the biggest freshwater lake of China, Poyang Lake. The watershed size is about 1.6225 × 10⁵ km2, i.e., 9% of the total area of the Yangtze River Basin. The Poyang Lake Basin is a typical energy-limited basin with a sub-tropical monsoon climate [19]. That is, actual evaporation is limited by the rate of energy supply rather than water supply. The annual temperature and rainfall are in the range 16.3–17.5 °C and 1341–1943 mm, respectively.
The vegetation coverage across the basin experienced an obvious change during the past decades [18]. The Poyang Lake Basin suffered an intensive deforestation after 1950s, where forest coverage decreased to 33.1% in 1978. Then, with the implementation of afforestation, greening was widely observed across the basin. The forest coverage continuously increased since 1990s and raised to 63.1% until 2011. That is, the coverage showed a fast increase mainly resulting from anthropogenic activity. This provides a natural laboratory for learning impacts of vegetation restoration on IAV of ET. In our present work, the open water bodies of the Poyang Lake Basin were excluded from the subsequent analysis to minimize the effects of water exchange to evaporation.
2.2. Data and Processing
2.2.1. Evapotranspiration
Two long-term satellite-based ET datasets were adopted to calculate the IAV of ET in this study. The first was the Advanced Very High-Resolution Radiometer (AVHRR) monthly ET data (unit: mm/month) with a spatial resolution of 8 km from 1983 to 2006 [20,21]. The other was the Moderate-Resolution Imaging Spectroradiometer (MODIS) monthly ET product (unit: mm/month) with a resolution of 1 km covering the period of 2001–2014 [22,23]. For the relative high accuracy, these two datasets have been widely applied in studies on water cycle in response to climate change and human activities at multiple spatial scales [24,25]. In this study, both of these datasets were aggregated to grids of 1/12° × 1/12° to match the spatial resolution of the vegetation coverage data derived from remote sensing vegetation index mentioned below. Afterwards, the two ET datasets were fused according to the overlapping period to obtain a long time series from 1983 to 2014 [18]. Additionally, field observations of hydrological variables, including precipitation, soil moisture and runoff, were collected to validate our satellite-based ET data [26].
2.2.2. Climatic Variables
Four climatic variables, i.e., surface air temperature (AT, unit: °C), precipitation (PR, unit: mm h−1), downward shortwave radiation (SR, unit: W m−2) and wind speed (WD, unit: m s−1) were used in this study, which are recognized the principal regulators of ET [27]. They were obtained from a monthly dataset of the high-resolution Chinese Meteorological Forcing Dataset (CMFD) [28,29,30]. CMFD was made through fusion of satellite-, reanalysis- and in-situ station-based data with a spatial resolution of 0.1°. It is the first high spatial-temporal resolution gridded near-surface meteorological dataset and has been widely used in studies of land surface process in China [31,32]. In the present work, the monthly climatic data during 1983–2014 were resampled to the resolution of 1/12° by the nearest neighbor method to match the resolution of the ET data.
2.2.3. Vegetation Coverage
The Normalized Difference Vegetation Index (NDVI) product of NOAA Global Inventory Monitoring and Modeling System (GIMMS, version number 3g.v1) was adopted to calculate vegetation coverage across the study area [33]. This dataset covers the period of 1983–2014 with a temporal resolution of half-month and a spatial resolution of 1/12° (about 0.083°) [34]. After a series of corrections (e.g., orbital drift effects, calibration, viewing geometry, stratospheric volcanic aerosols and other errors unrelated to vegetation change) [35,36], GIMMS NDVI 3g.v1 is well consistent with other high-precision NDVI products (e.g., MODIS), and has been widely applied in detecting responses of vegetation to climate change over the world [37,38]. In this study, the maximum value composite was carried out for the NDVI dataset to further get rid of white noise points [39].
A long-term time series of vegetation coverage was derived following an improved approach described in Wang et al. [18]. This approach employed an optimized dimidiate pixel model, in which dynamic background values and Moderate-Resolution Imaging Spectroradiometer (MODIS) Vegetation Continuous Fields (VCF) (MOD44B) were used. By validation, the NDVI-based vegetation coverage of this work performed well against the field investigation data of vegetation cover which were collected from the Statistics Yearbook of Jiangxi Province and Statistics Yearbook of China [18,26]. Overall, the correlation coefficient (r) between them was 0.94, indicating that the satellite-based vegetation cover could appropriately capture the revegetation process in the Poyang Lake Basin.
2.3. Statistical Analyses
2.3.1. Trend Analysis
To detect changes of IAV of ET over the Poyang Lake Basin, two regression models, i.e., linear regression model (Equation (1)) and piecewise regression model (Equation (2)) [40], were adopted and compared. The former assumed there was only one trend over the entire study period, while the latter one assumed that the trend of SDET significantly changed during the past decades [41,42,43].
In the models, y indicates the standard deviation of monthly ET in a year (i.e., SDET), t indicates the year, and α indicates the turning point (TP) of the SDET time-series data. k, k1 and k2 indicate the magnitudes of global SDET trend, SDET trend before the TP and SDET trend after the TP, respectively. b, b1, b2 and ε indicate the intercept and the residual random error of the regression model, respectively. The models were fitted to the SDET time-series by the least squares approach. The performances of the models were evaluated by coefficient of determination (R2), root mean square error (RMSE) and Akaike information criterion (AIC). Generally, a model with a relatively lower AIC value performs better than another. In this study, the value of AIC was quantified following Peng et al. [43]. The difference between the AIC value of linear regression model and that of piecewise regression model (termed δAIC) was calculated. Here, if the δAIC was lower than −2, the piecewise regression model was significantly preferred, and vice versa. Additionally, changes in IAV of climatic variables and vegetation coverage were also detected over the study area.
2.3.2. Path Analysis
Relationships of IAV of ET to the climatic variables and vegetation coverage were explored by partial correlation analysis. Moreover, path analysis was applied to investigate direct effects of the environmental variables on IAV of ET pixel by pixel over the study area. In the analysis, path coefficients were standardized weights which can be used in examining the possible causal linkage between statistical variables [44,45,46]. In the present work, SDET was employed as the dependent variable, indicating IAV of ET. IAV of climatic variables (also indicated by the intra-annual standard deviation of the monthly variable), as well as yearly vegetation coverage (VC), were employed as independent variables. Specifically, the climatic variables included temperature (SDAT), solar radiation (SDSR), precipitation (SDPR) and wind speed (SDWD).
2.3.3. Analysis of Dominant Variable
According to the significance of the path coefficients, response patterns of IAV of ET to the variables could be recognized. Furthermore, the environmental variable with the highest absolute value of path coefficient (direct effect) was identified as the dominant variable of IAV of ET. To explore differences in the effects of climatic variables and VC throughout the continuous vegetation restoration, all of the analysis mentioned above were applied during the entire study period and the phases before and after the turning point.
3. Results
3.1. Changes of IAV of ET
Changes in IAV of ET, measured by SDET, were detected by both linear regression and piecewise regression in the Poyang Lake Basin (Figure 2). In general, SDET significantly (p < 0.05) declined from 26.2 mm in 1983 to 20.8 mm in 2014 over the entire basin, with a linear slope of −0.14 mm/year (Figure 2a). Similarly, significant (p < 0.05) decreases in SDET were observed in all of the sub-basins, despite variations in magnitude (from −1.0 to −1.7 mm/year) (Figure 2b–f). However, the piecewise regression model performed better, with a higher R2 (0.56) and lower RMSE (1.73 mm) and AIC (44.56), than the linear regression model (R2 = 0.25, RMSE = 2.27 mm, and AIC = 56.78) in capturing the change of SDET the across the Poyang Lake Basin (Table 1). The turning point of the SDET time-series was found in the year of 1999 (Figure 1). That is, the trend of IAV of ET remarkably changed over the Poyang Lake Basin during the study period. This result was consistent with that in each of the sub-basins. The differences of AIC between the piecewise and linear regression models were negative (with an average value of −10.91) across all of the sub-basins. The turning points of the SDET trend were found in 1999 across the sub-basins except the Ganjiang Basin (in 2002) (Figure 1). To minimize spatial heterogeneity, the year of 1999 was selected as the turning point for the subsequent analysis. Before 1999, the SDET significantly (p < 0.05) decreased by −0.52 mm/year, while it slightly (p > 0.05) increased by 0.06 mm/year after 2000 over the whole study area (Figure 1a). For the sub-basins, likely, the trends of the SDET ranged from −0.42 to −0.56 mm/year and from 0.3 to 1.3 mm/year before and after 2000, respectively (Figure 1b–f). Moreover, the spatial distribution of IAV of ET across the study area was investigated during different phases (Figure 3). The multiyear average value of SDET from 1983 to 2014 was 35.82 ± 4.01 mm over the Poyang Lake Basin. The low SDET values were mainly observed on the edge of the basin, where there are mountainous regions (e.g., the Raohe and Xiushui Basins) (Figure 3a). After 2000, IAV of ET further decreased in the regions with relative low SDET values, especially in the Ganjiang Basin. Whereas, it slightly enhanced in the central of the study area (Figure 3b,c), with an overall average SDET of 35.17 ± 4.24 mm during 2000–2014.
3.2. Effects of the Selected Variables on IAV of ET
Figure 4 shows the changes in IAV of the climatic variables and VC over the Poyang Lake Basin from 1983 to 2014. In general, IAV of radiation and temperature first decreased and then increased around 2000, which was very consistent with IAV of ET. In contrast, IAV of wind speed exhibited gradual decline, while that of precipitation varied without a significant trend. For VC, a continuous increase was observed over the study area. It rapidly increased to 60% from 1990 to 2000 due to revegetation and maintained a slow increase since 2000. Relationships of IAV of ET to IAV of the climatic variables and VC were investigated by partial correlation analysis over the Poyang Lake Basin and its sub-basins. Table 2a provides the average values of the coefficients of partial correlation (r) during 1983–2014. Significantly (p < 0.01) positive correlations between SDET and SDSR dominated the entire study area. That is, IAV of ET increased with IAV of radiation. On the contrary, an increase in VC reduced IAV of ET in most of the basin, showing significant (p < 0.05) negative correlation coefficients between SDET and VC in the study area except the Raohe Basin. The two phases before and after the turning point were taken into account in the analysis. During the first phase (1983–1999), both SDSR and VC were significantly (p < 0.05) correlated with SDET in most of the sub-basins (Table 2b). In other words, an increasing IAV of radiation and VC would substantially enhance and weaken IAV of ET, respectively, in the Poyang Lake Basin. Notably, the absolute values of correlation coefficient for VC during 1983–1999 were larger than those during the whole study period, indicating a greater effect of VC during a rapid revegetation. Generally, stronger effects of IAV of temperature, indicated by the significant correlation coefficients between SDAT and SDET, were observed in all of the sub-basins from 2000 to 2014 (Table 2c). In contrast, SDSR was only significantly (p < 0.05) associated with SDET in the Raohe Basin, where the effect of IAV of temperature was not significant anymore. Moreover, the relationship between VC and IAV of ET remarkably decoupled across the basin, where the correlation between VC and SDET was not statistically significant.
After that, the direct effects of the climate variables and VC on IAV of ET were quantitatively explored across the Poyang Lake Basin during the different periods. The spatial distribution of the significant path coefficients (p < 0.05) demonstrated IAV of solar radiation dominated IAV of ET from 1983 to 2014, followed by VC and IAV air temperature (Figure 5). IAV of radiation enhanced IAV of ET at most (about 85.3%) of study area (Figure 5c). Likewise, IAV of temperature also promoted IAV of ET in the central of the Poyang Lake Basin (24.2% of the area) (Figure 5b). A significant suppression of VC on IAV of ET was widely observed in the basin (47.7% of the area) (Figure 5a). IAV of precipitation significantly reduced IAV of ET as well, mainly in the Xiushui and Fuhe Basin, accounting for 24.2% of the area (Figure 5e). The significant effects of IAV of wind speed on that of ET were only observed in parts of the Xinjiang and Ganjiang Basin (about 5.6% of the area) (Figure 5d).
Figure 6 shows spatial distribution of the significant (p < 0.05) path coefficients of the climatic variables and VC before the turning point of 1999. Similarly to the entire study period, IAV of solar radiation mainly controlled IAV of ET across the Poyang Lake Basin (88.3% of the area), indicating that an increasing fluctuation of energy would greatly stimulate the seasonal deviation of ET. Significantly negative effects of VC were widespread in the basin as well, accounting for 35% of the area. However, IAV of temperature hardly impacted IAV of ET during 1983–1999. Only 7.3% of the study area occurred significant positive effects of temperature, mainly in central of the Xinjiang Basin and southern of the Ganjiang Basin. The areas regulated by IAV of precipitation and wind speed (7.4% and 4.3% of the area, respectively) were mainly located in the Xiushui and Xinjiang Basin before 2000. After 2000, the areas controlled by IAV of both radiation and VC remarkably reduced to 34.1% and 4.1%, respectively (Figure 7). The significant effects of IAV of temperature on the ET variance, in constant, widely expanded, which was observed in 40.7% of the study area. The response of IAV of ET to IAV of precipitation also enhanced in western of Ganjiang and Fuhe Basin. The effect of IAV of wind speed was still limited during 2000–2014.
3.3. Dominators of IAV of ET
According to the significant path coefficients of the climatic variables and VC, the response patterns of IAV of ET were categorized during the different study periods. Spatial distributions of the first six dominant patterns are shown in Figure 8. The result showed that Pattern I (SDSR) and Pattern V (SDSR + VC) were widespread, accounting for about 31.99% and 29.78% of the basin, respectively, from 1983 to 2014 (Figure 8a). The former one was mainly located in the Raohe and Ganjiang Basin, meanwhile the latter one widely occurred in the Ganjiang and Fuhe Basin. Similarly to the entire study period, Pattern I dominated the most area (51.99%) of the Poyang Lake basin, followed by Pattern V which was observed in 11.36% of the area during 1983–1999 (Figure 8b). After the turning point (i.e., the year of 1999), the patterns of IAV of ET in response to IAV of the variables gave a quite different picture (Figure 8c). Only 12.58% and 8.86% of the area showed Pattern I and Pattern V, respectively, mainly in the Raohe and Fuhe Basin as well. Pattern II (SDAT) were widely observed in the north of the Poyang Lake Basin (about 30.21% of the study area).
Furthermore, the dominator of IAV of ET was further identified for each of the pixels in the basin in light of the maximum absolute value of the significant path coefficient (Figure 9). During the entire study period, IAV of ET was dominated by IAV of radiation (i.e., SDSR) in the most (about 72.0%) of the Poyang Lake Basin (Figure 9a). VC and IAV of temperature (SDAT) followed that, accounting for 12.92% and 12.15% of the basin, respectively. Notably, the roles of both SDSR and VC were more important before the year of 1999 (Figure 9b). The area dominated by SDSR and VC increased to 77.82% and 18.0%. In contrast, the control of IAV of temperature to IAV of ET dramatically enhanced in north and central of the study area (35.14%) from 2000 to 2014 (Figure 9c), while the area dominated by IAV of radiation just decreased to 16.27% of the basin. However, there was a 39.46% of the area where IAV of ET was significantly regulated by none of the selected variables during this period.
4. Discussion
Improving understanding of changes in IAV of ET and the underlying drivers is an essential step for better modeling of water cycle in response to global change. Previous studies have suggested that the IAV of ET varied considerably over time with climatic variables [6,7,8]. However, both abiotic and biotic variables affect annual and seasonal ET [9,12,18], and ignoring the role of landscape characteristics (e.g., vegetation coverage) can introduce large biases in the prediction of IAV of ET. Our present work shows that the IAV of ET exhibited significant contrasting trends during the past decades across the Poyang Lake Basin, China (Table 1 and Figure 2). Moreover, the proposed variables (i.e., the climatic variables and vegetation coverage) could well capture the changes in ET variance (Table 2 and Figure 5, Figure 6 and Figure 7). Furthermore, during the different phases, the dominators of IAV of ET were different (Figure 9).
4.1. Roles of the Climatic Variables
It has been well reported that climate change controls terrestrial ET at regional and global scales [25,47]. The findings of this study also support this view. The study area, the Poyang Lake Basin, belongs to a typical subtropical humid climate under energy-limited conditions [8,19]. Hence, energy, indicated by downward shortwave radiation, dominated IAV of ET in light of not only the significant correlation between SDET and SDSR but also its control areas (Table 2 and Figure 8). Moreover, the turning points for both IAV of ET and radiation were found in 1999 by the piecewise regression analysis. Additionally, a synchronous decrease in ET and radiation in summer (June–August) was observed from 1983 to 1999. All of these manifested the role of radiation on the ET variability. Evaporation demand, which is mainly driven by temperature [47], is another dominator of ET in humid basins. An increase in air temperature would enhance vapor pressure deficit (VPD) and thereby potential evapotranspiration (ETp). If soil moisture is sufficient, ET would be stimulated with an increasing ETp [48]. It has been reported that the Poyang Lake Basin has experienced an obvious warming since 1998 [49]. In our analysis, we found that SDAT also rose after 1998 because temperature increased in summer whereas decreased in winter. This was high consistent with the turning point of SDET at the year of 1999. Among the selected variables, only SDAT and VC significantly changed after 1999. However, the correlation between IAV of ET and VC seemed to be severely weakened due to the slow-down of the revegetation (Figure 8). Hence, the increase in SDET might be attributed to the enhanced fluctuation of seasonal temperature with asymmetric warming after 1999. Compared to energy and evaporation demand, the areas dominated by water supply (i.e., precipitation) were limited, mainly in the Ganjiang, Fuhe and Xiushui Basin. It may be associated with the relatively sufficient water supplement. As previously reported, ET variance is more sensitive to precipitation fluctuation in water-limited environments (e.g., arid climates) than other conditions (e.g., humid climates) [50,51]. Although wind speed plays an important role in evaporative demand, it slightly impacted IAV of ET over the study area, which is agreed to the previous study [12,19].
4.2. Roles of Vegetation Coverage
In addition to the climatic variables, increased controls of vegetation on terrestrial ET are observed over the entire world [24]. The Poyang Lake Basin experienced a dramatic reforestation from 1980s to 1990s, with a two-fold increase of the total vegetation coverage [18]. This restoration period was just consistent with that when SDET significantly decreased, showing a tight coupling between VC and IAV of ET. After 2000, the growth of VC slowed down, and meanwhile SDET started to exhibit an adverse trend across the basin. It indicates that a rapid restoration would promote the seasonal fluctuation of ET to become more stable (i.e., a decrease in SDET). Two potential causes accounted for the decline in SDET with the increasing vegetation cover. On the one hand, an expansion of vegetation leaf area could diminish the amount of strong solar radiation on soil surface in summer, resulting in a decrease in soil evaporation [18,52]. On the other hand, high ET in a well vegetated area would take heat away and raise air relative humidity [53]. Hence, it could induce a decrease in air temperature and VPD to some extent, and further a decline of evaporation demand, especially in the humid regions [54]. That is, the cold island effect of afforestation would further weaken the terrestrial ET. Both of the pathways mentioned above would lead to lower summer ET and consequently minor IAV of ET. Compared to a sparse vegetation, restoration may produce a systematic shift between water cycle components [16,18]. Overall, an increase in VC could reduce the fluctuation of ET in a year cycle so that maintain the water content of soil. This is beneficial to enhance the stability of water cycle at the basin scale, as well as resistance of terrestrial ecosystem to climatic extremes. Notably, this positive effect of afforestation may just occur in humid basins, whereas it seems to be reversed over arid regions due to the strong evaporation demand [9]. Moreover, the decline in SDET in response to revegetation might be observed in areas where VC dramatically increased. As shown in this study, despite a continuous but slight increase, SDET seemed to be insensitive to VC after that was over 60%, implying a limited role on IAV of ET [12].
4.3. Uncertainties and Further Study
In our present work, a few limitations should be acknowledged. First, although both the AVHRR and MODIS ET data have been widely evaluated and applied, there are still uncertainties in their forcing data, retrieval algorithm and parametrized scheme [25]. One of the most noteworthy problems is the static land cover data adopted in the ET estimation, which were used to set the physiological parameters (e.g., potential stomatal conductance) and constraints on stomatal conductance (e.g., minimum air temperature) [20,23]. To this point, a previous study investigated the impacts of land cover change on the data quantity of AVHRR and MODIS ET during the past decades over the Poyang Lake Basin [18]. It showed that the AVHRR and MODIS ET data worked properly, because the conversions between the land cover types did not significantly alert the key parameters or marginally impacted to the variation in ET in the study area [20,55]. However, given land cover changes, the constant parametrization of land classification inevitably induced errors in the ET calculation. It is necessary to develop a reliable scheme in which land cover types could be well identified for ET inversion in future study. Second, the direct effect of each of the regulators on IAV of ET was examined by path analysis. Despite statistical independence among the four climatic variables over the most areas of the Poyang Lake Basin, the collinearity might be inevitable due to the temperate monsoon climate [56], which is another source of uncertainty in this study. Third, the intra-annual standard deviation of the climatic variables could not fully represent influences of extreme events (e.g., seasonal drought [57]), weakening the explanatory power of the abiotic regulator of ET. Forth, the result showed that there were lots of areas where all of the selected variables could not account for the change of SDET during 2000–2014 (Figure 8). This might be associated with the mountain topography at the upstream region of the sub-basins, which is needed to be further investigated. Finally, interferences of human activity, e.g., water management over the cropland of the study area, also leaded to uncertainties of the present results. Nevertheless, despite the uncertainties mentioned above, the findings of this work explicitly demonstrated that both the climatic variables and vegetation coverage play key roles in regulating IAV of ET, and the role of the variables varied in space and time. Hence, we suggest that the hydrological response and feedback should be interpreted by not only abiotic but also biotic variables (e.g., vegetation coverage) to avoid omissions of useful signals.
5. Conclusions
This study presented changes of intra-annual variability (IAV) of ET and the responses to climatic variables and vegetation coverage over the Poyang Lake Basin in China from 1983 to 2014. Our findings demonstrate that IAV of ET showed contrary trends across the study area during the past decades. It statistically significantly decreased with a linear slope of −0.52 mm/year before 2000, and then increased (slope = 0.06 mm/year) despite no significant. The changes in IAV of ET were largely attributed to the climatic variables and vegetation coverage by statistical analysis. Generally, IAV of solar radiation (a proxy of energy) and air temperature (a proxy of evaporation demand) dominated the changes of IAV of ET over 77.82% and 35.14% of the basin, respectively, at the two phases. Meanwhile, the increase in vegetation coverage through the rapid restoration significantly reduced IAV of ET across the study area (about 35% of the area). Overall, we argue that both abiotic and biotic variables should be taken into account in understanding of changes in IAV of ET at the basin scale.
Author Contributions
Conceptualization, Y.W. and J.J.; methodology, software and formal analysis, Y.W.; data curation and validation, Y.W. and J.J.; project administration, J.J; writing—original draft, Y.W.; writing—review and editing, Y.L., X.F. and J.J. All authors have read and agreed to the published version of the manuscript.
Funding
This research was funded by National Natural Science Foundation of China (grant number 41807173, 41971374) and Fundamental Research Funds of the Sanjiang University (grant number 2018SJKY009).
Institutional Review Board Statement
Not applicable.
Informed Consent Statement
Not applicable.
Data Availability Statement
The ET datasets presented in this study are openly available in Numerical Terradynamic Simulation Group, University of Montana at [http://files.ntsg.umt.edu/data/ET_global_monthly/Global_8kmResolution/old/V1.0/] and [http://files.ntsg.umt.edu/data/NTSG_Products/MOD16/]. The climate data were downloaded from A Big Earth Data Platform for Three Poles with a spatial resolution of 0.1° and temporal resolution of 3-h [http://poles.tpdc.ac.cn/zh-hans/data/7a35329c-c53f-4267-aa07-e0037d913a21/]. The GIMMS 3g NDVI data presented in this study are openly available in National Qinghai-Tibetan Plateau Data Center at [http://poles.tpdc.ac.cn/en/data/9775f2b4-7370-4e5e-a537-3482c9a83d88/].
Conflicts of Interest
The authors declare no conflict of interest.
References
- Wilcox, B.P.; Thurow, T.L. Emerging issues in rangeland ecohydrology: Vegetation change and the water cycle. Rangel. Ecol. Manag. 2006, 59, 220–224. [Google Scholar] [CrossRef]
- Shukla, J.; Mintz, Y. Influence of land–surface evapotranspiration on the earth’s climate. Science 1982, 215, 1498–1501. [Google Scholar] [CrossRef] [PubMed]
- Katul, G.G.; Oren, R.; Manzoni, S.; Higgins, C.; Parlange, M.B. Evapotranspiration: A process driving mass transport and energy exchange in the soil–plant–atmosphere–climate system. Rev. Geophys. 2012, 50, RG3002. [Google Scholar] [CrossRef] [Green Version]
- Schlesinger, W.H.; Jasechko, S. Transpiration in the global water cycle. Agric. For. Meteorol. 2014, 189, 115–117. [Google Scholar] [CrossRef]
- Wang, K.; Dickinson, R.E. A review of global terrestrial evapotranspiration: Observation, modeling, climatology, and climatic variability. Rev. Geophys. 2012, 50, RG2005. [Google Scholar] [CrossRef]
- Zeng, R.; Cai, X. Assessing the temporal variance of evapotranspiration considering climate and catchment storage factors. Adv. Water Resour. 2015, 79, 51–60. [Google Scholar] [CrossRef]
- Zeng, R.; Cai, X. Climatic and terrestrial storage control on evapotranspiration temporal variability: Analysis of river basins around the world. Geophys. Res. Lett. 2016, 43, 185–195. [Google Scholar] [CrossRef]
- Zhang, D.; Liu, X.; Zhang, Q.; Liang, K.; Liu, C. Investigation of factors affecting intra–annual variability of evapotranspiration and streamflow under different climate conditions. J. Hydrol. 2016, 543, 759–769. [Google Scholar] [CrossRef]
- Zhou, G.; Xia, J.; Zhou, P.; Shi, T.; Li, L. Not vegetation itself but mis–revegetation reduces water resources. Sci. China Earth Sci. 2021, 64, 404–411. [Google Scholar] [CrossRef]
- Tang, L.; Cai, X.; Gong, W.; Lu, J.; Chen, X.; Lei, Q.; Yu, G. Increased vegetation greenness aggravates water conflicts during lasting and intensifying drought in the Poyang lake watershed, China. Forests 2018, 9, 24. [Google Scholar] [CrossRef] [Green Version]
- Croitoru, A.; Piticar, A.; Dragotă, C.S.; Burada, D.C. Recent changes in reference evapotranspiration in Romania. Glob. Planet. Chang. 2013, 111, 127–137. [Google Scholar] [CrossRef]
- Li, G.; Zhang, F.; Jing, Y.; Liu, Y.; Sun, G. Response of evapotranspiration to changes in land use and land cover and climate in China during 2001–2013. Sci. Total Environ. 2017, 596–597, 256–265. [Google Scholar] [CrossRef]
- Burn, D.H.; Hesch, N.M. Trends in evaporation for the Canadian prairies. J. Hydrol. 2007, 336, 61–73. [Google Scholar] [CrossRef]
- Dinpashoh, Y.; Jhajharia, D.; Fakheri-Fard, A.; Singh, V.P.; Kahya, E. Trends in reference crop evapotranspiration over Iran. J. Hydrol. 2011, 399, 422–433. [Google Scholar] [CrossRef]
- Wang, L.; Good, S.P.; Caylor, K.K. Global synthesis of vegetation control on evapotranspiration partitioning. Geophys. Res. Lett. 2014, 41, 6753–6757. [Google Scholar] [CrossRef]
- Liu, Y.; Xiao, J.; Ju, W.; Xu, K.; Zhao, Y. Recent trends in vegetation greenness in china significantly altered annual evapotranspiration and water yield. Environ. Res. Lett. 2016, 11, 094010. [Google Scholar] [CrossRef]
- Liu, Y.; Wu, G.; Zhao, X. Recent declines in China’s largest freshwater lake: Trend or regime shift? Environ. Res. Lett. 2013, 8, 014010. [Google Scholar] [CrossRef]
- Wang, Y.; Liu, Y.; Jin, J. Contrast effects of vegetation cover change on evapotranspiration during a revegetation period in the Poyang lake basin, China. Forests 2018, 9, 217. [Google Scholar] [CrossRef] [Green Version]
- McVicar, T.R.; Roderick, M.L.; Donohue, R.J.; Li, L.; Van Niel, T.G.; Thomas, A.; Grieser, J.; Jhajharia, D.; Himri, Y.; Mahowald, N.M.; et al. Global review and synthesis of trends in observed terrestrial near–surface wind speeds: Implications for evaporation. J. Hydrol. 2012, 416, 182–205. [Google Scholar] [CrossRef]
- Zhang, K.; Kimball, J.S.; Nemani, R.R.; Running, S.W. A continuous satellite–derived global record of land surface evapotranspiration from 1983 to 2006. Water Resour. Res. 2010, 46, W09522. [Google Scholar] [CrossRef] [Green Version]
- Remote Sensing (RS) GIMMS NDVI Based Global Monthly ET from 1983 to 2006. Available online: http://files.ntsg.umt.edu/data/ET_global_monthly/Global_8kmResolution/old/V1.0/ (accessed on 23 August 2016).
- Mu, Q.; Zhao, M.; Running, S.W. Improvements to a MODIS global terrestrial evapotranspiration algorithm. Remote Sens. Environ. 2011, 115, 1781–1800. [Google Scholar] [CrossRef]
- MOD16 Global Evapotranspiration. Available online: http://files.ntsg.umt.edu/data/NTSG_Products/MOD16/ (accessed on 18 February 2015).
- Forzieri, G.; Miralles, D.G.; Ciais, P.; Alkama, R.; Ryu, Y.; Duveiller, G.; Zhang, K.; Robertson, E.; Kautz, M.; Martens, B.; et al. Increased control of vegetation on global terrestrial energy fluxes. Nat. Clim. Chang. 2020, 10, 356–362. [Google Scholar] [CrossRef]
- Pan, S.; Pan, N.; Tian, H.; Friedlingstein, P.; Sitch, S.; Shi, H.; Arora, V.K.; Haverd, V.; Jain, A.K.; Kato, E.; et al. Evaluation of global terrestrial evapotranspiration using state-of-the-art approaches in remote sensing, machine learning and land surface modeling. Hydrol. Earth Syst. Sci. 2020, 24, 1485–1509. [Google Scholar] [CrossRef] [Green Version]
- Liu, Y.; Wu, G. Hydroclimatological influences on recently increased droughts in China’s largest freshwater lake. Hydrol. Earth Syst. Sci. 2016, 20, 93–107. [Google Scholar] [CrossRef] [Green Version]
- Chen, X.; Mo, X.; Hu, S.; Liu, S. Contributions of climate change and human activities to ET and GPP trends over North China Plain from 2000 to 2014. J. Geogr. Sci. 2017, 27, 661–680. [Google Scholar] [CrossRef]
- Chen, Y.; Yang, K.; He, J.; Qin, J.; Shi, J.; Du, J.; He, Q. Improving land surface temperature modeling for dry land of China. J. Geophys. Res. 2011, 116, D20104. [Google Scholar] [CrossRef]
- He, J.; Yang, K.; Tang, W.; Liu, H.; Qin, J.; Chen, Y.; Li, X. The first high–resolution meteorological forcing dataset for land process studies over China. Sci. Data 2020, 7, 25. [Google Scholar] [CrossRef] [PubMed] [Green Version]
- China Meteorological Forcing Dataset (1979–2015). Available online: http://poles.tpdc.ac.cn/zh-hans/data/7a35329c-c53f-4267-aa07-e0037d913a21/ (accessed on 16 April 2017).
- Jin, J.; Ma, X.; Chen, H.; Wang, H.; Kang, X.; Wang, X.; Wang, Y.; Yong, B.; Guo, F. Grassland production in response to changes in biological metrics over the Tibetan Plateau. Sci. Total Environ. 2019, 666, 641–651. [Google Scholar] [CrossRef] [PubMed]
- Li, X.; Che, T.; Li, X.; Wang, L.; Duan, A.; Shuangguan, D.; Pan, X.; Fang, M.; Bao, Q. CASEarth Poles: Big data for the Three Poles. Bull. Am. Meteorol. Soc. 2020, 101, E1475–E1491. [Google Scholar] [CrossRef] [Green Version]
- Global GIMMS NDVI3g v1 Dataset (1981–2015). Available online: http://poles.tpdc.ac.cn/en/data/9775f2b4-7370-4e5e-a537-3482c9a83d88/ (accessed on 8 December 2016).
- Tucker, C.J.; Pinzon, J.E.; Brown, M.E.; Slayback, D.A.; Pak, E.W.; Mahoney, R.; Vermote, F.; El Saleous, N. An extended AVHRR 8–km NDVI dataset compatible with MODIS and SPOT vegetation NDVI data. Int. J. Remote Sens. 2005, 26, 4485–4498. [Google Scholar] [CrossRef]
- Pinzon, J.E.; Tucker, C.J. A Non–Stationary 1981–2012 AVHRR NDVI3g Time Series. Remote Sens. 2014, 6, 6929–6960. [Google Scholar] [CrossRef] [Green Version]
- Garonna, I.; de Jong, R.; de Wit, A.J.; Mücher, C.A.; Schmid, B.; Schaepman, M.E. Strong contribution of autumn phenology to changes in satellite–derived growing season length estimates across Europe (1982–2011). Glob. Chang. Biol. 2014, 20, 3457–3470. [Google Scholar] [CrossRef] [PubMed]
- Buermann, W.; Parida, B.; Jung, M.; Macdonald, G.M.; Tucker, C.J.; Reichstein, M. Recent shift in Eurasian boreal forest greening response may be associated with warmer and drier summers. Geophys. Res. Lett. 2014, 41, 1995–2002. [Google Scholar] [CrossRef] [Green Version]
- Buermann, W.; Forkel, M.; O’Sullivan, M.; Sitch, S.; Friedlingstein, P.; Haverd, V.; Jain, A.K.; Kato, E.; Kautz, M.; Lienert, S.; et al. Widespread seasonal compensation effects of spring warming on northern plant productivity. Nature 2018, 562, 110–114. [Google Scholar] [CrossRef] [Green Version]
- Holben, B.; Kimes, D.; Fraser, R.S. Directional reflectance response in AVHRR red and near–IR bands for three cover types and varying atmospheric conditions. Remote Sens. Environ. 1986, 19, 213–236. [Google Scholar] [CrossRef]
- Toms, J.D.; Lesperance, M.L. Piecewise regression: A tool for identifying ecological thresholds. Ecology 2003, 84, 2034–2041. [Google Scholar] [CrossRef]
- Wang, X.; Piao, S.; Ciais, P.; Li, J.; Friedlingstein, P.; Koven, C.; Chen, A. Spring temperature change its implication in the change of vegetation growth in North America from 1982 to 2006. Proc. Natl. Acad. Sci. USA 2011, 108, 1240–1245. [Google Scholar] [CrossRef] [Green Version]
- Piao, S.; Wang, X.; Ciais, P.; Zhu, B.; Wang, T.; Liu, J. Changes in satellite–derived vegetation growth trend in temperate boreal Eurasia from 1982 to 2006. Glob. Chang. Biol. 2011, 17, 3228–3239. [Google Scholar] [CrossRef]
- Peng, S.; Chen, A.; Xu, L.; Cao, C.; Fang, J.; Myneni, R.B.; Pinzon, J.E.; Tucker, C.J.; Piao, S. Recent change of vegetation growth trend in China. Environ. Res. Lett. 2011, 6, 044027. [Google Scholar] [CrossRef]
- Chen, C.; Chen, D.; Pan, J.; Lam, S.K. Analysis of factors controlling soil N2O emission by principal component and path analysis method. Environ. Earth Sci. 2014, 72, 1511–1517. [Google Scholar] [CrossRef]
- Farrer, E.C.; Ashton, I.W.; Spasojevic, M.J.; Fu, S.; Gonzalez, D.J.X.; Suding, K.N. Indirect effects of global change accumulate to alter plant diversity but not ecosystem function in alpine tundra. J. Ecol. 2015, 103, 351–360. [Google Scholar] [CrossRef] [Green Version]
- Jin, J.; Wang, Y.; Jiang, H.; Cheng, M. Recent NDVI–based variation in growth of boreal intact forest landscapes and its correlation with climatic variables. Sustainability 2016, 8, 326. [Google Scholar] [CrossRef] [Green Version]
- Zhang, K.; Kimball, J.S.; Nemani, R.R.; Running, S.W.; Hong, Y.; Gourley, J.J.; Yu, Z. Vegetation greening and climate change promote multidecadal rises of global land evapotranspiration. Sci. Rep. 2015, 5, 15956. [Google Scholar] [CrossRef] [PubMed]
- Jung, M.; Reichstein, M.; Ciais, P.; Seneviratne, S.I.; Sheffield, J.; Goulden, M.L.; Bonan, G.; Cescatti, A.; Chen, J.; de Jeu, R.; et al. Recent decline in the global land evapotranspiration trend due to limited moisture supply. Nature 2010, 467, 951–954. [Google Scholar] [CrossRef] [PubMed]
- Tao, H.; Fraedrich, K.; Menz, C.; Zhai, J. Trends in extreme temperature indices in the Poyang Lake Basin, China. Stoch. Environ. Res. Risk Assess. 2014, 28, 1543–1553. [Google Scholar] [CrossRef]
- Fatichi, S.; Ivanov, V.Y. Interannual variability of evapotranspiration and vegetation productivity. Water Resour. Res. 2014, 50, 3275–3294. [Google Scholar] [CrossRef]
- Yang, Y.; Fang, J.; Ma, W.; Wang, W. Relationship between variability in aboveground net primary production and precipitation in global grasslands. Geophys. Res. Lett. 2008, 35, L23710. [Google Scholar] [CrossRef] [Green Version]
- Beer, C.; Ciais, P.; Reichstein, M.; Baldocchi, D.; Law, B.E.; Papale, D.; Soussana, J.F.; Ammann, C.; Buchmann, N.; Frank, D.; et al. Temporal and among–site variability of inherent water use efficiency at the ecosystem level. Glob. Biogeochem. Cycles 2009, 23, GB2018. [Google Scholar] [CrossRef]
- Jackson, R.B.; Randerson, J.T.; Canadell, J.G.; Anderson, R.G.; Avissar, R.; Baldocchi, D.D.; Bonan, G.B.; Caldeira, K.; Diffenbaugh, N.S.; Field, C.B.; et al. Protecting climate with forests. Environ. Res. Lett. 2008, 3, 044006. [Google Scholar] [CrossRef]
- Peng, S.; Piao, S.; Zeng, Z.; Ciais, P.; Zhou, L.; Li, L.; Myneni, R.B.; Yin, Y.; Zeng, H. Afforestation in China cools local land surface temperature. Proc. Natl. Acad. Sci. USA 2014, 111, 2915–2919. [Google Scholar] [CrossRef] [Green Version]
- Liu, J.; Liu, M.; Zhuang, D.; Zhang, Z.; Deng, X. Study on spatial pattern of land–use change in China during 1995–2000. Sci. China Ser. D Earth Sci. 2003, 46, 373–384. [Google Scholar]
- Yu, G.; Chen, Z.; Piao, S.; Peng, C.; Ciais, P.; Wang, Q.; Li, X.; Zhu, X. High carbon dioxide uptake by subtropical forest ecosystems in the East Asian monsoon region. Proc. Natl. Acad. Sci. USA 2014, 111, 4910–4915. [Google Scholar] [CrossRef] [PubMed] [Green Version]
- Wang, M.; Ding, Z.; Wu, C.; Song, L.; Ma, M.; Yu, P.; Lu, B.; Tang, X. Divergent responses of ecosystem water-use efficiency to extreme seasonal droughts in Southwest China. Sci. Total Environ. 2021, 760, 143427. [Google Scholar] [CrossRef] [PubMed]
Figure 1.
Terrain of the Poyang Lake Basin. The background color denotes the elevation (unit: m).

Figure 2.
Trends of intra-annual variability of evapotranspiration (ET), -measured by the intra-annual standard deviation of monthly ET (termed SDET), based on the linear regression model (the black lines) and piecewise regression model (the color lines) over (a) the Poyang Lake Basin and (b–f) its sub-basins from 1983 to 2014. The slopes (unit: mm/year) of the regression lines are shown in each panel, and ** stands for p < 0.01 (statistical significance of linear regression or piecewise regression). The performances of the models are listed in Table 1.

Figure 3.
Spatial distribution of multiyear average amplitudes of the intra-annual variability of evapotranspiration (ET), measured by the intra-annual standard deviation of monthly ET (termed SDET), over the Poyang Lake Basin during (a) the entire study period (1983–2014) and (b,c) the two phases (1983–1999 and 2000–2014, respectively).
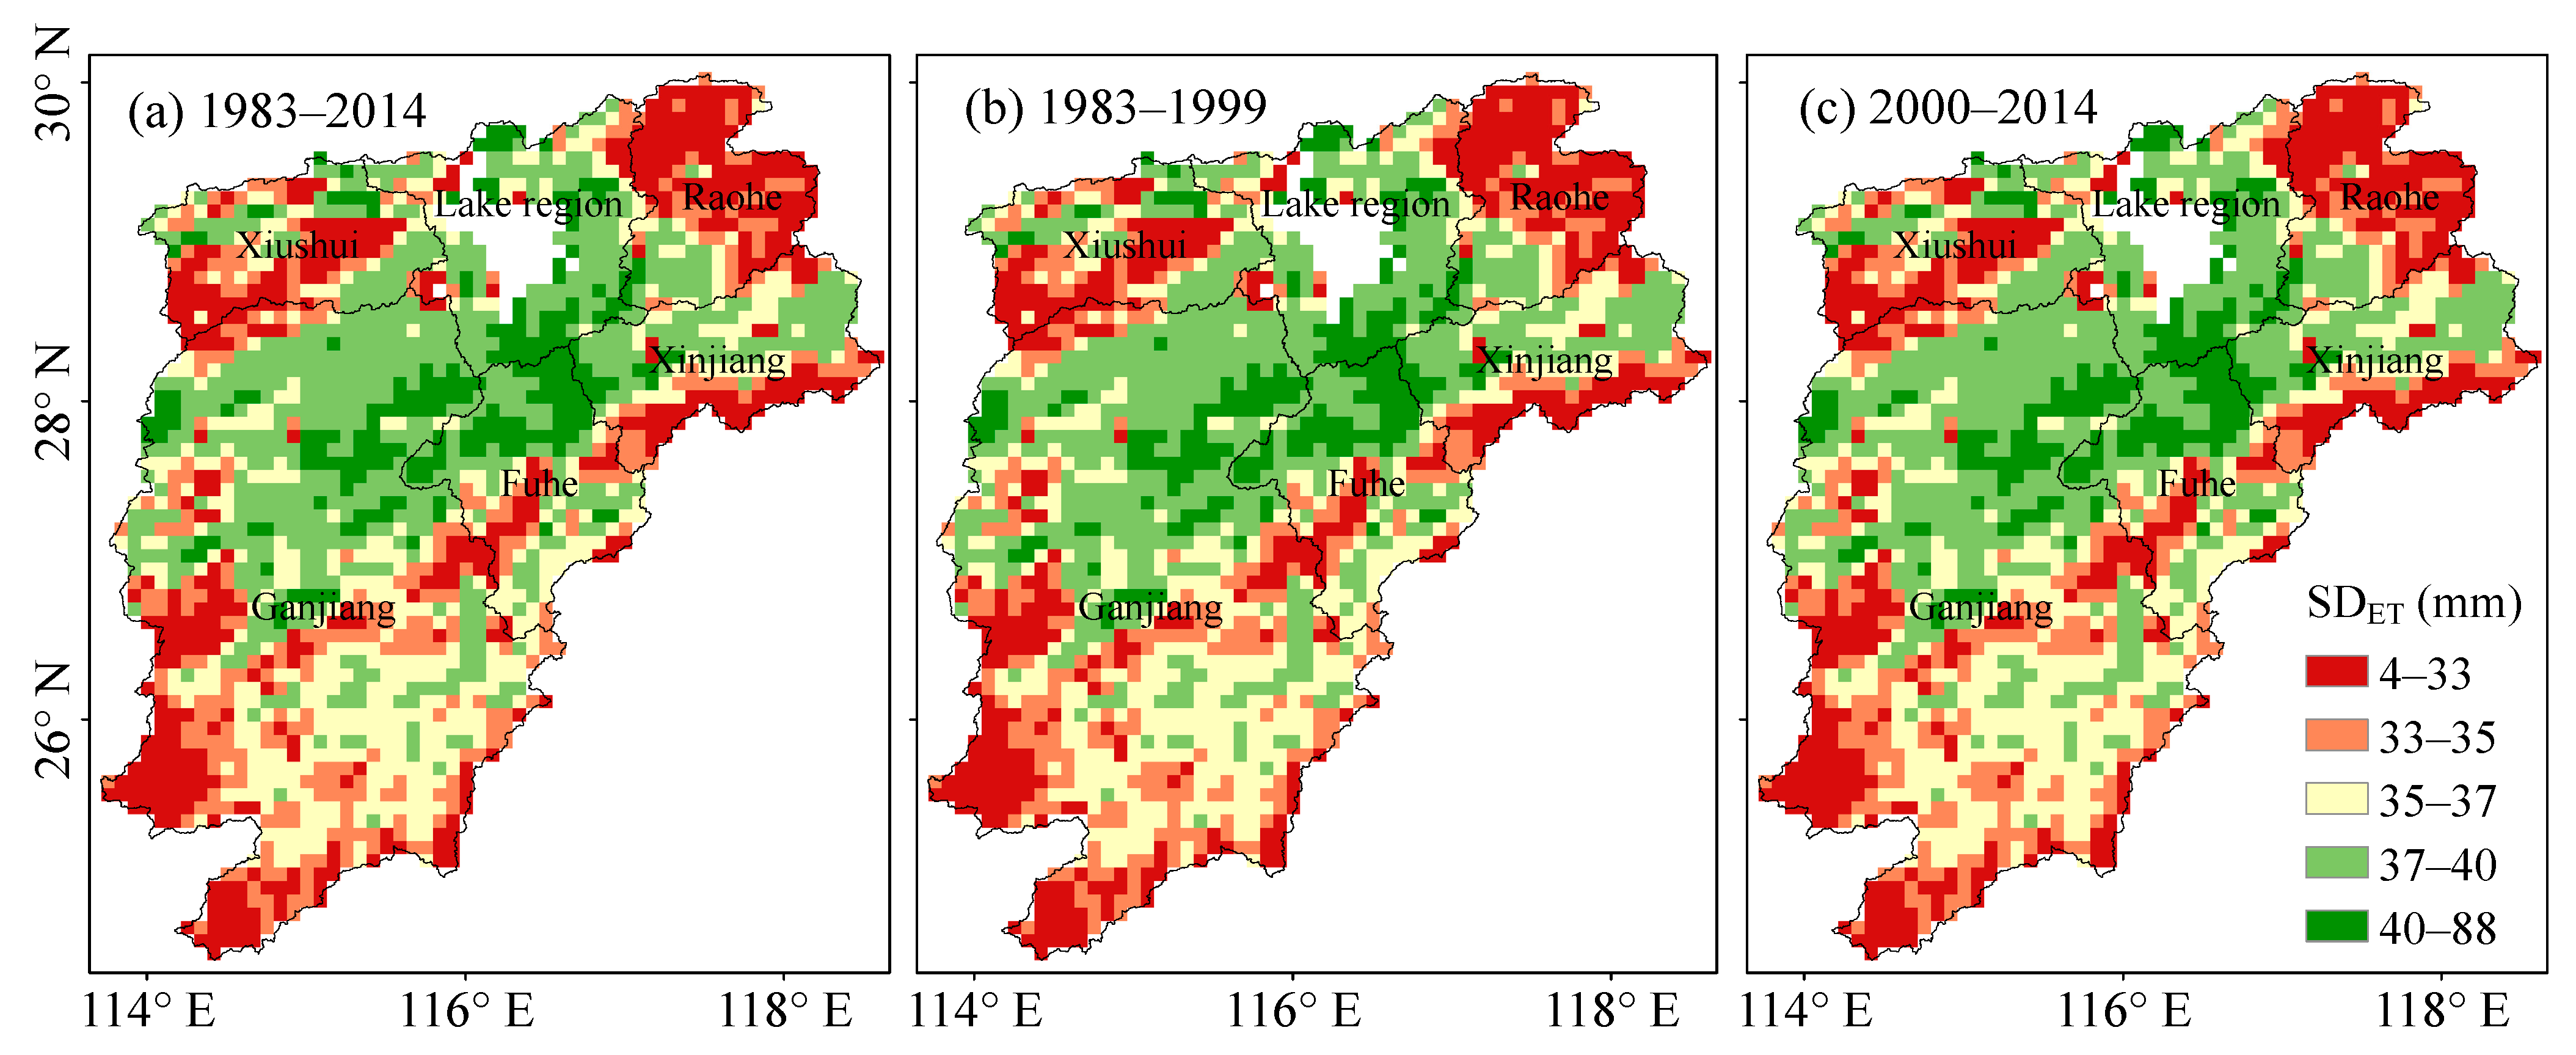
Figure 4.
Changes in intra-annual variability of the climatic variables and vegetation coverage (VC) over the Poyang Lake Basin from 1983 to 2014. SDAT, SDSR, SDWD and SDPR denote the intra-annual standard deviation of monthly temperature, radiation, wind speed and precipitation, respectively.
Figure 4.
Changes in intra-annual variability of the climatic variables and vegetation coverage (VC) over the Poyang Lake Basin from 1983 to 2014. SDAT, SDSR, SDWD and SDPR denote the intra-annual standard deviation of monthly temperature, radiation, wind speed and precipitation, respectively.

Figure 5.
Direct effects of (a–d) the climatic variables and (e) vegetation coverage (VC) on the intra-annual variability of evapotranspiration (ET), measured by SDET, over the Poyang Lake Basin from 1983 to 2014. SDET, SDAT, SDSR, SDWD and SDPR denote the intra-annual standard deviation of monthly ET, temperature, radiation, wind speed and precipitation, respectively. The colored areas indicate where the path coefficient of the variable was statistically significant (p < 0.05) in the path analysis.

Figure 6.
Direct effects of (a–d) the climatic variables and (e) vegetation coverage (VC) on the intra-annual variability of evapotranspiration (ET), measured by SDET, over the Poyang Lake Basin from 1983 to 1999. SDET, SDAT, SDSR, SDWD and SDPR denote the intra-annual standard deviation of monthly ET, temperature, radiation, wind speed and precipitation, respectively. The colored areas indicate where the path coefficient of the variable was statistically significant (p < 0.05) in the path analysis.

Figure 7.
Direct effects of (a–d) the climatic variables and (e) vegetation coverage (VC) on the intra-annual variability of evapotranspiration (ET), measured by SDET, over the Poyang Lake Basin from 2000 to 2014. SDET, SDAT, SDSR, SDWD and SDPR denote the intra-annual standard deviation of monthly ET, temperature, radiation, wind speed and precipitation, respectively. The colored areas indicate where the path coefficient of the variable was statistically significant (p < 0.05) in the path analysis.

Figure 8.
Patterns of responses of the intra-annual annual variability of evapotranspiration (ET), measured by SDET to the climatic variables and vegetation coverage over the Poyang Lake Basin during (a) the entire study period (1983–2014) and (b,c) the two phases (1983–1999 and 2000–2014, respectively). SDET, SDAT, SDSR, SDWD, SDPR and VC denote the intra-annual standard deviation of monthly ET, temperature, radiation, wind speed and precipitation, and vegetation coverage, respectively. Each color of the figure indicates a group of the variables of which the path coefficients were statistically significant (p < 0.05) in the path analysis. Only the first six dominant patterns were shown in the maps.

Figure 9.
Dominators of the intra-annual variability of evapotranspiration (ET), measured by SDET, over the Poyang Lake Basin during (a) the entire study period (1983–2014) and (b,c) the two phases (1983–1999 and 2000–2014, respectively). SDET, SDAT, SDSR, SDWD, SDPR and VC denote the intra-annual standard deviation of monthly ET, temperature, radiation, wind speed and precipitation, and vegetation coverage, respectively. The color of each pixel indicates the dominant variable, of which the absolute value of the path coefficient is statistically significant (p < 0.05) and highest in the path analysis. NS indicates none of the selected variables was significantly related to SDET during the period.


Table 1.
Performances of the linear regression model and piecewise regression model in detecting trends of the intra-annual variability of evapotranspiration (ET) from 1983 to 2014. The R2, RMSE and AIC indicate coefficient of determination, root-mean square error (unit: mm) and Akaike information criterion, respectively.
| Basin/Sub-Basin | Linear Regression Model | Piecewise Regression Model | ||||
|---|---|---|---|---|---|---|
| R2 | RMSE | AIC | R2 | RMSE | AIC | |
| Poyang Lake Basin | 0.25 | 2.27 | 56.78 | 0.56 | 1.73 | 44.56 |
| Ganjiang Basin | 0.33 | 2.27 | 56.79 | 0.62 | 1.72 | 44.05 |
| Fuhe Basin | 0.20 | 2.51 | 63.41 | 0.54 | 1.91 | 50.77 |
| Xinjiang Basin | 0.15 | 2.38 | 60.03 | 0.49 | 1.86 | 49.11 |
| Raohe Basin | 0.16 | 2.17 | 53.90 | 0.43 | 1.78 | 46.44 |
| Xiushui Basin | 0.16 | 2.20 | 54.81 | 0.46 | 1.75 | 45.32 |
Table 2.
Relationships of the intra-annual variability of evapotranspiration (ET), measured by SDET, with the climatic variables and vegetation coverage (VC) over the Poyang Lake Basin and its sub-basins during (a) 1983–2014, (b) 1983–1999 and (c) 2000–2014, respectively. SDET, SDAT, SDSR, SDWD and SDPR denote the intra-annual standard deviation of monthly ET, temperature, radiation, wind speed and precipitation, respectively. Each value indicates the average of partial correlation coefficient between SDET and one variable after controlling the others over the basin/sub-basin. The colors indicate the statistical significance of p < 0.01 (dark red), p < 0.05 (light red) and p ≥ 0.05 (white), respectively.
| 1983–2014 | 1983–1999 | 2000–2014 | |||||||||||||
|---|---|---|---|---|---|---|---|---|---|---|---|---|---|---|---|
| SDAT | SDSR | SDWD | SDPR | VC | SDAT | SDSR | SDWD | SDPR | VC | SDAT | SDSR | SDWD | SDPR | VC | |
| Poyang Lake Basin | 0.21 | 0.62 | −0.06 | −0.10 | −0.37 | 0.07 | 0.56 | −0.07 | 0.06 | −0.45 | 0.54 | 0.33 | 0.26 | −0.22 | −0.35 |
| Ganjiang Basin | 0.22 | 0.54 | 0.02 | −0.15 | −0.37 | 0.15 | 0.53 | 0.02 | 0.05 | −0.41 | 0.38 | 0.30 | −0.10 | 0.17 | −0.15 |
| Fuhe Basin | 0.24 | 0.60 | −0.13 | −0.21 | −0.34 | −0.04 | 0.52 | −0.12 | −0.04 | −0.45 | 0.62 | 0.33 | 0.34 | −0.39 | −0.25 |
| Xinjiang Basin | 0.31 | 0.40 | −0.08 | −0.10 | −0.40 | 0.23 | 0.35 | −0.13 | 0.13 | −0.82 | 0.62 | 0.18 | −0.04 | −0.08 | −0.23 |
| Raohe Basin | 0.18 | 0.71 | 0.00 | −0.11 | −0.19 | 0.22 | 0.79 | −0.26 | −0.20 | −0.22 | 0.31 | 0.63 | 0.33 | 0.01 | −0.04 |
| Xiushui Basin | 0.28 | 0.36 | −0.02 | −0.29 | −0.45 | −0.06 | 0.54 | −0.27 | −0.17 | −0.65 | 0.77 | 0.10 | 0.26 | −0.16 | −0.10 |
Publisher’s Note: MDPI stays neutral with regard to jurisdictional claims in published maps and institutional affiliations. |
© 2022 by the authors. Licensee MDPI, Basel, Switzerland. This article is an open access article distributed under the terms and conditions of the Creative Commons Attribution (CC BY) license (https://creativecommons.org/licenses/by/4.0/).
Share and Cite
MDPI and ACS Style
Wang, Y.; Liu, Y.; Jin, J.; Fan, X. Intra-Annual Variability of Evapotranspiration in Response to Climate and Vegetation Change across the Poyang Lake Basin, China. Remote Sens. 2022, 14, 885. https://doi.org/10.3390/rs14040885
AMA Style
Wang Y, Liu Y, Jin J, Fan X. Intra-Annual Variability of Evapotranspiration in Response to Climate and Vegetation Change across the Poyang Lake Basin, China. Remote Sensing. 2022; 14(4):885. https://doi.org/10.3390/rs14040885
Chicago/Turabian StyleWang, Ying, Yuanbo Liu, Jiaxin Jin, and Xingwang Fan. 2022. "Intra-Annual Variability of Evapotranspiration in Response to Climate and Vegetation Change across the Poyang Lake Basin, China" Remote Sensing 14, no. 4: 885. https://doi.org/10.3390/rs14040885
Note that from the first issue of 2016, this journal uses article numbers instead of page numbers. See further details here.