Article

Assessment of Three Long-Term Satellite-Based Precipitation Estimates against Ground Observations for Drought Characterization in Northwestern China

1
School of Geography and Tourism, Qufu Normal University, Rizhao 276825, China
2
State Key Laboratory of Desert and Oasis Ecology, Xinjiang Institute of Ecology and Geography, Chinese Academy of Sciences, Urumqi 830011, China
3
Department of Geography, Ghent University, 9000 Ghent, Belgium
*
Author to whom correspondence should be addressed.
Remote Sens. 2022, 14(4), 828; https://doi.org/10.3390/rs14040828
Submission received: 13 December 2021 / Revised: 29 January 2022 / Accepted: 7 February 2022 / Published: 10 February 2022
(This article belongs to the Special Issue Remote Sensing for Water Resources and Environmental Management)

Abstract

:
Long-term satellite-based precipitation estimates (LSPE) play a significant role in climatological studies like drought monitoring. In this study, three popular LSPEs (Precipitation Estimation from Remotely Sensed Information using Artificial Neural Networks–Climate Data Record (PERSIANN-CDR), Rainfall Estimates from Rain Gauge and Satellite Observations (CHIRPS) and Multi-Source Weighted-Ensemble Precipitation (MSWEP)) were evaluated on a monthly scale using ground-based stations for capturing drought event characteristics over northwestern China from 1983 to 2013. To reflect dry or wet evolution, the Standardized Precipitation Index (SPI) was adopted, and the Run theory was used to identify drought events and their characteristics. The conventional statistical indices (relative bias (RB), correlation coefficient (CC), and root mean square error (RMSE)), as well as categorical indices (probability of detection (POD), false alarm ratio (FAR), and missing ratio (MISS)) are used to evaluate the capability of LSPEs in estimating precipitation and drought characteristics. We found that: (1) three LSPEs showed generally satisfactory performance in estimating precipitation and characterizing drought events. Although LSPEs have acceptable performance in identifying drought events with POD greater than 60%, they still have a high false alarm ratio (>27%) and a high missing ratio (>33%); (2) three LSPEs tended to overestimate drought severity, mainly because of an overestimation of drought duration; (3) the ability of CHIRPS to replicate the temporal evolution of precipitation and SPI values is limited; (4) in severe drought events, PERSIANN-CDR tends to overestimate precipitation, and drought severity, as well as drought area; (5) among the three LSPEs, MSWEP outperformed the other two in identifying drought events (POD > 66%) and characterizing drought features. Finally, we recommend MSWEP for drought monitoring studies due to its high accuracy in estimating drought characteristics over northwestern China. In drought monitoring applications, the overestimation of PERSIANN-CDR for drought peak value and area, as well as CHIRPS’s inferiority in capturing drought temporal evolution, must be considered.

1. Introduction

Even though precipitation is expected to increase in the future, evaporation is expected to increase significantly as well, and precipitation variation is expected to be extremely variable [1]. The semi-arid and arid regions are still facing high drought risk [2,3,4].
Droughts have significant impacts on both natural ecosystems and human society, and they are particularly severe in semi-arid and arid regions with fragile ecosystems, such as the arid zones of Central Asia. Drought indices are commonly used to quantify the drought condition and its impacts on global and regional scales [5,6]. Many drought indices have been developed in recent years to characterize drought conditions [7]. Among them, SPI, Standardized Precipitation Evapotranspiration Index (SPEI), and Palmer Drought Severity Index (PDSI) are the three most commonly used drought indices for evaluating meteorological droughts. The SPI is a standardized drought index calculated based on probabilities derived from long-term precipitation records [8]. It is widely used and recommended by the World Meteorological Organization (WMO) because of its simple calculation, flexible time scales, and limited variable requirements [9]. Even though SPEI and PDSI consider the effect of temperature; however, variables like radiation, relative humidity, and the temperature required to calculate potential evapotranspiration (PET) based on the Penman or Penman-Monteith algorithm are usually not available in these areas. While calculating potential evapotranspiration based on temperature, like the Thornthwaite algorithm, has been shown to overestimate drought conditions in semi-arid and arid regions [10,11,12].
Long-term data records with adequate spatial and temporal coverage are required for drought characterization and drought index calculation using ground gauges [13]. However, drought monitoring in Central Asia’s arid zones, like many other arid and semi-arid countries around the world, is hampered by a lack of reliable precipitation observations. The climate stations are sparse and unevenly distributed in many drought-prone areas, resulting in large spatial gaps. Overall, the long latency of data acquisition, limited spatial representation, and data gaps in ground observations limit meteorological drought monitoring [13,14]. For example, many studies have lamented the scarcity of observations in Central Asia’s arid zones [15,16]. Furthermore, to ensure the reliability of results, drought monitoring and event characterization require a long-term data period of at least 30 years [17].
Satellite-based precipitation estimates (SPEs) are a very valuable alternative resource for drought monitoring due to their consistent and homogeneous data with quasi-global coverage, near-real-time estimates, increasing data records, and high spatial resolution [17,18,19]. In recent years, great efforts have been devoted to the development of SPEs such as the Tropical Rainfall Measuring Mission (TRMM), Multisatellite Precipitation Analysis (TMPA), Precipitation Estimation from Remotely Sensed Information using Artificial Neural Networks (PERSIANN), Rainfall Estimates from Rain Gauge and Satellite Observations (CHIRPS), Global Satellite Mapping of Precipitation (GSMaP), Climate Prediction Center morphing technique (CMORPH), Multi-Source Weighted-Ensemble Precipitation (MSWEP), Climate Prediction Center (CPC), MORPHing technique (CMORPH), and Integrated Multi-satellite Retrievals for Global Precipitation Mission (IMERG). However, most of them are limited by the short record length in meteorological drought monitoring, which requires long-term data records (≥30 years) [20]. According to AghaKouchak et al. [17], short-term data records will have an impact on drought monitoring accuracy. WMO reported that a reliable SPI calculation needs at least 30-years of data records [9].
Fortunately, three long-term LSPEs with records larger than 30 years are identified among the listed SPEs: PERSIANN-CDR, CHIRPS and MSWEP. These long-term SPEs (LSPEs) provide an opportunity to assess drought from a climatological perspective, especially for gauge-sparse regions like northwestern China. However, the inherent uncertainties of LSPEs in estimating precipitation may affect the accuracy of drought characterization. For example, PERSIANN-CDR has been reported to overestimate precipitation in mountainous regions [21]. Therefore, it is important to evaluate their suitability and reliability before employing them in drought monitoring.
Satellite-based precipitation estimates have already been put to the test in some regions for drought monitoring. Among these studies, TMPA products have been thoroughly evaluated in many regions, including Mexico [22], Africa [23], and different river basins [24,25,26]. The assessment of LSPEs for drought monitoring has also gotten a lot of attention in recent years. For example, the drought characterization performance of CHIRPS has been evaluated in China [27], Mekong River Basin [28], and the Brazilian Midwest [29]. PERSIANN-CDR’s capability for drought monitoring has also been assessed in China [30,31], India [32], and Iran [30]. The works on evaluating MSWEP for drought characterization have been limited because of the late release [16,30]. However, rather than original observations, the majority of existing evaluation works rely on interpolated grids or gridded reanalysis. The interpolation or re-grid process may introduce significant errors in gauge sparse regions.
This paper aims to inter-compare the performance of three LSPEs (i.e., PERSIANN-CDR, CHIRPS, and MSWEP) against ground-based gauges for meteorological drought monitoring in northwestern China from 1983 to 2013. The rest of this paper is organized as follows. Section 2 introduces the study area, datasets, and evaluation metrics. Section 3 focuses on the assessment of LSPEs in capturing precipitation and droughts. A summary and conclusions are given in Section 4.

2. Materials and Methods
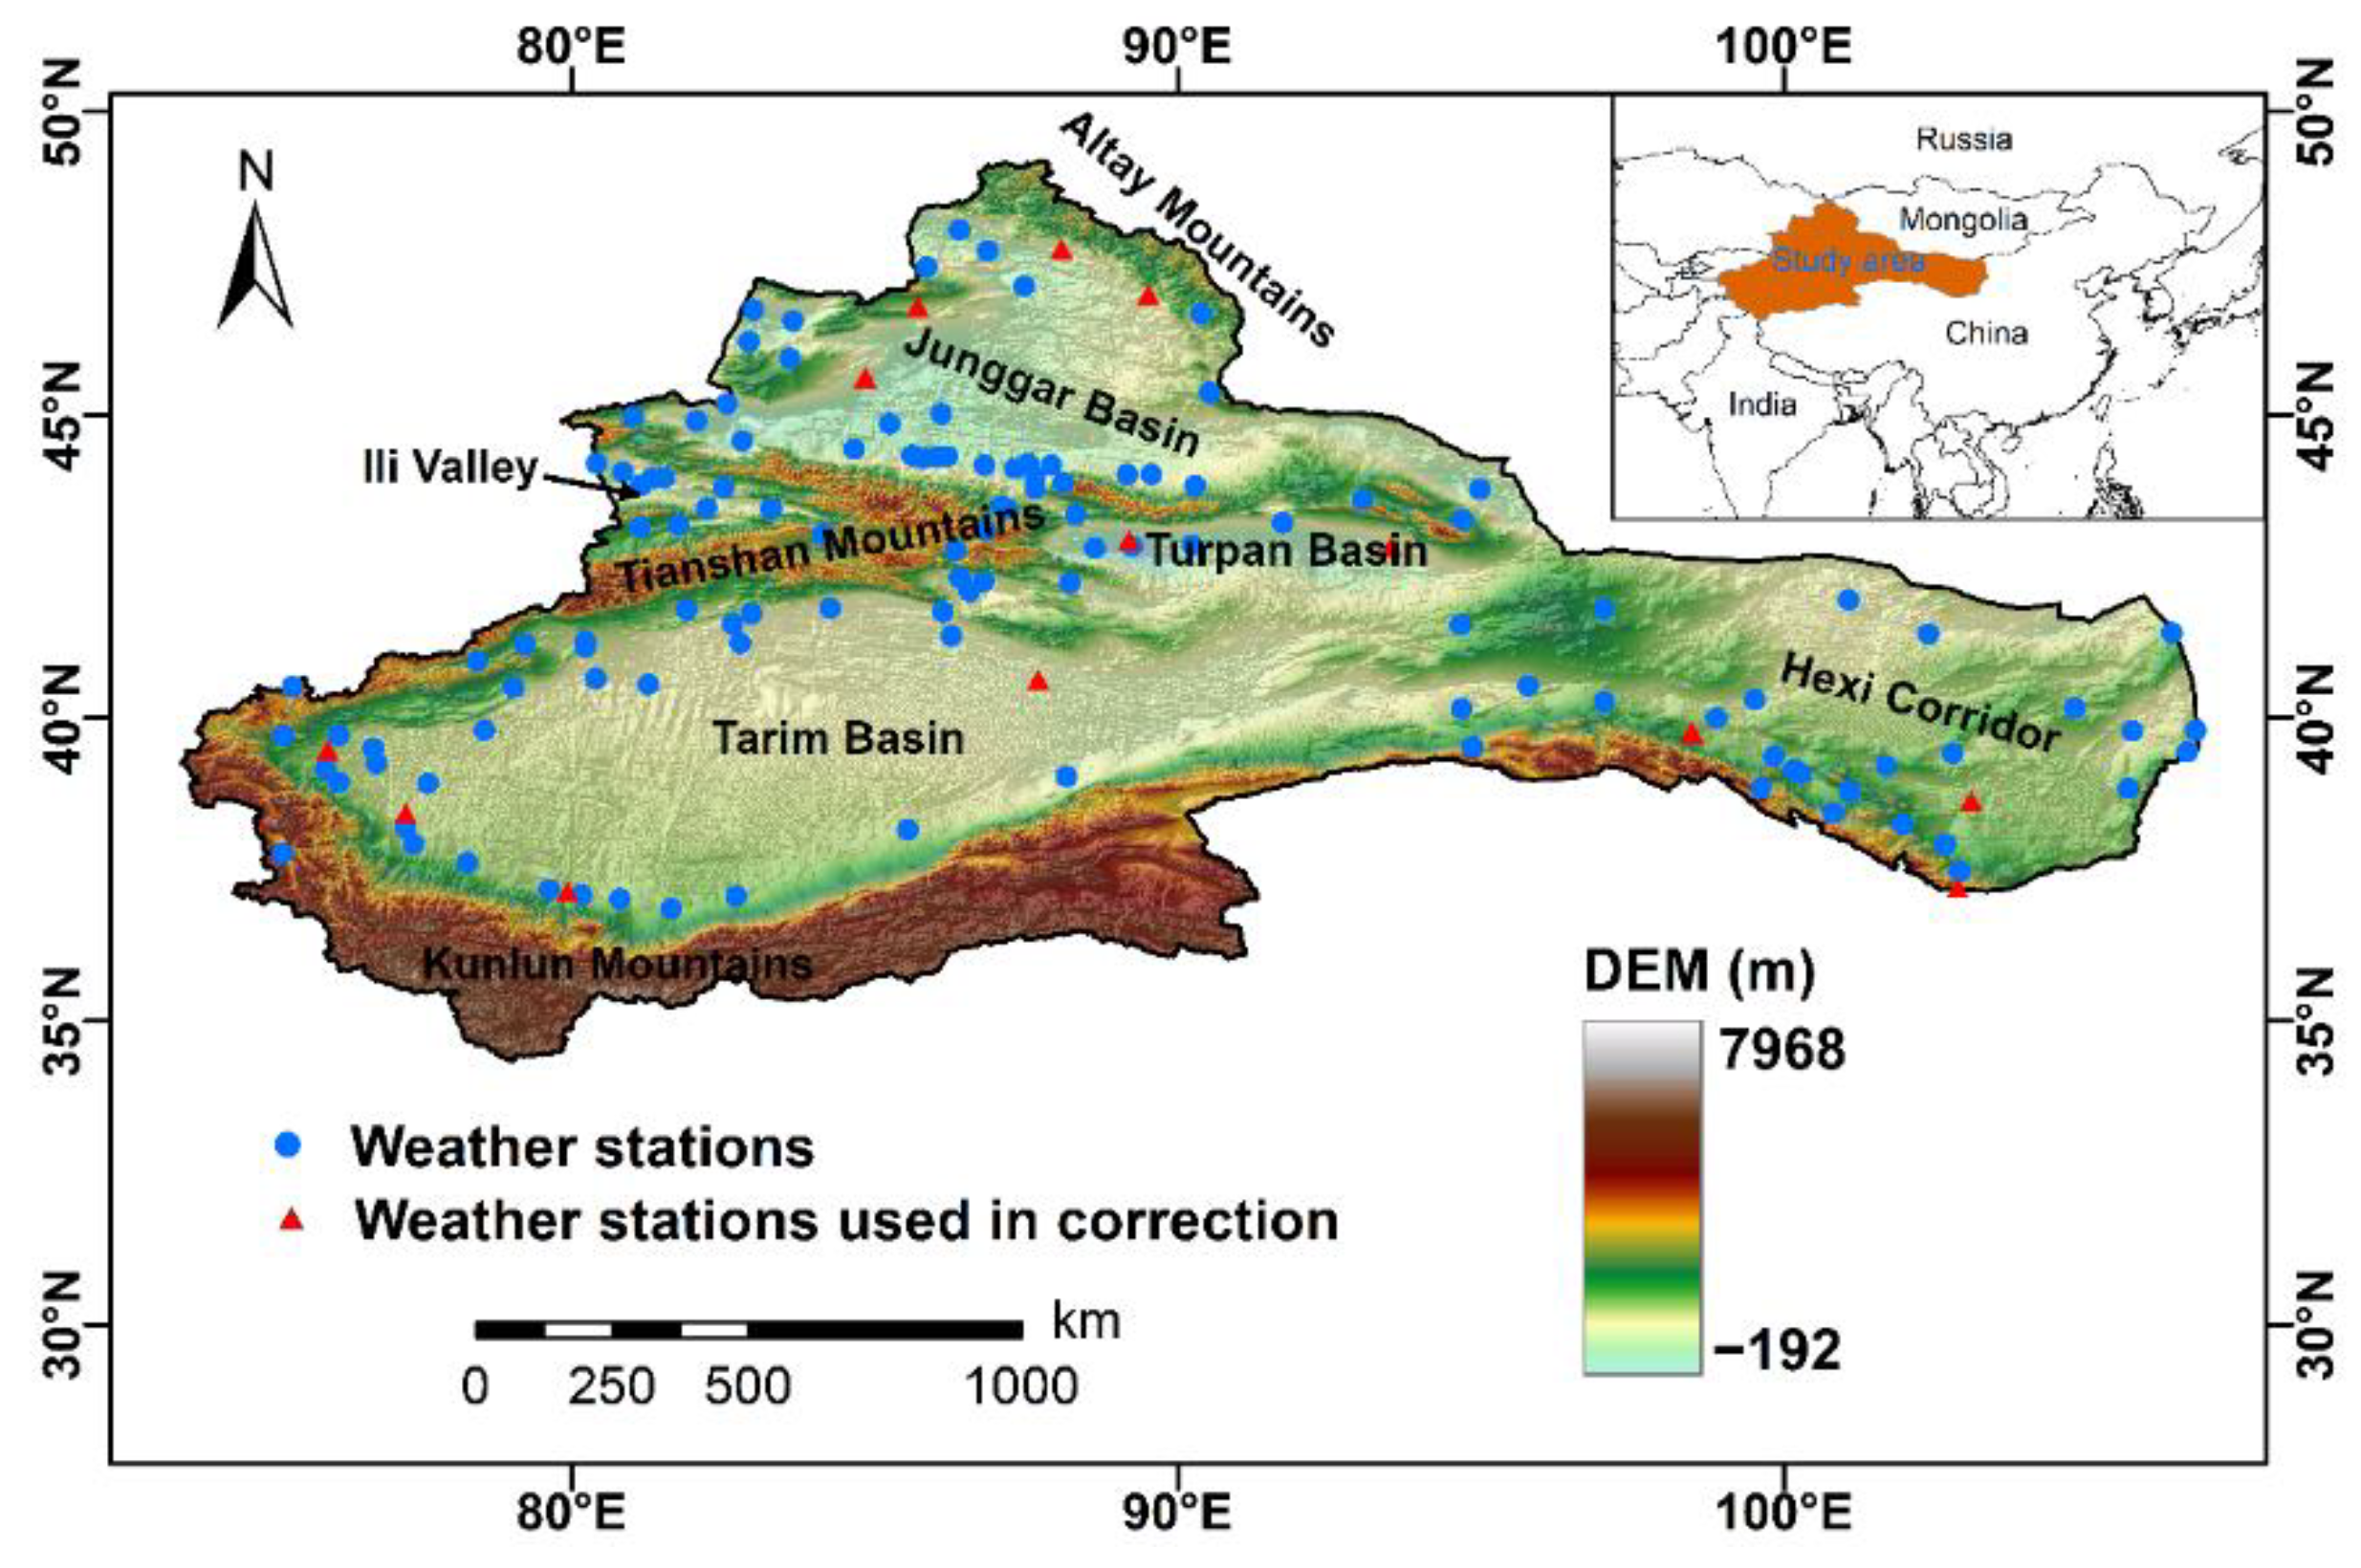
2.1. Study Area

Northwestern China is located in the central part of Asia, in the mid-latitude regions of the northern hemisphere. The terrain of northwestern China varies greatly, with DEM ranging from <−190 m in the Turpan Basin to over 7900 m in the Kunlun Mountain (Figure 1). The majority of northwestern China is characterized by typical semi-arid and arid climates with relatively lower precipitation and limited water resources. The local climate is mainly influenced by the westerly winds from the mid-latitudes, which bring moisture from the North Atlantic Ocean [33]. Despite the high aridity, precipitation fluctuates a lot, which could lead to more drought events. Severe drought events occurred in 1983–1984, 1990–1991, 1997, 2000, 2010 [34,35,36,37]. Because of the region’s high aridity and limited water resources, drought events have posed a serious threat to local agricultural production and natural ecosystems [38]. The great impacts of drought events on both society and the fragile ecology urge improvements in drought event monitoring and analysis.

2.2. Datasets

2.2.1. Ground-Based Observations

The spatial distribution of rain gauge locations is shown in Figure 1. The monthly precipitation data from 139 in situ rainfall gauges were collected from the National Meteorological Information Center (NMIC) and China Meteorological Administration (CMA, http://data.cma.cn/en, accessed on 1 October 2020) from 1983 to 2013. The evaluation period is selected based on the availability of both LSPEs and the gauge dataset. Seven of these gauges were eliminated because they had missing data for any of the 31 years. To ensure a relatively independent evaluation, 13 gauges involved in the Global Telecommunication System (GTS) were not considered in this study as they were used in the correction of the LSPEs’ generation [39,40,41,42]. Despite the removal of GTS gauges, the current evaluation may not be completely independent, as some gauges may be involved in LSPEs’ correction through other ways [39,40,41]. Finally, for the drought monitoring evaluation of LSPEs, precipitation observations from 119 in situ gauges marked with blue circles were used in this study. All of the in situ precipitation data used in this study went through a four-step quality control process: (1) Checking for extreme values, (2) checking for internal consistency, (3) checking for spatial consistency, and (4) checking for missing value [43]. The evaluation was conducted on a point scale to avoid potential errors introduced by the limited number and uneven distribution of rain gauges in this region. It is noted that some uncertainties may be introduced when the results of this study are extended to station-lacking regions, like the central part of the Tarim basin.

2.2.2. Long-Term Satellite Precipitation Datasets

From 1983 to 2013, three long-term satellite-based precipitation products are evaluated against the ground-based gauges for meteorological drought monitoring. The three long-term satellite-based precipitation products are summarized in Table 1.
PERSIANN-CDR is developed by the U.S National Climatic Data Center (NCDC) Climate Data Record program. It covers 60° S–60° N and provides 0.25° daily satellite-based precipitation estimates from 1983 to the near present. The Artificial Neural Network algorithm was used to generate the uncorrected estimates using multiple infrared satellite data and the National Centers for Environmental Prediction (NCEP) stage IV hourly precipitation data. After that, the monthly product from the Global Precipitation Climatology Project (GPCP) was used to correct the initial estimates on a scale of 2.5 degrees. Finally, the corrected 2.5-degree estimates were downscaled to 0.25° to generate the final PERSIANN-CDR product [40]. The daily PERSIANN-CDR Version 1 Revision 1 (hereafter referred to as PERSIANN-CDR) data from 1983 to 2013 were obtained from the U.S. National Oceanic and Atmospheric Administration (NOAA) (https://www.ncei.noaa.gov/data/precipitation-persiann/access/, accessed on 15 August 2020). In this study, daily precipitation was accumulated to monthly to keep the consistency of gauge data and the other two LSPEs.
The CHIRPS is a quasi-global satellite and observation-based precipitation estimate. It has provided 0.05° precipitation estimates since 1981. It covers the land from 50°N to 50°S and is available from daily to annual time intervals. The generation of CHIRPS mainly includes two steps: the preliminary version of CHIRPS was generated based on multiple global cold cloud duration precipitation estimates with the correction of the Tropical Rainfall Measuring Mission Multi-Satellite Precipitation Analysis version 7 (TMPA 3B42 v7) and sparse World Meteorological Organization’s Global Telecommunication System (GTS) gauge data; then, the final CHIRPS product was built by blending more available gauge datasets from around the world. Because of the different latency of obtaining various gauge data, the preliminary and final CHIRPS have a latency of ~2 days and ~3 weeks, respectively [41]. In this study, the monthly CHIRPS version 2 (hereafter referred to as CHIRPS) data from 1983 to 2013 were obtained from the University of California (https://www.chc.ucsb.edu/data/chirps, accessed on 10 August 2020).
MSWEP is a recently released global precipitation dataset from 1979 to the near-present with a spatial resolution of 0.1 degrees and temporal resolution of 3 hours [39,44]. The hourly, daily, monthly, and annual time scale data are available. MSWEP version 2 (hereafter referred to as MSWEP) is a current and improved version of MSWEP. It is a combination of several precipitation data resources, including satellite-based precipitation estimates, reanalysis estimates, and ground-based precipitation observations. The satellite-based estimates mainly include TRMM 3B42RT V7, GSMaP Moving Vector with Kalman products, Gridded Satellite (GridSat) B1 infrared data, and CMORPH estimates. Reanalysis includes European Centre for Medium-Range Weather Forecasts (ECMWF) interim reanalysis, Japanese 55-year Reanalysis (JRA-55), Global Precipitation Climatology Centre (GPCC) product, and WorldClim V2.0 monthly climatic dataset. It should be noted that final MSWEP estimates were generated using a daily gauge correction algorithm based on various gauge sources like Global Historical Climatology Network–Daily (GHCN-D) and Global Summary of Day (GSOD). In this study, the monthly MSWEP data from 1983 to 2013 were obtained from the official website (http://www.gloh2o.org/mswep/, accessed on 3 February 2021).

2.3. Statistics Evaluation Metrics

It is well known that there is a scale mismatch problem between the site-scale gauge and grid-scale satellite-based precipitation estimates. Conventionally, the rain gauges could be interpolated to the same scale with the SPEs based on different spatial interpolation techniques, such as the Inverse Distance Weighting (IDW) and Kriging method [45,46]. However, these interpolation methods may introduce large uncertainties and errors when the gauges are sparse and unevenly distributed with complex terrain [47,48]. Previous studies proved that spatial resolution differences may introduce small uncertainties on a monthly scale [47]. Therefore, ignoring the uncertainties from the different spatial resolutions of three LSPEs, the evaluation was conducted at a point scale without using any interpolation technique.
A series of conventional statistical metrics were used to evaluate the performance of three LSPEs in capturing monthly precipitation and drought characteristics. These statistical metrics used include relative bias (RB), Pearson linear correlation coefficient (CC) and root mean square error (RMSE). These statistical indices have been used in many evaluation studies [15,16,49]. The equations are listed in Appendix A.

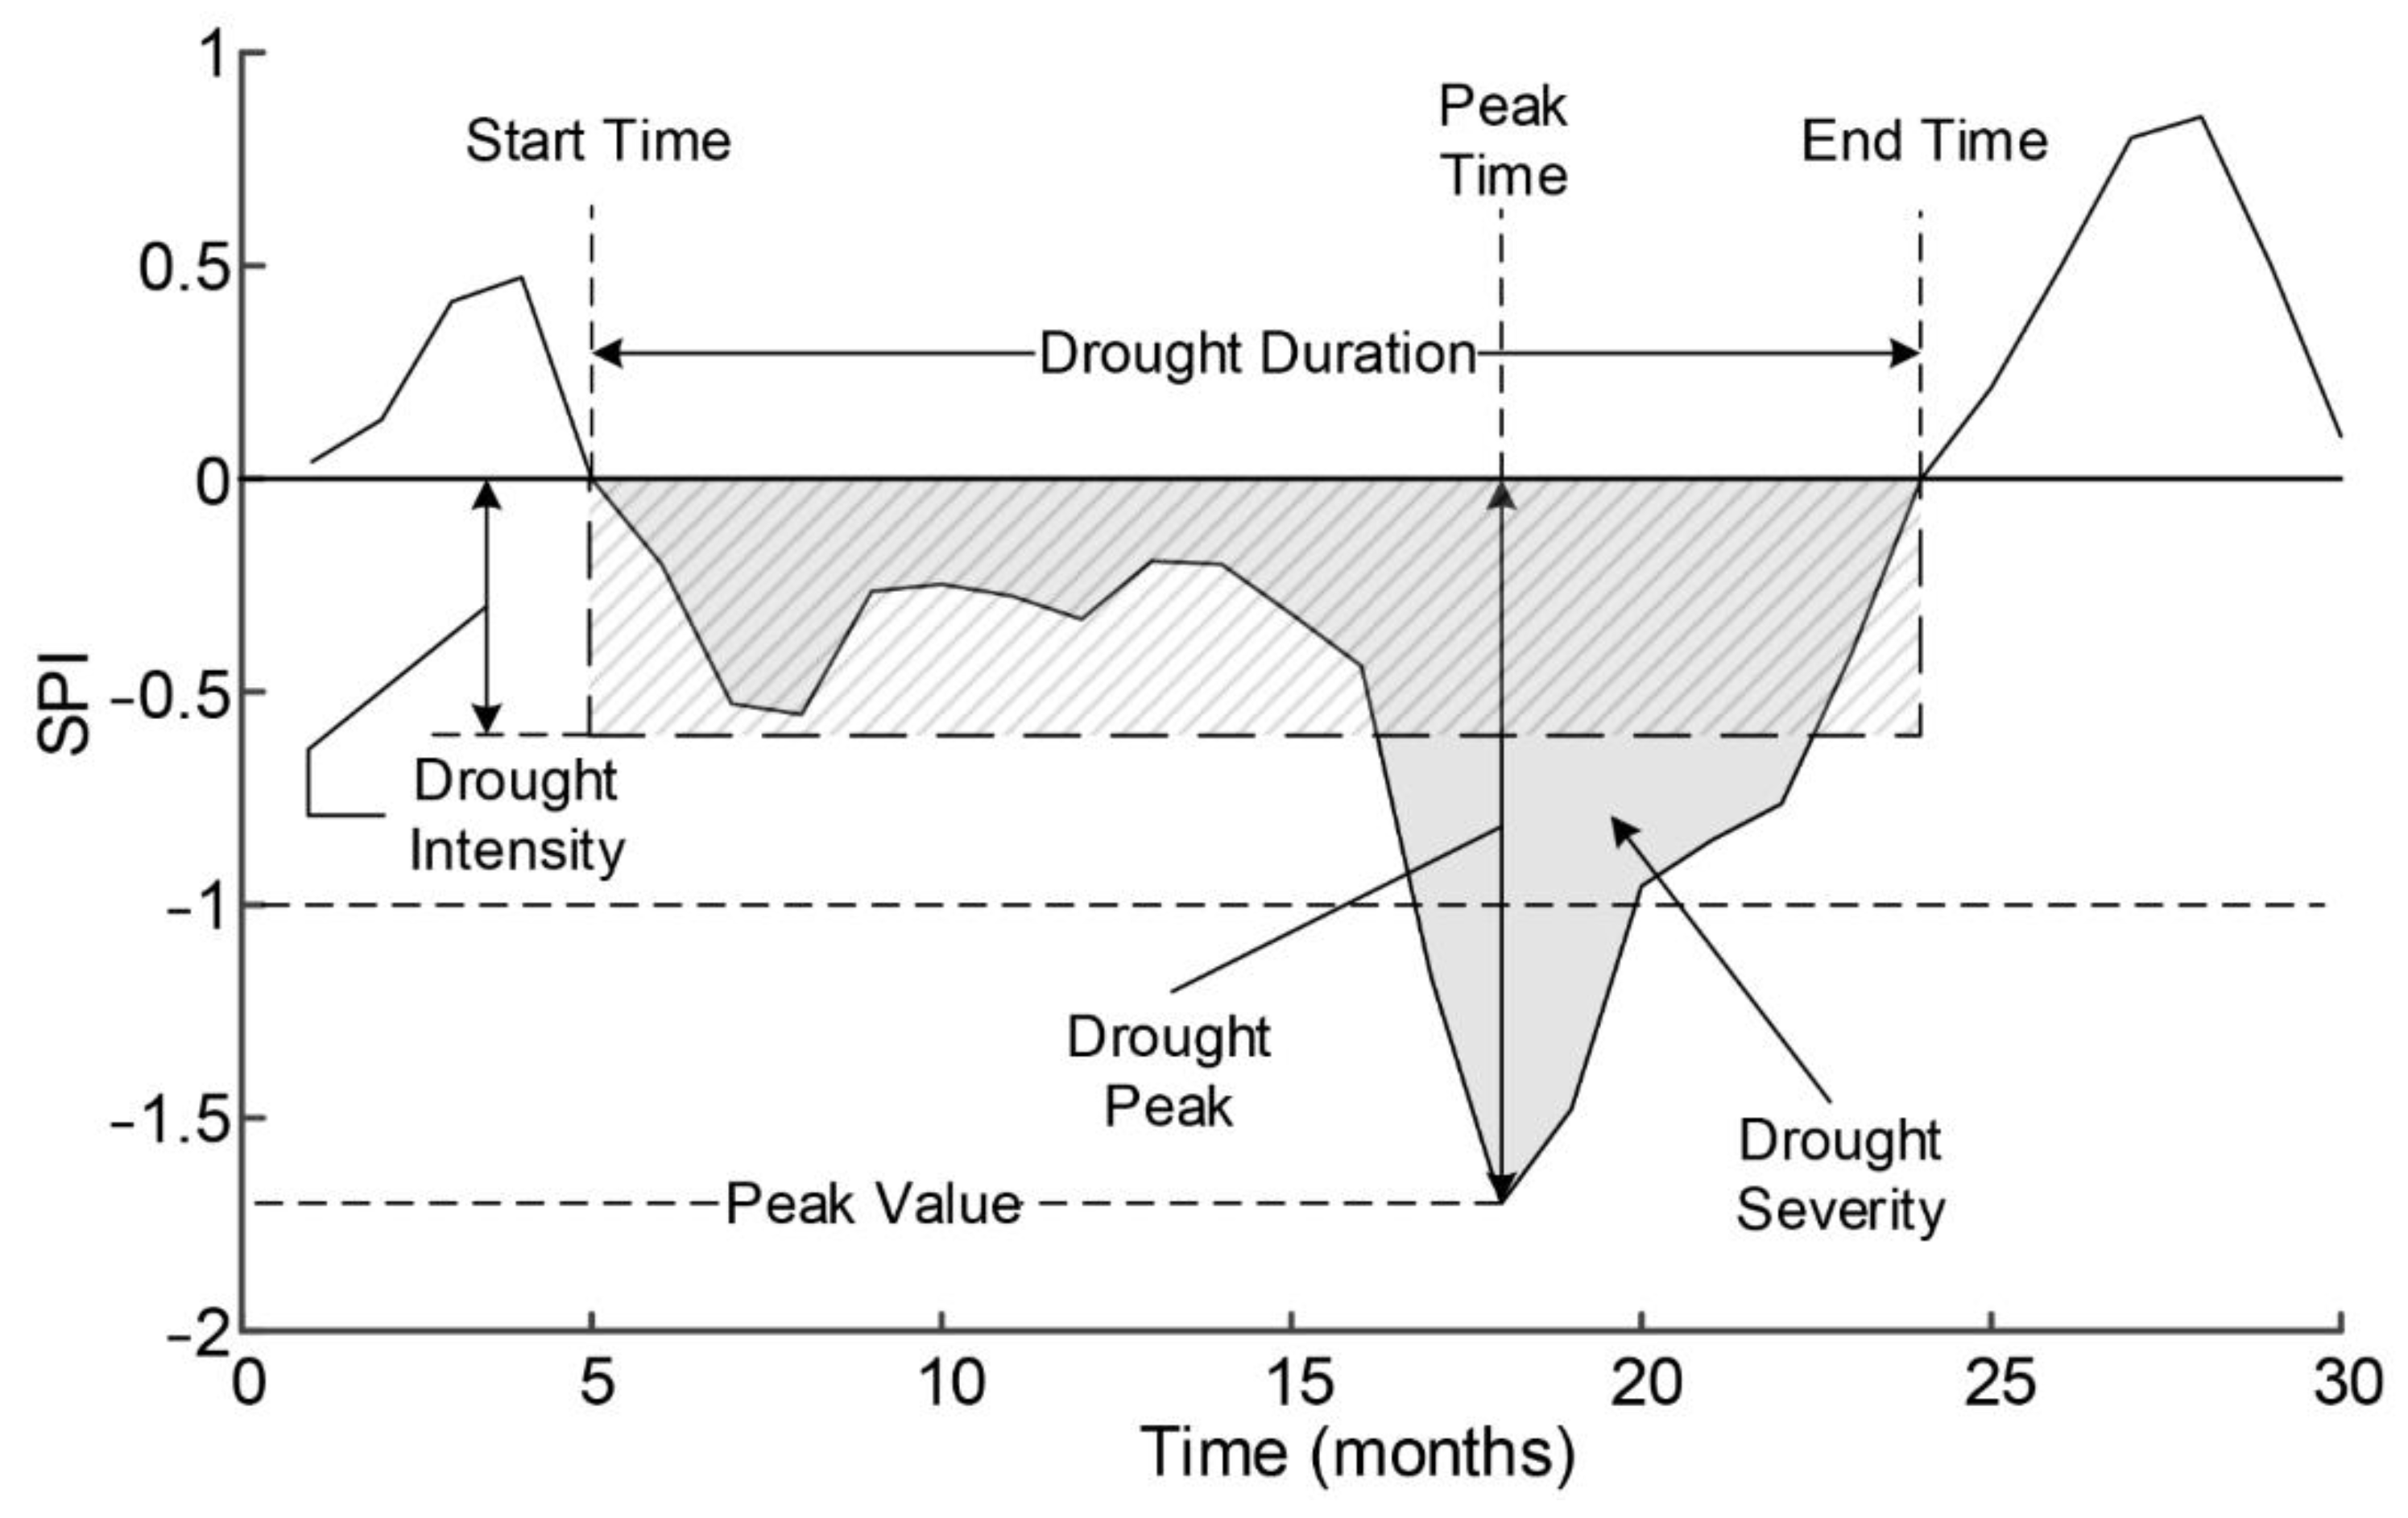
2.4. Drought Index and Drought Characteristics

In this study, SPI [8] was used to assess the capability of both LSPEs to reflect the drought conditions and drought event characteristics against the ground observations. The drought index was used in this study for the following reasons: (1) The SPI is calculated solely based on precipitation variable, which is consistent with our aim of determining the ability of LRPEs to capture drought characterizations and the fact that other variables like radiation and relative humidity are difficult to collect in the arid zones of Central Asia. (2) SPI is a probability-based index in which the SPI value is transformed from a long-term mean condition’s deviation degree [50]. Table A1 lists the SPI classes as well as their relative probabilities. (3) SPI is dimensionless and normalized, the SPI values in different regions could be directly compared [51,52]. (4) SPI can be used to investigate various types of droughts and quantify drought conditions with flexible timescales [53,54]. In this study, four typical timescales (i.e., 1-month, 3-month, 6-month and 12-month) are considered.
To better evaluate the potential of LSPEs for characterizing drought event features, the Run theory [55] was used to define drought events and quantify their characteristics like drought duration, intensity, and severity. Based on the study of McKee et al. [8], a drought event occurs when the SPI is negative, the peak value is less than −1, and the duration is greater than 2 months (Figure 1). Drought duration (DD) is the number of months between the start and end of a drought event. Drought severity (DS) is defined as the absolute cumulative SPI values during a drought event, which is the grey area in Figure 2. Drought intensity (DI) is the average value of absolute SPI during a drought event (the slash texture area).

2.5. Statistics for Drought Characteristic Evaluation

To quantify the ability of LSPEs to capture drought events, the probability of detection (POD), false alarm ratio (FAR), and missing event ratio (MISS) are used in the current study [56]. POD is used to quantify the hit ratio of drought events identified by both LSPEs and gauges. FAR is designed to measure the ratio of drought events falsely identified by LSPEs. The goal of MISS is to determine what percentage of drought events are detected by gauge but not by LSPEs [57]. These three categorical indices have been widely used in many studies [49,58,59]. The formulas are as follows:
P O D ( % ) = N ( S = 1   &   G = 1 ) N ( G = 1 ) × 100
F A R ( % ) = N ( S = 1   &   G = 0 ) N ( S = 1 ) × 100
M I S S ( % ) = N ( S = 0   &   G = 1 ) N ( G = 1 ) × 100
where S and G represent the LSPEs and Gauges, respectively. N means the number of drought events under different conditions. S = 1 (S = 0) indicates drought event identified by LSPE (or not); G = 1 (G = 0) illustrates a gauge-identified drought event (or not).
The mean value of drought duration (MDD), drought severity (MDS), and drought intensity (MDI) are also calculated throughout 1983–2013 to assess the ability of LSPEs to quantify drought characteristics. The following are the formulas for drought characteristics and their mean values:
M D D = i = 1 N D D i N
M D S = j = 1 N D S j N ,   D S = i = 1 D D | S P I i |
M D I = j = 1 N D I j N ,   D I = i = 1 D D | S P I i | D D
M D P = j = 1 N D P j N ,   D P = max | S P I i | 1 i D D
where i is a month during a drought event, SPIi denotes the SPI value for the specified month i; N means the total number of drought events identified throughout the study period, and j is the index of the drought event.

3. Results

3.1. Evaluation of LSPE for Estimating Precipitation

The performance of LSPEs in estimating precipitation is firstly assessed by comparing their values with gauges. Both spatial pattern and temporal evolution are considered in this section.
Figure 3a–c present the spatial distribution of the multiyear mean precipitation derived from the three LSPEs and gauge stations during the period from 1983 to 2013. All three LSPEs could generally capture the spatial precipitation pattern. Because of its higher spatial resolution (0.05°), CHIRPS shows a smoother spatial precipitation pattern than MSWEP and PERSIANN-CDR. PERSIANN-CDR seems to have difficulty in accurately capturing local terrain precipitation, missing the high precipitation amounts in the Tianshan Mountain and the Kunlun Mountain area. This could be explained by the fact that cloud-top infrared estimates are used in the generation of PERSIANN-CDR [60,61]. CHIRPS performs best in terms of standard deviation, correlation, and RMSE, with the highest CC (0.89) and the lower RB (−0.02%) and RMSE (4.75 mm/month) (Figure 3b). PERSIANN-CDR tends to overestimate precipitation with RB of 6.78% (Figure 3a) while MSWEP tends to underestimate it by about 4.27% (Figure 3c).
Temporal variation of precipitation is extremely significant for drought monitoring. To measure the performance of LSPEs in simulating temporal precipitation evolution throughout 1983–2013, the CC and RMSE are calculated at a point scale, as shown in Figure 4. In Xinjiang, all three LSPEs exhibit a high average CC (≥0.63) and a low average RMSE (0.62), especially in the eastern Hexi corridor. PERSIANN-CDR and CHIRPS exhibit lower correlation and higher RMSE with gauges in both the Tianshan Mountain and the Kunlun Mountain area. Despite the better performance in replicating spatial patterns, CHIRPS shows some inferiority in capturing the temporal evolution of precipitation, with relatively lower CC (0.63) (Figure 4c). With average CC up to 0.73, MSWEP performed the best in simulating temporal precipitation variation.

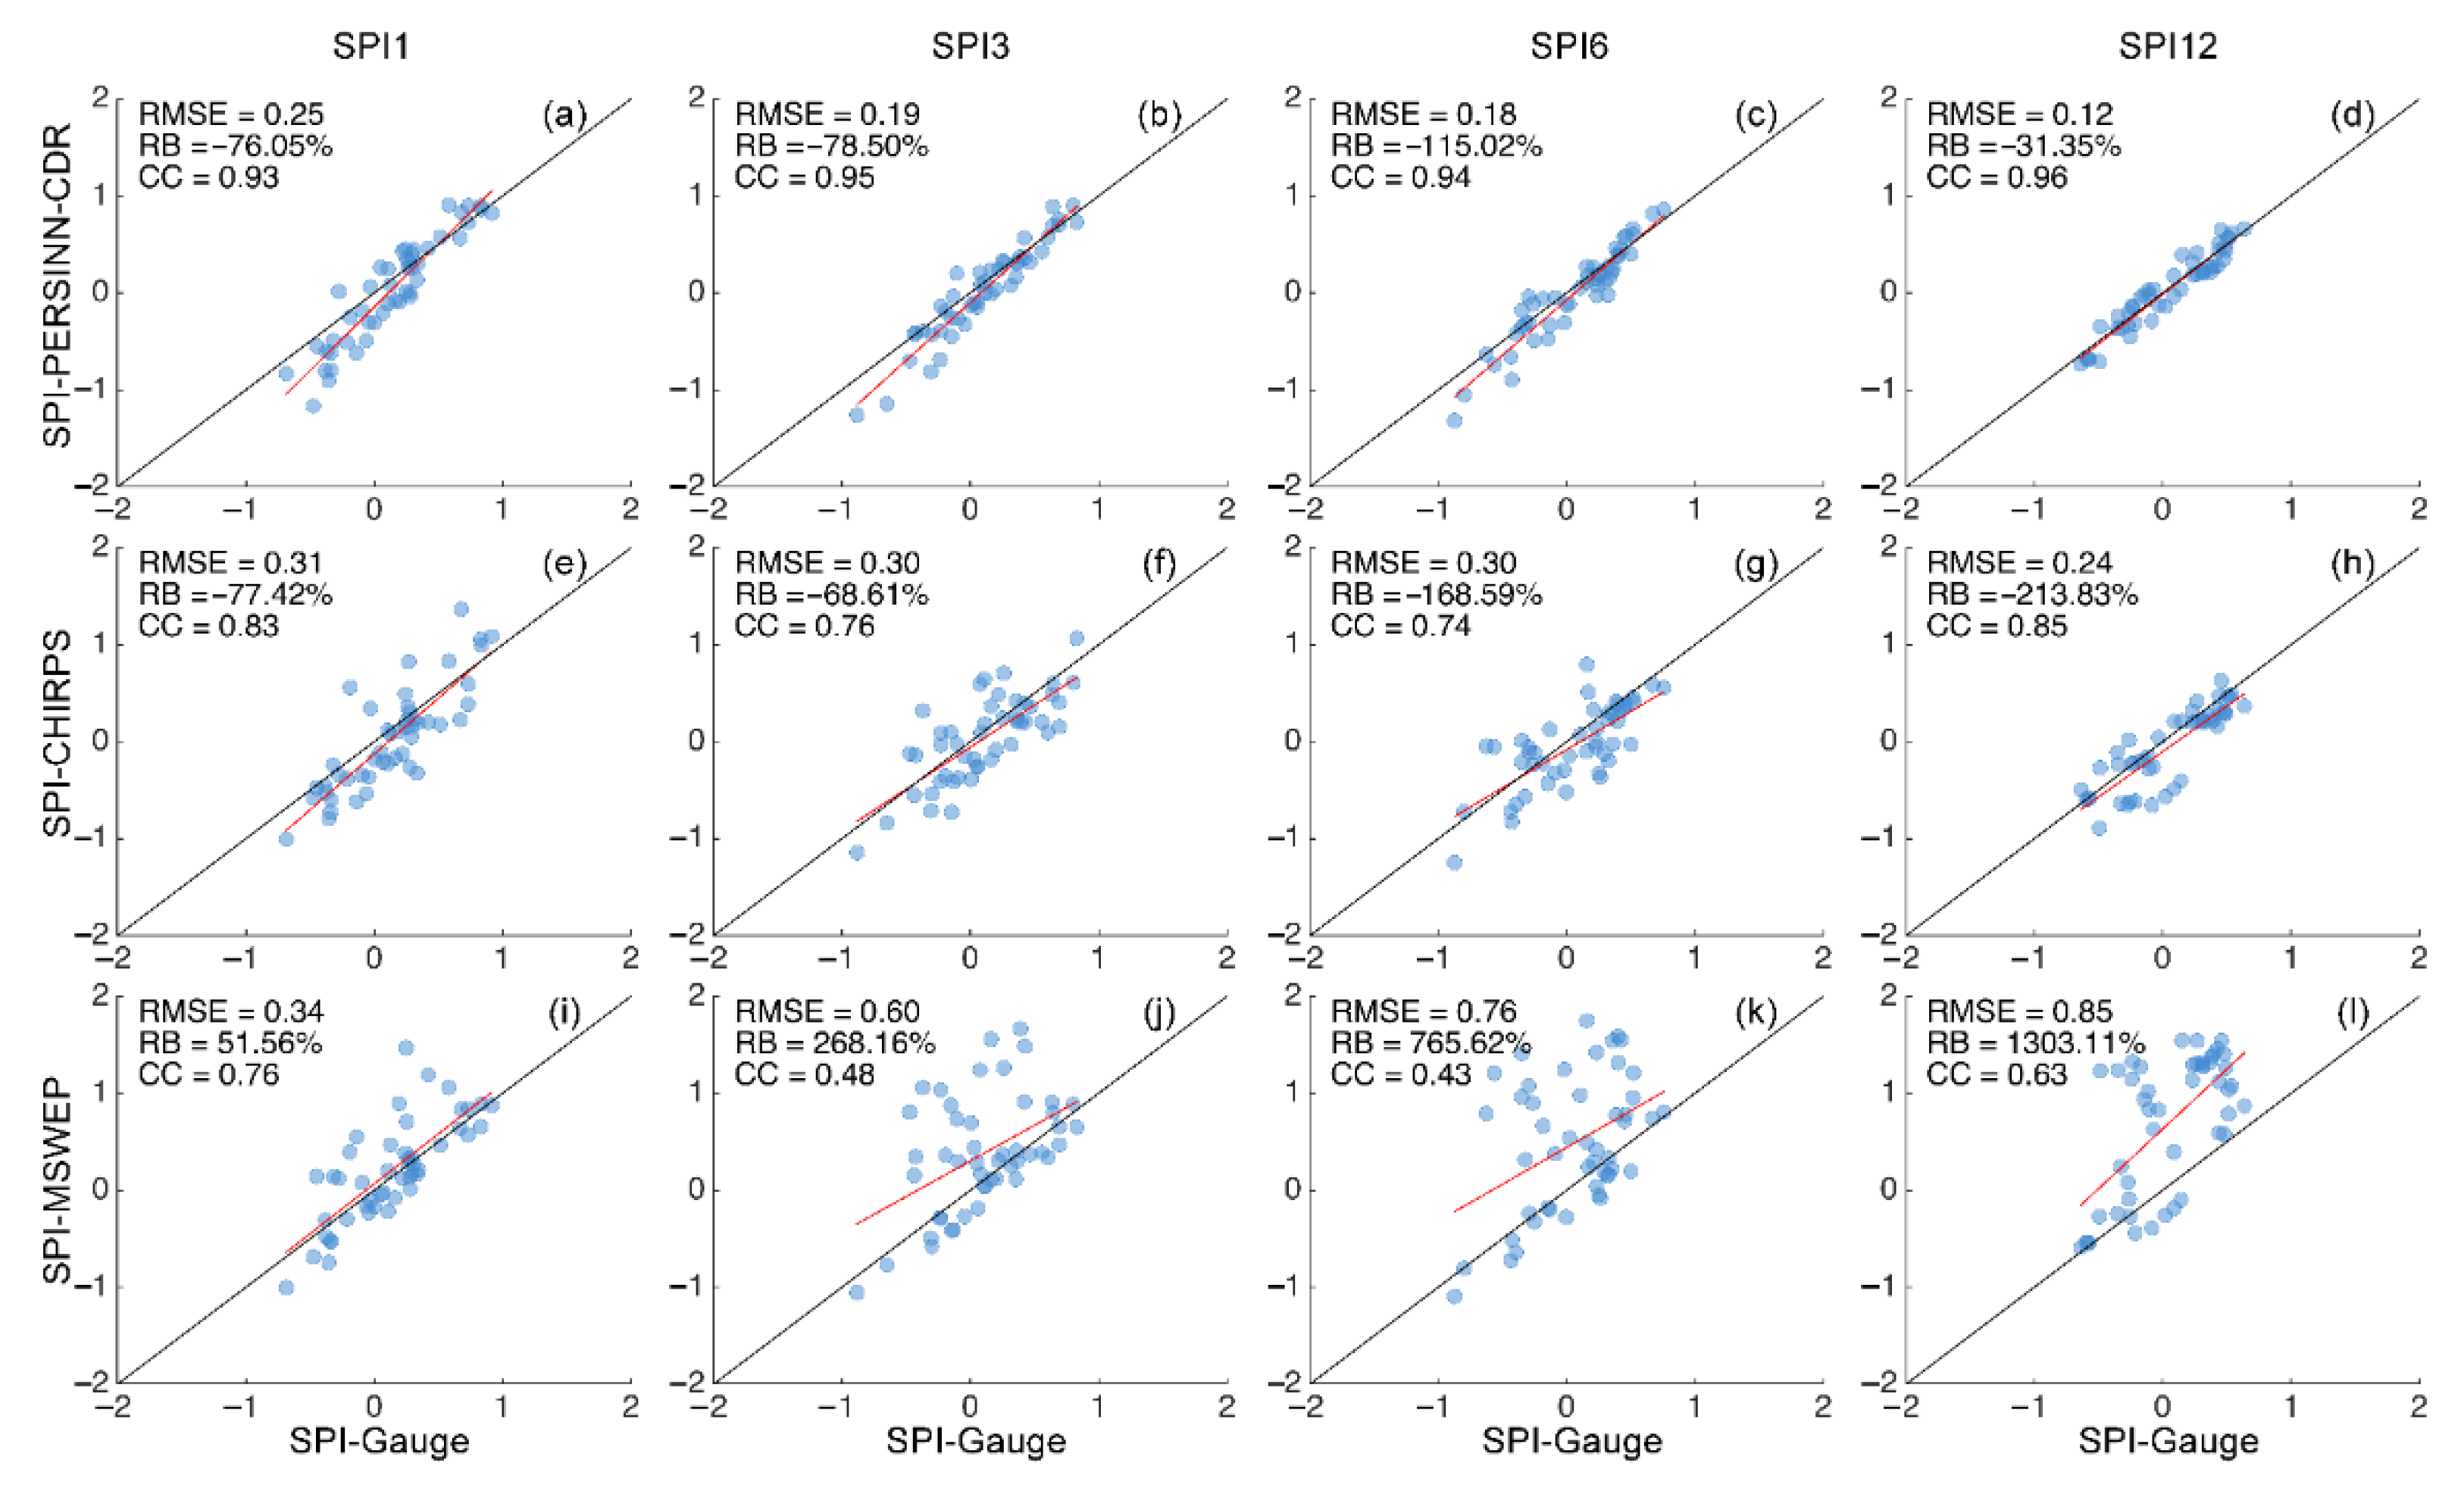
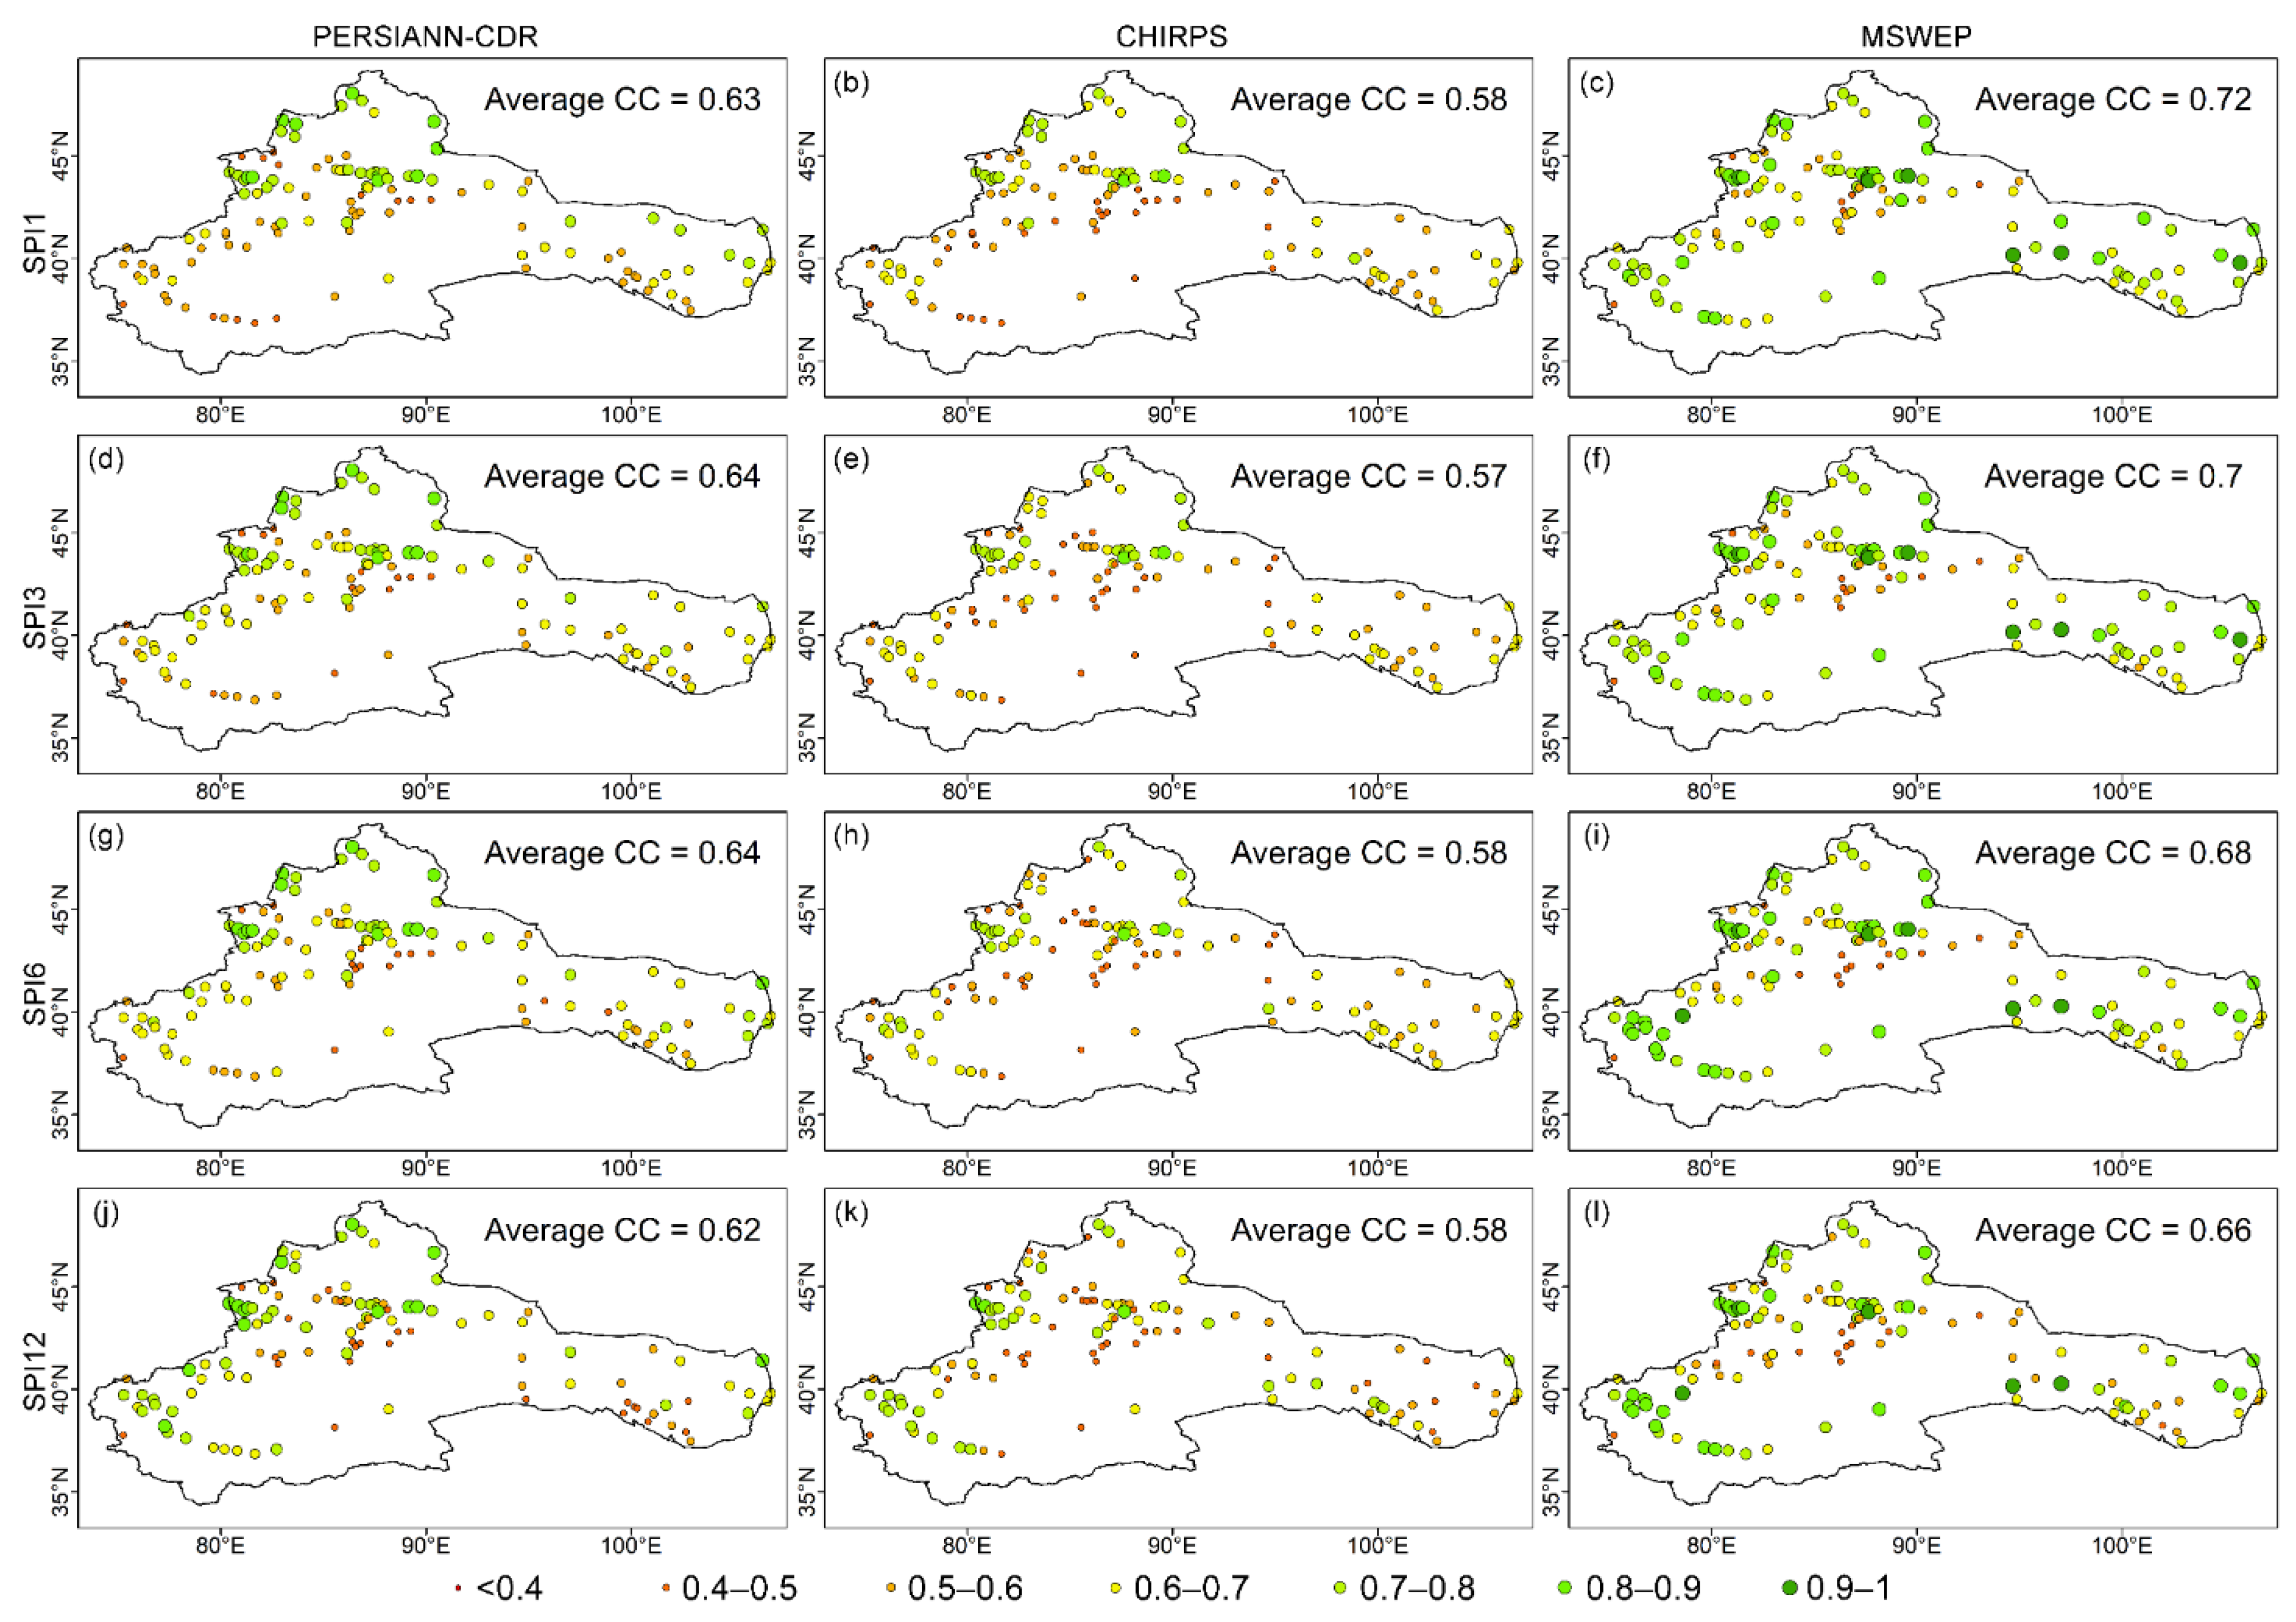
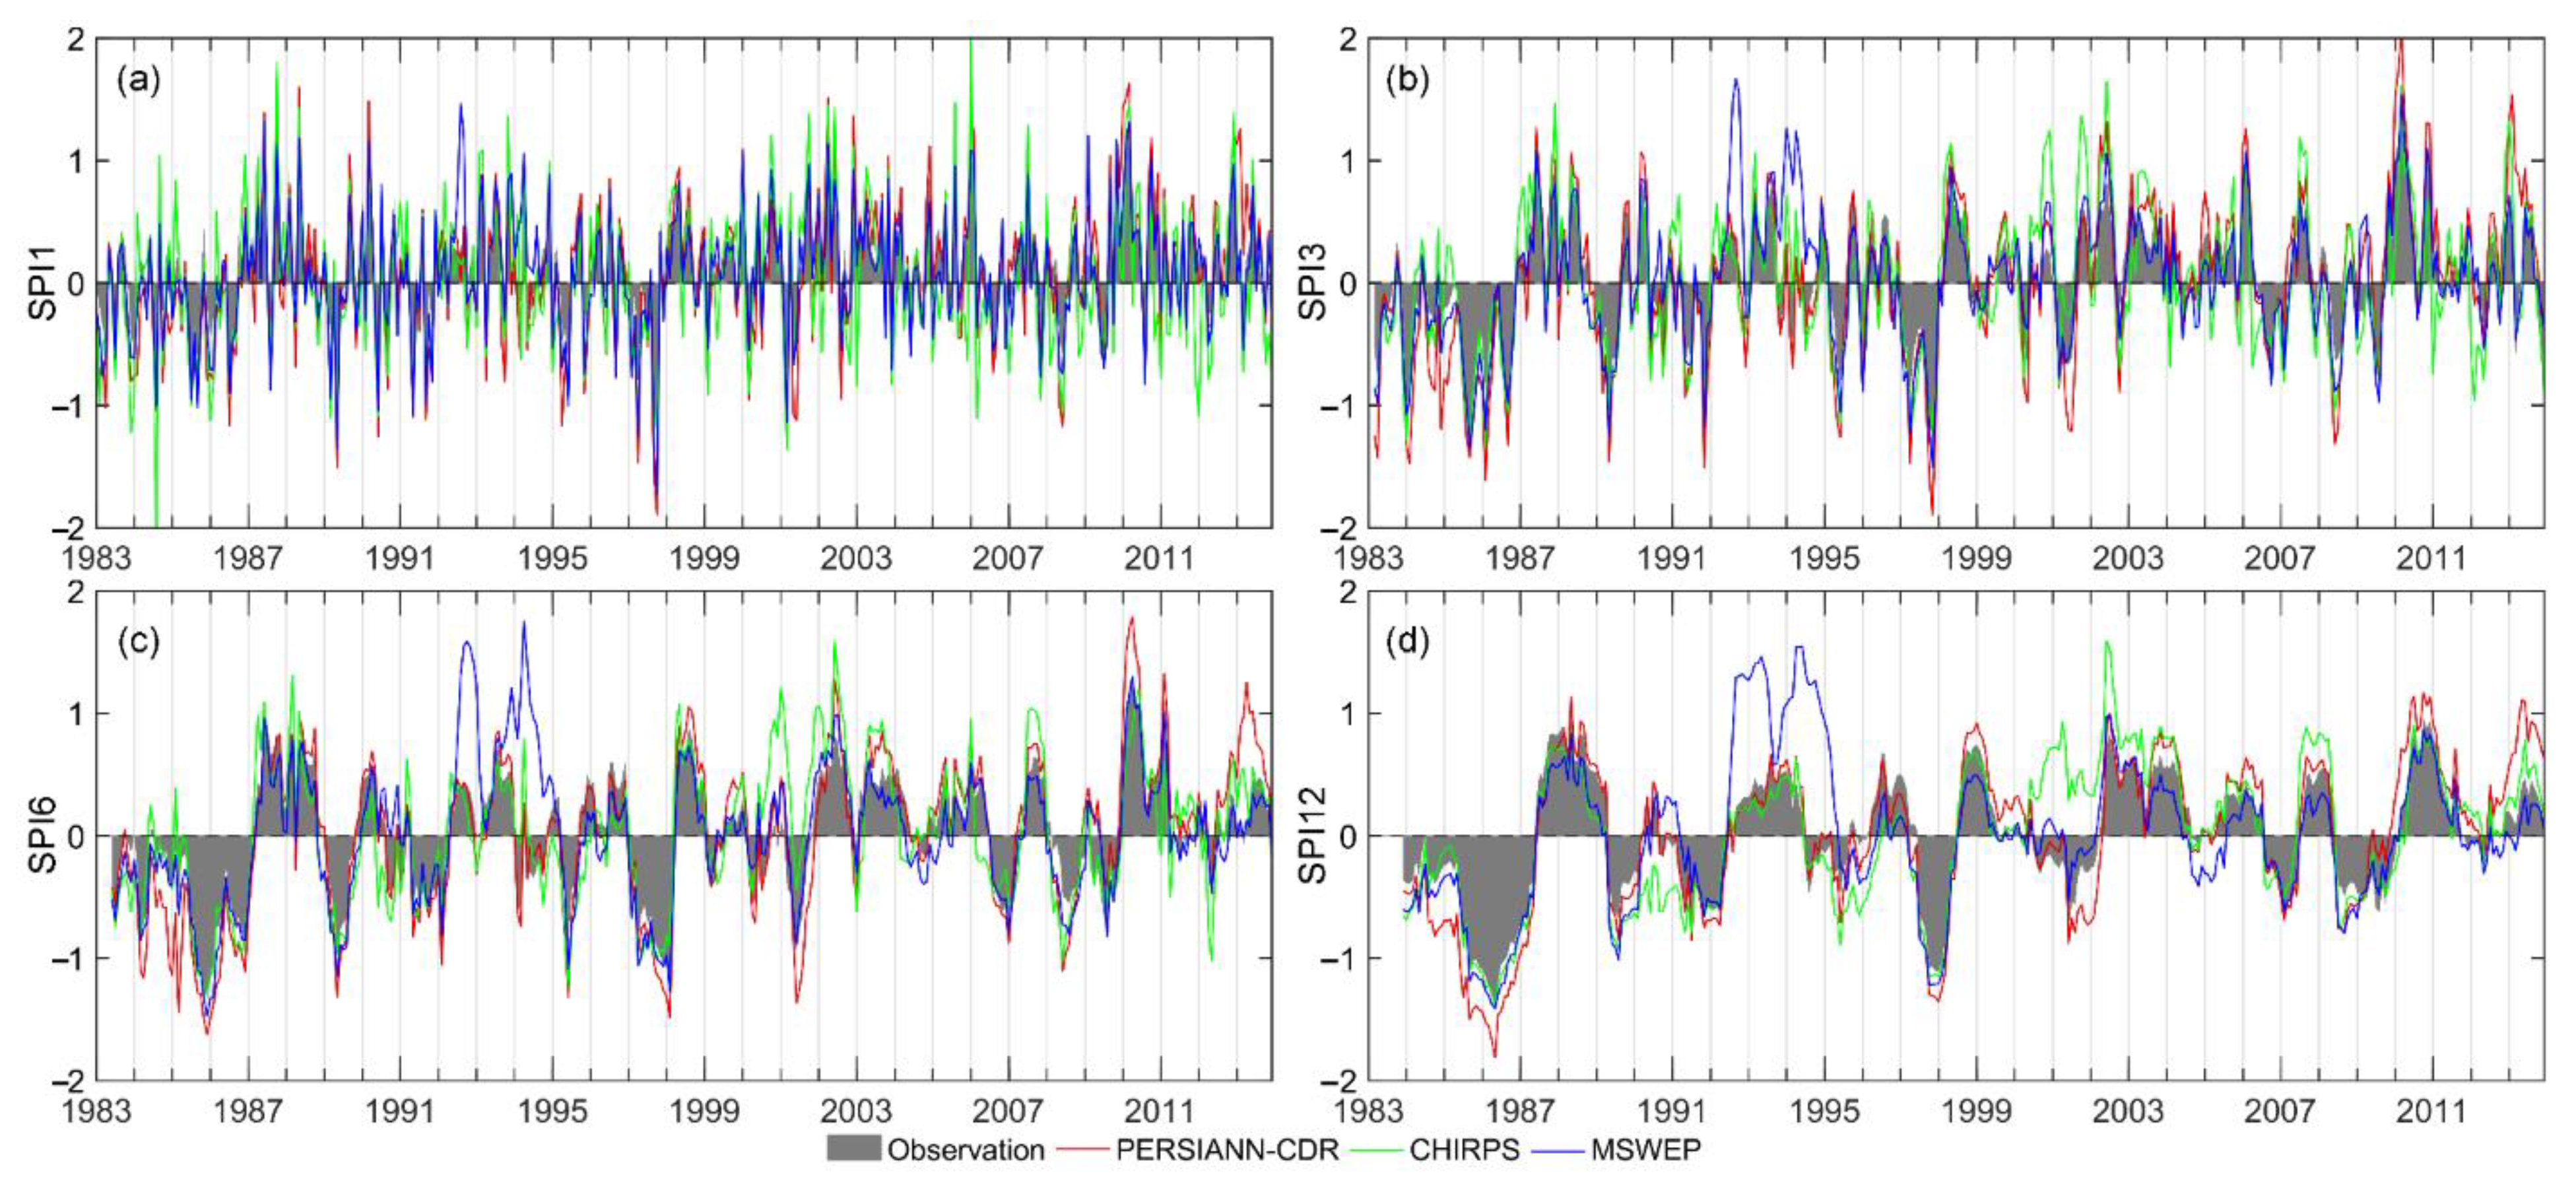
3.2. Evaluation of LSPE for Estimating SPI

The accuracy of drought index estimation may directly affect the ability of drought characterization estimation. The point-scale SPI values based on LSPEs (SPICDR, SPICHIRPS, and SPIMSWEP) and gauges (SPIGauge) are calculated at 1, 3, 6, and 12 months. The correlation (CC) and RMSE of SPI values based on LSPEs and gauges are shown in Figure 5 and Figure 6.
As expected, SPICHIRPS has a relatively lower CC and a higher RMSE than those of SPICDR and SPIMSWEP. This is mostly due to CHIRPS’ inadequate ability to predict the temporal evolution of precipitation (Figure 4). Regardless of the time scales, SPIMSWEP shows the highest correlation and lowest RMSE with SPIGauge, with average CC ranging from 0.66 for SPI12 to 0.72 for SPI1, among all three LSPEs. According to the CC and RMSE, there is no noticeable difference in performance for PERSIANN-CDR and CHIRPS across the four timescales. However, MSWEP’s performance becomes poorer as the time scale increases. In the north Xinjiang region, PERSIANN-CDR seems to perform better in estimating SPI variation, while in the South Xinjiang and Hexi Corridor regions, it shows lower correlations with gauges. CHIRPS has relatively higher RMSE values in the Tianshan Mountain region.
Figure 7 shows the SPI temporal evolution of LSPEs and gauges. To quantify the uncertainties of LSPEs for capturing temporal variation in SPI, the RB, CC, and RMSE are also calculated for both wet (SPI > 0) and dry (SPI < 0) months.
It is revealed that the SPI values in short time scales vary frequently between positive and negative over time. This causes dry or wet events to be discontinuous, which is also found by other studies [37,62]. At multiple time scales, the performance of LSPEs in capturing SPI temporal evolution is generally satisfactory. Even though the frequently varied SPI values on short time scales, LSPEs could well capture the dry or wet fluctuations with some overestimation and underestimation (Figure 7). All three LSPEs show an overestimation during dry months, which decreases as the time scale increases.
MSWEP appears to perform better than the other two LSPEs in terms of reflecting dry or wet temporal evolution at multiple scales and has a higher correlation with gauges (CC > 0.8) during dry months. However, it also suffers from overestimation from 11.69% for SPI12 to 37.31% for SPI1. Short time scales have a higher SPI overestimation than long time scales, and vice versa. Surprisingly, MSWEP shows a great overestimation between 1992 and 1995, and the SPI overestimation is accumulated and becomes greater with the increase in time scale. Figure A1 shows an additional comparison of SPIs based on both LSPEs and gauges from 1992 to 1995. From 1992 to 1995, MSWEP greatly overestimates SPI against observations with RB from 51.56% for SPI1 to 1303.11% for SPI12 and CC lower than 0.64, while PERSIANN-CDR and CHIRPS appear to have performed normally with reasonable RB values (from −213% to 0%) and CC values (≥0.74). This is mainly because summer precipitation was consistently overestimated during these years. The anomalies during this period may have resulted in lower MSWEP and gauge correlations over longer time scales.
PERSIANN-CDR shows significant overestimation for both dry (SPI < 0) and wet (SPI > 0) months, with a relative bias of over 16% for wet conditions. The overestimation is more noticeable in dry months, with SPI1 at 66.34%, SPI3 at 42.21%, SPI6 at 33.99%, and SPI12 at 27.78%. CHIRPS shows a medium and stable performance among these three LSPEs. For dry months, the correlation between CHIRPS and gauges ranges from 0.63 to 0.86, with overestimation ranging from 19.78% (SPI12) to 62.96% (SPI1) (Table 2).

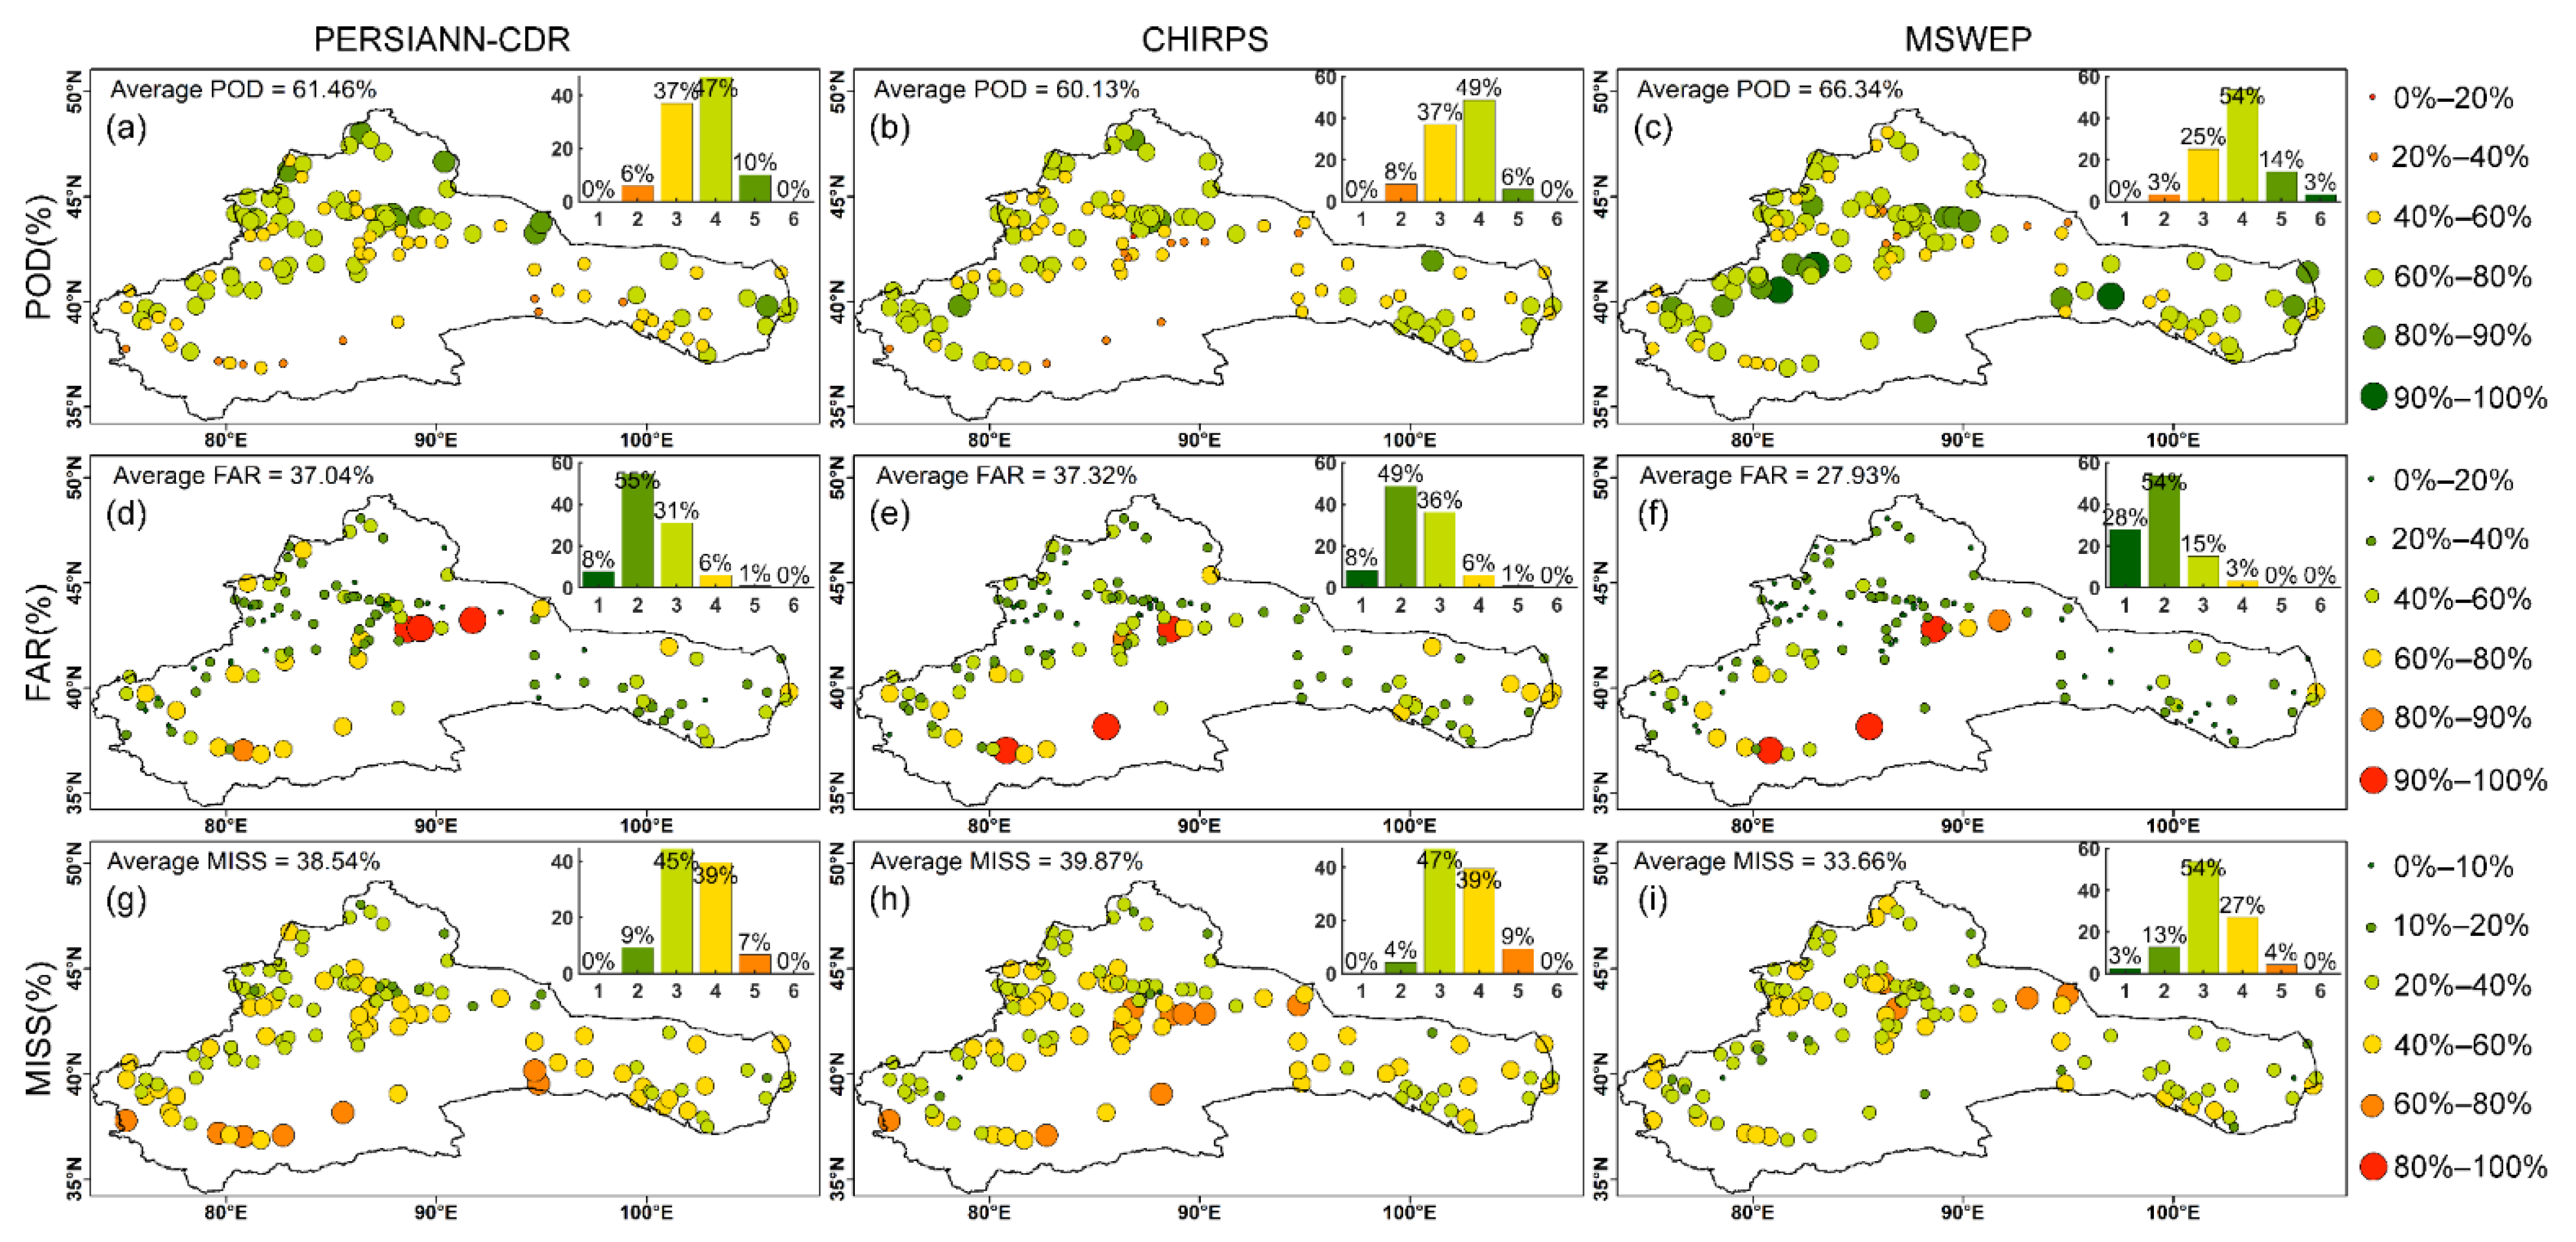
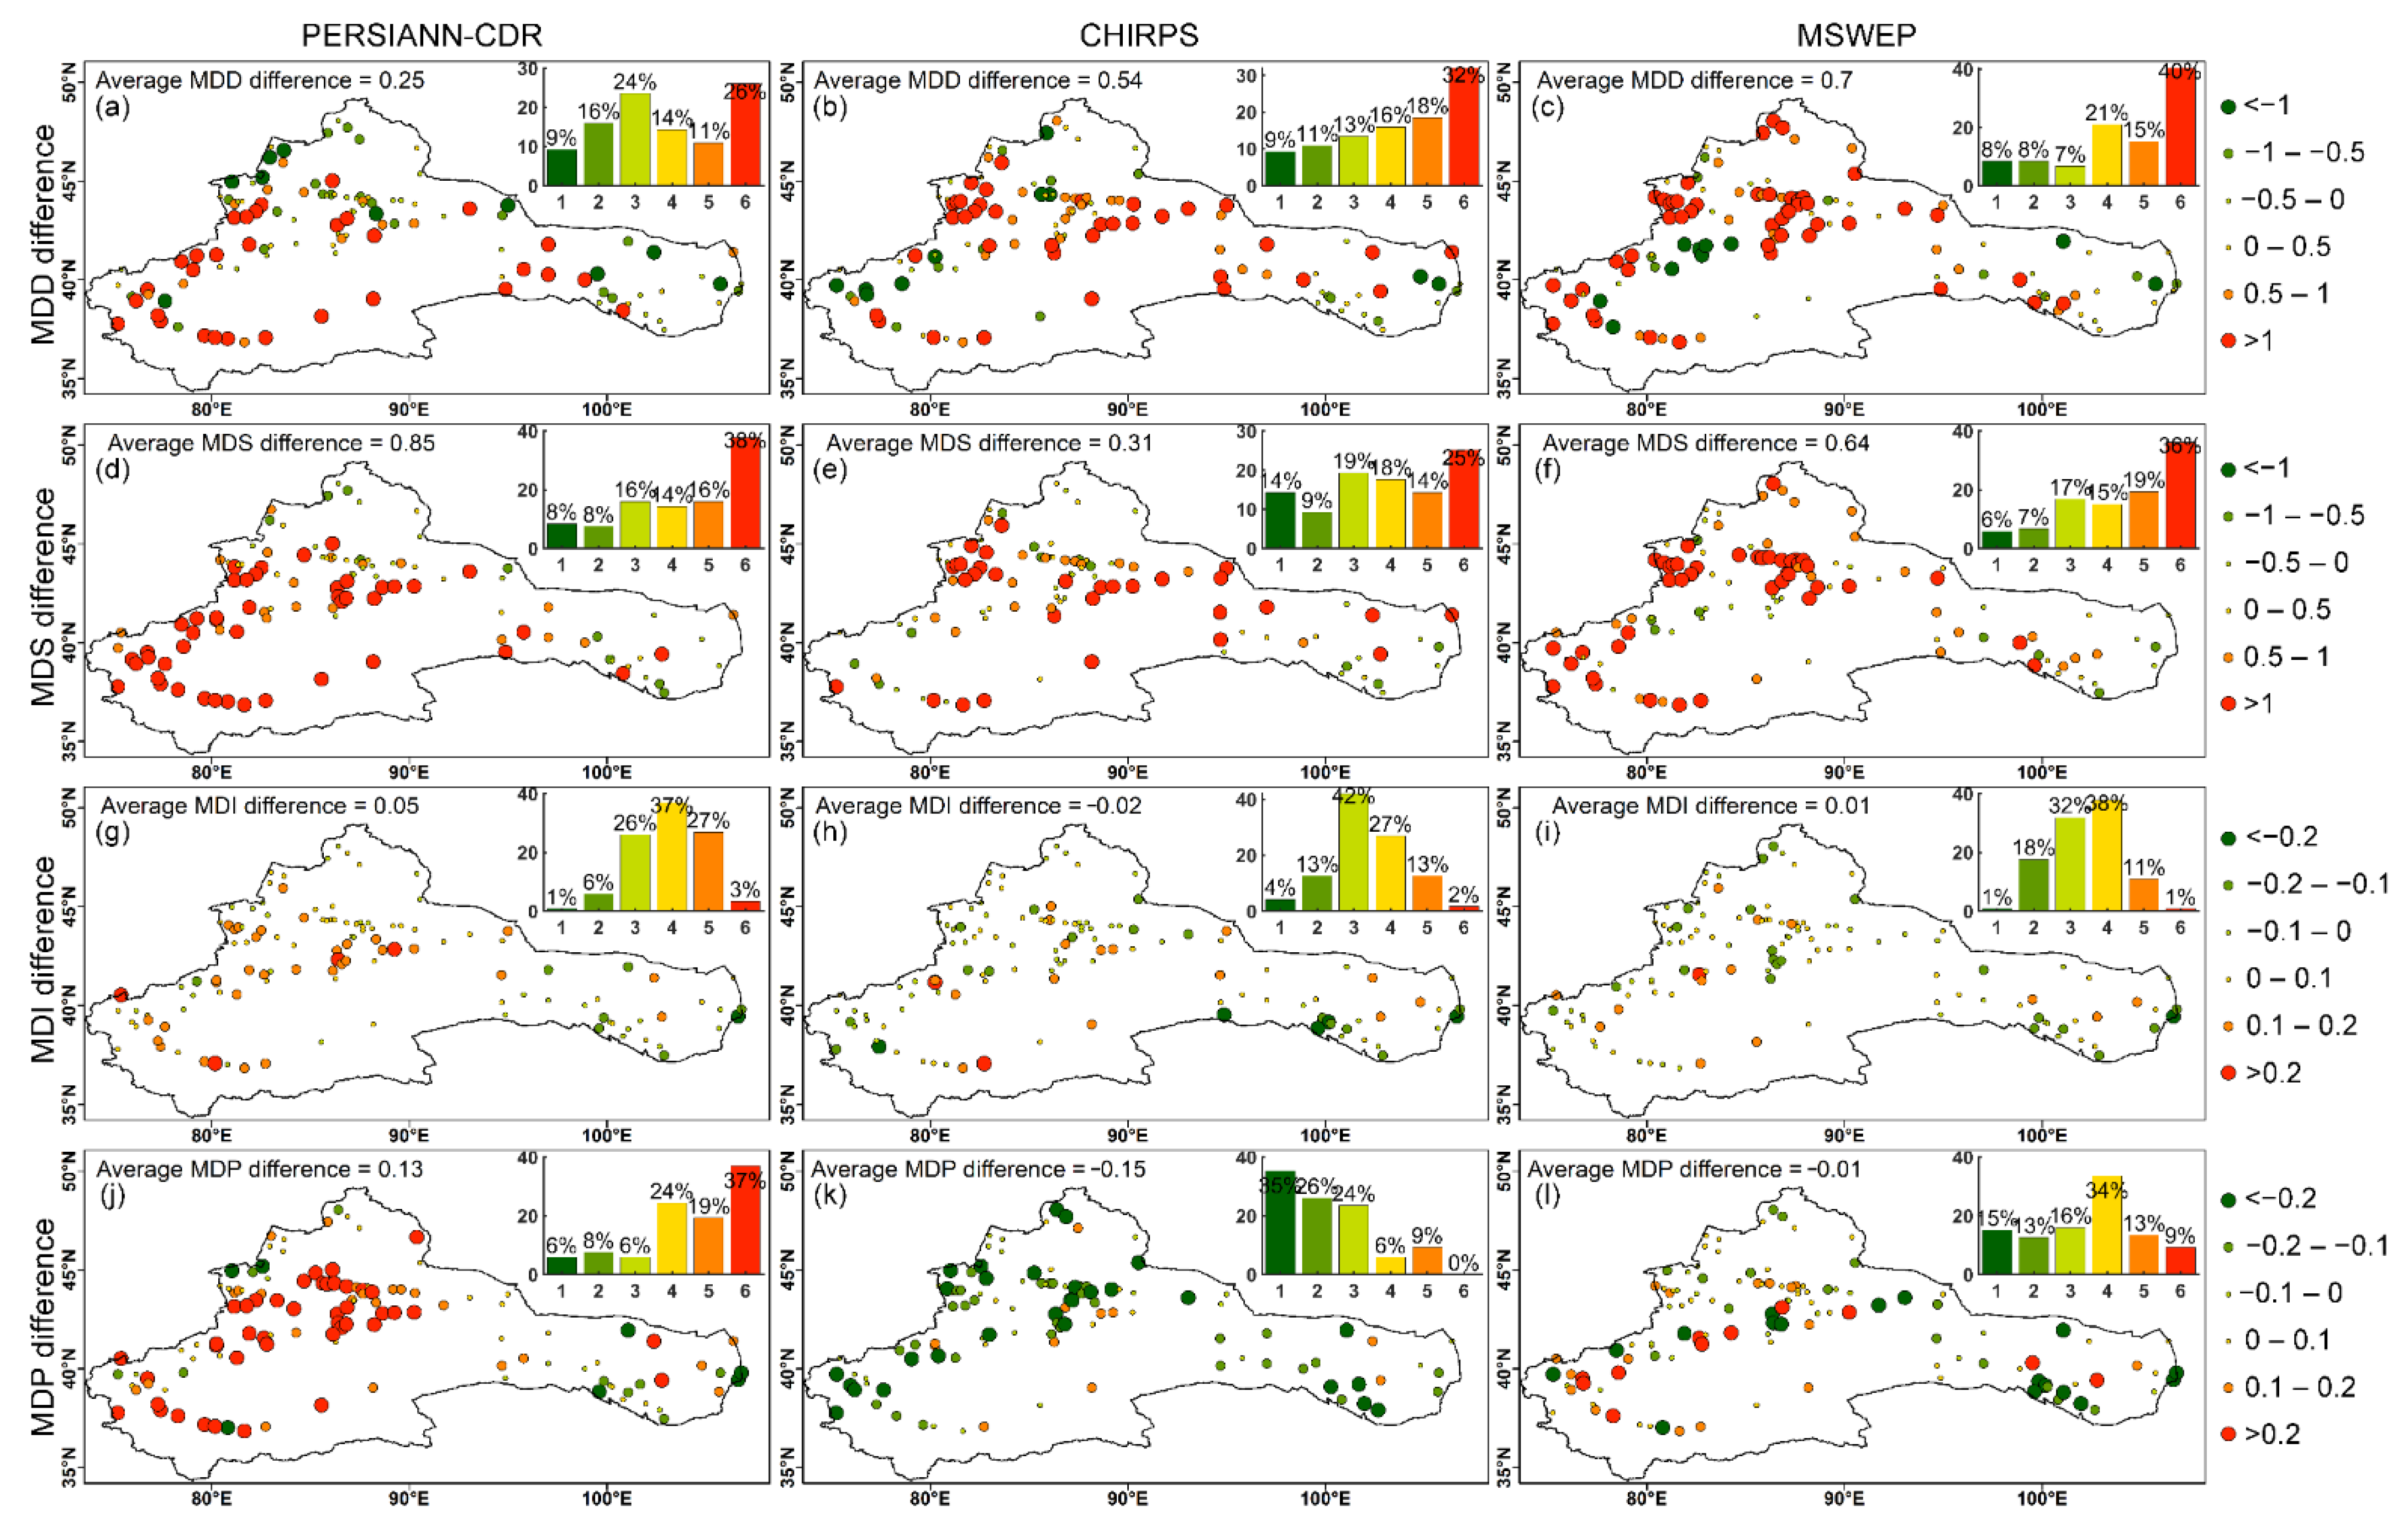
3.3. Performance of LSPE in Estimating Drought Characteristics

In this section, we would like to evaluate the performance of LSPEs in capturing drought events and estimating drought characteristics. The ability to capture drought events was assessed using categorical indexes (i.e., POD, FAR and MISS), whereas the ability to capture drought characteristics was assessed using the difference between three LSPEs and gauges for mean drought duration (MDD), mean drought severity (MDS), and mean drought intensity (MDI). To save space, only the 3-month SPI (SPI3), which is more suitable for identifying seasonal drought events [36,63], was selected as a representative case in the following sections.
Figure 8 depicts the spatial pattern of categorical indexes calculated between three LSPEs and gauges. The percentage of stations for each class is shown on the bar plots in the upper-right corner of each frame.
Three LSPEs have a good ability to capture drought events, with an average POD percentage of more than 60%. These LSPEs perform better in capturing drought events in the north of Xinjiang but have a lower POD score in the southern part. Among them, MSWEP has the highest average POD, at 66.34%, indicating significant superiority. MSWEP could capture more than 60% of drought events in more than 71% of stations. PERSIANN-CDR and CHIRPS perform poorly in capturing drought events with slightly lower POD values (61.46% and 60.13%). The FAR percentage is used to quantify the ratio of drought events that LSPEs falsely identified. The average false alarms of LSPEs are 27.93% for MSWEP, 37.04% for PERSIANN-CDR, and 37.32% for CHIRPS. High false alarms were found in the eastern Tianshan and southern Xinjiang regions. The MISS index is adopted to track drought events that are detected by gauges but missed by LSPEs. The average MISS percentage is greater than 30% for all three LSPEs. Similar to FAR, the high MISS percentages are mainly located in the eastern Tianshan region and the southern Xinjiang regions.
Generally, MSWEP was found to have a higher ability in identifying drought events, with lower missing and false events based on POD, FAR and MISS percentages.
Figure 9 shows the difference in drought characteristics between LSPEs and gauges, including MDD, MDS, MDI, and MDP. The abilities to describe the duration, severity, intensity, and peak value of drought events are quantified using MDD, MDS, MDI, and MDP differences, respectively.
Three LSPEs tend to overestimate drought duration for more than half of the stations. PERSIANN-CDR has the best agreement with gauges for drought duration, with an average value of 0.25 months. About 26% of stations show an MDD overestimation for more than a month (Figure 9a). MSWEP’s ability to determine the length of drought is limited. Drought events identified by MSWEP last 1 month longer in 40% of stations than gauges (Figure 9c). Similarly, all LSPEs overestimate drought severity in the majority of stations, with an average MDS overestimation of 0.31 for CHIRPS, 0.64 for MSWEP, and 0.85 for PERSIANN-CDR. The overestimation of drought severity can largely be attributed to an overestimation of drought duration (Figure 9d–f). Drought intensity is defined as the ratio of drought severity to drought duration. All LSPEs seem to have a lower drought intensity error with an average MDI difference of less than 0.05. This also suggests that drought severity overestimation is mainly caused by an overestimation of drought duration. From the bar plots, we can find that more than 60% of stations have an absolute MDI difference of less than 0.1 for three LSPEs. Among these three LSPEs, the amplitudes of overestimation for PERSIANN-CDR are relatively higher, especially for stations in the Tianshan Mountain area (Figure 9g). The drought peak value is a measurement of a drought’s most severe month during one drought event. The spatial pattern of the mean drought peak value (MDP) is illustrated in Figure 9j–l. PERSIANN-CDR seems to have greatly overestimated the drought peak value of drought events (Figure 9j). This phenomenon is consistent with the results shown in Figure 9. More than 70% of stations show an overestimation of drought peak value, and 37% of stations show an overestimation of more than 0.2. However, CHIRPS tends to underestimate drought peak value in 75% of stations, with an average MDP of 0.15 (Figure 9k). MSWEP shows the best performance in estimating drought peak values. The absolute MDP difference is less than 0.1 in about half stations (Figure 9l).
Generally, LSPEs tend to overestimate drought severity, which is mainly due to an overestimation of drought duration. MSWEP has a higher ability to predict drought peak values. PERSIANN-CDR tends to overestimate drought peak values, while the situation is the opposite for CHIRPS, with significant underestimation of drought peak values.

3.4. Performance of LSPE in Estimating Specific Drought Events

Drought events were identified using spatially averaged 3-month SPI values, and four drought events were selected based on various features to investigate the performance of three LSPEs during specific drought events. The specific drought characteristics of these three drought events are given in Table 3. The following is an illustration of the specific conditions of drought events, as well as a comparison of LSPEs and gauges.
The first was the most severe drought in recorded history during the study period, occurred between December 1984 and November 1986, and has been reported in some studies [31,34,64]. In September 1985, the drought event reached a peak value of 1.28 with a long duration (DD = 24 months), and high severity (DS = 11.88) and intensity (DI = 0.61). Both PERSIANN-CDR and CHIRPS overestimate the drought duration by 5 and 4 months, respectively. This is mainly due to the fact that they correctly predicted the drought’s end time (November 1986), but predicted the drought’s start time to be earlier. Due to their overestimation of duration, PERSIANN-CDR and CHIRPS both overestimated drought severity by 84.6% and 16%, respectively. PERSIANN-CDR also overestimated the drought intensity (25%) and its peak value (26%). MSWEP captured the start, end, and peak time accurately, with the same duration of 24 months. Despite an overestimation of drought severity (21%), it accurately captures the drought’s intensity and peak value.
The second drought event, which lasted from May to July 1991, was short (only 3 months) but intense, with a drought intensity of 0.61 and a peak value of 0.66. Despite its low severity (1.83), the summer drought of 1991 was reported to have a significant impact on local agriculture in Xinjiang [35]. All three LSPEs overestimated drought severity and peak value, with different magnitudes of overestimation. CHIRPS accurately captured the drought duration, while PERSIANN-CDR and MSWEP detected it as being a month longer. In estimating drought severity and peak values, PERSIANN-CDR had the worst performance with 36% and 42% overestimation, respectively. The MSWEP showed the closest drought severity and peak values with gauges.
The third drought event (January–December 1997) was characterized by its long length and high severity. The drought event had a relatively longer duration (12 months), as well as high severity (8.03) and high intensity (0.67), and has also been reported in other studies [65]. Both CHIRPS and MSWEP could accurately identify the drought start and end time, as well as its peak time. PERSIANN-CDR identified the correct start and peak times, but a later ending time, resulting in a 3-month overestimation of drought duration and a 35% overestimation of drought severity. Despite accurate drought time detection, CHIRPS and MSWEP also overestimated drought severity, intensity, and peak value. CHIRPS performed better in terms of quantifying drought characteristics during this drought event.
The fourth drought event was selected because of its low severity (3.43) and intensity (0.34), but a relatively long duration (10 months). Drought conditions were reported to have lasted more than half a year in 70% of Xinjiang stations during the drought [66]. PERSIANN-CDR showed a slight underestimation of drought severity, intensity, and peak value. This phenomenon could be related to the accurate estimation of drought duration. CHIRPS overestimated drought duration by 3 months, severity by 55%, and intensity by 21%, but drought peak values were underestimated. MSWEP showed the best performance, with a 5% overestimation of severity, a 5% underestimation of intensity, a 2% underestimation of peak values, and a 1-month longer duration.
Overall, LSPEs tend to overestimate drought severity, owing to a failure to capture the start and end of the drought time. MSWEP has better performance in estimating severity, intensity, and peak values. PERSIANN-CDR seems to have relatively poor performance, with systematic overestimation of drought severity, intensity, and peak values.
The spatial distribution of SPI on drought peak time for the four selected drought events studied is shown in Figure 10. To easily quantify the performances of LSPEs, the station ratio under different dry conditions for both LSPE and gauge was also calculated and shown in the concentric pie chart. Please note that the pie chart on the outside represents the station percentage for gauge, while the inner pie chart is the station percentage for LSPE. It is noted that only stations and corresponding grids from LSPEs were calculated in this section.
For severe drought events, PERSIANN-CDR appears to catch larger drought areas, which is mainly due to the fact that some wet stations were falsely identified as experiencing drought conditions. The overestimation of extreme drought areas was revealed in November 1991 and November 1997, when 17% and 30% of stations, respectively, were incorrectly identified as being in extreme drought conditions. CHIRPS, on the other hand, tends to miss some extreme drought regions for all four selected drought events. The underestimation of extreme drought areas can be clearly identified in the drought months of September 1985 (Figure 10b), November 1991 (Figure 10e), and November 1997 (Figure 10h). MSWEP appears to have closer percentages with gauges, indicating that it is better at capturing extreme drought conditions than PERSIANN-CDR and CHIRPS. However, the dry conditions (SPI < 0) were also overestimated. During the first three severe drought events, LSPEs performed well in capturing drought areas but missed 3% of extreme drought areas. (Figure 10j–l).
Generally, all three LSPEs were able to capture the overall drought pattern; however, there is still a lot of room for improvement when it comes to capturing drought patterns of varying intensities, especially for more severe drought events. MSWEP performs better than other LSPEs in terms of capturing drought spatial patterns.

4. Discussion

Drought index is important in drought monitoring and assessments [67,68]. Many drought indices have been developed, like SPI, Standardized Precipitation Evapotranspiration Index (SPEI) [69,70], Palmer Drought Severity Index (PDSI) [71], and so on [72]. Many studies have reviewed the characteristics of existing drought indices from different perspectives [17,72,73,74,75]. Each drought index has its own set of advantages and weaknesses. The researchers or users could select the drought index based on objective conditions and their specific needs. For example, the objective of this study is to evaluate LSPEs’ performance for meteorological drought monitoring compared to the valuable ground-based rainfall observations. The SPI was selected for this study because of its multiple advantages, including ease of calculation, applicability for both wet and dry conditions, ease of comparison in different regions, and flexibility of time scales [8,54,76]. SPI is solely based on precipitation without considering other hydrological parameters like potential evapotranspiration (PET). We did not use a drought index that includes PET, such as SPEI, because PET calculation is complex and unstable, and many other parameters (e.g., wind speed, relative humidity, solar radiation, etc.) involved in PET calculation are unavailable in this region [77]. Therefore, this analysis is based on the assumption that no other parameter’s effects were considered during the study period. Due to the role of the precipitation parameter in the calculation of various drought indices varying, the results may differ when another drought index is used. When studying the meteorological drought changes by considering the temperature effects, users may consider drought indices like SPEI or PDSI.

5. Conclusions

This study conducted an evaluation of three long-term satellite-based precipitation estimates in simulating precipitation and estimating drought features from 1983 to 2013 against ground-based precipitation observations. Our main findings are summarized below:
All three LSPEs show comparable performance in simulating precipitation variation, replicating dry evolution, identifying drought events, and characterizing drought features. However, we discovered that in dry months, these LSPEs tend to overestimate dry magnitude and have a relatively high false alarm rate (>27%) and missing rate (>33%). They tend to overestimate drought severity, owing to an overestimation of drought duration. LSPEs have advantages in capturing drought peak times, but they tend to overestimate drought peak values.
CHIRPS performs better at capturing precipitation patterns with high spatial resolution, but it has a weakness in estimating temporal variation; the weakness of CHIRPS in accurately capturing the temporal evolution of precipitation results in a clear lack of ability to replicate SPI variations.
PERSIANN-CDR tends to overestimate precipitation in many regions and performs poorly in simulating precipitation spatial patterns. When precipitation is overestimated, SPI values for dry months and drought characteristics (like drought severity and peak value) are overestimated. There are also obvious overestimations of the drought area in specific severe drought events.
MSWEP performs admirably when it comes to estimating precipitation spatial pattern and temporal variation. It also demonstrates marked superiority over the other two products in terms of capturing drought events, with a high probability of detection (66%) and a lower false alarm and missing ratio. It proves a higher ability in estimating event characteristics like drought peak value, severity, and area.
The strengths and weaknesses of LSPEs identified in this study could provide useful scientific evidence for users of satellite precipitation products in data selection and error tracking. Furthermore, they could be useful for the use of satellite-based precipitation products in drought monitoring applications, especially for areas with sparse rain-gauge stations. Moreover, the results of this study may also assist algorithm developers to improve the performance of LSPE generating algorithms.

Author Contributions

Conceptualization, P.D.M.; methodology and software, H.G. and M.L.; validation, X.M. and L.Z.; formal analysis, V.N.; investigation, H.G.; data curation, H.G.; writing—original draft preparation, H.G.; writing—review and editing, H.G. and V.N.; supervision, A.B.; funding acquisition, H.G. All authors have read and agreed to the published version of the manuscript.

Funding

This research was jointly funded by the National Natural Science Foundation of China (Grant No. 42001363), the Third Xinjiang Scientific Expedition Program (Grant No. 2021XJKK140304), the New Water Resources Strategy Research Project in NJ (403-1005-YBN-FT6I-8).

Institutional Review Board Statement

Not applicable.

Informed Consent Statement

Not applicable.

Data Availability Statement

Precipitation Estimation from Remotely Sensed Information using Artificial Neural Networks–Climate Data Record (PERSIANN-CDR) was retrieved from https://climatedataguide.ucar.edu/climate-data/persiann-cdr-precipitation-estimation-remotely-sensed-information-using-artificial (accessed on 15 August 2020); Rainfall Estimates from Rain Gauge and Satellite Observations (CHIRPS) is available on the website of University of California (https://www.chc.ucsb.edu/data/chirps, accessed on 10 August 2020) and Multi-Source Weighted-Ensemble Precipitation (MSWEP) can be obtained from http://www.gloh2o.org/mswep/ (accessed on 3 February 2021).

Acknowledgments

The authors thank the anonymous reviewers for their constructive comments and suggestions that greatly improved this paper.

Conflicts of Interest

The authors declare no conflict of interest.

Appendix A

Statistics Evaluation Metrics

R B = i = 1 N ( S i G i ) / i = 1 N ( G i ) × 100
C C = ( i = 1 N ( S i S ¯ ) ( G i G ¯ ) ) / ( i = 1 N ( S i S ¯ ) 2 i = 1 N ( G i G ¯ ) 2 )
R M S E = 1 N i = 1 N ( S i G i ) 2
where S and G represent LSPE and gauge, i means the sample number for evaluated variables like precipitation or SPI values.

Appendix B

Table A1. Dry/wet classification based on SPI values.
SPI ValueCategoryProbability (%)
>2Extremely wet2.3
1.5~1.99Severe wet4.4
1.0~1.49Moderately wet9.2
0~0.99Slightly wet34.1
−0.99~0Slightly dry34.1
−1~−1.49Moderately dry9.2
−1.5~−2Severe dry4.4
<−2Extremely dry2.3

Appendix C

Figure A1. (al) Comparison of SPI between gauge observations and LSPEs from 1992 to 1995. The blue points represent pairs of SPI values between Gauge and LSPEs, while the black and red lines represent equally 1:1 and linear regression lines.
Remotesensing 14 00828 g0a1

References

  1. IPCC. Managing the Risks of Extreme Events and Disasters to Advance Climate Change Adaptation; Field, C.B., Barros, V., Stocker, T.F., Qin, D., Dokken, D.J., Ebi, K.L., Mastrandrea, M.D., Mach, K.J., Plattner, G.-K., Allen, S.K., et al., Eds.; Cambridge University Press: Cambridge, UK, 2012; 582p. [Google Scholar]
  2. Field, C.B.; Barros, V.R.; Dokken, D.J.; Mach, K.J.; Mastrandrea, M.D.; Bilir, T.E.; Chatterjee, M.; Ebi, K.L.; Estrada, Y.O.; Genova, R.C. (Eds.) Climate Change 2014: Impacts, Adaptation, and Vulnerability. Part A: Global and Sectoral Aspects. Contribution of Working Group II to the Fifth Assessment Report of the Intergovernmental Panel on Climate Change; Cambridge University Press: Cambridge, UK, 2014; 1132p. [Google Scholar]
  3. Patrick, E. Drought Characteristics and Management in Central Asia and Turkey. In FAO Water Reports (FAO); Food and Agriculture Organization of the United Nations: Rome, Italy, 2017; 114p. [Google Scholar]
  4. Xu, H.J.; Wang, X.P.; Zhang, X.X. Decreased Vegetation Growth in Response to Summer Drought in Central Asia from 2000 to 2012. Int. J. Appl. Earth Obs. Geoinf. 2016, 52, 390–402. [Google Scholar] [CrossRef]
  5. Montaseri, M.; Amirataee, B. Comprehensive Stochastic Assessment of Meteorological Drought Indices. Int. J. Climatol. 2017, 37, 998–1013. [Google Scholar] [CrossRef]
  6. Kamali, B.; Abbaspour, K.C.; Lehmann, A.; Wehrli, B.; Yang, H. Identification of Spatiotemporal Patterns of Biophysical Droughts in Semi-Arid Region—A Case Study of the Karkheh River Basin in Iran. Hydrol. Earth Syst. Sci. 2015, 12, 5187–5217. [Google Scholar]
  7. Liu, X.; Xiufang, Z.; Yaozhong, P.; Shuangshuang, L.; Yanxu, L.; Yuqi, M. Agricultural Drought Monitoring: Progress, Challenges, and Prospects. J. Geogr. Sci. 2016, 26, 750–767. [Google Scholar] [CrossRef] [Green Version]
  8. McKee, T.B.; Doesken, N.J.; Kleist, J. The Relationship of Drought Frequency and Duration to Time Scales. In Proceedings of the Eighth Conference on Applied Climatology, Anaheim, CA, USA, 17–22 January 1993. [Google Scholar]
  9. Svoboda, M.; Hayes, M.; Wood, D. Standardized Precipitation Index User Guide. In Technical Report WMO—No. 1090; Hayes, M., Wood, D., Svoboda, M., Eds.; WMO: Geneva, Switzerland, 2012; 24p. [Google Scholar]
  10. Shi, L.; Feng, P.; Wang, B.; Li Liu, D.; Yu, Q. Quantifying Future Drought Change and Associated Uncertainty in Southeastern Australia with Multiple Potential Evapotranspiration Models. J. Hydrol. 2020, 590, 125394. [Google Scholar] [CrossRef]
  11. Kumar, K.; Krishna, K.; Kumar, R.; Rakhecha, P.R. Comparison of Penman and Thornthwaite Methods of Estimating Potential Evapotranspiration for Indian Conditions. Theor. Appl. Climatol. 1987, 38, 140–146. [Google Scholar] [CrossRef]
  12. Valipour, M. Temperature Analysis of Reference Evapotranspiration Models. Meteorol. Appl. 2015, 22, 385–394. [Google Scholar] [CrossRef]
  13. Damberg, L.; AghaKouchak, A. Global Trends and Patterns of Drought from Space. Theor. Appl. Climatol. 2014, 117, 441–448. [Google Scholar] [CrossRef]
  14. Thenkabail, P. Remote Sensing of Water Resources, Disasters, and Urban Studies; CRC Press: Boca Raton, FL, USA, 2015. [Google Scholar]
  15. Suliman, A.H.A.; Awchi, T.A.; Al-Mola, M.; Shahid, S. Evaluation of Remotely Sensed Precipitation Sources for Drought Assessment in Semi-Arid Iraq. Atmos. Res. 2020, 242, 105007. [Google Scholar] [CrossRef]
  16. Xu, Z.; Wu, W.; He, H.; Wu, H.; Zhou, J.; Zhang, Y.; Guo, X. Evaluating the Accuracy of Mswep V2.1 and Its Performance for Drought Monitoring over Mainland China. Atmos. Res. 2019, 226, 17–31. [Google Scholar] [CrossRef]
  17. AghaKouchak, A.; Farahmand, A.; Melton, F.S.; Teixeira, J.; Anderson, M.C.; Wardlow, B.D.; Hain, C.R. Remote Sensing of Drought: Progress, Challenges and Opportunities. Rev. Geophys. 2015, 53, 452–480. [Google Scholar] [CrossRef] [Green Version]
  18. Agutu, N.O.; Awange, J.L.; Zerihun, A.; Ndehedehe, C.E.; Kuhn, M.; Fukuda, Y. Assessing Multi-Satellite Remote Sensing, Reanalysis, and Land Surface Models’ Products in Characterizing Agricultural Drought in East Africa. Remote Sens. Environ. 2017, 194, 287–302. [Google Scholar] [CrossRef] [Green Version]
  19. Thavorntam, W.; Tantemsapya, N.; Armstrong, L. A Combination of Meteorological and Satellite-Based Drought Indices in a Better Drought Assessment and Forecasting in Northeast Thailand. Nat. Hazards 2015, 77, 1453–1474. [Google Scholar] [CrossRef]
  20. AghaKouchak, A.; Nakhjiri, N. A near Real-Time Satellite-Based Global Drought Climate Data Record. Environ. Res. Lett. 2012, 7, 044037. [Google Scholar] [CrossRef] [Green Version]
  21. Guo, H.; Chen, S.; Bao, A.; Hu, J.; Gebregiorgis, A.S.; Xianwu, X.; Zhang, X. Inter-Comparison of High-Resolution Satellite Precipitation Products over Central Asia. Remote Sens. 2015, 7, 7181–7211. [Google Scholar] [CrossRef] [Green Version]
  22. De Jesús, A.; Breña-Naranjo, J.A.; Pedrozo-Acuña, A.; Alcocer Yamanaka, V.H. The Use of Trmm 3b42 Product for Drought Monitoring in Mexico. Water 2016, 8, 325. [Google Scholar] [CrossRef]
  23. Naumann, G.; Barbosa, P.; Carrao, H.; Singleton, A.; Vogt, J. Monitoring Drought Conditions and Their Uncertainties in Africa Using Trmm Data. J. Appl. Meteorol. Climatol. 2012, 51, 1867–1874. [Google Scholar] [CrossRef] [Green Version]
  24. Yan, N.; Wu, B.; Chang, S.; Bao, X. Evaluation of Trmm Precipitation Product for Meteorological Drought Monitoring in Hai Basin. IOP Conf. Ser. Earth Environ. Sci. 2014, 17, 12093. [Google Scholar] [CrossRef] [Green Version]
  25. Zeng, H.W.; Li, L.J.; Li, J.Y. The Evaluation of Trmm Multisatellite Precipitation Analysis (Tmpa) in Drought Monitoring in the Lancang River Basin. J. Geogr. Sci. 2012, 22, 273–282. [Google Scholar] [CrossRef]
  26. Tan, M.; Tan, K.; Chua, V.; Chan, N. Evaluation of Trmm Product for Monitoring Drought in the Kelantan River Basin, Malaysia. Water 2017, 9, 57. [Google Scholar] [CrossRef] [Green Version]
  27. Gao, F.; Zhang, Y.; Ren, X.; Yao, Y.; Hao, Z.; Cai, W. Evaluation of Chirps and Its Application for Drought Monitoring over the Haihe River Basin, China. Nat. Hazards 2018, 92, 155–172. [Google Scholar] [CrossRef]
  28. Guo, H.; Bao, A.; Liu, T.; Ndayisaba, F.; He, D.; Kurban, A.; De Maeyer, P. Meteorological Drought Analysis in the Lower Mekong Basin Using Satellite-Based Long-Term Chirps Product. Sustainability 2017, 9, 901. [Google Scholar] [CrossRef] [Green Version]
  29. Oliveira-Júnior, J.F.; Silva Junior, C.A.; Teodoro, P.E.; Rossi, F.S.; Blanco, C.C.J.; Lima, M.; Gois, G.; Correira Filho, W.L.F.; Barros Santiago, D.; Santos Vanderley, M.H.G. Confronting Chirps Dataset and in Situ Stations in the Detection of Wet and Drought Conditions in the Brazilian Midwest. Int. J. Climatol. 2021, 41, 478–493. [Google Scholar] [CrossRef]
  30. Alijanian, M.; Rakhshandehroo, G.R.; Mishra, A.; Dehghani, M. Evaluation of Remotely Sensed Precipitation Estimates Using Persiann-Cdr and Mswep for Spatio-Temporal Drought Assessment over Iran. J. Hydrol. 2019, 579, 124189. [Google Scholar] [CrossRef]
  31. Guo, H.; Bao, A.; Liu, T.; Chen, S.; Ndayisaba, F. Evaluation of Persiann-Cdr for Meteorological Drought Monitoring over China. Remote Sens. 2016, 8, 379. [Google Scholar] [CrossRef] [Green Version]
  32. Santos, C.A.G.; Neto, R.M.B.; do Nascimento, T.V.M.; da Silva, R.M.; Mishra, M.; Frade, T.G. Geospatial Drought Severity Analysis Based on Persiann-Cdr-Estimated Rainfall Data for Odisha State in India (1983–2018). Sci. Total Environ. 2021, 750, 141258. [Google Scholar] [CrossRef]
  33. Bothe, O.; Fraedrich, K.; Zhu, X. Precipitation Climate of Central Asia and the Large-Scale Atmospheric Circulation. Theor. Appl. Climatol. 2012, 108, 345–354. [Google Scholar] [CrossRef]
  34. Mahmood, R.; ShuangLin, L.; Babar, K. Causes of Recurring Drought Patterns in Xinjiang, China. J. Arid. Land 2010, 2, 279–285. [Google Scholar]
  35. Li, Y.; Yao, N.; Sahin, S.; Appels, W.M. Spatiotemporal Variability of Four Precipitation-Based Drought Indices in Xinjiang, China. Theor. Appl. Climatol. 2016, 129, 1017–1034. [Google Scholar] [CrossRef]
  36. Guo, H.; Bao, A.; Ndayisaba, F.; Liu, T.; Jiapaer, G.; El-Tantawi, A.M.; De Maeyer, P. Space-Time Characterization of Drought Events and Their Impacts on Vegetation in Central Asia. J. Hydrol. 2018, 564, 165–178. [Google Scholar] [CrossRef]
  37. Guo, H.; Bao, A.; Liu, T.; Jiapaer, G.; Ndayisaba, F.; Jiang, L.; Kurban, A.; De Maeyer, P. Spatial and Temporal Characteristics of Droughts in Central Asia During 1966–2015. Sci. Total Environ. 2018, 624, 1523–1538. [Google Scholar] [CrossRef] [PubMed]
  38. Wu, Y.; Bake, B.; Zhang, J.; Rasulov, H. Spatio-Temporal Patterns of Drought in North Xinjiang, China, 1961–2012 Based on Meteorological Drought Index. J. Arid. Land 2015, 7, 527–543. [Google Scholar] [CrossRef] [Green Version]
  39. Beck, H.E.; Wood, E.F.; Pan, M.; Fisher, C.K.; Miralles, D.G.; van Dijk, A.I.J.M.; McVicar, T.R.; Adler, R.F. Mswep V2 Global 3-Hourly 0.1° Precipitation: Methodology and Quantitative Assessment. Bull. Am. Meteorol. Soc. 2019, 100, 473–500. [Google Scholar] [CrossRef] [Green Version]
  40. Ashouri, H.; Hsu, K.L.; Sorooshian, S.; Braithwaite, D.K.; Knapp, K.R.; Cecil, L.D.; Nelson, B.R.; Prat, O.P. Persiann-Cdr Daily Precipitation Climate Data Record from Multisatellite Observations for Hydrological and Climate Studies. Bull. Am. Meteorol. Soc. 2015, 96, 69–83. [Google Scholar] [CrossRef] [Green Version]
  41. Funk, C.; Peterson, P.; Landsfeld, M.; Pedreros, D.; Verdin, J.; Shukla, S.; Husak, G.; Rowland, J.; Harrison, L.; Hoell, A.; et al. The Climate Hazards Infrared Precipitation with Stations—A New Environmental Record for Monitoring Extremes. Sci. Data 2015, 2, 50066. [Google Scholar] [CrossRef] [Green Version]
  42. Shen, Y.; Xiong, A. Validation and Comparison of a New Gauge-Based Precipitation Analysis over Mainland China. Int. J. Climatol. 2016, 36, 252–265. [Google Scholar] [CrossRef]
  43. Shen, Y.; Xiong, A.Y.; Wang, Y.; Xie, P.P. Performance of High-Resolution Satellite Precipitation Products over China. J. Geophys. Res. Atmos. 2010, 115, D02114. [Google Scholar] [CrossRef]
  44. Beck, H.E.; van Dijk, A.I.J.M.; Levizzani, V.; Schellekens, J.; Miralles, D.G.; Martens, B.; de Roo, A. Mswep: 3-Hourly 0.25 Global Gridded Precipitation (1979–2015) by Merging Gauge, Satellite, and Reanalysis Data. Hydrol. Earth Syst. Sci. 2017, 21, 589–615. [Google Scholar] [CrossRef] [Green Version]
  45. Wang, R.; Chen, J.; Wang, X. Comparison of Imerg Level-3 and Tmpa 3b42v7 in Estimating Typhoon-Related Heavy Rain. Water 2017, 9, 276. [Google Scholar] [CrossRef] [Green Version]
  46. Cai, Y.; Jin, C.; Wang, A.; Guan, D.; Wu, J.; Yuan, F.; Xu, L. Comprehensive Precipitation Evaluation of Trmm 3b42 with Dense Rain Gauge Networks in a Mid-Latitude Basin, Northeast, China. Theor. Appl. Climatol. 2015, 126, 659–671. [Google Scholar] [CrossRef]
  47. Hofstra, N.; New, M.; McSweeney, C. The Influence of Interpolation and Station Network Density on the Distributions and Trends of Climate Variables in Gridded Daily Data. Clim. Dyn. 2012, 35, 841–858. [Google Scholar] [CrossRef]
  48. Mair, A.; Fares, A. Comparison of Rainfall Interpolation Methods in a Mountainous Region of a Tropical Island. J. Hydrol. Eng. 2011, 16, 371–383. [Google Scholar] [CrossRef]
  49. Pradhan, R.K.; Markonis, Y.; Vargas Godoy, M.R.; Villalba-Pradas, A.; Andreadis, K.M.; Nikolopoulos, E.I.; Papalexiou, S.M.; Rahim, A.; Tapiador, F.J.; Hanel, M. Review of Gpm Imerg Performance: A Global Perspective. Remote Sens. Environ. 2022, 268, 12754. [Google Scholar] [CrossRef]
  50. Edwards, D.C. Characteristics of 20th Century Drought in the United States at Multiple Time Scales; Air Force Institute of Technology: Wright-Patterson AFB, OH, USA, 1997. [Google Scholar]
  51. Santos, J.F.; Pulido-Calvo, I.; Portela, M.M. Spatial and Temporal Variability of Droughts in Portugal. Water Resour. Res. 2010, 46, W03503. [Google Scholar] [CrossRef] [Green Version]
  52. Belayneh, A.; Adamowski, J. Standard Precipitation Index Drought Forecasting Using Neural Networks, Wavelet Neural Networks, and Support Vector Regression. Appl. Comput. Intell. Soft Comput. 2012, 2012, 1–13. [Google Scholar] [CrossRef]
  53. Huang, S.Z.; Li, P.; Huang, Q.; Leng, G.Y.; Hou, B.B.; Ma, L. The Propagation from Meteorological to Hydrological Drought and Its Potential Influence Factors. J. Hydrol. 2017, 547, 184–195. [Google Scholar] [CrossRef]
  54. Mpelasoka, F.; Hennessy, K.; Jones, R.; Bates, B. Comparison of Suitable Drought Indices for Climate Change Impacts Assessment over Australia Towards Resource Management. Int. J. Climatol. 2008, 28, 1283–1292. [Google Scholar] [CrossRef]
  55. Yevjevich, V.M. An Objective Approach to Definition and Investigations of Continental Hydrologic Droughts; Hydrology Papers; Colorado State University: Fort Collins, CO, USA, 1967; Volume 23, No. 23. [Google Scholar]
  56. Wilks, D.S. Statistical Methods in the Atmospheric Sciences, 3rd ed.; Academic Press: Cambridge, MA, USA, 2011; Volume 100. [Google Scholar]
  57. Guo, H.; Bao, A.; Ndayisaba, F.; Liu, T.; Kurban, A.; De Maeyer, P. Systematical Evaluation of Satellite Precipitation Estimates over Central Asia Using an Improved Error-Component Procedure. J. Geophys. Res. Atmos. 2017, 122, 10906–10927. [Google Scholar] [CrossRef]
  58. Gosset, M.; Viarre, J.; Quantin, G.; Alcoba, M. Evaluation of Several Rainfall Products Used for Hydrological Applications over West Africa Using Two High-Resolution Gauge Networks. Q. J. R. Meteorol. Soc. 2013, 139, 923–940. [Google Scholar] [CrossRef]
  59. AghaKouchak, A.; Mehran, A. Extended Contingency Table: Performance Metrics for Satellite Observations and Climate Model Simulations. Water Resour. Res. 2013, 49, 7144–7149. [Google Scholar] [CrossRef] [Green Version]
  60. Sadeghi, M.; Nguyen, P.; Naeini, M.R.; Hsu, K.; Braithwaite, D.; Sorooshian, S. Persiann-Ccs-Cdr, a 3-Hourly 0.04° Global Precipitation Climate Data Record for Heavy Precipitation Studies. Sci. Data 2021, 8, 157. [Google Scholar] [CrossRef] [PubMed]
  61. Alijanian, M.; Rakhshandehroo, G.R.; Mishra, A.K.; Dehghani, M. Evaluation of Satellite Rainfall Climatology Using Cmorph, Persiann-Cdr, Persiann, Trmm, Mswep over Iran. Int. J. Climatol. 2017, 37, 4896–4914. [Google Scholar] [CrossRef]
  62. Brasil Neto, R.M.; Guimarães Santos, C.A.; da Costa Silva, J.F.C.B.; da Silva, R.M.; dos Santos, C.A.C.; Mishra, M. Evaluation of the Trmm Product for Monitoring Drought over Paraíba State, Northeastern Brazil: A Trend Analysis. Sci. Rep. 2021, 11, 1097. [Google Scholar] [CrossRef] [PubMed]
  63. Zhong, R.; Chen, X.; Lai, C.; Wang, Z.; Lian, Y.; Yu, H.; Wu, X. Drought Monitoring Utility of Satellite-Based Precipitation Products across Mainland China. J. Hydrol. 2019, 568, 343–359. [Google Scholar] [CrossRef]
  64. Yao, J.; Tuoliewubieke, D.; Chen, J.; Huo, W.; Hu, W. Identification of Drought Events and Correlations with Large-Scale Ocean-Atmospheric Patterns of Variability: A Case Study in Xinjiang, China. Atmosphere 2019, 10, 94. [Google Scholar] [CrossRef] [Green Version]
  65. Yu, M.; Li, Q.; Hayes, M.J.; Svoboda, M.D.; Heim, R.R. Are Droughts Becoming More Frequent or Severe in China Based on the Standardized Precipitation Evapotranspiration Index: 1951–2010? Int. J. Climatol. 2014, 34, 545–558. [Google Scholar] [CrossRef]
  66. Yao, J.; Zhao, Y.; Yu, X. Spatial-Temporal Variation and Impacts of Drought in Xinjiang (Northwest China) During 1961–2015. PeerJ 2018, 6, e4926. [Google Scholar] [CrossRef] [Green Version]
  67. Lei, T.; Wu, J.; Li, X.; Geng, G.; Shao, C.; Zhou, H.; Wang, Q.; Liu, L. A New Framework for Evaluating the Impacts of Drought on Net Primary Productivity of Grassland. Sci. Total Environ. 2015, 536, 161–172. [Google Scholar] [CrossRef]
  68. Ayantobo, O.O.; Li, Y.; Song, S.; Yao, N. Spatial Comparability of Drought Characteristics and Related Return Periods in Mainland China over 1961–2013. J. Hydrol. 2017, 550, 549–567. [Google Scholar] [CrossRef]
  69. Beguería, S.; Vicente-Serrano, S.M.; Reig, F.; Latorre, B. Standardized Precipitation Evapotranspiration Index (Spei) Revisited: Parameter Fitting, Evapotranspiration Models, Tools, Datasets and Drought Monitoring. Int. J. Climatol. 2014, 34, 3001–3023. [Google Scholar] [CrossRef] [Green Version]
  70. Vicente-Serrano, S.M.; Begueria, S.; Lopez-Moreno, J.I. A Multiscalar Drought Index Sensitive to Global Warming: The Standardized Precipitation Evapotranspiration Index. J. Clim. 2010, 23, 696–718. [Google Scholar] [CrossRef] [Green Version]
  71. Palmer, W.C. Meteorological Drought; U.S. Department of Commerce, Weather Bureau: Washington, DC, USA, 1965; Volume 30.
  72. Svoboda, M.; Fuchs, B. Handbook of Drought Indicators and Indices; World Meteorological Organization: Geneva, Switzerland, 2016; pp. 1–44. [Google Scholar]
  73. Bachmair, S.; Stahl, K.; Collins, K.; Hannaford, J.; Acreman, M.; Svoboda, M.; Knutson, C.; Helm Smith, K.; Wall, N.; Fuchs, B.; et al. Drought Indicators Revisited: The Need for a Wider Consideration of Environment and Society. Wiley Interdiscip. Rev. Water 2016, 3, 516–536. [Google Scholar] [CrossRef] [Green Version]
  74. Pedro-Monzonís, M.; Solera, A.; Ferrer, J.; Estrela, T.; Paredes-Arquiola, J. A Review of Water Scarcity and Drought Indexes in Water Resources Planning and Management. J. Hydrol. 2015, 527, 482–493. [Google Scholar] [CrossRef] [Green Version]
  75. Hao, Z.C.; Singh, V.P. Drought Characterization from a Multivariate Perspective: A Review. J. Hydrol. 2015, 527, 668–678. [Google Scholar] [CrossRef]
  76. Ashraf, M.; Routray, J.K. Spatio-Temporal Characteristics of Precipitation and Drought in Balochistan Province, Pakistan. Nat. Hazards 2015, 77, 229–254. [Google Scholar] [CrossRef]
  77. Ukkola, A.; De Kauwe, M.G.; Roderick, M.L.; Abramowitz, G.; Pitman, A.J. Robust Future Changes in Meteorological Drought in Cmip6 Projections Despite Uncertainty in Precipitation. Geophys. Res. Lett. 2020, 47, e2020GL087820. [Google Scholar] [CrossRef]
Figure 1. Topographic features and locations of weather stations in northwestern China.
Remotesensing 14 00828 g001
Figure 2. Definition of drought event and illustration of drought characteristics based on run theory.
Remotesensing 14 00828 g002
Figure 3. (ac) Spatial pattern of multiyear monthly mean and the corresponding scatter plots for gauge and three satellite-based precipitation products; (d) Taylor diagram based on correlation, standard deviation, and RMSE of multiyear monthly mean precipitation between LSPEs and gauges. The blue circles represent pairs of monthly precipitation values between Gauge and LSPEs, while the black and red lines represent equally 1:1 and linear regression lines.
Remotesensing 14 00828 g003
Figure 4. Spatial statistics of 31-year mean precipitation ranging from 1983 to 2013 derived from (a,b) PERSIANN-CDR, (c,d) CHIRPS, and (e,f) MSWEP over northwestern China.
Remotesensing 14 00828 g004
Figure 5. (al) Spatial distribution of CC between satellite products (i.e., PERSIANN_CDR, CHIRPS, and MSWEP) and gauge observations for SPI in four timescales.
Remotesensing 14 00828 g005
Figure 6. (al) Spatial distribution of RMSE between satellite products (i.e., PERSIANN_CDR, CHIRPS, and MSWEP) and gauge observations for SPI in four timescales.
Remotesensing 14 00828 g006
Figure 7. Temporal evolution of SPIs for LSPEs (i.e., PERSIANN-CDR, CHIRPS, MSWEP) and ground-based gauges. (a) SPI1; (b) SPI3; (c) SPI6 and (d) SPI12.
Remotesensing 14 00828 g007
Figure 8. Spatial pattern of categorical indexes (ac) POD, (df) FAR, (gi) MISS.
Remotesensing 14 00828 g008
Figure 9. Spatial distribution of drought characteristic difference between LSPEs and gauge for (ac) MDD, (df) MDS, (gi) MDI and (jl) MDP.
Remotesensing 14 00828 g009
Figure 10. (al) Spatial patterns of SPI from the gauge and three satellite-based precipitation products for the peak time of four selected drought events. The outside and inside concentric pie charts show the percentage of stations and grids under different dry intensities, respectively.
Remotesensing 14 00828 g010
Table 1. Summary of three long-term satellite-based precipitation products used in the study.
DatasetData RangeHighest ResolutionCoverageReference
PERSIANN-CDR V1R11983–current0.25°-monthly60° S–60° N[40]
CHIRPS2.01983–current0.05°-daily60° S–60° N[41]
MSWEP2.81979–current0.1°-3 hourly90° S–90° N[39]
Table 2. Statistics between domain-averaged SPI between LSPEs and gauges from 1983 to 2013.
ScaleNameWet Months (SPI > 0)Dry Months (SPI < 0)
RB (%)CCRMSERB (%)CCRMSE
SPI1PERSIANN-CDR16.720.860.2066.340.810.31
CHIRPS12.050.700.2962.960.630.34
MSWEP−3.140.810.2037.310.890.20
SPI3PERSIANN-CDR23.870.850.2242.210.840.29
CHIRPS17.980.490.3421.070.740.24
MSWEP−0.100.660.2617.930.890.16
SPI6PERSIANN-CDR24.270.820.2233.990.840.27
CHIRPS16.150.540.3112.660.670.25
MSWEP0.630.510.3112.970.880.16
SPI12PERSIANN-CDR21.410.750.2027.780.890.24
CHIRPS2.550.640.2319.780.860.20
MSWEP−1.490.300.3811.690.890.17
Table 3. Features of selected drought events. Drought characteristics based on the gauge are highlighted in bold font. The overestimated values were marked in red color while underestimated values were marked in blue color.
Event
Index
ProductStart Time–End Time
(yyyymm–yyyymm)
Peak Time
(yyyymm)
DD
(Months)
DSDIDP
DE1Gauge198412–1986111985092411.880.611.28
PERSIANN-CDR198407–1986111986022921.940.761.61
CHIRPS198408–1986111986022813.790.541.35
MSWEP198412–1986111985092414.360.601.35
DE2Gauge199105–19910719910731.830.610.66
PERSIANN-CDR199104–19910719910542.490.620.94
CHIRPS199105–19910719910632.190.730.88
MSWEP199104–19910719910641.990.500.67
DE3Gauge199701–199712199711128.030.671.24
PERSIANN-CDR199701–1998021997111410.840.771.90
CHIRPS199701–199712199711129.220.771.21
MSWEP199701–199712199711129.710.811.50
DE4Gauge200606–200703200610103.430.340.86
PERSIANN-CDR200605–200702200610103.250.330.77
CHIRPS200604–200704200702135.330.410.80
MSWEP200605–200703200610113.610.320.84
Publisher’s Note: MDPI stays neutral with regard to jurisdictional claims in published maps and institutional affiliations.

