
Estimating Reservoir Release Using Multi-Source Satellite Datasets and Hydrological Modeling Techniques

 , , , ,
  , , ,
, , ,
Abstract
:1. Introduction
2. Materials
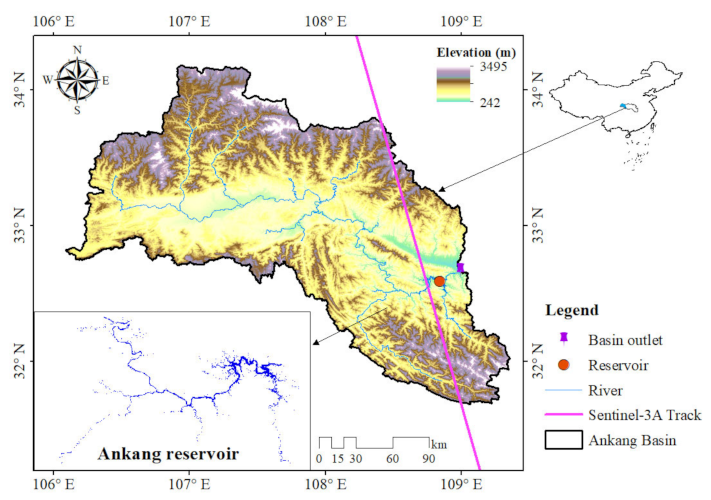
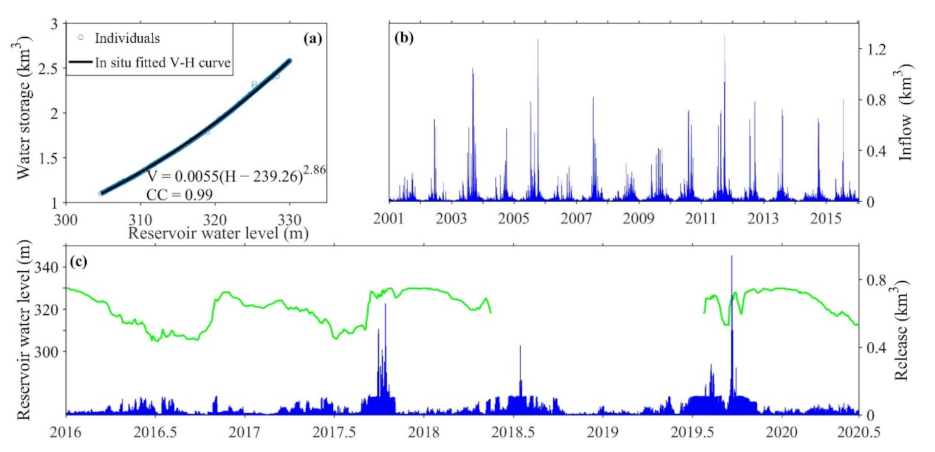
2.1. Study Area
2.2. Satellite Radar Altimetry
2.3. Synthetic Aperture Radar Imagery
2.4. Model Input Forcings and Other Validated Datasets
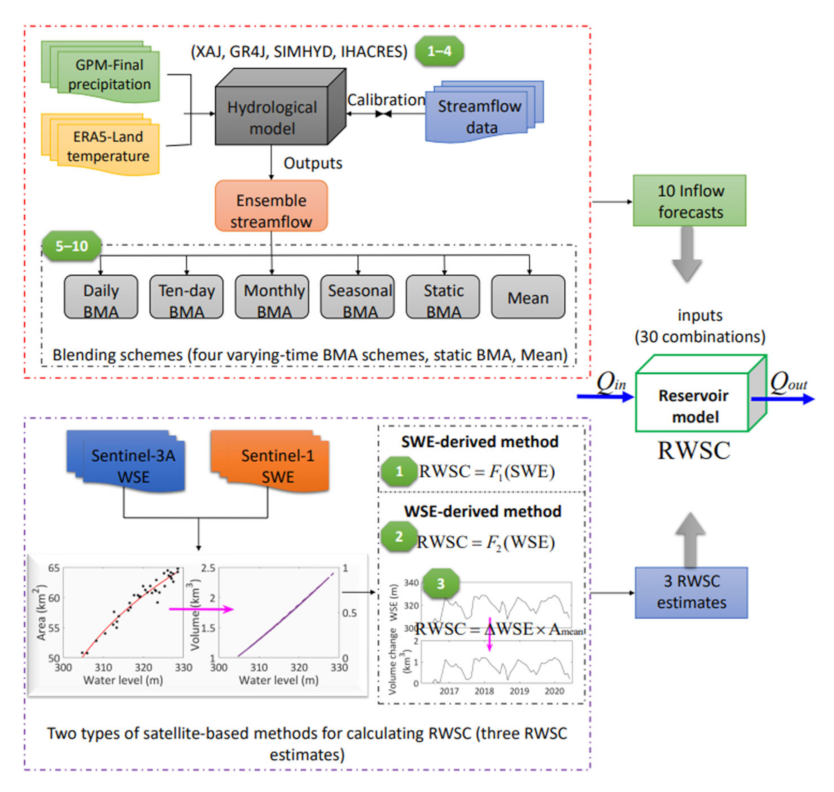
3. Methodology
3.1. Hydrological Modeling Techniques
3.2. Satellite-Based RWSC Estimates
3.3. A Simple Reservoir Model
4. Results
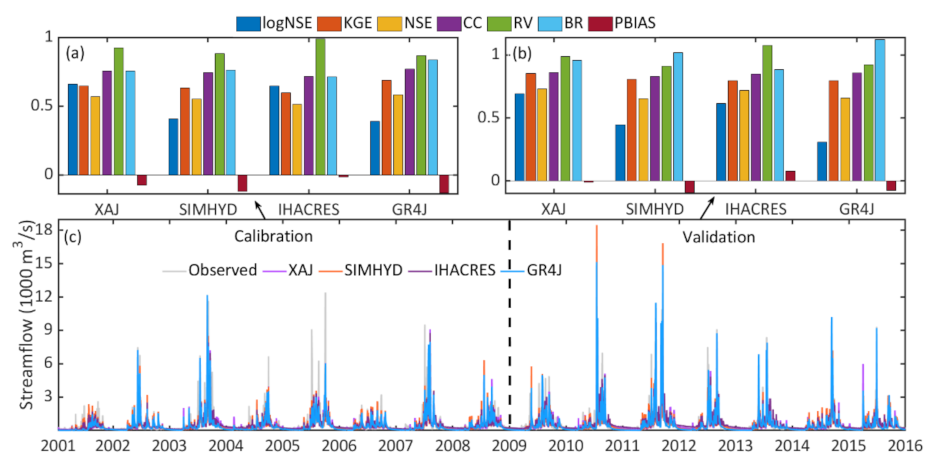
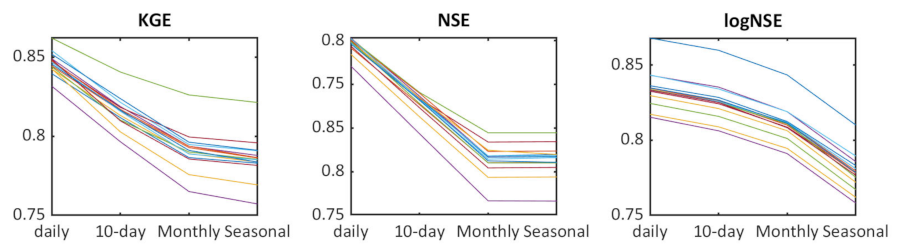
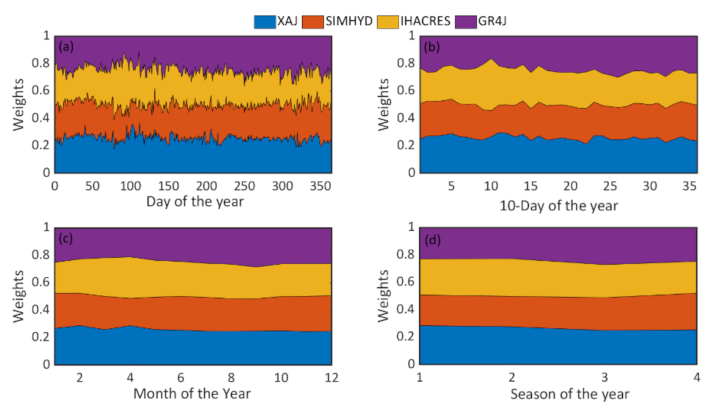
4.1. Inflow Simulations
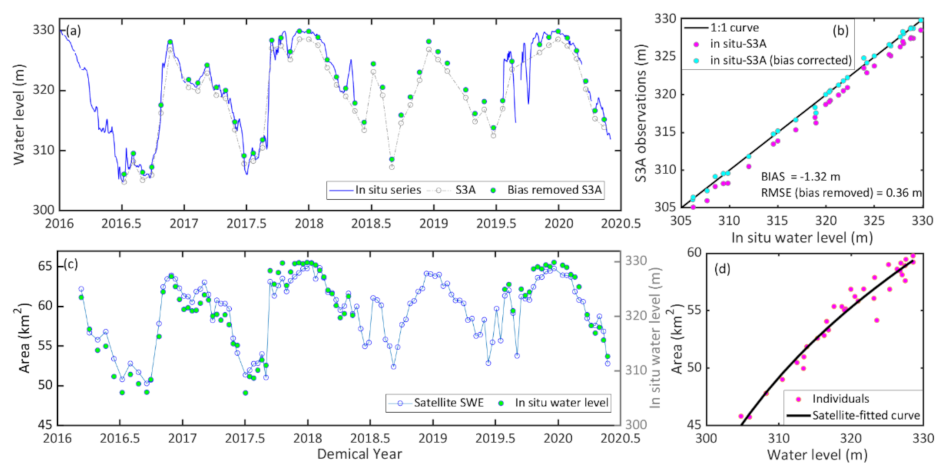
4.2. RWSC Estimates
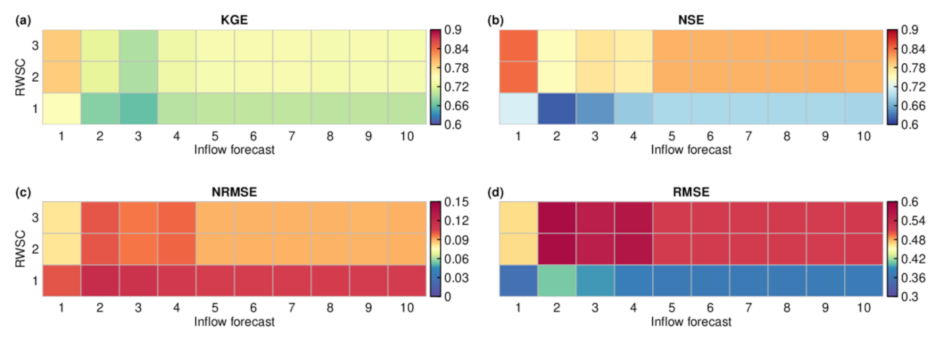
4.3. Reservoir Release Estimates
5. Discussion
6. Conclusions
Author Contributions
Funding
Institutional Review Board Statement
Informed Consent Statement
Data Availability Statement
Conflicts of Interest
Appendix A

References
- Intralawan, A.; Wood, D.; Frankel, R.; Costanza, R.; Kubiszewski, I. Tradeoff analysis between electricity generation and ecosystem services in the lower Mekong Basin. Ecosyst. Serv. 2018, 30, 27–35. [Google Scholar] [CrossRef]
- Zhong, R.; Zhao, T.; Chen, X. Hydrological model calibration for dammed basins using satellite altimetry information. Water Resour. Res. 2020, 56, e2020WR027442. [Google Scholar] [CrossRef]
- Gutenson, J.L.; Tavakoly, A.A.; Wahl, M.D.; Follum, M.L. Comparison of generalized non-data-driven lake and reservoir routing models for global-scale hydrologic forecasting of reservoir outflow at diurnal time steps. Hydrol. Earth Syst. Sci. 2020, 24, 2711–2729. [Google Scholar] [CrossRef]
- Lehner, B.; Liermann, C.R.; Revenga, C.; Vörösmarty, C.; Fekete, B.; Crouzet, P.; Döll, P.; Endejan, M.; Frenken, K.; Magome, J.; et al. High-resolution mapping of the world’s reservoirs and dams for sustainable river-flow management. Front. Ecol. Environ. 2011, 9, 494–502. [Google Scholar] [CrossRef] [Green Version]
- Cooper, A.R.; Infante, D.M.; Daniel, W.M.; Wehrly, K.E.; Wang, L.; Brenden, T.O. Assessment of dam effects on streams and fish assemblages of the conterminous USA. Sci. Total Environ. 2017, 586, 879–889. [Google Scholar] [CrossRef] [PubMed]
- Li, R.; Xiong, L.; Xiong, B.; Li, Y.; Xu, Q.; Cheng, L.; Xu, C.-Y. Investigating the downstream sediment load change by an index coupling effective rainfall information with reservoir sediment trapping capacity. J. Hydrol. 2020, 590, 125200. [Google Scholar] [CrossRef]
- Stone, R. Dam-building threatens Mekong fisheries. Science 2016, 354, 1084–1085. [Google Scholar] [CrossRef] [PubMed]
- Zarfl, C.; Lumsdon, A.E.; Berlekamp, J.; Tydecks, L.; Tockner, K. A global boom in hydropower dam construction. Aquat. Sci. 2014, 77, 161–170. [Google Scholar] [CrossRef]
- Liu, K.; Song, C.; Wang, J.; Ke, L.; Zhu, Y.; Zhu, J.; Ma, R.; Luo, Z. Remote sensing-based modeling of the bathymetry and water storage for channel-type reservoirs worldwide. Water Resour. Res. 2020, 56, e2020WR027147. [Google Scholar] [CrossRef]
- Tiwari, A.D.; Mishra, V. Prediction of reservoir storage anomalies in India. J. Geophy. Res. Atmos. 2019, 124, 3822–3838. [Google Scholar] [CrossRef]
- Mulligan, M.; van Soesbergen, A.; Sáenz, L. GOODD, a global dataset of more than 38,000 georeferenced dams. Sci. Data 2020, 7, 31. [Google Scholar] [CrossRef] [PubMed] [Green Version]
- Plengsaeng, B.; Wehn, U.; van der Zaag, P. Data-sharing bottlenecks in transboundary integrated water resources management: A case study of the Mekong River Commission’s procedures for data sharing in the Thai context. Water Int. 2014, 39, 933–951. [Google Scholar] [CrossRef] [Green Version]
- Ashoori, N.; Dzombak, D.A.; Small, M.J. Identifying water price and population criteria for meeting future urban water demand targets. J. Hydrol. 2017, 555, 547–556. [Google Scholar] [CrossRef]
- Duan, Z.; Bastiaanssen, W.G.M. Estimating water volume variations in lakes and reservoirs from four operational satellite altimetry databases and satellite imagery data. Remote Sens. Environ. 2013, 134, 403–416. [Google Scholar] [CrossRef]
- Gao, H.; Birkett, C.; Lettenmaier, D.P. Global monitoring of large reservoir storage from satellite remote sensing. Water Resour. Res. 2012, 48, W09504. [Google Scholar] [CrossRef] [Green Version]
- Boergens, E.; Buhl, S.; Dettmering, D.; Klüppelberg, C.; Seitz, F. Combination of multi-mission altimetry data along the Mekong River with spatio-temporal kriging. J. Geod. 2017, 91, 519–534. [Google Scholar] [CrossRef] [Green Version]
- Chen, J.; Dowman, I.; Li, S.; Li, Z.; Madden, M.; Mills, J.; Paparoditis, N.; Rottensteiner, F.; Sester, M.; Toth, C.; et al. Information from imagery: ISPRS scientific vision and research agenda. ISPRS J. Photogramm. Remote Sens. 2016, 115, 3–21. [Google Scholar] [CrossRef] [Green Version]
- Li, X.; Long, D.; Huang, Q.; Han, P.; Zhao, F.; Wada, Y. High-temporal-resolution water level and storage change data sets for lakes on the Tibetan Plateau during 2000-2017 using multiple altimetric missions and Landsat-derived lake shoreline positions. Earth Syst. Sci. Data 2019, 11, 1603–1627. [Google Scholar] [CrossRef] [Green Version]
- Donlon, C.; Berruti, B.; Buongiorno, A.; Ferreira, M.-H.; Féménias, P.; Frerick, J.; Goryl, P.; Klein, U.; Laur, H.; Mavrocordatos, C.; et al. The Global Monitoring for Environment and Security (GMES) Sentinel-3 mission. Remote Sens. Environ. 2012, 120, 37–57. [Google Scholar] [CrossRef]
- Song, C.; Huang, B.; Ke, L. Modeling and analysis of lake water storage changes on the Tibetan Plateau using multi-mission satellite data. Remote Sens. Environ. 2013, 135, 25–35. [Google Scholar] [CrossRef]
- Wingham, D.J.; Francis, C.R.; Baker, S.; Bouzinac, C.; Brockley, D.; Cullen, R.; de Chateau-Thierry, P.; Laxon, S.W.; Mallow, U.; Mavrocordatos, C.; et al. CryoSat: A mission to determine the fluctuations in Earth’s land and marine ice fields. Adv. Space Res. 2006, 37, 841–871. [Google Scholar] [CrossRef]
- Goumehei, E.; Tolpekin, V.; Stein, A.; Yan, W. Surface water body detection in polarimetric SAR data using contextual complex wishart classification. Water Resour. Res. 2019, 55, 7047–7059. [Google Scholar] [CrossRef] [Green Version]
- Weekley, D.; Li, X. Tracking multidecadal lake water dynamics with Landsat imagery and topography/bathymetry. Water Resour. Res. 2019, 55, 8350–8367. [Google Scholar] [CrossRef]
- Showstack, R. Sentinel satellites initiate new era in earth observation. Eos Trans. Am. Geophys. Union 2014, 95, 239–240. [Google Scholar] [CrossRef]
- Pekel, J.-F.; Cottam, A.; Gorelick, N.; Belward, A.S. High-resolution mapping of global surface water and its long-term changes. Nature 2016, 540, 418–422. [Google Scholar] [CrossRef]
- Pickens, A.H.; Hansen, M.C.; Hancher, M.; Stehman, S.V.; Tyukavina, A.; Potapov, P.; Marroquin, B.; Sherani, Z. Mapping and sampling to characterize global inland water dynamics from 1999 to 2018 with full Landsat time-series. Remote Sens. Environ. 2020, 243, 111792. [Google Scholar] [CrossRef]
- Avisse, N.; Tilmant, A.; Müller, M.F.; Zhang, H. Monitoring small reservoirs’ storage with satellite remote sensing in inaccessible areas. Hydrol. Earth Syst. Sci. 2017, 21, 6445–6459. [Google Scholar] [CrossRef] [Green Version]
- Busker, T.; de Roo, A.; Gelati, E.; Schwatke, C.; Adamovic, M.; Bisselink, B.; Pekel, J.-F.; Cottam, A. A global lake and reservoir volume analysis using a surface water dataset and satellite altimetry. Hydrol. Earth Syst. Sci. 2019, 23, 669–690. [Google Scholar] [CrossRef] [Green Version]
- Bonnema, M.; Sikder, S.; Miao, Y.; Chen, X.; Hossain, F.; Pervin, I.A.; Mahbubur Rahman, S.M.; Lee, H. Understanding satellite-based monthly-to-seasonal reservoir outflow estimation as a function of hydrologic controls. Water Resour. Res. 2016, 52, 4095–4115. [Google Scholar] [CrossRef] [Green Version]
- Huang, Q.; Long, D.; Du, M.; Han, Z.; Han, P. Daily continuous river discharge estimation for ungauged basins using a hydrologic model calibrated by satellite altimetry: Implications for the SWOT mission. Water Resour. Res. 2020, 56, e2020WR027309. [Google Scholar] [CrossRef]
- Gao, H. Satellite remote sensing of large lakes and reservoirs: From elevation and area to storage. Wiley Interdiscip. Rev. Water 2015, 2, 147–157. [Google Scholar] [CrossRef]
- Van Bemmelen, C.W.T.; Mann, M.; de Ridder, M.P.; Rutten, M.M.; van de Giesen, N.C. Determining water reservoir characteristics with global elevation data. Geophys. Res. Lett. 2016, 43, 11–278. [Google Scholar] [CrossRef] [Green Version]
- Han, Z.; Long, D.; Huang, Q.; Li, X.; Zhao, F.; Wang, J. Improving reservoir outflow estimation for ungauged basins using satellite observations and a hydrological model. Water Resour. Res. 2020, 56, e2020WR027590. [Google Scholar] [CrossRef]
- Eldardiry, H.; Hossain, F. Understanding reservoir operating rules in the transboundary nile river basin using macroscale hydrologic modeling with satellite measurements. J. Hydrometor. 2019, 20, 2253–2269. [Google Scholar] [CrossRef]
- Swenson, S.; Wahr, J. Monitoring the water balance of Lake Victoria, East Africa, from space. J. Hydrol. 2009, 370, 163–176. [Google Scholar] [CrossRef]
- Muala, E.; Mohamed, Y.A.; Duan, Z.; van der Zaag, P. Estimation of reservoir discharges from lake nasser and roseires reservoir in the Nile Basin using satellite altimetry and imagery data. Remote Sens. 2014, 6, 7522–7545. [Google Scholar] [CrossRef] [Green Version]
- Bonnema, M.; Hossain, F. Inferring reservoir operating patterns across the Mekong Basin using only space observations. Water Resour. Res. 2017, 53, 3791–3810. [Google Scholar] [CrossRef]
- Madadgar, S.; Moradkhani, H.; Garen, D. Towards improved post-processing of hydrologic forecast ensembles. Hydrol. Process. 2014, 28, 104–122. [Google Scholar] [CrossRef]
- Pagano, T.C.; Shrestha, D.L.; Wang, Q.J.; Robertson, D.; Hapuarachchi, P. Ensemble dressing for hydrological applications. Hydrol. Process. 2013, 27, 106–116. [Google Scholar] [CrossRef]
- Wang, L.; Huang, C.C.; Pang, J.; Zha, X.; Zhou, Y. Paleofloods recorded by slackwater deposits in the upper reaches of the Hanjiang River valley, middle Yangtze River basin, China. J. Hydrol. 2014, 519, 1249–1256. [Google Scholar] [CrossRef]
- Yang, G.; Guo, S.; Liu, P.; Li, L.; Xu, C.-Y. Multiobjective reservoir operating rules based on cascade reservoir input variables selection method. Water Resour. Res. 2017, 53, 3446–3463. [Google Scholar] [CrossRef]
- Liu, D.; Guo, S.; Shao, Q.; Liu, P.; Xiong, L.; Wang, L.; Hong, X.; Xu, Y.; Wang, Z. Assessing the effects of adaptation measures on optimal water resources allocation under varied water availability conditions. J. Hydrol. 2018, 556, 759–774. [Google Scholar] [CrossRef]
- Dinardo, S.; Fenoglio-Marc, L.; Buchhaupt, C.; Becker, M.; Scharroo, R.; Fernandes, M.J.; Benveniste, J. Coastal SAR and PLRM altimetry in German Bight and West Baltic Sea. Adv. Space Res. 2018, 62, 1371–1404. [Google Scholar] [CrossRef]
- Jiang, L.; Nielsen, K.; Andersen, O.B.; Bauer-Gottwein, P. CryoSat-2 radar altimetry for monitoring freshwater resources of China. Remote Sens. Environ. 2017, 200, 125–139. [Google Scholar] [CrossRef] [Green Version]
- Nielsen, N.; Stenseng, L.; Andersen, O.B.; Villadsen, H.; Knudsen, P. Validation of Cryosat-2 SAR mode based lake levels. Remote Sens. Environ. 2015, 171, 162–170. [Google Scholar] [CrossRef] [Green Version]
- Druce, D.; Tong, X.; Lei, X.; Guo, T.; Kittel, C.M.M.; Grogan, K.; Tottrup, C. An optical and SAR based fusion approach for mapping surface water dynamics over mainland China. Remote Sens. 2021, 13, 1663. [Google Scholar] [CrossRef]
- Li, H.; Zhang, Y. Regionalising rainfall-runoff modelling for predicting daily runoff: Comparing gridded spatial proximity and gridded integrated similarity approaches against their lumped counterparts. J. Hydrol. 2017, 550, 279–293. [Google Scholar] [CrossRef]
- Yang, X.; Magnusson, J.; Huang, S.; Beldring, S.; Xu, C.-Y. Dependence of regionalization methods on the complexity of hydrological models in multiple climatic regions. J. Hydrol. 2020, 582, 124357. [Google Scholar] [CrossRef]
- Perrin, C.; Michel, C.; Andréassian, V. Improvement of a parsimonious model for streamflow simulation. J. Hydrol. 2003, 279, 275–289. [Google Scholar] [CrossRef]
- Jakeman, A.J.; Littlewood, I.G.; Whitehead, P.G. Computation of the instantaneous unit hydrograph and identifiable component flows with application to two small upland catchments. J. Hydrol. 1990, 117, 275–300. [Google Scholar] [CrossRef]
- Chiew, F.H.S.; Peel, M.C.; Western, A.W.; Singh, V.P.; Frevert, D. Application and testing of the simple rainfall-runoff model SIMHYD. In Mathematical Models of Small Watershed Hydrology and Applications; Water Resources PublicationsHighlands: Ranch, CO, USA, 2002; pp. 335–367. [Google Scholar]
- Zhao, R.J. Xinanjiang model applied in China. J. Hydrol. 1992, 135, 371–381. [Google Scholar] [CrossRef]
- Duan, Q.; Ajami, N.K.; Gao, X.; Sorooshian, S. Multi-models ensemble hydrologic prediction using Bayesian model averaging. Adv. Water Resour. 2007, 30, 1371–1386. [Google Scholar] [CrossRef] [Green Version]
- Oudin, L.; Hervieu, F.; Michel, C.; Perrin, C.; Andréassian, V.; Anctil, F.; Loumagne, C. Which potential evapotranspiration input for a lumped rainfall-runoff model? Part 2-Towards a simple and efficient potential evapotranspiration model for rainfall-runoff modelling. J. Hydrol. 2005, 303, 290–306. [Google Scholar] [CrossRef]
- Gupta, H.V.; Kling, H.; Yilmaz, K.K.; Martinez, G.F. Decomposition of the mean squared error and NSE performance criteria: Implications for improving hydrological modelling. J. Hydrol. 2009, 377, 80–91. [Google Scholar] [CrossRef] [Green Version]
- Varma, S.; Simon, R. Bias in error estimation when using cross-validation for model selection. BMC Bioinform. 2006, 7, 91–98. [Google Scholar] [CrossRef] [Green Version]
- Liu, K.; Tseng, K.; Shum, K.C.; Liu, C.; Kuo, C.; Liu, G.; Jia, Y.; Shang, K. Assessment of the impact of reservoirs in the Upper Mekong River using satellite radar altimetry and remote sensing imageries. Remote Sens. 2016, 8, 367. [Google Scholar] [CrossRef] [Green Version]
- Bonnema, M.; Hossain, F. Assessing the potential of the Surface Water and Ocean Topograpghy Mission for reservoir monitoring in the Mekong River basin. Water Resour. Res. 2019, 55, 444–461. [Google Scholar] [CrossRef]
- Villadsen, H.; Deng, X.; Andersen, O.B.; Stenseng, L.; Nielsen, K.; Knudsen, P. Improved inland water levels from SAR altimetry using novel empirical and physical retrackers. J. Hydrol. 2016, 537, 234–247. [Google Scholar] [CrossRef] [Green Version]
- Biancamaria, S.; Lettenmaier, D.P.; Pavelsky, T.M. The SWOT mission and its capabilities for land hydrology. Surv. Geophys. 2016, 37, 307–337. [Google Scholar] [CrossRef] [Green Version]
- Alazard, M.; Leduc, C.; Travi, Y.; Boulet, G.; Salem, A.B. Estimating evaporation in semi-arid areas facing data scarcity: Example of the El Haouareb dam (Merguellil catchment, Central Tunisia). J. Hydrol. Reg. Stud. 2015, 3, 265–284. [Google Scholar] [CrossRef] [Green Version]
- Friedrich, K.; Grossman, R.L.; Huntington, J.; Blanken, P.D.; Lenters, J.; Holman, K.D.; Gochis, D.; Livneh, B.; Prairie, J.; Skeie, E.; et al. Reservoir evaporation in the Western United States: Current science, challenges, and future needs. Bull. Am. Meteor. Soc. 2018, 99, 167–187. [Google Scholar] [CrossRef]
- Liu, G.; Schwartz, F.W.; Tseng, K.-H.; Shum, C.K. Discharge and water-depth estimates for ungauged rivers: Combining hydrologic, hydraulic and inverse modeling with stage and water-area measurements from satellites. Water Resour. Res. 2015, 51, 6017–6035. [Google Scholar] [CrossRef]
- Li, Y.; Grimaldi, S.; Pauwels, V.R.N.; Walker, J.P. Hydrologic model calibration using remotely sensed soil moisture and discharge measurements: The impact on predictions at gauged and ungauged locations. J. Hydrol. 2018, 557, 897–909. [Google Scholar] [CrossRef]
- López, P.L.; Sutanudjaja, E.H.; Schellekens, J.; Sterk, G.; Bierkens, M.F.P. Calibration of a large-scale hydrological model using satellite-based soil moisture and evapotranspiration products. Hydrol. Earth Syst. Sci. 2017, 21, 3125–3144. [Google Scholar] [CrossRef] [Green Version]
- Kittel, C.M.M.; Nielsen, K.; Tøttrup, C.; Bauer-Gottwein, P. Informing a hydrological model of the Ogooué with multi-mission remote sensing data. Hydrol. Earth Syst. Sci. 2018, 22, 1453–1472. [Google Scholar] [CrossRef] [Green Version]


| ID | Name | Units | Description |
|---|---|---|---|
| 1 | Main function | - | Flood control and hydropower generation |
| 2 | Regulatory index | - | 38% (the ratio of water capacity to mean annual inflow) |
| 3 | Operational period | Year | 1996–present |
| 4 | Installed capacity | MW | 850 |
| 5 | Normal water level | m | 330 |
| 6 | Inactive water level | m | 305 |
| 7 | Critical water level | m | 325 |
| 8 | Reservoir extent area | km2 | 70 (at normal water level) |
| 9 | Water capacity | km3 | 2.58 (at normal water level) |
| Metric | Abbreviation | Expression | Perfect Score |
|---|---|---|---|
| Kling-Gupta Efficiency | KGE | 1 | |
| Correlation coefficient | CC | 1 | |
| Bias Ratio | BR | 1 | |
| Relative Variability | RV | 1 | |
| Nash-Sutcliffe Efficiency | NSE | 1 | |
| Logarithmic Nash-Sutcliffe Efficiency | logNSE | 1 | |
| Percent bias | PBIAS | 0 | |
| Root-mean-square error | RMSE | 0 | |
| Normalized root-mean-square error | NRMSE | 0 |
| ID | RMSE | NRMSE | BIAS | CC |
|---|---|---|---|---|
| WSE | 0.36 (m) | - | −1.32 (m) | 1 |
| SWE | - | - | - | 0.97 |
| RWSC1 | 0.099 (km3) | 0.064 | −0.003 (km3) | 0.91 |
| RWSC2 | 0.026 | 0.019 | 0.004 | 1 |
| RWSC3 | 0.030 | 0.023 | 0.006 | 1 |
Publisher’s Note: MDPI stays neutral with regard to jurisdictional claims in published maps and institutional affiliations. |
© 2022 by the authors. Licensee MDPI, Basel, Switzerland. This article is an open access article distributed under the terms and conditions of the Creative Commons Attribution (CC BY) license (https://creativecommons.org/licenses/by/4.0/).
Share and Cite
Shen, Y.; Liu, D.; Jiang, L.; Tøttrup, C.; Druce, D.; Yin, J.; Nielsen, K.; Bauer-Gottwein, P.; Wang, J.; Zhao, X. Estimating Reservoir Release Using Multi-Source Satellite Datasets and Hydrological Modeling Techniques. Remote Sens. 2022, 14, 815. https://doi.org/10.3390/rs14040815
Shen Y, Liu D, Jiang L, Tøttrup C, Druce D, Yin J, Nielsen K, Bauer-Gottwein P, Wang J, Zhao X. Estimating Reservoir Release Using Multi-Source Satellite Datasets and Hydrological Modeling Techniques. Remote Sensing. 2022; 14(4):815. https://doi.org/10.3390/rs14040815
Chicago/Turabian StyleShen, Youjiang, Dedi Liu, Liguang Jiang, Christian Tøttrup, Daniel Druce, Jiabo Yin, Karina Nielsen, Peter Bauer-Gottwein, Jun Wang, and Xin Zhao. 2022. "Estimating Reservoir Release Using Multi-Source Satellite Datasets and Hydrological Modeling Techniques" Remote Sensing 14, no. 4: 815. https://doi.org/10.3390/rs14040815