
A Novel Workflow for Seasonal Wetland Identification Using Bi-Weekly Multiple Remote Sensing Data
by
 ,
,
Liwei Xing
1, 
Zhenguo Niu
2,
Cuicui Jiao
3,
Jing Zhang
1,
Shuqing Han
1,
Guodong Cheng
1 and
Jianzhai Wu
1,* 1
Key Laboratory of Agricultural Big Data, Ministry of Agriculture and Rural Affairs/Agricultural Information Institute, Chinese Academy of Agricultural Sciences, Beijing 100081, China
2
State Key Laboratory of Remote Sensing Science, Aerospace Information Research Institute, Chinese Academy of Sciences, Beijing 100094, China
3
College of Economics, Sichuan University of Science & Engineering, Zigong 643000, China
*
Author to whom correspondence should be addressed.
Remote Sens. 2022, 14(4), 1037; https://doi.org/10.3390/rs14041037
Submission received: 11 January 2022
/
Revised: 10 February 2022
/
Accepted: 18 February 2022
/
Published: 21 February 2022
(This article belongs to the Special Issue Remote Sensing of Wetlands and Biodiversity)
Abstract
:Accurate wetland mapping is essential for their protection and management; however, it is difficult to accurately identify seasonal wetlands because of irregular rainfall and the potential lack of water inundation. In this study, we propose a novel method to generate reliable seasonal wetland maps with a spatial resolution of 20 m using a seasonal-rule-based method in the Zhalong and Momoge National Nature Reserves. This study used Sentinel-1 and Sentinel-2 data, along with a bi-weekly composition method to generate a 15-day image time series. The random forest algorithm was used to classify the images into vegetation, waterbodies, bare land, and wet bare land during each time period. Several rules were incorporated based on the intra-annual changes in the seasonal wetlands and annual wetland maps of the study regions were generated. Validation processes showed that the overall accuracy and kappa coefficient were above 89.8% and 0.87, respectively. The seasonal-rule-based method was able to identify seasonal marshes, flooded wetlands, and artificial wetlands (e.g., paddy fields). Zonal analysis indicated that seasonal wetland types, including flooded wetlands and seasonal marshes, accounted for over 50% of the total wetland area in both Zhalong and Momoge National Nature Reserves; and permanent wetlands, including permanent water and permanent marsh, only accounted for 11% and 12% in the two reserves, respectively. This study proposes a new method to generate reliable annual wetland maps that include seasonal wetlands, providing an accurate dataset for interannual change analyses and wetland protection decision-making.
1. Introduction
Globally, wetlands are some of the most productive ecosystems [1], and they often perform many critical biogeochemical, hydrological, and ecological functions. These crucial functions include filtering contaminants, controlling flooding, feeding groundwater, and providing habitats for fish and wildlife [2,3,4]. Wetlands can change seasonally or intermittently due to rainfall and evapotranspiration [5]. These changes provide an oxygenation period for invertebrates through episodic inundation, allowing wetlands to host more invertebrates than permanent water bodies [6,7]. However, seasonal wetlands are often not monitored and managed because of this ephemeral nature [8].
Remote sensing technology has high efficiency, is dynamic, covers a wide area, obtains information quickly, and has been widely used to monitor landcover dynamics [9,10,11,12,13]. Kumar et al. [14] monitored the spatiotemporal evolution of land subsidence in the National Capital Region of India based on multi-source remote sensing data to provide advanced warning for impending groundwater-related hazards. Zheng et al. [15] assessed the ecological vulnerability of protected areas using big data. Additionally, remote sensing serves as a conventional tool for wetland monitoring [16,17,18,19]. Several global land-cover products have mapped wetland distributions based on remote sensing data, such as DISCover [20], FROM-GLC BU-MODIS [21], GLC2000 [22], GlobalLand30 [23], and GLCNMO2013 [24]. However, these datasets do not consider the significant intra-annual variations in wetlands, thus failing to distinguish different wetland categories (e.g., seasonal wetlands).
Time series remote sensing data can detect the phenological characteristics of water bodies and vegetation, which makes these suitable for mapping seasonal wetlands [25,26,27]. The Advanced Very High-Resolution Radiometer (AVHRR) and Moderate Resolution Imaging Spectrometer (MODIS) data have high temporal resolutions and are commonly used to monitor annual wetland distributions [28,29,30,31]. Xing and Niu [8] developed a seasonal wetland map of China using 250 m resolution MODIS time series data, and Li et al. [32] used MODIS data (MCD43A4) to generate a time series of surface water fraction maps at 8-day intervals for the Mediterranean Sea at a resolution of 500 m from 2000 to 2017. These past wetland maps have significant classification errors because of the coarse spatial resolution. Although the Landsat and Huan Jing satellites have a better spatial resolution, they have a low temporal frequency and irregular image time series owing to their low revisit frequencies and missing data because of cloud cover [28,33,34,35]. With the recent launch of satellites, such as Sentinel-2 [1], GF-4 [36], Worldview-3 [37], and Sentinel-1 [38], which can provide images with both high spatial and spatiotemporal resolutions, the integrated use of multi-source remote sensing data can enable seasonal wetland mapping at a high spatial resolution.
Some previous studies have focused on using time series remote sensing data for seasonal wetland identification [39]. Conventional classification methods, such as maximum likelihood (ML) [40], support vector machine (SVM) [41], decision tree (DT) [42], and random forest (RF) [43], require sufficient and representative training samples. For example, Xu et al. [44] mapped the wetlands, including seasonal wetlands, of Poyang Lake using SVM and RF. However, seasonal wetlands are characterised by rapid, irregular, and seasonal and inter-annual dynamics because of the influence of seasonal rainfall [45]. Thus, it is difficult to select representative training samples for seasonal wetlands.
The objectives of this study were (1) to develop a new workflow for seasonal wetland identification using multi-source remote sensing time series images and (2) to analyse the spatial distribution of wetlands in the study region. The rest of this paper is organised as follows: Section 2 introduces the study area and annual wetland classification system, Section 3 and Section 4 discuss the materials and methods of this study, Section 5 and Section 6 present and discuss the research results, respectively, and Section 7 provides the conclusion of this study.
2. Study Area
The study areas are located at the western margin of the Songnen Plain (45°38′ N–47°36′ N, 123°23′ E–124°43′ E), specifically in the Zhalong National Nature Reserve (ZNNR) [46] and the Momoge National Nature Reserve (MNNR) [47], covering 2250 and 1470 km2, respectively (Figure 1). The ZNNR and MNNR were listed in the Ramsar Convention List of Wetlands of International Importance in 1992 and 2013, respectively. The study areas have temperate continental monsoon climates that are characterised by hot and wet summers and cold and dry winters. The mean annual temperature, precipitation level, and sunshine duration are 3.9 °C, 402.7 mm, and 2903 h, respectively, in the ZNNR and 4.2 °C, 392 mm [48], and 2903 h in the MNNR, respectively [47]. Over 90% of the total annual precipitation in the MNNR and ZNNR falls between May and October. The primary land cover types include marsh, lake, paddy field, dry farmland, and grassland, with reed marsh, Calamagrostis angustifolia marsh, and seep weed marsh being dominant in the study area. These wetlands provide important habitats for a variety of fish, bird, and other wildlife. Statistical surveys have revealed 468 species of higher plants and 260 species of birds in ZNNR, and 309 species of higher plants and 297 species of birds in MNNR [49].
In this study, we propose two types of classification systems, for intra-annual and annual periods. The intra-annual classification system includes four categories: bare land, wet bare land, vegetation, and waterbody, based on single-date satellite imagery with bi-weekly temporal resolution. Multiple annual wetland classification systems do not include seasonal information, but Xing and Niu [8] proposed a revised annual classification system based on time series data from satellites, which included seasonal wetlands. By modifying the annual classification system proposed by Xing and Niu [8], our study designed an annual classification system considering the following factors: (1) ensuring a detailed classification system, including marshes that do not hold water continuously and are bare land during some time phases of the year (defined in our classification system as Seasonal marsh2); and (2) ensuring that the system is suitable for small study areas. The annual classification system in our study uses a two-tier hierarchical classification structure (Table 1). Level 1 comprises two categories: wetlands and uplands. Level 2 comprises 11 categories: five types of natural wetlands, an artificial wetland, three types of natural uplands, and two types of artificial uplands.
3. Datasets and Pre-Processing
Mapping seasonal wetlands requires remote sensing data at a high temporal resolution. Sentinel-2 and Sentinel-1 offer multi-spectral data at spatial and temporal resolutions of 10–20 m and 5 days, respectively, enabling accurate seasonal wetland mapping and monitoring [38]. In this study, we used Sentinel-2 top of atmosphere (TOA) reflectance and Sentinel-1 data of the study regions from March to November 2018. All data were acquired and proceeded on the Google Earth Engine (GEE) [50].
3.1. Sentinel-2 Data
We used the Sentinel-2 TOA reflectance data in our study as no surface reflectance (SR) data prior to 2019 were available on GEE for the study area. Studies have shown that some indices calculated from TOA reflectance and SR are highly correlated, and, as such, they performed equally well in land cover classification [51]. Therefore, although TOA reflectance is not perfect, its impact on classification results is negligible [52].
We sourced all available Sentinel-2 TOA reflectance data between 15 March 2018 and 30 November 2018, including data from 10 multispectral bands (Blue, Green, Red, three Red-edge, two Near Infrared (NIR), and two Short-Wave Infrared (SWIR) bands). These data were pre-processed by masking clouds using cloudy pixels identified by the quality assurance (QA) assessment band. Subsequently, bi-weekly image time series were generated using the 15-day maximum composition for the 10 multi-spectral bands. Each composited image was defined as one time phase, with 17-time phases in one year. We then used the nearest neighbour algorithm to resample the spatial resolution of all data to the spatial resolution of the Red-edge and SWIR bands (20 m).
Several indices calculated from optical images were used in this study. First, wetness is a unique feature of wetlands. Existing studies have shown that water indices can easily separate water bodies from other objects, such as the normalised difference water index (NDWI) [53], modified NDWI (MDNWI) [54], automated water extraction index (AWEI) [55], and all bands water index (ABWI) [56]. Additionally, the normalised difference moisture index (NDMI) [57], which is generally calculated to monitor plant water content, can increase the separability among wetland plant varieties. Therefore, both ABWI and NDMI were used in this study, which can increase the separability of waterbody, wet bare land, and vegetation. Finally, time series vegetation indices (VIs) have shown good performance for monitoring the phenological characteristics of vegetation; therefore, the normalised difference vegetation index (NDVI) was also selected for vegetation identification. All these indices were calculated from TOA data according to Equations (1)–(3).
where B2, B3, B4, B8, B8b, B11, and B12 are Blue, Green, Red, NIR, narrow NIR, and two SWIR bands for Sentinel-2 images, respectively.
3.2. Sentinel-1 Data
Synthetic aperture radar (SAR) is sensitive to water, wetlands, and paddy fields, indicating that SAR images can be used to improve the accuracy of wetland mapping [58]. In this study, Sentinel-1 VH and VV polarisation data with a resolution of 10 m were obtained from 15 March to 30 November 2018. The data were C-band synthetic aperture radar images in interferometric wide swath (IW) mode and ground range detected (GRD) format. The data were pre-processed by GEE within the Sentinel-1 Toolbox, including orbital correction, thermal noise removal, radiometric calibration, and terrain correction using a digital elevation model (DEM). Subsequently, backscattering coefficients (in dB) were acquired from the orthorectified s0 band using the equation: 10 × log10 (ơ0) [59]. The median value of all pixels at the same location for 15 days was then applied to obtain the bi-weekly Sentinel-1 VH and VV polarisation time series. Finally, the nearest neighbour algorithm was used to resample the spatial resolution of all Sentinel-1 data to 20 m.
3.3. Training and Validation Samples
The samples used in this study were divided into two parts: (1) training and validation samples for the intra-annual land cover map in each time phase and (2) validation samples used to verify the annual wetland map.
The first part of the sample set contained 1899 samples that were used as training and validation samples to classify and evaluate the intra-annual classification results with a bi-weekly temporal resolution. Initially, these 1899 geolocation sampling points were randomly generated using ArcGIS (version 10.5, ESRI 2011). Subsequently, the bi-weekly samples were visually interpreted as bare land, wet bare land, vegetation, and water bodies based on 15-day composited sentinel imagery and high-resolution images from Google Earth (http://earth.google.com, accessed on 5 January 2021) for the same 15 days period. Only points with unambiguous interpretation were retained. Finally, these samples were divided into two parts for training and validation; two-thirds of these samples (1266 samples) were randomly selected and used as intra-annual training samples and the other one-third of the samples (633 samples) were used as validation samples to verify the classification accuracy during each time phase.
The second part of the sample set comprised 810 samples, which were used to verify the annual wetland map. When collecting these validation samples, the study area was divided into nine columns and rows, resulting in 81 cells. Subsequently, at least 10 samples with a centre of 100 × 100 m pure pixels were selected using a stratified random sampling method in each cell. Finally, the validated samples were visually interpreted based on the high-resolution Google Earth images and the typical spectral profiles of vegetation, waterbodies, bare land, and wet bare land (Figure 2).
4. Methodology
4.1. Analytical Techniques
The framework for mapping the seasonal wetlands developed in this study is shown in Figure 3A,B. First, we generated spectral data at 15-day intervals, VH and VV polarisation data, and indices (ABWI, NDMI, and NDVI) extracted from Sentinel-2 data at a spatial resolution of 20 m. Then, the RF algorithm was used to classify intra-annual classification types for each bi-weekly dataset based on 15-day composited remote sensing data. Next, based on the bi-weekly land cover maps, the seasonal-rule-based wetland classification method was used to generate an annual wetland map, and the classification accuracy was calculated to measure the classification performance. Finally, the spatial distribution of the seasonal wetlands was analysed.
4.2. Intra-Annual Classification Method
The bi-weekly composited images were used to generate intra-annual land cover maps for each time phase, with land cover types including bare land, wet bare land, vegetation, and water bodies. Of the contemporary classification algorithms, we chose the RF algorithm for intra-annual classification type mapping because of its high efficiency and flexibility for large datasets [43]. RF is an ensemble-based classifier that combines a set of classification and regression trees (CARTs). Each tree was trained using two-thirds of the samples and the remaining samples were used to validate the classification result, with errors referred to as the “out-of-bag (OOB) error.” Then, the final output was determined by the majority vote of the classifier ensemble. The two parameters set in the RF algorithm were the number of decision trees to be generated (Ntree) and the number of features to best split each node (Mtry). Ntree was set to 1000 to ensure that the OOB errors stabilised the convergence and Mtry was set to the square root of the number of input features.
4.3. Seasonal-Rule-Based Wetland Classification Method
We developed a seasonal-rule-based method (Figure 3) based on the seasonal dynamics of the 15-day intra-annual landcover time series (output of Section 4.2), with N representing the number of 15-day periods, up to a maximum value of 17. Figure 3B shows the details of this method. Permanent water was first extracted based on the 15-day waterbody time series, with the rule that the land cover type of one pixel was a waterbody for all 17 periods (N = 17). The remaining pixels (0 < N < 17) included flooded wetlands and seasonal marsh1 (FS). Non-vegetation (N = 0) and vegetation types (0 < N ≤ 17) were separated based on the 15-day vegetation time series. The overlapping of FS and non-vegetation included flooded wetlands, and the overlapping of FS and vegetation included seasonal marsh1. Subsequently, wetlands (0 < N ≤ 17) and uplands (N = 0) were separated based on a 15-day wet bare land time series. The wetlands zone removed flooded wetlands and seasonal marsh1, remaining permanent marsh, seasonal marsh2, and paddy fields (PSP). The zone including paddy fields and seasonal marsh2 (PS, 0 < N < 17) was delineated based on a 15-day bare land time series, as these two landcover types are bare land during some time in a year. The permanent marsh was delineated from PSP by removing paddy field and seasonal marsh2 (PS). Finally, seasonal marsh2 and paddy fields were distinguished based on the changes in vegetation and wet bare land.
4.4. Accuracy Evaluation
In this study, a confusion matrix, calculated using the validation samples, was used to assess the accuracy of the wetland classification results. The overall accuracy (OA) (Equation (4)), user’s accuracy (UA) (Equation (5)), producer’s accuracy (PA) (Equation (6)), and kappa coefficient (Equation (7)) were calculated based on this confusion matrix, which is a widely used statistical accuracy assessment method [60].
where is the overall accuracy; is the user’s accuracy; is the producer’s accuracy; is the number of correctly classified samples of class i; r is the number of classes; N is the number of training samples; is the number of samples classified as class i; and is the number of training samples of class i.
5. Results
5.1. Land Cover Validation of Each Time Phase
Validation samples were used to assess the intra-annual classification accuracy. Overall, the results showed that the intra-annual accuracy was relatively stable. Vegetation, waterbodies, bare land, and wet bare land were all well distinguished for each bi-weekly period based on the training samples and RF algorithm. The OA ranged from 93.4% to 98.3%, with an average value of 96.0% (Figure 4). The kappa coefficient ranged from 0.90 to 0.97, with an average value of 0.93 (Figure 4). Based on these findings, the use of the intra-annual land cover classification results is reliable to map annual seasonal wetlands.
The PA and UA for all four land cover types were above 85.0% and 84.6%, respectively (Figure 5). Both PA and UA for water bodies were high and stable for each time period, with average PA and UA values of 94.0% and 94.2%, respectively. Additionally, the average PA and UA of vegetation were 98.5% and 98.6%, respectively, greater than those in the non-growing season (1 October to 31 May), with average PA and UA of 90.9% and 92.1%, respectively. The main omission errors in the non-growing season were attributed to the sparsely vegetated areas with low NDVI values that were interpreted as bare land. The accuracy for identifying wet bare land was lower than that for identifying the other three landcover types (Figure 5), as the spectral characteristics of wet bare land, waterbodies, and bare land were not well delineated.
5.2. Annual Wetland Map Accuracy Assessment
This study used the seasonal dynamic characteristics of vegetation, waterbodies, bare land, and wet bare land time series with 15-day intervals to develop a seasonal-rule-based wetland classification method. The confusion matrix for the annual validation samples is shown in Table 2. The results showed that both permanent and seasonal wetland types were well extracted. The OA and kappa coefficients for the annual wetland classification result were 89.8% and 0.87, respectively. In addition, the PA and UA for seasonal wetlands, such as seasonal marsh1, seasonal marsh2, and flooded wetland were above 81.5% and 83.0%, respectively. This indicates that the method proposed in our study is reliable and acceptable for mapping annual wetlands, considering the seasonal changes.
To assess the reliability of this seasonal-rule-based wetland classification method, we compared the wetland classification results obtained by 20 optimal features from all 255 features (time series of Blue, Breen, Red, three Red-edge, two NIR, and two SWIR bands, NDVI, NDMI, and ABWI) with the RF algorithm using 1620 training samples. The results showed that both the OA and kappa coefficient decreased by 9% and 0.11, respectively, compared to the classification result based on the seasonal-rule-based wetland classification method. The PA and UA for all seven land cover types were low, especially for seasonal marsh1 and seasonal marsh2, both being below 72% (Table 3). This is mainly due to the omission of seasonal marsh2 and the commissions of seasonal marsh1. Seasonal marsh2 was misclassified as uplands (Figure 6e,f,A), and seasonal marsh1 was misclassified as seasonal marsh2 and paddy fields (Figure 6e,f,A). However, both seasonal marsh2 and seasonal marsh1 were well extracted based on the method proposed in this study.
Seasonal marsh1, seasonal marsh2, and paddy fields are wetland vegetation types with similar spectral and NDVI time series curves. Therefore, it is difficult to obtain typical training samples owing to the irregular interannual variability of seasonal wetlands, which is also why the supervision classification method was incapable of separating these. However, slight differences persisted in these three wetland vegetation types. The growing season of paddy fields was from 1 July to 30 September, after which the NDVI declined sharply during the rice harvesting period from 1 to 15 October (Figure 6D). The growing season of seasonal marsh1 and seasonal marsh2 was from 16 June to 15 October; thereafter, the NDVI declined slowly. The biggest greatest difference between seasonal marsh1 and seasonal marsh2 is that seasonal marsh1 had an NDVI lower than 0 when inundated by water at certain times during the year (Figure 6B,C). The seasonal-rule-based wetland classification method could precisely identify the irregular seasonal characteristics of each wetland type, enabling classification. Therefore, the results of wetland classification were more accurate than those of the supervision classification method, indicating the effectiveness and stability of the proposed method.
5.3. Wetland Classification Result
The intra-annual classification results were obtained using 15-day training samples and the RF algorithm. Figure 7 shows the vegetation, waterbodies, bare land, and wet bare land time series of both wetland reserves in 2018. The distribution of all landcover types showed significant seasonal variations. Vegetation coverage began to increase in May and reached a peak in July, and then started to decline in October. During the growing season (16 May to 15 October), the average vegetation coverage was 1700.8 km2 in ZNNR (Figure 8A) and 785.9 km2 in MNNR (Figure 8B). During the non-growing season (16 October to 15 May), the average vegetation coverage was 7.9 km2 in ZNNR and 7.6 km2 in MNNR. On the contrary, the bare land and wet bare land areas in both reserves began to decrease in May, reached a minimum in July, and started to increase in October. Additionally, the seasonal dynamic characteristics of waterbodies differed between these two reserves. The waterbody area in MNNR was larger during the rainy season (July to September) than that in the dry season (October to June), while the waterbody area in the ZNNR during the rainy season was lower than that during the dry season. This can be explained by the large amount of vegetation that becomes submerged in MNNR during the rainy season (Figure 7), while large water areas experience vegetation growth in ZNNR during the same time (Figure 7).
Figure 9 shows the annual wetland classification results for our study area in 2018. The total area of wetlands was 79.8% (1794.4 km2) of the total area of ZNNR and 66.6% (978.5 km2) of the total area of MNNR. In ZNNR, seasonal wetland types, including seasonal marsh2 (965.7 km2), seasonal marsh1 (361.2 km2), and flooded wetland (57.6 km2) were the main wetland types, accounting for over 77% of the total wetland area. Permanent wetland types, including permanent water (51.4 km2) and permanent wetland (135.2 km2), accounted for only 11% of the total wetland area (Figure 10A). In MNNR, seasonal marsh1 and paddy field were the main wetland types, accounting for 67% of the total wetland area. Similarly, seasonal wetland types (554.1 km2) accounted for 55% of the total wetland area, permanent wetland types (119.5 km2) account for only 12% of the total wetland area (Figure 10B). Although seasonal wetlands in both reserves accounted for more than half of the total wetland area, existing wetland classification maps in ZNNR and MNNR have not classified seasonal wetland types [46,48]. These findings are significant for protecting and managing the fragile seasonal wetlands in ZNNR and MNNR.
6. Discussion
Accurate wetland mapping is important for clarifying interannual dynamics and wetland protection and management. The seasonal-rule-based wetland classification method proposed in our study accurately and successfully obtained the annual spatial distribution of wetlands by monitoring plant phenological characteristics and detecting seasonal changes in vegetation and waterbodies. We compared our resulting annual wetland maps to the 10-m resolution European Space Agency (ESA) World Cover map [61]. Although the spatial resolution of the ESA world cover map is higher, the land cover system is coarser. For example, our classification results included both permanent (permanent water and marsh) and seasonal wetlands (flooded wetland, seasonal marsh1, and seasonal marsh2) (Figure 11e,f), whereas the World Cover map ignores the seasonal dynamics of wetlands and only defines two wetland types, open water and herbaceous wetlands (Figure 11g,h). Furthermore, large areas of seasonal marsh1 and flooded wetlands were misclassified as grasslands or open water in the World Cover map. For example, points A and B in Figure 11f,h are water bodies in the wet season but vegetation and bare land during the dry season, respectively; therefore, it is unreasonable for these areas to be classified as grassland and open water in the World Cover map. Additionally, artificial wetlands (paddy field) were also separated from croplands based on the differences in growing season between paddy fields and dry farmland (Figure 11f,h,C,D). However, paddy fields and croplands were not separated in the World Cover map. Overall, our classification method presents a more accurate representation of the land cover than the ESA world cover map. Paddy fields have high economic benefits, but the ecological value of natural wetlands is far greater than the economic value of artificial wetlands [62]. Considering the limited water resources in the studied reserves, paddy fields as artificial wetlands need to be accurately evaluated and monitored to prevent expansion.
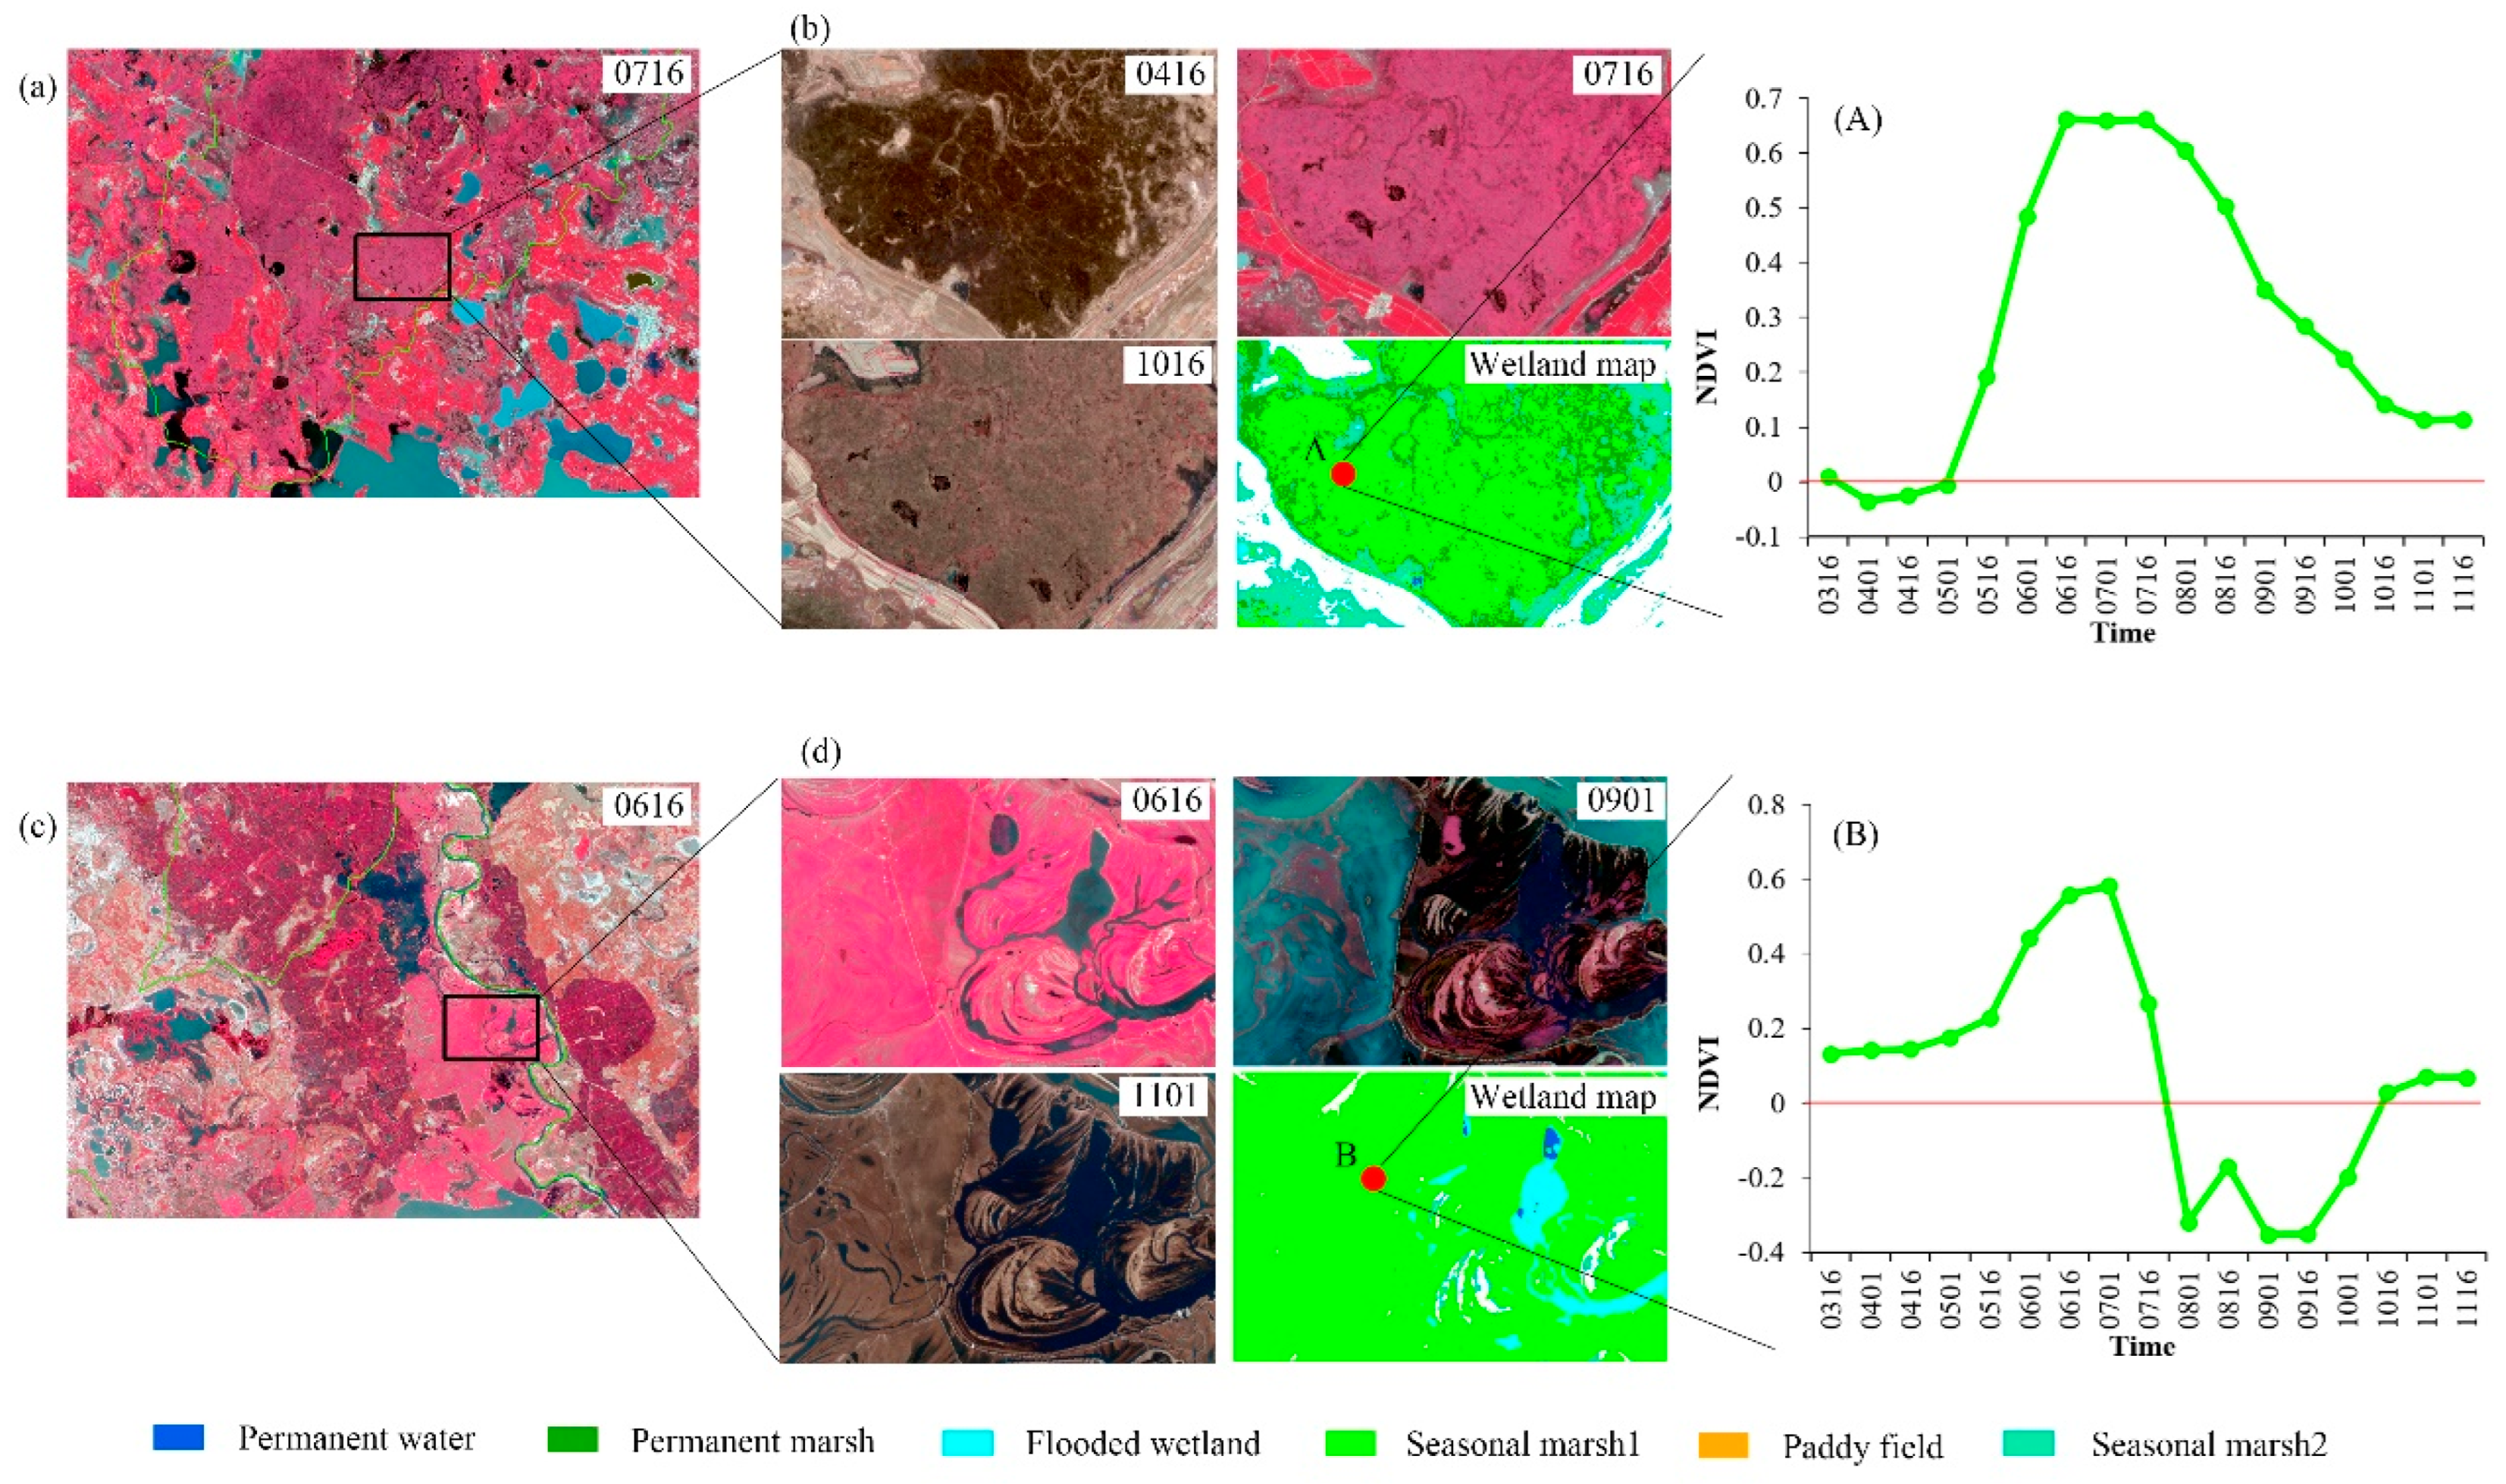
Seasonal wetlands play an important role in supporting the survival of species and promoting their movement. In this study, seasonal wetlands, such as flooded wetland, seasonal marsh1, and seasonal marsh2, were accurately classified using a seasonal-rule-based wetland classification method. Some previous studies have focused on permanent and seasonal wetland identification through multi-temporal remote sensing data. Chen et al. [39] identified seasonal wetlands in Poyang Lake by artificially setting the submerged time to July through September. However, submerged time is affected by rainfall, temperature, and artificial factors, and varies in different regions. For example, the submerged time of point A in the ZNNR is from 1 April to 15 May (Figure 12b,A), while that of point B in the MNNR is from 1 August to 15 October (Figure 12d,B). Although seasonal marsh1 in ZNNR and MNNR were submerged at different times, the seasonal marsh1 areas of the two reserves could be accurately identified using the seasonal-rule-based wetland classification method considering the irregular seasonal dynamics of the submerged time. Therefore, the classification workflow was more accurate and extendable than past methodologies.
The classification results based on our novel method have higher accuracies and more detailed type identifications than past methods, allowing the provision of accurate data for interannual changes analyses and land protection uplands. The seasonal-rule-based wetland classification method proposed in our study had a clear theoretical basis and is easy to replicate; therefore, the method can be used for large-scale wetland identification. However, intra-annual landcover classification was a necessary intermediate step to obtain an annual wetland classification map. The accuracy of the annual wetland map is dependent on the accuracy of the intra-annual landcover classification results, which is an unavoidable limitation of this approach. The four land cover classes in each time phase had high separability and our results show that the OA of all intra-annual maps were higher than 93%. Therefore, the method proposed in this study could generate high-quality annual wetland maps that outperformed traditional methods. However, another limitation is that the specific rules used in this method could only be applied under similar geographical and ecological conditions. These would need to be redesigned for the use in other geographical and ecological contexts. Furthermore, the study area does not include forest swamp types, so the rule establishment of our method did not consider the seasonal characteristics of forest swamps.
7. Conclusions
Most existing wetland classification studies are based on bi-weekly multiple remote sensing data. In this study, we proposed a seasonal-rule-based wetland classification method to extract 15-day vegetation, waterbodies, bare land, and wet bare land in ZNNR and MNNR based on 20 m resolution Sentinel-1 and Sentinel-2 data, and delineated annual seasonal wetlands in these two reserves in 2018. The main conclusions are as follows:
This seasonal-rule-based wetland classification method showed good performance at identifying annual wetlands, particularly seasonal wetlands. In this study area, the OA and kappa coefficient of our classification results were above 89.8% and 0.87, respectively. The PA and UA for all land cover types were above 81.5% and 81.6%, respectively. These results indicate that our seasonal-rule-based wetland classification method was feasible and reasonable, and that the design idea of this method can provide an appropriate large-scale reference.
In 2018, the total area of wetlands in ZNNR and MNNR was 1794.4 and 978.5 km2, respectively; and seasonal wetlands accounted for more than 50% of the total wetland area in both reserves. However, permanent wetlands only accounted for 11% and 12% in the two reserves, respectively. Additionally, the proportion of paddy fields in the MNNR was 20% higher than that in the ZNNR.
This study proposed a new method based on the irregular seasonal dynamics of vegetation and waterbodies to identify the annual seasonal wetlands in the ZNNR and MNNR. The resulting annual wetland maps are reliable for decision-making and interannual change analyses in the two reserves because the majority of the wetlands were seasonal wetlands. In a future study, we will analyse the seasonal variation characteristics of more wetland types, such as forest swamps, and generate more high-quality annual wetland maps at larger scales.
Author Contributions
Conceptualization, L.X.; methodology, L.X.; validation, L.X.; formal analysis, L.X.; investigation, Z.N. and C.J.; resources, L.X.; writing—original draft preparation, L.X.; writing—review and editing, J.Z., S.H., G.C.; project administration, J.W.; funding acquisition J.W. All authors have read and agreed to the published version of the manuscript.
Funding
This research was funded by the National Natural Science Foundation of China (32102600), the Central Public-interest Scientific Institution Basal Research Fund, China (YBYW-AII-2021-09, JBYW-AII-2021-17, and JBYW-AII-2021-33), and the Agricultural Science and Technology Innovation Program of the Chinese Academy of Agricultural Sciences (CAAS-ASTIP-2016-AII).
Data Availability Statement
Not applicable.
Acknowledgments
The authors would like to thank the anonymous reviewers for reviewing the manuscript and providing comments to improve the manuscript. The satellite data used in this paper are processed on Google Earth Engine platform, we would like to thank GEE for providing the service free.
Conflicts of Interest
The authors declare no conflict of interest.
References
- Kaplan, G.; Avdan, U. Mapping and monitoring wetlands using sentinel-2 satellite Imagery. ISPRS Ann. Photogramm. Remote Sens. Spat. Inf. Sci. 2017, 4, 271–277. [Google Scholar] [CrossRef] [Green Version]
- Bwangoy, J.-R.B.; Hansen, M.C.; Roy, D.P.; De Grandi, G.; Justice, C.O. Wetland mapping in the Congo Basin using optical and radar remotely sensed data and derived topographical indices. Remote Sens. Environ. 2010, 114, 73–86. [Google Scholar] [CrossRef]
- Amani, M.; Salehi, B.; Mahdavi, S.; Granger, J.; Brisco, B. Wetland classification in Newfoundland and Labrador using multi-source SAR and optical data integration. GISci. Remote Sens. 2017, 54, 779–796. [Google Scholar] [CrossRef]
- Mao, D.H.; Wang, Z.M.; Du, B.J.; Li, L.; Tian, Y.L.; Jia, M.M.; Zeng, Y.; Song, K.S.; Jiang, M.; Wang, Y.Q. National wetland mapping in China: A new product resulting from object-based and hierarchical classification of Landsat 8 OLI images. ISPRS J. Photogramm. Remote Sens. 2020, 164, 11–25. [Google Scholar] [CrossRef]
- Dronova, I.; Beissinger, S.; Burnham, J.; Gong, P. Landscape-Level Associations of Wintering Waterbird Diversity and Abundance from Remotely Sensed Wetland Characteristics of Poyang Lake. Remote Sens. 2016, 8, 462. [Google Scholar] [CrossRef] [Green Version]
- Duan, H.; Xu, M.; Cai, Y.; Wang, X.; Zhou, J.; Zhang, Q. A Holistic Wetland Ecological Water Replenishment Scheme with Consideration of Seasonal Effect. Sustainability 2019, 11, 930. [Google Scholar] [CrossRef] [Green Version]
- Dronova, I.; Taddeo, S.; Hemes, K.S.; Knox, S.H.; Valach, A.; Oikawa, P.Y.; Kasak, K.; Baldocchi, D.D. Remotely sensed phenological heterogeneity of restored wetlands: Linking vegetation structure and function. Agric. For. Meteorol. 2021, 296, 108215. [Google Scholar] [CrossRef]
- Xing, L.; Niu, Z. Mapping and analyzing China’s wetlands using MODIS time series data. Wetl. Ecol. Manag. 2019, 27, 693–710. [Google Scholar] [CrossRef]
- Hess, L.L.; Melack, J.M.; Filoso, S.; Yong, W. Delineation of inundated area and vegetation along the Amazon floodplain with the SIR-C synthetic aperture radar. IEEE Trans. Geosci. Remote Sens. 1995, 33, 896–904. [Google Scholar] [CrossRef] [Green Version]
- Dewan, A.M.; Kankam-Yeboah, K.; Nishigaki, M. Using Synthetic Aperture Radar (SAR) Data for Mapping River Water Flooding in an Urban Landscape: A Case Study of Greater Dhaka, Bangladesh. J. Jpn. Soc. Hydrol. Water Resour. 2006, 19, 44–54. [Google Scholar] [CrossRef] [Green Version]
- Gomez-Chova, L.; Fernández-Prieto, D.; Calpe, J.; Soria, E.; Vila, J.; Camps-Valls, G. Urban monitoring using multi-temporal SAR and multi-spectral data. Pattern Recognit. Lett. 2006, 27, 234–243. [Google Scholar] [CrossRef]
- Jefriza; Yusoff, I.M.; Abir, I.A.; Syahreza, S.; Lateh, H. The applications of InSAR technique for natural hazard detection in smart society. J. Phys. Conf. Ser. 2020, 1572, 012067. [Google Scholar] [CrossRef]
- Orhan, O. Monitoring of land subsidence due to excessive groundwater extraction using small baseline subset technique in Konya, Turkey. Environ. Monit. Assess. 2021, 193, 1–17. [Google Scholar] [CrossRef]
- Kumar, H.; Syed, T.H.; Amelung, F.; Agrawal, R.; Venkatesh, A. Space-time evolution of land subsidence in the national capital region of India using ALOS-1 and sentinel-1 SAR data: Evidence for groundwater overexploitation. J. Hydrol. 2021, 605, 127329. [Google Scholar] [CrossRef]
- Zheng, Y.; Wang, S.; Cao, Y.; Shi, J.; Qu, Y.; Li, L.; Zhao, T.; Niu, Z.; Yang, R.; Gong, P. Assessing the ecological vulnerability of protected areas by using Big Earth Data. Int. J. Digit. Earth 2021, 14, 1624–1637. [Google Scholar] [CrossRef]
- Hu, S.; Niu, Z.; Chen, Y.; Li, L.; Zhang, H. Global wetlands: Potential distribution, wetland loss, and status. Sci. Total Environ. 2017, 586, 319–327. [Google Scholar] [CrossRef] [PubMed]
- Ozesmi, S.L.; Bauer, M.E. Satellite remote sensing of wetlands. Wetl. Ecol. Manag. 2002, 10, 381–402. [Google Scholar] [CrossRef]
- Rebelo, L.-M.; Finlayson, C.M.; Nagabhatla, N. Remote sensing and GIS for wetland inventory, mapping and change analysis. J. Environ. Manag. 2009, 90, 2144–2153. [Google Scholar] [CrossRef] [PubMed]
- Töyrä, J.; Pietroniro, A. Towards operational monitoring of a northern wetland using geomatics-based techniques. Remote Sens. Environ. 2005, 97, 174–191. [Google Scholar] [CrossRef]
- Loveland, T.R.; Reed, B.C.; Brown, J.F.; Ohlen, D.O.; Zhu, Z.; Yang, L.; Merchant, J.W. Development of a global land cover characteristics database and IGBP DISCover from 1 km AVHRR data. Int. J. Remote Sens. 2000, 21, 1303–1330. [Google Scholar] [CrossRef]
- Friedl, M.A.; McIver, D.K.; Hodges, J.C.; Zhang, X.Y.; Muchoney, D.; Strahler, A.H.; Woodcock, C.E.; Gopal, S.; Schneider, A.; Cooper, A. Global land cover mapping from MODIS: Algorithms and early results. Remote Sens. Environ. 2002, 83, 287–302. [Google Scholar] [CrossRef]
- Bartholome, E.; Belward, A.S. GLC2000: A new approach to global land cover mapping from Earth observation data. Int. J. Remote Sens. 2005, 26, 1959–1977. [Google Scholar] [CrossRef]
- Chen, J.; Chen, J.; Liao, A.; Cao, X.; Chen, L.; Chen, X.; He, C.; Han, G.; Peng, S.; Lu, M. Global land cover mapping at 30 m resolution: A POK-based operational approach. ISPRS J. Photogramm. Remote Sens. 2015, 103, 7–27. [Google Scholar] [CrossRef] [Green Version]
- Kobayashi, T.; Tateishi, R.; Alsaaideh, B.; Sharma, R.C.; Wakaizumi, T.; Miyamoto, D.; Bai, X.; Long, B.D.; Gegentana, G.; Maitiniyazi, A. Production of global land cover data–GLCNMO2013. J. Geogr. Geol. 2017, 9, 1. [Google Scholar] [CrossRef] [Green Version]
- Lhermitte, S.; Verbesselt, J.; Verstraeten, W.W.; Coppin, P. A comparison of time series similarity measures for classification and change detection of ecosystem dynamics. Remote Sens. Environ. 2011, 115, 3129–3152. [Google Scholar] [CrossRef]
- Nguyen, T.T.H.; De Bie, C.A.J.M.; Ali, A.; Smaling, E.M.A.; Chu, T.H. Mapping the irrigated rice cropping patterns of the Mekong delta, Vietnam, through hyper-temporal SPOT NDVI image analysis. Int. J. Remote Sens. 2012, 33, 415–434. [Google Scholar] [CrossRef]
- Sun, F.; Zhao, Y.; Gong, P.; Ma, R.; Dai, Y. Monitoring dynamic changes of global land cover types: Fluctuations of major lakes in China every 8 days during 2000–2010. Chin. Sci. Bull. 2014, 59, 171–189. [Google Scholar] [CrossRef]
- Feng, M.; Sexton, J.O.; Channan, S.; Townshend, J.R. A global, high-resolution (30-m) inland water body dataset for 2000: First results of a topographic–spectral classification algorithm. Int. J. Digit. Earth 2016, 9, 113–133. [Google Scholar] [CrossRef] [Green Version]
- Kang, S.; Hong, S.Y. Assessing Seasonal and Inter-Annual Variations of Lake Surface Areas in Mongolia during 2000–2011 Using Minimum Composite MODIS NDVI. PLoS ONE 2016, 11, e0151395. [Google Scholar] [CrossRef] [Green Version]
- Klein, I.; Gessner, U.; Dietz, A.J.; Kuenzer, C. Global WaterPack–A 250 m resolution dataset revealing the daily dynamics of global inland water bodies. Remote Sens. Environ. 2017, 198, 345–362. [Google Scholar] [CrossRef]
- Zhao, C.; Qin, C.-Z. 10-m-resolution mangrove maps of China derived from multi-source and multi-temporal satellite observations. ISPRS J. Photogramm. Remote Sens. 2020, 169, 389–405. [Google Scholar] [CrossRef]
- Li, L.; Skidmore, A.; Vrieling, A.; Wang, T. A new dense 18-year time series of surface water fraction estimates from MODIS for the Mediterranean region. Hydrol. Earth Syst. Sci. 2019, 23, 3037–3056. [Google Scholar] [CrossRef] [Green Version]
- Liao, A.; Chen, L.; Chen, J.; He, C.; Cao, X.; Chen, J.; Peng, S.; Sun, F.; Gong, P. High-resolution remote sensing mapping of global land water. Sci. China Earth Sci. 2014, 57, 2305–2316. [Google Scholar] [CrossRef]
- Verpoorter, C.; Kutser, T.; Seekell, D.A.; Tranvik, L.J. A global inventory of lakes based on high-resolution satellite imagery. Geophys. Res. Lett. 2014, 41, 6396–6402. [Google Scholar] [CrossRef]
- Forkuor, G.; Dimobe, K.; Serme, I.; Tondoh, J.E. Landsat-8 vs. Sentinel-2: Examining the added value of sentinel-2′s red-edge bands to land-use and land-cover mapping in Burkina Faso. GISci. Remote Sens. 2018, 55, 331–354. [Google Scholar] [CrossRef]
- Zhang, T.; Ren, H.; Qin, Q.; Sun, Y. Snow Cover Monitoring with Chinese Gaofen-4 PMS Imagery and the Restored Snow Index (RSI) Method: Case Studies. Remote Sens. 2018, 10, 1871. [Google Scholar] [CrossRef] [Green Version]
- Sibanda, M.; Mutanga, O.; Rouget, M. Testing the capabilities of the new WorldView-3 space-borne sensor’s red-edge spectral band in discriminating and mapping complex grassland management treatments. Int. J. Remote Sens. 2017, 38, 1–22. [Google Scholar] [CrossRef]
- Slagter, B.; Tsendbazar, N.-E.; Vollrath, A.; Reiche, J. Mapping wetland characteristics using temporally dense Sentinel-1 and Sentinel-2 data: A case study in the St. Lucia wetlands, South Africa. Int. J. Appl. Earth Obs. Geoinf. 2020, 86, 102009. [Google Scholar] [CrossRef]
- Chen, B.; Chen, L.; Huang, B.; Michishita, R.; Xu, B. Dynamic monitoring of the Poyang Lake wetland by integrating Landsat and MODIS observations. ISPRS J. Photogramm. Remote Sens. 2018, 139, 75–87. [Google Scholar] [CrossRef]
- John, A. RA Fisher and the making of maximum likelihood 1912–1922. Stat. Sci. 1997, 12, 162–176. [Google Scholar]
- Cortes, C.; Vapnik, V. Support-vector networks. Mach. Learn. 1995, 20, 273–297. [Google Scholar] [CrossRef]
- Otukei, J.R.; Blaschke, T. Land cover change assessment using decision trees, support vector machines and maximum likelihood classification algorithms. Int. J. Appl. Earth Obs. Geoinf. 2010, 12, S27–S31. [Google Scholar] [CrossRef]
- Breiman, L. Random forests. Mach. Learn. 2001, 45, 5–32. [Google Scholar] [CrossRef] [Green Version]
- Xu, P.; Niu, Z.; Tang, P. Comparison and assessment of NDVI time series for seasonal wetland classification. Int. J. Digit. Earth 2017, 11, 1–28. [Google Scholar] [CrossRef]
- Dronova, I.; Gong, P.; Wang, L.; Zhong, L. Mapping dynamic cover types in a large seasonally flooded wetland using extended principal component analysis and object-based classification. Remote Sens. Environ. 2015, 158, 193–206. [Google Scholar] [CrossRef]
- Na, X.; Zang, S.; Wu, C.; Tian, Y.; Li, W. Hydrological Regime Monitoring and Mapping of the Zhalong Wetland through Integrating Time Series Radarsat-2 and Landsat Imagery. Remote Sens. 2018, 10, 702. [Google Scholar] [CrossRef] [Green Version]
- Chen, Y.; Qiao, S.; Zhang, G.; Xu, Y.J.; Chen, L.; Wu, L. Investigating the potential use of Sentinel-1 data for monitoring wetland water level changes in China’s Momoge National Nature Reserve. PeerJ 2020, 8, e8616. [Google Scholar] [CrossRef]
- Du, J.; Song, K.; Yan, B. Impact of the Zhalong Wetland on Neighboring Land Surface Temperatures Based on Remote Sensing and GIS. Chin. Geogr. Sci. 2019, 29, 798–808. [Google Scholar] [CrossRef] [Green Version]
- An, Y.; Gao, Y.; Zhang, Y.; Tong, S.; Liu, X. Early establishment of Suaeda salsa population as affected by soil moisture and salinity: Implications for pioneer species introduction in saline-sodic wetlands in Songnen Plain, China. Ecol. Indic. 2019, 107, 105654.105651–105654.105657. [Google Scholar] [CrossRef]
- Tian, F.; Wu, B.; Zeng, H.; Zhang, X.; Xu, J. Efficient Identification of Corn Cultivation Area with Multitemporal Synthetic Aperture Radar and Optical Images in the Google Earth Engine Cloud Platform. Remote Sens. 2019, 11, 629. [Google Scholar] [CrossRef] [Green Version]
- Hao, P.; Chen, Z.; Tang, H.; Li, D.; Li, H. New Workflow of Plastic-Mulched Farmland Mapping Using Multi-Temporal Sentinel-2 Data. Remote Sens. 2019, 11, 1353. [Google Scholar] [CrossRef] [Green Version]
- Harald, V.; Freek, V. Sentinel-2A MSI and Landsat 8 OLI Provide Data Continuity for Geological Remote Sensing. Remote Sens. 2016, 8, 883. [Google Scholar]
- McFeeters, S. The use of the Normalized Difference Water Index (NDWI) in the delineation of open water features. Int. J. Remote Sens. 1996, 17, 1425–1432. [Google Scholar] [CrossRef]
- Xu, H. A Study on Information Extraction of Water Body with the Modified Normalized Difference Water Index (MNDWI). J. Remote Sens. 2005, 9, 589–595. [Google Scholar]
- Feyisa, G.L.; Meilby, H.; Fensholt, R.; Proud, S.R. Automated Water Extraction Index: A new technique for surface water mapping using Landsat imagery. Remote Sens. Environ. 2014, 140, 23–35. [Google Scholar] [CrossRef]
- Hakdaoui, S.; Emran, A.; Pradhan, B.; Abdeljebbar, Q.; Alamri, A.M. Assessing the Changes in the Moisture/Dryness of Water Cavity Surfaces in Imlili Sebkha in Southwestern Morocco by Using Machine Learning Classification in Google Earth Engine. Remote Sens. 2020, 12, 131. [Google Scholar] [CrossRef] [Green Version]
- Jin, S.; Sader, S.A. Comparison of time series tasseled cap wetness and the normalized difference moisture index in detecting forest disturbances. Remote Sens. Environ. 2005, 94, 364–372. [Google Scholar] [CrossRef]
- Pham-Duc, B.; Prigent, C.; Aires, F. Surface water monitoring within Cambodia and the Vietnamese Mekong Delta over a year, with Sentinel-1 SAR observations. Water 2017, 9, 366. [Google Scholar] [CrossRef] [Green Version]
- Kun, L.I.; Shao, Y.; Zhang, F.L. Rice information extraction using multi-polarization airborne synthetic aperture radar data. J. Zhejiang Univ. (Agric. Life Sci.) 2011, 37, 181–186. [Google Scholar]
- Foody, G.M. Status of land cover classification accuracy assessment. Remote Sens. Environ. 2002, 80, 185–201. [Google Scholar] [CrossRef]
- Liu, X.; Yu, L.; Si, Y.; Zhang, C.; Lu, H.; Yu, C.; Gong, P. Identifying patterns and hotspots of global land cover transitions using the ESA CCI Land Cover dataset. Remote Sens. Lett. 2018, 9, 972–981. [Google Scholar] [CrossRef]
- Qiu, P.; Songjun, X.; Genzong, X.; Ying, F. Comparisons of natural wetland, Semi-constructed wetland and engineered wetland. J. Hainan Norm. Univ. (Nat. Sci.) 2010, 23, 209–213, 231. [Google Scholar]
Figure 1.
Location of study area.
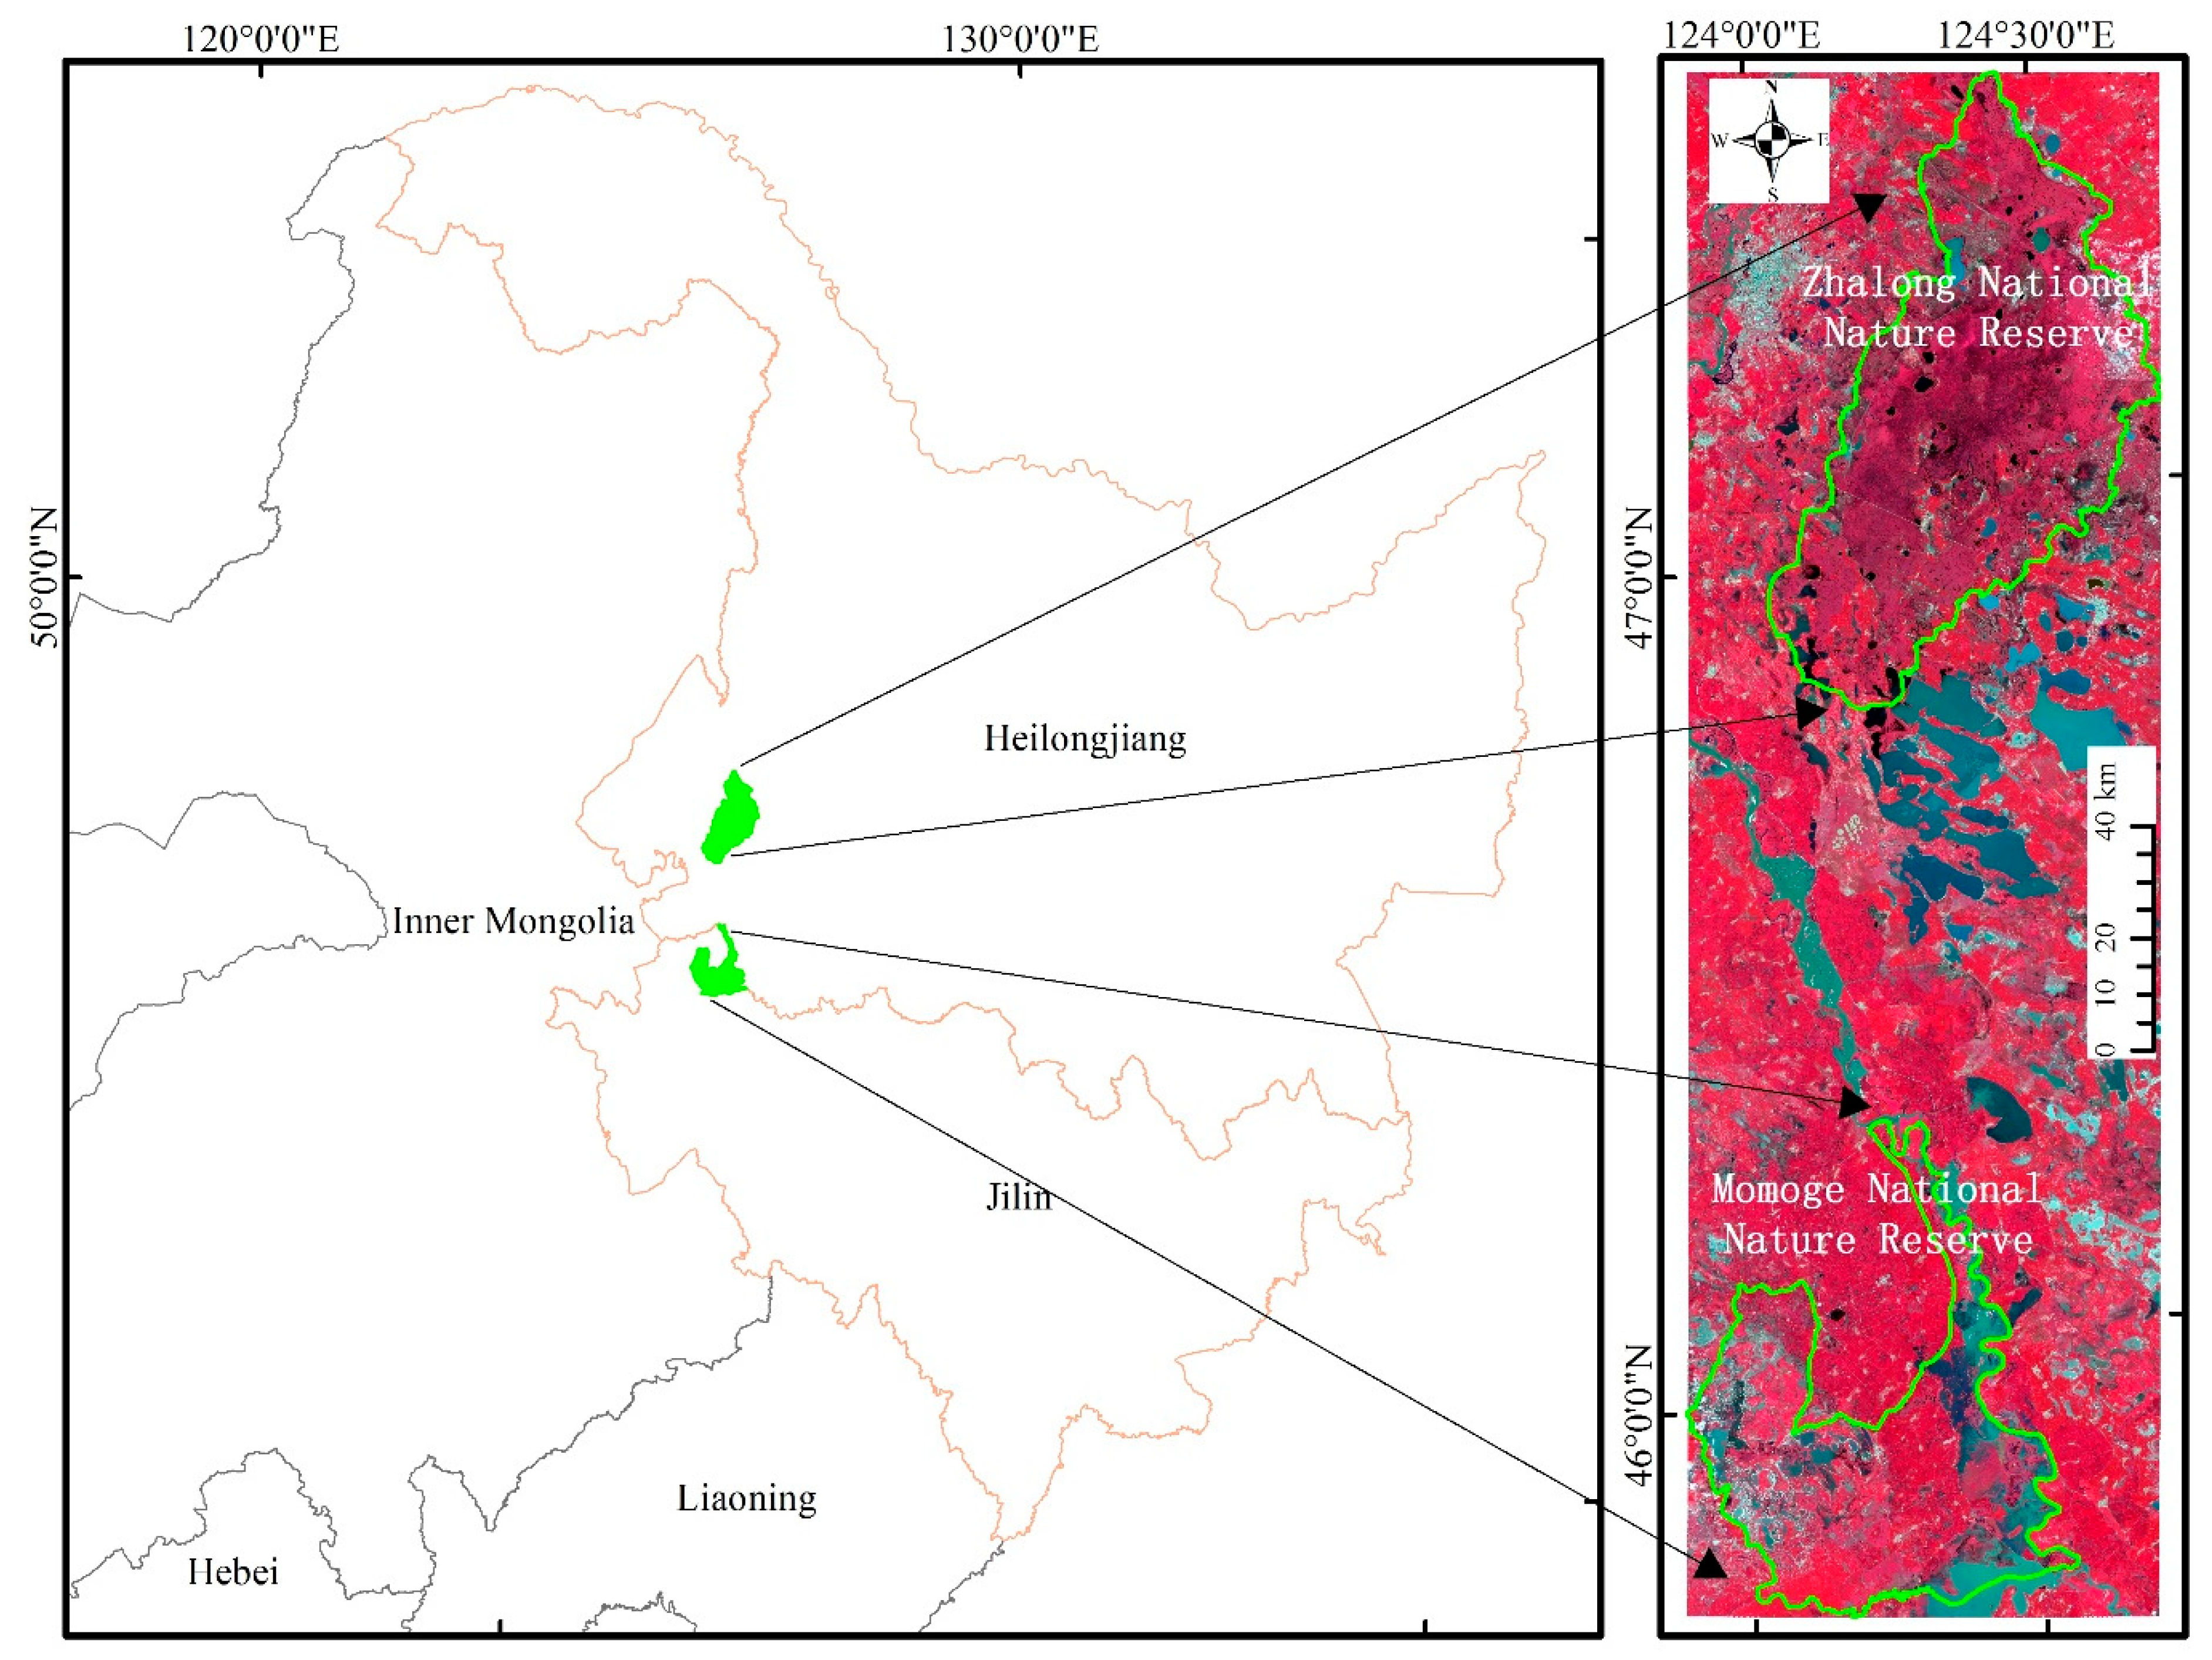
Figure 2.
Typical spectral profiles of vegetation, waterbodies, bare land, and wet bare land. The figure was generated using the Sentinel-2 TOA reference average of intra-annual training samples. Band2, Band3, Band4, Band5, Band6, Band7, Band8, Band8A, Band11, and Band12 represent Blue, Green, Red, Red-edge 1, Red-edge 2, Red-edge 3, NIR (broad), NIR (narrow), SWIR1, and SWIR 2 bands of Sentinel-2 data, respectively.

Figure 3.
Flowchart of the methodology followed in the study (A,B). N is the number of 15-day periods, with a maximum value of 17.
Figure 3.
Flowchart of the methodology followed in the study (A,B). N is the number of 15-day periods, with a maximum value of 17.
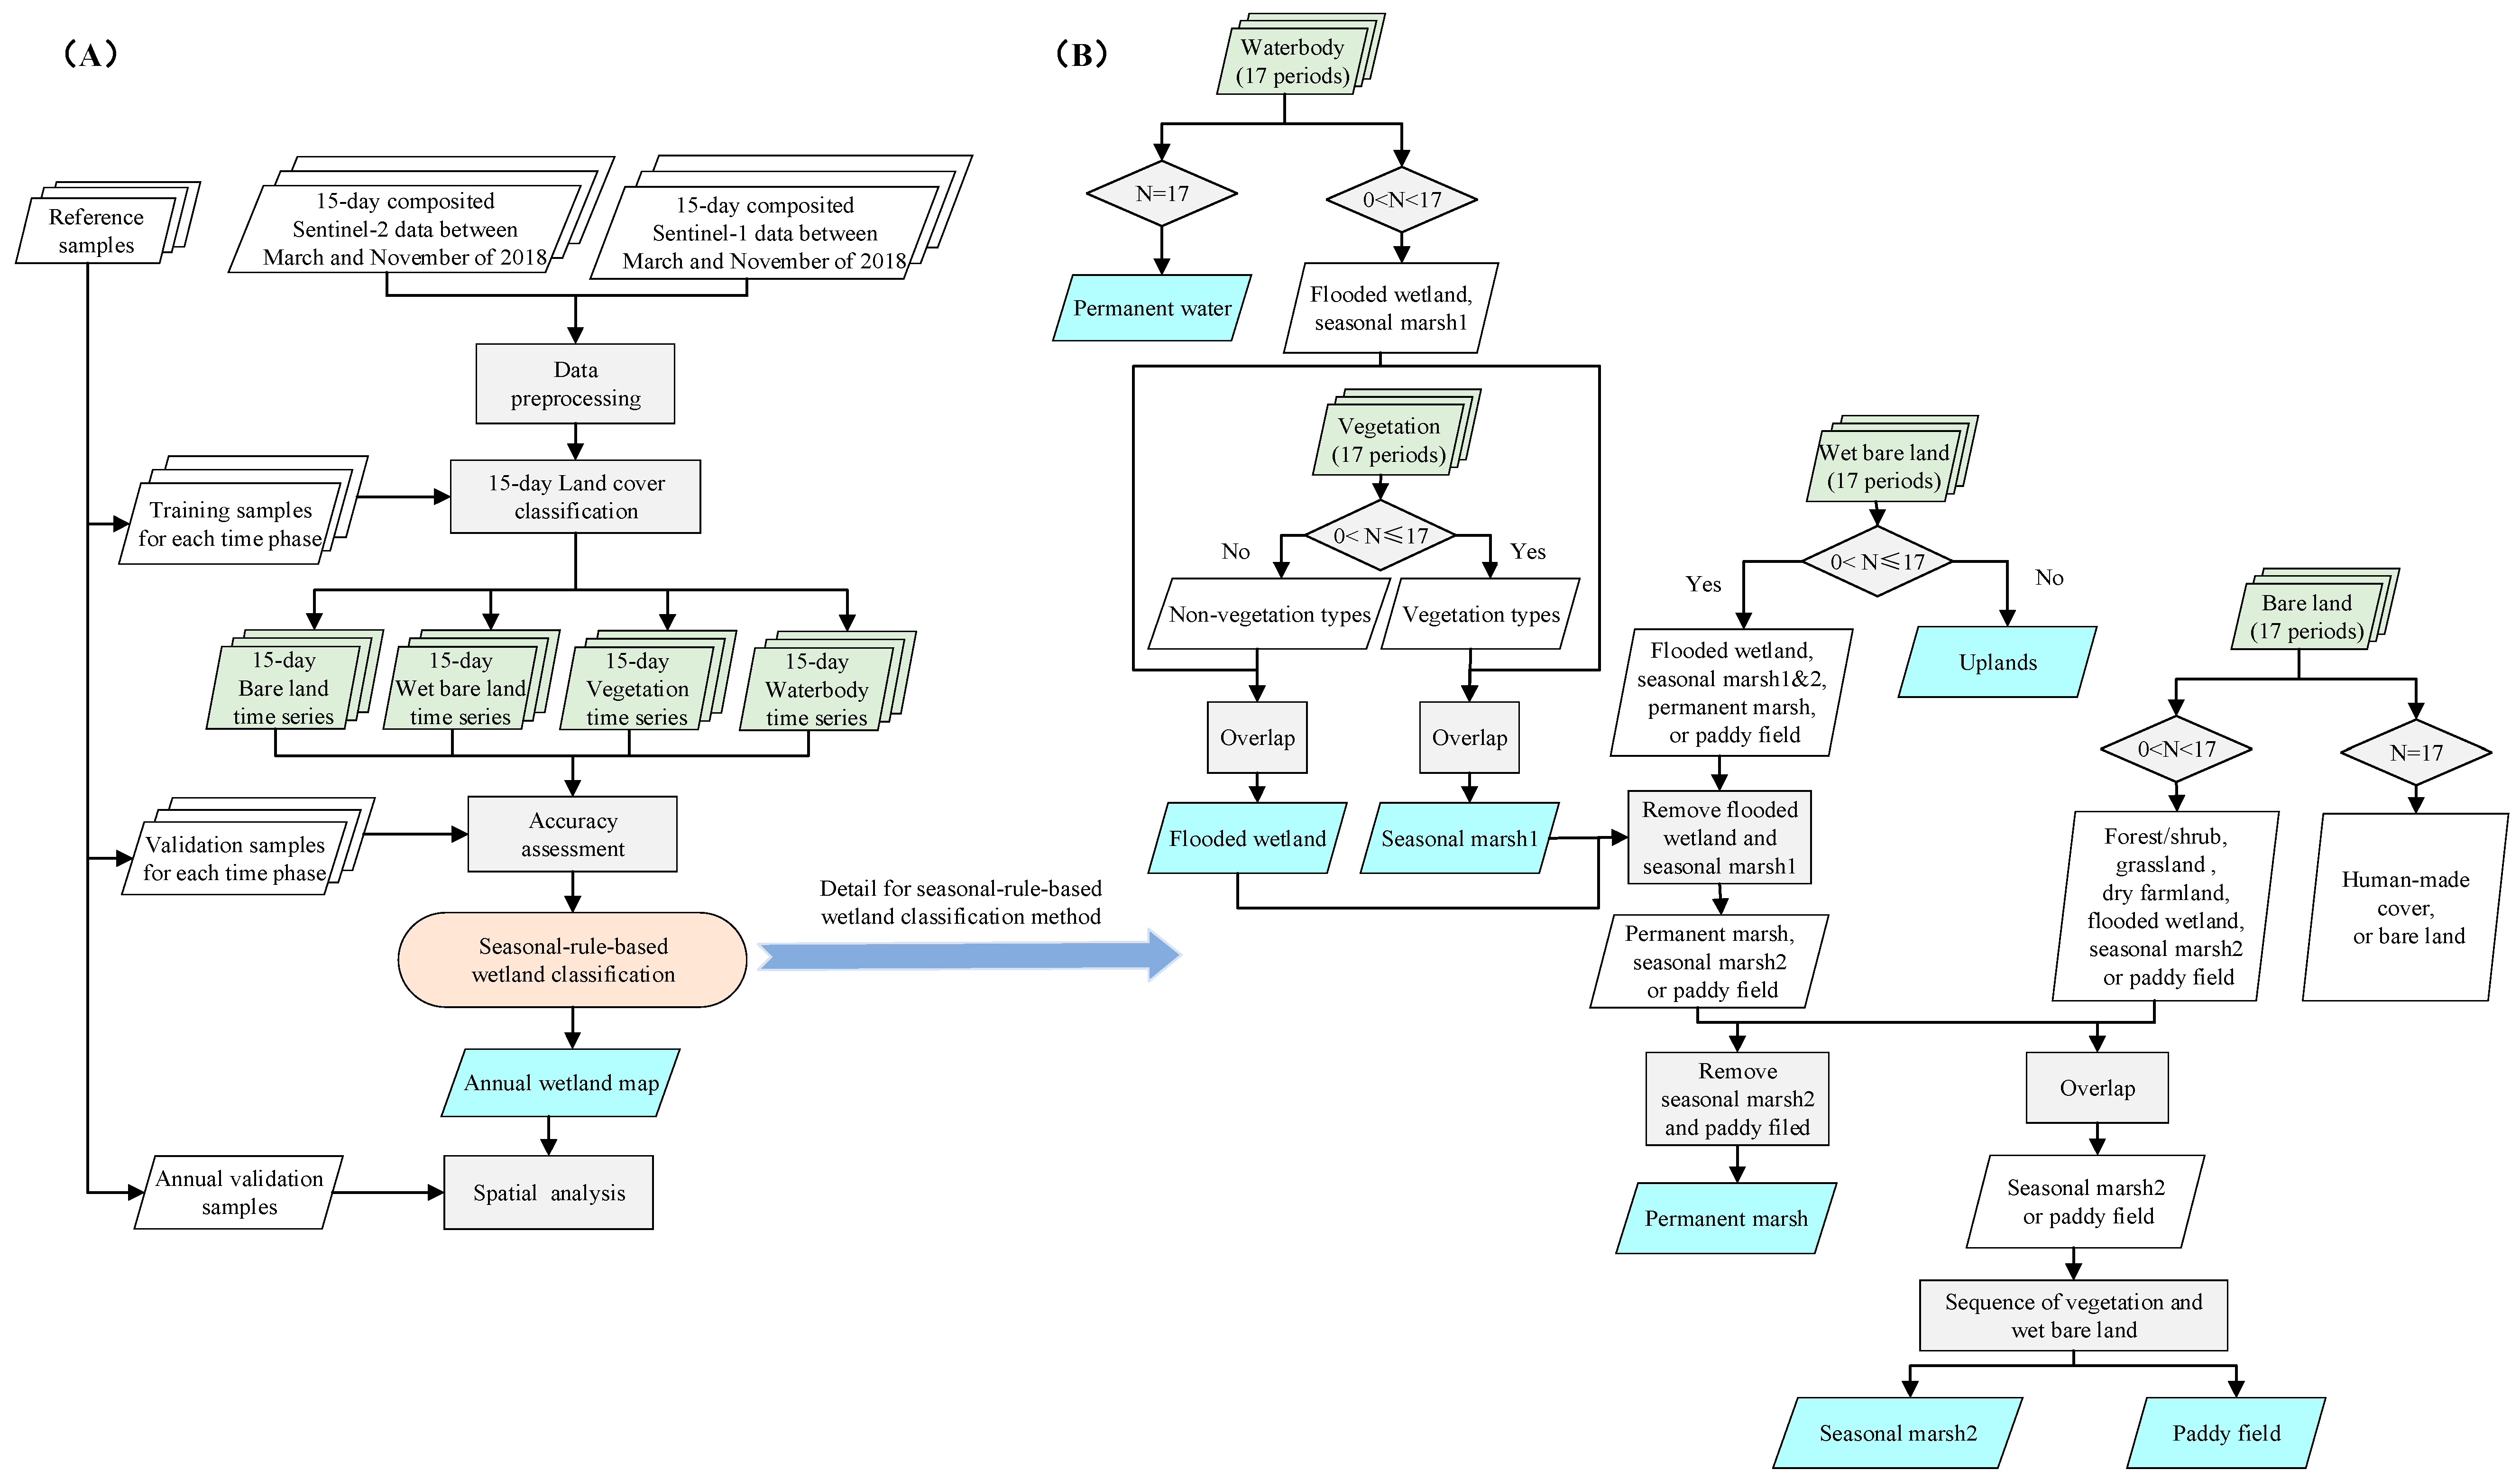
Figure 4.
Overall accuracy (OA) and kappa coefficient of 15-day intra-annual classification results. Note: The times marked in the figure are the first dates of the 15-day Sentinel-2 composite images.
Figure 4.
Overall accuracy (OA) and kappa coefficient of 15-day intra-annual classification results. Note: The times marked in the figure are the first dates of the 15-day Sentinel-2 composite images.
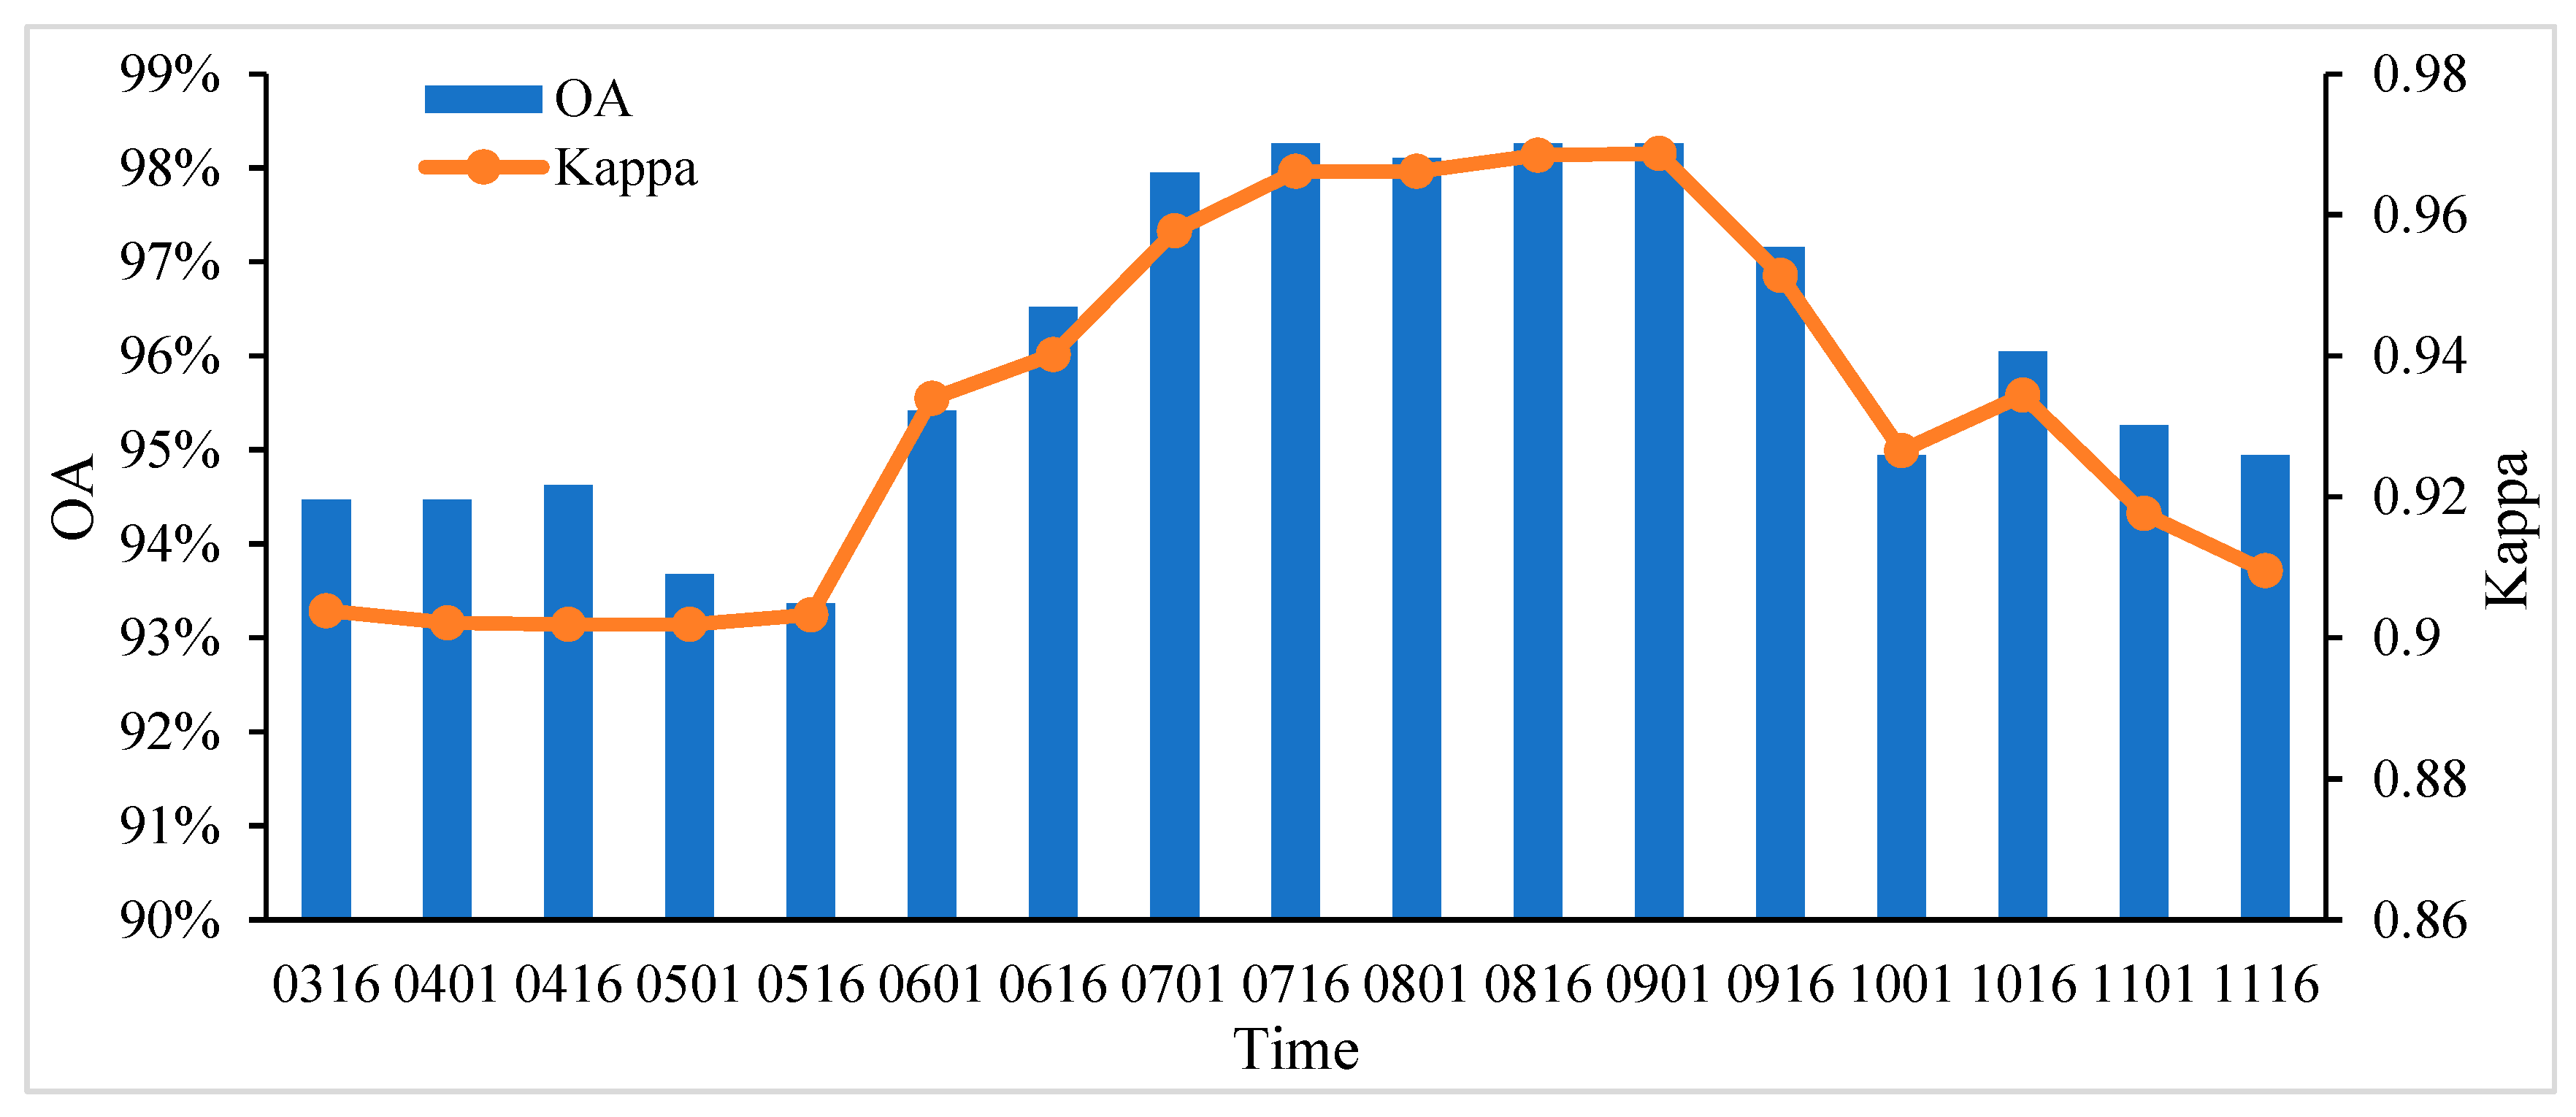
Figure 5.
Producer accuracy (PA) and user accuracy (UA) of 15-day intra-annual classification results. Note: The times marked in the figure are the first dates of the 15-day Sentinel-2 composite images.
Figure 5.
Producer accuracy (PA) and user accuracy (UA) of 15-day intra-annual classification results. Note: The times marked in the figure are the first dates of the 15-day Sentinel-2 composite images.

Figure 6.
Comparison between our resultant wetland map and the classification result based on optimal features and the RF algorithm. (a) Location of the first subset in our study area (false colour image created from 15-day Sentinel-2 composited image between 16 and 31 July). (b) False colour image for the first subset (15-day Sentinel-2 composited image between 1 and 15 April). (c) False colour image for the first subset (15-day Sentinel-2 composited image between 16 and 31 July). (d) False colour image for the first subset (15-day Sentinel-2 composited image between 16 and 31 October). (e,f) Wetland mapping result using seasonal-rule-based wetland classification method. (g,h) Wetland mapping result using the Random Forest algorithm. (A–D) 15-day Sentinel-2 composited NDVI time series curves for point A, B, C, and D in (e–h). Note: The times marked in the figure are the first dates of the 15-day Sentinel-2 composite images.
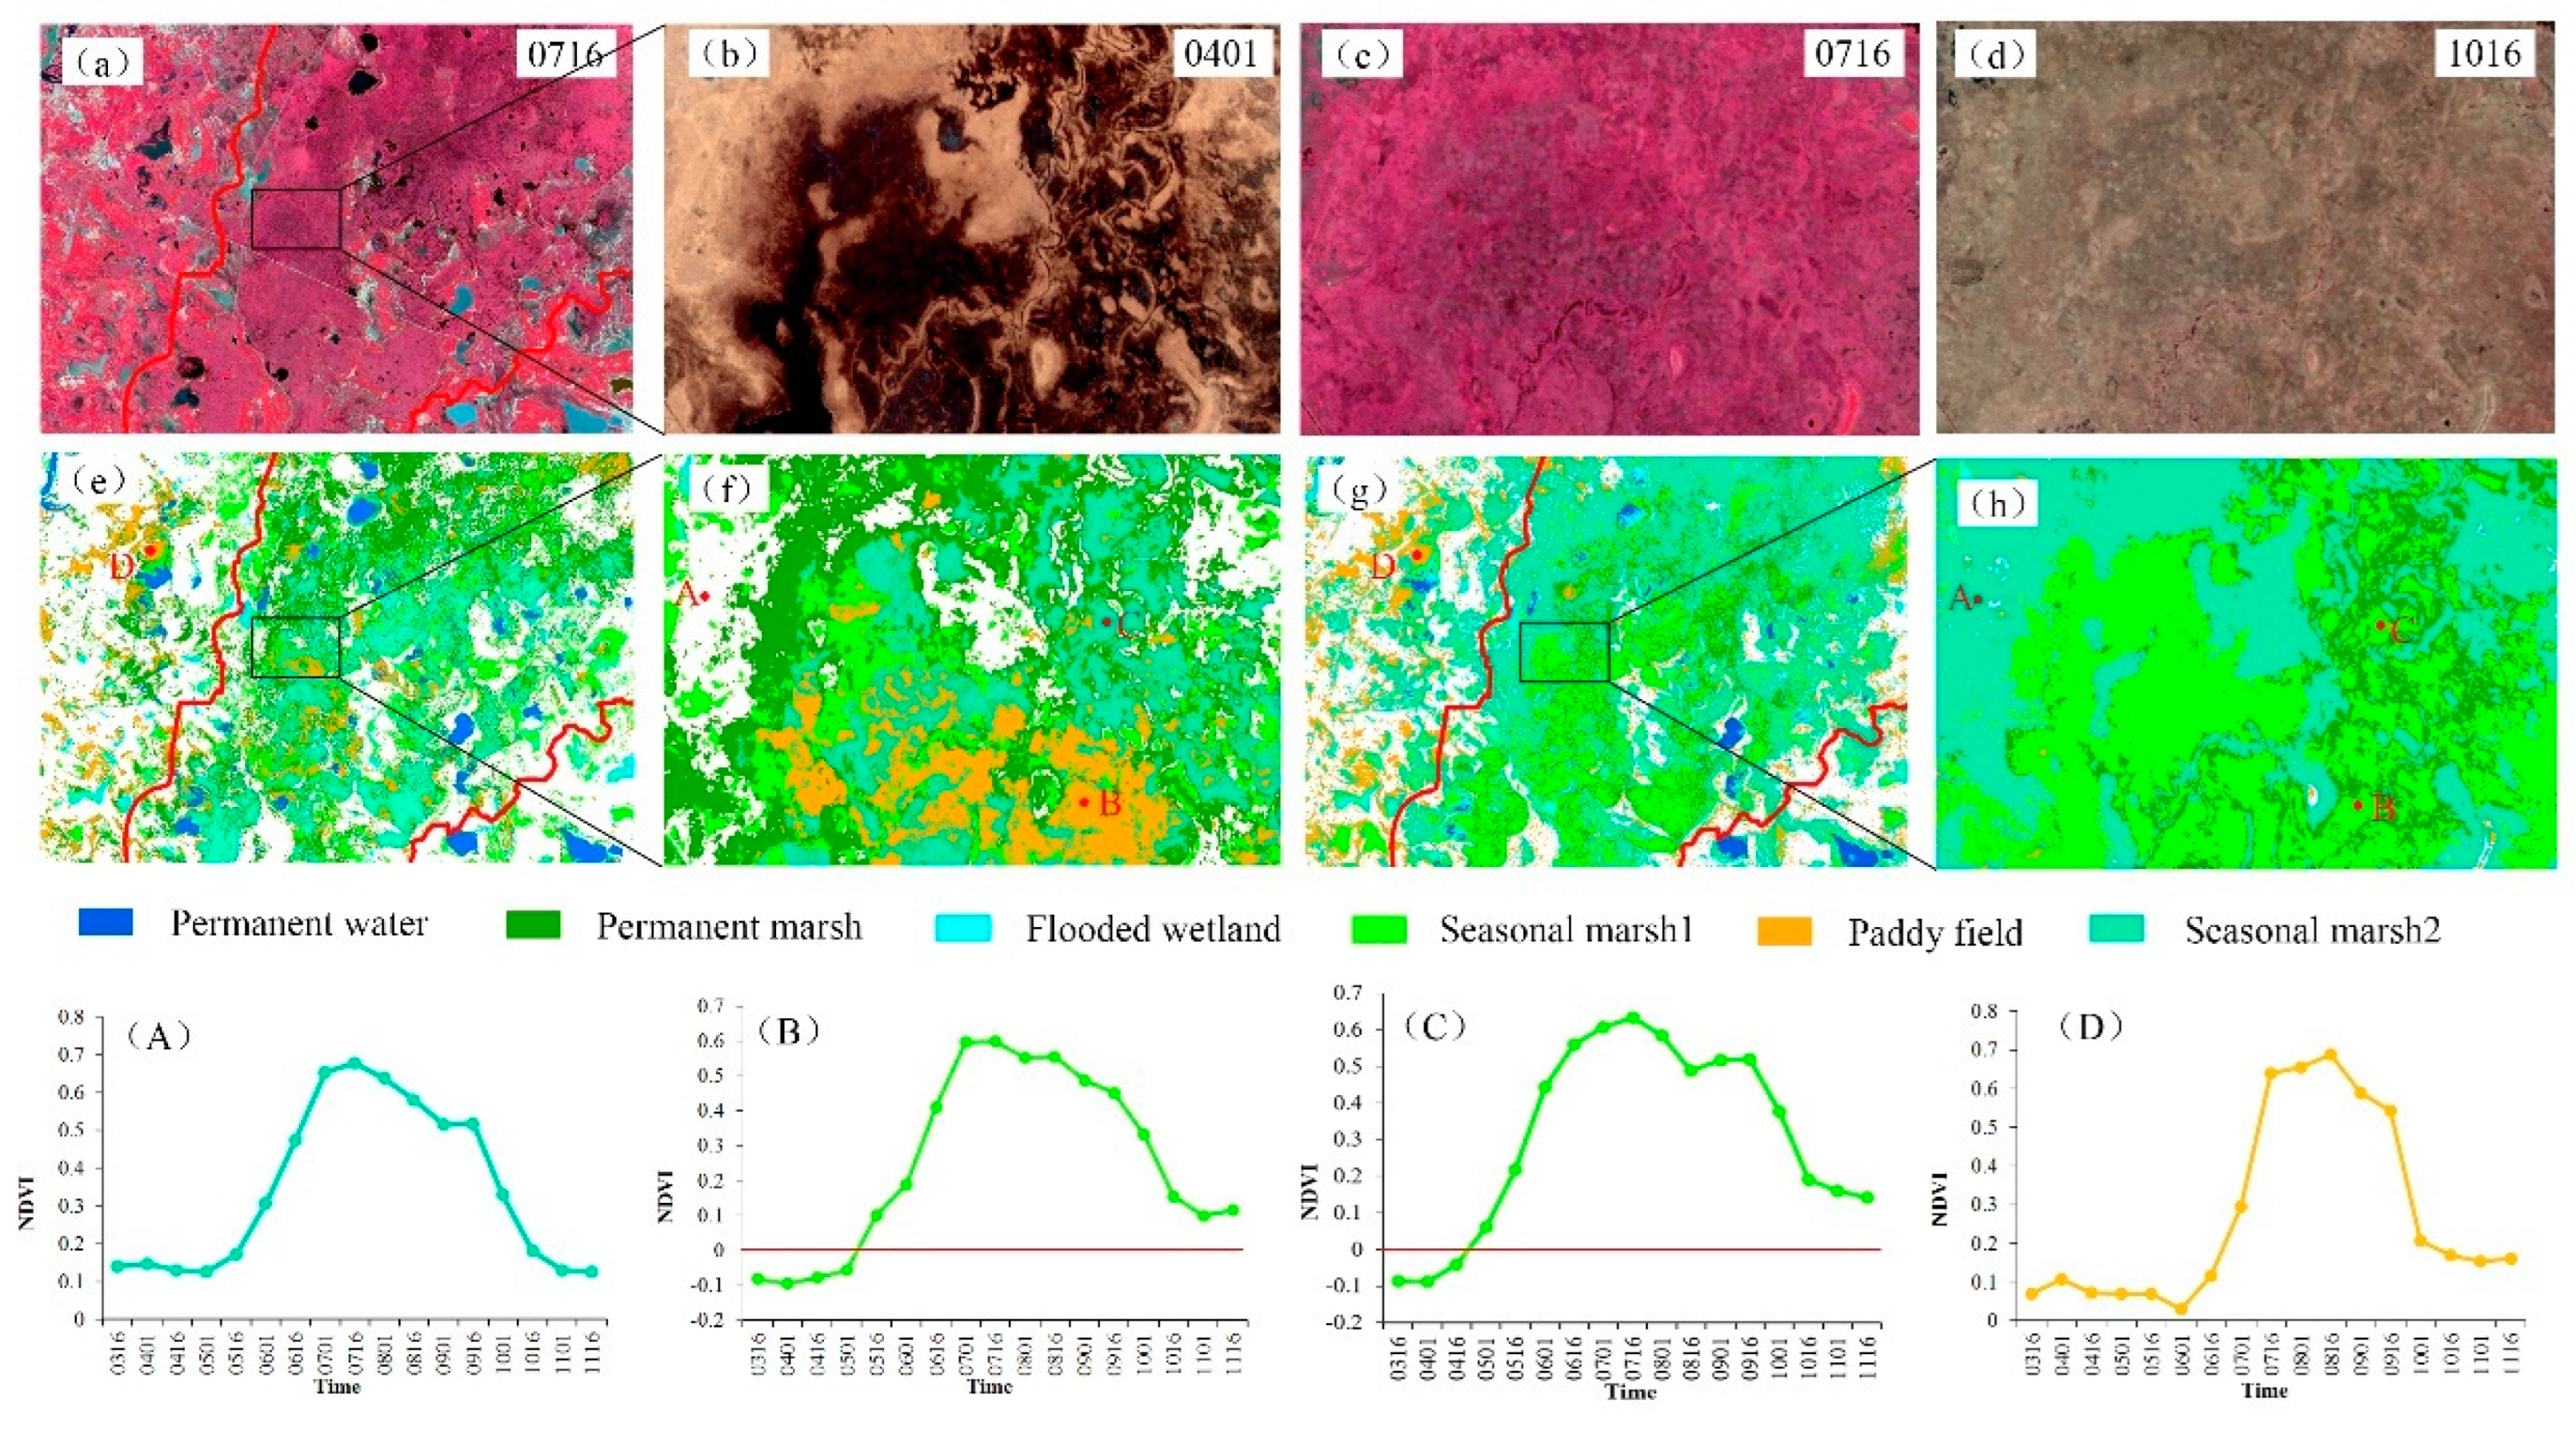
Figure 7.
Intra-annual classification results based on 15-day periods.
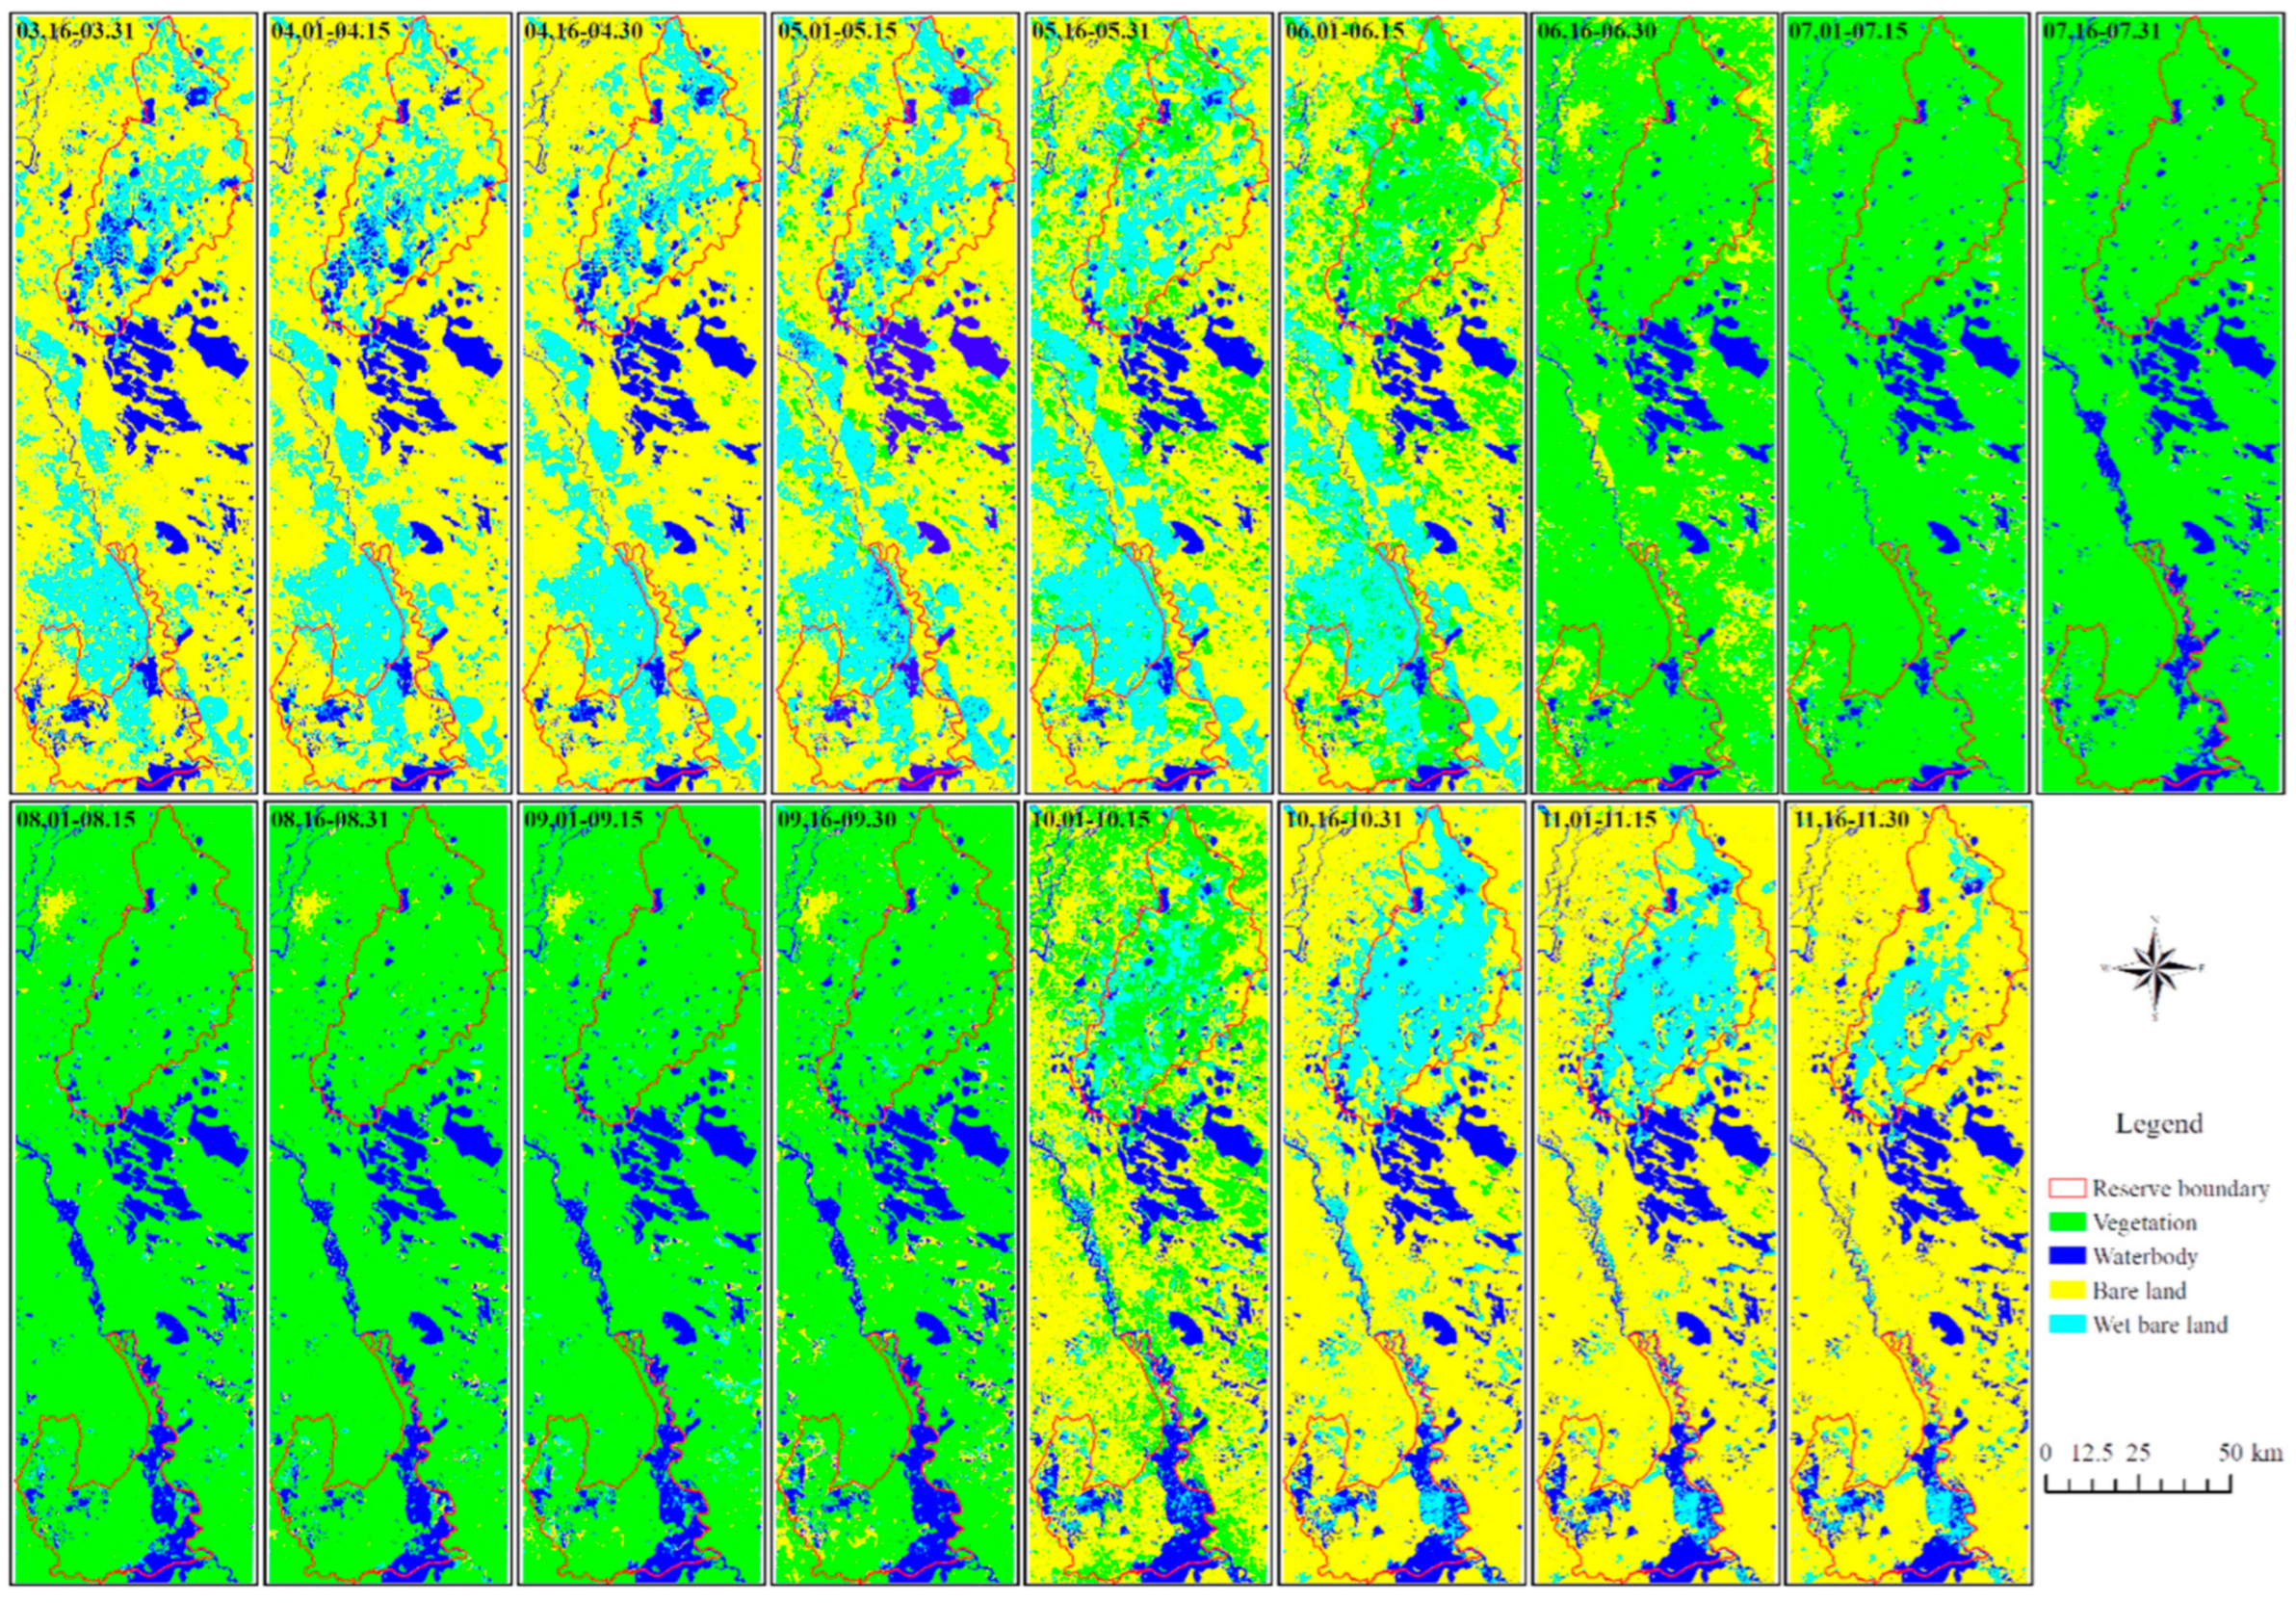
Figure 8.
Changes in four landcovers area for Zhalong National Nature Reserve and Momoge National Nature Reserve. Note: The times marked in the figure are the first dates of the 15-day Sentinel-2 composite images.
Figure 8.
Changes in four landcovers area for Zhalong National Nature Reserve and Momoge National Nature Reserve. Note: The times marked in the figure are the first dates of the 15-day Sentinel-2 composite images.
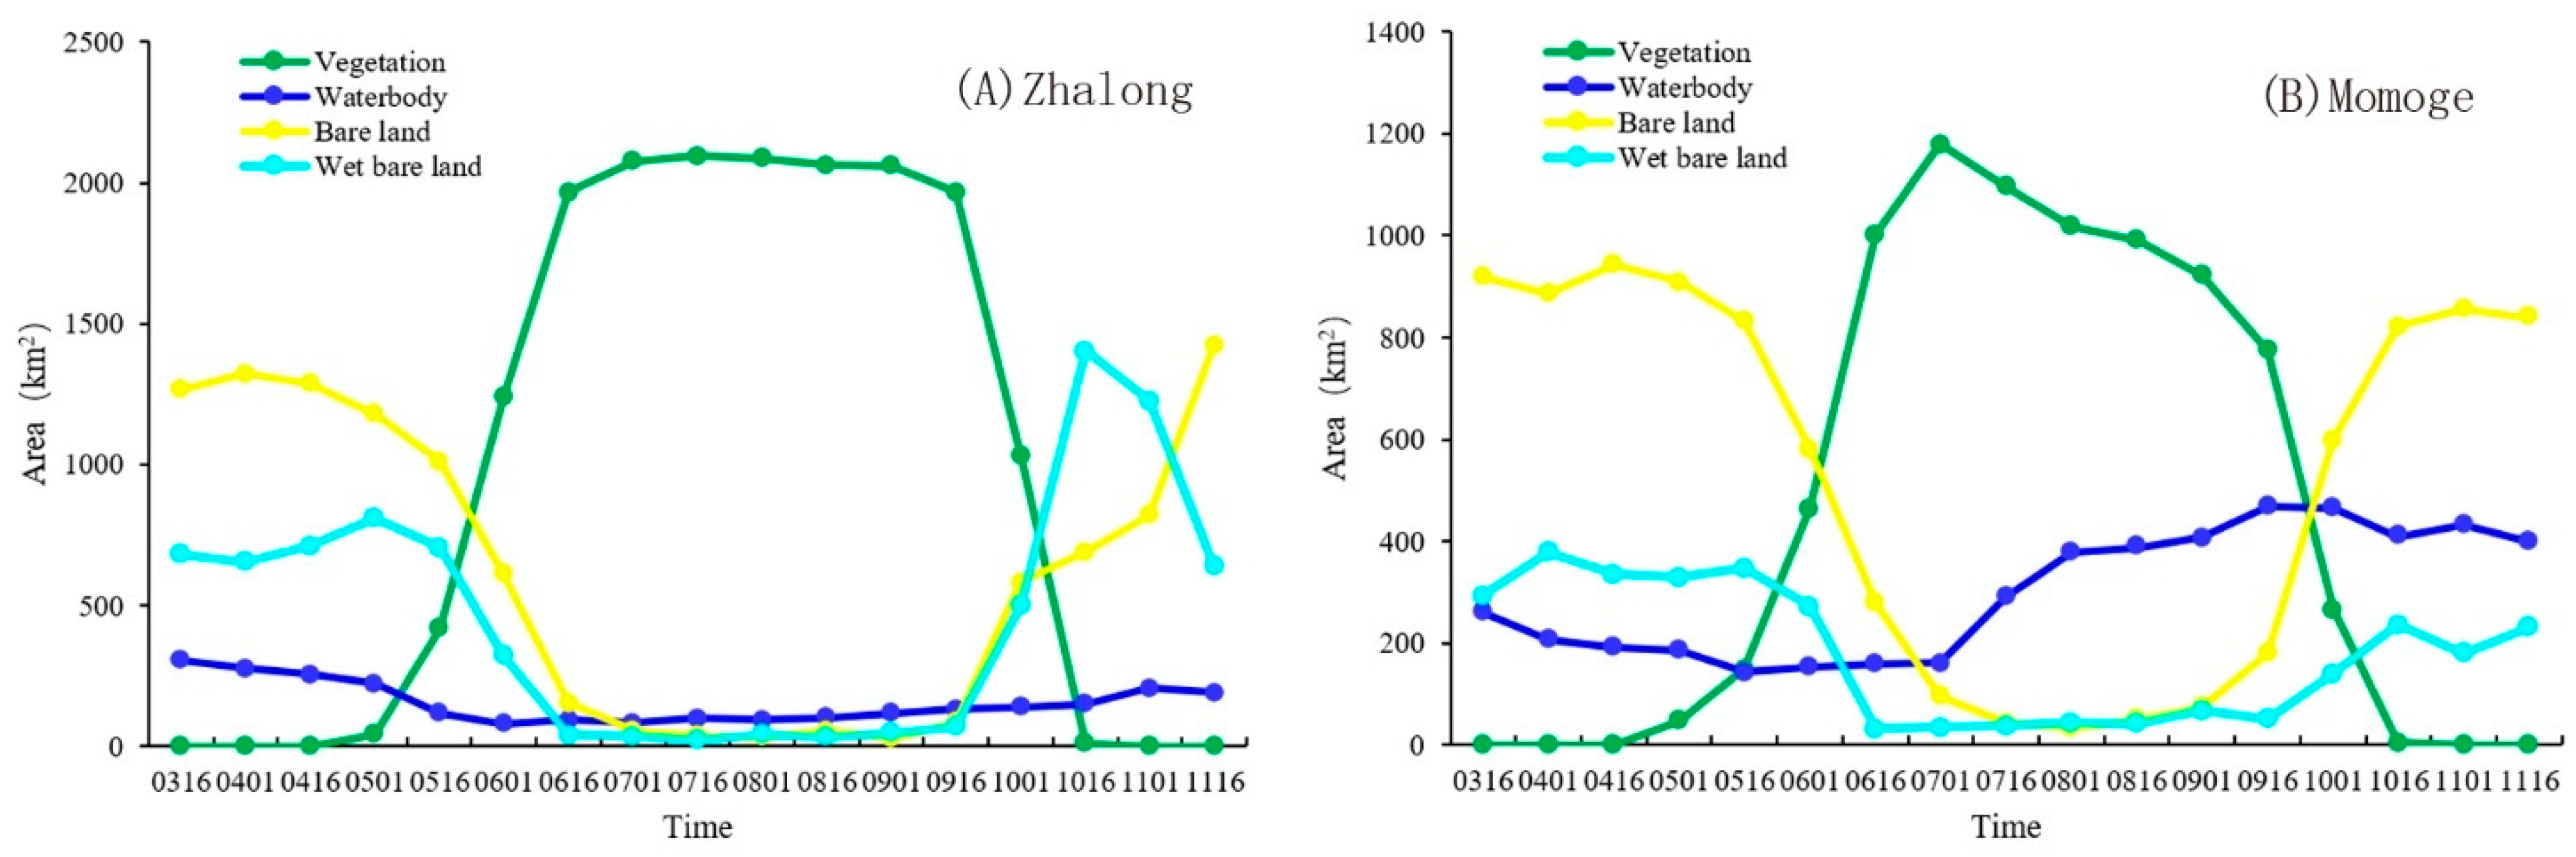
Figure 9.
Annual wetland classification result based on seasonal-rule-based wetland classification method.
Figure 9.
Annual wetland classification result based on seasonal-rule-based wetland classification method.
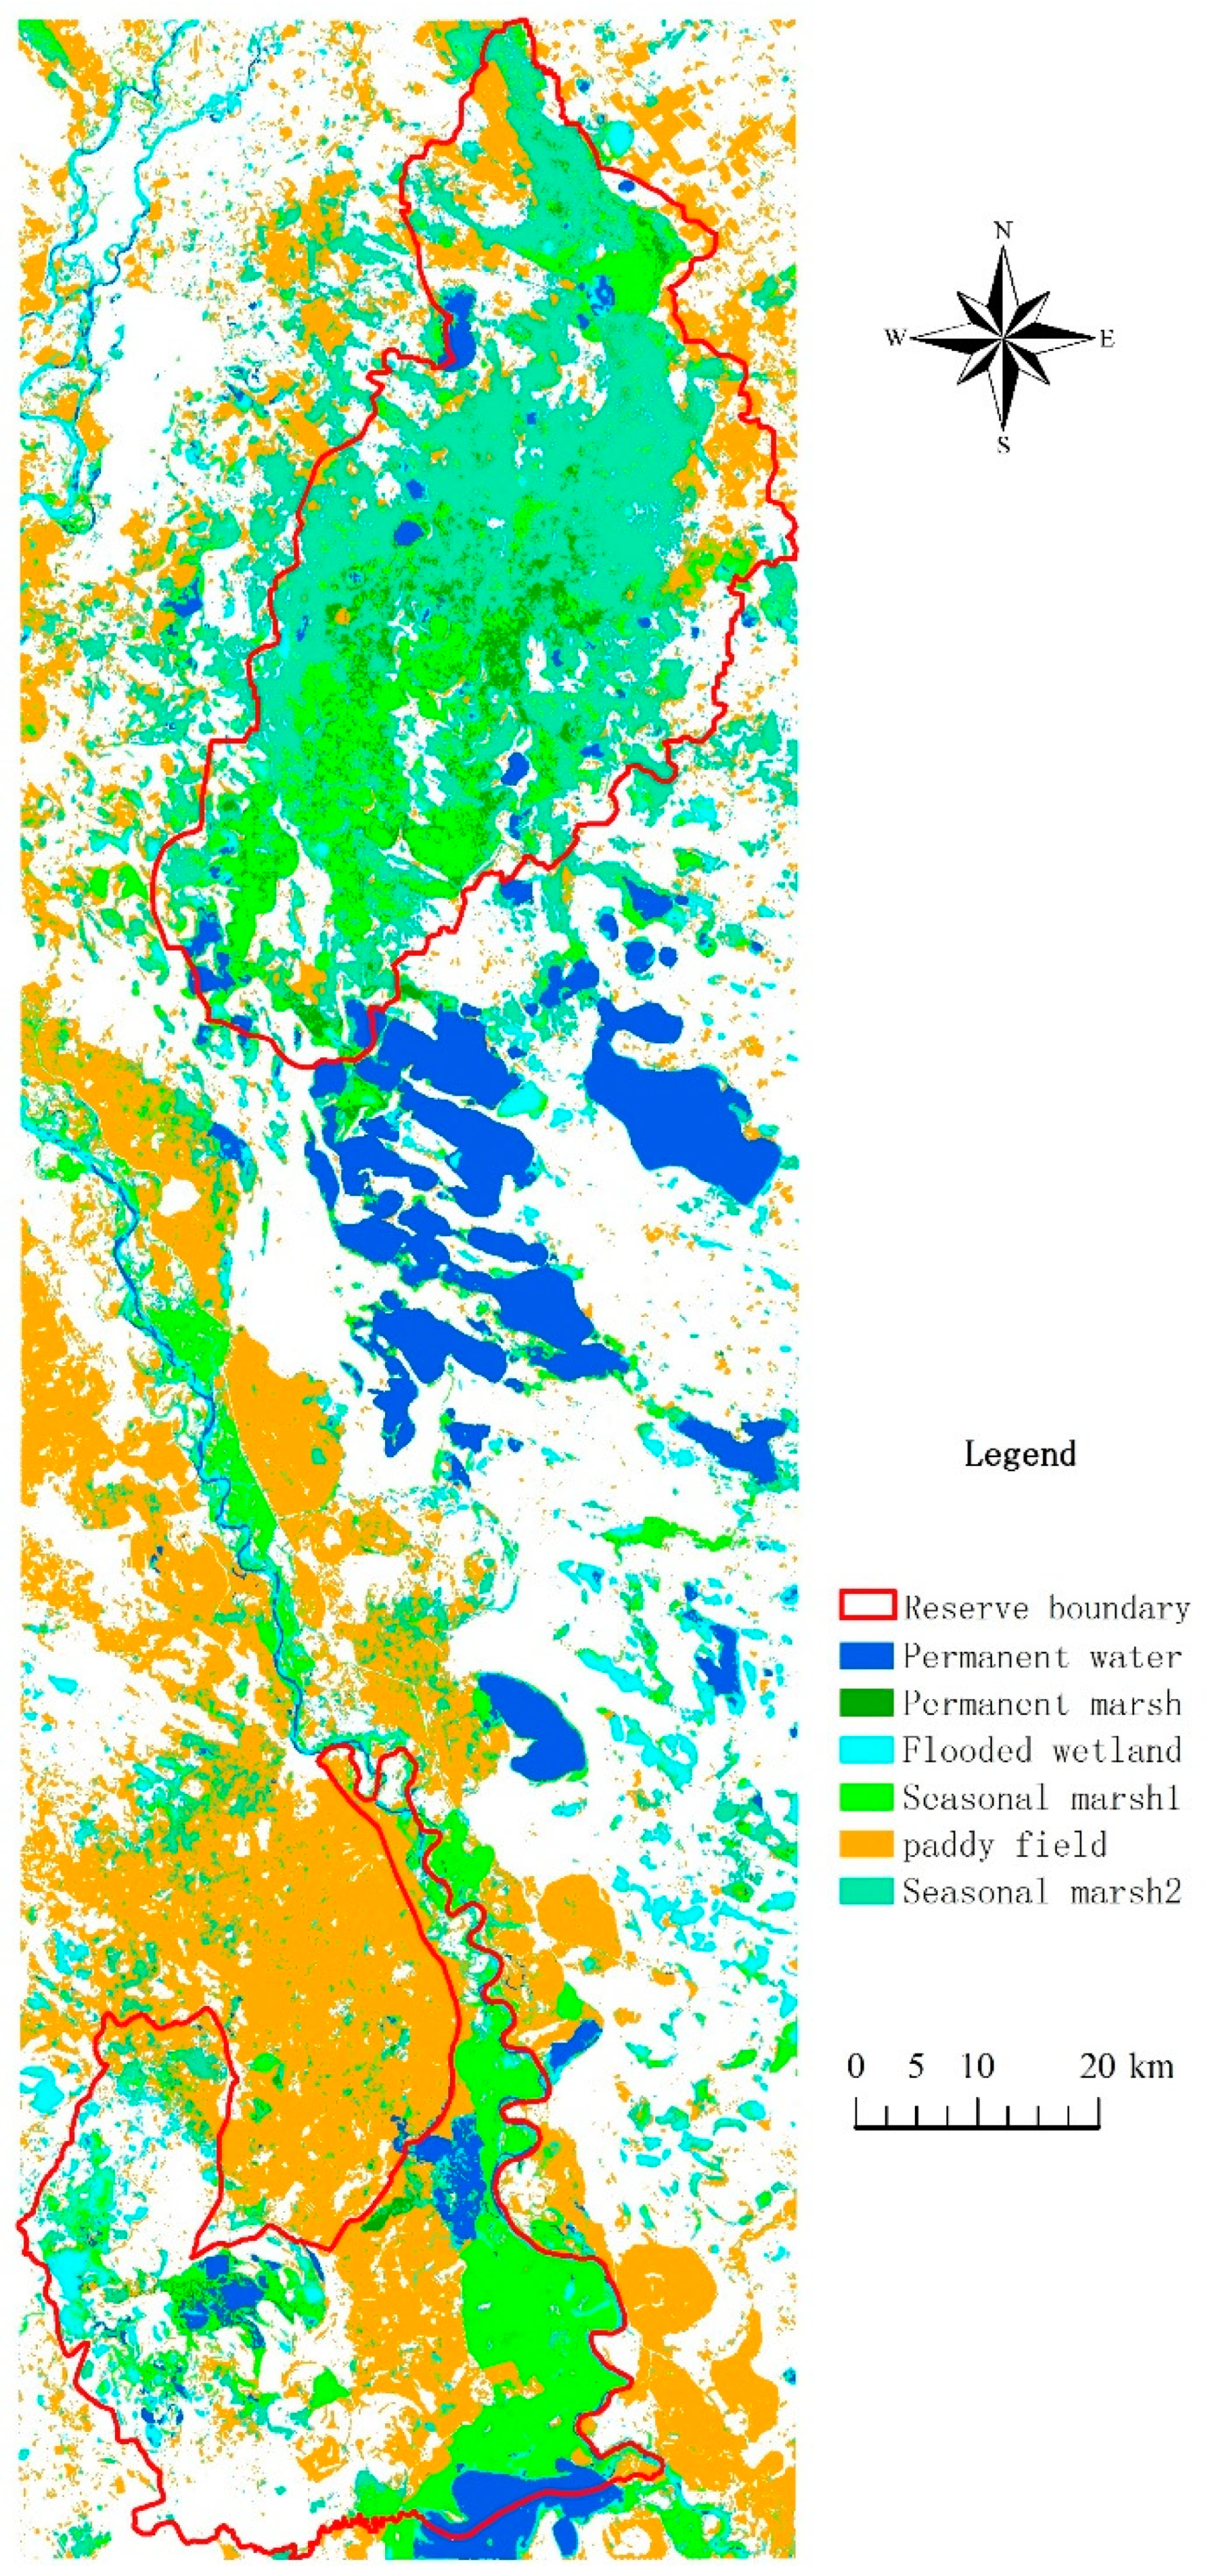
Figure 10.
Areal ratio of each wetland type in Zhalong National Nature Reserve and Momoge National Nature Reserve.
Figure 10.
Areal ratio of each wetland type in Zhalong National Nature Reserve and Momoge National Nature Reserve.
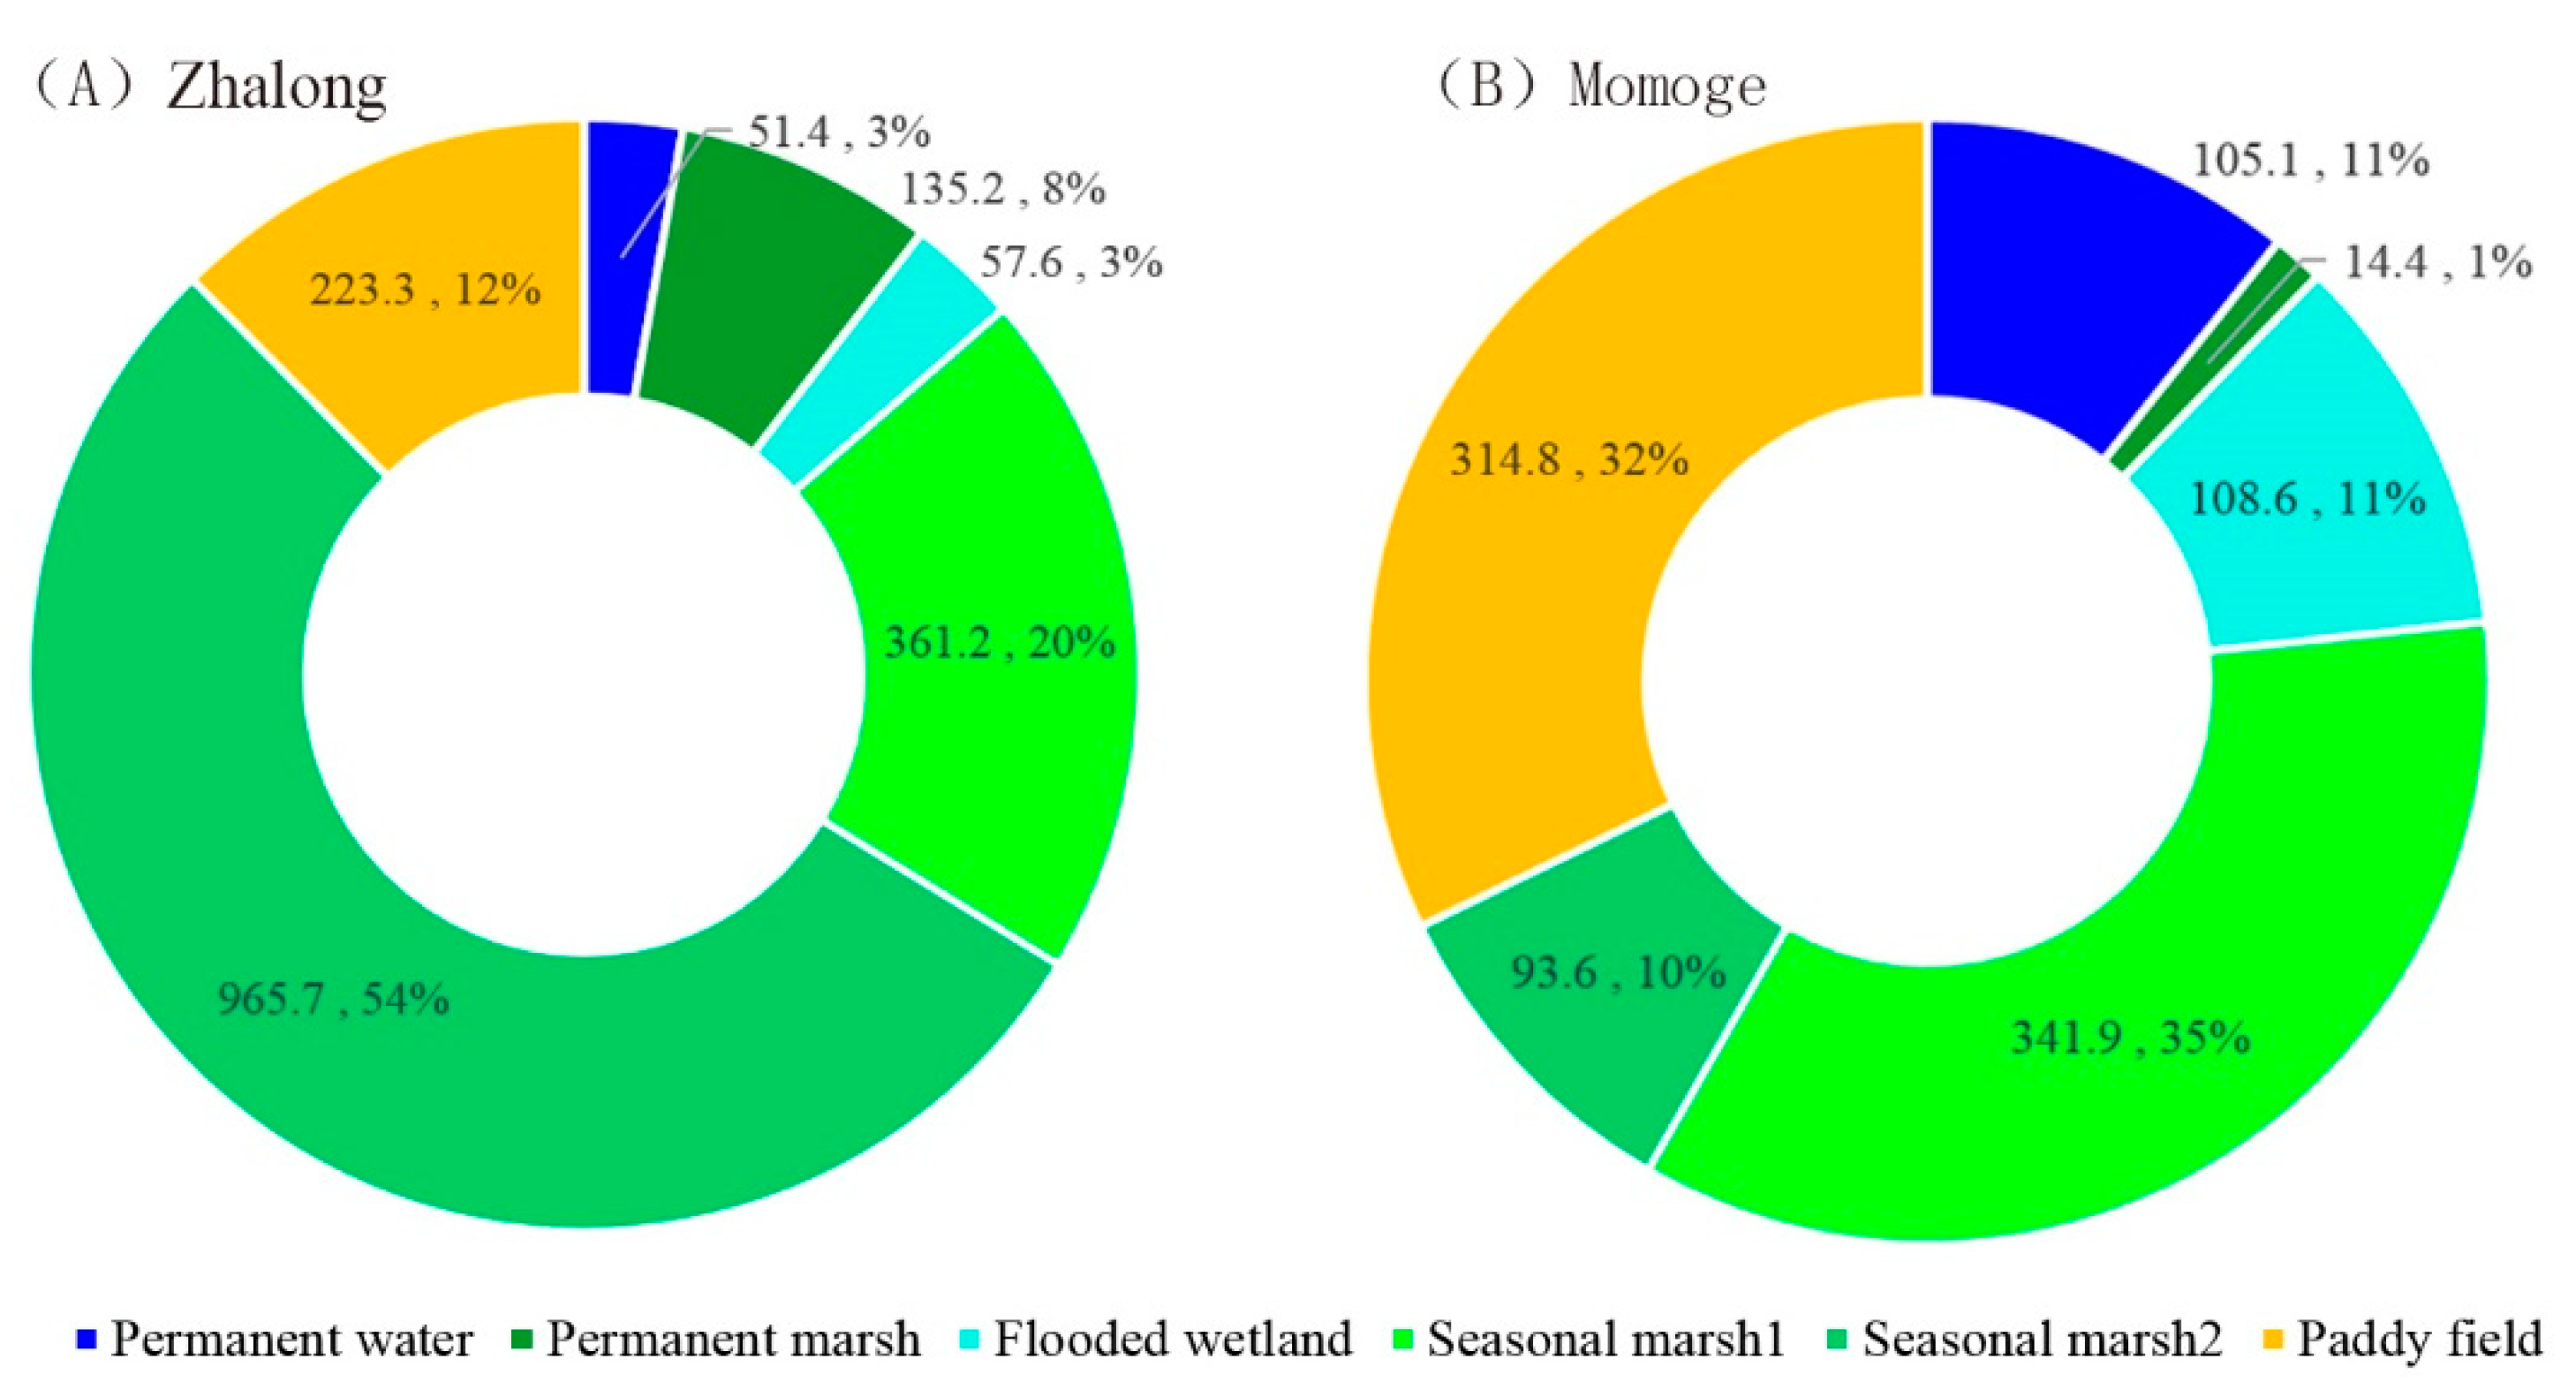
Figure 11.
Comparison between our resultant wetland map and the European Space Agency (ESA) World Cover map. (a) Location of the second subset in our study area (false colour image created from 15-day Sentinel-2 composited image between 1 and 15 May). (b) False colour image for the second subset (15-day Sentinel-2 composited image between 16 and 30 June). (c) False colour image for the second subset (15-day Sentinel-2 composited image between 16 and 30 September). (d) False colour image for the second subset (15-day Sentinel-2 composited image between 1 and 15 November). (e,f) Wetland mapping result using seasonal-rule-based wetland classification method. (g,h) ESA World Cover map for the second subset. (A–D) 15-day Sentinel-2 composited NDVI time series curves for points A, B, C, and D in (f,h). Note: The times marked in the figure are the first dates of the 15-day Sentinel-2 composite images.
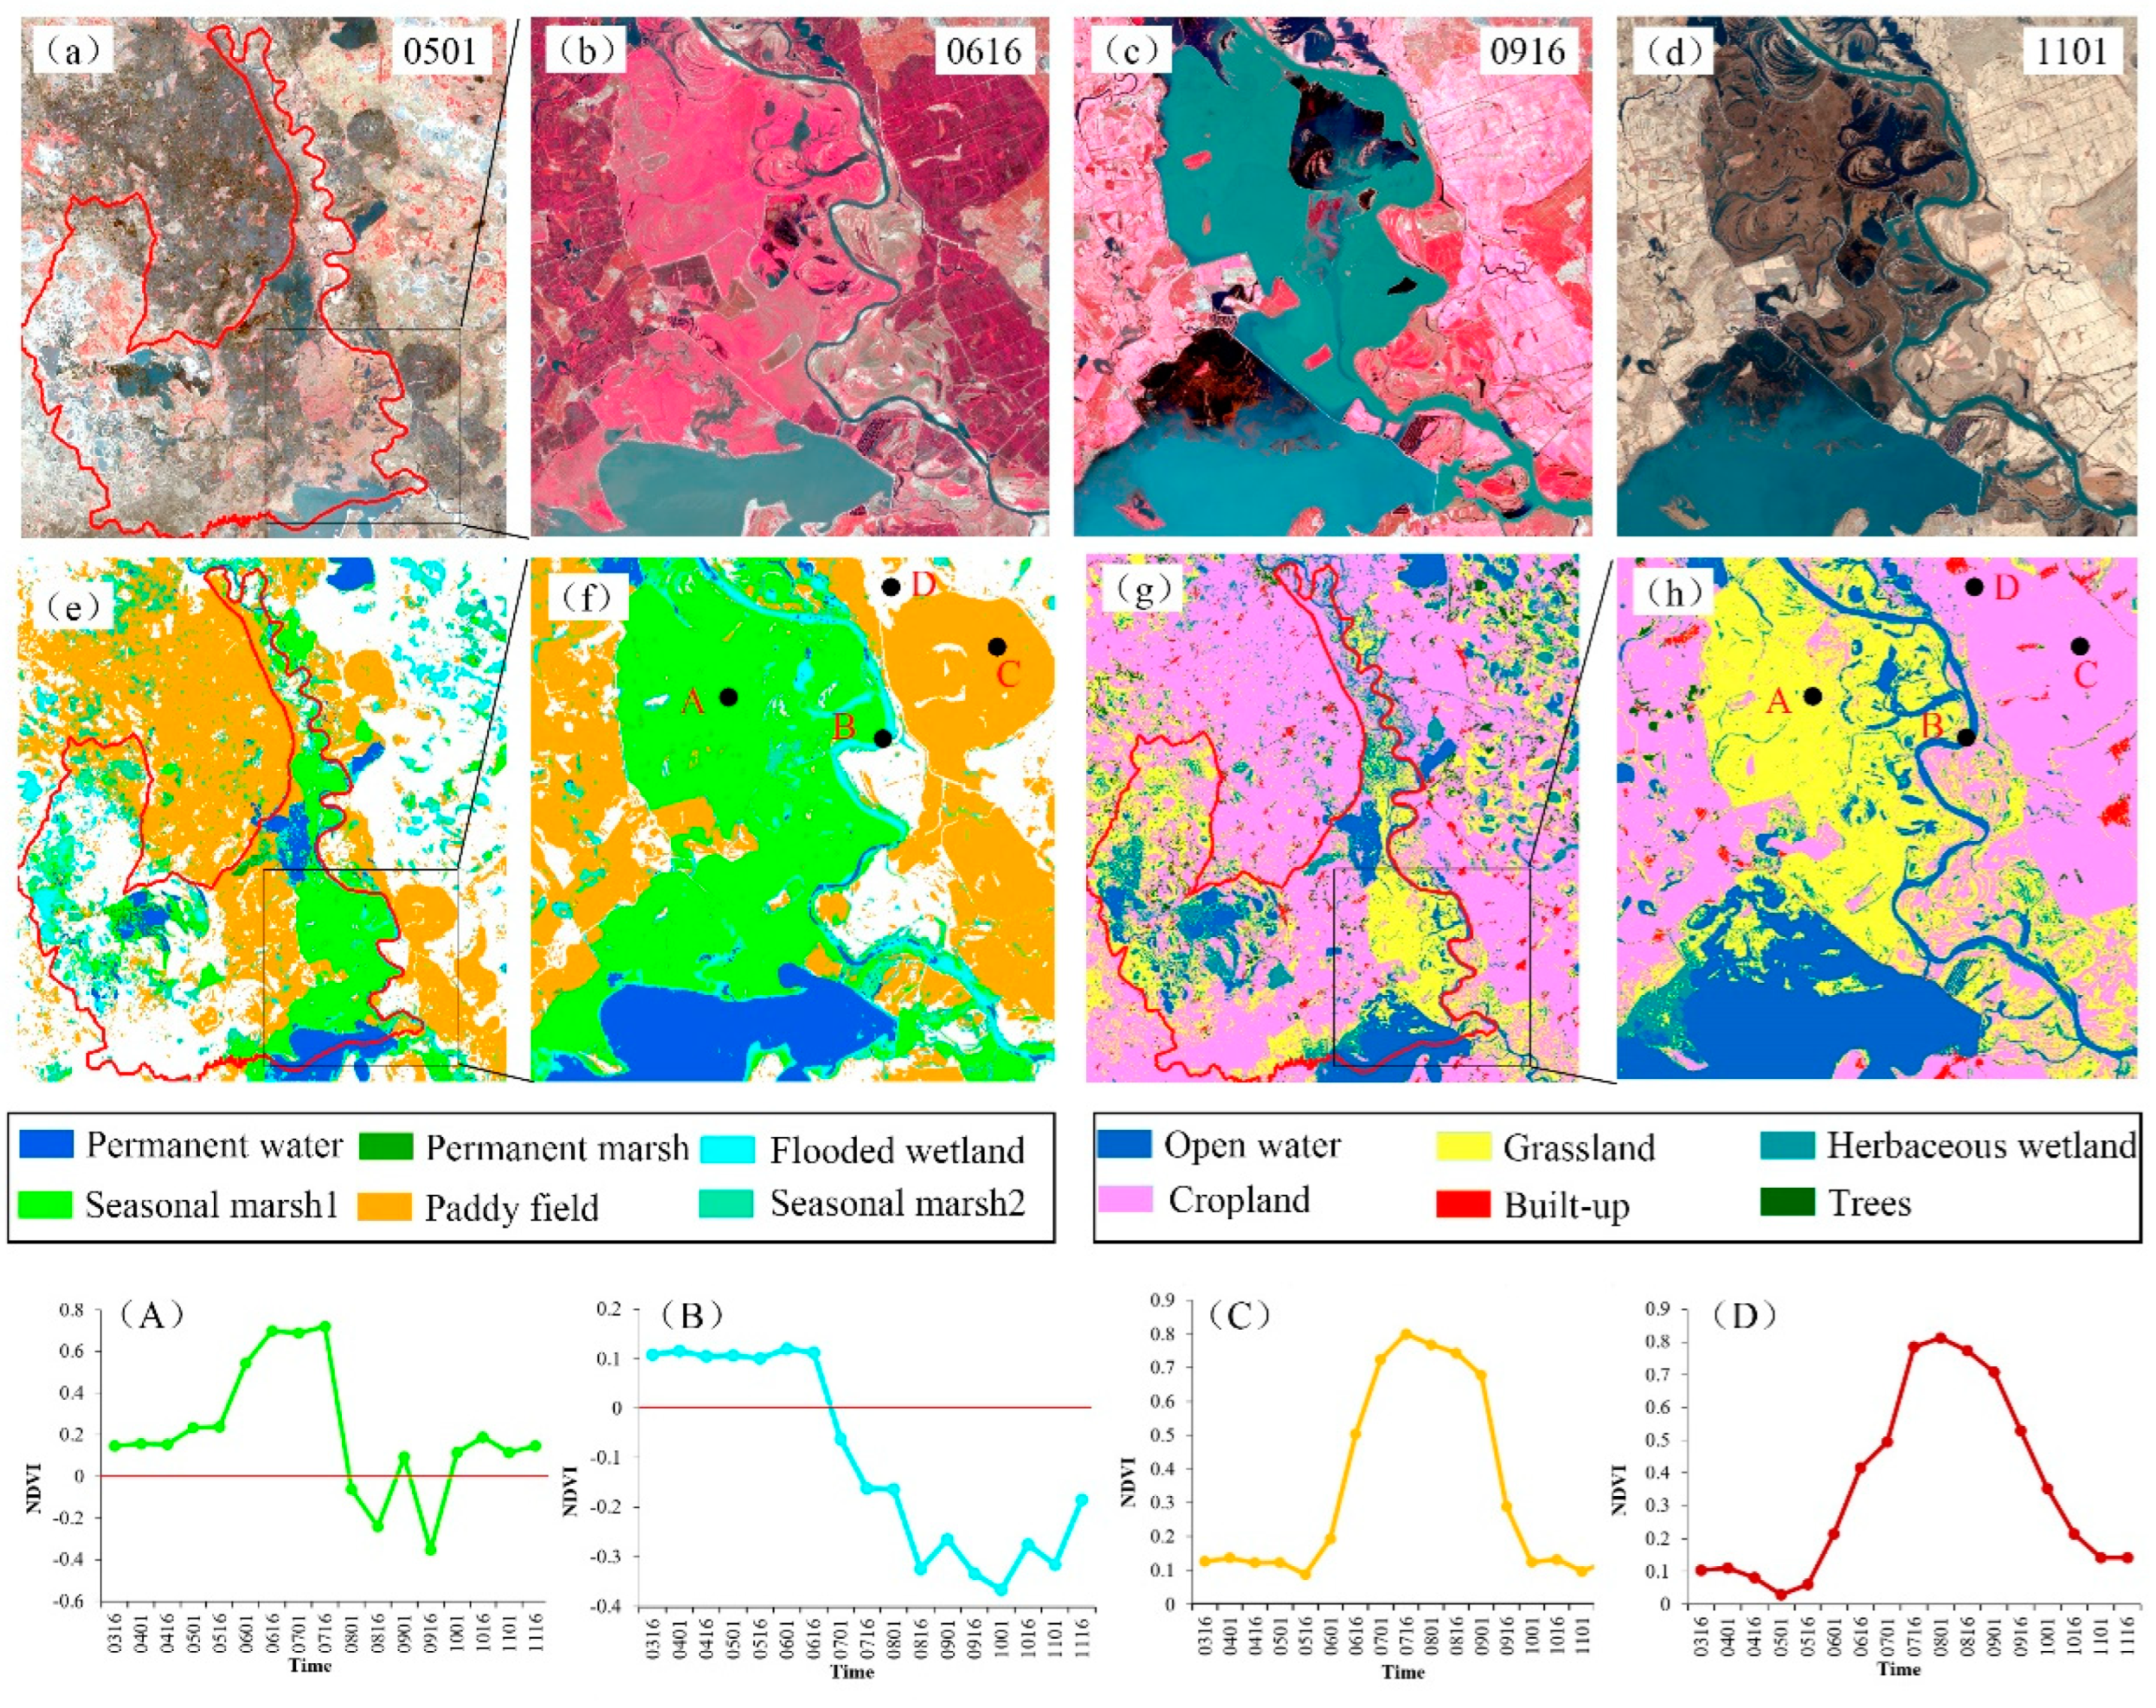
Figure 12.
Seasonal marsh1 in different areas. (a) Location of the third subset in our study area (false colour image created from 15-day Sentinel-2 composited image between 16 and 31 July). (b) False colour image and our classification result for the third subset. (A) 15-day Sentinel-2 composited NDVI time series curves for the red point in Figure 12b. (c) Location of the fourth subset in our study area (false colour image created from 15-day Sentinel-2 composited image between 16 and 30 June). (d) False colour image and our classification result for the fourth subset. (B) 15-day Sentinel-2 composited NDVI time series curves for the red point in Figure 12d. Note: The times marked in the figure are the first dates of the 15-day Sentinel-2 composite images.

Table 1.
Annual wetland classification system.
| Level 1 | Code | Level 2 | Code | Definition and Description |
|---|---|---|---|---|
| Wetlands | 1 | Permanent water | 11 | Submerged throughout the year. |
| Permanent marsh | 12 | Contains areas of herbaceous marsh throughout the entire year. | ||
| Flooded wetland | 13 | Supersaturated soil near rivers or lake, vegetation coverage < 30%, no open water. | ||
| Seasonal marsh1 | 14 | Marshes that do not hold marsh continuously and are water bodies during parts of the year. | ||
| Seasonal marsh2 | 15 | Marshes that do not hold marsh continuously and are bare land during parts of the year. | ||
| Paddy field | 16 | Crops grow submerged in water, such as paddy | ||
| Uplands | 2 | Snow | 21 | Perennial snow |
| Forest/shrub | 22 | Forest or scrub | ||
| Grass | 23 | Pasture and natural grassland | ||
| Human-made cover or bare land | 24 | Artificial cover including buildings, roads, etc. bare land including bedrock, sand, bare soil, etc. | ||
| Dry farmland | 25 | Artificial vegetation growing on dry land. |
Table 2.
Confusion matrix measuring the accuracy of the annual wetland classification result based on seasonal-rule-based wetland classification method. Note: The land cover types corresponding to the codes are shown in Table 1.
Table 2.
Confusion matrix measuring the accuracy of the annual wetland classification result based on seasonal-rule-based wetland classification method. Note: The land cover types corresponding to the codes are shown in Table 1.
| Reference Data | ||||||||||
|---|---|---|---|---|---|---|---|---|---|---|
| Classification Data | Code | 11 | 12 | 13 | 14 | 15 | 16 | 2 | Total | UA |
| 11 | 124 | 5 | 1 | 130 | 95.4% | |||||
| 12 | 31 | 1 | 3 | 3 | 38 | 81.6% | ||||
| 13 | 8 | 70 | 3 | 81 | 86.4% | |||||
| 14 | 1 | 2 | 4 | 81 | 1 | 5 | 1 | 95 | 85.3% | |
| 15 | 3 | 44 | 1 | 5 | 53 | 83.0% | ||||
| 16 | 2 | 3 | 1 | 142 | 15 | 163 | 87.1% | |||
| 2 | 3 | 5 | 7 | 235 | 250 | 94.0% | ||||
| Total | 133 | 38 | 79 | 89 | 54 | 158 | 259 | 810 | ||
| PA | 93.2% | 81.6% | 88.6% | 91.0% | 81.5% | 89.9% | 90.7% | |||
Table 3.
Confusion matrix measuring the accuracy of the annual wetland classification result based on traditional supervised classification. Note: The land cover types corresponding to the codes are shown in Table 1.
Table 3.
Confusion matrix measuring the accuracy of the annual wetland classification result based on traditional supervised classification. Note: The land cover types corresponding to the codes are shown in Table 1.
| Reference Data | ||||||||||
|---|---|---|---|---|---|---|---|---|---|---|
| Classification Data | Code | 11 | 12 | 13 | 14 | 15 | 16 | 2 | Total | UA |
| 11 | 117 | 6 | 3 | 1 | 1 | 2 | 130 | 90.0% | ||
| 12 | 28 | 2 | 5 | 3 | 38 | 73.7% | ||||
| 13 | 10 | 1 | 62 | 1 | 1 | 12 | 87 | 71.3% | ||
| 14 | 4 | 3 | 6 | 64 | 2 | 10 | 1 | 90 | 71.1% | |
| 15 | 4 | 5 | 38 | 2 | 5 | 54 | 70.4% | |||
| 16 | 2 | 10 | 3 | 126 | 21 | 162 | 77.8% | |||
| 2 | 2 | 5 | 4 | 5 | 15 | 218 | 249 | 87.6% | ||
| Total | 133 | 38 | 79 | 89 | 54 | 158 | 259 | 810 | ||
| PA | 88.0% | 73.7% | 78.5% | 71.9% | 70.4% | 79.7% | 84.2% | |||
Publisher’s Note: MDPI stays neutral with regard to jurisdictional claims in published maps and institutional affiliations. |
© 2022 by the authors. Licensee MDPI, Basel, Switzerland. This article is an open access article distributed under the terms and conditions of the Creative Commons Attribution (CC BY) license (https://creativecommons.org/licenses/by/4.0/).
Share and Cite
MDPI and ACS Style
Xing, L.; Niu, Z.; Jiao, C.; Zhang, J.; Han, S.; Cheng, G.; Wu, J. A Novel Workflow for Seasonal Wetland Identification Using Bi-Weekly Multiple Remote Sensing Data. Remote Sens. 2022, 14, 1037. https://doi.org/10.3390/rs14041037
AMA Style
Xing L, Niu Z, Jiao C, Zhang J, Han S, Cheng G, Wu J. A Novel Workflow for Seasonal Wetland Identification Using Bi-Weekly Multiple Remote Sensing Data. Remote Sensing. 2022; 14(4):1037. https://doi.org/10.3390/rs14041037
Chicago/Turabian StyleXing, Liwei, Zhenguo Niu, Cuicui Jiao, Jing Zhang, Shuqing Han, Guodong Cheng, and Jianzhai Wu. 2022. "A Novel Workflow for Seasonal Wetland Identification Using Bi-Weekly Multiple Remote Sensing Data" Remote Sensing 14, no. 4: 1037. https://doi.org/10.3390/rs14041037
Note that from the first issue of 2016, this journal uses article numbers instead of page numbers. See further details here.