
Identifying Precarious Settlements and Urban Fabric Typologies Based on GEOBIA and Data Mining in Brazilian Amazon Cities

 , , ,
, , ,  and
and
Abstract
:1. Introduction
2. Identification of Brazilian Precarious Settlements by Geotechnologies
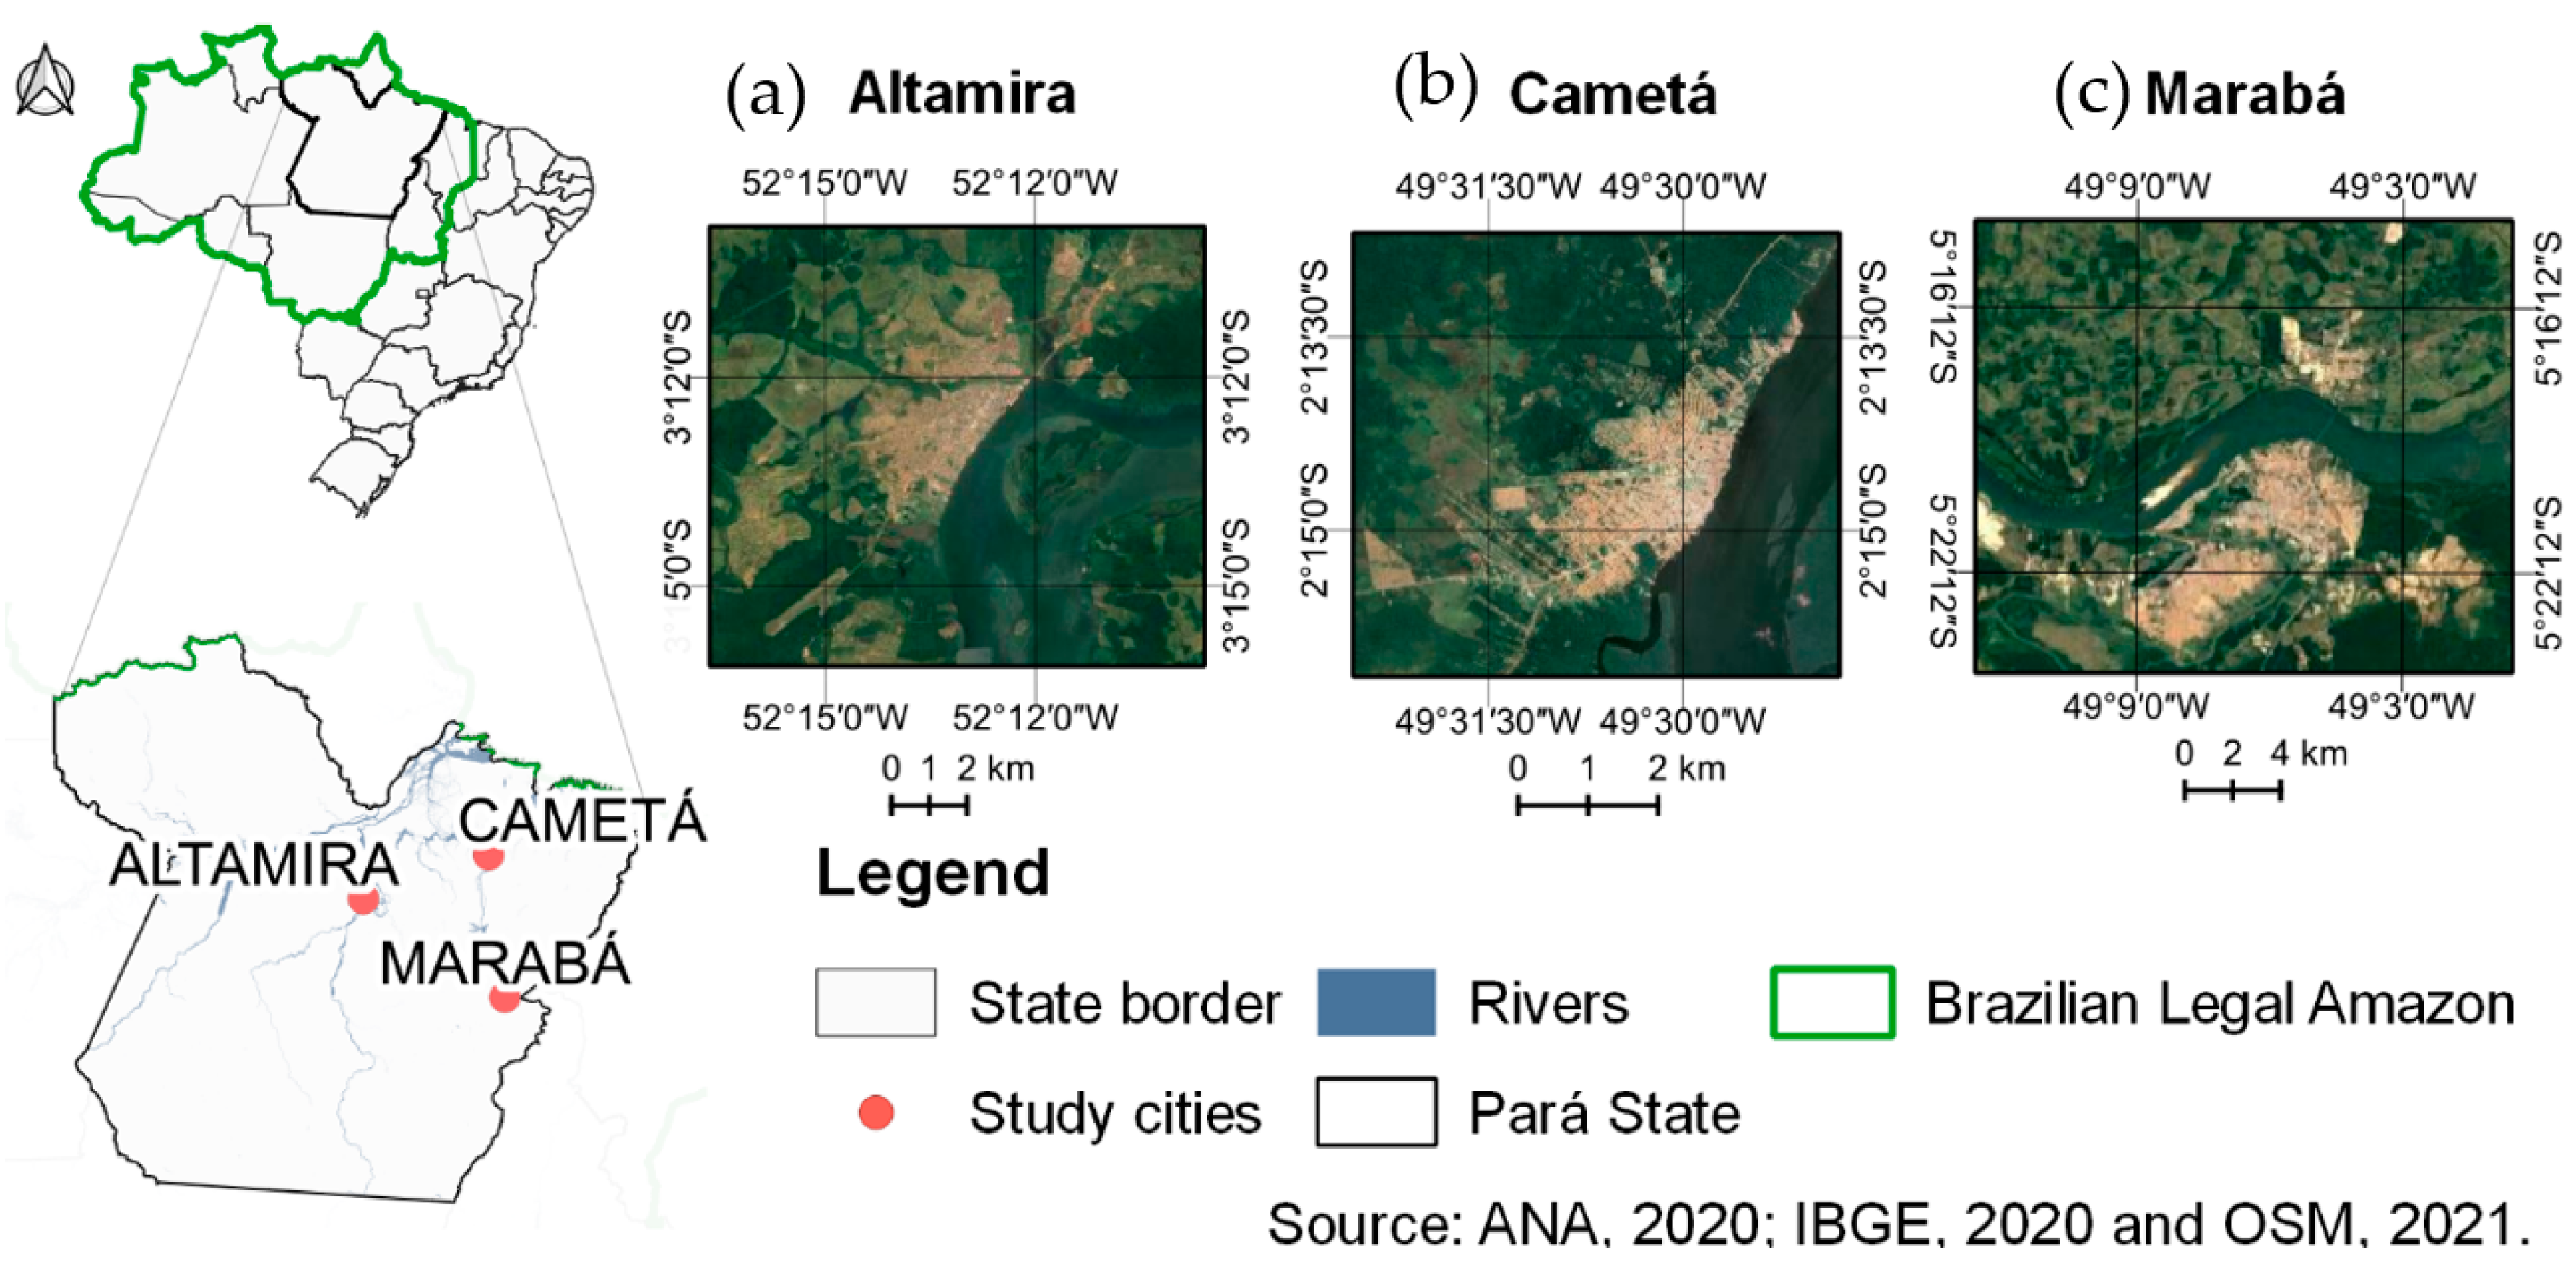
3. Precarious Settlements in the Brazilian Amazon
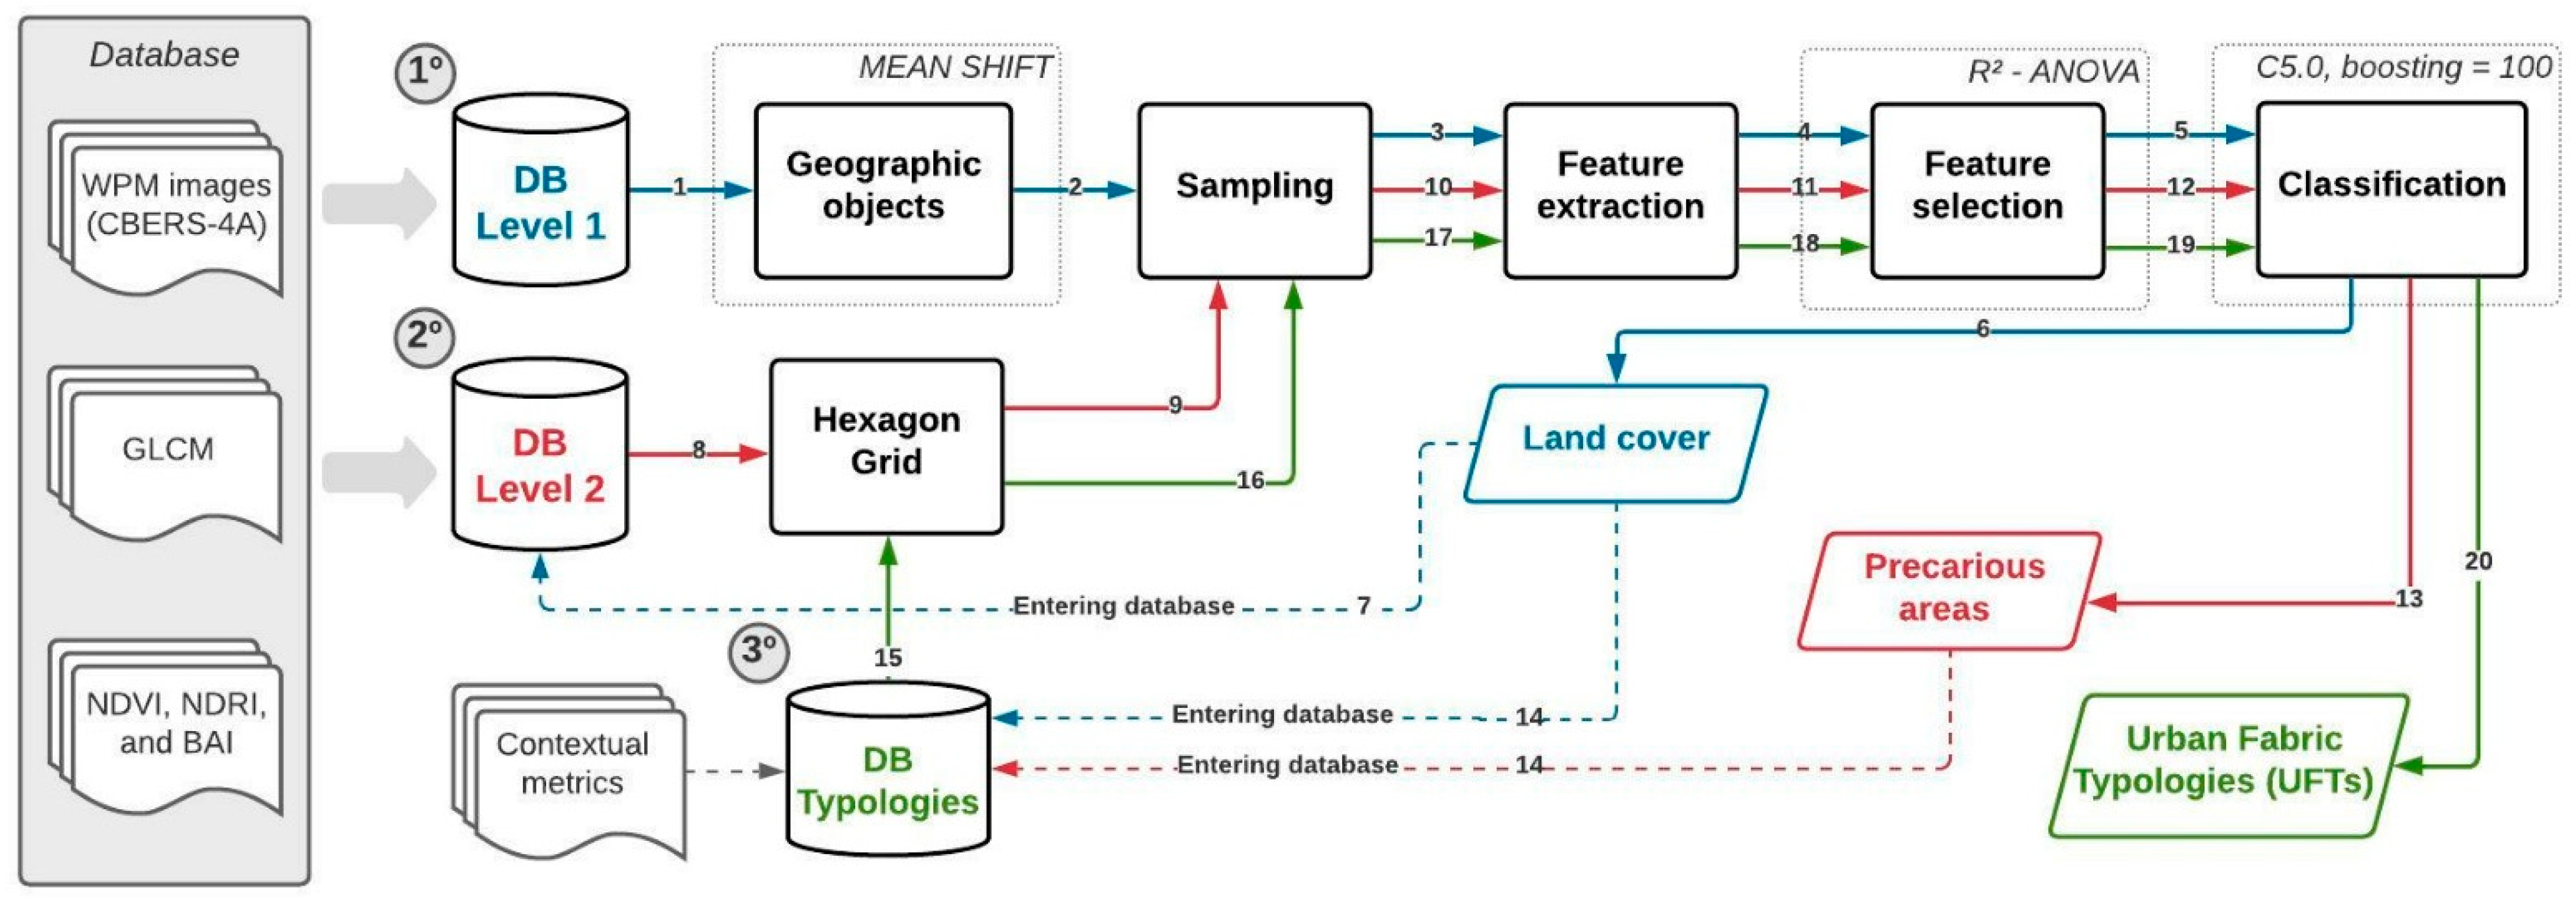
4. Materials and Methods
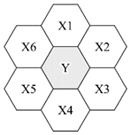
4.1. Preprocessing
- QGIS [62]: for image clipping, PCA fusions, image registration, calculation of biophysical index and textural index, creation of hexagon grids, and production of thematic maps;
- Orfeo ToolBox [63]: segmentation of WPM images;
- Geographical Data Mining Analyst (GeoDMA) [64]: for feature extractions and estimation of the classification model by applying the C5.0 algorithm.
- (a)
- Normalized difference vegetation index (NDVI): division of the near-infrared (NIR) band by the red band, normalized, to analyze the presence and condition of vegetation [65] (Equation (1)):
- (b)
- Normalized difference roof index (NDRI): division of the red band by the blue band, normalized, to identify the presence of ceramic roofs and areas with exposed soil [66] (Equation (2)):
- (C)
- Bare soil area index (BAI): the normalized division of the blue band by the near-infrared band, to identify exposed soil [46] (Equation (3)):
4.2. Preparation of the Land Cover Database
- Boosting value: number of trees. We adopted a value of 100 trees for boosting.
- Minimum cases: the minimum number of samples required to split an internal node. We chose a minimum value of 2.
- Training samples proportion: the proportion of samples labeled for training. We adopted 70% of the labeled samples for training and 30% for validation.
4.3. Identification of Precarious Areas
 | |
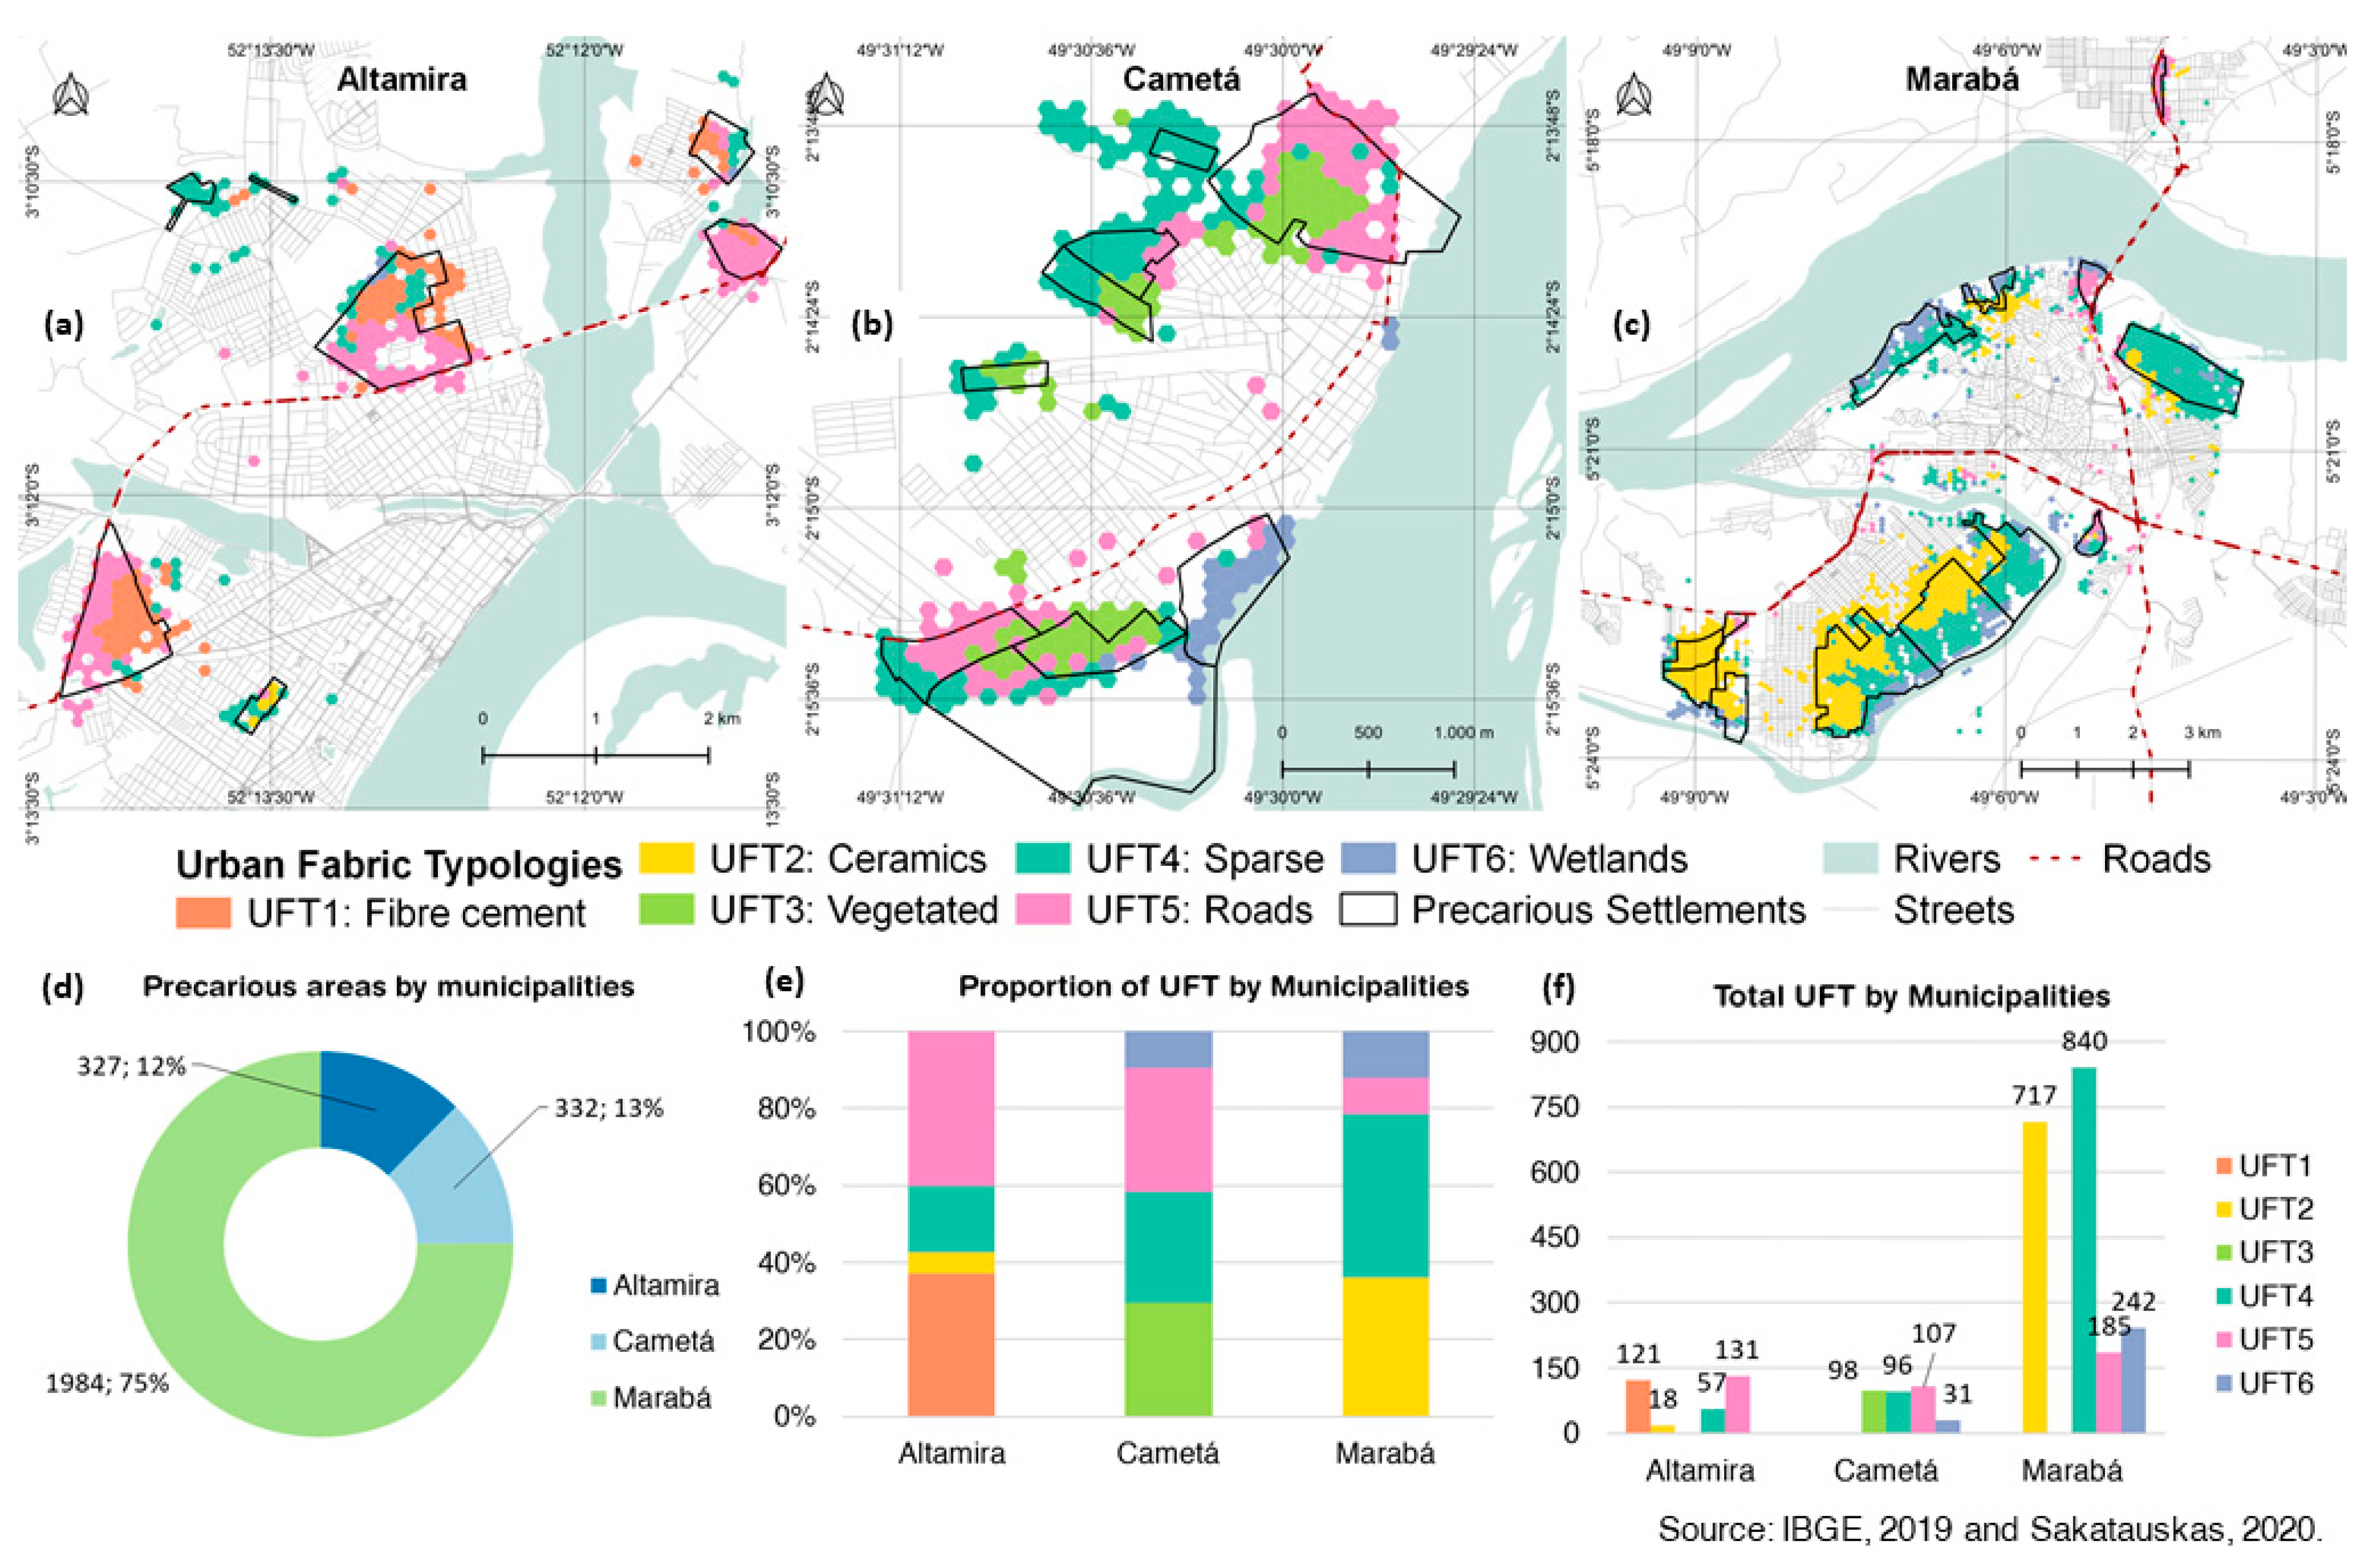
4.4. Characterization and Identification of Urban Fabric Typologies (UFT) in Precarious Areas
4.5. Validation
5. Results
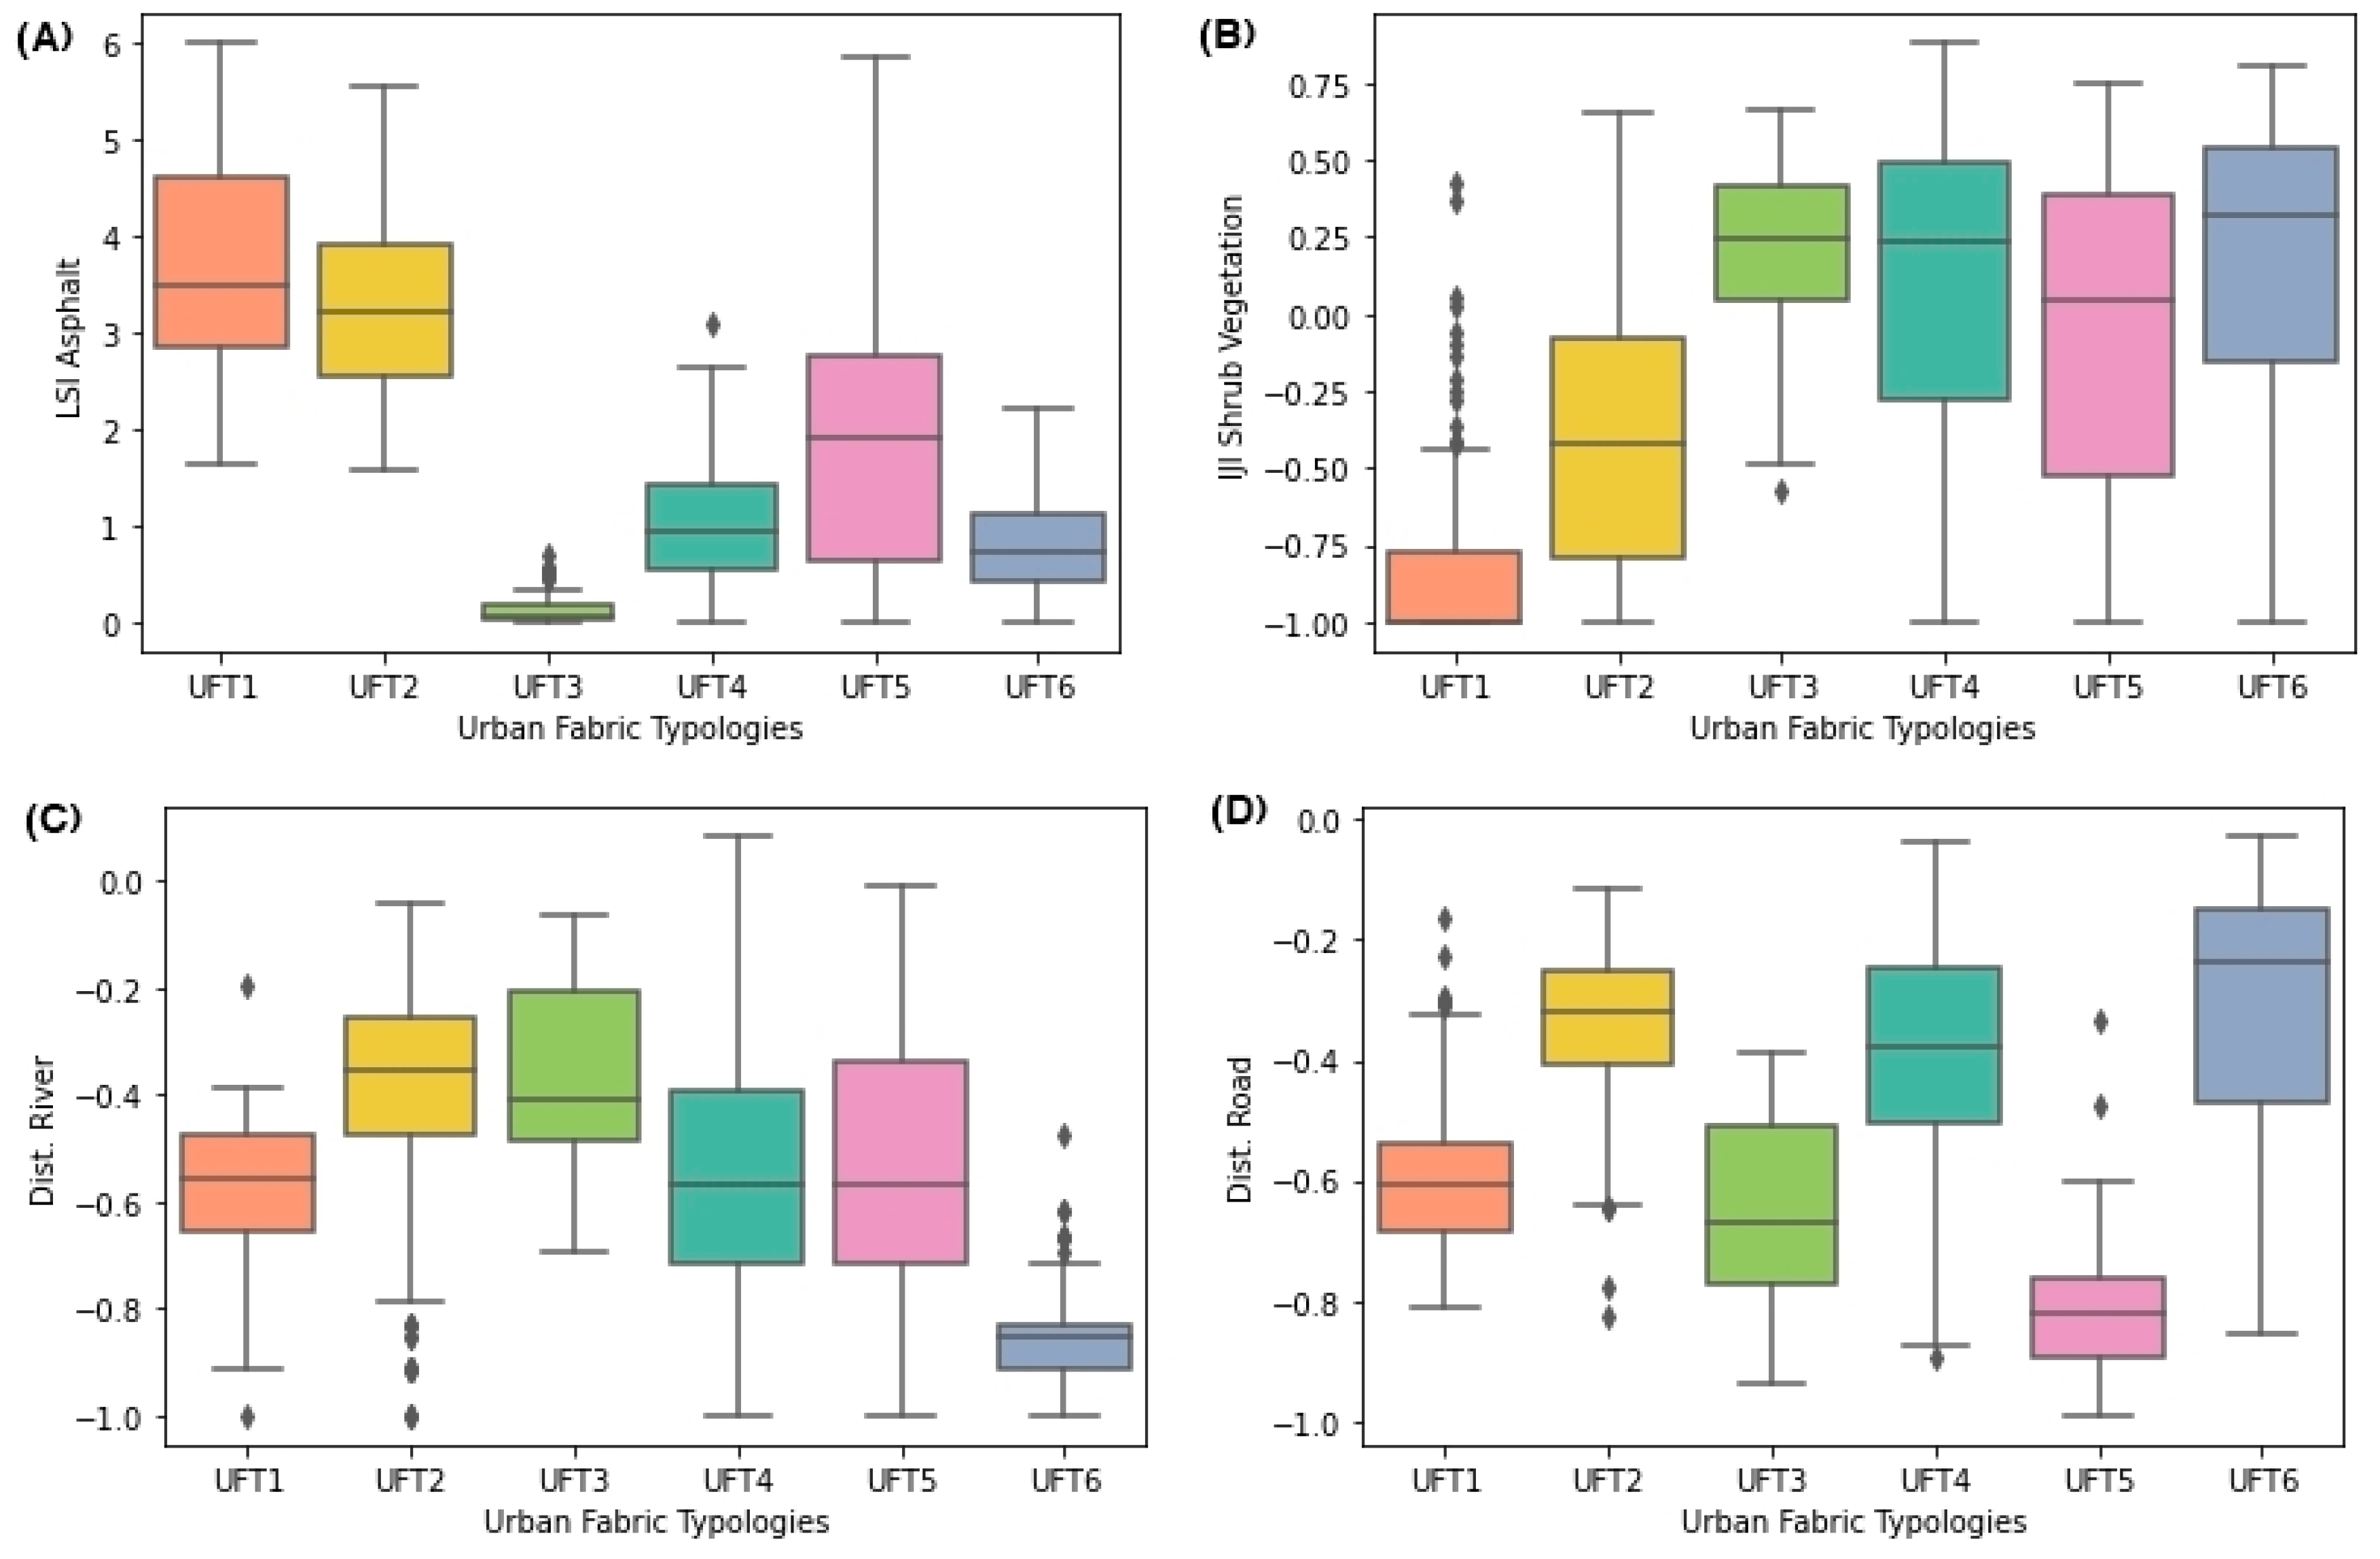
- LSI Asphalt: The landscape shape index (LSI) of the “Asphalt” class, which measures the complexity of shape by dividing the perimeter by twice the square root of the area multiplied by π (Equation (7)). This index quantifies the amount of edge present in a landscape relative to what would be present in a landscape of the same size but with a simple geometric shape (circle in vector, square in raster) and no internal edge. Equation (7) shows the LSI calculation:
- PD Exposed Soil and PD Roads: The patch density (PD) of the “Exposed Soil” and “Roads” classes, which represents the number of patches divided by the total patch area. Equation (8) shows the PD calculation:
- MSI Herbaceous Vegetation: The mean shape index (MSI) of the “Herbaceous Vegetation” class. Equation (9) shows the MSI calculation:
- NP Herbaceous Vegetation: The number of patches (NP) of “Herbaceous Vegetation” class;
- AWMPFD Herbaceous Vegetation: The area-weighted average fractal dimension (AWMPFD) of “Herbaceous Vegetation” class; AWMPFD equals the average patch fractal dimension of patches of the corresponding patch type, weighted by patch area so that larger patches weigh more than smaller patches [79]. Equation (10) shows the AWMSI calculation:
- IJI Shrub Vegetation: The interspersion and juxtaposition index (IJI) of the “Shrub Vegetation” class, which measures whether a particular patch type is adjacent to one or more classes. Equation (11) shows the IJI, with m being the perimeter of all edge segments involving the corresponding patch type:
- TABO Water and TABOCeramic Roof: Total area of the largest object (TABO) of the “Water” and “Ceramic Roof” classes that cross the landscape.
- Euclidean distance from a cell’s centroid to the nearest river;
- Euclidean distance from a cell’s centroid to the nearest road.
6. Discussion
7. Conclusions
Author Contributions
Funding
Data Availability Statement
Acknowledgments
Conflicts of Interest
References
- Un-Habitat. World Cities Report 2016: Urbanization and Development–Emerging Futures; United Nations Human Settlements Programme: Nairobi, Kenyav, 2016; Available online: https://unhabitat.org/world-cities-report (accessed on 29 October 2021).
- Unstats. SDG Indicators: Make Cities and Human Settlements Inclusive, Safe, Resilient and Sustainable. Available online: https://unstats.un.org/sdgs/report/2019/goal-11 (accessed on 31 October 2021).
- BRASIL. Lei No. 11.124. 2005. Available online: http://www.planalto.gov.br/ccivil_03/_ato2004-2006/2005/lei/l11124.htm (accessed on 31 October 2021).
- BRASIL. Guia para o Mapeamento e Caracterização de Assentamentos Precários; Ministério das Cidades: Brasilia, Brazil, 2010; Volume 1. [Google Scholar]
- Maricato, E. Autoconstrução, a Arquitetura Possível. A Produção Capitalista da Casa (e da cidade) no Brasil industrial. 1982. Available online: https://erminiamaricato.files.wordpress.com/2012/03/a-produccca7acc83o-capitalista-da-casa-e-da-cidade-no-brasil-industrial.pdf (accessed on 31 October 2021).
- Denaldi, R.; Rosa, J.S. Ações Integradas de Urbanização de Assentamentos Precários. Brasilia: Ministério das Cidades/Cities Alliance. 2010. Available online: https://bibliotecadigital.seplan.planejamento.gov.br/handle/iditem/272 (accessed on 31 October 2021).
- Abreu, M.A. Reconstruindo uma história esquecida: Origem e expansão inicial das favelas do Rio de Janeiro. Espaço Debates 1994, 14, 34–46. [Google Scholar]
- Vaz, L.F. Dos cortiços às favelas e aos edifícios de apartamentos—a modernização da moradia no Rio de Janeiro. Análise Social 1994, 29, 581–597. [Google Scholar]
- Pasternak, S. São Paulo e suas favelas. Pós Rev. Programa Pós-Grad. Arquitetura Urban. FAUUSP 2006, 19, 176–197. [Google Scholar] [CrossRef]
- Queiroz Filho, A.P. As definições de assentamentos precários e favelas e suas implicações nos dados populacionais: Abordagem da análise de conteúdo. Urbe Rev. Bras. Gestão Urbana 2015, 7, 340–353. [Google Scholar] [CrossRef] [Green Version]
- Santana, J.V.; Holanda, A.C.G.; de Moura, A.D.S.F. A questão da habitação em municípios periurbanos na Amazônia. Ed. UFPA 2012, 1, 1–400. [Google Scholar]
- Sakatauskas, G.D.L.B.; Santana, J.V. ST 2 Particularidades Das Habitações Nos Pequenos Municípios Paraenses. An. ENANPUR. 2015, 16, 1–14. [Google Scholar]
- Sakatauskas Gdlb. Especificidades da Precariedade Habitacional na Amazônia Ribeirinha: Um Olhar Sobre a Região do Baixo Tocantins; Sakatauskas Gdlb: São Bernardo do Campo, Brazil, 2020. [Google Scholar]
- Nakano, A.K. Desenvolvimento Urbano e Territorial em Municípios Periurbanos: Diferenciações no Universo dos Municípios brasileiros. Proposta 2012, 35, 1–60. [Google Scholar]
- Becker, B. A Urbe Amazônida, 1st ed.; Garamound: Rio de Janeiro, Brazil, 2013; Volume 1, pp. 1–88. [Google Scholar]
- Morais, M.D.P.E.; Krause, C.H.; Lima Neto, V.C. Caracterização e Tipologia de Assentamentos Precários: Estudos de Caso Brasileiros; Instituto de Pesquisa Econômica Aplicada; Ipea: Brasília, Brazil, 2016; Volume 1, pp. 1–548. [Google Scholar]
- Kuffer, M.; Pfeffer, K.; Sliuzas, R. Slums from space—15 years of slum mapping using remote sensing. Remote Sens. 2016, 8, 455. [Google Scholar] [CrossRef] [Green Version]
- Instituto Brasileiro de Geografia e Estatística. Censo 2000: A Divulgação dos Resultados. IBGE. 2010. Available online: https://www.ibge.gov.br/censo/divulgacao.shtm (accessed on 1 November 2021).
- Instituto Brasileiro De Geografia E Estatística. Censo Demográfico 2010. Rio de Janeiro. 2011. Available online: https://biblioteca.ibge.gov.br/visualizacao/periodicos/93/cd_2010_caracteristicas_populacao_domicilios.pdf (accessed on 1 November 2021).
- Centro de Estudos da Metropole-Cem, Cebrap. Assentamentos Precários no Brasil Urbano. Brasília. 2007. Available online: https://direito.mppr.mp.br/arquivos/File/relatorio-assentamentos-precatorios-no-brasil-urbano.pdf (accessed on 1 November 2021).
- Centro de Estudos da Metropole-Cem, Cebrap. Diagnóstico dos Assentamentos Precários nos Municípios da Macrometrópole Paulista. São Paulo. 2013. Available online: https://centrodametropole.fflch.usp.br/pt-br/downloads-de-dados/assentamentos-precarios-2013 (accessed on 1 November 2021).
- Mahabir, R.; Croitoru, A.; Crooks, A.T.; Agouris, P.; Stefanidis, A. A critical review of high and very high-resolution remote sensing approaches for detecting and mapping slums: Trends, challenges and emerging opportunities. Urban Sci. 2018, 2, 8. [Google Scholar] [CrossRef] [Green Version]
- Duque, J.C.; Royuela, V.; Noreña, M. A Stepwise Procedure to Determinate a Suitable Scale for the Spatial Delimitation of Urban Slums. In Defining the Spatial Scale in Modern Regional Analysis; Springer: Berlin/Heidelberg, Germany, 2012; pp. 237–254. [Google Scholar]
- Gonçalves, G. Identificação de Assentamentos Precários na Região do Grande ABC: Uma Abordagem Estatística; UFABC: Santo André, Brazil, 2018. [Google Scholar]
- Galeon, F. Estimation of population in informal settlement communities using high resolution satellite image. In Proceedings of the XXI ISPRS Congress, Commission IV, Beijing, China, 5–9 July 2008; pp. 1377–1381. [Google Scholar]
- Karekezi, S.; Kimani, J.; Onguru, O. Energy access among the urban poor in Kenya. Energy Sustain. Dev. 2008, 12, 38–48. [Google Scholar] [CrossRef]
- Alves, M.C.G.P.; Morais, M.D.L.S.; Escuder, M.M.L.; Goldbaum, M.; Barros, M.B.D.A.; Cesar, C.L.G.; Carandina, L. Household sampling in slums in surveys. Rev. Saude Publica 2011, 45, 1099–1109. [Google Scholar] [CrossRef] [PubMed] [Green Version]
- Henderson, J.V.; Storeygard, A.; Weil, D.N. Measuring Economic Growth from Outer Space. Am. Econ. Rev. 2012, 102, 994–1028. [Google Scholar] [CrossRef] [PubMed] [Green Version]
- Novo, E.M.L.D.M. Sensoriamento Remoto: Princípios e Aplicações; Editora Blucher: São Paulo, Brazil, 2010. [Google Scholar]
- QUILAN, J.R. C5.0: An Informal Tutorial. Available online: http://www.rulequest.com/see5-unix.html (accessed on 1 November 2021).
- Maricato, E.A. Cidade do Pensamento Único: Desmanchando Consenso, 3rd ed.; Revista do Programa de Pós-Graduação em Arquitetura e Urbanismo da FAUUSP: Petrópolis, Brazil, 2002; pp. 250–251. [Google Scholar]
- Instituto Brasileiro De Geografia E Estatística—IBGE. Aglomerados Subnormais 2019: Classificação Preliminar e Informações de Saúde Para o Enfrentamento à COVID-19. Rio de Janeiro. 2020. Available online: https://covid19.ibge.gov.br/ (accessed on 1 November 2021).
- Kurkdjian, M. Um método Para Identificação e Análise de Setores Residenciais Urbanos Homogêneos, Através de Dados de Sensoriamento Remoto, Com Vistas ao Planejamento Urbano. São Paulo. 158p. Tese (Doutorado em Arquitetura e Urbanismo)-FAU-USP. [São Paulo, Brazil]. 1986. Available online: http://mtc-m12.sid.inpe.br/col/sid.inpe.br/iris@1912/2005/07.18.21.29/doc/INPE%206358.pdf (accessed on 1 November 2021).
- De Lourdes Neves de Oliveira, M.; Manso, A.P.; Barros, M.S.S. Setorização urbana através de Sensoriamento Remoto. Instituto Nacional De Pesquisas Espaciais. 1978. Available online: http://marte.sid.inpe.br/col/dpi.inpe.br/marte@80/2008/09.23.18.09/doc/436-451.pdf (accessed on 1 November 2021).
- Manso, A.P.; Barros, M.S.S.; Oliveira, M.L.N. Determinação de Zonas Homogêneas Através de Sensoriamento Remoto; INPE: São José dos Campos, Brazil, 1978. [Google Scholar]
- Gonçalves, C.; Souza, I.D.M.; Pereira, M.N.; Freitas, C.D.C. Análise do Ambiente Urbano Visando a Inferência Populacional a Partir do uso de Dados de Sensoriamento Remoto Orbital de alta Resolução; INPE: São José dos Campos, Brazil, 2004. [Google Scholar]
- Matias, L.F.; Nascimento, E.D. Geoprocessamento aplicado ao mapeamento das áreas de ocupação irregular na cidade de Ponta Grossa (PR). Geogr. Rio Claro 2006, 31, 317–330. [Google Scholar]
- Hofmann, P. Detecting informal settlements from IKONOS image data using methods of object oriented image analysis-an example from Cape Town (South Africa). Remote Sens. Urban Areas/Fernerkund. Urbanen Räumen 2001, 41–42. [Google Scholar]
- Hofmann, P.; Strobl, J.; Blaschke, T.; Kux, H. Detecting informal settlements from QuickBird data in Rio de Janeiro using an object based approach. In Object-Based Image Analysis; Springer: Berlin/Heidelberg, Germany, 2008; pp. 531–553. [Google Scholar]
- Kohli, D.; Sliuzas, R.; Stein, A. Urban slum detection using texture and spatial metrics derived from satellite imagery. J. Spat. Sci. 2016, 61, 405–426. [Google Scholar] [CrossRef] [Green Version]
- Kohli, D.; Stein, A.; Sliuzas, R.V.; Kerle, N. Identifying and Classifying Slum Areas Using Remote Sensing; University of Twente Faculty of Geo-Information and Earth Observation (ITC): Enschede, The Netherlands, 2015. [Google Scholar]
- Wurm, M.; Taubenböck, H. Detecting social groups from space–Assessment of remote sensing-based mapped morphological slums using income data. Remote Sens. Lett. 2018, 9, 41–50. [Google Scholar] [CrossRef]
- REUß, F. Detection of Favelas in Brazil using Texture Parameters and Machine Learning. [Graz, Austria]. 2017. Available online: https://elib.dlr.de/115220/1/Reuss_MA.pdf (accessed on 1 November 2021).
- Gueguen, L. Classifying compound structures in satellite images: A compressed representation for fast queries. IEEE Trans. Geosci. Remote Sens. 2014, 534, 1803–1818. [Google Scholar] [CrossRef]
- Dos Santos, B.D.; de Pinho, C.M.D.; de Jesus, T.B. Níveis De Consolidação De Assentamentos Precários A Partir De Dados De Sensoriamento Remoto. In XIX Simpósio Brasileiro de Sensoriamento Remoto; INPE: Santos, Brazil, 2019; pp. 3224–3227. Available online: http://marte2.sid.inpe.br/col/sid.inpe.br/marte2/2019/10.31.12.39/doc/98009.pdf (accessed on 2 January 2021).
- Stark, T.; Wurm, M.; Zhu, X.X.; Taubenböck, H. Satellite-Based mapping of urban poverty with transfer-learned slum morphologies. IEEE J. Sel. Top. Appl. Earth Obs. Remote Sens. 2020, 13, 5251–5263. [Google Scholar] [CrossRef]
- Kohli, D.; Sliuzas, R.; Kerle, N.; Stein, A. An ontology of slums for image-based classification. Comput. Environ. Urban Syst. 2012, 36, 154–163. [Google Scholar] [CrossRef]
- Feitosa, F.D.F.; Vasconcelos, V.V.; de Pinho, C.M.D.; da Silva, G.F.G.; da Silva Gonçalves, G.; Danna, L.C.C.; Lisboa, F.S. IMMerSe: An integrated methodology for mapping and classifying precarious settlements. Appl. Geogr. 2021, 133, 102494. [Google Scholar] [CrossRef]
- Da Costa, G.A.O.P.; de Pinho, C.M.D.; Feitosa, R.Q.; de Almeida, C.M.; Kux, H.J.H.; Fonseca, L.M.G.; Oliveira, D.A.B. InterIMAGE: Uma plataforma cognitiva open source para a interpretação automática de imagens digitais. Rev. Bras. Cartogr. 2008, 60, 331–337. [Google Scholar]
- Alves, C.D.; Pereira, M.N.; Florenzano, T.G.; Souza, Í.D.M.E. Análise orientada a objeto no mapeamento de áreas urbanas com imagens Landsat. Bol. Ciências Geodésicas 2009, 15, 120–141. [Google Scholar]
- Ribeiro, B.M.G. Avaliação das Imagens WorldView-II Para o Mapeamento da Cobertura do Solo Urbano Utilizando o Sistema InterIMAGE. São José dos Campos. 2010. Available online: http://mtc-m16d.sid.inpe.br/col/sid.inpe.br/mtc-m19@80/2010/08.03.12.52.20/doc/publicacao.pdf (accessed on 1 November 2021).
- Kux, H.J.H.; Novack, T.; Ferreira, R.; Oliveira, D.A.; Ribeiro, B.M.G. Classificação da cobertura do solo urbano usando imagens ópticas de altíssima resolução e o sistema InterIMAGE baseado em conhecimento. In Proceedings of the Anais XV Simpósio Brasileiro de Sensoriamento Remoto–SBSR, Curitiba, Brasil, 30 April–5 May 2011; p. 822. [Google Scholar]
- De Pinho, C.M.D.; Fonseca, L.M.G.; Korting, T.S.; de Almeida, C.M.; Kux, H.J.H. Land-cover classification of an intra-urban environment using high-resolution images and object-based image analysis. Int. J. Remote Sens. 2012, 33, 5973–5995. [Google Scholar] [CrossRef]
- Kux, H.J.H.; Novack, T.; Fonseca, L.M.G. Mapeamento de favelas usando classificação orientada a objeto–estudo de caso em Paraisópolis, São Paulo (SP). Simpósio Bras. Sens. Remoto 2009, 14, 715–721. [Google Scholar]
- Cardoso, A.C.D.; de Melo, A.C.; do Vale Gomes, T. O urbano contemporâneo na fronteira de expansão do capital: Padrões de transformações espaciais em seis cidades do Pará, Brasil. Rev. Morfol. Urbana 2016, 4, 5–28. [Google Scholar] [CrossRef]
- Pontes, L.B. Cidade, Desenho e Natureza: Uma Reflexão Sobre os Espaços Livres de Marabá. [Belém do Pará]. 2015. Available online: https://bdtd.ibict.br/vufind/Record/UFPA_6aaf495909dd3b97f78cd452d6b7dc0b (accessed on 1 November 2021).
- Cardoso, A.C.D.; Lima, J.J.F. Tipologias e Padrões de Ocupação Urbana na Amazônia Oriental: Para Que e Para Quem. In O Rural e o Urbano na Amazônia: Diferentes Olhares em Perspectivas; UFPA: Belém, Brazil, 2006. [Google Scholar]
- LISS. Grupo De Pesquisa|Liss Inpe. Available online: https://www.lissinpe.com.br/ (accessed on 1 November 2021).
- INPE. Câmeras Imageadoras CBERS-4A. INPE. 2019. Available online: http://www.cbers.inpe.br/sobre/cameras/cbers04a.php (accessed on 8 January 2021).
- INPE. Sobre o CBERS. INPE. 2018. Available online: http://www.cbers.inpe.br/sobre/index.php (accessed on 2 January 2021).
- Instituto Nacional de Pesquisas Espaciais. Divisão de Geração de Imagem: Catálogo de Imagens. Available online: http://www2.dgi.inpe.br/catalogo/explore (accessed on 1 November 2021).
- Team, Q.D.; QGIS Geographic Information System. QGIS Association. 2021. Available online: https://www.qgis.org (accessed on 14 November 2021).
- OTB. Segmentation—Orfeo ToolBox 7.4.0 Documentation. Available online: https://www.orfeo-toolbox.org/CookBook/Applications/app_Segmentation.html (accessed on 1 November 2021).
- Körting, T.S.; Garcia Fonseca, L.M.; Câmara, G. GeoDMA—Geographic Data Mining Analyst. Comput. Geosci. 2013, 57, 133–145. [Google Scholar] [CrossRef] [Green Version]
- Ponzoni, F.J.; Shimabukuro, Y.E.; Kuplich, T.M. Sensoriamento Remoto da Vegetação, 2nd ed.; Oficina de Textos: Paulo, Brazil, 2012; Volume 1. [Google Scholar]
- De Pinho, C.M.D.; Ummus, M.E.; Novack, T. Extração De Feições Urbanas Em Imagens De Alta Resolução Espacial A Partir Do Estudo Do Comportamento Espectral Dos Alvos. Rev. Bras. De Cartogr. 2011, 63, 439–448. [Google Scholar]
- Haralick, R.M. Statistical and structural approaches to texture. Proc. IEEE. 1979, 67, 786–804. [Google Scholar] [CrossRef]
- Michel, J.; Youssefi, D.; Grizonnet, M. Stable Mean-Shift Algorithm and Its Application to the Segmentation of Arbitrarily Large Remote Sensing Images. IEEE Trans. Geosci. Remote Sens. 2015, 53, 952–964. [Google Scholar] [CrossRef]
- INPE. GeoDMA Features. Available online: http://wiki.dpi.inpe.br/doku.php?id=geodma_2:features&s[]=landscape (accessed on 1 November 2021).
- Quinlan, J.R. C4. 5: Programs for Machine Learning; Elsevier: Amsterdam, The Netherlands, 2014. [Google Scholar]
- Pandya, R.; Pandya, J. C5. 0 algorithm to improved decision tree with feature selection and reduced error pruning. Int. J. Comput. Appl. 2015, 117, 18–21. [Google Scholar] [CrossRef]
- Birch, C.P.; Oom, S.P.; Beecham, J.A. Rectangular and hexagonal grids used for observation, experiment and simulation in ecology. Ecol. Model. 2007, 206, 347–359. [Google Scholar] [CrossRef]
- Pereira, R.H.M.; Kauê, C.; Braga, V.; Serra, B.; Nadalin, V.G. Desigualdades Socioespaciais De Acesso A Oportunidades Nas Cidades Brasileiras—2019. Brasília. 2020. Available online: http://www.ipea.gov.br/portal/publicacoes (accessed on 1 November 2021).
- Denaldi, R.; Petrarolli, J.G.; Gonçalves, G.; Moraes, G. Tecidos Urbanos E A Identificação De Assentamentos Precários Na Região Metropolitana Da Baixada Santista. In III URBFAVELAS; Observatório das Metrópoles: Salvador, 2018; pp. 1–21. Available online: http://lepur.com.br/wp-content/uploads/2018/12/TECIDOS-URBANOS-E-A-IDENTIFICA%C3%87%C3%83O-DE-ASSENTAMENTOS-PREC%C3%81RIOS-NA-REGI%C3%83O-METROPOLITANA-DA-BAIXADA-SANTISTA-.pdf (accessed on 1 November 2021).
- Cdhu, ufabc. Desenvolvimento e aplicação de metodologia para identificação, caracterização e dimensionamento de assentamentos precários. São Bernardo do Campo. 2018.
- Ribeiro, R.J.D.C. Índice Composto de Qualidade de vida Urbana: Aspectos de Configuração Espacial, Socioeconômicos e Ambientais Urbanos. 2008. Available online: file:///C:/Users/dias-bruno/Downloads/2008_RomuloJoseCostaRibeiro.pdf (accessed on 15 November 2021).
- OSM. OpenStreetMap. 2021. Available online: https://www.openstreetmap.org/#map=4/-15.13/-53.19 (accessed on 1 November 2021).
- Rennó, C.D.; Nobre, A.D.; Cuartas, L.A.; Soares, J.V.; Hodnett, M.G.; Tomasella, J.; Waterloo, M.J. HAND, a New Terrain Descriptor Using SRTM-DEM: Mapping Terra-Firme Rainforest Environments in Amazonia. Remote Sens. Environ. 2008, 112, 3469–3481. Available online: https://www.sciencedirect.com/science/article/pii/S003442570800120X (accessed on 15 November 2021). [CrossRef]
- McGarigal, K.; Marks, B.J. Spatial pattern analysis program for quantifying landscape structure. In General Technical Report; PNW-GTR-351; US Department of Agriculture, Forest Service, Pacific Northwest Research Station: Portland, OR, USA, 1995; pp. 1–122. [Google Scholar]
- De Cidades, A.; das Cidades, M. Ações Integradas de Urbanização de Assentamentos precários: Síntese do Curso à Distância. 2010. Available online: https://antigo.mdr.gov.br/images/stories/ArquivosSNH/ArquivosPDF/SinteseAcaoUrbanizacao_WEB.pdf (accessed on 15 November 2021).
- Georganos, S.; Abascal, A.; Kuffer, M.; Wang, J.; Owusu, M.; Wolff, E.; Vanhuysse, S. Is It All the Same? Mapping and Characterizing Deprived Urban Areas Using WorldView-3 Superspectral Imagery. A Case Study in Nairobi, Kenya. Remote Sens. 2021, 13, 4986. [Google Scholar] [CrossRef]
- Reis, I.C. Caracterizaçao de Paisagens Urbanas Heterogêneas de Interesse para a Vigilância e Controle da Dengue com o uso de Sensoriamento Remoto e Mineraçao de Padroes Espaciais: Um Estudo para o Rio de Janeiro. Master in Remote Sensing, National Institute of Spatial Research, São José dos Campos, Brazil. 2010. Available online: http://mtc-m16d.sid.inpe.br/col/sid.inpe.br/mtc-m19/2010/12.06.15.22/doc/publicacao.pdf?metadatarepository=sid.inpe.br/mtc-m19/2010/12.06.15.22.45&mirror=sid.inpe.br/mtc-m19@80/2009/08.21.17.02.53 (accessed on 15 November 2021).
- Leonita, G.; Kuffer, M.; Sliuzas, R.; Persello, C. Machine Learning-Based Slum Mapping in Support of Slum Upgrading Programs: The Case of Bandung City, Indonesia. Remote Sens. 2018, 10, 1522. [Google Scholar] [CrossRef] [Green Version]
- Amaral, S.; Câmara, G.; Monteiro, A.M.V.; Quintanilha, J.; Elvidge, C.D. Estimating population and energy consumption in Brazilian Amazonia using DMSP night-time satellite data. Comput. Environ. Urban Syst. 2005, 29, 179–195. [Google Scholar] [CrossRef]
- Instituto de Pesquisa Econômica Aplicada. Webinar Destacou Principais Resultados da Pesquisa Sobre núcleos urbanos Informais. Available online: https://www.ipea.gov.br/portal/index.php?option=com_content&view=article&id=38607&catid=1&Itemid=7 (accessed on 1 November 2021).


| UFT | Full and Empty Scheme | WPM RGB (3,2,1) | Class Description |
|---|---|---|---|
| UFT1 Fibre cement |  | 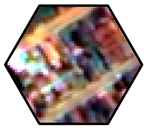 | Organized occupation with planned blocks and structured roads. The roads have sections with poor quality asphalt and sections of unpaved ground. High built-up density, without unbuilt areas inside settlements or space within lots. Fiber cement is the predominant material for roofs. |
| UFT2 Ceramics | 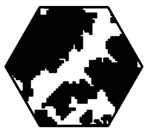 |  | Organized occupation with planned blocks and structured roads. The roads have sections with poor quality asphalt and sections of unpaved ground. High built-up density, without unbuilt areas inside settlements or space within lots. The predominance of ceramic roof is what distinguishes UFT2 from UFT1. |
| UFT3 Vegetated |  |  | Organized occupation with planned blocks and structured roads. The roads are unpaved and longer than 400 m. Medium built-up density, with unbuilt areas and vegetation inside blocks. Ceramic is the predominant material for roofs. |
| UFT4 Sparse | 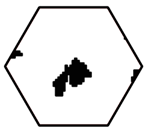 | 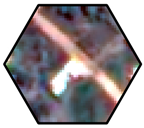 | Spontaneous and not consolidated occupation. Low built-up density, without well-defined blocks and with unpaved streets. There is a predominance of empty spaces between dwellings, with herbaceous vegetation. Recent occupations resulting from unmediated expansion of organized precarious settlements toward environmentally sensitive areas or land designated for rural purposes. |
| UFT5 Roads |  | 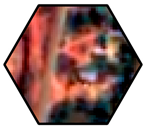 | Occupation located near highway BR-230 (Transamazônica) in Marabá and Altamira, BR-222 in Marabá, and BR-422 in Cametá. Organized settlements located far from central areas, in regions with periurban characteristics. Roads are unpaved (except highways). |
| UFT6 Wetlands |  |  | Spontaneous occupation, located in wetlands or in areas subject to flooding. Low built-up density and similar to UFT4, some are the result of the expansion of large settlements. It may not have well-defined street layouts and has shrubby vegetation between houses. |
| Context Metric | Reason |
|---|---|
| Euclidean distance between the nearest road and the centroid of a cell | Roads are vectors of urban growth in Amazonian cities [55,57]. Additionally, they are related to the formation of precarious settlements in their surrounding areas [13]. |
| Euclidean distance between the municipal seat and the centroid of a cell | The central region of Amazonian cities in this study concentrates health and educational services and has better infrastructure and offer of basic services [13] than other regions. Some precarious settlements are far from the center of the municipality, as they occupy regions close to roads and areas in recent expansion. |
| Euclidean distance between the centroid of a cell and the height above the nearest drainage (HAND) | Some informal settlements are in flatlands [55]. However, unlike traditional Amazonian populations, here housing is not well designed to survive seasonal floods. Furthermore, Sakatauskas [13] identified a typology of precarious settlements located in wetlands. We built HAND according to the methodology developed by Rennó et al. [78]. |
| Average of the shape index of blocks | Informal settlements tend to have greater inconsistency of block designs when compared to traditional Amazonian settlements [57]. This value allows the comparison of geometric shapes of blocks in regular areas (rectangular blocks with similar sizes) and irregular shapes or the absence of subdivisions within blocks, a common characteristic of precarious settlements [75]. We computed shape index [79] from the road base [77] accordingly to the methodology described by [75]. |
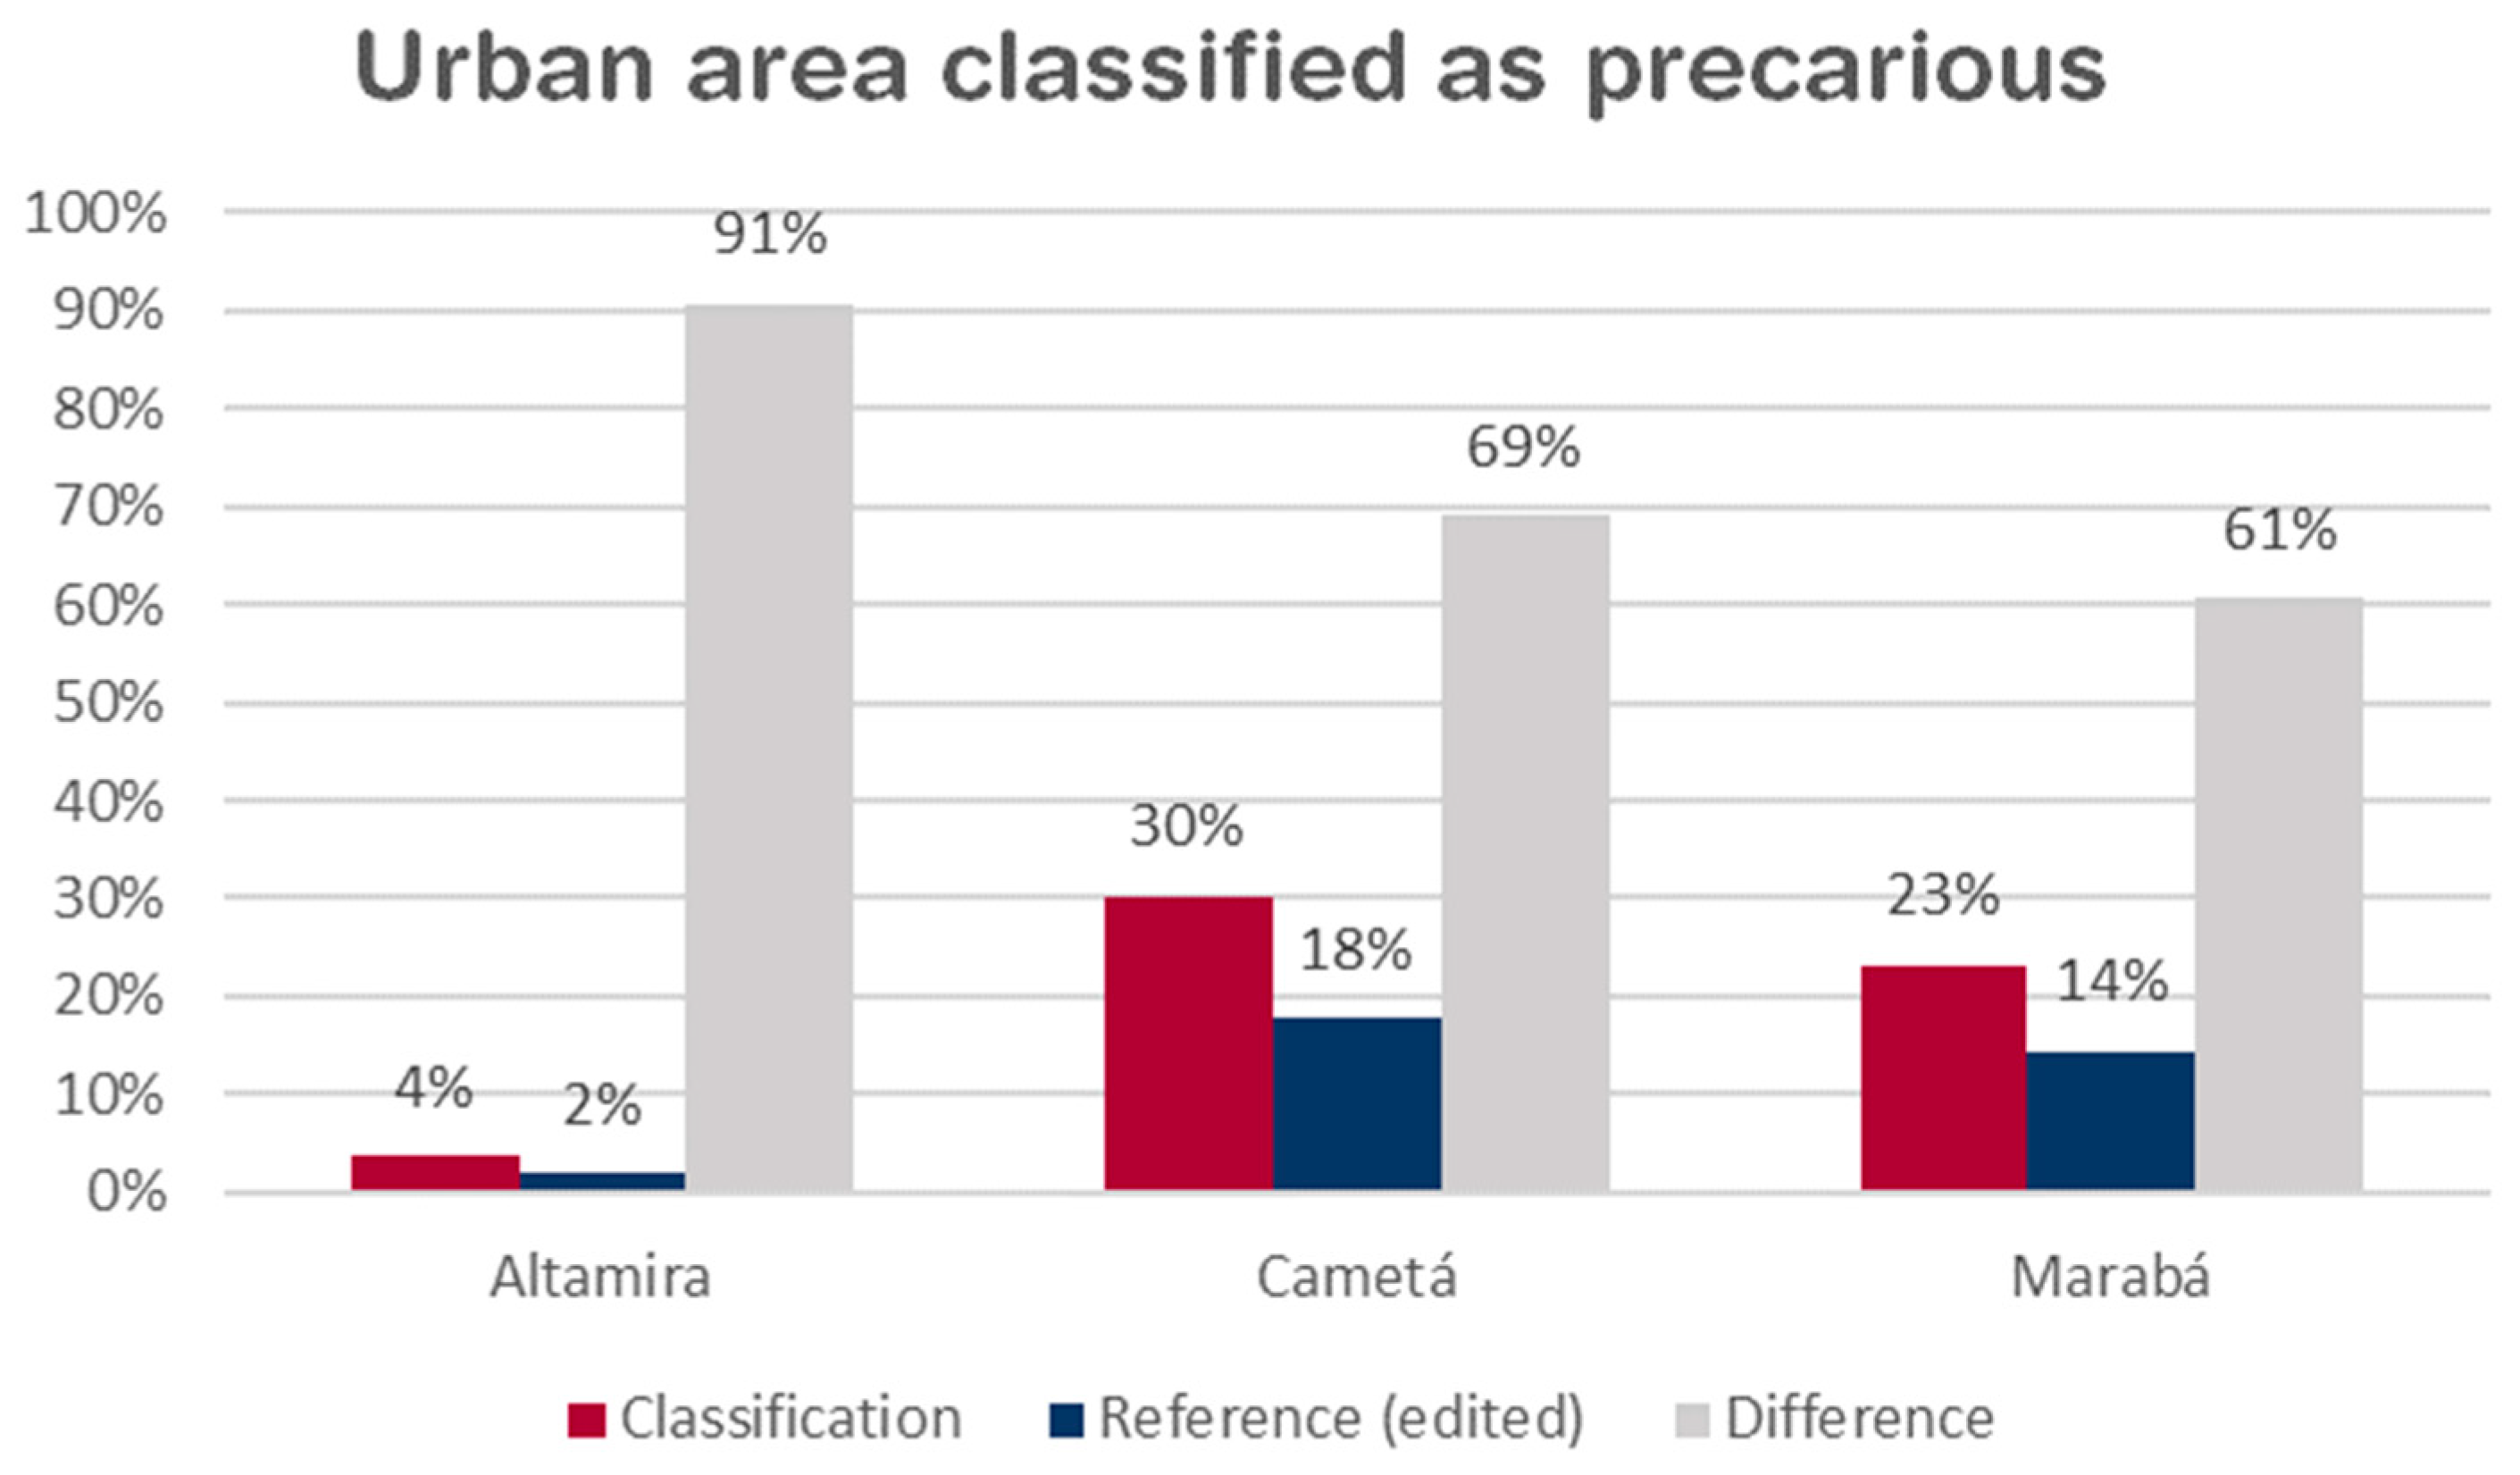
| Classification | Producer’s Accuracy | User’s Accuracy | Area | ||||
|---|---|---|---|---|---|---|---|
| Nonprec. | Prec | Total | |||||
| Reference | Nonprec. | 1054 | 11 | 1065 | 0.99 | 0.98 | Altamira (F1: 0.78; GA: 0.97) |
| Prec | 26 | 65 | 91 | 0.71 | 0.86 | ||
| Total | 1080 | 76 | 1156 | ||||
| Nonprec. | 350 | 15 | 365 | 0.96 | 0.96 | Cametá (F1: 0.81; GA: 0.93) | |
| Prec | 14 | 62 | 76 | 0.82 | 0.81 | ||
| Total | 364 | 77 | 441 | ||||
| Nonprec. | 1887 | 52 | 1939 | 0.97 | 0.98 | Marabá (F1: 0.91; GA: 0.97) | |
| Prec | 31 | 444 | 475 | 0.93 | 0.90 | ||
| Total | 1918 | 496 | 2414 | ||||
| Classification | Producer’s Accuracy | User’s Accuracy | Class F1-Score | Global | |||||||||
|---|---|---|---|---|---|---|---|---|---|---|---|---|---|
| UFT1 | UFT2 | UFT3 | UFT4 | UFT5 | UFT6 | Total | |||||||
| Reference | UFT1 | 15 | 1 | 1 | 17 | 0.88 | 0.83 | 0.86 | F1-Score | 0.91 | |||
| UFT2 | 32 | 1 | 33 | 0.97 | 0.91 | 0.94 | Accuracy | 0.92 | |||||
| UFT3 | 19 | 1 | 1 | 21 | 0.90 | 0.90 | 0.90 | ||||||
| UFT4 | 58 | 1 | 59 | 0.98 | 0.92 | 0.95 | |||||||
| UFT5 | 3 | 2 | 2 | 2 | 47 | 2 | 58 | 0.81 | 0.96 | 0.88 | |||
| UFT6 | 2 | 34 | 36 | 0.94 | 0.89 | 0.92 | |||||||
| Total | 18 | 35 | 21 | 63 | 49 | 38 | 224 | ||||||
Publisher’s Note: MDPI stays neutral with regard to jurisdictional claims in published maps and institutional affiliations. |
© 2022 by the authors. Licensee MDPI, Basel, Switzerland. This article is an open access article distributed under the terms and conditions of the Creative Commons Attribution (CC BY) license (https://creativecommons.org/licenses/by/4.0/).
Share and Cite
dos Santos, B.D.; de Pinho, C.M.D.; Oliveira, G.E.T.; Korting, T.S.; Escada, M.I.S.; Amaral, S. Identifying Precarious Settlements and Urban Fabric Typologies Based on GEOBIA and Data Mining in Brazilian Amazon Cities. Remote Sens. 2022, 14, 704. https://doi.org/10.3390/rs14030704
dos Santos BD, de Pinho CMD, Oliveira GET, Korting TS, Escada MIS, Amaral S. Identifying Precarious Settlements and Urban Fabric Typologies Based on GEOBIA and Data Mining in Brazilian Amazon Cities. Remote Sensing. 2022; 14(3):704. https://doi.org/10.3390/rs14030704
Chicago/Turabian Styledos Santos, Bruno Dias, Carolina Moutinho Duque de Pinho, Gilberto Eidi Teramoto Oliveira, Thales Sehn Korting, Maria Isabel Sobral Escada, and Silvana Amaral. 2022. "Identifying Precarious Settlements and Urban Fabric Typologies Based on GEOBIA and Data Mining in Brazilian Amazon Cities" Remote Sensing 14, no. 3: 704. https://doi.org/10.3390/rs14030704