Article

Forecast Characteristics of Radar Data Assimilation Based on the Scales of Precipitation Systems

1
National Typhoon Center, Korea Meteorological Administration, Seogwipo 63614, Korea
2
School of Earth System Sciences, Kyungpook National University, Daegu 41566, Korea
*
Author to whom correspondence should be addressed.
Remote Sens. 2022, 14(3), 605; https://doi.org/10.3390/rs14030605
Submission received: 23 November 2021 / Revised: 20 January 2022 / Accepted: 24 January 2022 / Published: 27 January 2022
(This article belongs to the Special Issue Radar-Based Studies of Precipitation Systems and Their Microphysics)

Abstract

:
Radar data with high spatiotemporal resolution and automatic weather station (AWS) data are used in the data assimilation experiment to improve the precipitation forecast of a numerical model. The numerical model considered in this study is the Weather Research and Forecasting (WRF) model with double-moment 6-class microphysics scheme (WDM6). We calculated the radar equivalent reflectivity factor using high resolution WRF and compared it with radar observations in South Korea. To compare the precipitation forecast characteristics of the three-dimensional variational (3D-Var) assimilation of radar data, four experiments were performed based on the scales of precipitation systems. Comparison of the 24 h accumulated rainfall with surface observation data, contoured frequency by altitude diagram (CFAD), time–height cross sections (THCS), and vertical hydrometeor profiles was used to evaluate the accuracy of the simulation of precipitation. The model simulations were performed with and without 3D-VAR radar reflectivity, radial velocity and AWS assimilation for two mesoscale convective cases and two synoptic scale cases. The combined effect of the radar and AWS data assimilation experiment improved the location of the precipitation area and rainfall intensity compared to the control run. There is a noticeable scale dependence in the improvement of precipitation systems. Improvements in simulating mesoscale convective systems were larger compared to synoptically driven precipitation systems.

1. Introduction

The convective precipitation forecast is one of the most challenging tasks in weather forecasting due to the nonlinear behavior of the atmosphere. Numerical models are used to generate the high-resolution forecast of weather information. Improvement in numerical weather prediction (NWP) generally means improvement in the physics and dynamics of the modeling system including the model resolution [1,2], as well as improvement in the initial state (analysis) of the model [3,4,5,6]. In order to create the initial conditions for an NWP model (state of the atmosphere), in situ observations are crucial. Some of the important sources of observations are sounding, Automatic Weather Station (AWS), and the remote sensing satellite data. In recent years, radial velocity and equivalent radar reflectivity from Doppler weather radars such as the Weather Surveillance Radar-1988 Doppler (WSR-88D) have become important sources for higher resolution NWP models.
Cloud analysis schemes [7,8,9] are three-dimensional analysis packages based on surface observations from the Global Observing System, geostationary satellite infrared and visible imagery data, and radar reflectivity data. The analysis package includes three-dimensional cloud cover, cloud liquid and ice mixing ratios, cloud and precipitate types, and hydrometeor information. Cloud-base, cloud-top, and cloud-ceiling fields are also derived. In cloud analysis schemes, radar data are the key measurements that can assimilate the mesoscale features of three-dimensions in the NWP system [10,11,12]. For a high-resolution NWP system through data assimilation, the radar reflectivity observations have been used to generate the dynamically consistent and best analysis field (initial condition). In this methodology, the radar reflectivity observations are used to adjust hydrometeors, cloud temperature and cloud condensation [12]. Souto et al. [13] showed that the inclusion of cloud analysis improves the forecast skill for spatial distribution and the amount of precipitation. Sun et al. [14], reported that radar data assimilation can improve the forecast amount of precipitation but only up to 3-h forecasts. They used digital filters and Newtonian nudging techniques to assimilate radar observations without considering the physical processes involved. Weygandt et al. [15] showed that the use of a diabatic digital filter initialization which adjusts latent heating based on radar reflectivity improved short-term forecasts. Further, Ha et al. [16] showed that radar data can be used to predict the development of convective storms responsible for heavy rainfall, and the surface data contributed to the occurrence of intensified low-level winds and enhanced thermal gradient. They suggested that the combined effect of radar and AWS data assimilation can improve the forecasts in regions with complex topography.
During the last few years, for the high-resolution convective forecast, radar observations have been largely used in the data assimilation system in order to improve initial conditions [17]. Several assimilation methods have been developed for assimilating observed data into NWP models in convective scale. These assimilation systems include three-dimensional variational methods (3D-Var; [12,18]); four-dimensional variational methods (4D-Var; [19,20,21]); ensemble Kalman filter (EnKF; [22,23]) and hybrid method (3D/4D-Var + EnKF; [24,25,26]). These assimilation methods use the observation operator to translate model variables (or control variables) on the model grid to the observed location. The previous study showed that using those methods to prepare the initial field improved the precipitation forecasts [21]. Many research communities and operational centers developed and tested the 3D-Var and 4D-Var for radar data assimilation with different observation operators and with different microphysics schemes [27]. Although the 4D-Var, EnKF and hybrid methods show great potential, these approaches still suffer from unaffordable computer costs for the high-resolution model at convection scale. So the cloud analysis and 3D-Var assimilation method are still widely used in research communities [28,29,30].
In [31], the authors found that 3D-Var analysis with large-scale analysis constraints in the cost function was able to guide the assimilation process while adding the convective characteristics. Thus, the 3D-Var analysis with the constraint is more accurate when verified against an independent dataset. Many observing system simulation experiments (OSSE) have been conducted with real radar data and a WRF 3D-Var assimilation system to examine the strengths and weaknesses of the system [25,32]. The WRF 3D-Var system has been evaluated and operationally implemented in the Korea Meteorological Administration (KMA; [33]). Many previous studies discuss the 3D-Var data assimilation system at a convective scale along with their advantages and disadvantages, when radial wind and reflectivity are available [34,35,36,37,38]. Recently, using vertically integrated liquid water (VIL) calculated through a mosaicked 3D radar reflectivity field for severe weather events, pseudo water vapor and pseudo in cloud potential temperature were produced and data assimilation was conducted. When simulating the Meiyu-front cases, the predictability of the convective cloud simulation was improved [36]. In addition, in Italy, a study was conducted to compare predictability by applying WRF 3D-Var and 4D-Var to two flood cases. Through cases studies, it was reported that flood predictability was greatly improved when radar data assimilation was performed [37]. In Germany, an idealized experiment carried out on the simulation predictability of convective clouds in complex terrain using a regional-scale ensemble prediction model. Based on this, in a realistic experiment, it was mentioned that the ability to simulate convective clouds by terrain was improved when the radar 3D-Var data assimilation was applied [38]. These studies have shown that the assimilation of radar radial wind and reflectivity data in an NWP system can improve short-range forecast skills.
Min et al. [39] evaluated WRF single moment 6-class (WSM6) and double-moment 6-class (WDM6) microphysics schemes with radar observations for the 2011 summer monsoon and convective precipitation cases in Korea. This study showed that the accuracy of the WDM6 scheme is in better agreement with radar observations.
Existing radar data assimilation studies were restricted to studies to improve the prediction of mesoscale precipitation, which develops rapidly in a short time at the local scale in the summer, and studies on improving the prediction of precipitation for extratropical cyclones or various synoptic precipitation phenomena are insufficient. Therefore, this study verified the predictability of three-dimensional variational data assimilation using meteorological radar and AWS observation data for mesoscale and synoptic scale precipitation phenomena, and analyzed the predictability of precipitation for each case to identify systematic characteristics.
In Section 2, we describe the observations used, a description of selected cases, the high resolution model configuration, the 3D-Var data assimilation method and evaluation of parameters; Section 3 presents the results, and Section 4, the summary and discussions.

2. Observations, Method, Experiment Set Up and Evaluation Methodology
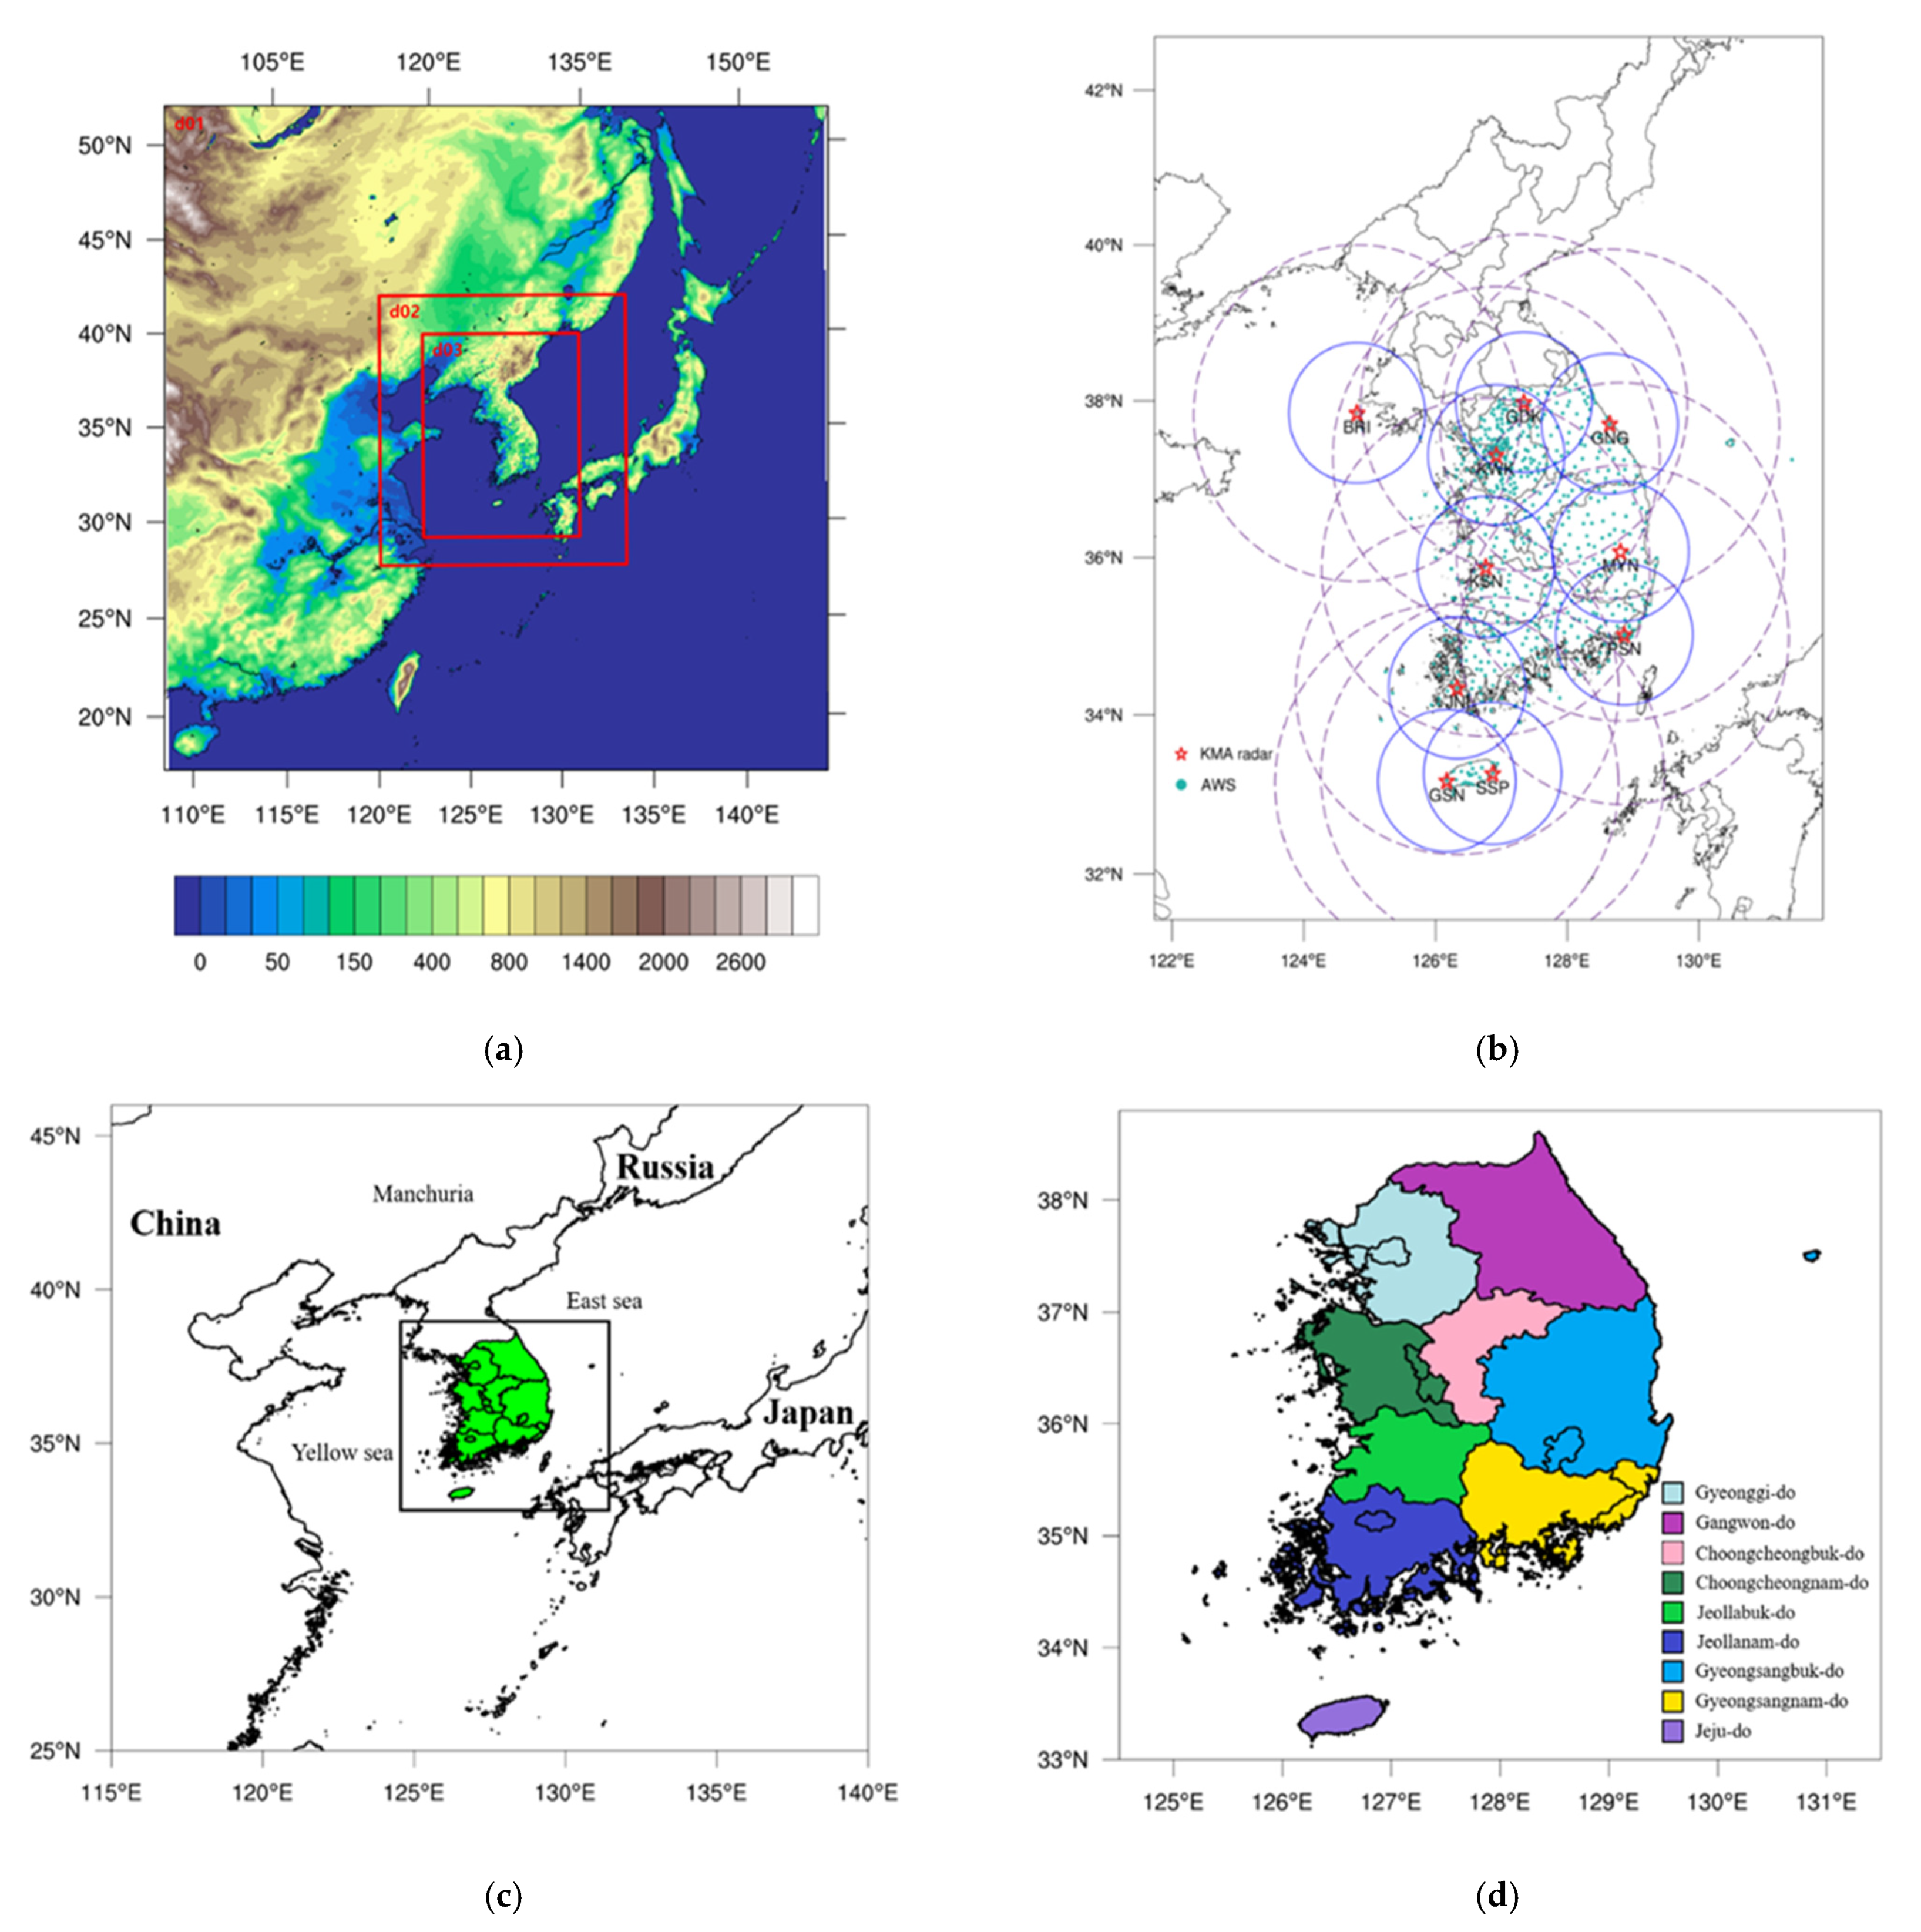
2.1. Observations

For objective comparison of WRF 3D-Var data assimilation we used three types of observations. These observations were from AWS, high resolution KMA radar reflectivity and radial velocity. The radar data were used after quality control (QC) and thinning. Thinning is applied because there exists a correlation between model resolution and observation density, i.e., the quality of analysis may decrease when the observation density is too large, such as radar data [40,41]. If the 3D high-resolution radar data (250–500 m) is applied to all domains of a relatively coarse resolution numerical model, large spatial errors of observations can occur and reduce the performance of a precipitation simulation. To prevent this, it is necessary to properly assimilate the observation data through thinning.
The fuzzy logic algorithm was used to remove anomalous propagation and non-meteorological echoes such as sea clutter, ground clutter and chaffs [42]. A total number of ten radar sites were used in the assimilation system. The data from AWS were also used in the assimilation system to update surface information because the radar sites are located on top of mountains to avoid beam blockage. The parameters from AWS data used in the WRF assimilation system were temperature, wind, air pressure, relative humidity. It should be noted that approximately 675 AWS stations were used in the assimilation. The 24 h AWS observed precipitation was used to compare with the model forecast rainfall. A domain area suitable for data assimilation on a local scale was established, and the detailed topography, observation site, and administrative districts of Korea are shown in Figure 1.
In addition, satellite-based NASA Global Precipitation Measurement (GPM) gridded data (Level 3; the Integrated Multi-satellitE Retrievals for GPM, IMERG) with horizontal resolution of 0.1° × 0.1° and time resolution of 30 min were used to analyze precipitation predictability of NWP. The GPM data has the advantage of supplementing the spatial limit of the rain gauge that can only observe precipitation on land to analyze the cumulative precipitation both over land and ocean. The GPM Level-3 data has small error characteristics by estimating precipitation through satellite and calibrating it with AWS data [43].

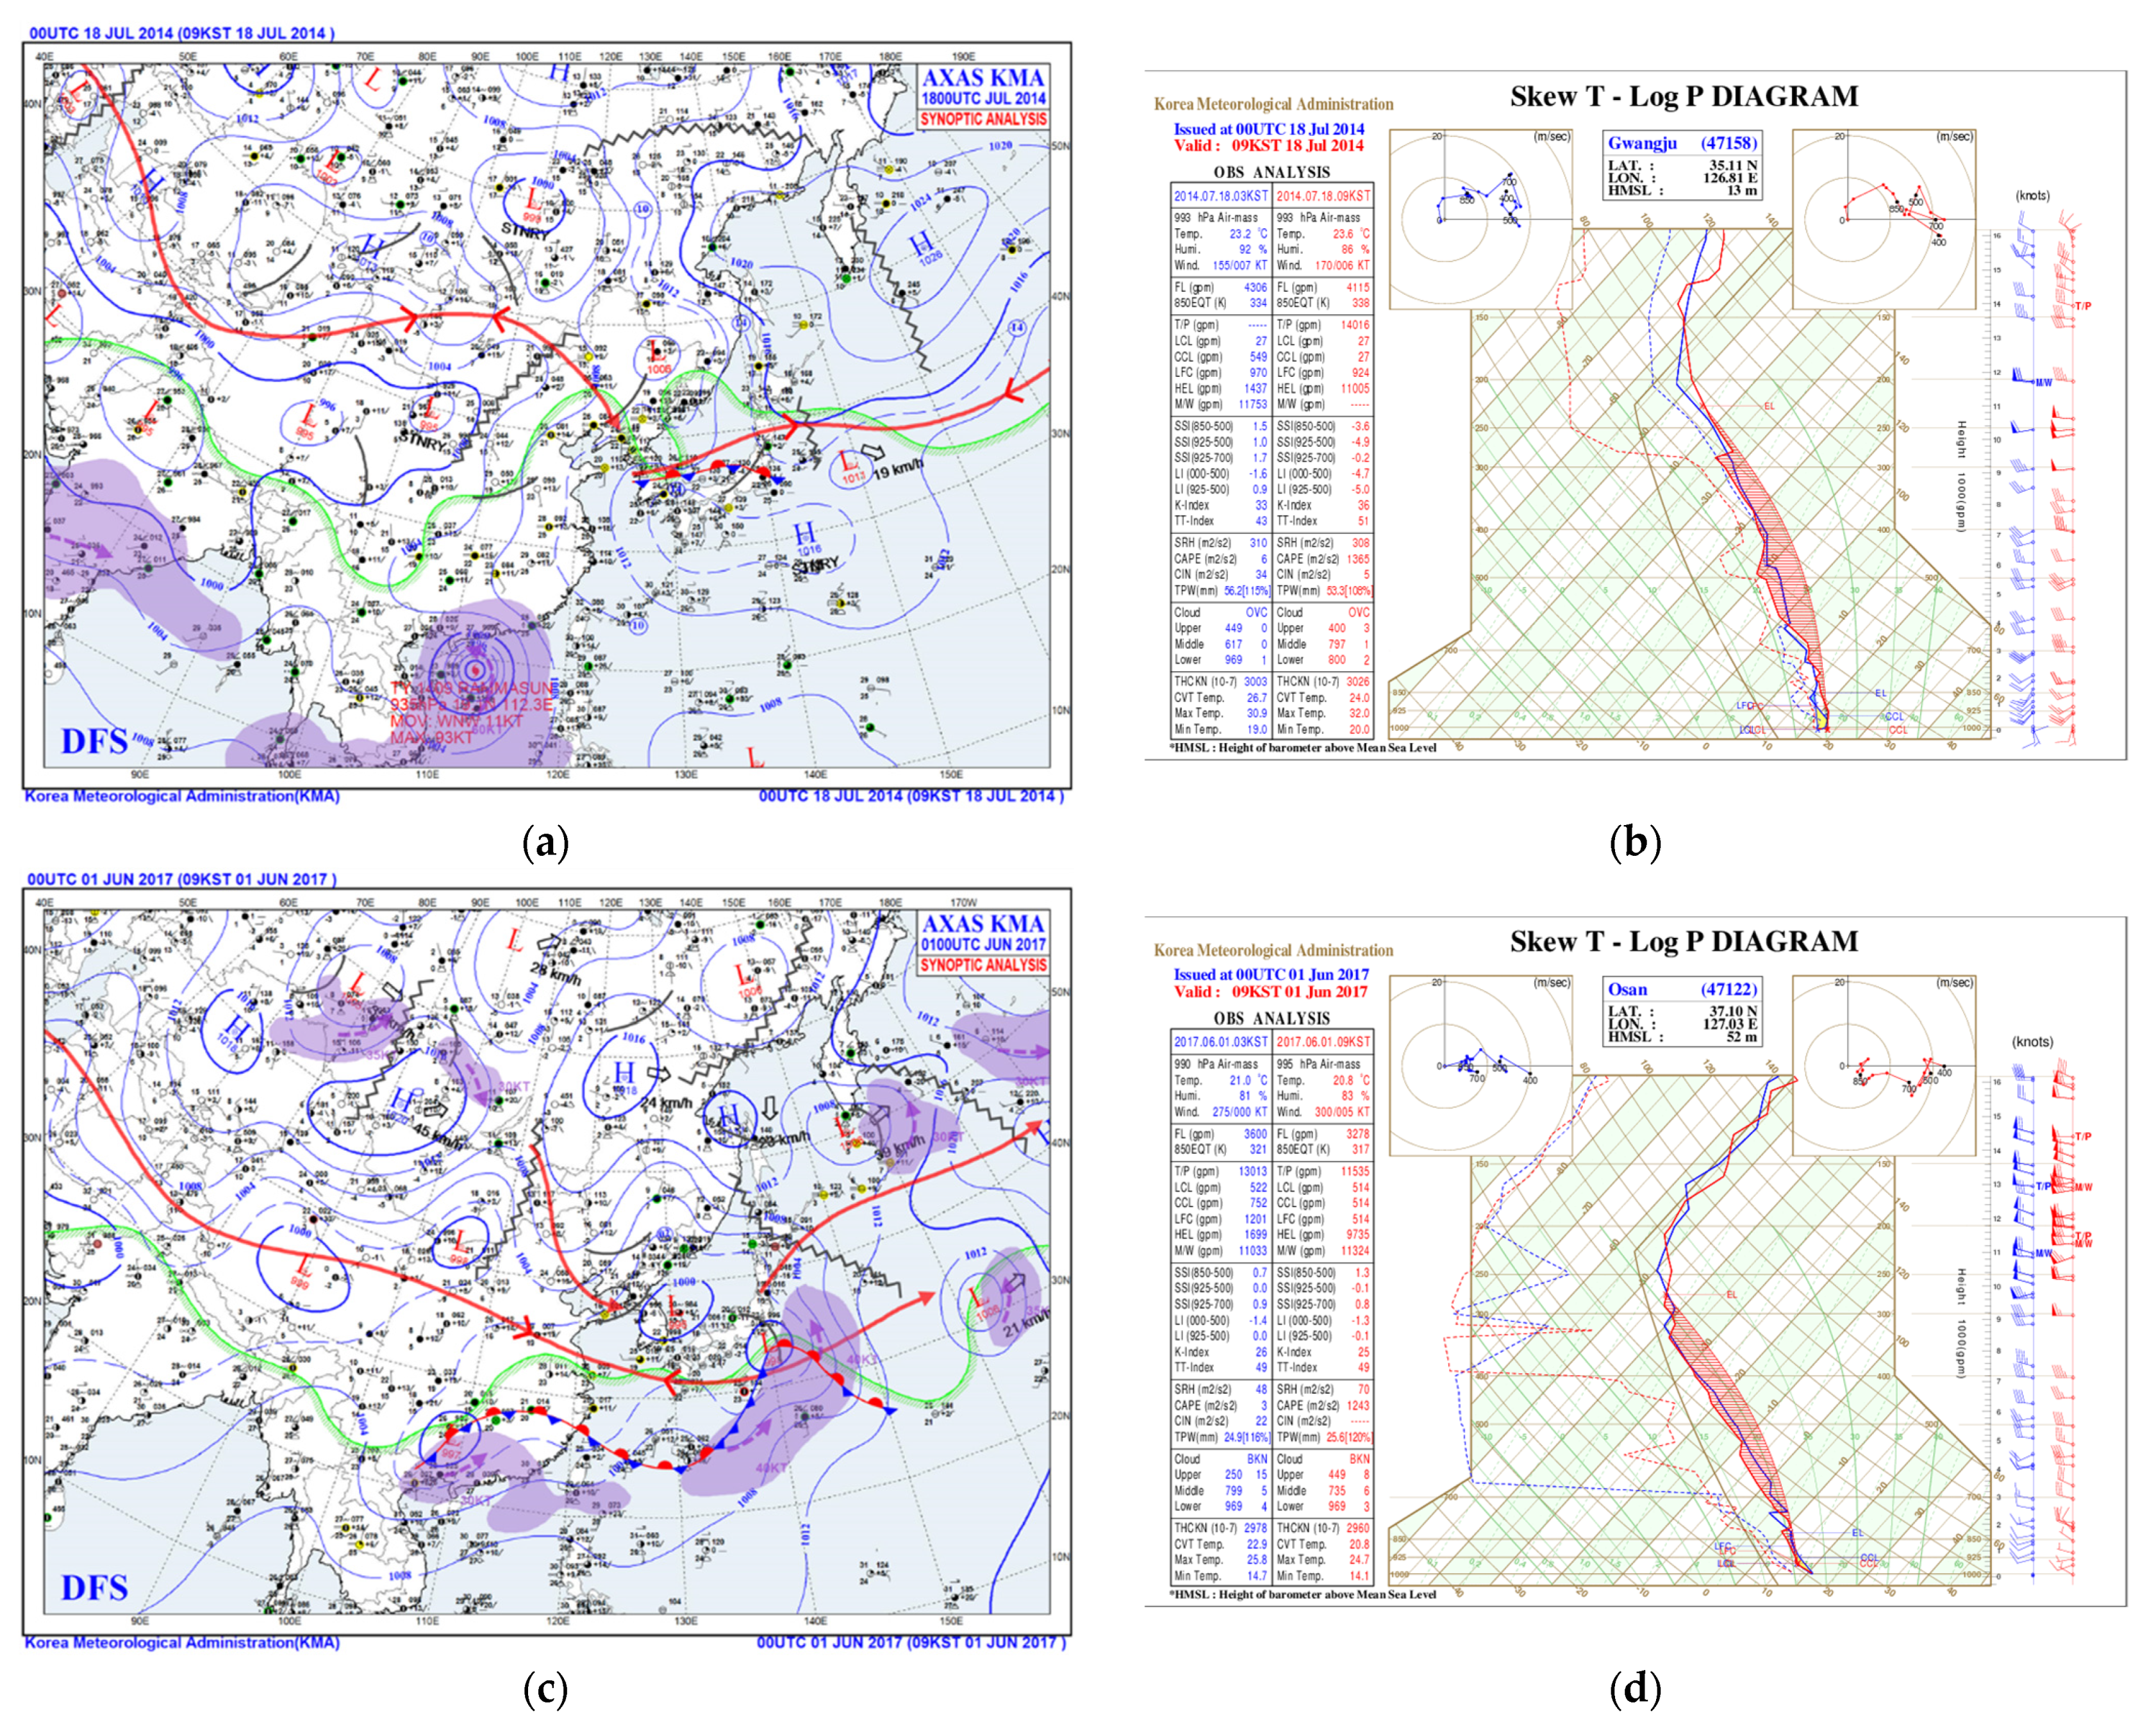
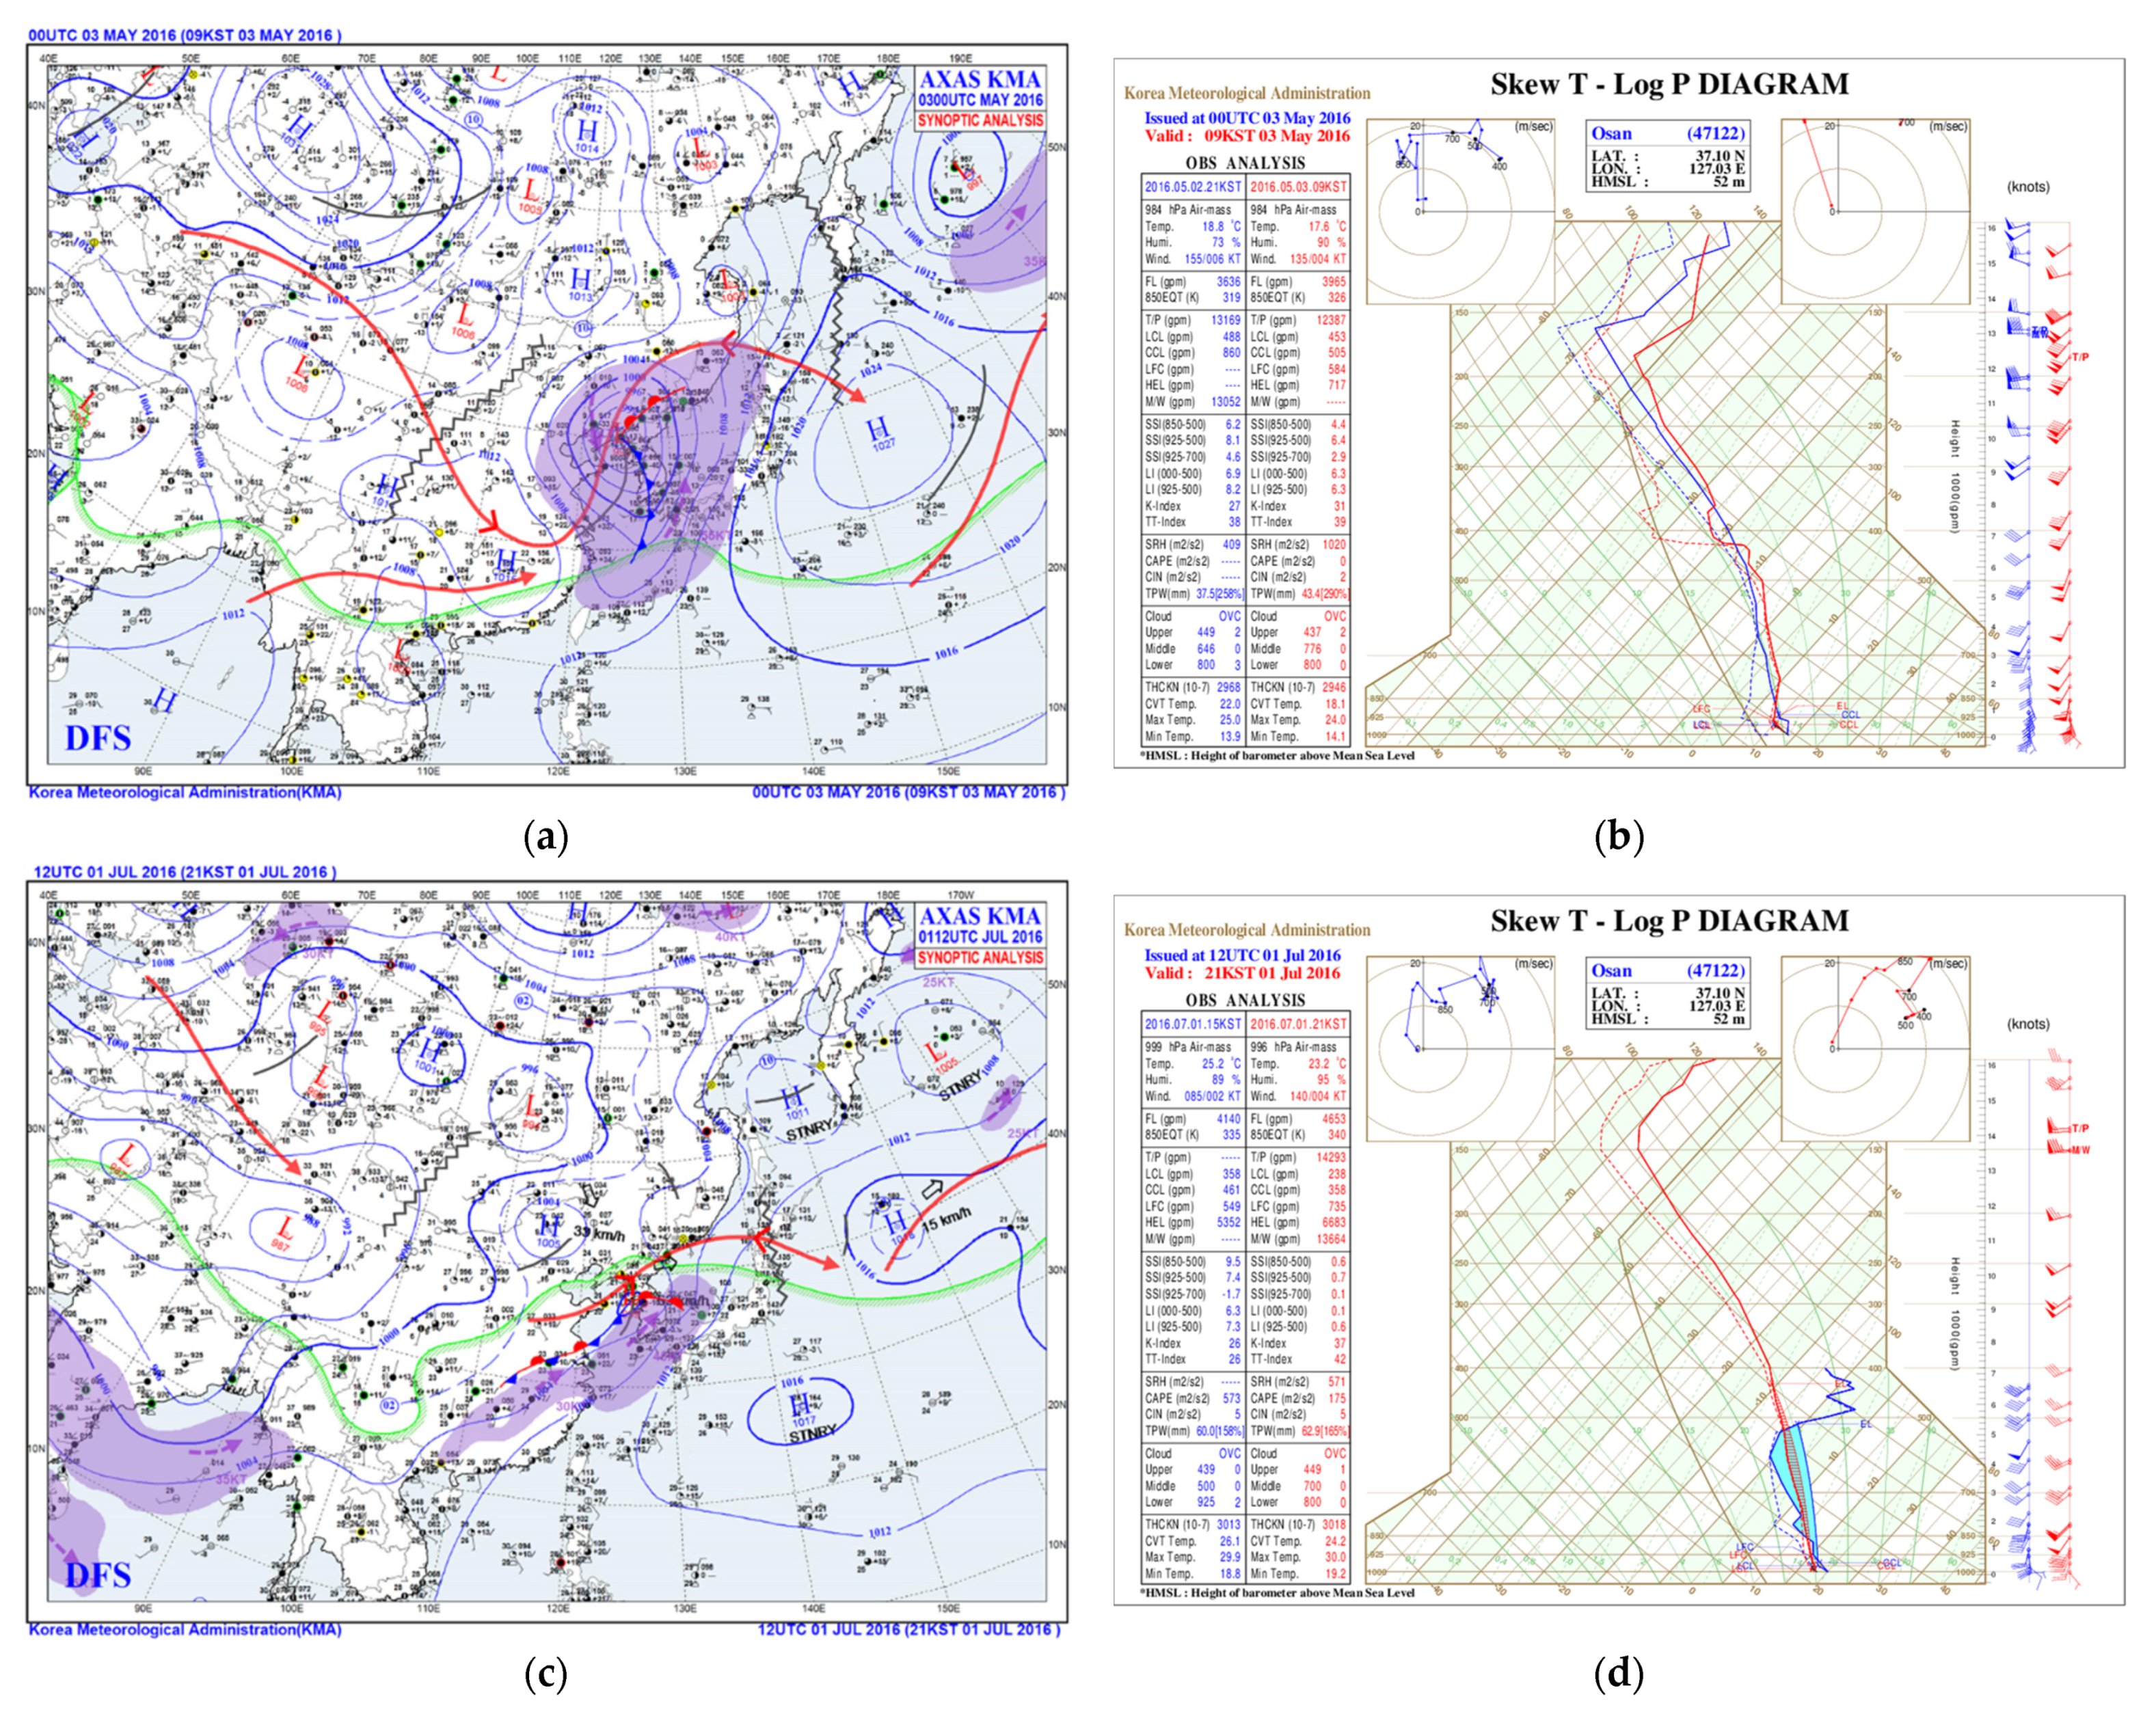
2.2. Description of Selected Cases

In this study, we selected the cases based on whether there was convective available potential energy (CAPE) or low-level jet stream (LLJ) to analyze the precipitation prediction characteristics of 3D-Var radar data assimilation. CAPE indicates thermal instability of the atmosphere, and those below 1000 m2 s−2 are classified as weak instability, those between 1000 to 2500 m2 s−2 are moderate, and those above 2500 m2 s−2 are high instability with possible convective cloud formation [44]. When a synoptic scale extratropical cyclone develops over the Yellow Sea, the air–sea interaction creates a lowering of the central atmospheric pressure and an increase in pressure gradient force. Accordingly, strong winds of more than 12.5 m s−1 with a scale of several hundred to thousand km in the lower atmosphere below 850 hPa often accompany the system (Table 1 and Figure 2 and Figure 3).
Case 1 is of a local, heavy rainfall event in the western region of Korea due to rapid growth of convective clouds over the Yellow Sea, north of the Changma front. Cold and dry air was introduced to the rear of the 500 hPa trough passing through Manchuria. In addition, high-temperature and humid southerly winds caused by the North Pacific High were advected, leading to a highly unstable atmosphere with 1365 m2 s−2 of CAPE in Gwangju radiosonde station. As a result, the convective clouds, which developed strongly at 1230 UTC on 17 July, approached the Seoul metropolitan and central inland areas, and cumulative precipitation of 263 mm was observed during the case period with a strong hourly precipitation of 40 mm h−1 or more (Figure 2a,b).
Case 2 shows a convective cloud that emerged due to the instability in the upper- and lower-level atmosphere in Gyeonggi-do, Gangwon-do, and Gyeongsang-do. The 500 hPa trough located in Manchuria moved south to the Korean Peninsula. The surface air temperature increased significantly during the day with strong solar radiation, which resulted in a more than 50 °C temperature difference between the 500 hPa and the surface. This led to an extremely unstable atmosphere, and the CAPE of 1243 m2 s−2 occurred in Osan radiosonde data. Strong convective clouds developed around the mid-Peninsula inland area, and the inland region was affected by local heavy rains of 50 mm h−1 or more. In addition, the accumulated precipitation of 20–60 mm was observed in Gangwon-do and Gyeongsang-do. Hail occurred due to the highly instable atmosphere, and farms in southern Gyeonggi-do, Gangwon-do, and northern Gyeongsangbuk-do suffered from severe damage (Figure 2c,d).
Case 3 is a precipitation event caused by the influence of an extratropical cyclone. An extratropical cyclone in Huazhong, China, which occurred on 2 May at 0000 UTC, passed near the Shandong Peninsula on 2 May and entered the Yellow Sea, where it developed rapidly with the supply of hot and humid air from the ocean. Moreover, the cyclone was located in front of the strong 500 hPa trough with cold air and the divergence zone of the 300 hPa upper-level jet stream coincided with each other, leading to a rapid growth of the cyclone and the emergence of a wide LLJ area. As a result, stratiform precipitation of less than 5 mm h−1 occurred throughout the Korean Peninsula. The observed AWS accumulated precipitation during the case period was over 80 mm in the central region and 220 mm in Jeju Island (Figure 3a,b).
Case 4 is an event affected by an extratropical cyclone which developed along the monsoon front. The monsoon front located in Huanan, China moved northward to Huazhong, China by the upper-level trough. In addition, the upper-level jet divergence zone in North Korea rapidly developed the extratropical cyclone, which affected the Korean Peninsula. High temperature and humid air from Huanan, China and East China Sea ascended rapidly, resulting in a LLJ flowing into the Korean Peninsula. During the case period, accumulated precipitation of over 150 mm in the central region of the Korean Peninsula and 120 mm in the southern region were observed (Figure 3c,d). As mentioned at the beginning of Section 2.2, we classified case 1 and 2 as mesoscale precipitation and case 3 and 4 as synoptic-scale precipitation events in this study. Furthermore, the mesoscale precipitation cases were named as Meso 1 and Meso 2, and the synoptic-scale precipitations as Synop 1 and Synop 2, respectively, for easier recognition.

2.3. WRF Model Setup

We used a state-of-the-art limited area model, referred to as Weather Research and Forecasting (WRF) Model version 3.7.1 [45]. Many improvements have been made to the model and radar assimilation codes while conducting the experiments. However, the most important module in the precipitation simulation is the cloud microphysics scheme and there were no serious bugs reported. Thus, there should not be any problem in deriving the conclusions based on the study results in the paper. The details of the model configuration used in the present study are discussed in Table 2. All the forecasts were generated with three nested domains; the outer domain consisting of 301 × 301 grids with 13.5 km horizontal grid resolution in x- and y-direction, the inner domain consisting of 337 × 364 grids (4.5 km horizontal grid resolution), and the innermost domain consisting of 640 × 820 (1.5 km horizontal grid resolution) grid points. The mother domain (13.5 km) was configured to allow large scale synoptic features to propagate appropriately over Korea. The number of vertical levels used was 60, and the top of the model atmosphere was located at 50 hPa. The mother domain was configured to allow large-scale monsoon features over the Korean Peninsula. The innermost domain of 1.5 km resolution was needed to account for the complexity of the local topography and to compare directly with the radar observations (Table 2 and Figure 1a). The initial conditions for the outer domain were provided by the National Center for Environmental Prediction (NCEP) Final analysis (FNL) data. The initial condition was enhanced by assimilation of local observations through the WRF 3D-Var schemes [46,47]. The 30-s datasets from United States Geological Survey (USGS) were used to create the surface boundary conditions, such as model topography, land use, soil types, and monthly vegetation fraction. The initial, lower and lateral boundary conditions for the inner domains were obtained by interpolating the fields from the outer domain. We also used the WDM6 microphysics scheme in this study for both control run (CTRL) and 3D-Var assimilation run (DA). The WDM6 allows for six types of hydrometeors—vapor mixing ratio (qvapor), rain mixing ratio (qrain), ice mixing ratio (qice), cloud mixing ratio (qcloud) snow mixing ratio (qsnow) and graupel mixing ratio (qgraupel) to be predicted in the model. WDM6 scheme has been widely used to simulate and conduct precipitation-related research in East Asia including Korea [26,39]. Therefore, the model was performed using WDM6 in this study [39,48].
Further, a few studies have revealed that the activation of cumulus parameterization for simulation with grid spacings of 2–3 km produced an overall similar storm structure to the simulation with explicit convection [49,50,51]. Therefore, the cumulus parameterization scheme was not applied in domain 3 of model simulation.

2.4. WRF 3D-Var Assimilation System

The 3D-Var method in the WRF data assimilation system is capable of assimilating all types of conventional observations as well as remote sensing observations [18]. The 3D-Var system combines the observations with background information on the model state and uses a linearized forecast model to ensure that the observations given are dynamically realistic and consistent in the analysis field. In this study, we used an incremental WRF 3D-Var data assimilation system [39,40]. The 3D-Var incremental system minimizes a scalar term called the cost function (or objective function, J) defined as a function of the analysis increment relative to the first gauss (background) using a linearized observation operator. The minimizations subjected to the constraint of observation uncertainty, the difference between the observations and the analysis projected to the observation space using the observations operator (H).
J = J b + J o = 1 2 ν T ν + 1 2 ( d H U ν ) T   R 1 ( d H U ν )   H ( x )
The terms Jo and Jb are the cost functions obtained from the observation and background term, R is the observation error covariance matrix. The term d = JoH(x) is the innovation vector, which measures the departure of the observation yo and the corresponding model parameters H(xb), H is the linearization of the nonlinear observation operator H. The term ν is the control variable, where ν = U−1 (x − xb), U is the decomposition of the background error covariance B under the constraint B = UUT. The covariance matrix for the regional background error statistics was calculated using NMC method [52] by taking 24 h and 12 h forecasts during the summer period (June, July and August) for the chosen domain with five control variables. These were the stream-function, unbalanced temperature, unbalanced surface pressure, unbalanced velocity potential, and pseudo-relative humidity. The minimization of cost was performed using conjugate gradient method. In all the four cases considered in this study (Table 1), an hourly updated data assimilation cycle for 6 h was made. In each assimilation cycle, observations from radar reflectivity, radial velocity and AWS observations were used during a one hour period. In the case of the radar reflectivity data assimilation, it consisted of a relative humidity operator and an assimilation algorithm for hydrometeor retrievals [4,5,10,11,18,25,26]. To provide a favorable environment for the formation of hydrometeors, the relative humidity of the numerical weather prediction model was adjusted to 75% if there was a radar reflectivity between 25~30 dBZ above the lifted condensation level (LCL), and was adjusted to 85% if it was more than 30 dBZ [25]. The performance of this 3D-Var assimilation system on improving precipitation forecasts was tested using two convective cases in the year 2014, 2017 and two stratiform rain events in the year 2016. In the data assimilation system, it was also important to analyze the data input and the impact of those data in the analysis field. For each assimilation cycle, approximately 8–9 radar sites’ data were assimilated. In case of AWS data, an average of approximately 675 stations were used to assimilate temperature, pressure, and relative humidity in the assimilation system.

2.5. Evaluation Parameters

For an objective comparison of the forecasts, we considered a number of evaluation parameters described below.

2.5.1. The Contoured Frequency by Altitude Diagram (CFAD)

The CFAD is a contour plot displaying the frequency distribution of reflectivity in an area of detectable echo volume at each vertical height in a single contour plot. Many studies show that the CFAD is a convenient tool to examine the characteristics of storms, especially for their temporal evolution [39]. The CFAD begins with a histogram calculation using a constant reflectivity bin width within a constant vertical volume [53]. The CFAD ignores the horizontal echo structure and summarizes the frequency distribution information in a single two dimensional plot. The mathematical descriptions of CFADs are discussed [54]. In this study, to plot CFAD diagram, the area was limited to a radius of 100 km from the observation point, considering the characteristics of the weather radar observation. To exploit the reflectivity information of an area where precipitation occurred, we used the vertical reflectivity information of the area where AWS precipitation of 0.1 mm or more was observed and the vertical interval was 250 m. The histograms were normalized with the total number of points at each vertical level and the results were converted as a percentage value. The average reflectivity ( Z d b ¯ ) and the average of the reflectivity factor in linear units ( Z d b ¯     l i n e a r , in mm−6 m−3) for each height is calculated as follows:
  Z d b ¯     l i n e a r = 1 N k   i = 1 n d B Z i
Z d b ¯ l i n e a r = 10 × l o g 10 ( 1 N k   i = 1 n 10 0.1 × d B Z i )
Here, N is the total number of points at each height (level). In addition, we also calculated the cumulative reflectivity frequencies of the 25th, 50th, and 75th percentiles and included them in each of the CFAD plots.

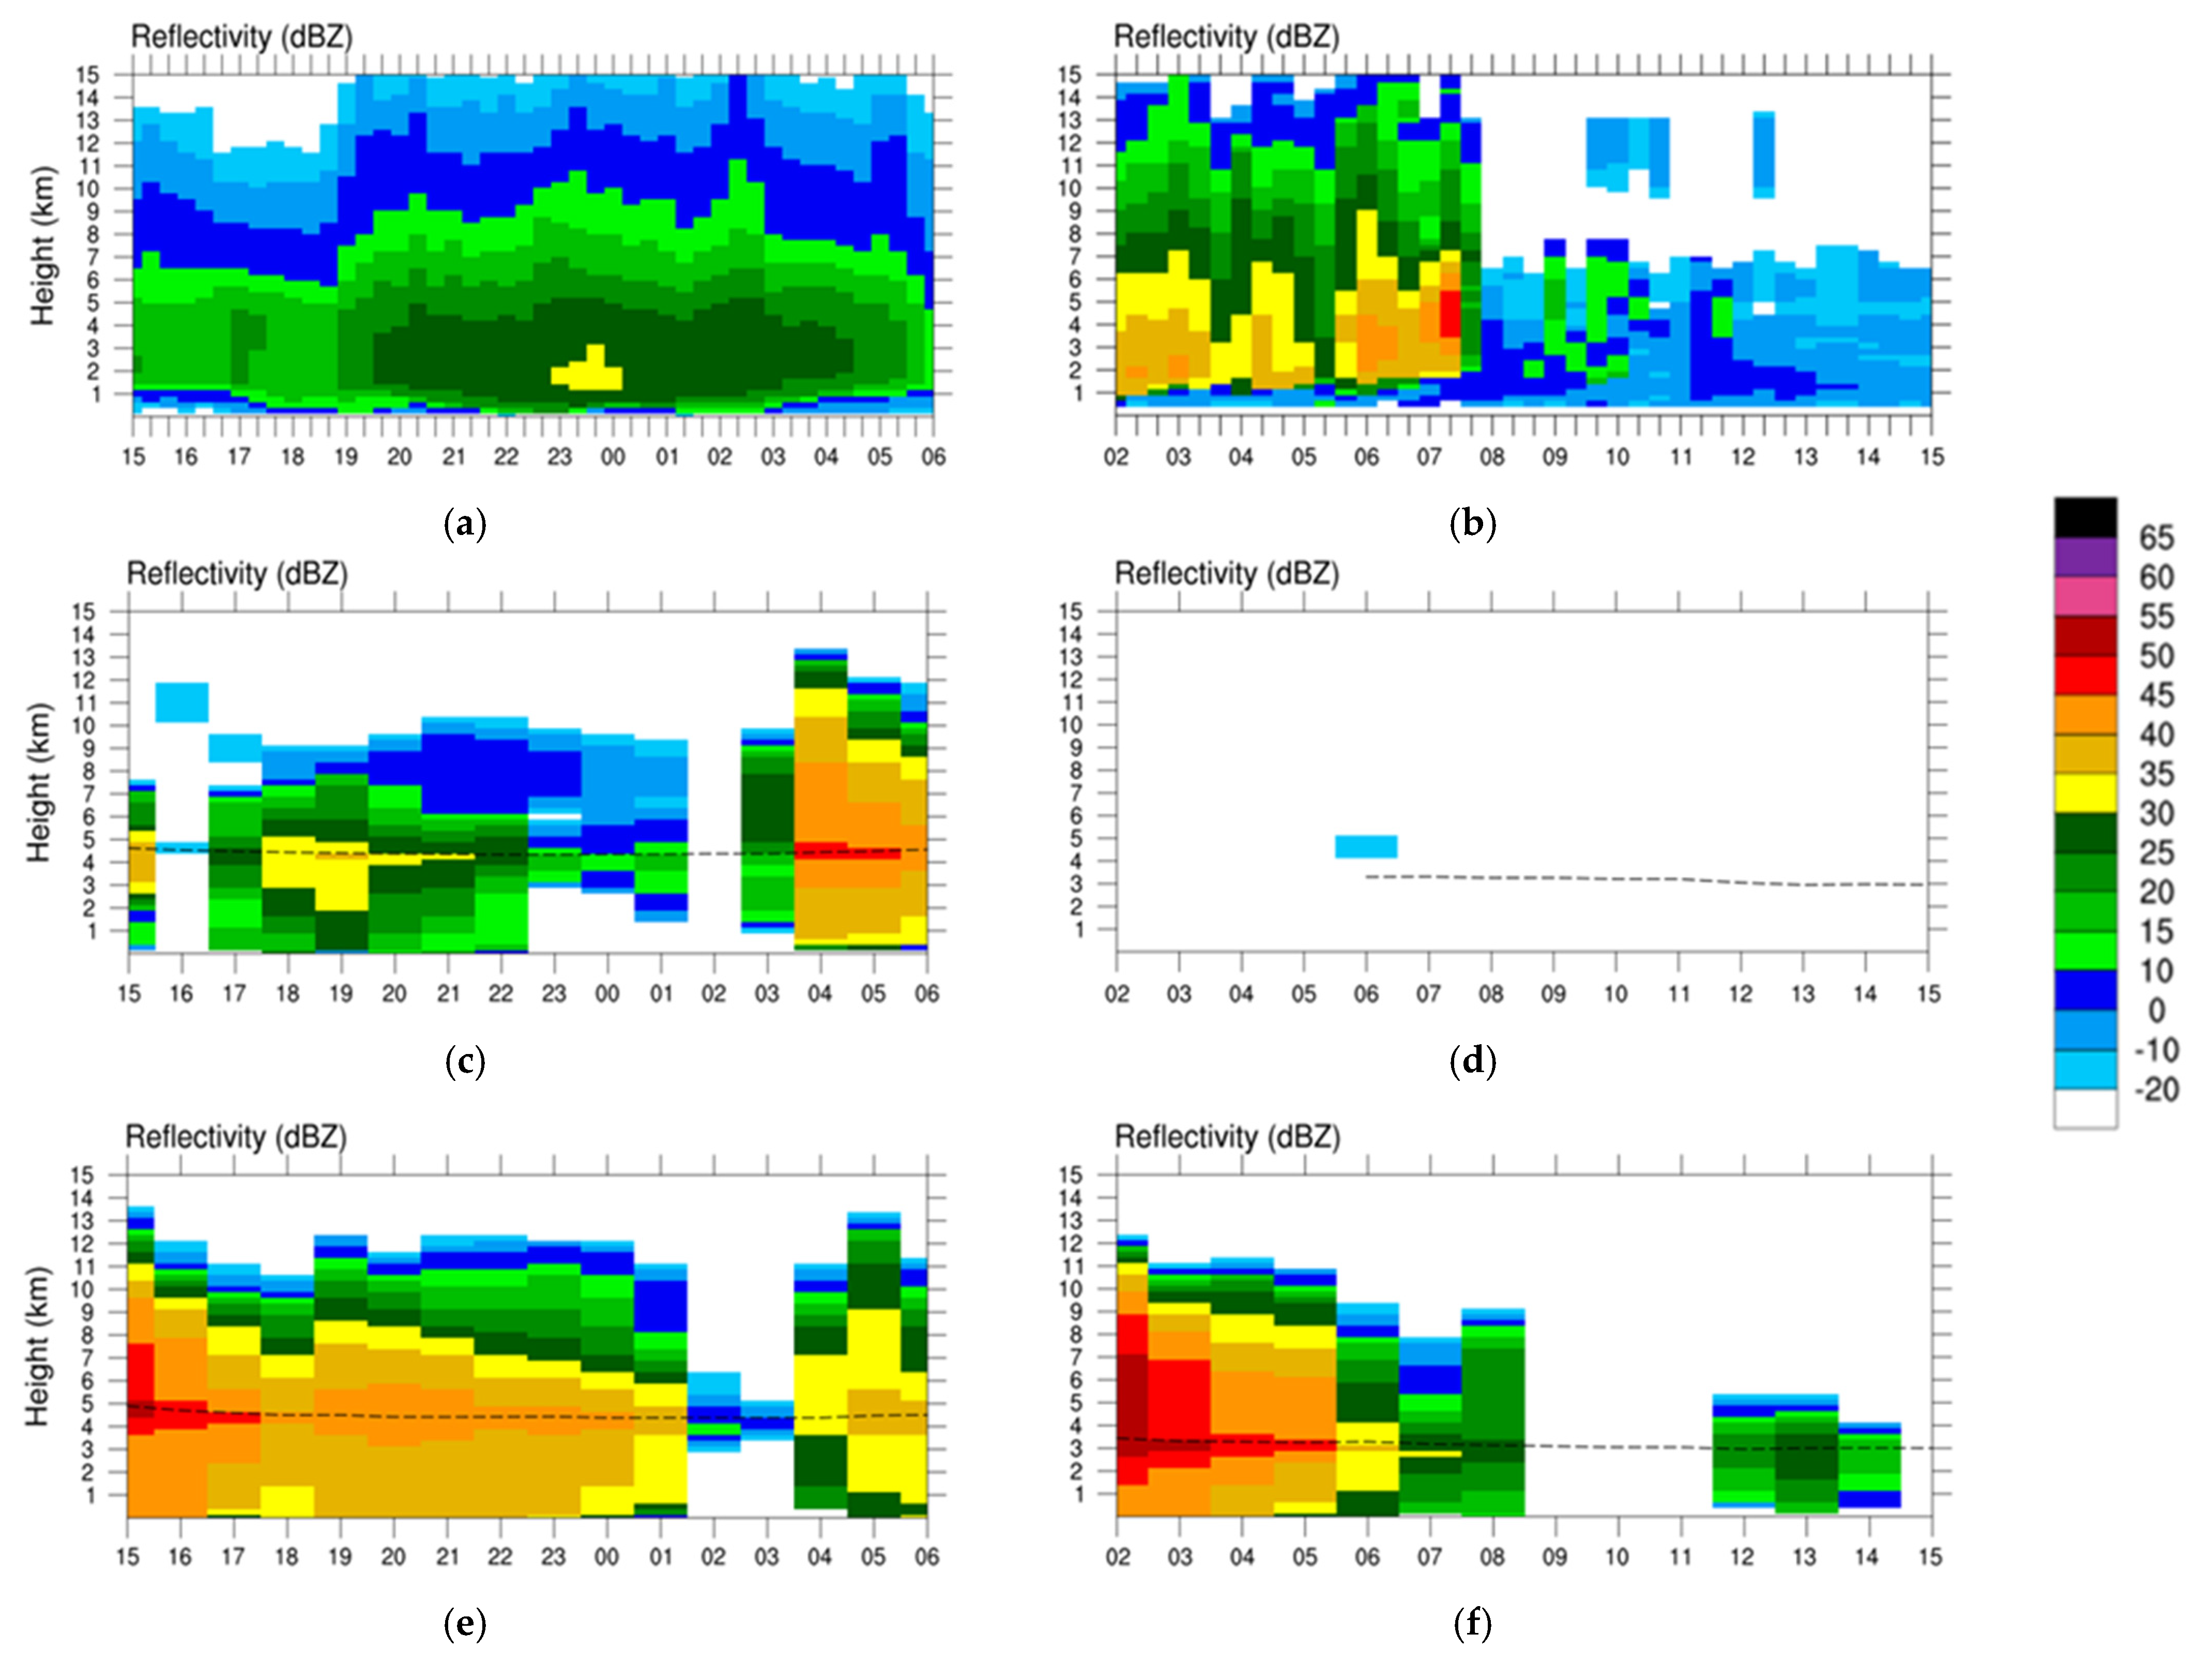
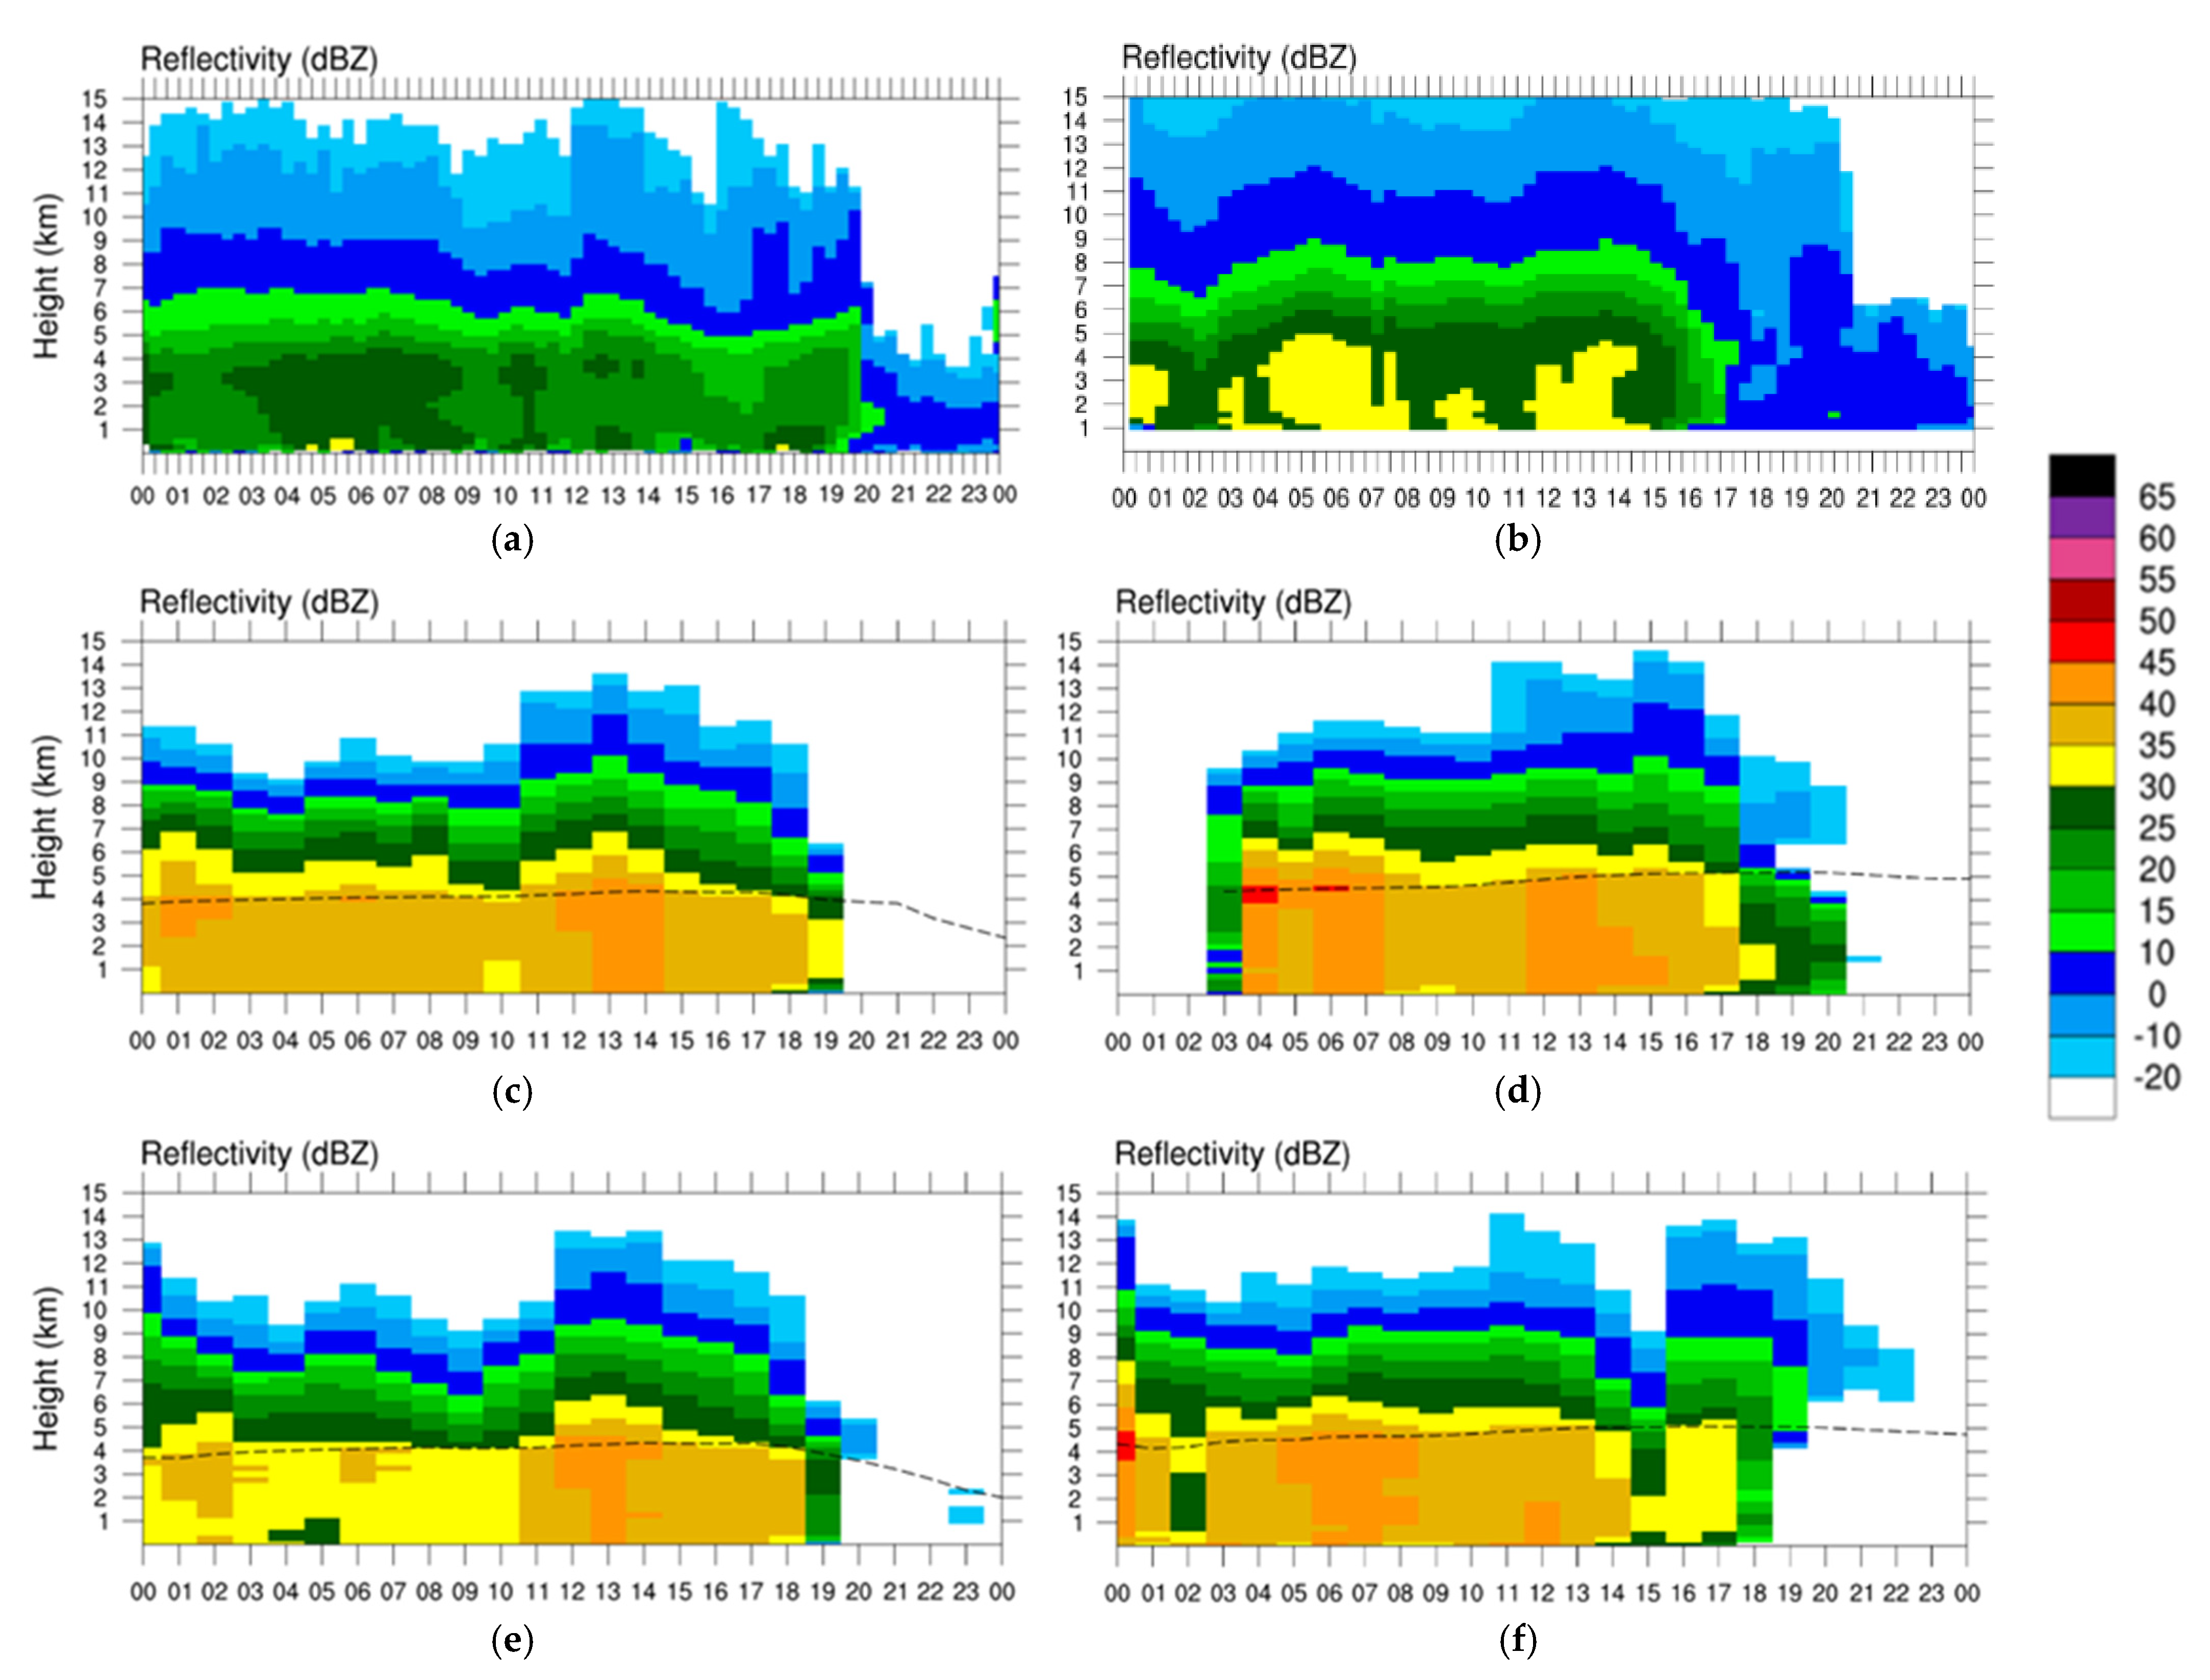
2.5.2. Time-Height Cross Sections (THCS)

The time-height cross sections diagram is useful to identify the duration of the precipitation and the varying echo tops of the precipitating system. It is used to augment CFAD, which does not reveal the time evolution characteristics of reflectivity (and so precipitation) that are related to phase errors in simulating any storm. We calculated the time-height cross sections of simulated reflectivity with a 1 h temporal resolution whereas the radar observations were made with 20 min resolution (temporal). All the observed datasets were vertically interpolated to 0.25 km from their native polar and the model datasets sigma vertical coordinates to the same vertical resolution. The range was limited to approximately 100 km radius. The Bright Band in the time-height cross section is represented by a line that stretches horizontally with higher reflectivity than the neighboring area. It is useful to identify the duration of the precipitation and the varying echo tops of the precipitating system. The time-height cross sections diagram is used to augment CFAD, which does not reveal the time evolution characteristics of precipitation that are related to phase errors in simulating storms [39].

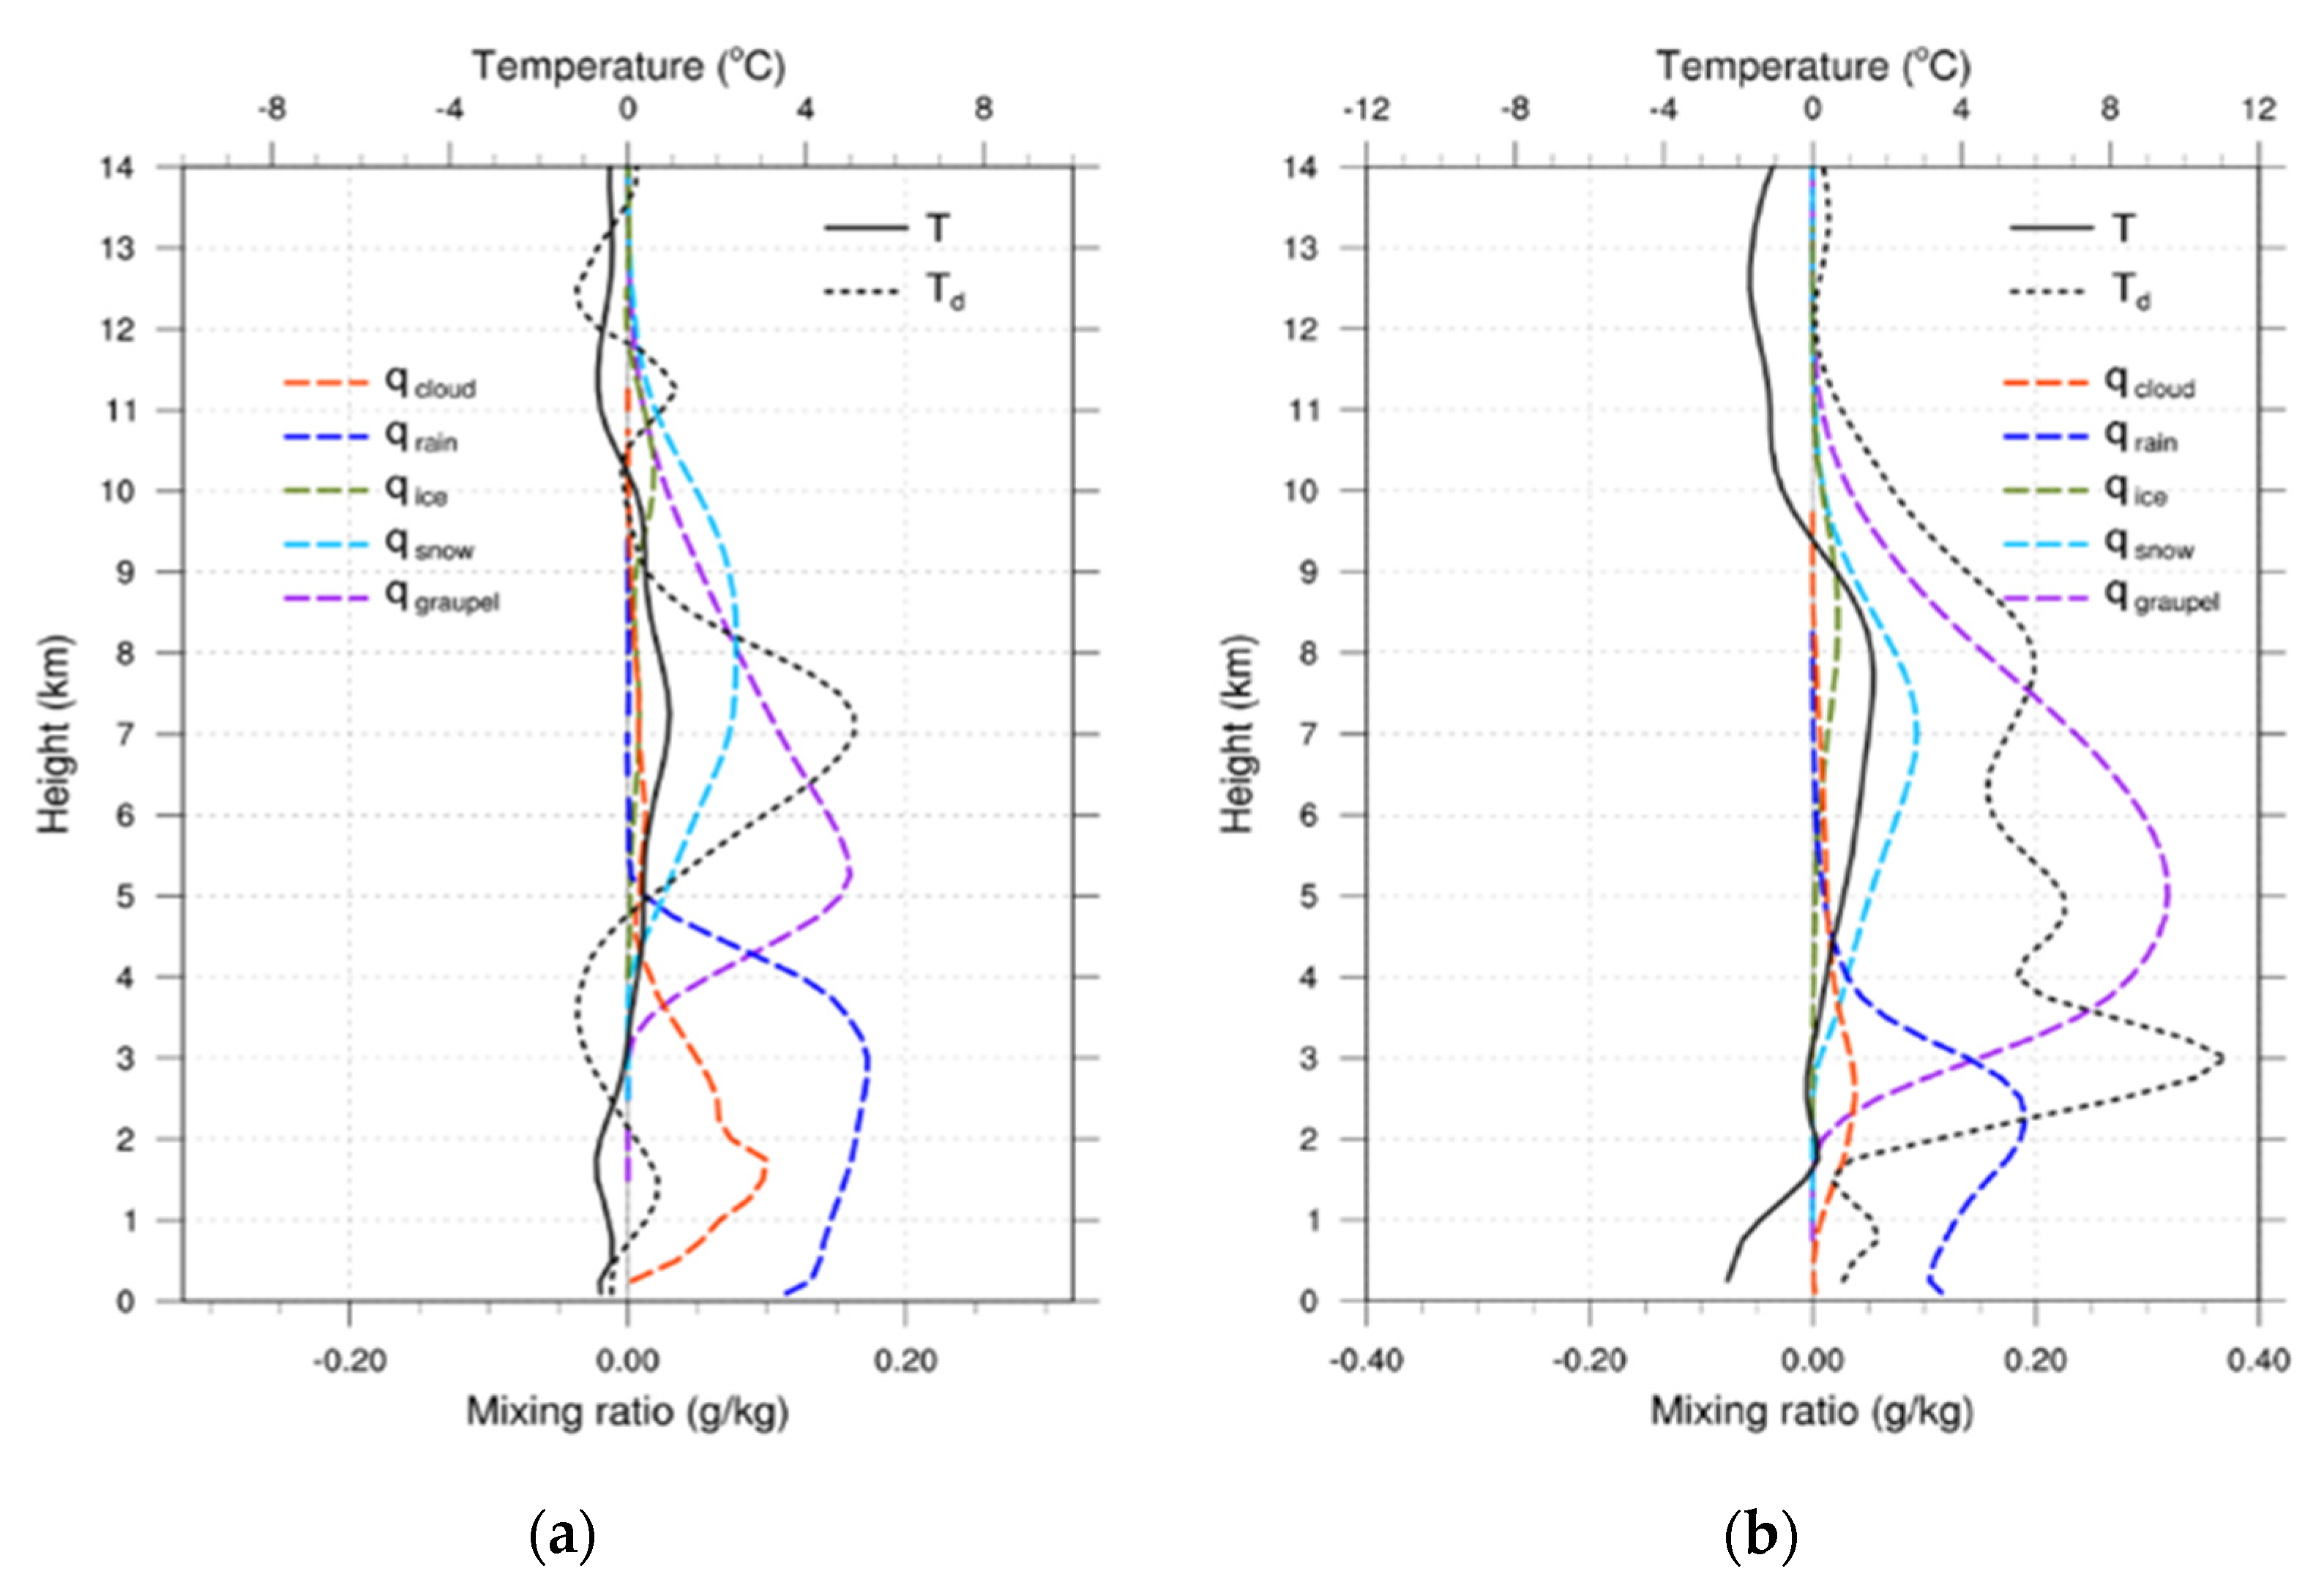
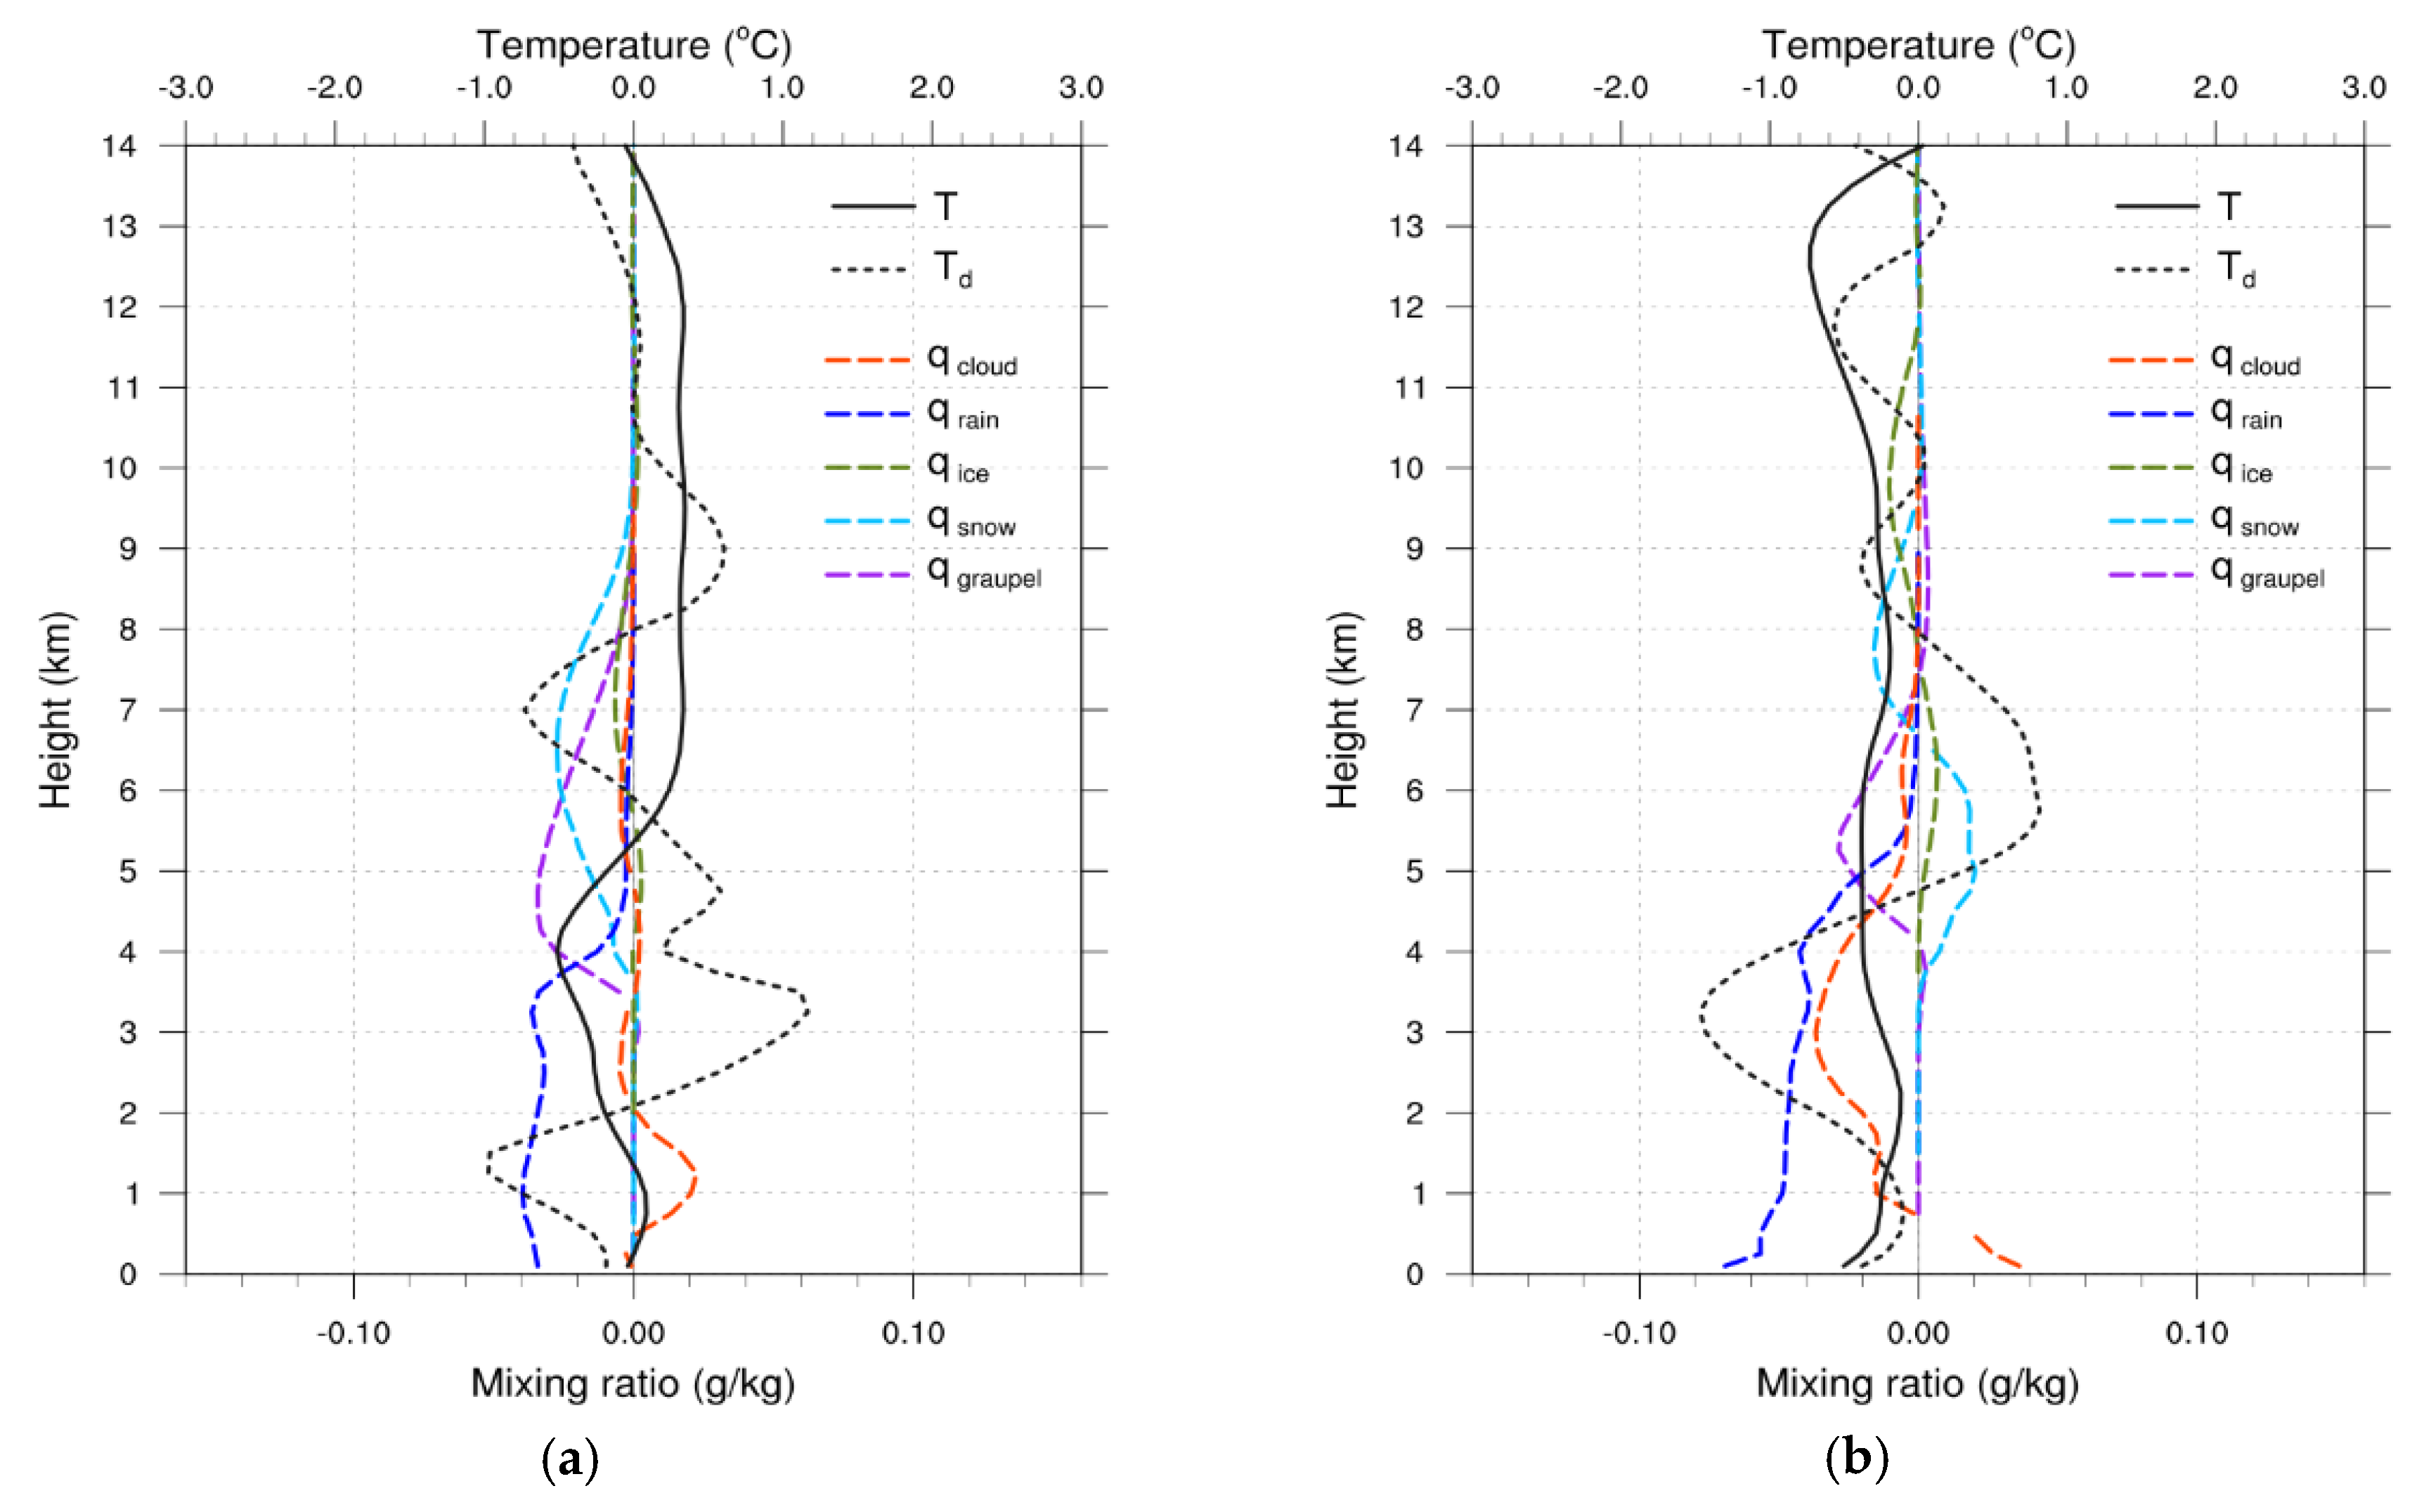
2.5.3. Hydrometeor Profile Analysis

We conducted the hydrometeor profile analysis (1) to analyze the change in humidity and the hydrometeor distribution in the initial dynamic field of the model through the radar data assimilation, and (2) to understand the microphysical processes of the clouds compared to the control run. With this, we analyzed the changes in qvapor, qrain, qice, qcloud, qsnow, and qgraupel due to the generation of clouds and precipitation during the prediction period of the cases, and investigated the cloud microphysical processes of the NWP model and the prediction characteristics of radar data assimilation.

3. Results

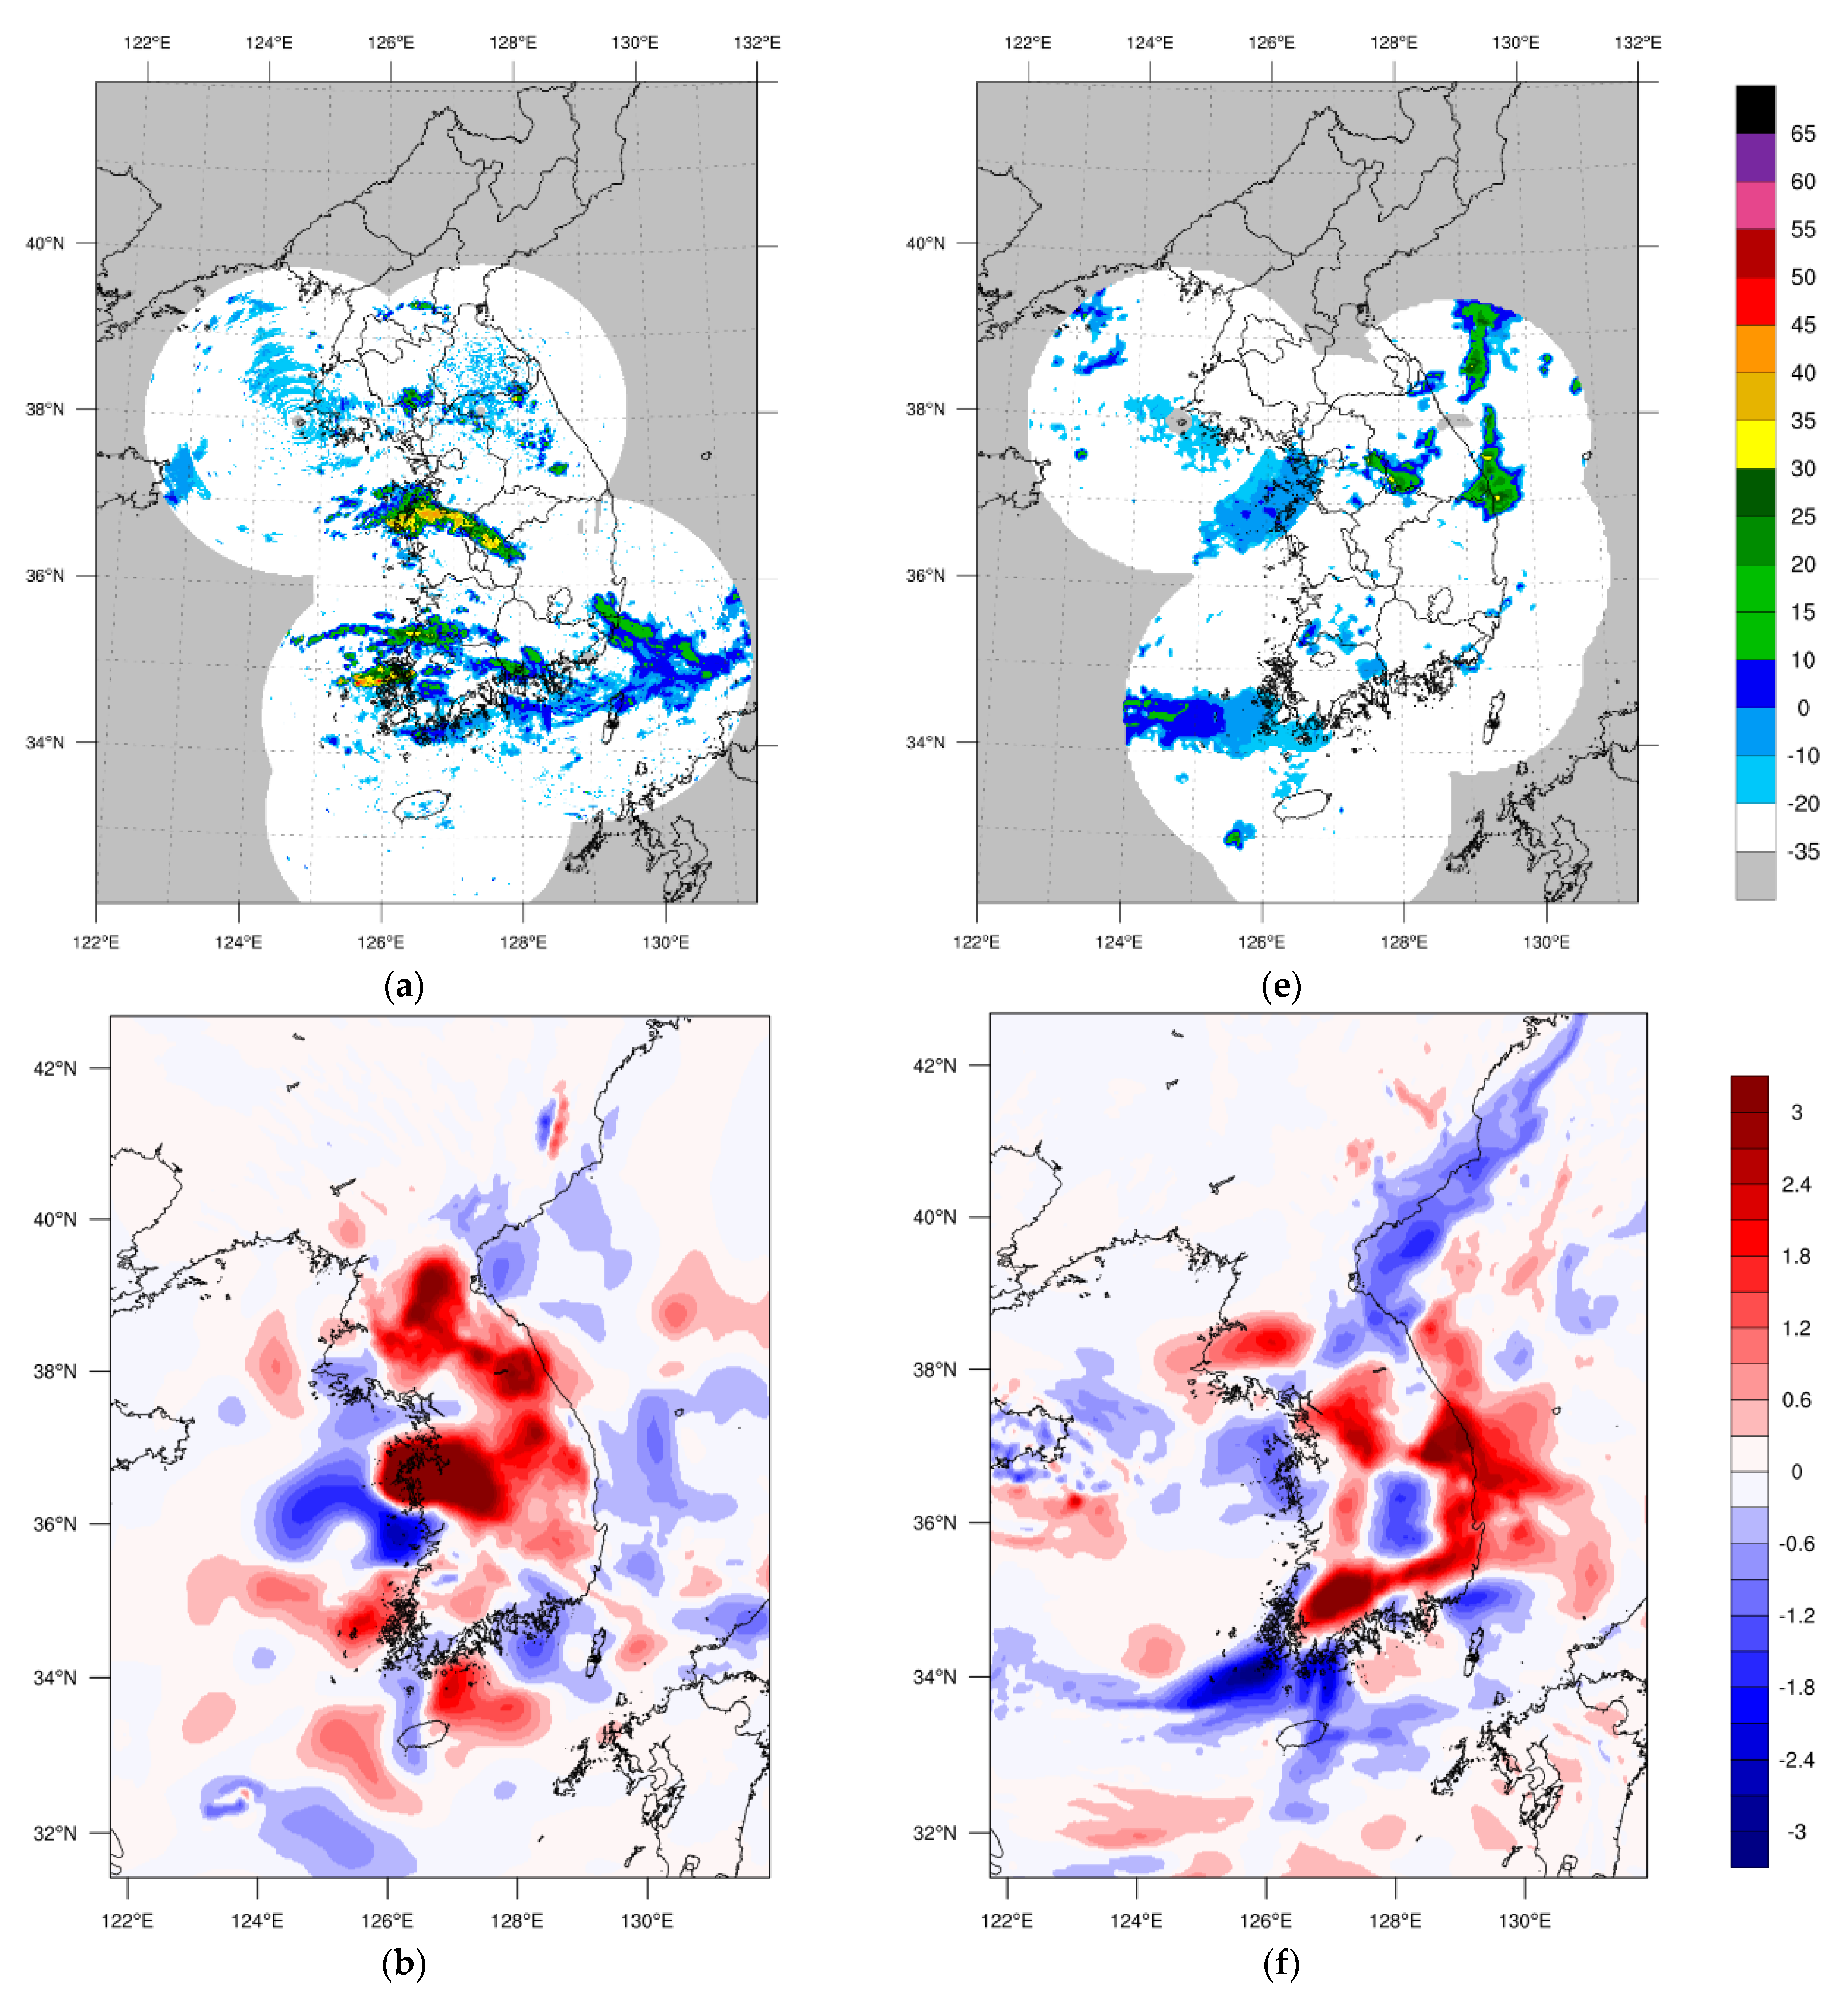
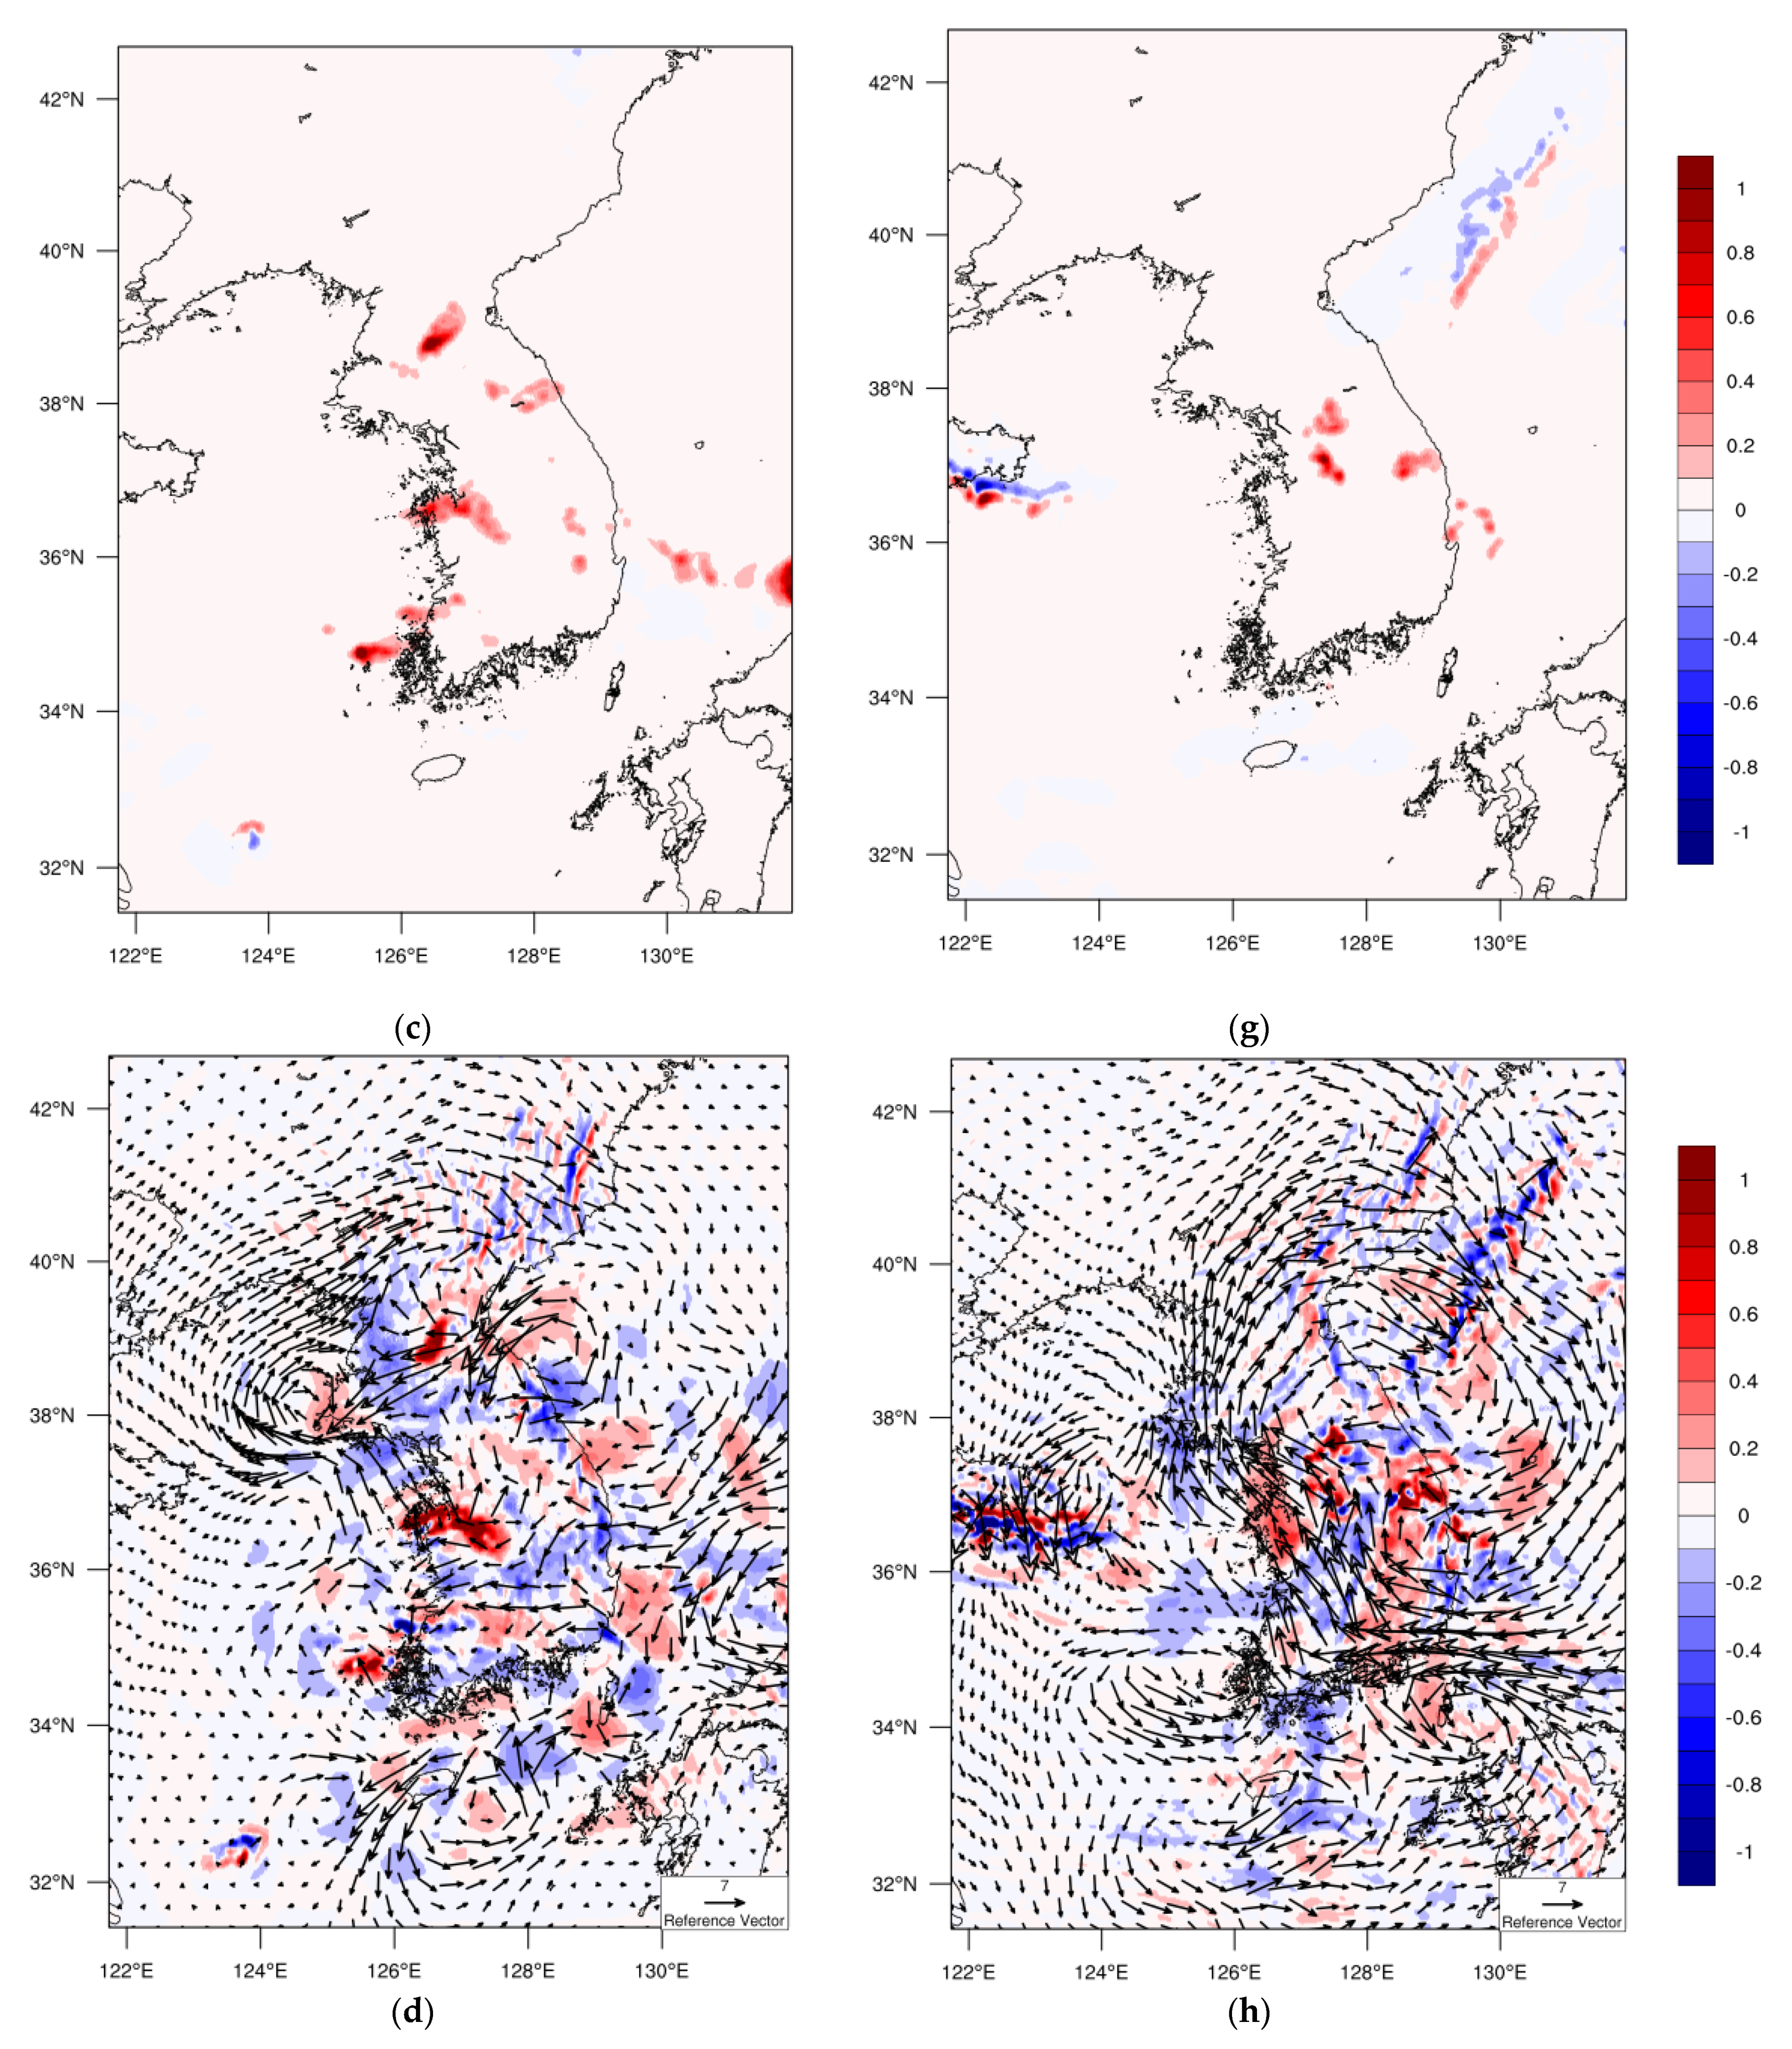
3.1. Analysis of the Incremental Initial Field

We analyzed the difference in the incremental initial fields between the data assimilation experiment and the control run by conducting the weather radar data assimilation. Through this analysis, we identified how much improvement was made in the initial field of the model compared to the control run (Figure 4 and Figure 5).
In the initial field of Meso 1 (1430 UTC on 17 July 2014), convective clouds were in the Chungcheong-do region, and the radar reflectivity of more than 30 dBZ was distributed at an altitude of 700 hPa (about 3 km) (Figure 4a). The strong reflectivity in this region was applied to the model through the relative humidity operator, which led the increase in the vapor mixing ratio up to 3 g kg−1 or more, compared to the control run (Figure 4c). As the surrounding area was saturated, the rainwater mixing ratio increased, based on the model temperature field classification (Figure 4e). Strong convective clouds simulated in the Chungcheong-do region showed that the vertical upward airflow was increased by more than 1 m s−1 (Figure 4d).
In the incremental initial field of Meso 2 (0130 UTC on 1 June 2017), there were convective clouds in the eastern Gyeonggi-do and the western region of Gangwon-do with a strong, vertical reflectivity of 20–35 dBZ (Figure 4e). In the regions where reflectivity existed, the water vapor and rainwater mixing ratio increased by 2~3 g kg−1 and 0.6 g kg−1, respectively. Thus, the atmosphere became saturated, clouds were formed, and precipitation was simulated (Figure 4f,g). A horizontal convergence was formed around the convective clouds simulated in the model and ascending air increased. The region of cold air at 700 hPa and the southerly winds created an unstable environment where convective clouds developed (Figure 4h).
On the other hand, in the incremental initial field of Synop 1 (0500 UTC on 2 May 2016), a radar reflectivity of 15~35 dBZ was distributed at an altitude of 700 hPa (about 3 km) as an extratropical cyclone passed through (Figure 5a). Due to the radar reflectivity of more than 25 dBZ located over the Yellow Sea, the water vapor mixing ratio increased by about 2 g kg−1. In the western inland of Korea, the water vapor mixing ratio decreased since no clouds were generated compared to the control run (Figure 5b). Moreover, the rainwater mixing ratio was oversimulated in the control run, which reduced the ratio by 0.5~1.0 g kg−1 in waters off the Yellow Sea (Figure 5c). The ascending air slightly increased in the region with increased vapor and rainwater mixing ratios. A stronger low pressure center was simulated in the control run without data assimilation, but data assimilation reduced the intensity of the low pressure (Figure 5d). Throughout the domain, a clockwise rotating circulation was formed, reducing the oversimulated low pressure in the western region of the Korean peninsula.

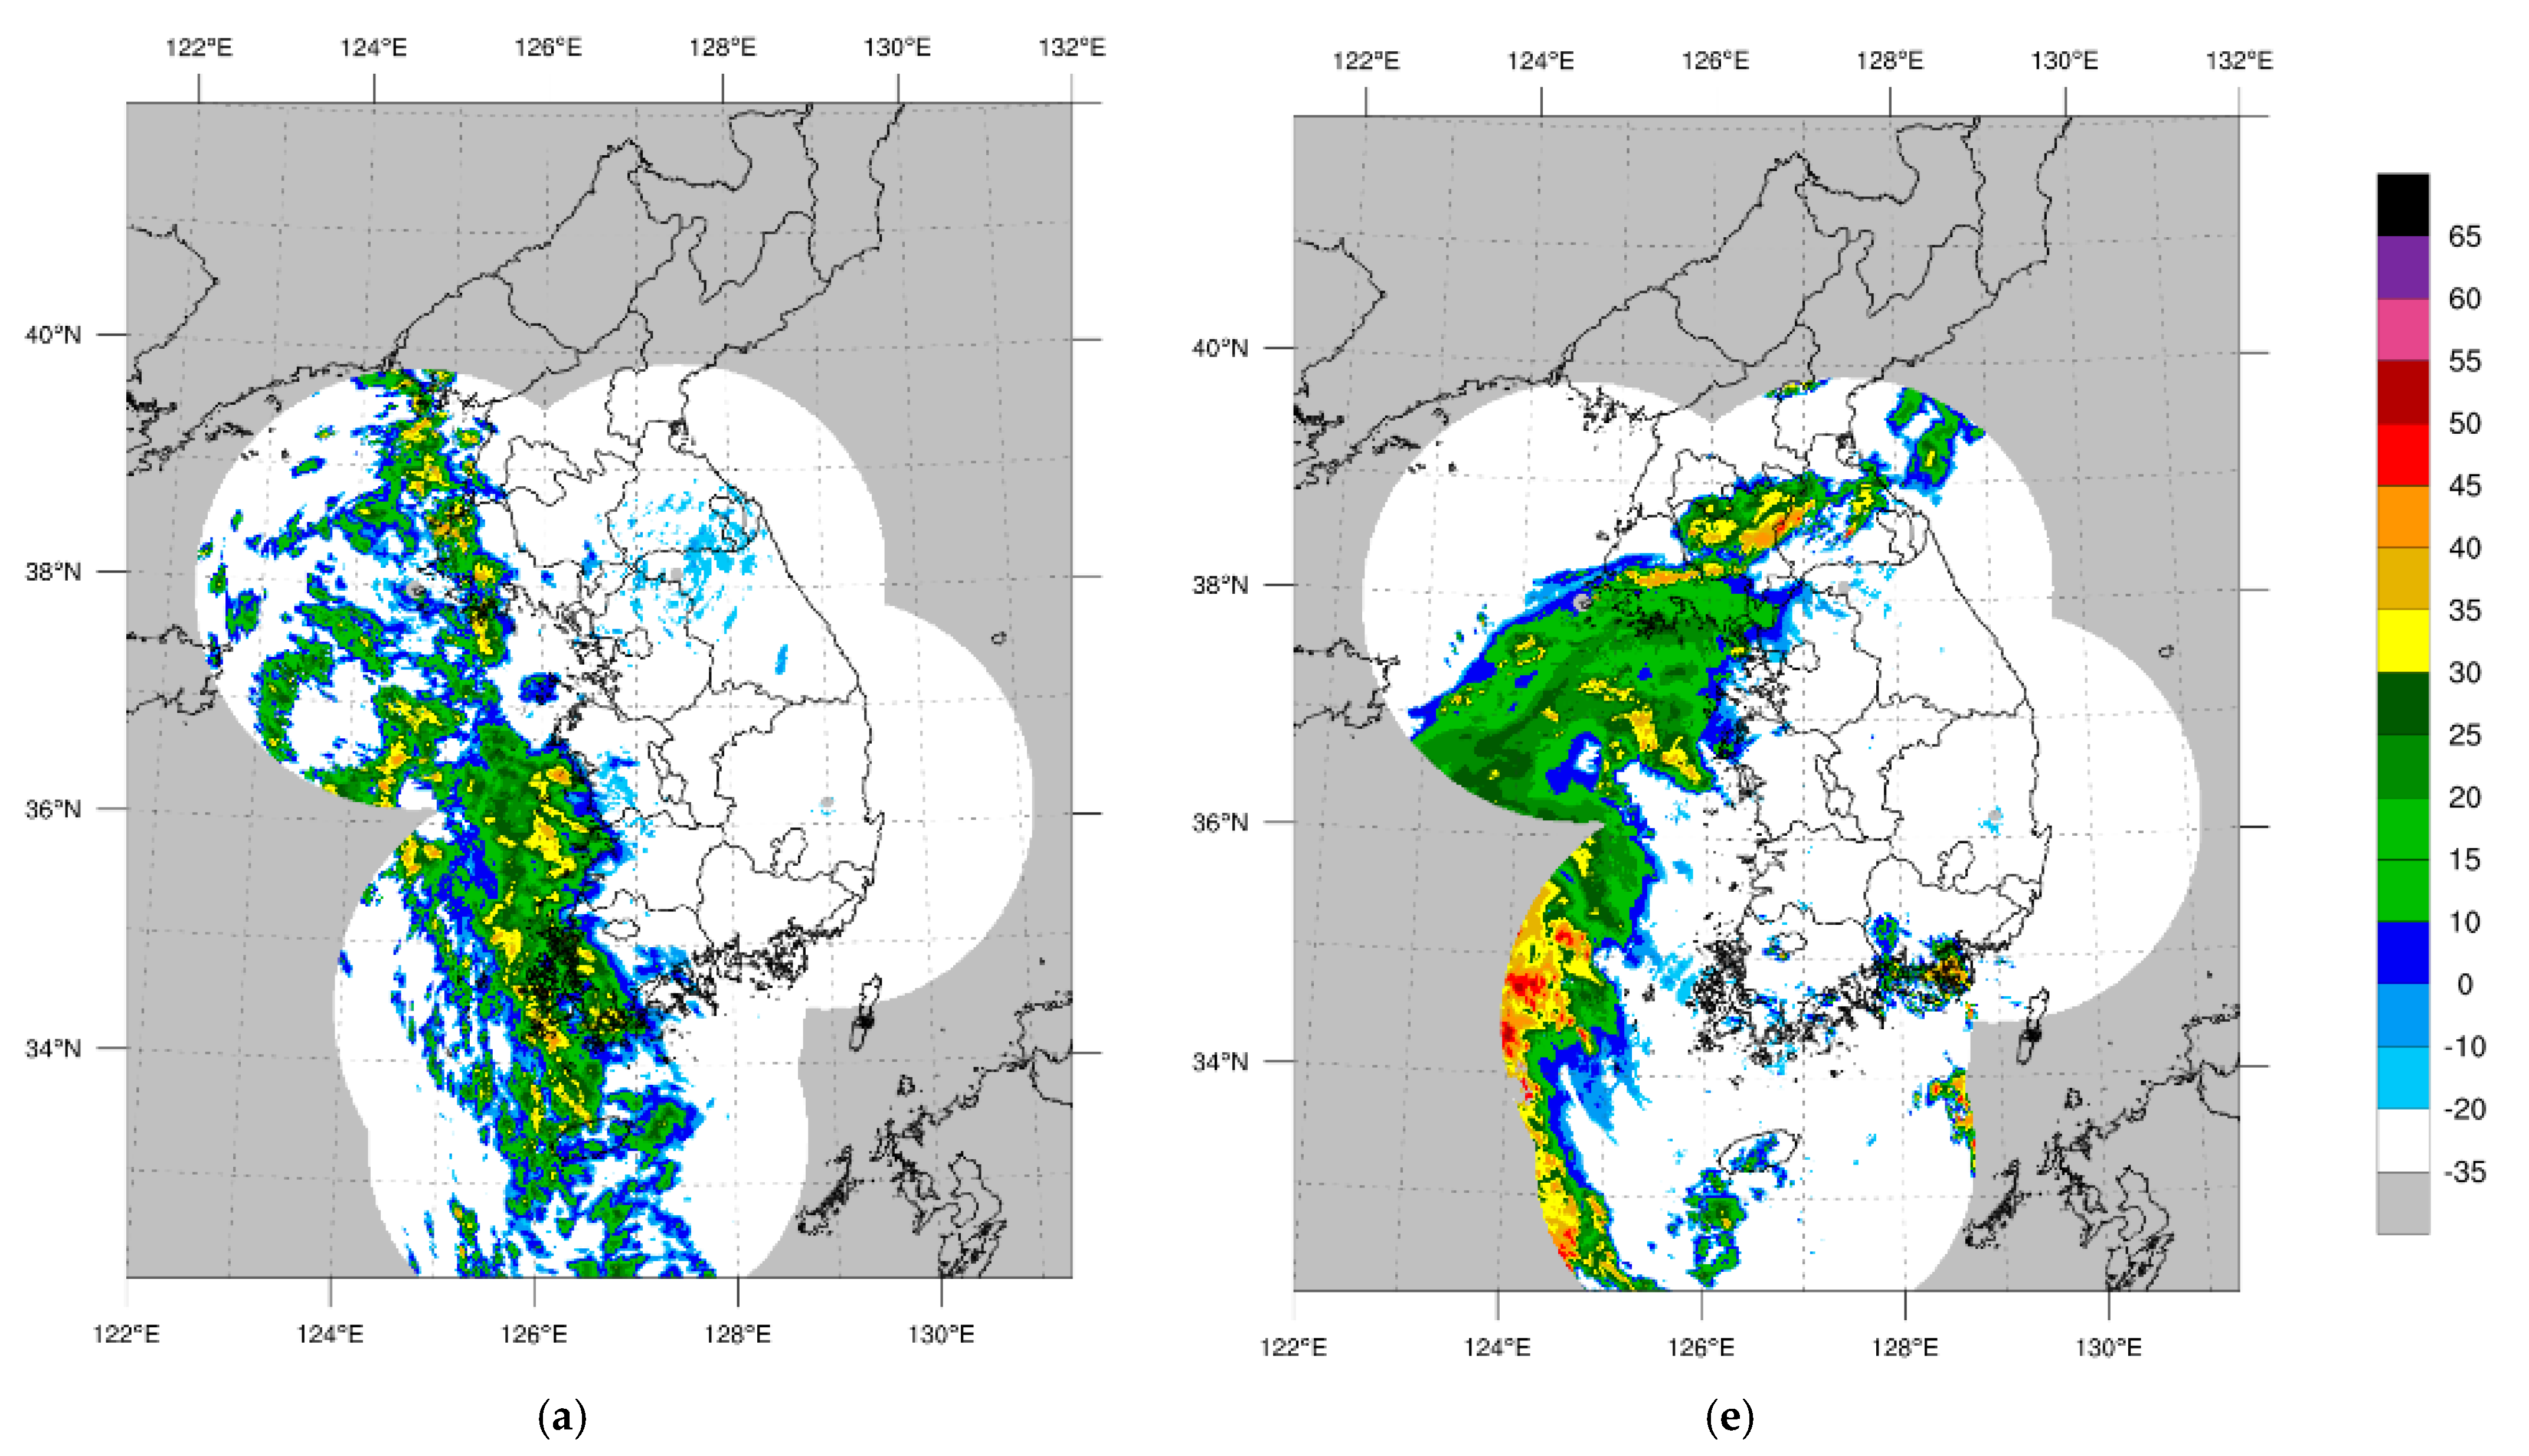
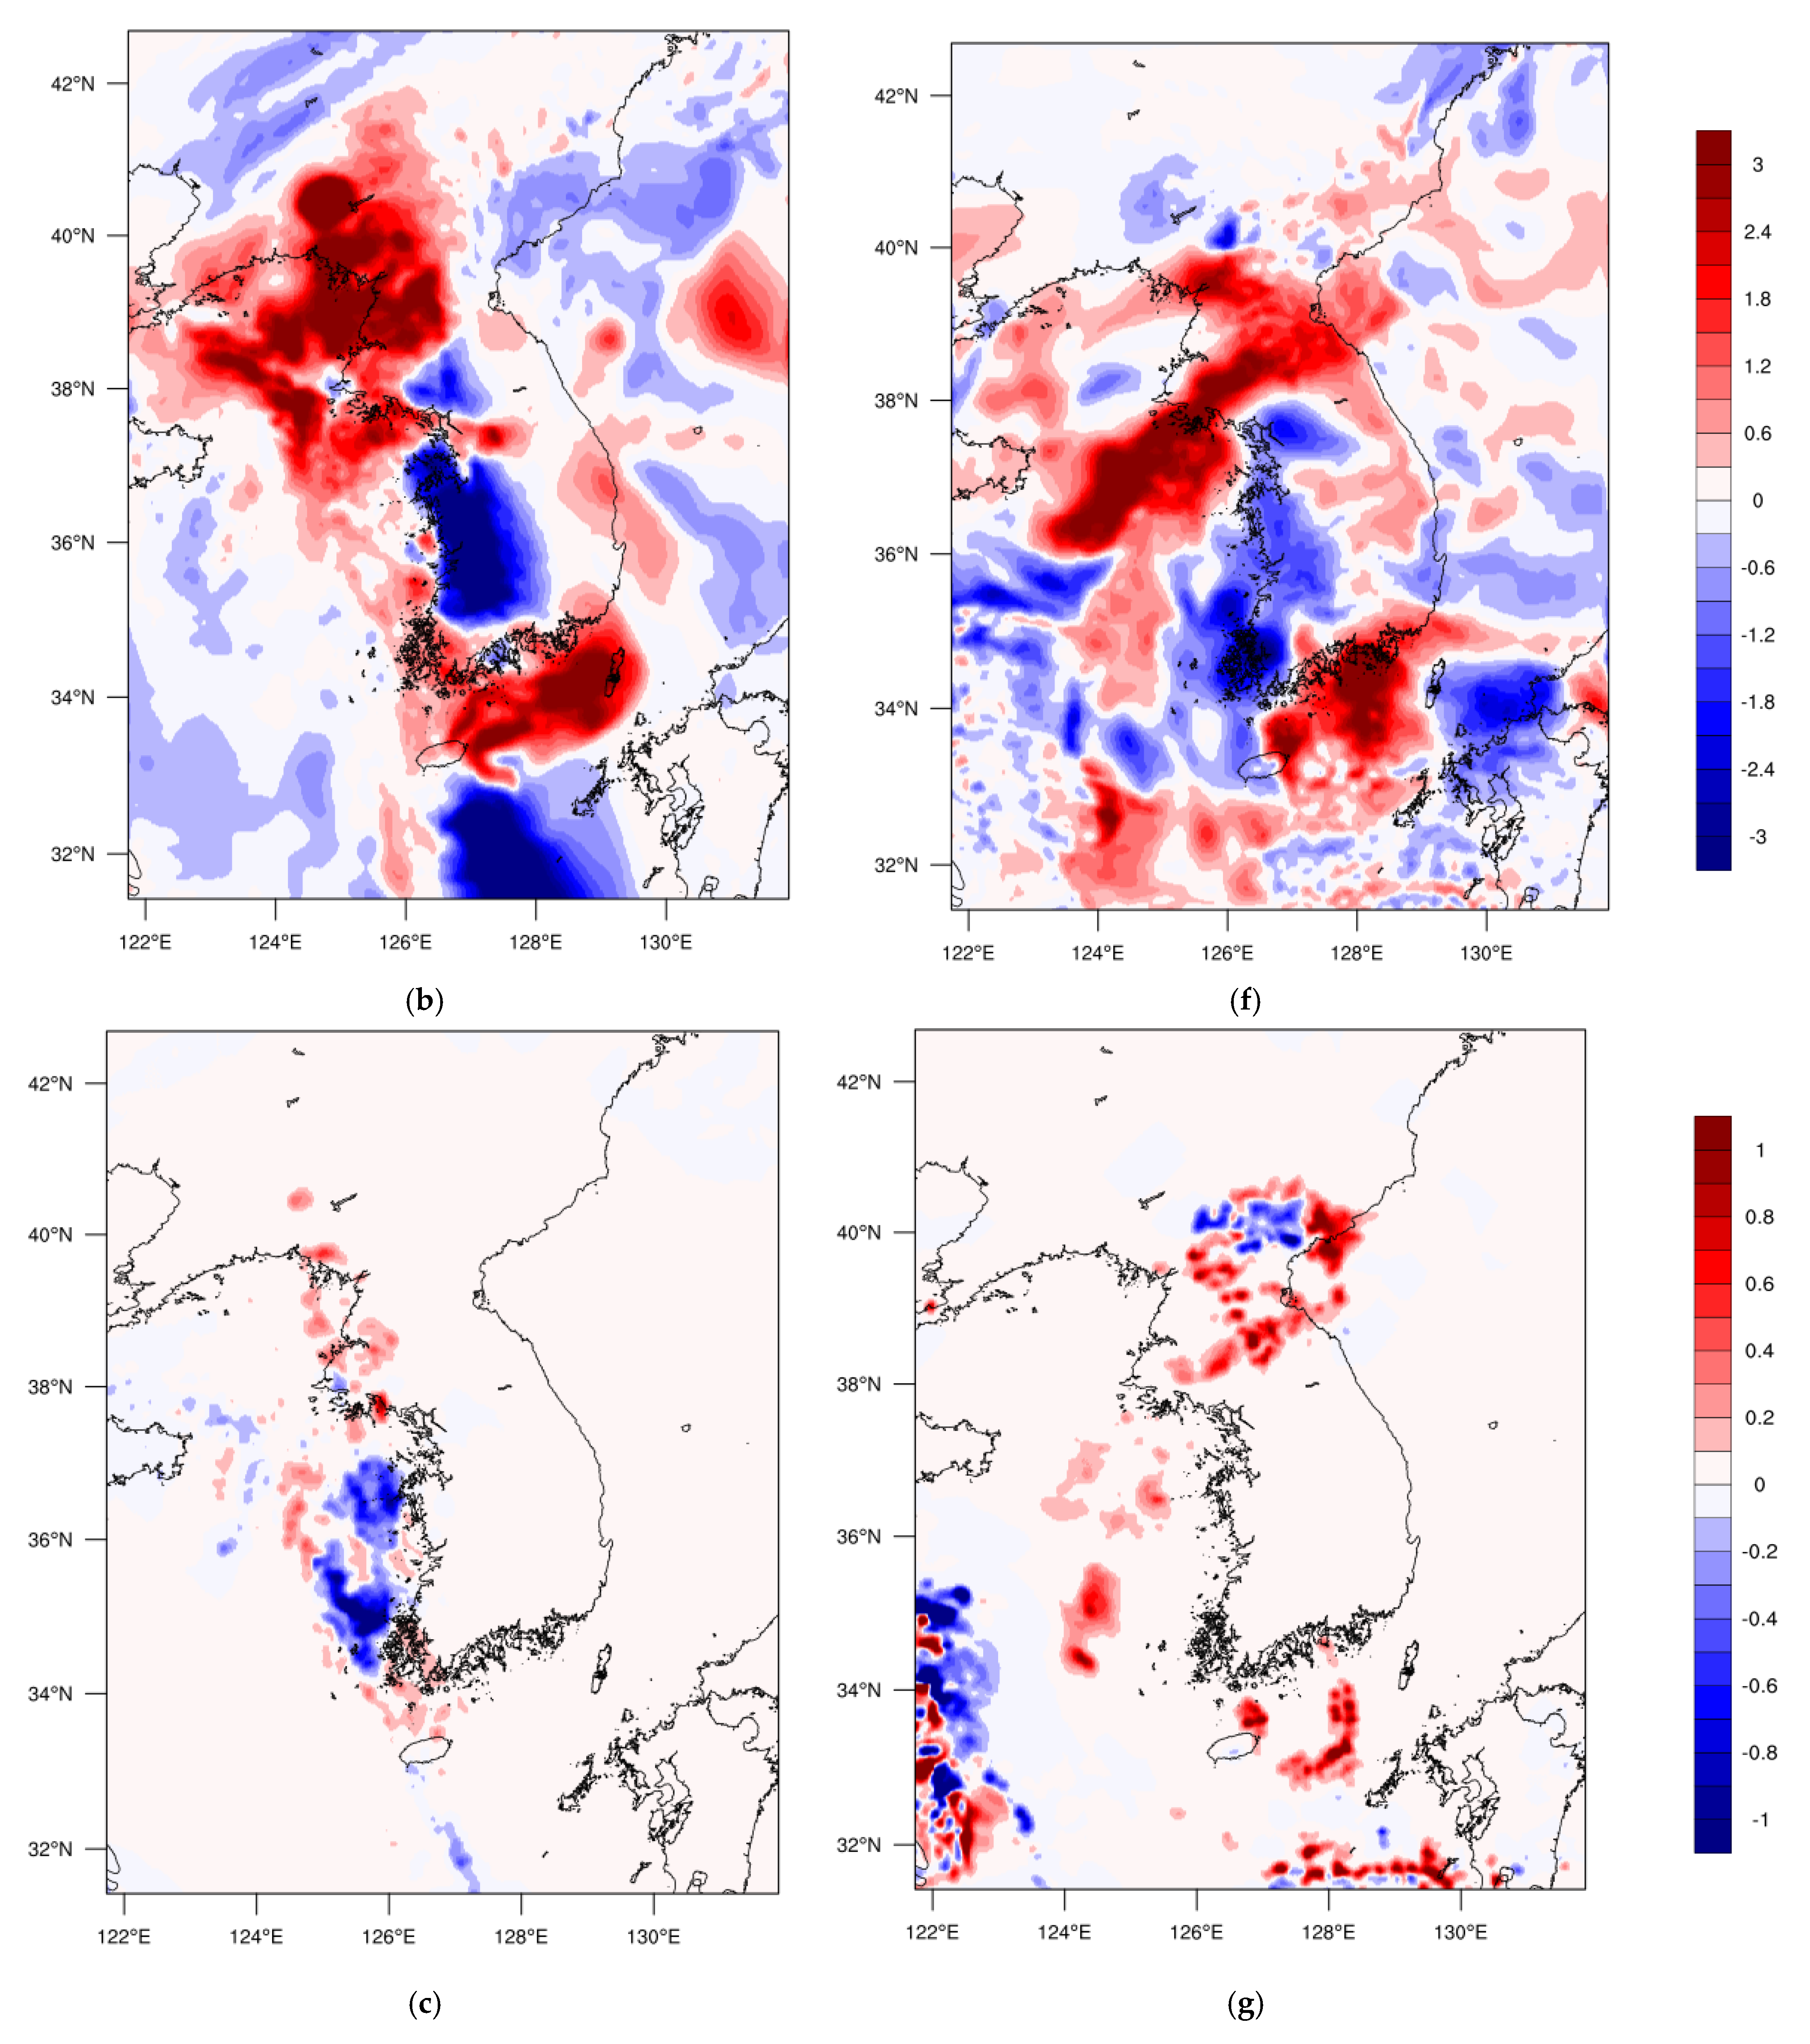
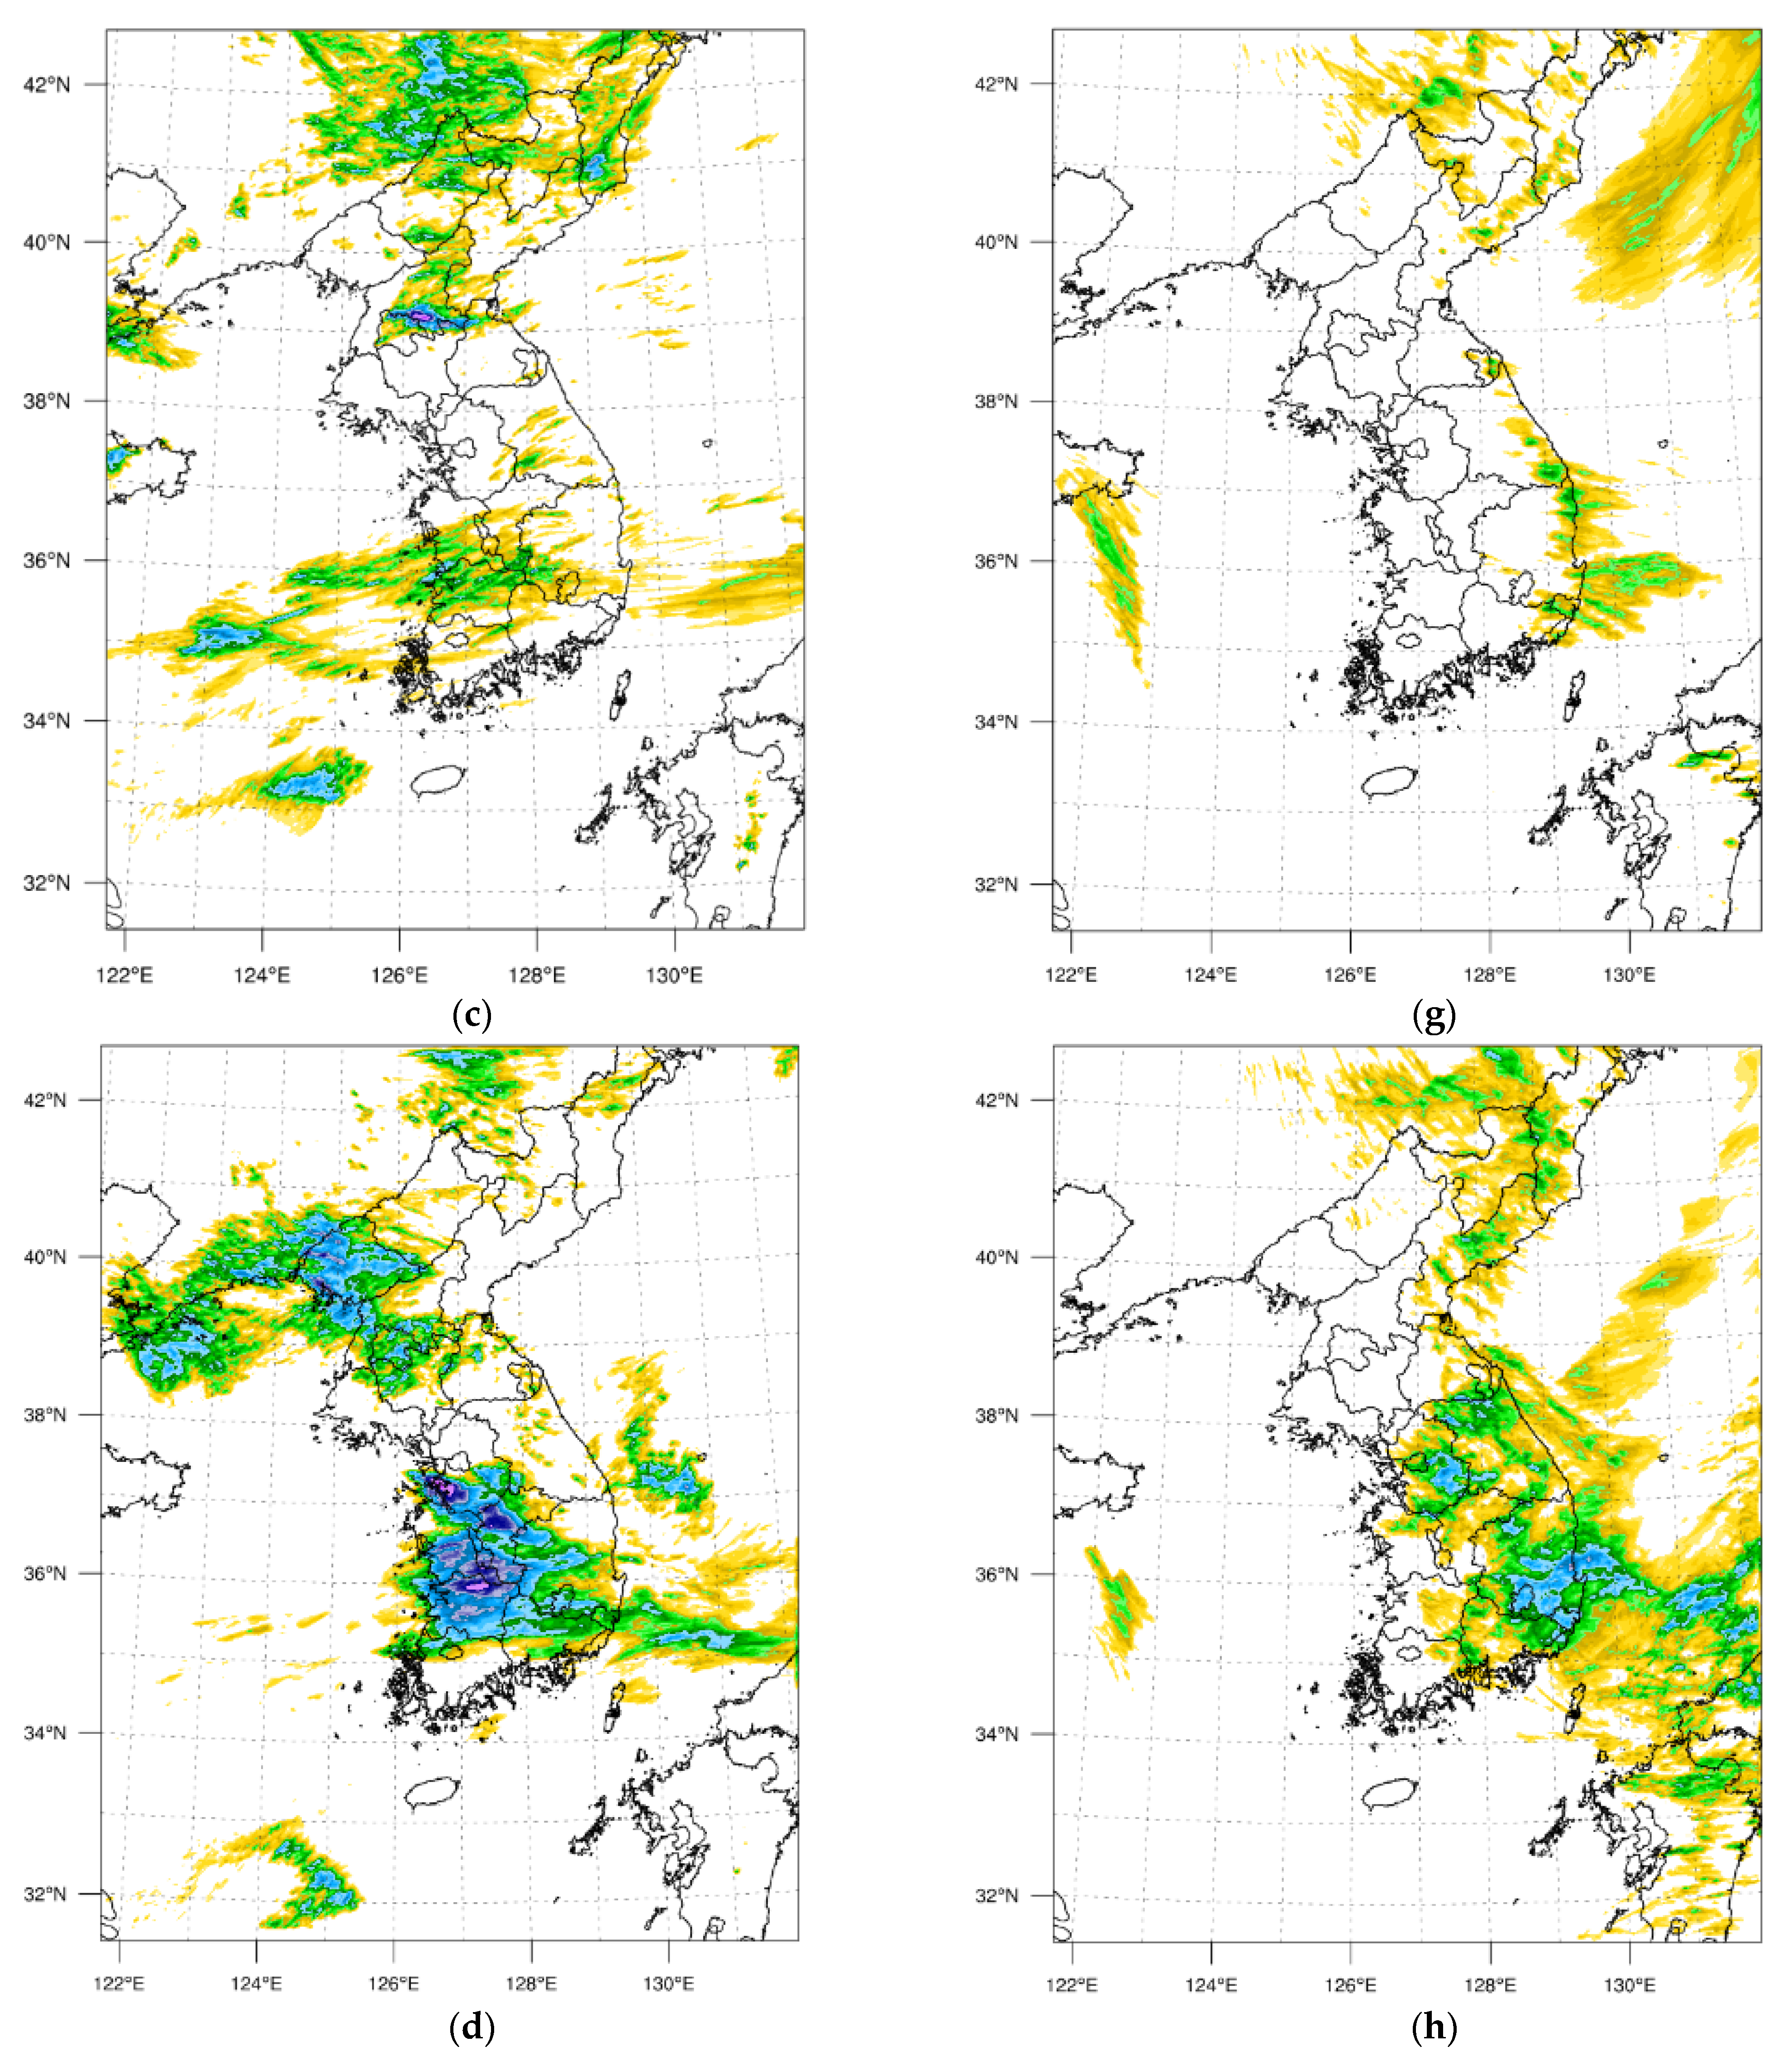
3.2. Simulation Results of Precipitation

We compared the results of the control run with that of the assimilation run by using the cumulated precipitation information of AWS and GPM (Figure 6 and Figure 7). Detailed quantitative verification results are presented in Section 3.4. The AWS cumulated precipitation of Meso 1 was up to 150 mm in the southern Gyeonggi-do (Figure 6a). For the cumulated precipitation in the control run, a maximum of 40 mm was simulated in Jeollabuk-do and the convective precipitation was not well simulated (Figure 6c). In contrast, mesoscale precipitation was simulated in the assimilation run and the cumulated precipitation of more than 150 mm was predicted in the mid-region of Korea similar to AWS (Figure 6d). Precipitation over the ocean also showed improved simulation near the east coast (Figure 6b,d).
During the period of Meso 2, the AWS cumulated precipitation was about 20~50 mm in Gangwon-do (Figure 6e). The control run failed to simulate precipitation in the inland of Korea (Figure 6g). However, improved results were found by simulating mesoscale precipitation in the inland of Korea, western area of Gangwon-do, Gyeongsang-do, and the east coast through the radar data assimilation (Figure 6h).
In Synop 1, the AWS cumulated precipitation of 50–80 mm was observed in Gyeonggi-do, Chungcheongnam-do, and the southern coast as an extratropical cyclone passed through the Korean Peninsula (Figure 7a). In the control run, precipitation of up to 110 mm was accumulated on the west coast and in the metropolitan area, which was oversimulated compared to the AWS precipitation (Figure 7c). In the assimilation run, the result was improved as the oversimulated precipitation on the west coast and the metropolitan area decreased by more than 40 mm. However, the increased precipitation in the southern region was an overprediction (Figure 7d). As for the precipitation that occurred over the ocean, both the control and assimilation run simulated it well in the Yellow Sea, while both failed to simulate the heavy precipitation over the South Sea (Figure 7b,d).
In Synop 2, heavy precipitation occurred in the central and northern regions including the metropolitan area in the first half of the case, and in the southern regions in the second half, as an extratropical cyclone developed along the Changma front which passed through the Korean Peninsula. The AWS accumulated precipitation was more than 200 mm in the central region and 100~150 mm in the southern region (Figure 7e). The control run was able to simulate the heavy precipitation in the first half of the case but was not able to simulate the southern region system during the second half. The accumulated precipitation from 130 to 150 mm was simulated in the control run (Figure 7g). On the other hand, through the radar operator, the precipitation simulation was improved in the assimilation run with an increased cumulative precipitation by 20~40 mm in the central region, as well as in the southern region (Figure 7h). The accumulated precipitation of over 150 mm at the southern coast was recorded in the GPM data, but neither the control run nor the assimilation run could simulate the heavy precipitation in the southern coast during the second half (Figure 7f,h). The Synop 2 experiment showed that the effect of the radar data assimilation could not last longer than 12 h.

3.3. CFAD, THCS, and Hydrometeor Profile

We analyzed Meso 1 case based on the weather radar of Mt. Oseong (KSN; Figure 1b). The reflectivity CFAD information of Mt. Oseong radar showed the hydrometeor growth (radar reflectivity increased) from upper troposphere to an altitude of about 5 km. The ice phase hydrometeors existing above 10 km altitude descended to 5 km altitude and the size of the particles increased indicating particle growth and higher reflectivity frequency distribution. The altitude of the melting layer was not clearly identified due to the localized mesoscale convective precipitation (Figure 8a). The structure of CFAD was not clear in the control run because the model could not simulate the precipitation properly (Figure 8c). The assimilation run simulated the precipitation, which clearly showed the hydrometeor growth from the upper to the lower atmospheric layer and that the increased reflectivity eventually reached the ground as precipitation (Figure 8e).
The THCS showed reflectivity of 16~19 dBZ at the beginning of the case, and 28~32 dBZ was distributed when convective clouds approached the KSN radar site (Figure 9a; 1500 UTC 17 to 0600 UTC 18 July 2014). The control run failed to properly simulate the precipitation, leading to the undersimulation of the reflectivity during the case period (Figure 9c). In contrast, the heavy precipitation was simulated through the data assimilation, which in turn simulated a stronger reflectivity compared to the control run (Figure 9e). For the vertical hydrometeor profile, all hydrometeors were increased in the assimilation run (Figure 10a). The ice and graupel mixing ratios increased above the melting layer, while the rainwater mixing ratio increased significantly below the melting layer, making the middle and upper atmospheric layers more humid compared to that of the control run. As convective clouds developed rapidly in the metropolitan area in the Meso 2 case, the CFAD was generated based on the reflectivity information recorded by the Mt. Gwanak radar (KWK; Figure 1b). The frequency distribution of the reflectivity was high from the upper layer to an altitude of about 5 km and it decreased at the lower altitude (Figure 8b). The CFAD of the control run was not generated properly because the precipitation was not simulated in the model (Figure 8d), while the assimilation run clearly showed the growth of the hydrometeor in the CFAD (Figure 8f). In the THCS, columns of reflectivities ranging from 20 to 32 dBZ were distributed from the lower atmosphere to an altitude of about 8 km (Figure 9b; 0200 to 1500 UTC 1 June 2017). In the control run, there was no radar reflectivity in the lower atmosphere because the precipitation was not simulated (Figure 9d). The DA run correctly simulated the precipitation at the beginning of the case and also simulated the strong reflectivity up to an altitude of 10 km (Figure 9f). The vertical hydrometeor profile indicated all hydrometeors increased in the assimilation run. Similar to Meso 1, the ice and graupel mixing ratios increased above the melting layer and there was a noticeable increase in the rainwater mixing ratio below the melting layer, resulting in an overall humid atmosphere, compared to the control run (Figure 10b).
Recall that Synop 1 was a stratiform precipitation case caused by an extratropical cyclone passing through the Korean Peninsula. We analyzed the data based on the weather radar of KSN, focusing on the precipitation approaching from the west. The observed reflectivity information confirmed the growth of hydrometeors from the upper atmosphere to an altitude of about 5 km, and the melting layer at an altitude around 4 km, leading to precipitation below the melting layer. The average reflectivity was 15 dBZ, which can be attributed to the weak precipitation of the extratropical cyclone over the large area (Figure 11a). The structures of the CFAD were similar in both the control and the assimilation runs. However, the simulated precipitation decreased in the assimilation run, leading to a slightly decreased frequency distribution of the reflectivity around the middle and upper atmosphere above the melting layer (Figure 11c,e). In the THCS from Mt. Oseong, the reflectivities of 20~30 dBZ were distributed over the entire case period (Figure 12a; 0600 UTC 02 to 0600 UTC 3 May 2016). Both the control and assimilation runs showed a similar structure of the THCS, but the assimilation run simulated the reflectivity of about 3~5 dBZ lower than in the control run (Figure 12c,e). The reason for the reduced reflectivity of the assimilation run can be attributed to two factors. One is that the radar reflectivity was observed to be less than 25 dBZ for most of the case period of Synop 1, and the relative humidity operator was not properly applied when performing the data assimilation. The other factor is that the atmosphere became drier compared to that in the control run since the vapor mixing ratio decreased. The vertical hydrometeor profile in the atmosphere was simulated in a similar way both in the control and assimilation runs, but overall, the hydrometeors decreased in the assimilation run (Figure 13a). Synop 2 was a case where precipitation occurred as an extratropical cyclone, which developed along the Changma front that passed through the Korean Peninsula. The analysis was conducted based on the weather radar of Mt. Gwangdeok (GDK; Figure 1a). The observed reflectivity data confirmed the hydrometeor growth up to an altitude of about 5 km from the upper atmosphere, and also the existence of the melting layer at an altitude of around 4.5 km. The average reflectivity was approximately 25 dBZ in the lower atmosphere (Figure 11b). Both the control and the assimilation runs showed the frequency distribution of the reflectivity of the upper and lower atmospheres higher than the observed reflectivity. The reflectivity increased from the melting layer at an altitude of about 5 km, which led to precipitation. The heavy blue solid line indicating the average reflectivity decreased by about 5 dBZ in the assimilation run (Figure 11d,f). In the THCS, the reflectivity up to 35 dBZ was distributed until the middle of the case period due to heavy precipitation (Figure 12b; 0000 UTC 01 to 0000 UTC 2 July 2016). A strong reflectivity of more than 35 dBZ was distributed both in the control and assimilation runs. However, a relatively weak reflectivity was simulated in the assimilation run (Figure 12d,f). Similar to the CFAD and the THCS information, the vertical hydrometeor was also reduced by the data assimilation (Figure 13b).

3.4. Verification of the Precipitation

To verify the predictability of the precipitation simulation for WRF control and assimilation experiments, we conducted a quantitative precipitation comparison using approximately 680 nationwide AWS surface precipitation data. We calculated the fractional skill score (FSS) and probability of detection (POD) based on the precipitation intensity of 1 mm h−1 and 10 mm h−1 for the results obtained from the four case experiments (Table 3). FSS is a verification method that considers the probability that precipitation occurs in the area surrounding a specific point. FSS is a useful method to verify the precipitation forecast of the NWP model for an area including the neighborhood scale centered on the point, not the verification at a specific point [55].
FSS = 1 1 N N ( P F P F ) 2 1 N N P F 2 + 1 N N P C F 2  
POD is a skill score that verifies the precipitation forecast performance of an NWP model using the observed precipitation. If precipitation is simulated correctly, it is expressed as GD (good detection), and if precipitation is not simulated properly, it is expressed as MI (miss forecast) to calculate POD.
POD = GD GD + MI
In addition, we calculated the pattern correlation to verify the spatial predictability of the model’s precipitation forecasts (Figure 14 and Table 4). In this research, a zero lag 2D correlation method was used. This method is linear-cross correlation (Pearson) between two variables that are, respectively, the values of the same variables at corresponding locations on two different maps.
A value of zero indicates that there is no relationship between the two variables. Meso 1 and Meso 2 were localized mesoscale convective precipitation cases. For all precipitation intensities of 1 mm h−1 and 10 mm h−1, the assimilation run improved the results compared to the control run. However, for Synop 1 and Synop 2, where synoptic-scale induced precipitation occurred, the verification score in the assimilation run was not improved distinctively compared to the control run. Similarly, the spatial correlation of precipitation was significantly improved in the case of mesoscale convective precipitation (Table 4). Based on the verification results, it can be determined that the 3D-Var assimilation using weather radar observation data is more effective in improving localized mesoscale precipitation events than the synoptic-scale driven precipitation events.

4. Summary and Discussions

In this study, we analyzed the prediction characteristics of 3D-Var data assimilation using weather radar observations and AWS data for four precipitation cases which occurred in Korea. The four cases selected for data assimilation runs were: (1) a mesoscale convective system which occurred on 17 July 2014; (2) a mesoscale precipitation that occurred on 1 June 2017; (3) a stratiform precipitation caused by an extratropical cyclone which occurred on 2 May 2016; and (4) precipitation caused by a low pressure that developed along the monsoon rain band on 1 July 2016.
In Meso 1, the assimilation run with the radar and AWS data successfully simulated the precipitation that was not simulated in the control run. Analyzing the CFAD, THCS, and the vertical hydrometeor profile, the NWP model simulated stronger reflectivity than the observed data with the radar and AWS data assimilation. The stronger and intensive precipitation in the first half led to a dry atmosphere in the second half of the period, and the precipitation simulation ended earlier. An improved result was obtained in Meso 2 by simulating localized mesoscale convective precipitation in the Seoul metropolitan area, the western area of Gangwon-do, and Gyeongsang-do, which was not simulated in the control run. Synoptic-scale precipitation systems caused by extratropical cyclones passing through the Korean Peninsula were also investigated. In Synop 1, compared with the observed reflectivity data, both the control and the assimilation run oversimulated the reflectivity. However, the assimilation experiment showed a similar precipitation pattern with that of the AWS accumulated precipitation. In Synop 2, heavy precipitation occurred in the central region during the first half of the period and in the southern region during the second half, as the cyclone developed along the Changma front passing through the Korean Peninsula. Although the control run failed to simulate the precipitation in the southern region during the second half, the assimilation run improved precipitation predictability in the southern region. Overall, radar and AWS data assimilation experiments improved the location of the precipitation area and rainfall intensity compared to the control run. However, radar reflectivity was oversimulated in all four cases through the CFAD, THCS, and vertical hydrometeor profile analyses.
To analyze the characteristics of precipitation simulation in the four cases, we conducted a quantitative verification using AWS accumulated precipitation information. In Meso 1 and 2, where the CAPE was high due to an unstable atmosphere, the predictability of precipitation was improved with the FSS and the POD increased by about 0.2. As for the spatial pattern of precipitation, it was increased by 0.7 in Meso 1, suggesting a great improvement in the spatial pattern predictability of precipitation. On the other hand, the spatial predictability in the Meso 2 data assimilation was not significantly improved compared to the control simulation. Further, as shown in the verification results of FSS and POD through the AWS accumulated precipitation, there was little improvement in Synop 1 and 2, which were synoptic-scale precipitation events with low-level jet stream, compared to the control run. The spatial pattern predictability of precipitation did not improve significantly either. Based on these results, it can be said that the precipitation predictability in the case of localized mesoscale convective precipitation is significantly improved through the 3D-Var assimilation using the weather radar and AWS data. There was a noticeable scale dependence in the improvement of the precipitation systems. The improvements in simulating mesoscale convective systems were larger compared to synoptically driven precipitation systems.
This study showed that it is suitable to apply weather radar observation data, which has a high temporal and spatial resolution, to a numerical prediction model for simulating meteorological phenomena that can occur on a local scale. According to the results of this study, it was analyzed that the WRF model tends to oversimulate reflectivity compared to radar observations. Therefore, it is necessary to conduct further research for improving the precipitation predictability by adjusting the observation operator in the data assimilation or improving the cloud microphysical processes responsible for generating hydrometeors that lead to precipitation. Lastly, studies with advanced data assimilation methods should be conducted to improve the NWP model forecasting skills at multiple scales.

Author Contributions

Conceptualization K.-H.M.; methodology, investigation, J.-H.B. and K.-H.M.; software, data curation, visualization, J.-H.B.; validation, K.-H.M.; writing—original draft preparation, J.-H.B.; writing—review and editing, supervision, project administration, funding acquisition K.-H.M. All authors have read and agreed to the published version of the manuscript.

Funding

This research was funded by the Korea Meteorological Administration Research and Development Program under grant number KMA2017-02410. This work was also supported by the National Research Foundation of Korea (NRF) funded by the Korea Ministry of Education (NRF-2019R1F1A1058620).

Institutional Review Board Statement

Not applicable.

Informed Consent Statement

Not applicable.

Data Availability Statement

GPM IMERG L3 Final Precipitation data is downloaded from NASA Goddard Earth Sciences Data and Information Services Center (GES DISC). The data is available from NASA GES DICS (https://disc.gsfc.nasa.gov/datasets/GPM_3IMERGDF_06/summary) (accessed on 20 September 2019).

Conflicts of Interest

The authors declare no conflict of interest.

References

  1. Roberts, N.M.; Lean, H.W. Scale-Selective Verification of Rainfall Accumulations from High-Resolution Forecasts of Convective Events. Mon. Weather Rev. 2008, 136, 78–97. [Google Scholar] [CrossRef]
  2. Chen, Y.; Wang, H.; Min, J.; Huang, X.-Y.; Minnis, P.; Zhang, R.; Haggerty, J.; Palikonda, R. Variational Assimilation of Cloud Liquid/Ice Water Path and Its Impact on NWP. J. Appl. Meteorl. Climatol. 2015, 54, 1809–1825. [Google Scholar] [CrossRef]
  3. Bouttier, F. Fine Scale Versus Large Scale Data Assimilation—A Discussion. Fifth WMO Symposium on Data Assimilation; WMO World Weather Research Programme: Melbourne, VIC, Australia, 2009; p. 8. Available online: https://www.researchgate.net/publication/268376800_Fine_scale_versus_large_scale_data_assimilation_-a_discussion (accessed on 15 October 2019).
  4. Wang, H.; Sun, J.; Fan, S.; Huang, X.-Y. Indirect assimilation of radar reflectivity with WRF 3D-Var and its impact on prediction of four summertime convective events. J. Appl. Meteorol. Climatol. 2013, 52, 889–902. [Google Scholar] [CrossRef]
  5. Wang, H.; Sun, J.; Zhang, X.; Huang, X.-Y.; Auligné, T. Radar data assimilation with WRF 4D-Var. Part I: System development and preliminary testing. Mon. Weather Rev. 2013, 141, 2224–2244. [Google Scholar] [CrossRef]
  6. Tai, S.-L.; Liou, Y.-C.; Sun, J.; Chang, S.-F. The development of a terrain-resolving scheme for the forward model and its adjoint in the four-dimensional Variational Doppler Radar Analysis System (VDRAS). Mon. Weather Rev. 2017, 145, 289–306. [Google Scholar] [CrossRef]
  7. Zhang, F.; Snyder, C.; Sun, J. Impacts of initial estimate and observations on the convective-scale data assimilation with an ensemble Kalman filter. Mon. Weather Rev. 2004, 132, 1238–1253. [Google Scholar] [CrossRef]
  8. Zhang, J. Moisture and Diabatic Initialization Based on Radar and Satellite Observation. Ph.D. Thesis, University of Oklahoma, Norman, OK, USA, 1999; p. 194. [Google Scholar]
  9. Zhang, J.; Carr, F.; Brewster, K. ADAS cloud analysis. Preprints, 12th Conf. on Numerical Weather Prediction, Phoenix, AZ. Am. Meteorol. Soc. 1998, 79, 185–188. [Google Scholar]
  10. Sun, J.; Crook, N.A. Dynamical and microphysical retrieval from doppler radar observations using a cloud model and its adjoint. Part I: Model development and simulated data experiments. J. Atmos. Sci. 1997, 54, 1642–1661. [Google Scholar] [CrossRef]
  11. Sun, J.; Crook, N.A. Dynamical and microphysical retrieval from Doppler radar observations using a cloud model and its adjoint. Part2: Retrieval experiments of an observed Florida convective storm. J. Atmos. Sci. 1998, 55, 835–852. [Google Scholar] [CrossRef]
  12. Hu, M.; Xue, M.; Brewster, K. 3DVAR and cloud analysis with WSR-88D level-II data for the prediction of the Fort Worth, Texas, tornadic thunderstorms. Part I: Cloud analysis and its impact. Mon. Weather Rev. 2006, 134, 675–698. [Google Scholar] [CrossRef]
  13. Souto, M.J.; Balseiro, C.F.; Pérez-Muñuzuri, V.; Xue, M.; Brewster, K. Impact of cloud analysis on numerical weather prediction in the Galician region of Spain. J. Appl. Meteorol. 2003, 42, 129–140. [Google Scholar] [CrossRef] [Green Version]
  14. Sun, J.-H.; Zhang, X.-L.; Wei, J.; Zhao, S.-X. A study on severe heavy rainfall in north China during the 1990s (in Chinese). Clim. Environ. Res. 2005, 10, 492–506. [Google Scholar] [CrossRef]
  15. Weygandt, S.S.; Benjamin, S.G.; Smirnova, T.G.; Brown, J.M. Assimilation of radar reflectivity data using a diabatic digital filter within the Rapid Update Cycle. In Proceedings of the 12th conference on IOAS-AOLS, New Orleans, LA, USA, 20–24 January 2008; American Meteorological Society: Geneseo, NY, USA, 2008; Volume 8, p. 4. Available online: https://ams.confex.com/ams/pdfpapers/134081.pdf (accessed on 15 November 2019).
  16. Ha, J.-H.; Kim, H.; Lee, D.-K. Observation and Numerical Simulations with Radar and Surface Data Assimilation for Heavy Rainfall over Central Korea. Adv. Atmos. Sci. 2011, 28, 573–590. [Google Scholar] [CrossRef]
  17. Aksoy, A.; Dowell, D.C.; Snyder, C. A multi-case comparative assessment of the ensemble Kalman filter for assimilation of radar observations. Part II: Short-range ensemble forecasts. Mon. Weather Rev. 2010, 138, 1273–1292. [Google Scholar] [CrossRef] [Green Version]
  18. Xiao, Q.; Sun, J. Multiple-radar data assimilation and short range quantitative precipitation forecasting of a squall line observed during IHOP 2002. Mon. Weather Rev. 2007, 135, 3381–3404. [Google Scholar] [CrossRef]
  19. Caya, A.; Sun, J.; Snyder, C. A comparison between the 4DVAR and the ensemble Kalman filter techniques for radar data assimilation. Mon. Weather Rev. 2005, 133, 3081–3094. [Google Scholar] [CrossRef] [Green Version]
  20. Wang, H.; Auligné, T.; Morrison, H. Impact of Microphysics Scheme Complexity on the Propagation of Initial Perturbations. Mon. Weather Rev. 2012, 140, 2287–2296. [Google Scholar] [CrossRef] [Green Version]
  21. Sun, J.; Wang, H. WRF-ARW Variational Storm-Scale Data Assimilation: Current Capabilities and Future Developments. Adv. Meteorol. 2013, 2013, 815910. [Google Scholar] [CrossRef]
  22. Dowell, D.C.; Wicker, L.J.; Snyder, C. Ensemble kalman filter assimilation of radar observations of the 8 May 2003 Oklahoma city supercell: Influences of reflectivity observations on storm-scale analyses. Mon. Weather Rev. 2011, 139, 272–294. [Google Scholar] [CrossRef] [Green Version]
  23. Bick, T.; Simmer, C.; Trömel, S.; Wapler, K.; Franssen, H.H.; Stephan, K.; Blahak, U.; Schraff, C.; Reich, H.; Zeng, Y.; et al. Assimilation of 3D radar reflectivities with an ensemble Kalman filter on the convective scale. Q. J. R. Meteorol. Soc. 2016, 142, 1490–1504. [Google Scholar] [CrossRef] [Green Version]
  24. Zupanski, M. Maximum likelihood ensemble filter: Theoretical aspects. Mon. Weather Rev. 2005, 133, 1710–1726. [Google Scholar] [CrossRef]
  25. Gao, J.; Fu, C.; Stensrud, D.J.; Kain, J.S. OSSEs for an Ensemble 3DVAR Data Assimilation System with Radar Observations of Convective Storms. J. Atmos. Sci. 2016, 73, 2403–2426. [Google Scholar] [CrossRef]
  26. Lee, J.-W.; Min, K.-H.; Lee, Y.-H.; Lee, G. X-Net-Based radar data assimilation study over the Seoul metropolitan area. Remote Sens. 2020, 12, 893. [Google Scholar] [CrossRef] [Green Version]
  27. Zhao, Q.Y.; Jin, Y. High-resolution radar data assimilation for Hurricane Isabel (2003) at landfall. Bull. Am. Meteorol. Soc. 2008, 89, 1355–1372. [Google Scholar] [CrossRef] [Green Version]
  28. Gao, J.; Stensrud, D.J. Assimilation of reflectivity data in a convective-scale, cycled 3D-VAR framework with hydrometeor classification. J. Atmos. Sci. 2012, 69, 1054–1065. [Google Scholar] [CrossRef]
  29. Tong, M.; Xue, M. Ensemble Kalman filter assimilation of Doppler radar data with a compressible nonhydrostatic model: OSS experiments. Mon. Weather Rev. 2005, 133, 1789–1807. [Google Scholar] [CrossRef] [Green Version]
  30. Lee, Y.-H.; Min, K.-H. High-resolution modeling study of an isolated convective storm over Seoul Metropolitan area. Meteorol. Atmos. Phys. 2019, 131, 1549–1564. [Google Scholar] [CrossRef]
  31. Vendrasco, E.P.; Sun, J.; Herdies, D.L.; de Angelis, C.F. Constraining a 3DVAR Radar Data Assimilation System with Large-Scale Analysis to Improve Short-Range Precipitation Forecasts. J. Appl. Meteorol. Climatol. 2016, 55, 673–690. [Google Scholar] [CrossRef]
  32. Sugimoto, S.; Crook, N.A.; Sun, J.; Xiao, Q.; Barker, D. Assimilation of Doppler radar data with WRF 3DVAR: Evaluation of its potential benefits to quantitative precipitation forecasting through observing system simulation experiments. Mon. Weather Rev. 2009, 137, 4011–4029. [Google Scholar] [CrossRef]
  33. Xiao, Q.; Kuo, Y.-H.; Sun, J.; Lee, W.-C.; Lim, E.; Guo, Y.-R.; Barker, D.M. Assimilation of doppler radar observations with a regional 3DVAR system: Impact of doppler velocities on forecasts of a heavy rainfall case. J. Appl. Meteorol. 2005, 44, 768–788. [Google Scholar] [CrossRef]
  34. Johnson, A.; Wang, X.; Carley, J.; Wicker, L.J.; Karstens, C. A Comparison of Multiscale GSI-Based EnKF and 3DVar Data Assimilation Using Radar and Conventional Observations for Midlatitude Convective-Scale Precipitation Forecasts. Mon. Weather Rev. 2015, 143, 3087–3108. [Google Scholar] [CrossRef]
  35. Chang, S.-F.; Liou, Y.-C.; Sun, J.; Tai, S.-L. The Implementation of the Ice-Phase Microphysical Process into a Four-Dimensional Variational Doppler Radar Analysis System (VDRAS) and Its Impact on Parameter Retrieval and Quantitative Precipitation Nowcasting. J. Atmos. Sci. 2016, 73, 1015–1038. [Google Scholar] [CrossRef]
  36. Lai, A.; Min, J.; Gao, J.; Ma, H.; Cui, C.; Xiao, Y.; Wang, Z. Assimilation of Radar Data, Pseudo Water Vapor, and Potential Temperature in a 3DVAR Framework for Improving Precipitation Forecast of Severe Weather Events. Atmosphere 2020, 11, 182. [Google Scholar] [CrossRef] [Green Version]
  37. Mazzarella, V.; Maiello, I.; Ferretti, R.; Capozzi, V.; Picciotti, E.; Alberoni, P.P.; Marzano, F.S.; Budillon, G. Reflectivity and velocity radar data assimilation for two flash flood events in central Italy, A comparison between 3D and 4D variational methods. Q. J. R. Meteorol. Soc. 2019, 146, 348–366. [Google Scholar] [CrossRef]
  38. Bachmann, K.; Keil, C.; Craig, G.C. Predictability of Deep Convection in Idealized and Operational Forecasts: Effects of Radar Data Assimilation, Orography, and Synoptic Weather Regime. Mon. Weather Rev. 2020, 148, 63–81. [Google Scholar] [CrossRef]
  39. Min, K.-H.; Choo, S.H.; Lee, D.H.; Lee, G.W. Evaluation of WRF cloud microphysics scheme using radar observations. Wea. Forecast. 2015, 30, 1571–1589. [Google Scholar] [CrossRef]
  40. Liu, Z.-Q.; Rabier, F. The interaction between model resolution, observation resolution and observation density in data assimilation: An one-dimensional study. Q. J. R. Meteorol. Soc. 2002, 128, 1367–1386. [Google Scholar] [CrossRef] [Green Version]
  41. Ochotta, T.; Gebhardt, C.; Bondarenko, V.; Saupe, D.; Wergen, W. On thinning methods for data assimilation of satellite observations. In Proceedings of the 87th AMS Annual Meeting, San Antonio, TX, USA, 14–18 January 2007; pp. 1–4. Available online: https://ams.confex.com/ams/87ANNUAL/techprogram/paper_118511.htm (accessed on 20 September 2019).
  42. Ye, B.-Y.; Lee, G.; Park, H.-M. Identification and removal of non-meteorological echoes in dual-polarization radar data based on a fuzzy logic algorithm. Adv. Atmos. Sci. 2015, 32, 1217–1230. [Google Scholar] [CrossRef]
  43. Huffman, G.J.; Stocker, E.F.; Bolvin, D.T.; Nelkin, E.J.; Tan, J. GPM IMERG Final Precipitation L3 Half Hourly 0.1 Degree x 0.1 Degree V06; Goddard Earth Sciences Data and Information Services Center (GES DISC): Greenbelt, MD, USA, 2019. [Google Scholar] [CrossRef]
  44. Das, M.K.; Das, S.; Rahman, M. Chapter 5. Simulation of Mesoscale Convective Systems Associated with Squalls Using 3DVAR Data Assimilation over Bangladesh. In High-Impact Weather Events over the SAARC Region; Springer: Berlin/Heidelberg, Germany, 2015; pp. 63–72. [Google Scholar] [CrossRef]
  45. Skamarock, W.C.; Klemp, J.B.; Dudhia, J.; Gill, D.O.; Barker, D.M.; Duda, M.G.; Huang, X.-Y.; Wang, W.; Powers, J.G. A Description of the Advanced Research WRF Version. Natl. Cent. Atmos. Res. 2015, 3, 87–91. [Google Scholar]
  46. Barker, D.M.; Huang, W.; Guo, Y.R.; Xiao, Q.N. A three dimensional (3DVAR) data assimilation system for use with MM5: Implementation and initial results. Mon. Weather Rev. 2004, 132, 897–914. [Google Scholar] [CrossRef] [Green Version]
  47. Barker, D.M.; Huang, X.-Y.; Liu, Z.; Auligné, T.; Zhang, X.; Rugg, S.; Ajjaji, R.; Bourgeois, A.; Bray, J.; Chen, Y. Coauthors. The Weather Research and Forecasting (WRF) Model’s Community Variational/Ensemble Data Assimilation System: WRFDA. Bull. Am. Meteorl. Soc. 2012, 93, 831–843. [Google Scholar] [CrossRef] [Green Version]
  48. Jang, S.; Lim, K.-S.S.; Ko, J.; Kim, K.; Lee, G.; Cho, S.-J.; Ahn, K.-D.; Lee, Y.-H. Revision of WDM7 Microphysics Scheme and Evaluation for Precipitating Convection over the Korean Peninsula. Remote Sens. 2021, 13, 3860. [Google Scholar] [CrossRef]
  49. Yu, X.; Lee, T.-Y. Role of convective parameterization in simulations of heavy precipitation systems at grey-zone resolutions case studies. Asia-Pac. J. Atmos. Sci. 2011, 47, 99–112. [Google Scholar] [CrossRef]
  50. Li, F.; Song, J.; Li, X. A preliminary evaluation of the necessity of using a cumulus parameterization scheme in high-resolution simulations of Typhoon Haiyan 2013. Nat. Hazards 2018, 92, 647–671. [Google Scholar] [CrossRef]
  51. On, N.; Kim, H.M.; Kim, S. Effects of Resolution, Cumulus Parameterization Scheme, and Probability Forecasting on Precipitation Forecasts in a High-Resolution Limited-Area Ensemble Prediction System. Asia-Pac. J. Atmos. Sci. 2018, 54, 623–637. [Google Scholar] [CrossRef]
  52. Parrish, D.F.; Derber, J.C. The National Meteorological Center’s spectral statistical-interpolation analysis system. Mon. Weather Rev. 1992, 120, 1747–1763. [Google Scholar] [CrossRef]
  53. Mecikalski, J.R.; Li, X.; Carey, L.D.; McCaul, E.W.; Coleman, T.A. Regional Comparison of GOES Cloud-Top Properties and Radar Characteristics. Mon. Weather Rev. 2013, 141, 55–74. [Google Scholar] [CrossRef] [Green Version]
  54. Yuter, S.E.; Houze, R.A., Jr. Three-Dimensional Kinematic and Microphysical Evolution of Florida Cumulonimbus. Part 2: Frequency Distributions of Vertical Velocity, Reflectivity, and Differential Reflectivity. Mon. Weather Rev. 2013, 123, 1941–1963. [Google Scholar] [CrossRef]
  55. Schwartz, C.S.; Kain, J.S.; Weiss, S.J.; Xue, M.; Bright, D.R.; Kong, F.; Thomas, K.W.; Levit, J.J.; Coniglio, M.C.; Wandishin, M.S. Toward improved convection-allowing ensembles: Model physics sensitivities and optimizing probabilistic guidance with small ensemble membership. Wea. Forecast. 2010, 25, 263–280. [Google Scholar] [CrossRef]
Figure 1. Maps showing (a) nested domains of WRF model used in this study. Color shading indicates terrain height (meters), (b) location of the observation site (red color markers are KMA radar sites and cyan color markers are KMA AWS sites), (c) location of South Korea in Eastern Asia, and (d) provinces of South Korea.
Remotesensing 14 00605 g001
Figure 2. Synoptic scale analysis for Meso 1 (upper panel; 0000 UTC 18 July 2014) and Meso 2 (bottom panel; 0000 UTC 1 June 2017). (a,c) Synthesis weather chart, and (b,d) skew T-log P diagram. Skew T-Log P diagram of the upper panel (a,b) is Gwang-ju radiosonde, and bottom panel (c,d) is Osan radiosonde site.
Remotesensing 14 00605 g002
Figure 3. Same as Figure 2 but for Synop 1 (upper panel (a,b); 0000 UTC 3 May 2016, Osan radiosonde) and Synop 2 (bottom panel (c,d); 1200 UTC 1 July 2016, Osan radiosonde).
Remotesensing 14 00605 g003
Figure 4. Initial field differences (analysis field; DA minus first guess field; CTRL) at 700 hPa height for Meso 1 (left side panel; 1430 UTC 17 July 2014) and Meso 2 (right side panel; 0130 UTC 1 June 2017). (a,e) Radar reflectivity (dBZ); (b,f) Difference in vapor mixing ratio ( g   kg 1 ) ; (c,g) Difference in rain mixing ratio ( g   kg 1 ); (d,h) Difference in wind components (U, V is vector and W is shaded; m   s 1 ).
Remotesensing 14 00605 g004aRemotesensing 14 00605 g004b
Figure 5. Same as Figure 4 but for Synop 1 (left side panel; 0500 UTC 2 May 2016) and Synop 2 (right side panel; 2300 UTC 30 June 2016). (a,e) Radar reflectivity (dBZ); (b,f) Difference in vapor mixing ratio ( g   kg 1 ) ; (c,g) Difference in rain mixing ratio ( g   kg 1 ); (d,h) Difference in wind components (U, V is vector and W is shaded; m   s 1 ).
Remotesensing 14 00605 g005aRemotesensing 14 00605 g005bRemotesensing 14 00605 g005c
Figure 6. Accumulated precipitation for Meso 1 (left side panel) and Meso 2 (right side panel) for (a,e) AWS, (b,f) GPM IMERG, (c,g) WRF CTRL experiment, and (d,h) WRF DA experiment, respectively.
Remotesensing 14 00605 g006aRemotesensing 14 00605 g006b
Figure 7. Same as Figure 6 but for Synop 1 (left site panel) and Synop 2 (right site panel) for (a,e) AWS; (b,f) GPM IMERG; (c,g) WRF CTRL experiment; (d,h) WRF DA experiment, respectively.
Remotesensing 14 00605 g007aRemotesensing 14 00605 g007bRemotesensing 14 00605 g007c
Figure 8. Averaged CFAD for Meso 1 and Meso 2 periods. (a,b) Radar observation, (c,d) WRF CTRL experiment, and (e,f) WRF DA experiment. Left panels (a,c,e) are KSN radar site and right panels (b,d,f) are KWK radar site. Blue bold line is average reflectivity ( Z d B ¯ ), white line is average of the reflectivity factor in linear units ( Z d B ¯   l i n e a r , in mm−6 m−3), and black line is the cumulative reflectivity frequencies of the 25th, 50th, and 75th percentiles.
Remotesensing 14 00605 g008aRemotesensing 14 00605 g008b
Figure 9. THCS for Meso 1 and Meso 2 periods. (a,b) Radar observation, (c,d) WRF CTRL experiment, and (e,f) WRF DA experiment. Left panels (a,c,e) are KSN radar site and right panels (b,d,f) are KWK radar site.
Remotesensing 14 00605 g009
Figure 10. Difference in vertical hydrometeor profiles for (a) Meso 1 (KSN radar site) and (b) Meso 2 (KWK radar site) forecast period. Black line is temperature (solid) and dew-point temperature profile (dashed). Other colors are hydrometeor profiles (orange, q_cloud; blue, q_rain; green, q_ice; cyan, q_snow; purple, q_graupel).
Remotesensing 14 00605 g010
Figure 11. Same as Figure 8 but for Synop 1 (KSN radar site; left side panel) and Synop 2 (GDK radar site; right side panel). (a,b) Radar observation; (c,d) WRF CTRL experiment; and (e,f) WRF DA experiment.
Remotesensing 14 00605 g011
Figure 12. Same as Figure 9 but for Synop 1 (KSN radar site; left side panel) and Synop 2 (GDK radar site; right side panel). (a,b) Radar observation, (c,d) WRF CTRL experiment, and (e,f) WRF DA experiment.
Remotesensing 14 00605 g012
Figure 13. Same as Figure 10 but for Synop 1 (KSN radar site) and Synop 2 (GDK radar site). (a) KSN profile (DA minus CTRL); (b) GDK profile (DA minus CTRL).
Remotesensing 14 00605 g013
Figure 14. Comparison of the pattern correlation of 1 h accumulated precipitation between WRF DA and WRF CTRL. Red line is WRFDA experiment and blue line is WRF CTRL experiment for (a) Meso 1, (b) Meso 2, (c) Synop 1, and (d) Synop 2, respectively.
Remotesensing 14 00605 g014
Table 1. Overview of precipitation cases.
CaseCase PeriodsMaximum CAPE
(m2 s−2)
Existence of Low Level Jet
(Below 850 hPa)
Characteristics
1Meso 11500 UTC 17 July 2014
0600 UTC 18 July 2014
Gwang-ju: 1365
(0000 UTC 18 July 2014)
NoMesoscale
precipitation
2Meso 20200 UTC 1 June 2017
1500 UTC 1 June 2017
Osan: 1243
(0000 UTC 1 June 2017)
No
3Synop 10600 UTC 2 May 2016
0600 UTC 3 May 2016
Gwang-ju: 97
(0600 UTC 2 May 2016)
YesSynoptic scale
embedded
precipitation
4Synop 20000 UTC 1 July 2016
0000 UTC 2 July 2016
Osan: 573
(0600 UTC 1 July 2016)
Yes
Table 2. Selected configuration and parameterization schemes used in the WRF model simulation.
CategoryCharacteristics
Horizontal resolution13.5 km, 4.5 km and 1.5 km
(2 nested grid/3 domains)
# of grids
(d01|d02|d03)
301 × 301 × 60|337 × 364 × 60|640 × 820 × 60
Vertical layer information60 sigma levels up to 50 hPa
MicrophysicsWDM6 scheme
RadiationRRTM long/short wave scheme
Cumulus parameterizationKain-Fritsch scheme
(domain 3 off)
Planetary boundary layerYSU scheme
Surface Revised MM5 Monin-Obukhov similarity scheme
Land surface modelRUC LSM scheme
Table 3. Results of precipitation verification for cases.
Rainrate1 mm10 mm
Case CTRLDACTRLDA
Meso 1FSS0.1800.3280.0520.235
POD0.0300.18000.107
Meso 2FSS0.1440.2780.0810.194
POD0.1090.1960.0170.184
Synop 1FSS0.6370.7090.3630.401
POD0.4810.5490.2690.284
Synop 2FSS0.6440.6020.5290.481
POD0.5940.5690.2840.269
Table 4. Results of precipitation pattern verification for cases.
ScorePattern Correlation
Case CTRLDA
Meso 1−0.0930.728
Meso 20.1470.253
Synop 10.6140.649
Synop 20.4840.507
Publisher’s Note: MDPI stays neutral with regard to jurisdictional claims in published maps and institutional affiliations.

