
Microwave Brightness Temperature (MBT) Background in Bayan Har Block, Qinghai-Tibet Plateau and Its Importance in Searching for Seismic MBT Anomalies


Abstract
:
1. Introduction
2. Methods and Materials
2.1. MBT Background
2.2. MBT Data
2.3. Auxiliary Data
3. Results and Analysis
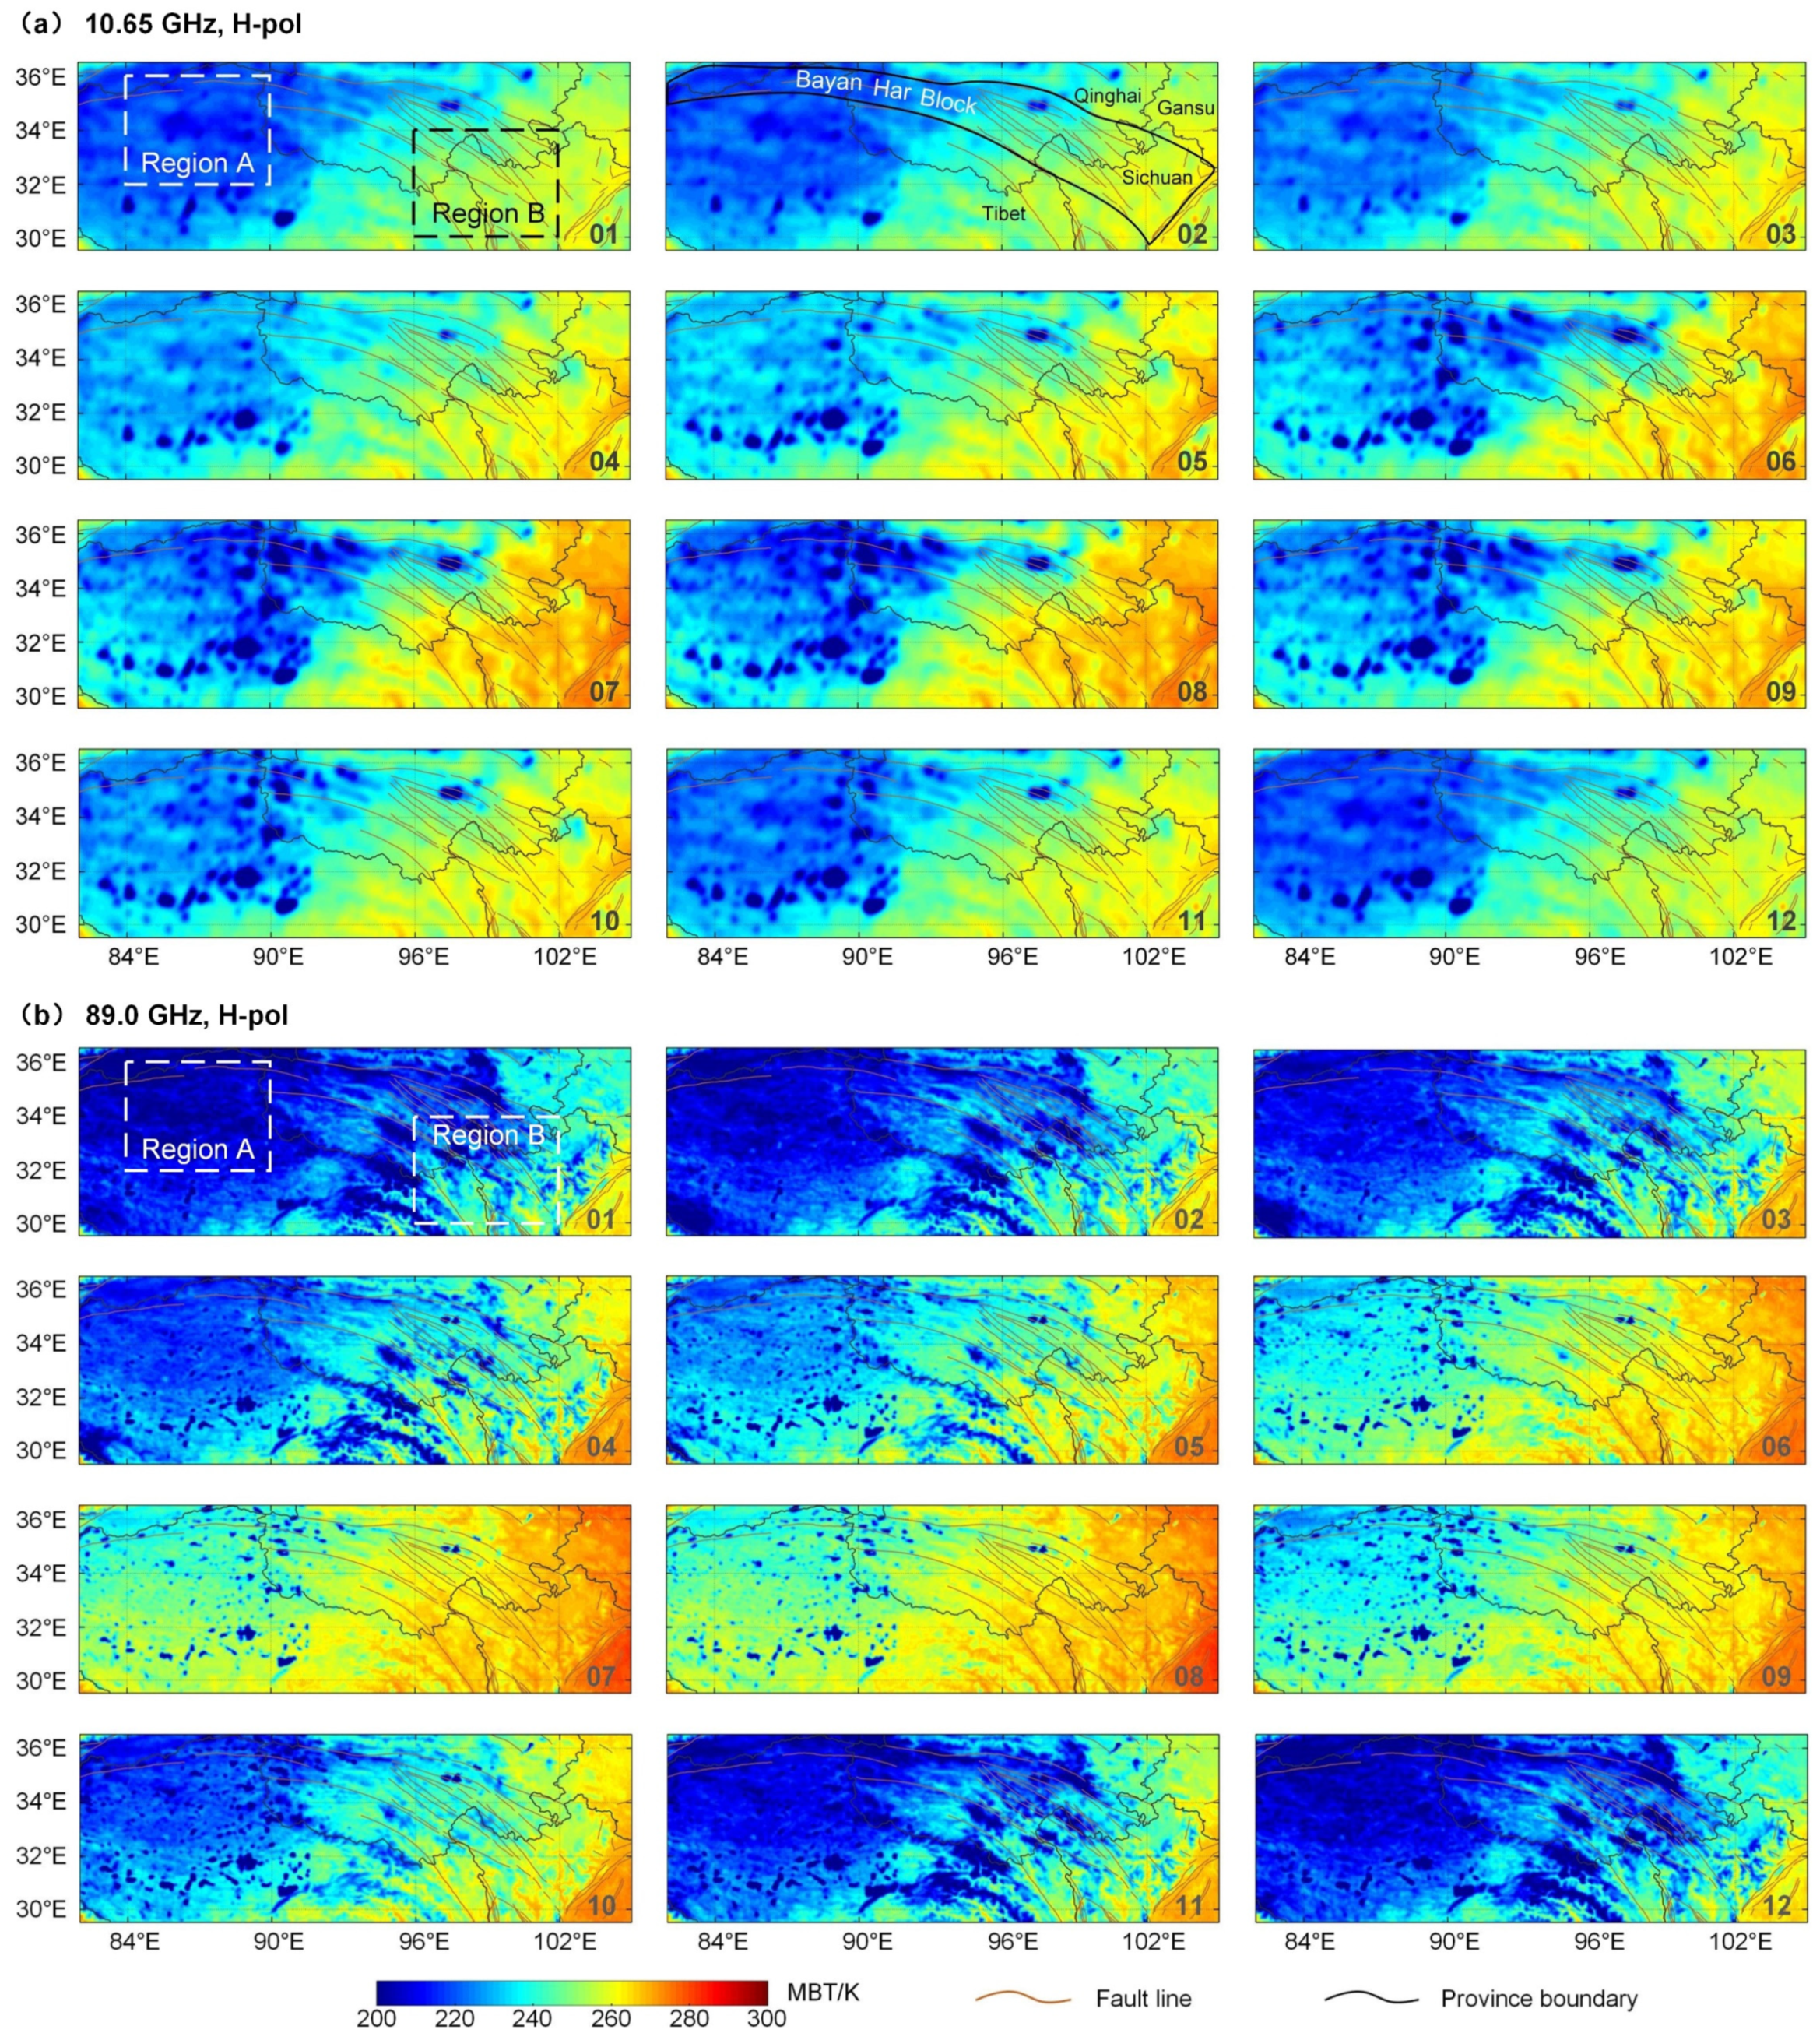
3.1. Monthly Mean MBT Background and Its Standard Deviation (STD)
3.2. Analysis of MBT Background and STD
3.3. Application to Extract Seismic MBT Anomaly
4. Discussion
4.1. Discrimination of the MBT Anomalies
4.2. Possible Causes of the Seismic MBT Anomalies
5. Conclusions and Outlook
Author Contributions
Funding
Data Availability Statement
Acknowledgments
Conflicts of Interest
Appendix A


References
- Gornyi, V.I.; Sal’Man, A.G.; Tronin, A.A.; Shilin, B.V. Outgoing infrared radiation of the earth as an indicator of seismic activity. Akad. Nauk SSSR Dokl. 1988, 301, 67–69. [Google Scholar]
- Wright, T.J.; Parsons, B.E.; Lu, Z. Toward mapping surface deformation in three dimensions using InSAR. Geophys. Res. Lett. 2004, 31, L01607. [Google Scholar] [CrossRef] [Green Version]
- Saraf, A.A.; Choudhury, S. Satellite detects surface thermal anomalies associated with the Algerian earthquakes of May 2003. Int. J. Remote Sens. 2004, 26, 2705–2713. [Google Scholar] [CrossRef]
- Hayakawa, M.; Hattori, K.; Ohta, K. Monitoring of ULF (ultra-low-frequency) geomagnetic variations associated with earthquakes. Sensors 2007, 7, 1108–1122. [Google Scholar] [CrossRef] [Green Version]
- Brunner, D.; Lemoine, G.; Bruzzone, L. Earthquake damage assessment of buildings using VHR optical and SAR imagery. IEEE Trans. Geosci. Remote Sens. 2010, 48, 2403–2420. [Google Scholar] [CrossRef] [Green Version]
- Wu, L.X.; Qin, K.; Liu, S.J. GEOSS-based thermal parameters analysis for earthquake anomaly recognition. Proc. IEEE 2012, 100, 2891–2907. [Google Scholar] [CrossRef]
- Dell’Acqua, F.; Gamba, P. Remote sensing and earthquake damage assessment: Experiences, limits, and perspectives. Proc. IEEE 2012, 100, 2876–2890. [Google Scholar] [CrossRef]
- Liu, S.J.; Liu, X.; Ma, Y.T.; Wu, L.X. Microwave radiation anomaly of Yushu earthquake and its mechanism. In Proceedings of the 2011 IEEE International Geoscience and Remote Sensing Symposium, Vancouver, BC, Canada, 24–29 July 2011; IEEE: New York, NY, USA, 2011; pp. 1192–1195. [Google Scholar] [CrossRef]
- Liu, W.; Yamazaki, F. Extraction of collapsed bridges due to the 2011 Tohoku-oki earthquake from post-event SAR images. J. Disaster. Res. 2018, 13, 281–290. [Google Scholar] [CrossRef]
- Qin, K.; Wu, L.X.; Zheng, S.; Ma, W.Y. Discriminating satellite IR anomalies associated with the MS 7.1 Yushu earthquake in China. Adv. Space. Res. 2018, 61, 1324–1331. [Google Scholar] [CrossRef]
- Ouzounov, D.; Pulinets, S.; Hattori, K.; Taylor, P. Pre-Earthquake Processes: A Multidisciplinary Approach to Earthquake Prediction Studies, 3rd ed.; John Wiley & Sons, Inc: Hoboken, NJ, USA, 2018. [Google Scholar] [CrossRef]
- Zhang, Y.; Meng, Q.Y.; Ouillon, G.; Sornette, D.; Ma, W.Y.; Zhang, L.L.; Zhao, J.; Qi, Y.; Geng, F. Spatially variable model for extracting TIR anomalies before earthquakes: Application to Chinese Mainland. Remote Sens. Environ. 2021, 267, 112720. [Google Scholar] [CrossRef]
- Qi, Y.; Wu, L.X.; Ding, Y.F.; Mao, W.F. Microwave brightness temperature anomalies associated with the 2015 Mw 7.8 Gorkha and Mw 7.3 Dolakha earthquakes in Nepal. IEEE Trans. Geosci. Remote Sens. 2022, 60, 1–11. [Google Scholar] [CrossRef]
- Qi, Y.; Miao, Z.L.; Wu, L.X.; Ding, Y.F. Seismic microwave brightness temperature anomaly detection using multitemporal passive microwave satellite images: Ideas and limits. IEEE J. Sel. Top. Appl. Earth Obs. Remote Sens. 2021, 14, 6792–6806. [Google Scholar] [CrossRef]
- Ulaby, F.T.; Moore, R.K.; Fung, A.K. Microwave Remote Sensing Fundamentals and Radiometry. In Microwave Remote Sensing Active and Passive, 2nd ed.; Addison-Wesley: Boston, MA, USA, 1981. [Google Scholar]
- Ulaby, F.T.; David, L. Microwave Radar and Radiometric Remote Sensing, 3rd ed.; The University of Michigan Press: Ann Arbor, MI, USA, 2014. [Google Scholar]
- Curtis, J.O. Moisture effects on the dielectric properties of soils. IEEE Trans. Geosci. Remote Sens. 2001, 39, 125–128. [Google Scholar] [CrossRef]
- Turner, D.D.; Clough, S.A.; Liljegren, J.C.; Clothiaux, E.E.; Cady-Pereira, K.E.; Gaustad, K.L. Retrieving liquid water path and precipitable water vapor from the atmospheric radiation measurement (ARM) microwave radiometers. IEEE Trans. Geosci. Remote Sens. 2007, 45, 3680–3690. [Google Scholar] [CrossRef]
- Bauer, P.; Schluessel, P. Rainfall, total water, ice water, and water vapor over sea from polarized microwave simulations and special sensor microwave/imager data. J. Geophys. Res. Atmos. 1993, 98, 20737–20759. [Google Scholar] [CrossRef]
- Njoku, E.G.; Jackson, T.J.; Lakshmi, V.; Chan, T.K.; Nghiem, S.V. Soil moisture retrieval from AMSR-E. IEEE Trans. Geosci. Remote Sens. 2003, 41, 215–229. [Google Scholar] [CrossRef]
- Njoku, E.G.; Entekhabi, D. Passive microwave remote sensing of soil moisture. J. Hydrol. 1996, 184, 101–129. [Google Scholar] [CrossRef]
- Karbou, F.; Gérard, É.; Rabier, F. Microwave land emissivity and skin temperature for AMSU-A and -B assimilation over land. Q. J. R. Meteor. Soc. 2006, 132, 2333–2355. [Google Scholar] [CrossRef] [Green Version]
- Li, Z.L.; Tang, B.H.; Wu, H.; Ren, H.Z.; Yan, G.J.; Wan, Z.M.; Trigo, I.F.; Sobrino, J.A. Satellite-derived land surface temperature: Current status and perspectives. Remote Sens. Environ. 2013, 131, 14–37. [Google Scholar] [CrossRef] [Green Version]
- Kelly, R.E.; Chang, A.T.; Tsang, L.; Foster, J.L. A prototype AMSR-E global snow area and snow depth algorithm. IEEE Trans. Geosci. Remote Sens. 2003, 41, 230–242. [Google Scholar] [CrossRef] [Green Version]
- Pulliainen, J. Mapping of snow water equivalent and snow depth in boreal and sub-arctic zones by assimilating space-borne microwave radiometer data and ground-based observations. Remote Sens. Environ. 2006, 101, 257–269. [Google Scholar] [CrossRef]
- Prigent, C.; Rossow, W.B.; Matthews, E. Microwave land surface emissivities estimated from SSM/I observations. J. Geophys. Res. Atmos. 1997, 102, 21867–21890. [Google Scholar] [CrossRef]
- Prigent, C.; Rossow, W.B.; Matthews, E. Global maps of microwave land surface emissivities: Potential for land surface characterization. Radio Sci. 1998, 33, 745–751. [Google Scholar] [CrossRef]
- Saraf, A.K.; Choudhury, S. Thermal remote sensing technique in the study of pre-earthquake thermal anomalies. J. Ind. Geophys. Union 2005, 9, 197–207. [Google Scholar] [CrossRef]
- Takano, T.; Maeda, T. Experiment and theoretical study of earthquake detection capability by means of microwave passive sensors on a satellite. IEEE. Geosci. Remote Sens. Lett. 2009, 6, 107–111. [Google Scholar] [CrossRef]
- Singh, R.P.; Zlotnicki, J.; Prasad, A.K.; Gautam, R.; Kafatos, M. Precursory signals using satellite and ground data associated with the Wenchuan earthquake of 12 May 2008. Int. J. Remote Sens. 2010, 31, 3341–3354. [Google Scholar] [CrossRef]
- Maeda, T.; Takano, T. Detection algorithm of earthquake-related rock failures from satellite-borne microwave radiometer data. IEEE Trans. Geosci. Remote Sens. 2010, 48, 1768–1776. [Google Scholar] [CrossRef]
- Chen, H.; Jin, Y.Q. A preliminary detection of anomalous radiation of rock failures related with Yushu earthquake by using satellite-borne microwave radiometers. Remote Sens. Technol. Appl. 2010, 25, 860–866. [Google Scholar] [CrossRef]
- Ma, Y.T.; Liu, S.J.; Wu, L.X.; Xu, Z.Y. Two-step method to extract seismic microwave radiation anomaly: Case study of Ms 8.0 Wenchuan earthquake. Earthq. Sci. 2011, 24, 577–582. [Google Scholar] [CrossRef] [Green Version]
- Jing, F.; Singh, R.P.; Sun, K.; Shen, X. Passive microwave response associated with two main earthquakes in Tibetan Plateau, China. Adv. Space Res. 2018, 62, 1675–1689. [Google Scholar] [CrossRef]
- Qi, Y.; Wu, L.X.; He, M.; Mao, W.F. Spatio-temporally weighted two-step method for retrieving seismic MBT anomaly: May 2008 Wenchuan earthquake sequence being a case. IEEE J. Sel. Top. Appl. Earth Obs. Remote Sens. 2020, 13, 382–391. [Google Scholar] [CrossRef]
- Qi, Y.; Wu, L.X.; Mao, W.F.; Ding, Y.F.; He, M. Discriminating possible causes of microwave brightness temperature positive anomalies related with May 2008 Wenchuan earthquake sequence. IEEE Trans. Geosci. Remote Sens. 2021, 59, 1903–1916. [Google Scholar] [CrossRef]
- Ding, Y.F.; Qi, Y.; Wu, L.X.; Mao, W.F.; Liu, Y.J. Discriminating the multi-frequency microwave brightness temperature anomalies relating to 2017 Mw 7.3 Sarpol Zahab (Iran-Iraq border) earthquake. Front. Earth Sci. 2021, 706, 656216. [Google Scholar] [CrossRef]
- Qi, Y.; Wu, L.X.; Mao, W.F.; Ding, Y.F.; Liu, Y.J. Satellite Passive Microwave Remote Sensing for Seismic Thermal Anomaly: Phenomena and Mechanisms. In Proceedings of the 2021 IEEE International Geoscience and Remote Sensing Symposium, Brussels, Belgium, 11–16 July 2021; IEEE: New York, NY, USA; pp. 8696–8699. [CrossRef]
- Liu, S.J.; Xu, Z.Y.; Wei, J.L.; Huang, J.W.; Wu, L.X. Experimental study on microwave radiation from deforming and fracturing rock under loading outdoor. IEEE Trans. Geosci. Remote Sens. 2016, 54, 5578–5587. [Google Scholar] [CrossRef]
- Gao, X.; Liu, S.J.; Wu, L.X.; Mao, W.F.; Li, W.W.; Huang, J.W. The variation in microwave brightness temperature of granite pressed under weak background radiation. IEEE Trans. Geosci. Remote Sens. 2020, 59, 1369–1381. [Google Scholar] [CrossRef]
- Gao, X.; Liu, S.J.; Wu, L.X.; Mao, W.F.; Li, W.W.; Huang, J.W.; Mao, W.F. The anisotropy and polarization of stress-induced microwave radiation changes in granite and their significance for seismic remote sensing. IEEE Trans. Geosci. Remote Sens. 2021, 59, 7603–7617. [Google Scholar] [CrossRef]
- Mao, W.F.; Wu, L.X.; Liu, S.J.; Gao, X.; Huang, J.W.; Xu, Z.Y.; Qi, Y. Additional microwave radiation from experimentally loaded granite covered with sand layers: Features and mechanisms. IEEE Trans. Geosci. Remote Sens. 2020, 58, 5008–5022. [Google Scholar] [CrossRef]
- Mao, W.F.; Wu, L.X.; Qi, Y. Impact of compressive stress on microwave dielectric properties of feldspar specimen. IEEE Trans. Geosci. Remote Sens. 2020, 58, 1398–1408. [Google Scholar] [CrossRef]
- Zoran, M. MODIS and NOAA-AVHRR l and surface temperature data detect a thermal anomaly preceding the 11 March 2011 Tohoku earthquake. Int. J. Remote Sens. 2012, 33, 6805–6817. [Google Scholar] [CrossRef]
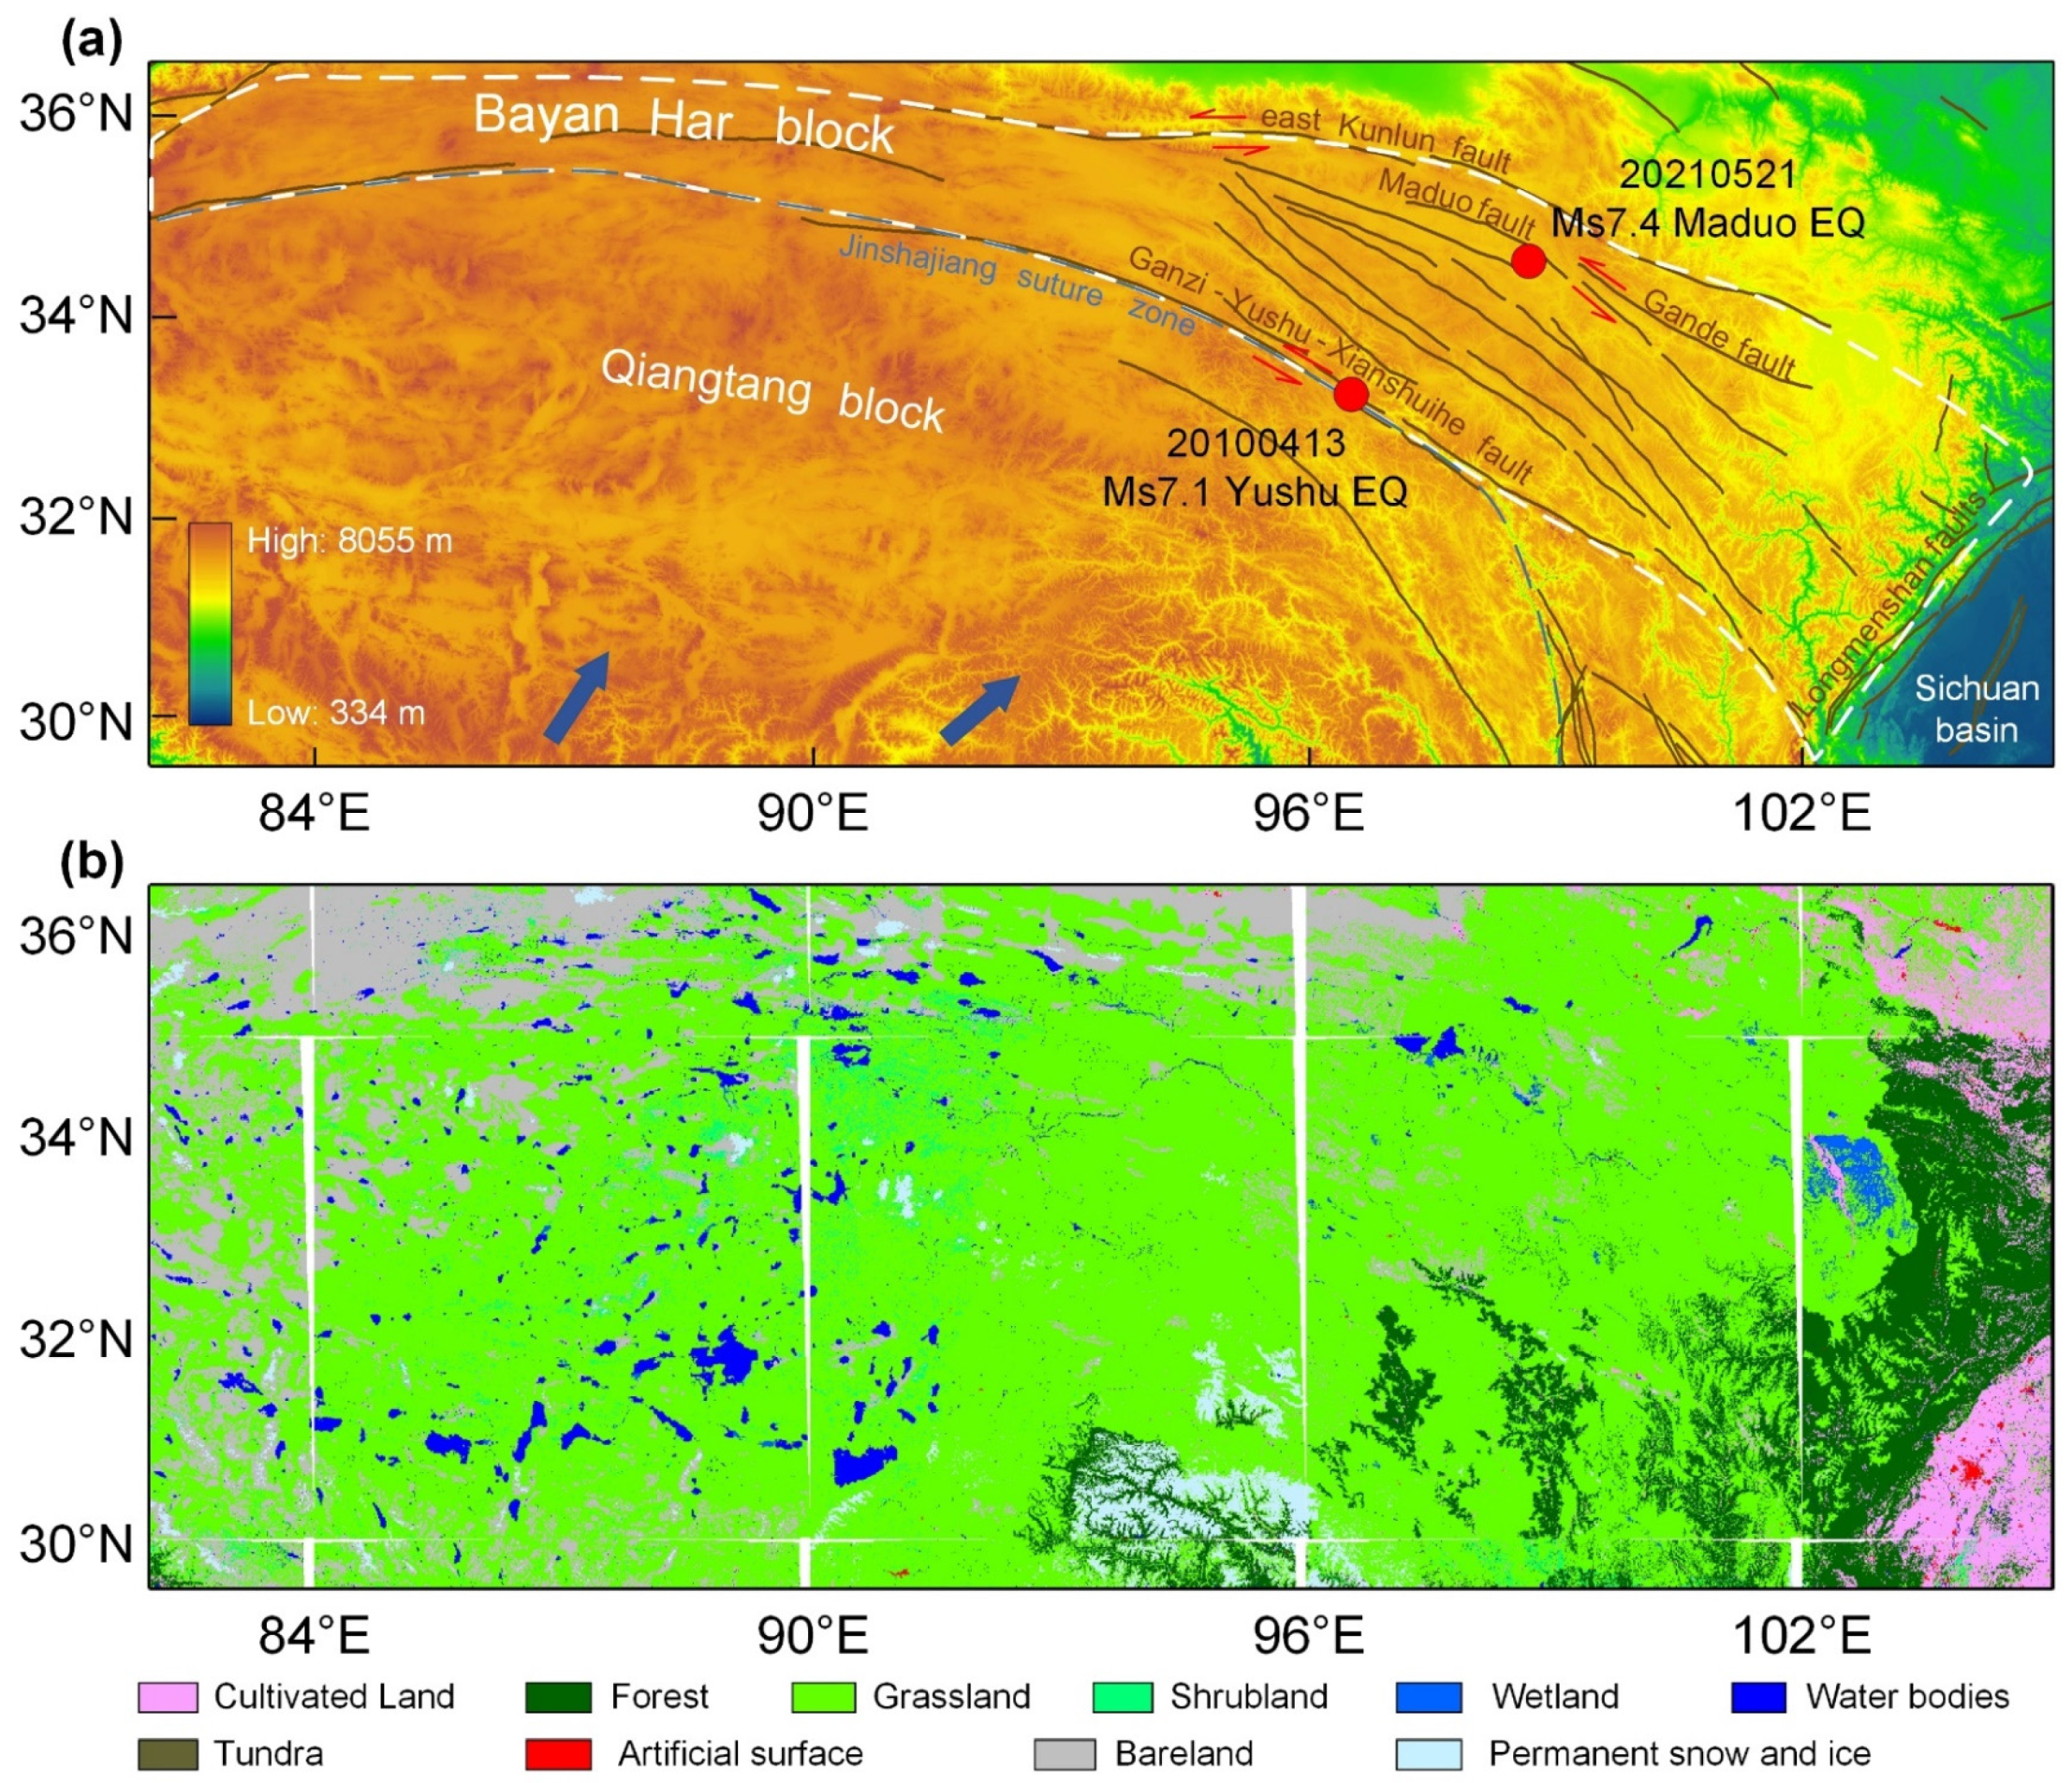
- Deng, Q.D.; Gao, X.; Chen, G.H.; Yang, H. Recent tectonic activity of Bayankala fault block and the Kunlun Wenchuan earthquake series of the Tibetan Plateau. Earth Sci. Front. 2010, 17, 163. [Google Scholar]
- Woerd, J.V.D.; Tapponnier, P.; Ryerson, F.J.; Meriaux, A.S.; Meyer, B.; Gaudemer, Y.; Finkel, R.C.; Caffee, M.W.; Zhao, G.G.; Xu, Z.Q. Uniform postglacial slip-rate along the central 600 km of the Kunlun Fault (Tibet), from 26Al, 10Be, and 14C dating of riser offsets, and climatic origin of the regional morphology. Geophys. J. Int. 2002, 148, 356–388. [Google Scholar] [CrossRef]
- Wang, S.Y.; Tian, H.; Ma, K.X.; Yu, C.; Ma, W.Y.; Yu, H.Z. Correlation between short-term and imminent anomalies of LURR and OLR before the Maduo Ms7.4 earthquake in Qinghai Province. China Earthq. Eng. J. 2021, 43, 847–852, 859. [Google Scholar] [CrossRef]
- Liu, J.; Du, X.B.; Jacques, Z.; Fan, Y.Y.; An, Z.H.; Xie, T.; Zheng, G.L.; Tan, D.C.; Chen, J.Y. The changes of the ground and ionosphere electric/magnetic fields before several great earthquakes. Chin. J. Geophys. 2011, 54, 2885–2897. [Google Scholar] [CrossRef]
- Zhao, S.F.; Shen, X.H.; Zhima, Z.; Zhou, C. The very low-frequency transmitter radio wave anomalies related to the 2010 Ms 7.1 Yushu earthquake observed by the DEMETER satellite and the possible mechanism. Ann. Geophys. 2020, 38, 969–981. [Google Scholar] [CrossRef]
- Dong, C.; Chen, B.; Yuan, J.C.; Wang, Z.D.; Wang, C. Characteristic analysis of the lithospheric magnetic anomaly before the Madoi M S 7.4 earthquake on 22th May 2021. Acta Seismol. Sin. 2021, 43, 453–462. [Google Scholar] [CrossRef]
- Prigent, C.; Aires, F.; Rossow, W.B. Land surface microwave emissivities over the globe for a decade. Bull. Am. Meteorol. Soc. 2006, 87, 1573–1584. [Google Scholar] [CrossRef] [Green Version]
- Prigent, C.; Aires, F.; Rossow, W.; Matthews, E. Joint characterization of vegetation by satellite observations from visible to microwave wavelengths: A sensitivity analysis. J. Geophys. Res. Atmos. 2001, 106, 20665–20685. [Google Scholar] [CrossRef]
- Weng, F.Z.; Yan, B.H.; Grody, N.C. A microwave land emissivity model. J. Geophys. Res. Atmos. 2001, 106, 20115–20123. [Google Scholar] [CrossRef]
- Jackson, T.J., III. Measuring surface soil moisture using passive microwave remote sensing. Hydrol. Process. 1993, 7, 139–152. [Google Scholar] [CrossRef]
- Qi, Y.; Wu, L.; Ding, Y.; Liu, Y.; Chen, S.; Wang, X.; Mao, W. Extraction and discrimination of MBT anomalies possibly associated with the Mw 7.3 Maduo (Qinghai, China) Earthquake on 21 May 2021. Remote Sens. 2021, 13, 4726. [Google Scholar] [CrossRef]
- Institute of Geology, China Seismological Bureau. Analysis of Source Area Seismotectonics of Yushu Ms 7.1 Earthquake. 2010. Available online: http://www.eq-igl.ac.cn (accessed on 19 November 2021).
- Gan, W.J.; Zhang, P.Z.; Shen, Z.K.; Niu, Z.J.; Wang, M.; Wan, Y.G.; Zhou, D.M.; Cheng, J. Present-day crustal motion within the Tibetan Plateau inferred from GPS measurements. J. Geophys. Res. Solid Earth 2007, 112, B08416. [Google Scholar] [CrossRef] [Green Version]
- Qin, K.; Wu, L.X.; Zheng, S.; Liu, S.J. A deviation-time-space-thermal (DTS-T) method for global earth observation system of systems (GEOSS)-based earthquake anomaly recognition: Criterions and quantify indices. Remote Sens. 2013, 5, 5143–5151. [Google Scholar] [CrossRef] [Green Version]
- Yang, X.Y.; Yang, L.M.; Li, Y.J.; Tan, P. Numerical simulation on strong earthquake dynamic process of Bayan Har block. Acta Seismol. Sin. 2013, 35, 304–314. [Google Scholar] [CrossRef]
- Wei, C.X.; Zhang, Y.S.; Xiao, G.; Qin, M.Z.; Ning, Y.L.; Gao, J. Thermal infrared and long-wave radiation anomalies of Yushu M_S7.1 earthquake. Pro. In. Geophys. 2013, 28, 2444–2452. [Google Scholar] [CrossRef]
- Xie, T.; Kang, C.L.; Ma, W.Y. Thermal infrared brightness temperature anomalies associated with the Yushu (China) Ms = 7.1 earthquake on 14 April 2010. Nat. Hazards Earth Syst. Sci. 2013, 13, 1105–1111. [Google Scholar] [CrossRef] [Green Version]
- Zhan, Y.; Liang, M.J.; Sun, X.Y.; Huang, F.P.; Zhao, L.Q.; Gong, Y.; Han, J.; Li, C.X.; Zhang, P.Z.; Zhang, H.P. Deep structure and seismogenic pattern of the 2021.5.22 Madoi (Qinghai) Ms7.4 earthquake. Chin. J. Geophys. 2021, 64, 2232–2252. [Google Scholar]
- Su, W.G.; Liu, L.; Yuan, F.Q.; Zhao, Y.H.; Sun, X.H. The anomaly characteristics of well water temperature in Yushu seismic station before the 2021 Maduo MS7.4 earthquake. Acta Geol. Sin. 2021, 43, 1–5. [Google Scholar]
- Freund, F. Toward a unified solid state theory for pre-earthquake signals. Acta Geophys. 2010, 58, 719–766. [Google Scholar] [CrossRef]


| Parameter | AMSR-E | AMSR-2 | |||||||||
|---|---|---|---|---|---|---|---|---|---|---|---|
| Platform | AQUA | GCOM-W1 | |||||||||
| Available time | 1 June 2002–4 October 2011 | 2 July 2021–present | |||||||||
| Frequency (GHz) | 6.925 | 10.65 | 18.7 | 23.8 | 36.5 | 89.0 | 10.65 | 18.7 | 23.8 | 36.5 | 89.0 |
| Polarization | H, V | H, V | |||||||||
| Spatial resolution (km) | 50 | 50 | 25 | 25 | 15 | 5 | 50 | 25 | 25 | 15 | 5 |
| IFOV (km × km) | 43 × 75 | 29 × 51 | 16 × 27 | 18 × 32 | 8.2 × 14 | 3.7 × 6.5 | 42 × 24 | 22 × 14 | 26 × 15 | 12 × 7 | 5 × 3 |
| NEΔT (K) | <0.34 | <0.7 | <0.7 | <0.6 | <0.7 | <1.2 | <0.7 | <0.7 | <0.6 | <0.7 | <1.2 |
| Information | Yushu Earthquake | Maduo Earthquake |
|---|---|---|
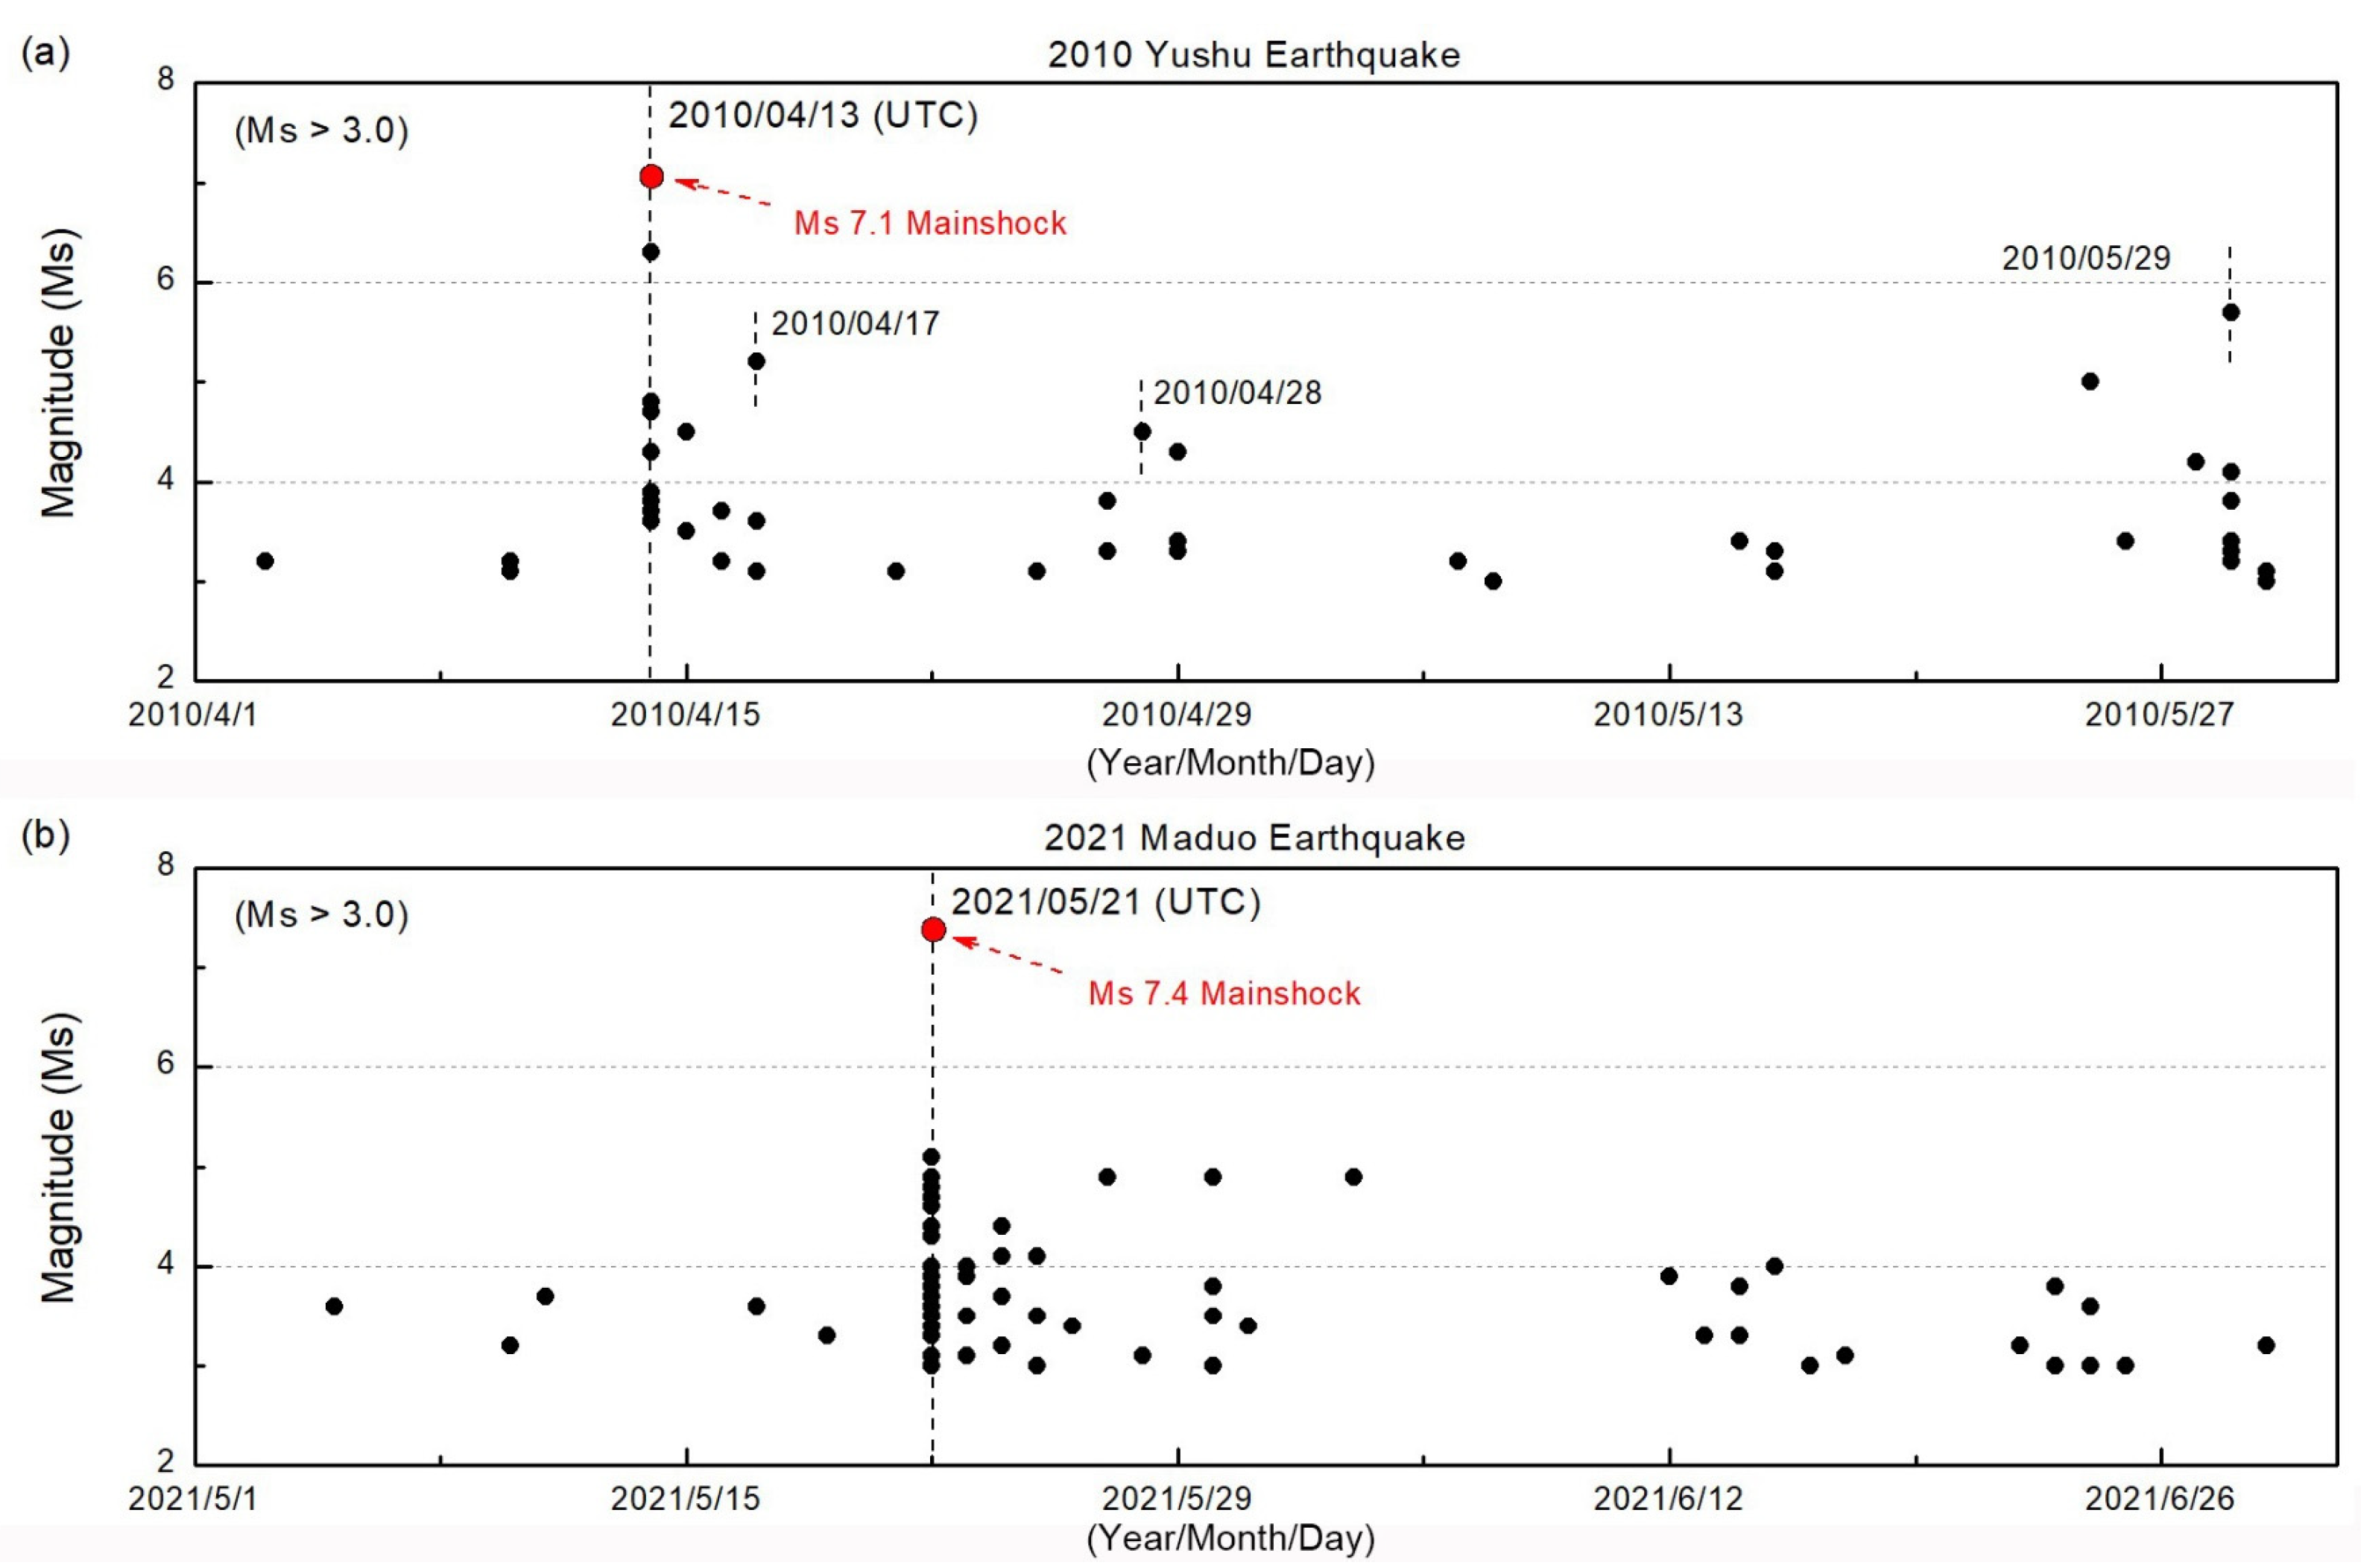
| Time (UTC) | 13 April 2021 | 21 May 2021 |
| Type | strike-slip | strike-slip |
| Magnitude (Ms) | 7.1 | 7.4 |
| Location | 33.17°N, 96.55°E | 34.65°N, 98.40°E |
| Hypocenter depth (km) | 14 | 9 |
Publisher’s Note: MDPI stays neutral with regard to jurisdictional claims in published maps and institutional affiliations. |
© 2022 by the authors. Licensee MDPI, Basel, Switzerland. This article is an open access article distributed under the terms and conditions of the Creative Commons Attribution (CC BY) license (https://creativecommons.org/licenses/by/4.0/).
Share and Cite
Qi, Y.; Wu, L.; Ding, Y.; Liu, Y.; Wang, X.; Mao, W. Microwave Brightness Temperature (MBT) Background in Bayan Har Block, Qinghai-Tibet Plateau and Its Importance in Searching for Seismic MBT Anomalies. Remote Sens. 2022, 14, 534. https://doi.org/10.3390/rs14030534
Qi Y, Wu L, Ding Y, Liu Y, Wang X, Mao W. Microwave Brightness Temperature (MBT) Background in Bayan Har Block, Qinghai-Tibet Plateau and Its Importance in Searching for Seismic MBT Anomalies. Remote Sensing. 2022; 14(3):534. https://doi.org/10.3390/rs14030534
Chicago/Turabian StyleQi, Yuan, Lixin Wu, Yifan Ding, Yingjia Liu, Xiao Wang, and Wenfei Mao. 2022. "Microwave Brightness Temperature (MBT) Background in Bayan Har Block, Qinghai-Tibet Plateau and Its Importance in Searching for Seismic MBT Anomalies" Remote Sensing 14, no. 3: 534. https://doi.org/10.3390/rs14030534