1. Introduction
Water resources (quality and quantity) play an important role in the ecological environment and socioeconomic development of watersheds. Surface water is an extremely complex mixture of soluble and insoluble substances; therefore, water quality is a comprehensive characteristic of a waterbody under the interaction of environmental elements. The dissolved and insoluble substances in water directly affect the properties of surface water, leading to the deterioration of waterbodies to different levels. Water pollution is a major environmental problem worldwide, especially in developing countries [
1]. The water quality of a watershed has an important impact on the ecological environment and human health [
2]. Moreover, it is extremely vulnerable to deterioration due to external factors, so it is necessary to monitor the water quality in real time. During water quality monitoring, dynamic changes of water quality parameters are obtained at the monitoring station. Although the accuracy of the obtained water quality is high in the monitoring station, there are only a few monitoring stations in a given basin, which cannot satisfy the needs of dynamic monitoring in an entire basin. Remote sensing-based water quality monitoring can obtain the water quality parameters of the whole basin, which plays an important role in detecting pollution sources and analyzing the causes of river water quality changes.
The survey method and section monitoring can obtain the change of water quality very accurately [
3], while the remote sensing can dynamically monitor the state of surface water in a large area and a long term in a timely and low-cost manner. Moreover, it can reveal the pollution source, diffusion direction, and influence range of pollutants. Therefore, researchers have done a lot of work in surface water quality analysis based on remote sensing [
4,
5]. These studies mainly focus on oil pollution, suspended solids (e.g., sediment and microorganisms), and water eutrophication [
6,
7,
8]. The research methods include qualitative analysis, empirical models, and semi-empirical models. Qualitative methods mainly evaluate the state of water environment by analyzing the hue features or anomalies of remote sensing images. Such studies usually determine the relationship between the phenomenon of the water environment based on field data synchronized and the hue of remote sensing images, and then establish a quantitative method for image interpretation. The empirical method is based on a statistical correlation analysis of remote sensing band data and field measurement data. The optimal band or band combination data and field-measured water quality parameters are selected, and the correlation model is obtained through statistical analysis, and the water quality parameters are inversed. Several studies have shown that when analyzing the turbidity of surface water, at low turbidities, there is a good correlation between the turbidity and reflectivity of the satellite band located in the red part of the spectrum, e.g., Dogliotti et al. [
9] The semi-empirical method is used to select the optimal band or band combination to estimate water quality parameters according to the spectral reflectance characteristics of a waterbody measured by satellite sensors or field spectrometers. This method is then used to establish a quantitative empirical algorithm between the obtained remote sensing data and water quality parameters. Gohin et al. [
10] used the semi-empirical method to extract the turbidities of wa-terbodies based on the concentrations of chlorophyll-
a (Chl-
a) and non-algae suspended particulate matter (SPM) using satellite images, while Zhang et al. [
11] estimated the water clarity of inland water using in situ reflectance measurements.
To date, several studies have been done on remote-sensing monitoring of water quality in different watersheds. The main process involves selecting the sensitive bands to describe water quality changes and building a regression model between the combined band index and water quality parameters [
12,
13]. These studies have shown that increased sediment and algae concentrations in a waterbody are closely related to water eutrophication and key pollution indicators [
14]. When a large number of nutrients enter the water body, the indicators, such as total nitrogen and total phosphorus, in the water body will increase, and algae will reproduce under specific conditions, leading to water eutrophication. Subsequently, the dissolved oxygen concentration reduces in the process of algae death and decomposition, resulting in the death of fish and shellfish. Ultimately, eutrophication can destroy the ecological environment of a river basin and even affect human health.
The decrease of dissolved oxygen (DO) and the increase of total nitrogen (TN) and total phosphorus (TP) are the important signs of water quality deterioration in middle of northeast China. Because the optical properties of TN and TP in waterbodies are not obvious, and standard physical models cannot be used to construct their concentration estimation equations based on remote sensing [
15], some empirical models based on spectral combination have been proposed and developed to predict water quality parameters [
16,
17,
18]. The spectral characteristics of the waterbody are mainly influenced by the Chl-
a concentration [
19], total suspended sediment (TSS) [
20], suspended particulate matter (SPM) [
10], and other factors (e.g., underwater topography and water depth). The increase of Chl-
a concentration also indicates the aggravation of eutrophication. With the change of Chl-
a concentration, there is a significant difference in the water optical spectrum between 430 nm and 700 nm, which is the theoretical basis for monitoring Chl-
a concentration by remote sensing [
21]. Different band ratio methods or ratio regression methods are usually used to determine the concentration of Chl-
a. The studies found when Chl-
a concentration of >5 μg/L, the spectral reflectance ratio (R705/R675) of the studied waterbody and the position of the Chl-
a reflection peak near 700 nm had a good correlation with the Chl-
a concentration [
21]. It is also found that suspended material (SPM), such as sediment and algae, scatter and reflect the light entering the waterbody, thus improving the reflectivity of the waterbody [
16]. The spectral attenuation characteristics of a waterbody vary with pollutant concentrations [
21,
22]. Sediment, Chl-
a, and suspended solid concentrations are closely related to the chemical composition of the waterbodies within a watershed. As intermediate media, these parameters are strongly correlated with water quality. Therefore, it is of great significance to determine the relationships between remote sensing images and water quality parameters based on the data of previous studies. Such information could also be used to analyze the causes of water quality changes, which is of great significance for tracing the pollution sources.
Up to now, several studies have attempted to use a variety of sensor data (e.g., IRS-1c, SPOT, TM, ETM, and EO-1) for water quality monitoring [
19,
23,
24,
25,
26,
27]. These studies have shown that turbidity, Chl-
a, and SPM could be used to indicate the deterioration of water quality caused by eutrophication [
9,
20,
28], and water quality parameters are highly correlated with turbidity, Chl-
a, and SPM [
29]. The changes of Chl-
a, SPM, and TSS in water body are closely related to the change of TN, TP, and DO. However, considering the spectral, spatial, and temporal resolutions, Landsat data have certain advantages in water quality monitoring. In this study, based on previous studies on the TSS, SPM, Chl-
a, and turbidity, and the analysis of the optimal band combination, the regression relationships between these optimal band combinations and water quality parameters were determined using Landsat 8 images and field measurement data. Previous studies have shown that the reflectance of each band to the target observation object is normally distributed, and that the fitting efficiency of water quality parameters using linear regression is very low [
14,
30]. Therefore, to obtain the water quality parameters of large-scale watershed quickly and effectively, this study proposes a stable and reliable water quality parameter model based on Gaussian regression. This model can automatically obtain the optimal combination of multi-spectral band ratios by using the measured data and corresponding band ratios based on Pearson correlation analysis, as well as reduce the dimension of multi-dimensional band ratio combinations by principal component analysis. This model is a nonparametric model with good regression performance for priori data of low dimensions and small samples. As key parameters affecting regional water quality, DO, TN, and TP are selected to construct a Gaussian process model for retrieving water quality parameters based on remote sensing bands, and the performance of the three models is compared in this study.
2. Materials and Methods
2.1. Study Area
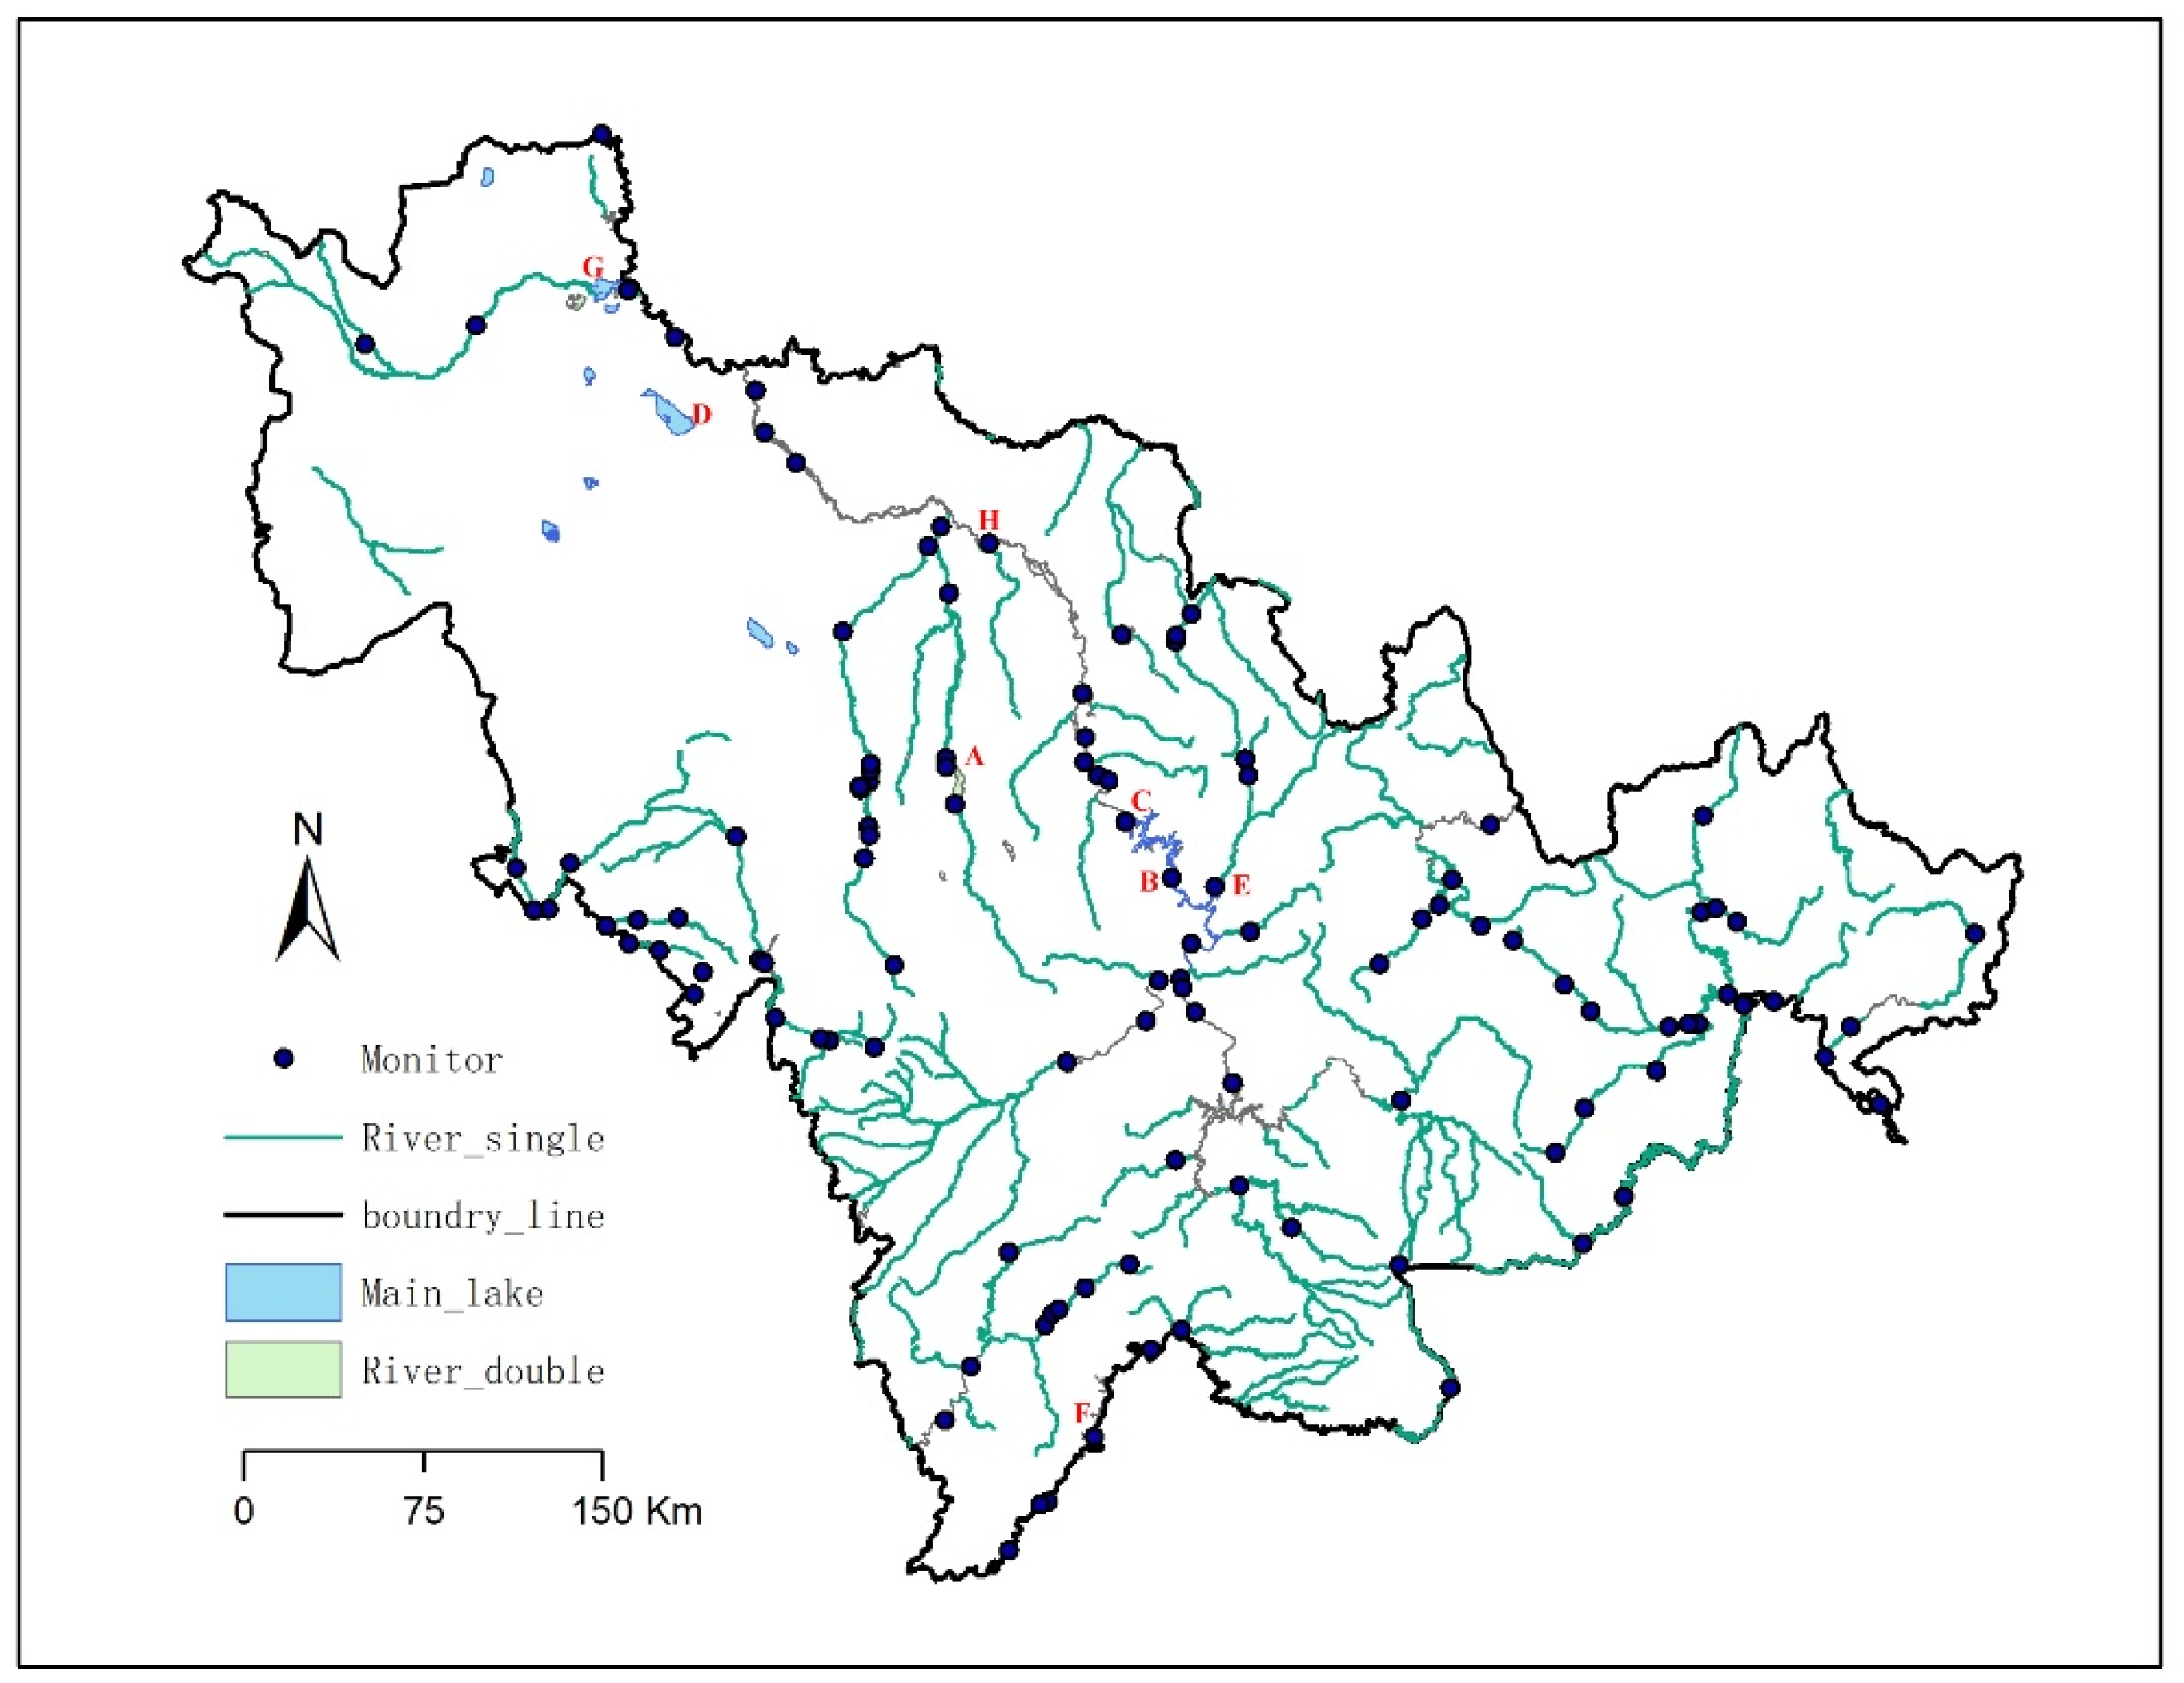
The study area is located in the middle of Northeast China (123°42′–127°31′E, 42°34′–44°08′N). The study area includes the Liao River Basin and Songhua River Basin (
Figure 1). The terrain gradually descends from the hilly area of the southeast to the plains of the northwest. The study area is a typical agricultural region, where diffuse pollution from agriculture and the breeding industry severely impacts water quality. The mean annual precipitation is 621.7 mm, and 80% of rainfall occurs from May to September. The mean annual evaporation is 1378.9 mm. The mean annual temperature is 5.0 °C and the minimum reaches −29.6 °C. The high temperature period is mainly from July to August. There are two main rivers in the study area, Songhua River and Liao River. The mean annual water resource volume is 4.04 × 10
8 m
3. Soil erosion in the upstream of main rivers is serious, with a maximum erosion modulus of >2.0 × 10
6 kg/km
2·a (Water Resources Bulletin of Jilin Province 2020). This study area is one of the ten inland river basins in China and a representative area for water pollution control. The main pollutants include ammonia nitrogen, TN, TP, DO, and chemical oxygen demand. The main pollution sources are soil erosion, agriculture (diffuse pollution), industry (point-source pollution), livestock breeding, and urban and rural life. In recent years, the deterioration of water quality has seriously affected the local ecological environment and social economy. Therefore, real-time monitoring of surface water quality parameters over the entire study area has become an important part of water quality management.
2.2. Data Collection and Processing
The data was used in this study including water quality field data and corresponding remote sensing data. Field-measured data from May 2020 to November 2021 were obtained from watershed water quality monitoring section. These samples are daily data, which are issued by China Environmental Monitoring Station and conform to the national water quality monitoring standards. The freezing period of rivers in the study area is from the middle of November to the May of the next year (about 160 days). During this period, remote sensing monitoring of water parameters is difficult, so the samples in this study are selected from non-freezing water bodies from May to November. The Landsat 8 Operational Land Imager (OLI), which was launched in 2013, was selected as the data source for the analysis and the establishment of water quality parameters. The return visit period of Landsat 8 is 16 days, which can complete the observation of the same area twice a month. The spatial resolution of bands 1–7 is 30 m, which meets the requirements of routine water quality monitoring. The Landsat 8 OLI includes all the bands of the ETM. To avoid atmospheric absorption, OLI readjusts the width of band 5 (0.845–0.885 μm), excluding the wavelength of 0.825 μm, which has strong absorption of water vapor (Landsat 8 Data Users Handbook). The dataset USGS Landsat 8 Surface Reflectance Tier 1 (LANDSAT/LC08/C01/T1_SR) is used in this study. This dataset is the atmospherically corrected surface reflectance from the Landsat 8 OLI/TIRS sensors. Remote sensing images of 18 monitoring sections which synchronized with above field data were obtained through Google Earth Engine (GEE).
Nitrogen, phosphorus, and other nutrients are the most important water quality parameters causing water eutrophication. Concentrations of TN and TP are important indicators of international water quality monitoring [
31], and they are the basic items of China’s “environmental quality standard for surface water” (GB 3838-2002) (
Table 1) [
32]. A previous study found strong correlations between
Chl-a, suspended solid (including sediment), TN, and TP concentrations in the Liao River basin of Jilin Province. This study selected 171 measured water quality samples as field data from the study area during 2020–2021 and 171 Landsat OLI 8 images were obtained from the United States Geological Survey (USGS) (
https://www.usgs.gov, accessed on 10 January 2022). Image data with a cloud cover of <5% were selected for this study. The signal noise from the sky background, adjacency effects, sun glint, and water body mirror reflection were eliminated by next steps. Firstly, the data samples affected by sun glint and water body mirror reflection were removed when Band1 > Band2 > Band3 > Band4 based on the previous research [
33]. Secondly, this study eliminated the influence of sky background reflectance of inland waters. The clean water body (Tianci) in the study area was selected as the benchmark. Because of the strong absorption of the near-infrared band by clean water, we subtracted the reflectance of the infrared band from the reflectance of all bands of Pixel to eliminate the influence of sky background.
2.3. Theoretical Basis of Water Quality Monitoring
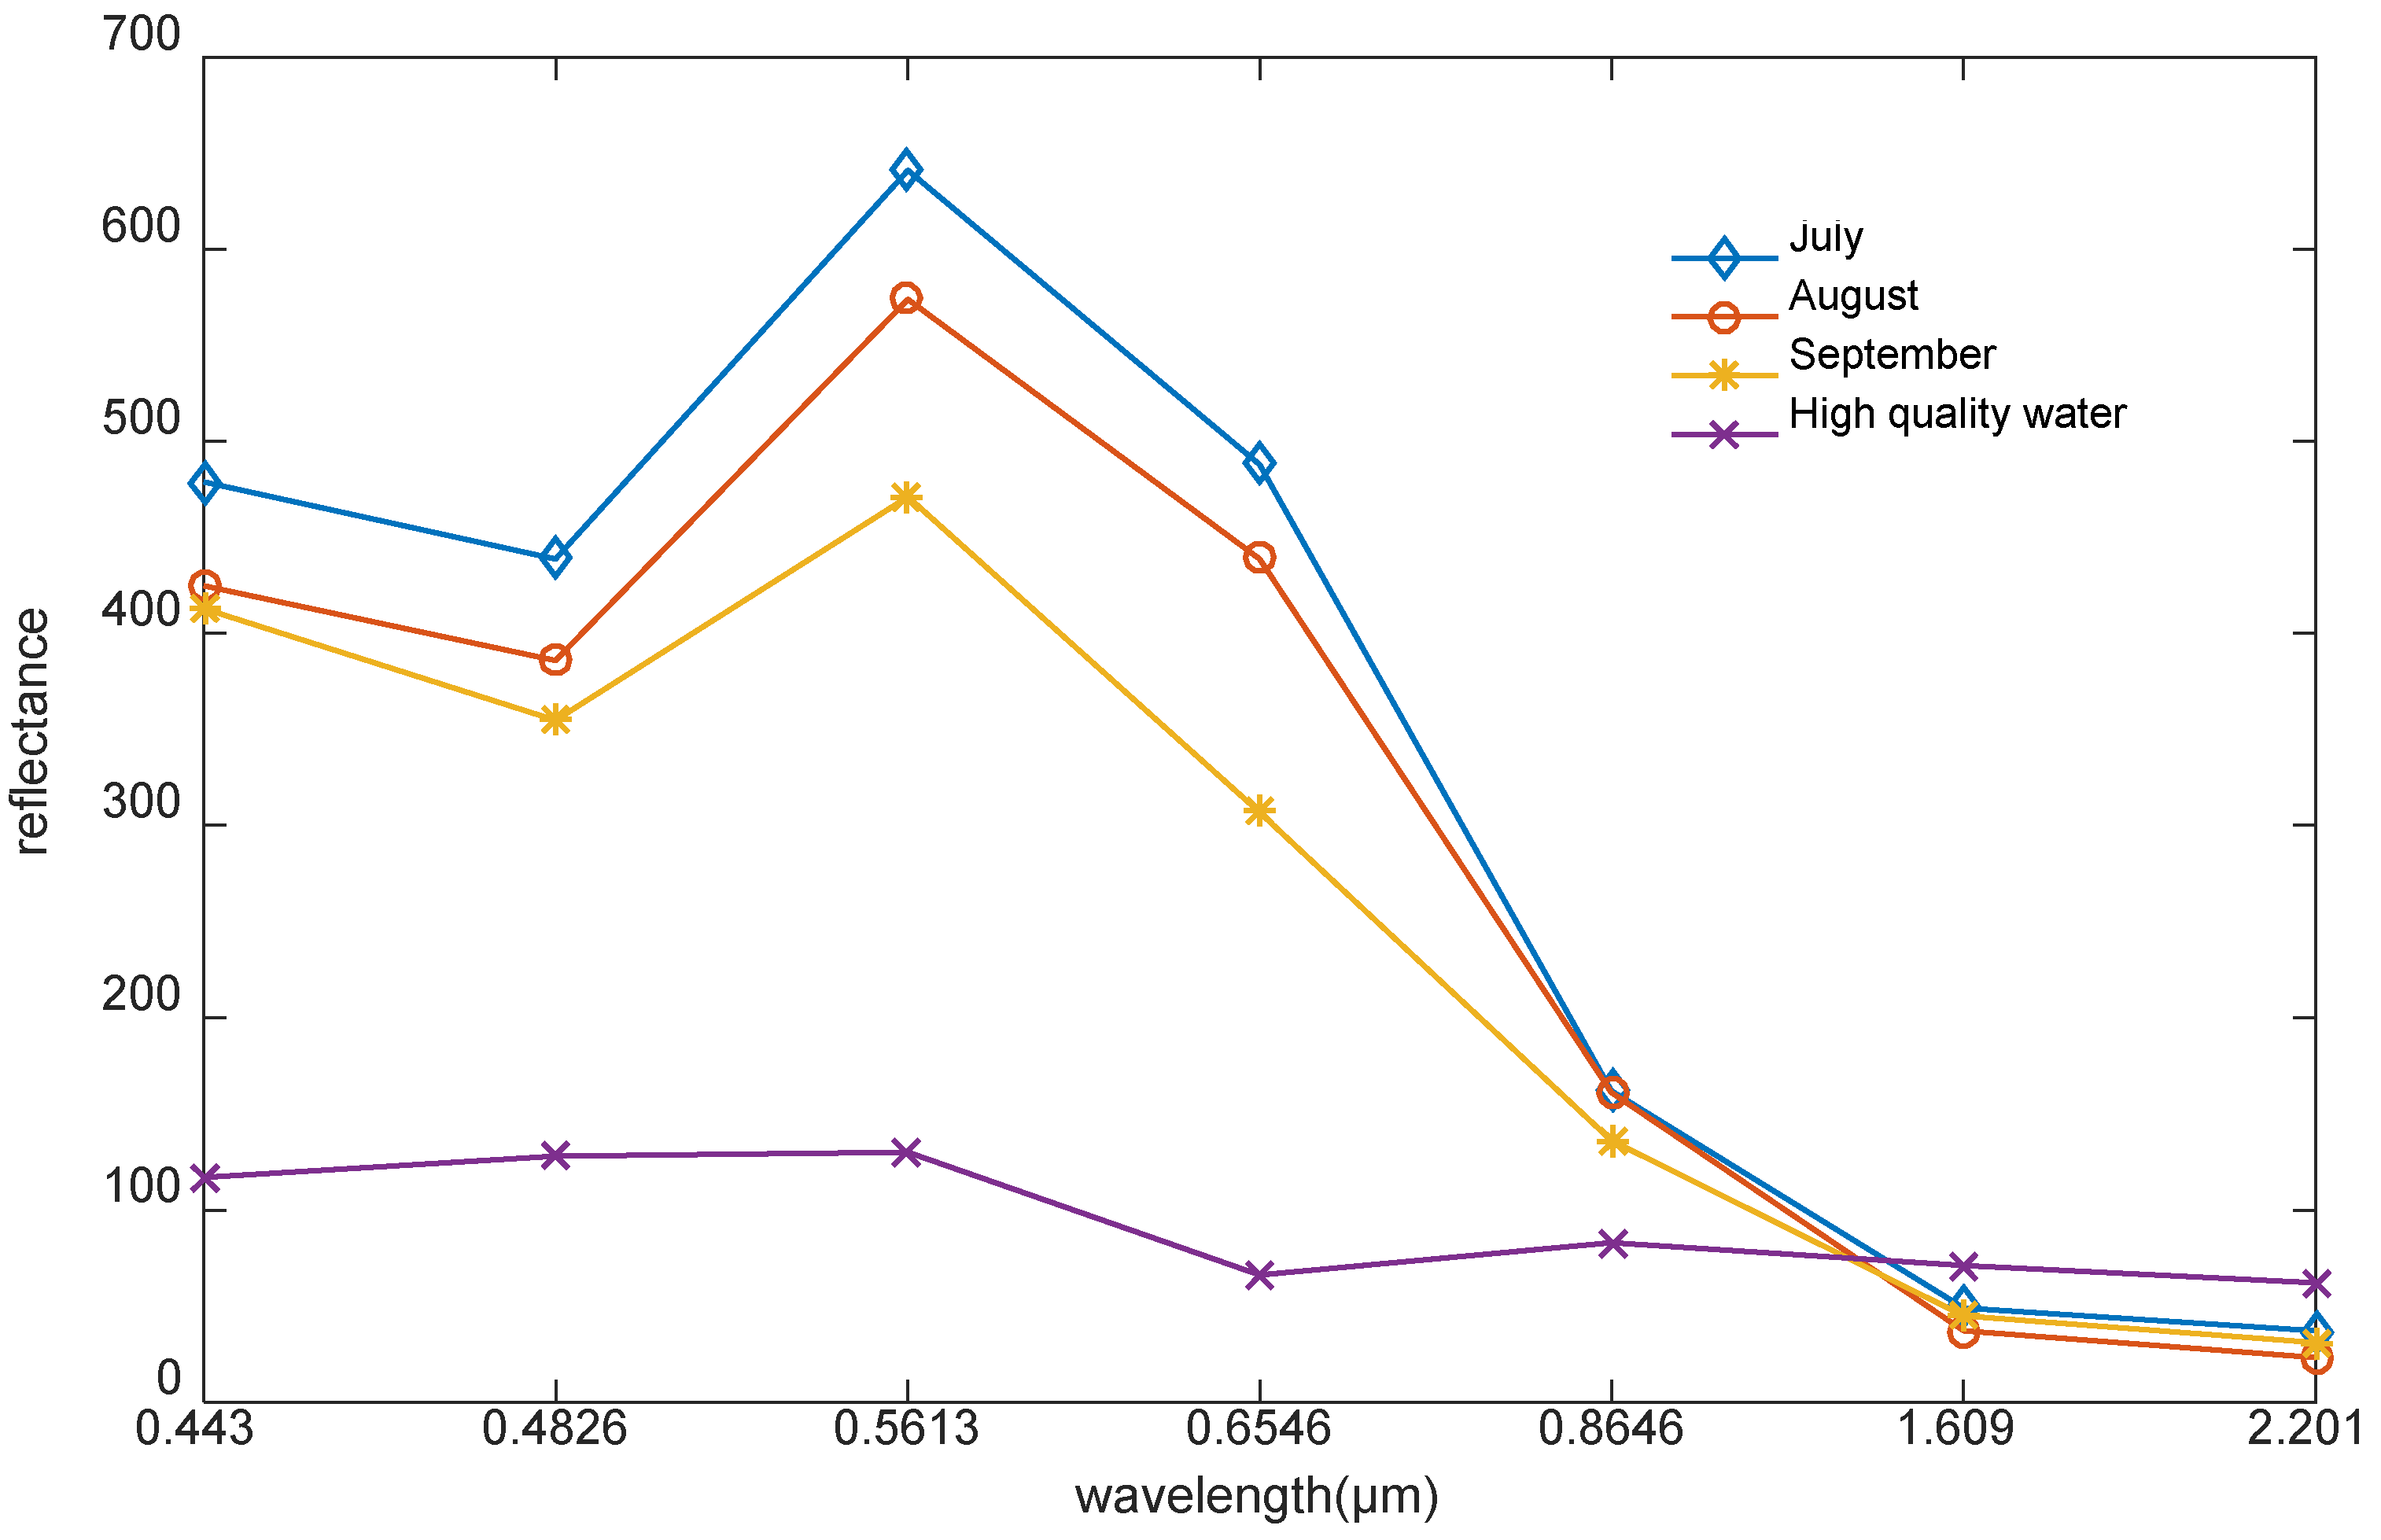
The principle of remote sensing monitoring for water quality parameters is that a waterbody containing certain substances has unique spectral characteristics that are different from those of natural clean water. The reflection of a natural waterbody is mainly in the blue–green band, and the absorption rate of other bands is very strong, especially in the near-infrared and mid-infrared bands. As the reflectivity is almost zero, it is easy to identify water in the infrared band. The spectral reflectance of relatively clean natural water in the 0.4–1.1 μm band is approximately 1–3% (mean of ~2%). However, when other substances exist in water, such as suspended solids, algae, chemicals, dissolved organic matter, and other water components that affect the reflection, absorption, and backscattering of light, these are reflected in the remote sensing image [
34]. Therefore, water quality parameters can be inferred based on light reflection in the image. The reflectance of a waterbody with dark suspended matter in the 0.4–1.1 μm band is slightly lower than that of clean natural water. When sediment exists, the emissivity of the visible light band increases due to the scattering effect of sediment, and the peak value appears in the yellow, red area. Near infrared reflectance increases obviously with the increase of Chl-
a concentration in water [
21]. Hence, the spectral reflectance of turbid water is usually higher than that of clear water because it is composed of sediment, natural organic matter, and plankton (
Figure 2).
A high-quality water spectrum was obtained for a waterbody in Tianchi, Changbai Mountain, near the study area. The differences in the contents of various components of the waterbody resulted in a significant difference in reflectivity within a certain wavelength range, thus providing a basis for the quantitative measurement of the corresponding water quality parameters. The average water depth of Tianchi is 204 m, which is a very pure water and belong to class I water quality.
2.4. Water Parameter Models Based on Gaussian Process Regression
Gaussian process regression is a nonparametric and kernel-based model that uses a Gaussian process (GP) prior to the regression analysis of data [
35]. The GP has been successfully applied to model spatially varying environmental problems. Liang and Liu (2021) calculated the surface water fraction using the GPR model [
36]. Because the reflectance of surface water is related to water quality parameters, remote sensing image bands can be used to estimate the spatial distribution of water quality parameters. Moreover, as a probability prediction method, remote sensing images can be used for the regression analysis of water quality parameters by combining uncertainty estimation with super parameter characterization and model training. Therefore, the GPR model can effectively capture the nonlinear relationship between water quality parameters and band reflectivity.
The GPR method assumes that all sensitive bands and their combination of waterbodies (as ) obey a multivariate Gaussian distribution, where f is a GP. A GPR model uses a GP to explain the response by introducing potential variables. Therefore, for each sample , j ∈ [1, n], GPR introduces a potential variable that obeys a Gaussian distribution, and then all variables become a group of random variables f(X) with a joint Gaussian distribution.
Taking
S as the training set and assuming that the training data are independent and identically distributed, but that the distribution is unknown, the expression of the high-dimensional multivariate GPR model is defined as follows:
where
y is the in situ measured water quality parameter;
X is a random variable;
,
is the mean function of each variable;
f(
X)
N(
μ(
X),
κ(
X,
X)),
κ(
X,
X) is the covariance function between the dimensions of the two variables;
i is the dimension of the variables;
is an independent and identically distributed noise variable that obeys the distribution of
, where
is the weight vector and
is the covariance.
First, it was assumed that a prior distribution for the function
obeyed the GP with a mean value of 0 in the GPR model:
Taking
T as the test set, which is independent and identically distributed like
S, the samples of
T and
S can be calculated as follows:
The prior distribution of the training set is expressed as
. For the test set (
), the
and
variables were assumed to obey the joint normal distribution:
where the Gramian matrix
,
,
, and
κ are kernel functions. Therefore, the joint normal distribution of all data can be expressed as:
According to the properties of the GP, the noise also obeys this rule:
Because the sum of two independent multivariate Gaussian variables is still a multivariate Gaussian variable, the GPR model can be expressed as follows:
To simplify the model, Equation (7) can be expressed and calculated as follows.
To solve the above formulae, the automatic relevance determination (ADR) is selected as the kernel function
κ:
where both
x(
i) and
x(
j) are the
d-by-1 vectors;
and
l are super parameters of the kernel and are used to express the characteristics of the width and length scale, respectively. Solving by GPR is also called hyperparameter learning, and the maximum likelihood estimation (MLE) is used to obtain the hyperparameters of the GPR model.
To select the sensitive bands of Landsat 8 OLI data for establishing water quality parameters, based on radiometric and fast atmospheric corrections, remote sensing images with good quality and synchronous field data were selected for analysis. The regression relationships of a single band and combined bands of Landsat 8 OLI and three water quality parameters are analyzed, and the optimal band combinations of water quality parameters are ranked and selected using Pearson’s correlation analysis. To ensure the normality of the data, this study first processes the input data by Box–Cox transform.
To verify the reliability of the model, this study selected the correlation analysis, the root mean square error (RMSE), the mean absolute percentage error (MAPE), and population stability index (PSI) to verify the validity of the model. The PSI is the most common model stability evaluation method, which can measure the distribution difference between testing samples and training samples. Grouping the samples by numerical value is adopted to test whether the proportion of samples in the total samples within each grouping interval changes significantly.
where
Ac are training samples,
Ex are testing samples, and
i denotes the number of groups. When PSI < 0.1, it indicates good stability of the model, and when PSI is between 0.1 and 0.2, it indicates general stability of the model.
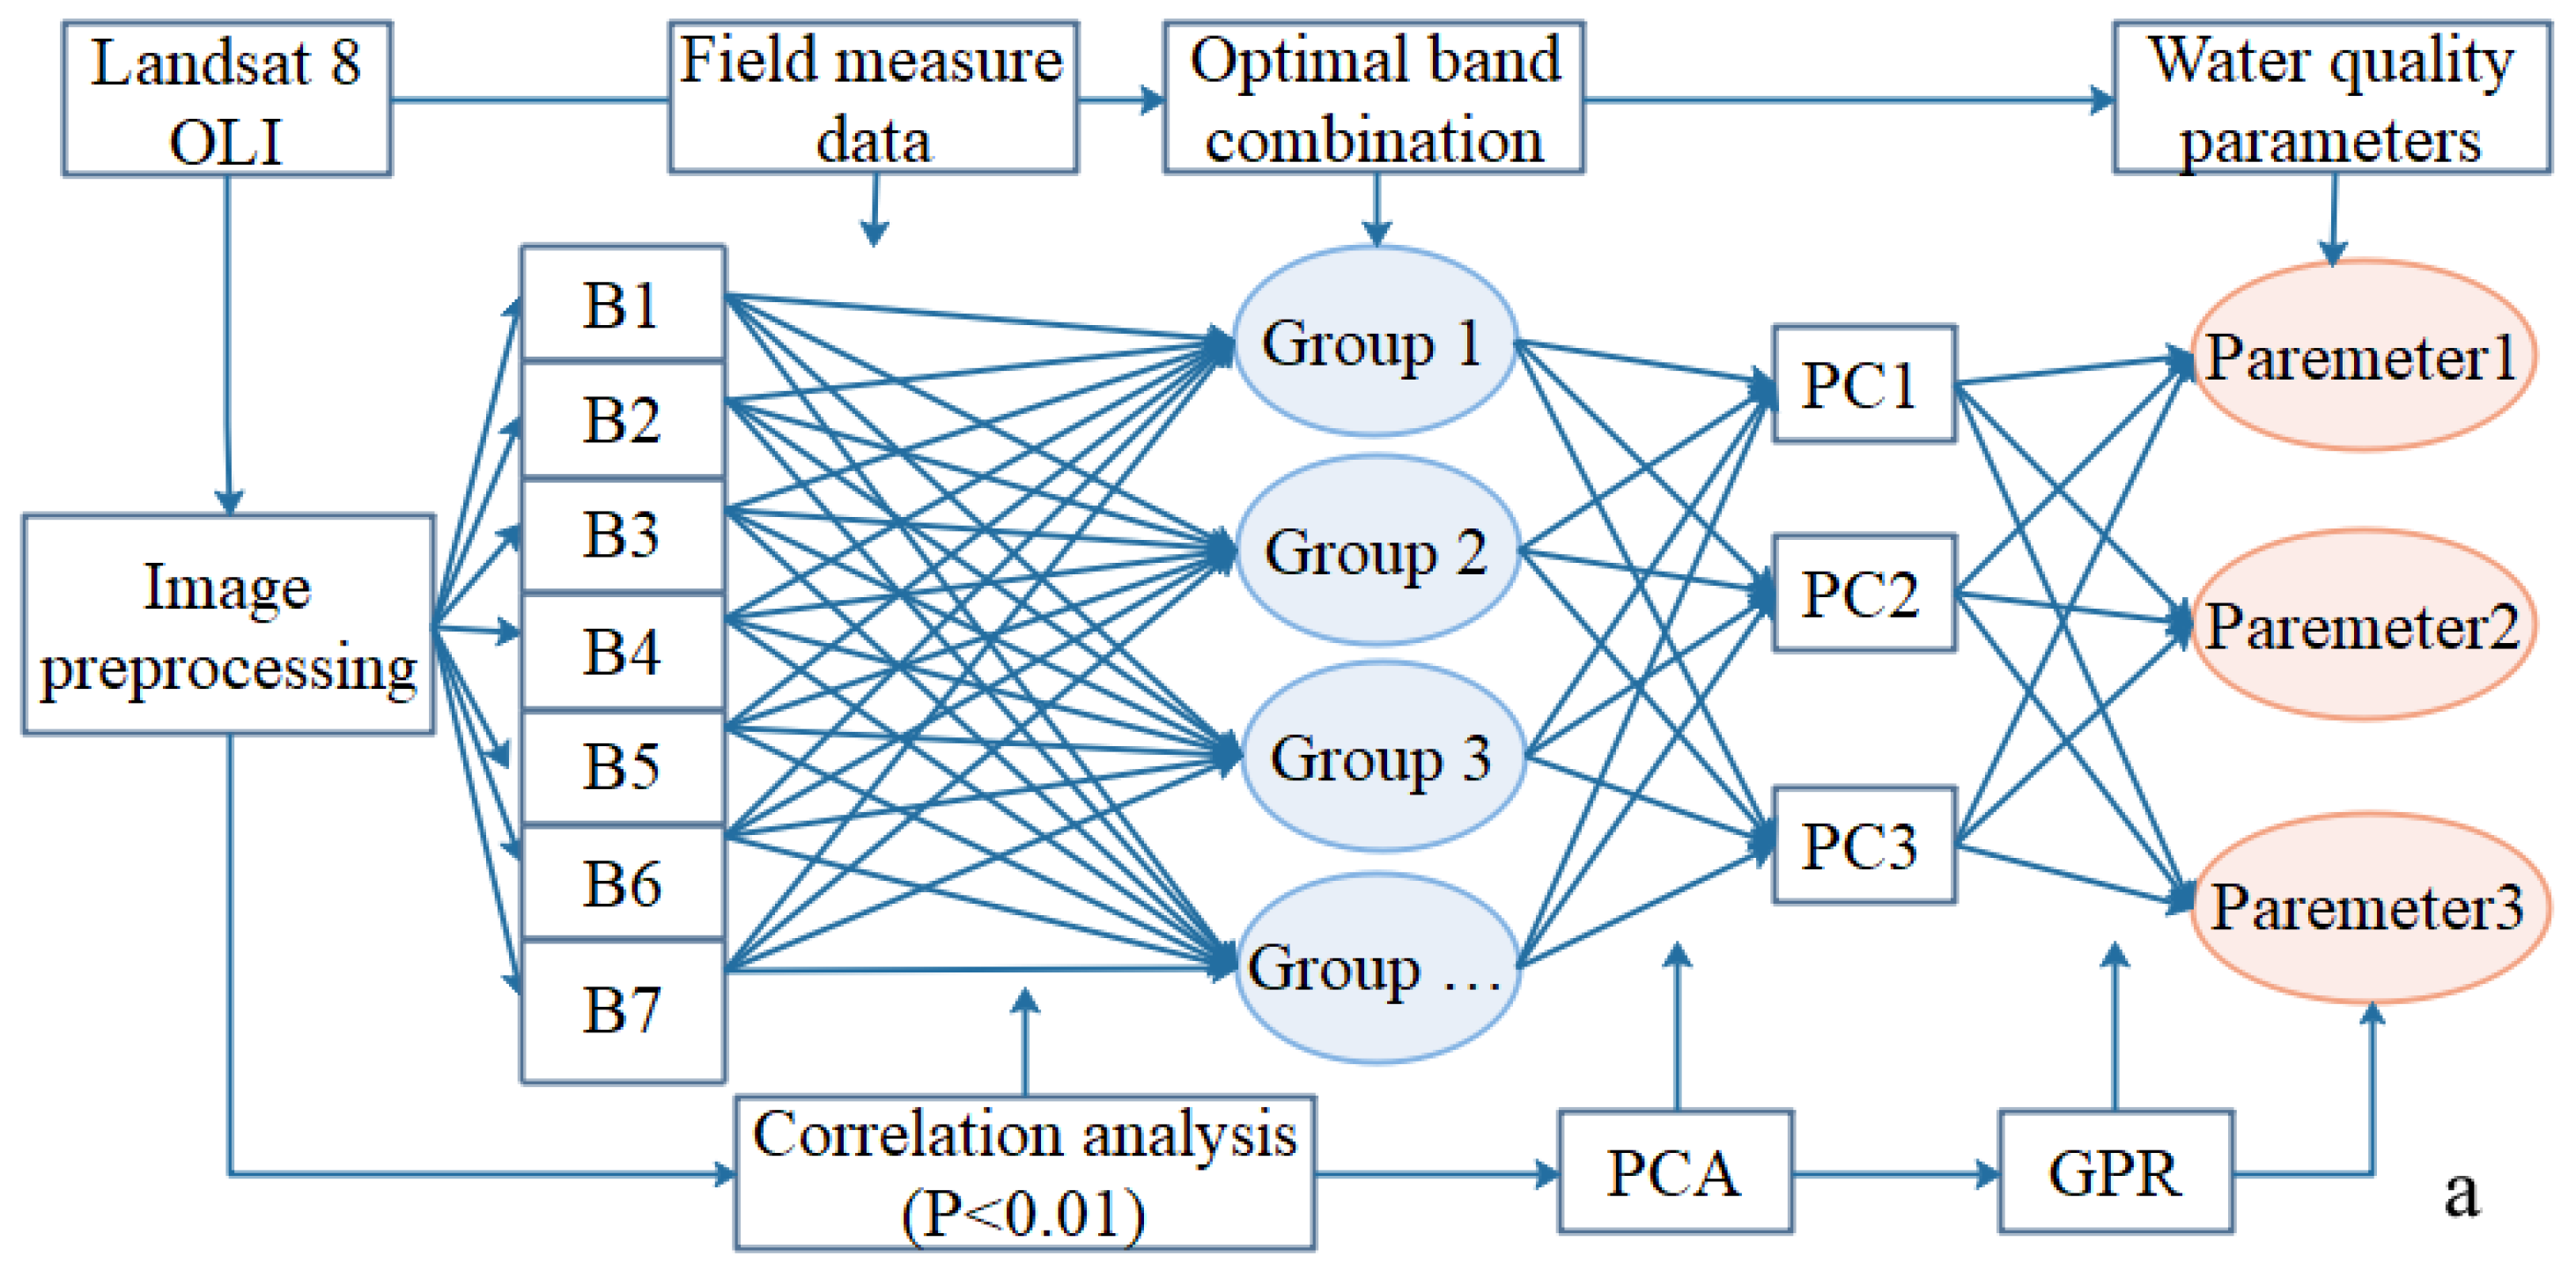
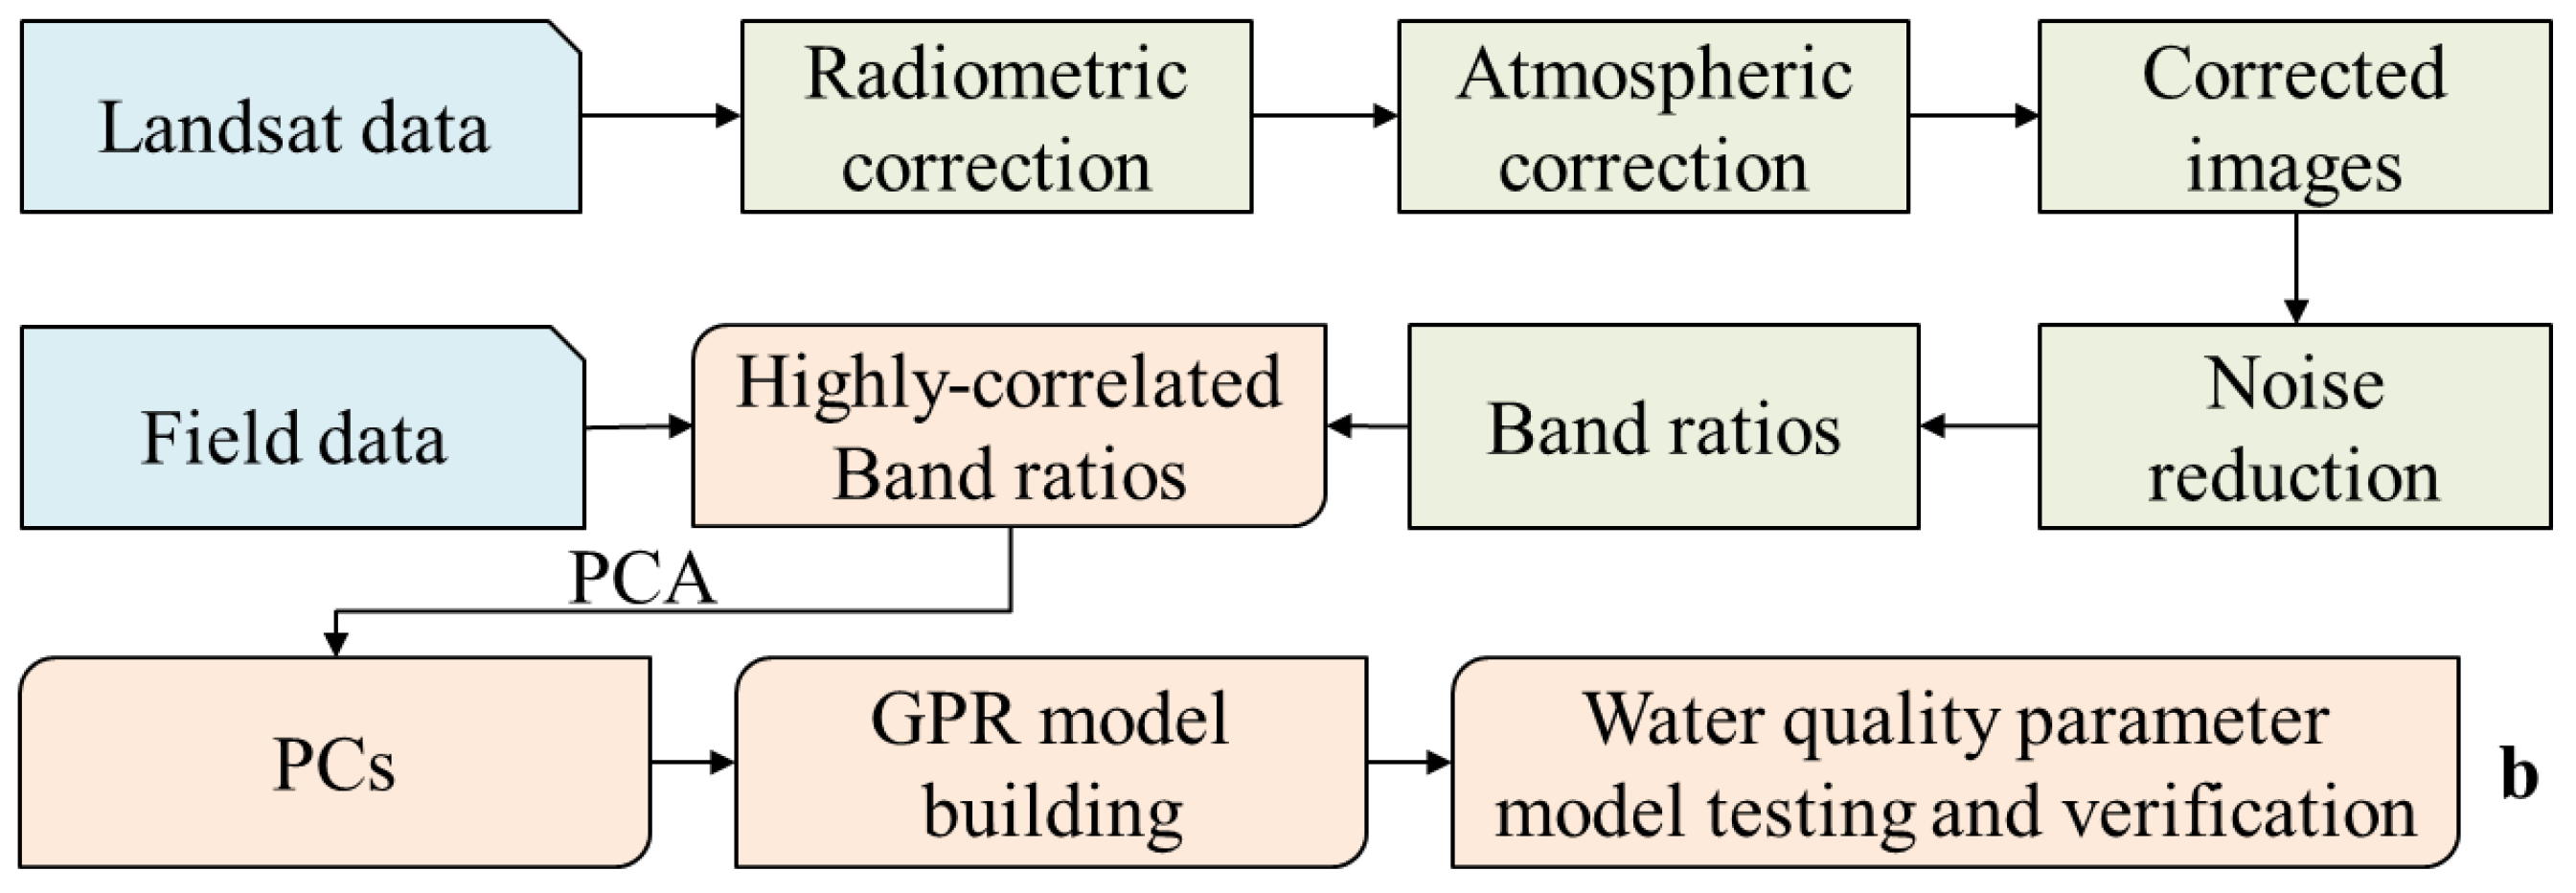
Based on GPR and PCA methods, the model building flowchart and total study flowchart are designed and shown in
Figure 3a by using field measure data and Landsat images.
As shown in
Figure 3b, to establish the water quality parameters based on remote sensing images, the optimal band and optimal band combinations for water quality parameters were selected based on a correlation analysis of the remote sensing band data and the field-measured data. Then, multiple optimal band combinations for water quality parameters were combined based on the Gaussian process regression (GPR) model, which was used to retrieve the water quality parameters. This method could provide support for the real-time monitoring of water quality parameters over large-scale areas, and it could also assist in tracing pollution sources in river basins.
3. Results
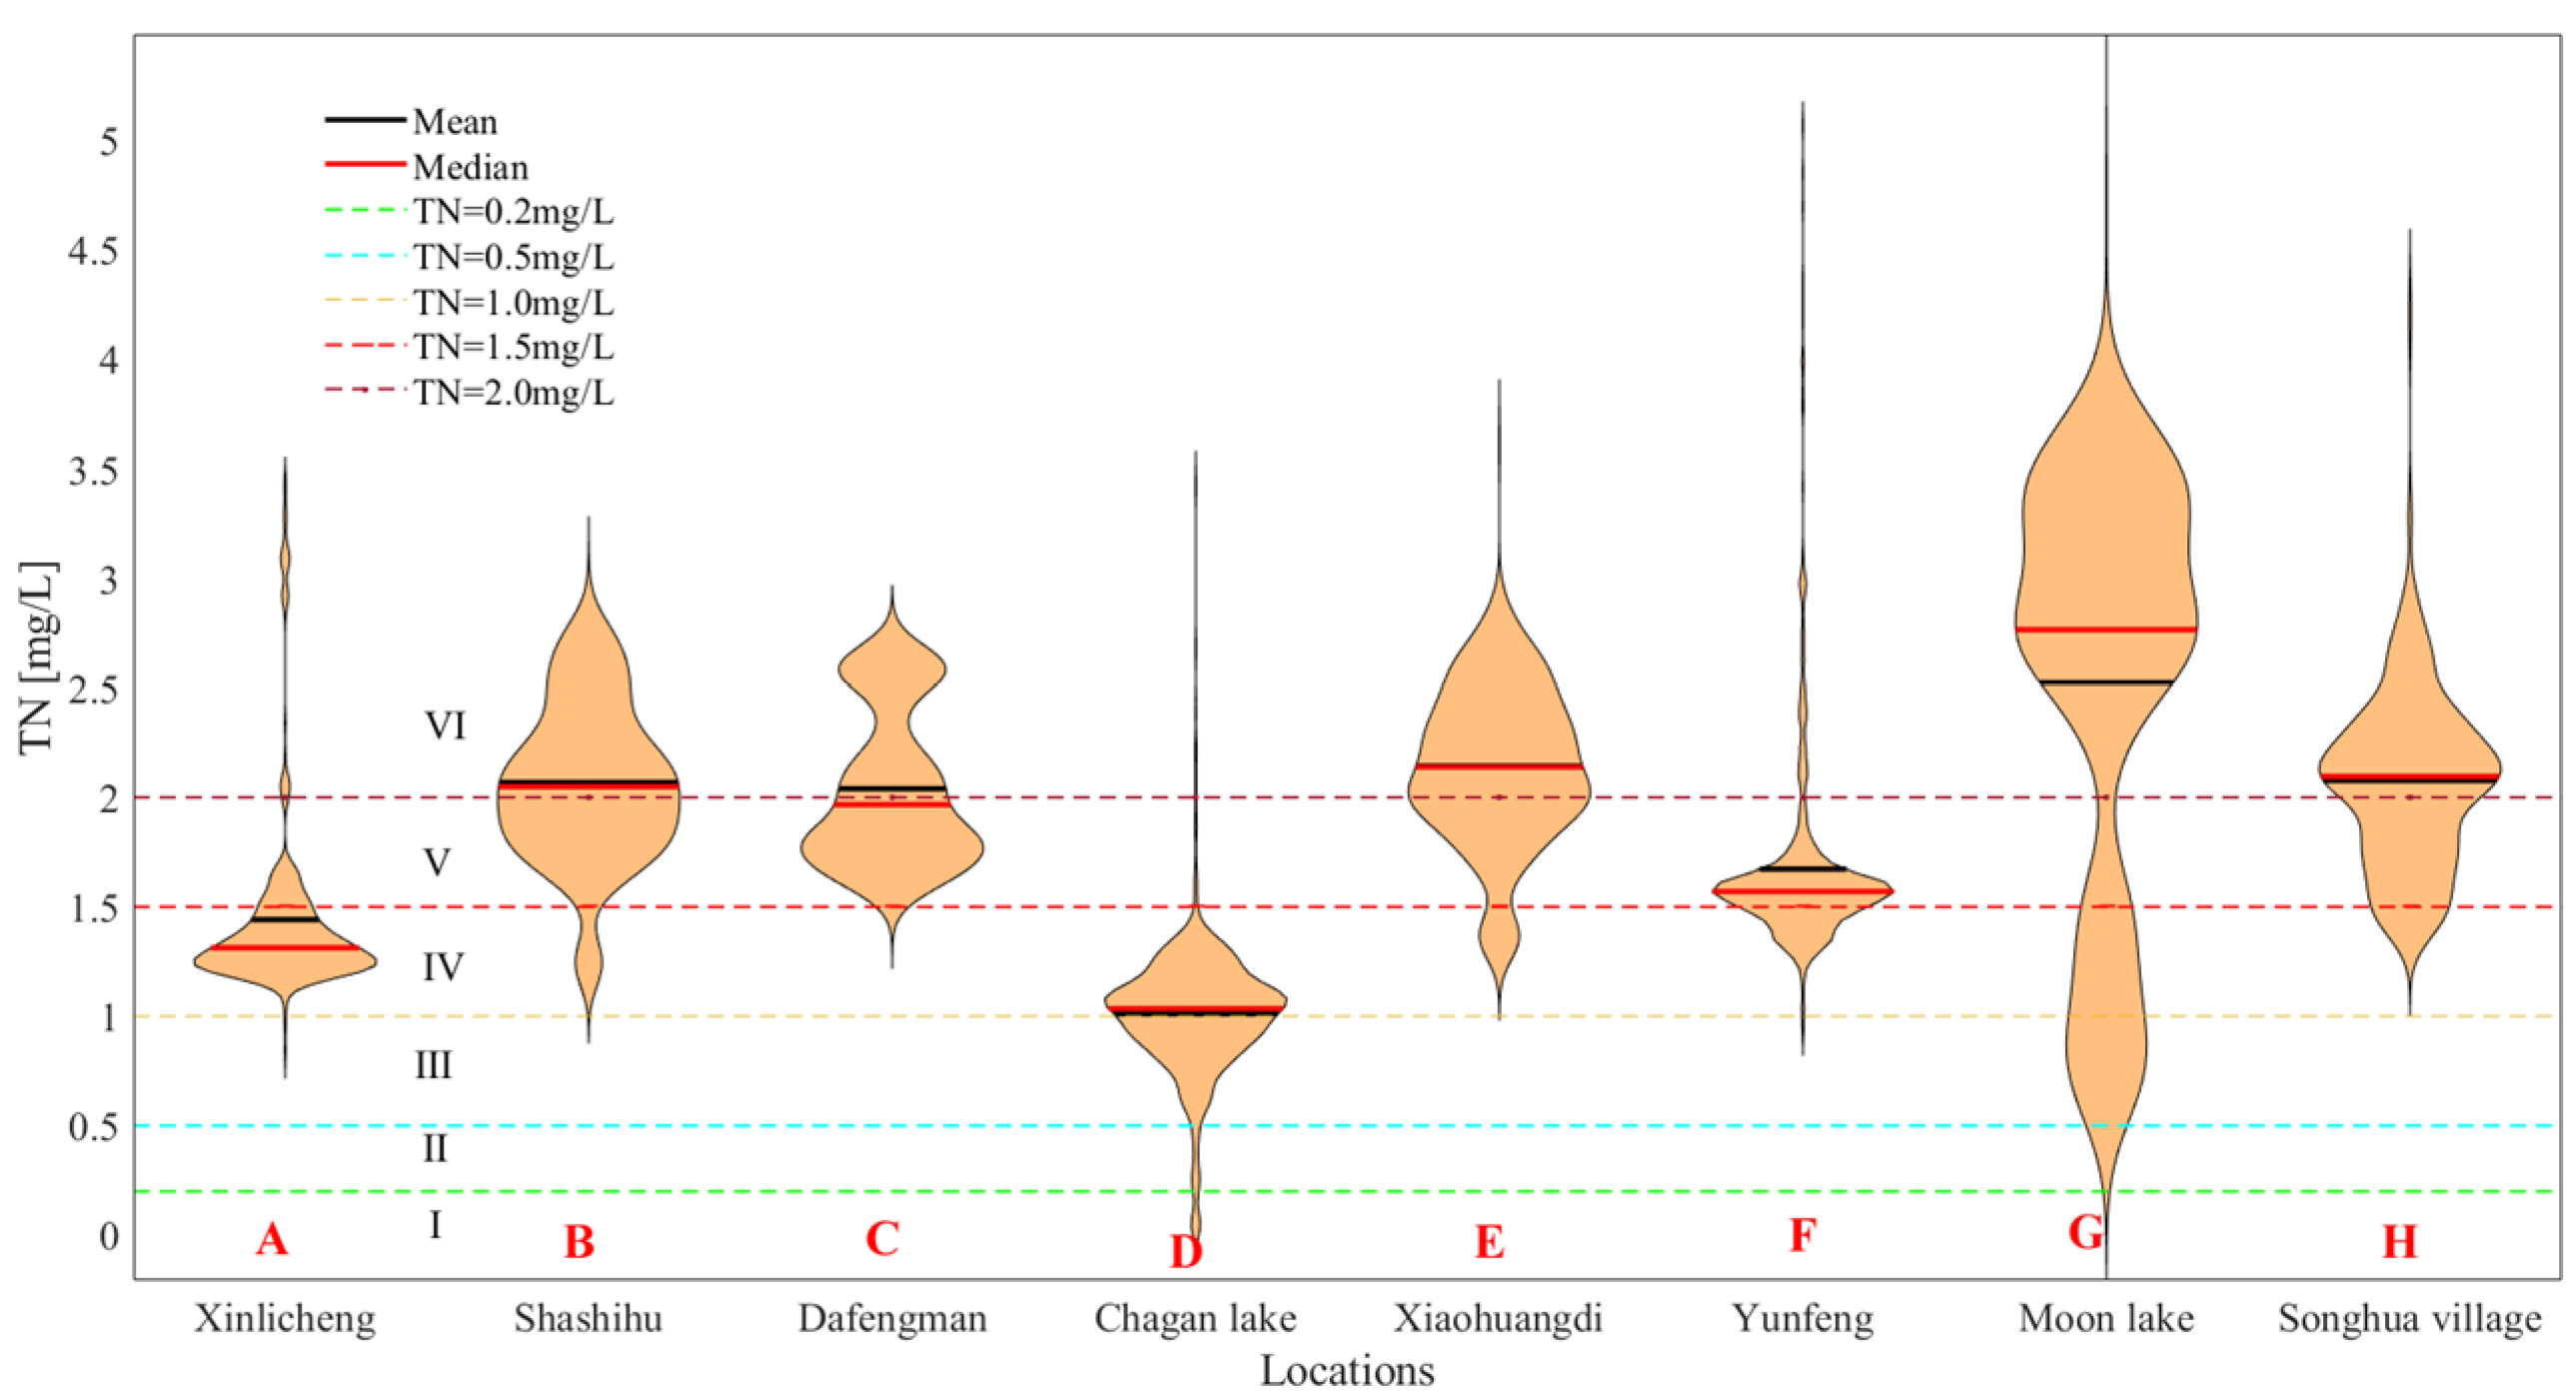
The study area includes the Songhua River and the Liao River. Through the analysis of the water quality using main monitoring points in the study area (
Figure 4), it is found that the TN exceeding the standard mainly occurs in the Liao River Basin in Jilin Province, showing a decreasing trend from west to east, and the maximum average value of TN can reach 6.0 mg/L. The water bodies with excessive TP mainly appear in the lower reaches of Liao River Basin and Songhua River Basin, and the highest average value of TP reaches 2.0 mg/L. DO value shows a decreasing trend from southeast to northwest, and the average value of it in this region ranges from 8.0 to 11.0 mg/L. Therefore, the DO value in the water body in this region is not the main cause of water pollution. However, in some periods, the DO value in the water body is lower than 2.0 mg/L, which needs special attention. The sources of TN and TP in the study area mainly include the metabolism of self-organisms, the discharge of industrial wastewater and domestic sewage, and the runoff of nitrogen and phosphorus in farmland.
To monitor water parameters in a large-scale area, the band that responded sensitively to the water quality parameters in the study area is determined first.
Table 2 shows that bands 4 (red) and 5 (near-infrared) are correlated with TP, and bands 5 and 6 (short-wave infrared) are correlated with TN, while all bands are weakly correlated with DO. Therefore, the single band has low correlation with the water quality parameters in the study area. The correlation between DO, TN, and TP was significant for the waterbody of the study area. This shows that when water pollution occurs, the increase of TN and TP will lead to eutrophication of the water body, thus leading to the decrease of DO in the water body.
Next, the optimal combination of sensitive bands according to specific water quality parameters is determined. To enhance the difference, the traditional band ratio is used as the band combination method. After the combination of each band, the coefficients with high correlation values are sorted (
p < 0.05), and the optimal band combinations of water quality parameters suitable for the study area are obtained (
Table 3). The band ratio B4/B2 is the most sensitive to DO and TN, while the band ratio B4/B1 is the most sensitive to TP. For single band, Band 5 is the most sensitive to land surface temperature, whereas band 4 is affected by Chl-
a in the water body. This also illustrates that the DO concentration is closely related to the temperature and Chl-
a concentration. Band 6 is sensitive to organic matter in the water body, while band 1 is sensitive to Chl-
a; hence, both reflected the degree of eutrophication. Band 2 can penetrate a water body. Eutrophication affects water quality and reduces transparency, making it difficult for sunlight to penetrate a water body. This illustrates that the change of spectral reflectance in these bands is related to the content of TN and TP in water body.
Based on the field-measured water quality parameters and remote sensing data during 2020–2021, three GPR models (TP, TN, and DO) are established for water quality monitoring. The key parameters of these models are listed in
Table 4, and their prediction performances are shown in
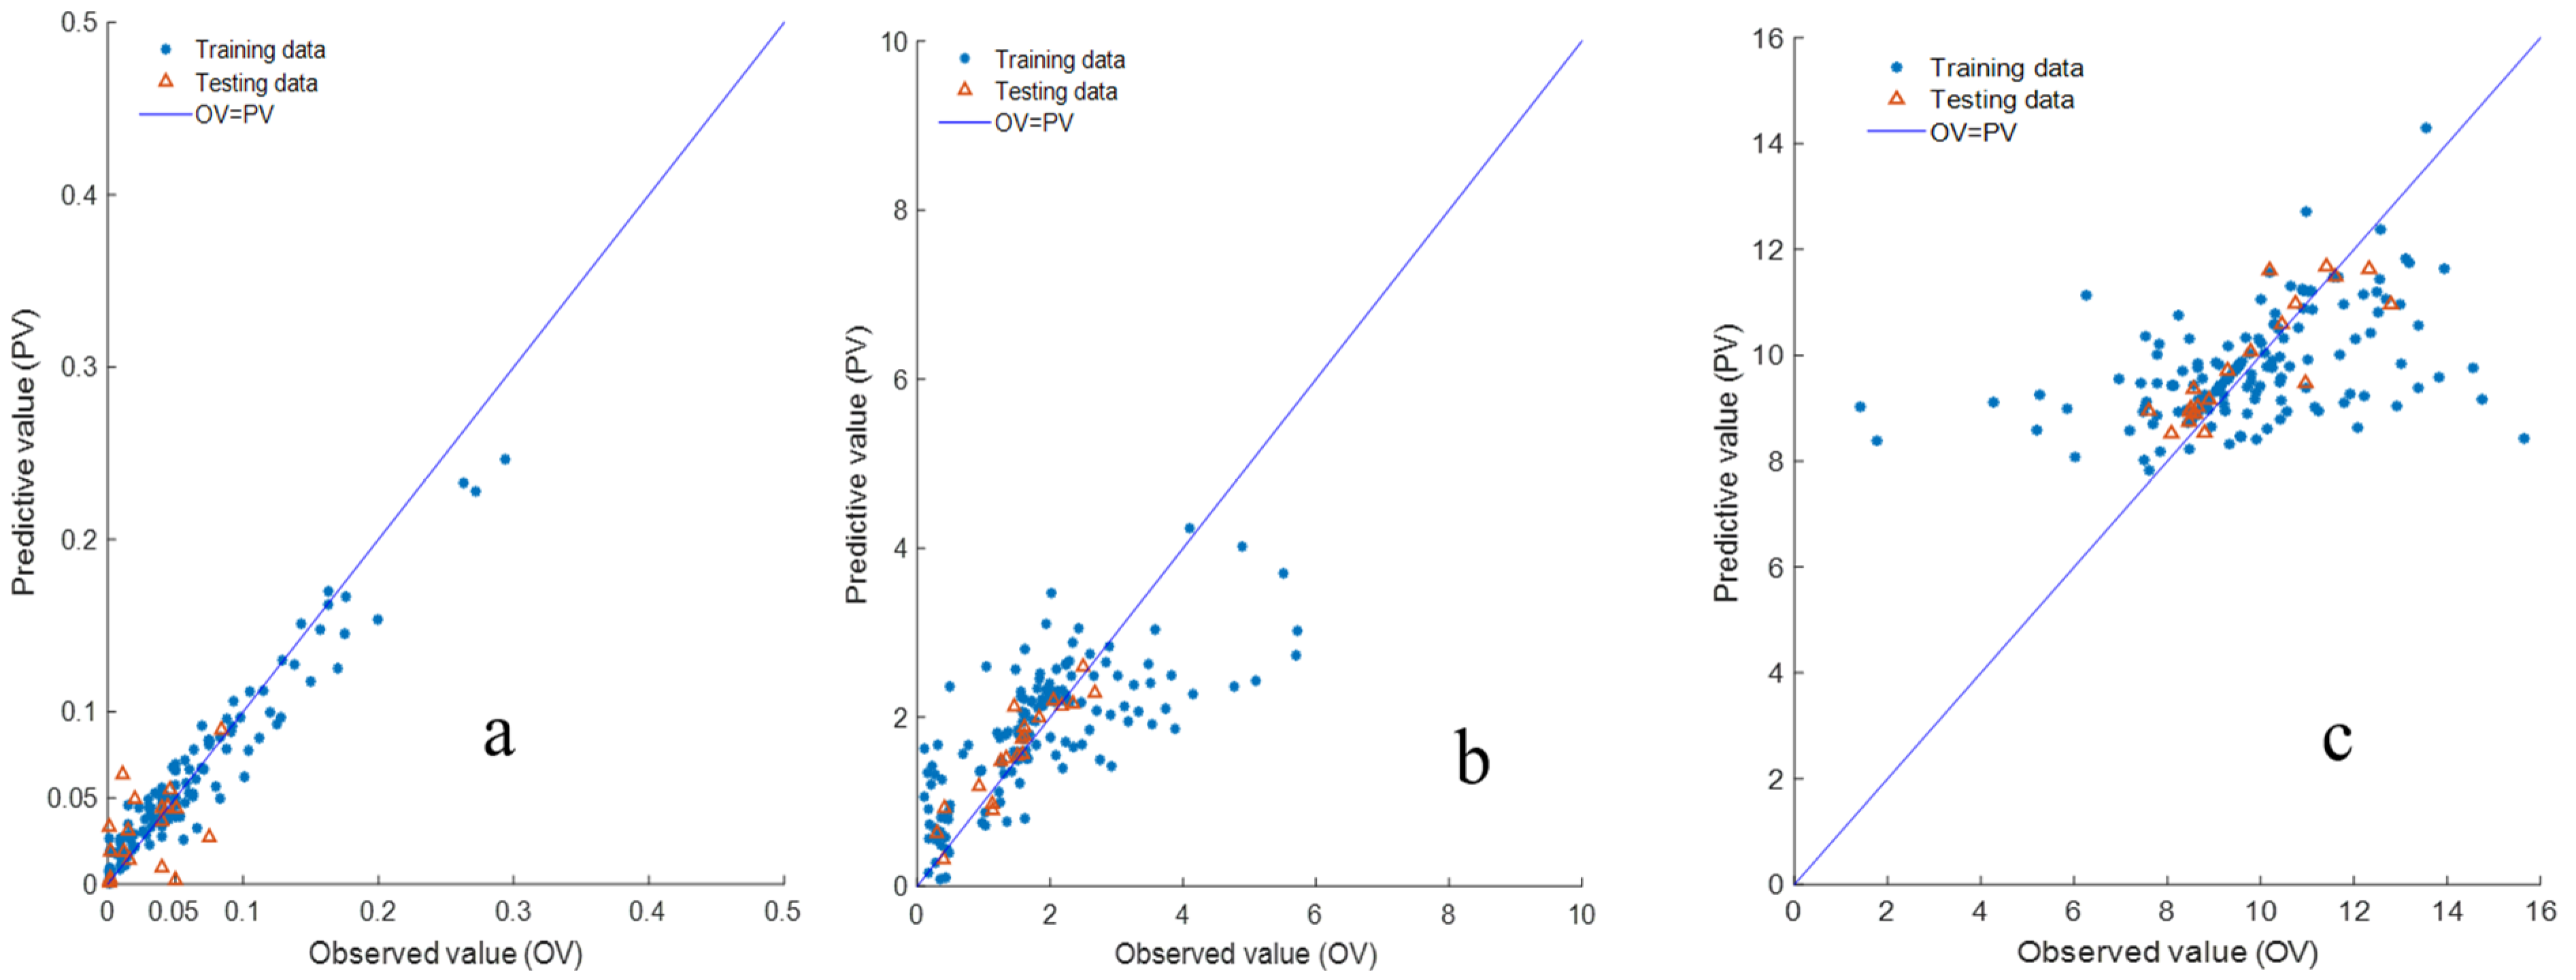
Figure 5. In this study, 140 samples are used to build the model and 19 samples are used to verify the model (i.e., 159 samples in total after data processing).
Based on the Pearson’s correlation results, three band combinations with significant correlations (r > 0.30,
p < 0.01) are selected to analyze the DO concentration. The Box–Cox transform coefficient of DO is 1.23. In this study, principal component analysis (PCA) is used to combine these sensitive band ratios.
Table 5 shows the first three principal components of water quality parameters. The PCs coefficients represent the eigenvectors of the covariance matrix of variables (sensitive band ratios).
Table 5 shows that the contribution rates of the first three principal components (PCs) are 85.66%, 13.27%, and 0.81%, respectively. Therefore, these PCs are used as factors of the GPR to analyze the DO concentration of the waterbody. From the measured data, the DO concentration in the study area ranges from 1.4 mg/L to 15.0 mg/L (mean of 8.9 mg/L). The DO concentration in the waterbody meets the national surface water quality standards (
Table 2). Based on the GPR model, the DO concentration is calculated (
Figure 5a).
Figure 5a reveals the good consistency between the observed and predicted values. The root mean square error (RMSE) of the DO model is 1.2768, the correlation between the observed and predicted data is 0.8457 (
p < 0.01), and the mean absolute percentage error (MAPE) is 16.58%, indicating that the DO model has a good ability to predict dissolved oxygen.
Based on the Pearson’s correlation results, six band combinations with significant correlations (r > 0.30,
p < 0.01) are selected to analyze the TN concentration. The Box–Cox transform coefficient of TN is 0.32. As for DO, PCA is used to combine the three sensitive bands ratios. The contribution rates of the first three PCs were 85.71%, 9.75%, and 2.02%, respectively (
Table 5). Hence, these PCs are used as factors of the GPR to analyze the TN concentration of the waterbody. From the field-measured data, the TN concentration in the study area range from 0.23 mg/L to 5.72 mg/L (mean of 2.18 mg/L). It is found that the TN concentration of 14.4% water samples is lower than 0.5 mg/L, 37.1% water samples recorded lower than 1.0 mg/L, and 28.9% samples recorded higher than 2.0 mg/L. According to the national surface water quality standard for TN (
Table 1), the waterbody belonged to class III during the study period. Based on the GPR model, the TN concentration is calculated (
Figure 5b). As shown in
Figure 5b, the total RMSE of the TN model is 1.1013, and the correlation between the observed data and the predicted data is 0.6318 (
p < 0.01) (
Figure 5b). This shows that that this model has an ordinary ability to predict TN.
Based on the Pearson’s correlation results, six band combinations with significant correlations (r > 0.30,
p < 0.01) are selected to analyze the TP concentration. The Box–Cox transform coefficient of TP is 0.16. As for DO and TN, PCA is used to combine the six sensitive bands ratios. The contribution rates of the first three PCs were 79.76%, 16.18%, and 2.72%, respectively (
Table 5). Therefore, these PCs are used as factors of the GPR to analyze the TP concentration of the waterbody. From the field-measured data, the TP concentration range from 0.01 mg/L to 1.60 mg/L in the study area (mean of 0.07 mg/L). It is found that TP concentration of 58.7% samples lower than 0.1 mg/L, while its 33.0% samples is between 0.1 and 0.3 mg/L. According to the national surface water quality standard for TP (
Table 1), the waterbody belonged to class III during the study period. Based on the GPR model, the TP concentration is calculated and showed in
Figure 5. As shown in
Figure 5c, the total RMSE of the TP model is 0.0098, the correlation between the observed data and the predicted data is 0.9824 (
p < 0.01), and the MAPE is 16.95%. This shows that the model is high credibility.
By transforming the training sample size and performing 5000 repeat simulations, as well as comparing the monitoring performance of three key water quality indicators using Landsat OLI 8 remote sensing images, it is found that the Gaussian process method can be well used for the remote sensing monitoring and analysis of water quality indicators. According to the national surface water quality standard (
Table 1), the prediction results of this TP model are converted into water quality grades, and the prediction results of water quality grades are analyzed (
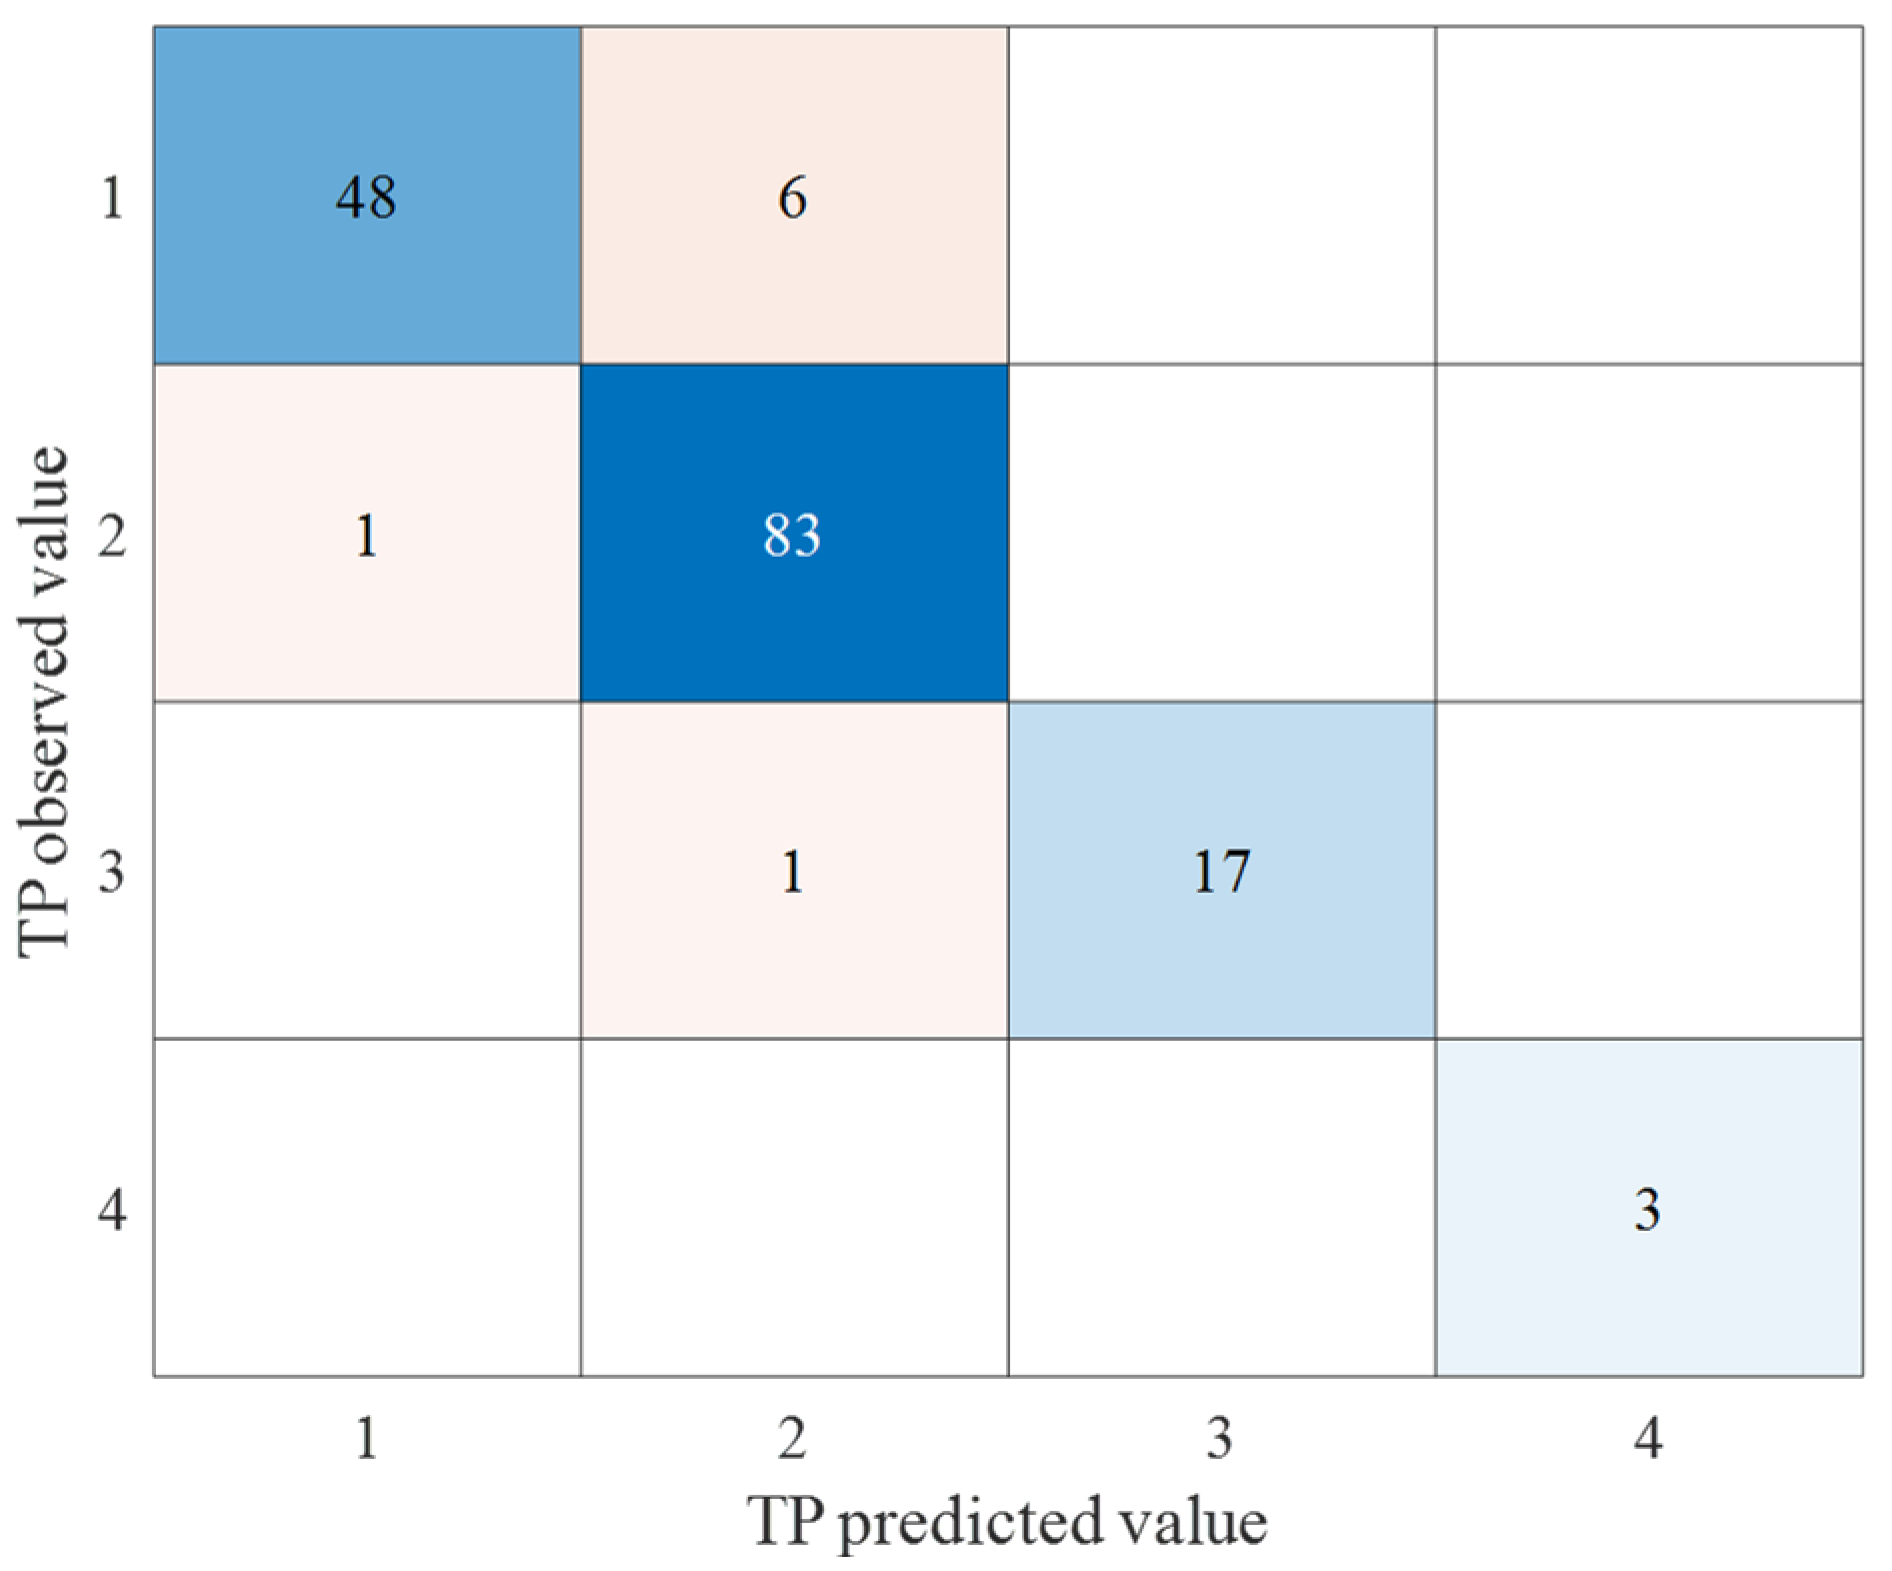
Figure 6).
Through the analysis of the water quality parameter DO, it is found that the DO grade in this area mainly belongs to grade Ⅰ and Ⅱ. The prediction result of grade Ⅰ is good (85.53%), but the prediction accuracy becomes worse when the water quality with poor DO grade in the surface water. Through the analysis of water quality grade of TN and TP, it is found that the prediction accuracy of water quality grade of TP is good, with an accuracy rate of 94.97%, while the prediction accuracy rate of TN grade could reach to 70.51%. The comparison of the results of the three indicators shows that the order of the three indicators is TP > TN > DO. Through the error analysis of TN and DO, it is found that 93.0% of error samples occur when TP < 0.1 mg/L in the waterbody. TP is a key and necessary indicator for surface water quality monitoring, which can indicate water eutrophication and water pollution. Therefore, this method can be used for large-scale water quality change and deterioration in this area.
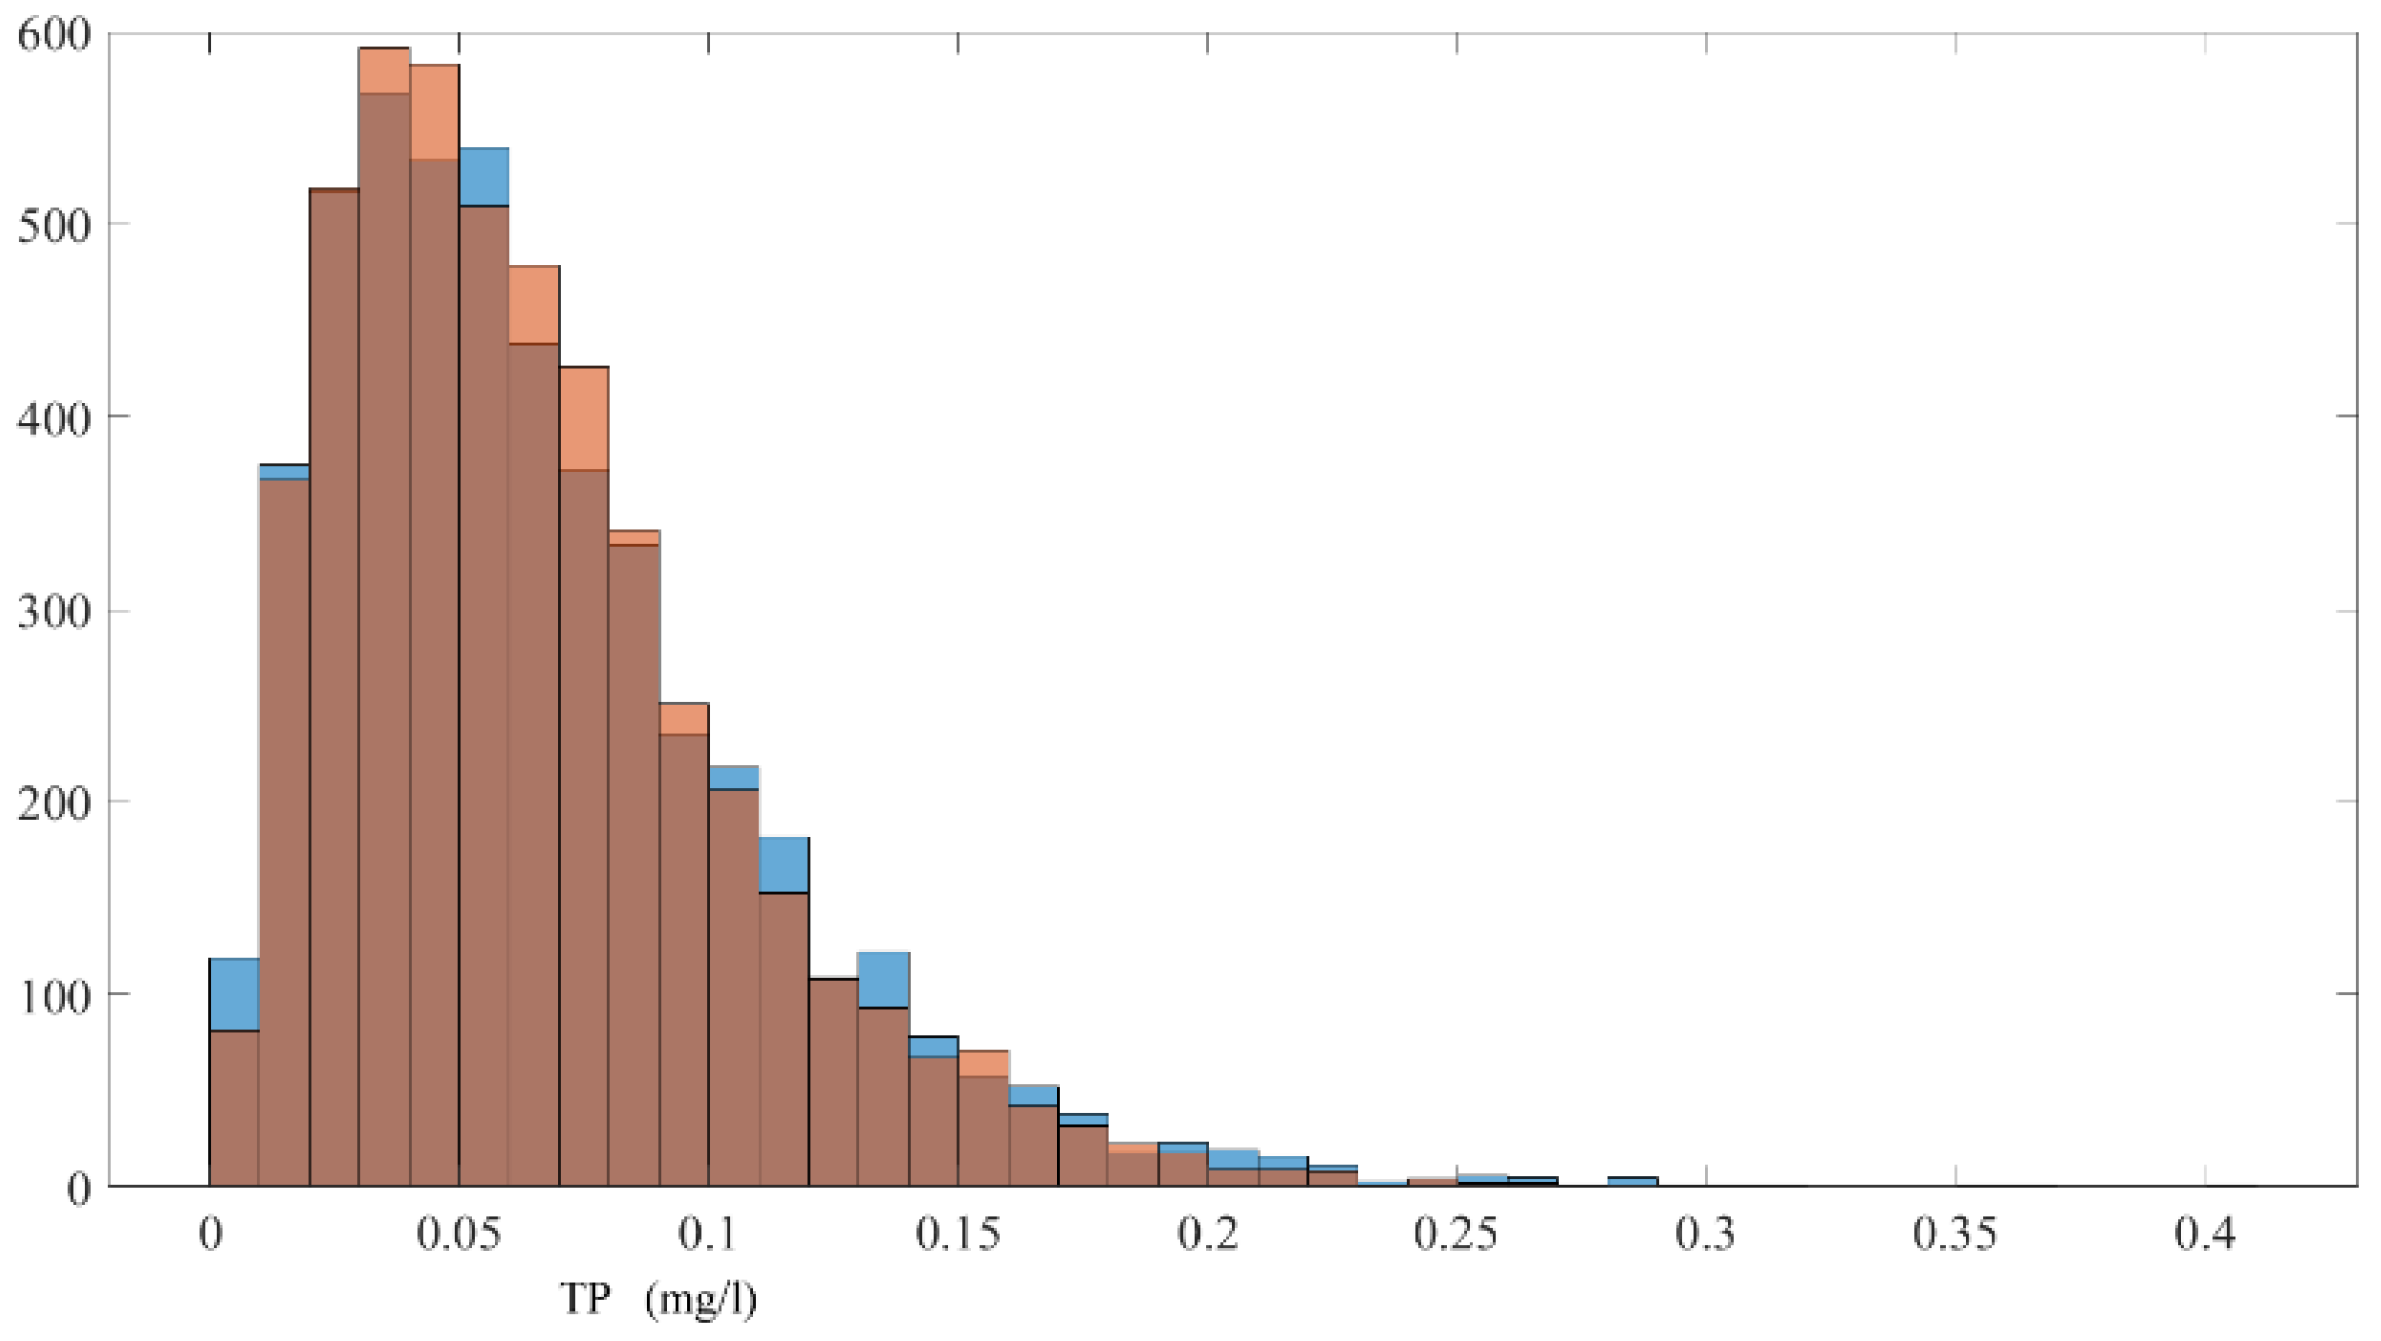
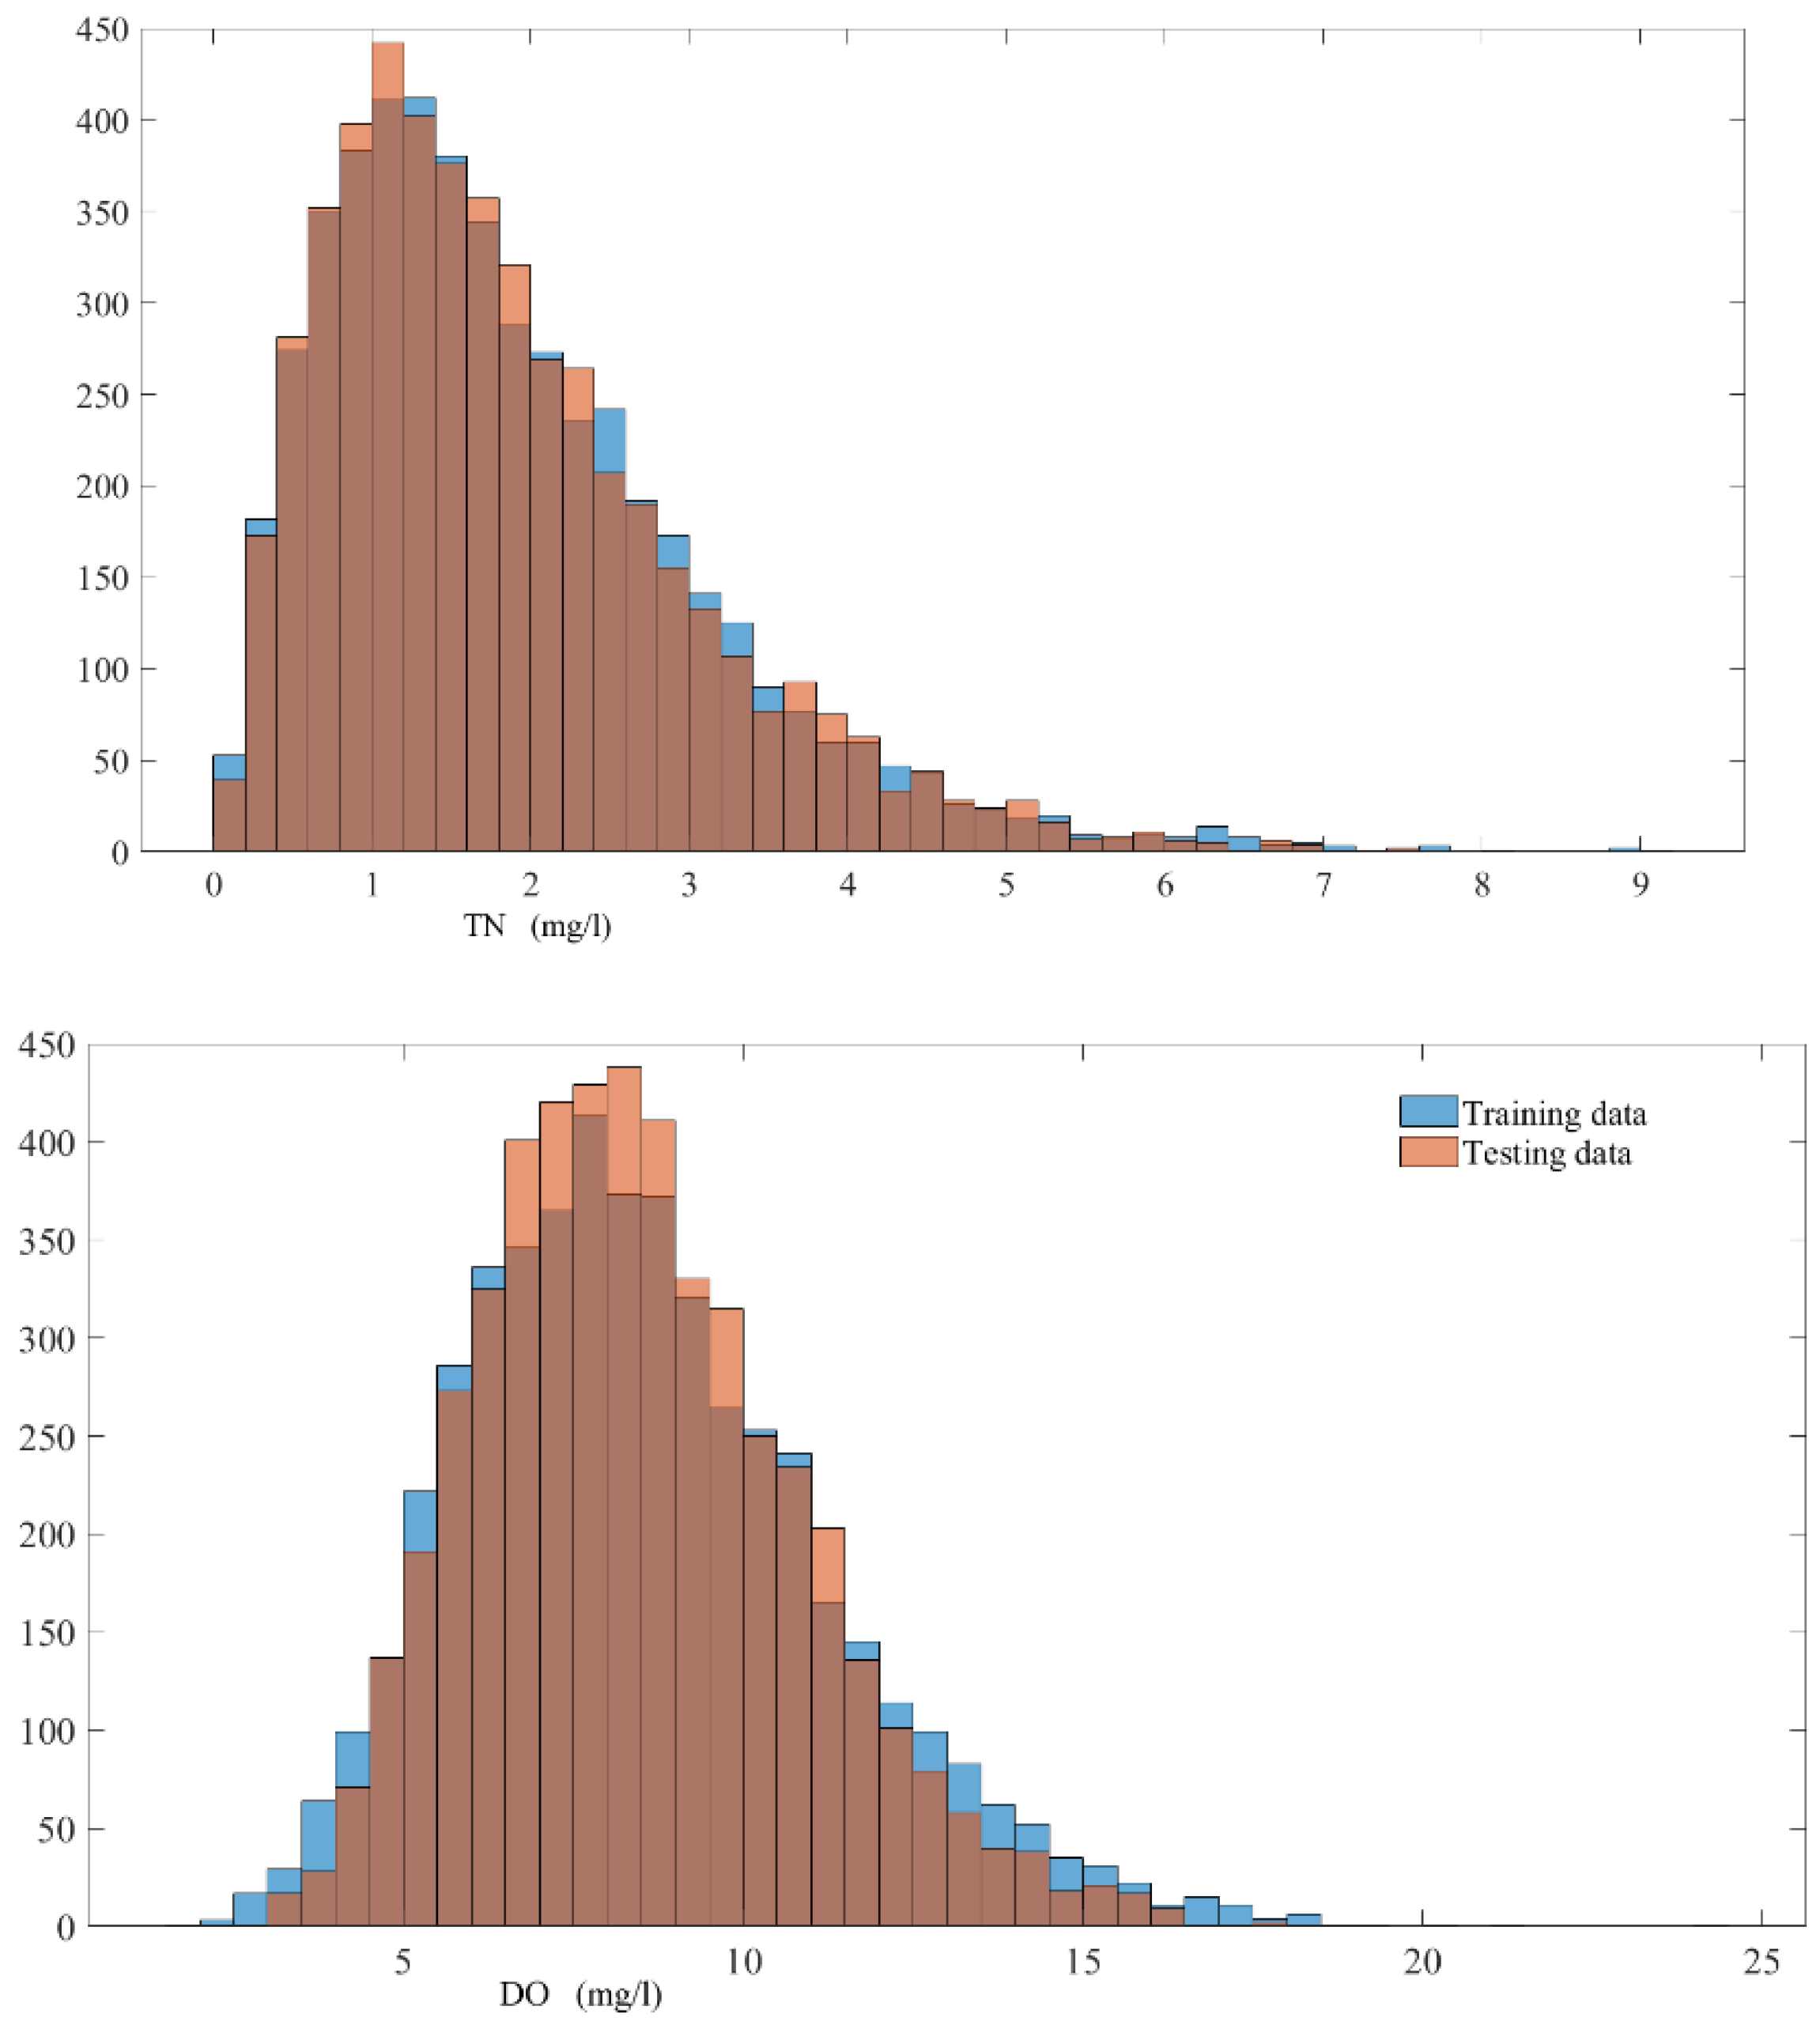
In this study, the reliability of three water quality parameter models is analyzed using PSI and the Monte Carlo method. The Monte Carlo method is used to simulate the real data and prediction results, and PSI is calculated from grouping calculation. The results shows that the value of PSI for TN, TP, and DO are 0.0854, 0.0470, and 0.1969, respectively (
Figure 7). This shows that the water quality parameter models for TP and TN proposed in this study have good stability (PSI < 0.1), and the water quality parameter models for DO need to be improved in the further study.
4. Discussion
In this study, based on the GPR model, three water quality parameters (DO, TN, and TP) were established and compared using Landsat 8 OLI image data and field measurement data. In terms of data processing, to obtain the true surface reflectance and ensure the wide application of the model, radiometric and atmospheric corrected data were collected using GEE. In the selection of remote sensing images, frozen water bodies and cloudy images should be eliminated. The monitoring accuracy can be improved by normalizing the principal component indexes. This data process method reduces the data dimension and avoids over fitting in prediction.
In terms of band selection, Pearson’s correlation analysis was used to analyze the band combinations that were sensitive to DO, TN, and TP. Then, multiple optimal band combinations were obtained for the analysis of these water quality parameters. An attempt was made to use a combination of a single sensitive band and multiple optimal band combinations to obtain water quality parameters. The accuracy of the results did not increase when a single sensitive optimal band was introduced into the models, and increasing the number of band combinations had little effect on the results. However, the accuracy would have reduced if the number of optimal band combinations had been reduced (e.g., 1–2 optimal band combinations).
Using Pearson’s correlation analysis, the multiple optimal combinations for water quality parameters (DO, TN, and TP) were determined. PCA is an important step in this study. As multiple band ratios may be filtered when using Pearson correlation analysis, PCA was used to reduce the dimensions of these optimal band combinations and obtain key information of all indicators. In
Table 5, the coefficients of first three PCs divide the water quality parameter information into three dimensions (direction), which greatly reduces the redundant information between multiple band ratios. Hence, the main information of these optimal band combinations was obtained, and the problem was simplified. The Box–Cox processing method makes the data present a normal distribution, which is very useful for improving the results.
Compared with traditional popular methods, GPR has powerful regression performance and high interpretability. This study established the water parameters using the traditional popular algorithms, i.e., support vector machine (SVM) and back propagation (BP). The predicted results show that three water quality parameters obtained by GPR model are better than SVM and BP (
Table 6).
In this study, all data were simulated 5000 times by changing the training and test samples, it is found that the model has strong stability. The simulation results demonstrated that the GPR models were robust and very reliable for the three water quality parameters. From the sensitivity analysis of the error results, it is found that the estimation results of the TP model is better than those of the TN and DO models, and that the three models satisfy the requirements of water quality monitoring. It should be pointed out that when the model is applied to inland water bodies in other basins, the reflectance of polluted water bodies will be different due to the sky background, so the model parameters need to be retrained and corrected.
5. Conclusions
Due to the influence of background noise, image resolution, and human activities, the acquisition of water quality parameters in inland water based on remote sensing is full of challenges. To obtain the true surface reflectance and ensure the wide application of the model, radiometric and fast atmospheric corrections were applied to Landsat images in this study. Based on previous studies on band selection [
29], the band ratios were selected as the identification index in this study. This method can also enhance the spectral difference between various water bodies and reduce the impact of environmental noise. Multiple optimal band combinations were selected by analyzing the correlations between the field-measured data and band ratios based on Pearson’s correlation analysis. Then, PCA was applied to these band combinations, and the first three PCs of the optimal combinations were selected to analyze the three water quality parameters. The GPR model was used to analyze the multiple optimal band combinations and was combined with the field-measured water quality data to estimate the water quality parameters.
Through Pearson correlation analysis with the field measured water body, the results showed that the monitoring effect of band ratio combination on water parameters is better than that of band ratio and single band. As the increase of TP and TN in the water body will lead to changes in indicators, such as turbidity and Chl-a, it is feasible to obtain these water parameters by remote sensing. The band ratio B4/B2 is the most sensitive to DO and TN, while the band ratio B4/B1 is the most sensitive to TP. Finally, the multiple optimal band combinations were used to estimate the DO, TN, and TP concentration based on correlation analysis.
In this study, the model for TP showed good performance. The Pearson’s correlation coefficient between the observed data and the predicted data exceeded 0.9824 (p < 0.01), and the RMSEs of the model satisfied the requirements of water quality monitoring, indicating the high credibility of TP model. Compared with SVM and BP, this model could obtain more stable and accurate results by using small samples. The method and results of this study could provide a scientific basis for water quality monitoring and water environment management in the Songhua and Liao River basin. By transforming the training sample size and performing 5000 repeat simulations, the order of prediction accuracy of the three models is TP > TN > DO. Although the monitoring accuracy of TN and DO is not as good as the accuracies of TP, they could still indicate significant water pollution. These findings are of great significance for decision-making with respect to eutrophication monitoring and water risk management in the Songhua and Liao River basin, and can also be used as a reference for other basins.


 ,
, 
