
Variations in the Equatorial Ionospheric F Region Current during the 2022 Tonga Volcanic Eruption

Department of Space Physics, School of Electronic Information, Wuhan University, Wuhan 430072, China
*
Author to whom correspondence should be addressed.
Remote Sens. 2022, 14(24), 6241; https://doi.org/10.3390/rs14246241
Submission received: 9 November 2022
/
Revised: 6 December 2022
/
Accepted: 7 December 2022
/
Published: 9 December 2022
(This article belongs to the Special Issue Applications of Remote Sensing in Monitoring Ionospheric Physics and Ionospheric Weather Forecasting)
Abstract
:In this work, the temporal variations in the ionospheric F region current (FRC) during the 2022 volcanic eruption in Tonga are reported for the first time. The FRC increased and underwent several polarity reversals following the eruption, as observed by the dual Swarm satellites. By combining neutral wind observations derived from the Ionospheric Connection Explorer (ICON) satellite, we attempt to reveal the potential physical mechanisms responsible for these variations. The ICON and Swarm satellites were located at almost the same distance from the epicenter of the volcanic wave, thus providing a good opportunity for analyzing coordinated observations. The F-layer neutral wind data reflect eastward and westward fluctuations that are basically consistent with the polarity reversals identified in the FRC. The E-layer neutral wind also exhibits polarity reversals that affect the equatorial ionosphere electron density anomaly. These results show that the atmospheric fluctuations caused by the analyzed volcanic eruption affected the wind pattern distribution in the E-F region, thus further affecting the spatial distribution of the FRC and electron density in the F layer.

1. Introduction
There was an intense volcanic eruption event that occurred in Tonga on 15 January 2022 (20.54°S, 175.38°W). According to some data, this huge volcanic eruption released energy equivalent to 200 megatons of TNT and created strong tsunami waves [1]. It was the most powerful volcanic explosion in more than 30 years. Recently, a number of studies have reported the impacts of volcanic eruption-related waves on the equatorial electrojet and total electron content; these impacts are all related to changes in the E-region dynamo wind (below 150 km) [2,3,4,5]. The disturbed F region neutral zonal wind (above 400 km) during the volcanic eruption might modulate the ionospheric radial current [6], termed as F region current (FRC) in the present work. However, there is still a lack of work on the changes of ionospheric F region current in response to the volcanic eruption.
Ionospheric currents play important roles in the energy transfer process in the geo-space system, which could damage electrical power grids. The neutral wind is oriented westward in the daytime while directed eastward in the nighttime around the magnetic equator. As a consequence, the daytime wind dynamo electric field is directed downward, while the nighttime dynamo electric field is directed upward. This is opposite to the orientation of the zonal plasma drift electric field. Both electric fields contribute to the development of ionospheric F region current at the dip equator. The equatorial FRC can be expressed as σp(Ez − UyBx) [6], where σp is the Pedersen conductivity in the F region, Uy is the magnetic zonal wind in the F region (positive value means eastward direction), Bx is the geomagnetic field in the northward direction, and Ez represents the contribution of zonal plasma drift in the F region (positive value means downward direction). The first term, σpEz, represents the effect from polarization electric field, and the second term, σpUyBx, is the wind dynamo current. The relative contributions of these two electric fields to the F-layer FRC were comprehensively studied and it showed that the radial current (i.e., FRC) was mainly controlled by the neutral wind dynamo electric field [7]. Using observations from Challenging Minisatellite Payload (CHAMP) satellite, Lühr and Maus (2006) [8] showed that the F-layer dynamo current around the magnetic equator was driven by the thermospheric wind.
The FRC exhibits obvious variations with geographical longitude (GLon) [9]. Using CHAMP observations, Park et al. (2010) [10] revealed that at the equinox and June solstice, the daytime FRC exhibited a wave-4 longitudinal structure that was not prominent in December solstice. The wave-4 longitudinal structure of duskside FRC was much reduced in all seasons, which was attributed to the reduced E-F layer coupling efficiency. Using observations from the Swarm satellites, Lühr et al. (2019) [11] further revealed that the FRC had an obvious hemispheric asymmetry between the eastern and western hemispheres. The western-hemispheric daytime FRC was generally weaker than that of the eastern hemisphere, whereas the situation was reversed at night. The authors deduced that the mean altitude of the dynamo region was higher in the evening than around noon. Wang et al. (2022) [12] showed that the low atmospheric migrating tides could also contribute to the eastern-western hemispheric asymmetry of the daytime FRC by using thermosphere-ionosphere electrolytic general circulation model (TIE-GCM) simulations. Wang et al. (2022) [13] investigated the FRC under different magnetic strengths and solar activities by using CHAMP observations and TIE-GCM simulations. They found that the daytime and nighttime FRCs increased significantly with decreasing magnetic strengths and increasing solar activities due to the ionospheric conductivity increasing in response to these changes. These results were consistent with previous observations, in which the F-region dynamo current was found to decrease with decreasing solar activity [14]. The FRC was diverted along the magnetic field line into the E region in both hemispheres, thus forming meridional current systems at noon and dusk. The dusktime meridional current was caused by the equatorial F-layer dynamo based on Magnetic Field Satellite (Magsat) observations [9].
These previous studies have provided interesting information that has aided our understanding of the FRC. It is essential to understand whether volcanic eruptions can affect the ionospheric current system, however, there has been little observational evidence to directly reveal the impact of these geological disasters on FRC for a long time. In this work, by analyzing FRC observations derived from the dual Swarm A and C satellites, we display the evidence characterizing the FRC in relation to the intense volcanic eruption event that occurred in Tonga on 15 January 2022. The focus of the present work is mainly on the polarity reversal of the FRC in response to the occurrence of neutral wind changes in the F region (above 400 km), which can be affected by volcanic eruptions. To this end, we use combined observations derived from Swarm and Ionospheric Connection Explorer (ICON) satellites.
2. Satellite Data
The Swarm satellite constellation of the European Space Agency (ESA) was launched on 22 November 2013 into near polar orbits. Among three satellites, Swarm-A and Swarm-C fly side by side at altitudes of approximately 470 km, with a longitudinal separation of 1.4°, and Swarm-B flies at a higher altitude of 520 km. The method by which FRC estimations are obtained from dual-satellite observations is briefly introduced in the present work. Using the magnetic field observed by CHAMP, Ørsted and Satélite de Aplicaciones Científicas-C (SAC-C) magnetic satellite data version 6 (CHAOS-6) model, the magnetic field of the core, mantle, and disturbance fields were removed [15]. Using Ampere’s circuit law: , where is the vacuum permeability, is magnetic field caused by FRC, dl is the line element, and is the quadrilateral encircled by four observation points of Swarm-A and Swarm-C, the FRC can be calculated. The integration can be expressed as: , where Bx is along the satellite orbit, and By is from Swarm A to C in the horizontal plane, dl is the line elements. The subscript 1 (3) and 2 (4) means samples are taken separated by 5 s along the Swarm A (C) orbit. The assumptions are that the currents are constant over the period of 5 s, the time for taking the two samples B1 and B2 or B3 and B4, and the spatial size of the current is larger than the size of the quad. For mitigating the assumption, the magnetic field data have been low pass filtered with a period of 20 s in order to suppress the small-scale variations. For more details of the inversion method, please refer to Lühr et al. (2019) [11]. Magnetic coordinates were derived from the quasi-dipole latitude, as outlined by Richmond (1995) [16].
The ICON satellite flies in a low-inclination orbit (27°) at an azimuth of 575 km [17]. The Michelson Interferometer for Global High-Resolution Thermospheric Imaging (MIGHTI) onboard ICON measures thermospheric winds and temperatures. The 630-nm oxygen red-line observations are collected from altitudes of 160–300 km, while the green-line observations are collected from 90–200 km [18]. The MIGHTI winds cover GLats of −13° and 42° and all GLons within approximately 1.5 h.
3. Results
There was a geomagnetic storm occurring before the volcanic eruption. In order to distinguish the effects of magnetic storms, reconnection electric fields and volcanic eruption on FRC, we firstly show the time evolution of reconnection electric field and geomagnetic activity index. Figure 1 shows the temporal variation in the solar-wind merging electric field (Em) [19] and symmetric-H-component (SYM-H) index measured between 14 and 15 January 2022. The merging electric field is a geo-effective solar wind electric field parameter that can measure the input of solar wind energy to the magnetosphere. The main phase of the storm analyzed herein began at approximately 14:00 UT on 14 January, at which time Em gradually intensified. The SYM-H index fell to the minimum value of −100 nT at approximately 22:25 UT on 14 January; at this time, Em attained its peak value. During the storm recovery phase, Em fluctuated from 22:25 UT on 14 January until the end of the day on 15 January.
The Tonga volcanic eruption started around −20.54° GLat, −175.38° GLon at 04:15 UT on 15 January, as indicated by the vertical red dashed line in Figure 1. Approximately 8 h after the eruption, the Swarm satellites detected intermittent upward and downward FRC signals at the magnetic equator during the daytime (around 11 MLT), as indicated by the upward and downward arrows in the figure; these fluctuations are the main interest considered in the present work.
The top panel in Figure 2 shows the daytime (around 11 MLT) FRC distribution around the magnetic equator (±1° MLat) derived along 16 consecutive orbits on 15 January 2022. The FRC is normalized by the peak current density throughout the day (the maximum FRC is 258.2 nA/m2). The vertical dashed line indicates the zero current. The radially upward (positive) FRC shifts are shown to the right of the dashed line, while the radially downward (negative) current shifts are shown to the left. The figure shows that a large FRC occurred above the magnetic equator after 12:00 UT, reflecting several polarity reversals.
We averaged the FRC in each cross-equator orbit segment within ±1° MLat to represent the FRC in the magnetic-equator region. In order to separate the effects of magnetic storm and volcano eruption, the latitudinal averaged FRC on 13–15 January is shown together in the bottom panel of Figure 2 as a function of UT. In this figure, positive values denote the radially upward FRC, while negative value denotes the radially downward FRC. The red arrows and vertical dashed lines denote the radially upward FRC on 15 January 2022, while blue arrows and vertical dashed lines denote the radially downward FRC, following the same format as that used in Figure 1. The figure shows that strongly positive FRCs were identified at 12:36 UT and 15:30 UT, while strongly negative FRCs emerged at 14:06 UT and 17:12 UT. The FRC magnitudes in the subsequent orbits monitored after 12:36 UT were obviously larger than those measured before the volcanic eruption effect took place (at 04:15 UT) and propagated until daytime (approximately 11 MLT), approximately 10 h after the eruption.
The magnetic activity is generally quiet on 13 January (figure not shown). The magnetic storm started at 14:00 UT on 14 January, and Dst attained peak at 22:25 UT on 14 January. After that it was the storm recovery phase. It can be seen from the bottom panel of Figure 2 that the F region current in the daytime (around 11 MLT) was generally weak on 13 and 14 January (black and red curves, no more than 20 nA/m2). However, the FRC is greatly enhanced in amplitude during the eruption period (after 12 UT on 15 January 2022), which is much larger than that during quiet or during storm main phase periods. Thus, it seems that the intense FRC is related to the volcanic eruption rather than the magnetic storm. The merging electric field effect on FRC will be discussed in the discussion section.
4. Discussion
One of the possible reasons for the strong FRC density identified in this work might have been the F-region magnetic zonal winds. Note that we are using the magnetic zonal wind in the present work. Figure 3 shows the ICON tracks and altitudinal distribution of the MIGHTI wind observations obtained during four subsequent orbits from 11:30 to 17:30 UT. The Tonga volcanic eruption occurred around −20.54° GLat, −175.38° GLon at 04:15 UT. The estimated eruption wave-front location is shown in green curves. The ICON and Swarm orbit tracks are also shown on the map. Although the ICON satellite flies at a higher latitude than the Swarm satellites, both the ICON and Swarm satellites are located at nearly the same great-circle distances from the eruption center, that is, nearly 17,000 km in Figure 3a, 13–15,000 km in Figure 3b, 11–13,000 km in Figure 3c, and 9–11,000 km in Figure 3d (see the green curves in the figure). In addition, the altitude map of ICON-monitored winds covers the longitudinal coverages of the Swarm satellites in the daytime (around 12 MLT). ICON cannot measure neutral wind above 300 km altitude. However, the F region neutral wind pattern might not change too much between 300 and 400 km altitudes due to the air viscosity [13].
A strong eastward wind above 250 km altitude approaching −30° GLon around 11–12 MLT (Swarm A longitude) can be seen in Figure 3c, followed by a strong westward wind above 250 km altitude, as shown in Figure 3d. Another pair of strong westward and eastward F-region neutral winds above 250 km altitude can be found in the further-westward longitudinal zone shown in Figure 3d,g. Such a wave-like disturbance zonal wind structure might have been caused by the Lamb wave associated with the volcanic eruption [20]. As shown in Figure 3c,d,g,h the F-region neutral wind (above 250 km altitude) in the longitudinal zone of the Swarm constellation (shown with the vertical red or blue dashed line) changed polarity from eastward to westward, and vice versa, three times. This finding was consistent with the polarity change observed in the FRC by the Swarm satellites; i.e., the eastward wind induced an upward-oriented FRC, as indicated by the red dashed line and upward arrow, while the westward wind caused a downward-oriented FRC, as indicated by the blue dashed line and downward arrow. We conducted a cross-correlation analysis on the FRC densities recorded in these four orbits and the corresponding F-layer zonal wind velocities. It indicates that a good correlation was found between these two parameters (R = 0.997). The FRC tended to intensify with strengthened wind, further indicating that these two physical processes share a close internal relationship.
In addition to the F-region wind changes, the E-region wind at 100–150 km also shows polarity reversals, as Figure 3d,g reflect. Around 14:06 UT (Figure 3d), the zonal wind at Swarm A longitude (see vertical blue dashed line) was strongly westward at altitude below 120 km and eastward at 120–150 km. However, around 15:30 UT (Figure 3g), the zonal wind at Swarm A changed to be weakly eastward below 120 km and strongly westward at 120–150 km (see vertical red dashed line). Both the Hall region westward (eastward) wind below 120 km and the Pedersen region eastward (westward) wind above 120 km could contribute to the generation of the eastward (westward) electric field in the E layer [21]. These reversals induced an intense eastward electrojet around 14:06 UT and a subsequent intense westward counter-electrojet around 15:30 UT observed by Swarm, as was reported by, Harding et al. (2022) [3] and Le et al. (2022) [4].
When the E layer eastward electric field at 14:06 UT was projected onto the F layer along the magnetic line, it could drive the equatorial plasma vertically upward. Subsequently the plasma at higher altitudes diffused along the field line toward higher latitudes due to the pressure gradient and gravity forces. This could result in the well-known equatorial ionosphere anomaly (EIA), which is characterized by two electron density enhancement bands at higher magnetic latitude across the magnetic equator. On the contrary, when the E region westward electric field at 15:30 UT mapped into F-region, the plasma moved downward, preventing the EIA formation. For further verification of this speculation, Figure 4 shows the latitudinal variation of electron density between 12:00 and 16:00 UT observed by Swarm C at around 470 km altitude (blue curve, Swarm A has no data available). Compared with the previous orbit around 12:36 UT, the prominent EIA appeared on both sides of the magnetic equator around 14:06 UT due to the strong eastward dynamo electric field. Around 15:36 UT, the EIA disappeared due to the westward dynamo electric field. The Ne pattern during the eruption period is further compared with that of the quiet period on 13 January 2022. Figure 4 illustrates the latitudinal variation of Ne between 13:00 UT and 16:00 UT on 13 January 2022 (black curve). It can be seen that a more prominent EIA structure emerging around 14:00 UT on 15 January 2022 when compared to that on 13 January 2022. This indicates a stronger eastward electric field occurring on 15 January 2022 than that of the quiet day. In contrast, the Ne is generally weaker around 15:36 UT on 15 January 2022 than that of the quiet day, consistent with the changed dynamo electric field as outlined above. These new findings of E-F wind polarity switch and impact on the ionospheric current and electron density agree with the timing of the volcano-induced atmospheric Lamb waves as they swept across the American sector.
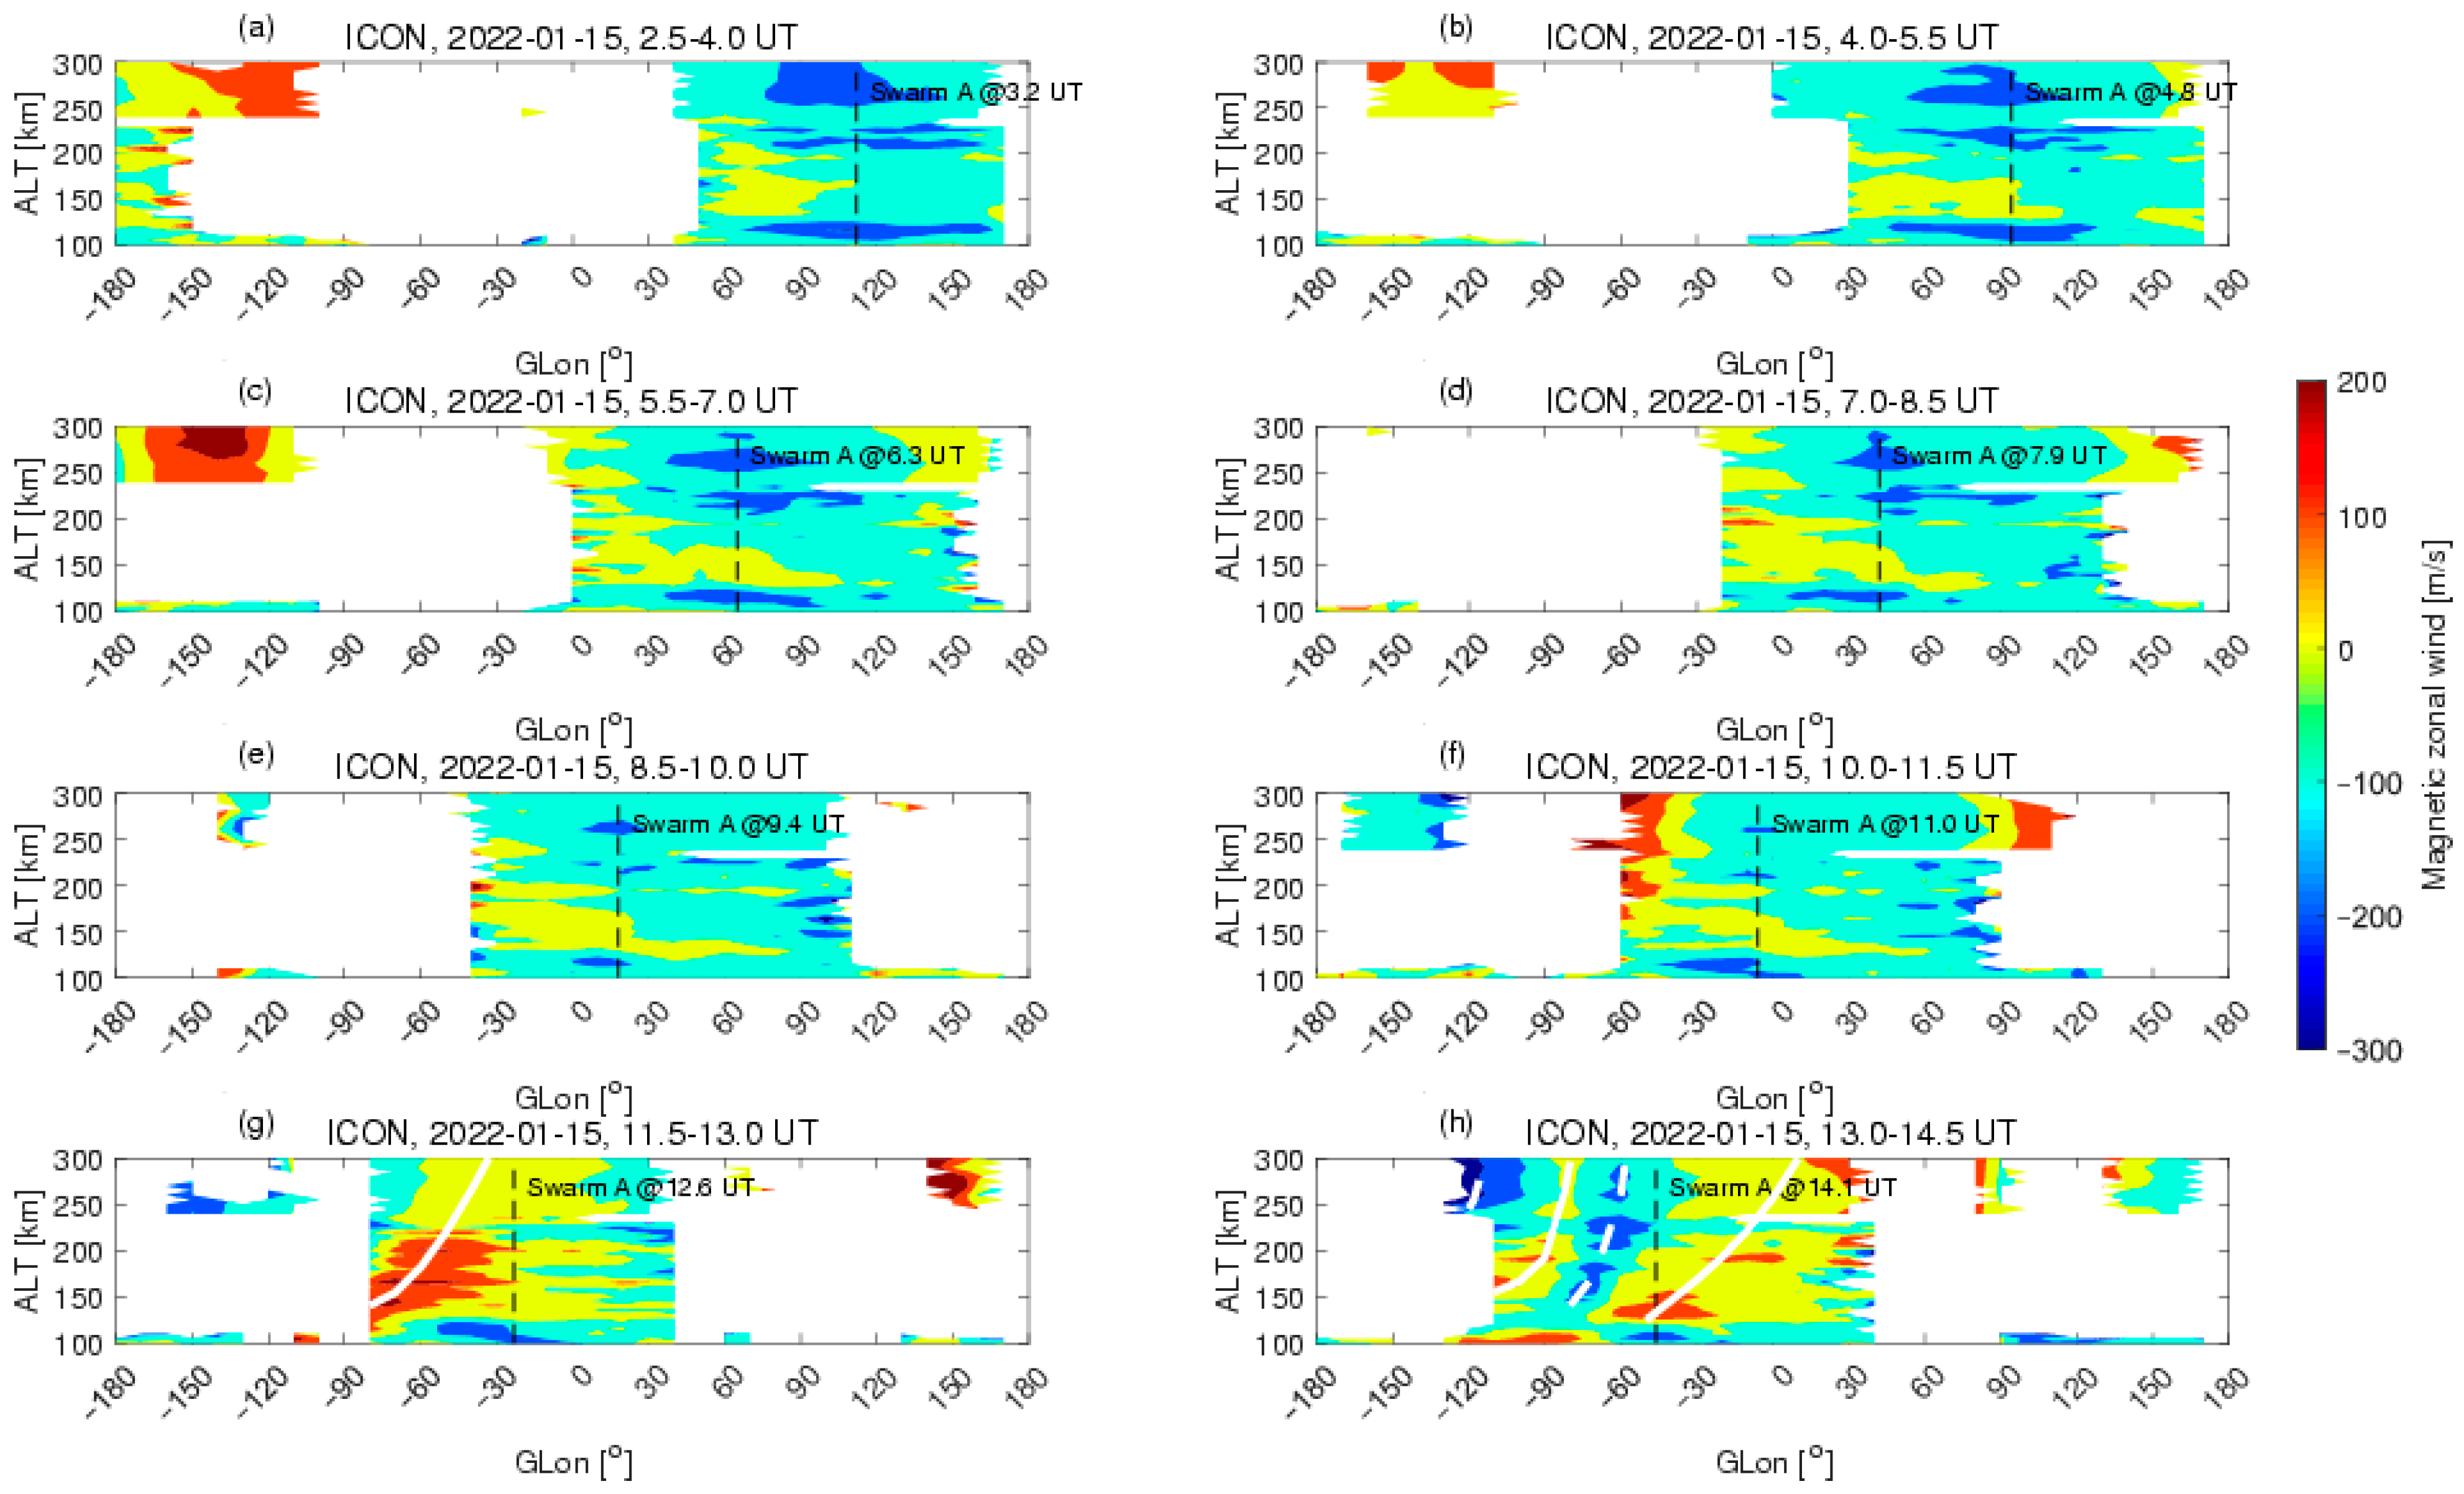
Because this event occurred during the storm-recovery phase, one might argue that the storm disturbance wind might affect the ionosphere current system. To check whether the zonal wind change is related to magnetic storm recovery phase or not, Figure 5 shows the longitudinal and altitudinal distribution of the magnetic zonal wind before and after the arrival of the volcanic eruption around Swarm longitudes. All subfigures are during storm recovery phase. It can be seen that after the arrival of the volcanic eruption at the Swarm longitude (panels g–h), the longitudinal distribution of the magnetic zonal wind at fixed height shows obvious peaks (eastward) and troughs (westward). The eastward or westward peak wind velocities at different altitudes are chosen to display the longitudinal wave structure, as indicated by white solid line or dashed line. But before the arrival of the volcanic eruption (panels a–f), no such longitudinal wave structure can be detected. The large-scale westward wind can be found within 60–120° GLon above 200 km altitude. Since panels a–h are during storm recovery phase, one can conclude that the obvious longitudinal wave structure in panels g and h might be related to the volcanic eruption, rather than to the recovery phase of the magnetic storm.
In addition, as simulated by Huang et al. (2005) [22] and explained by Harding et al. (2022) [3], magnetic storms mainly cause westward disturbance winds at middle and low latitudes in the nighttime. These westward disturbance winds differ from the polarity-switching characteristics of zonal winds in both the E and F regions (see Figure 3 and Figure 5g,h), as shown in the present work. Thus, we speculate that the volcanic eruption might generate atmospheric waves that propagate into the upper atmosphere and affect the F-region ionospheric current system.
As known to us all, the Lamb waves propagate in the sound speed of typically 300–350 m/s and are mostly confined to the troposphere. Owing to the decreasing density, the amplitudes of Lamb waves increase exponentially with height. Then, the energy of Lamb wave can leak into the upper atmosphere when their horizontal phase speed of ~300 m/s are resonant with the atmosphere [4,23]. Thus, one possibility is that the wave signals from the lower atmosphere might be transmitted to ionospheric F region heights through direct propagation of waves. Another possibility is that the E region or lower F region neutral wind is affected directly by the low atmosphere wave, and through the air viscosity process, the neutral wind in the top ionosphere can be affected. The Lamb wave during Tonga volcanic eruption in the ionosphere has been reported in a lot of studies [23,24,25,26,27]. For instance, Wright et al. (2022) [27] disclosed that the wave disturbances, in a speed close to sound wave, from surface to upper thermosphere can be observed by a comprehensive set of satellites. The Lamb waves in the ionosphere could drive the corresponding large-scale travelling ionospheric disturbances through ion-neutral collision [5]. The Lamb wave related to the volcanic eruption can cause TID in conjugate hemispheres [25,26].
Another factor that might affect the FRC densities analyzed herein is the prompt penetration electric field (PPEF). As shown in Figure 1, the merging electric field changed quickly at 14:00 UT, exhibiting a decrease of 4 mV/m; this change corresponded to the westward enhancement of the FRC. However, the westward enhancement of the FRC was most significant near 17:00 UT, but the corresponding merging electric field measured at this time was not as significantly variable as that measured at 14:00 UT. When examining the other UT periods, such as the 00:00 UT–04:00 UT period, Em also showed frequent transient variations, but the corresponding FRC changes were not as significant, indicating that the PPEF might not have been the dominant factor inducing the FRC polarity changes observed during this period.
5. Conclusions
Using the joint observations of the Swarm and ICON satellites, in this work, we report the drastic variations in the F-layer FRC almost 10 h following the 2022 Tonga volcanic eruption for the first time. The Swarm constellation observed that the radial current amplitude increased and its polarity reversed several times when the volcanic wave arrived. Using neutral wind observations obtained by the ICON satellite, the possible physical mechanisms responsible for these changes are disclosed in this work. Both the ICON and Swarm satellites were in nearly the same distance to the eruption, thus providing a good opportunity for analyzing coordinated observations. The F-layer neutral wind exhibited fluctuations in the eastward and westward directions; these fluctuations were basically consistent with the polarity variations in the FRC. Volcanic eruptions can trigger atmospheric gravity wave disturbances that can propagate upward, redistributing the E and F region wind pattern and inducing significant spatial variations in the FRC and electron density in F region. Since ionospheric current changes may damage electrical power grids, the results discussed above provide a novel perspective for understanding how the ionosphere is affected by natural disaster on the surface of the Earth and will eventually help us mitigate the impacts of these disasters on society.
Author Contributions
Investigation, H.X.; methodology, K.Z.; writing—original draft, H.W. All authors have read and agreed to the published version of the manuscript.
Funding
This research was funded by National Nature Science Foundation of China (41974182), National Natural Science Foundation of China Basic Science Center (42188101), and Fundamental Research Funds for the Central Universities (2042021kf0208).
Acknowledgments
The Swarm magnetic field and electron density data product are available at the European Space Agency site https://swarm-diss.eo.esa.int (accessed on 15 January 2022). The ICON data are available at https://icon.ssl.berkeley.edu/Data (accessed on 15 January 2022). The solar wind and interplanetary magnetic field and magnetic activity index data are from NASA/GSFC’S Space Physics Data Facility’s OMNIWeb (https://omniweb.gsfc.nasa.gov, accessed on 15 January 2022). We appreciate the availability of the data in the website.
Conflicts of Interest
The authors declare no conflict of interest.
References
- Adushkin, V.V.; Rybnov, Y.S.; Spivak, A.A. Wave-Related, Electrical, and Magnetic Effects due to the January 15, 2022 Catastrophic Eruption of Hunga Tonga-Hunga Haapai Volcano. J. Volcanolog. Seismol. 2022, 16, 251–263. [Google Scholar] [CrossRef]
- Aa, E.; Zhang, S.R.; Wang, W.; Erickson, P.J.; Qian, L.; Eastes, R.; Harding, B.J.; Immel, T.J.; Karan, D.K.; Daniell, R.E.; et al. Pronounced Suppression and X-Pattern Merging of Equatorial Ionization Anomalies after the 2022 Tonga Volcano Eruption. J. Geophys. Res. Space Phys. 2022, 127, e2022JA030527. [Google Scholar] [CrossRef]
- Harding, B.J.; Wu, Y.J.J.; Alken, P.; Yamazaki, Y.; Triplett, C.C.; Immel, T.J.; Gasque, L.C.; Mende, S.B.; Xiong, C. Impacts of the January 2022 Tonga Volcanic Eruption on the Ionospheric Dynamo: ICON-MIGHTI and Swarm Observations of Extreme Neutral Winds and Currents. Geophys. Res. Lett. 2022, 49, e2022GL098577. [Google Scholar] [CrossRef]
- Le, G.; Liu, G.; Yizengaw, E.; Englert, C.R. Intense Equatorial Electrojet and Counter Electrojet caused by the 15 January 2022 Tonga Volcanic Eruption: Space and Ground-based Observations. Geophys. Res. Lett. 2022, 49, e2022GL099002. [Google Scholar] [CrossRef]
- Zhang, S.R.; Vierinen, J.; Aa, E.; Goncharenko, L.P.; Erickson, P.J.; Rideout, W.; Coster, A.J.; Spicher, A. 2022 Tonga volcanic eruption induced global propagation of ionospheric disturbances via Lamb waves. Front. Astron. Space Sci. 2022, 9. [Google Scholar] [CrossRef]
- Park, J.; Lühr, H. Effects of sudden stratospheric warming (SSW) on the lunitidal modulation of the F-region dynamo. J. Geophys. Res. Space Phys. 2012, 117, A9. [Google Scholar] [CrossRef] [Green Version]
- Park, J.; Lühr, H. Relation of zonal plasma drift and wind in the equatorial F region as derived from CHAMP observations. Ann. Geophys. 2013, 31, 1035–1044. [Google Scholar] [CrossRef] [Green Version]
- Lühr, H.; Maus, S. Direct observation of the F region dynamo currents and the spatial structure of the EEJ by CHAMP. Geophys. Res. Lett. 2006, 33. [Google Scholar] [CrossRef] [Green Version]
- Maeda, H.; Iyemori, T.; Araki, T.; Kamei, T. New evidence of a meridional current system in the equatorial ionosphere. Geophys. Res. Lett. 1982, 9, 337–340. [Google Scholar] [CrossRef]
- Park, J.; Lühr, H.; Min, K.W. Characteristics of F-region dynamo currents deduced from CHAMP magnetic field measurements. J. Geophys. Res. Space Phys. 2010, 115, A10. [Google Scholar] [CrossRef]
- Lühr, H.; Kervalishvili, G.N.; Stolle, C.; Rauberg, J.; Michaelis, I. Average characteristics of low-latitude interhemispheric and F region dynamo currents deduced from the swarm satellite constellation. J. Geophys. Res. Space Phys. 2019, 124, 10631–10644. [Google Scholar] [CrossRef] [Green Version]
- Wang, H.; Xia, H.; Zhang, K.; Zhong, Y.; Qian, C. Local time and longitudinal variation of the ionospheric radial current: Swarm observations and TIE-GCM simulations. Earth Planets Space 2022, 74, 1–16. [Google Scholar] [CrossRef]
- Wang, H.; Gao, J.; Zhang, K. Influence of the Magnetic Field Strength and Solar Activity on the Thermospheric Zonal Wind. J. Geophys. Res. Space Phys. 2022, 127, e2021JA029741. [Google Scholar] [CrossRef]
- Maute, A.; Richmond, A.D. F-Region Dynamo Simulations at Low and Mid-Latitude. Space Sci. Rev. 2017, 206, 471–493. [Google Scholar] [CrossRef]
- Finlay, C.C.; Dumberry, M.; Chulliat, A.; Pais, M.A. Short timescale core dynamics: Theory and observations. Space Sci. Rev. 2010, 155, 177–218. [Google Scholar] [CrossRef]
- Richmond, A.D. Ionospheric electrodynamics using magnetic apex coordinates. J. Geomagn. Geoelectr. 1995, 47, 191–212. [Google Scholar] [CrossRef]
- Immel, T.J.; England, S.L.; Mende, S.B.; Heelis, R.A.; Englert, C.R.; Edelstein, J.; Fery, H.U.; Korpela, E.J.; Taylor, E.R.; Craig, W.W.; et al. The ionospheric connection explorer mission: Mission goals and design. Space Sci. Rev. 2018, 214, 1–36. [Google Scholar] [CrossRef]
- Englert, C.R.; Harlander, J.M.; Brown, C.M.; Marr, K.D.; Miller, I.J.; Stump, J.E.; Hancock, J.; Peterson, J.Q.; Kumler, J.; Morrow, W.H.; et al. Michelson Interferometer for Global High-resolution Thermospheric Imaging (MIGHTI): Instrument design and calibration. Space Sci. Rev. 2017, 212, 553–584. [Google Scholar] [CrossRef]
- Newell, P.T.; Sotirelis, T.; Liou, K.; Meng, C.-I.; Rich, F.J. A nearly universal solar wind-magnetosphere coupling function inferred from 10 magnetospheric state variables. J. Geophys. Res. 2007, 112, A01206. [Google Scholar] [CrossRef]
- Amores, A.; Monserrat, S.; Marcos, M.; Argüeso, D.; Villalonga, J.; Jordà, G.; Gomis, D. Numerical Simulation of Atmospheric Lamb Waves Generated by the 2022 Hunga-Tonga Volcanic Eruption. Geophys. Res. Lett. 2022, 49, e2022GL098240. [Google Scholar] [CrossRef]
- Yamazaki, Y.; Harding, B.J.; Stolle, C.; Matzka, J. Neutral wind profiles during periods of eastward and westward equatorial electrojet. Geophys. Res. Lett. 2021, 48, e2021GL093567. [Google Scholar] [CrossRef]
- Huang, C.M.; Richmond, A.D.; Chen, M.Q. Theoretical effects of geomagnetic activity on low-latitude ionospheric electric fields. J. Geophys. Res. Space Phys. 2005, 110, A5. [Google Scholar] [CrossRef] [Green Version]
- Nishida, K.; Kobayashi, N.; Fukao, Y. Background Lamb Waves in the Earth’s Atmosphere. Geophys. J. Int. 2014, 196, 312–316. [Google Scholar] [CrossRef] [Green Version]
- Chen, C.-H.; Zhang, X.; Sun, Y.-Y.; Wang, F.; Liu, T.-C.; Lin, C.-Y.; Gao, Y.; Lyu, J.; Jin, X.; Zhao, X.; et al. Individual Wave Propagations in Ionosphere and Troposphere Triggered by the Hunga Tonga-Hunga Ha’apai Underwater Volcano Eruption on 15 January 2022. Remote Sens. 2022, 14, 2179. [Google Scholar] [CrossRef]
- Lin, J.-T.; Rajesh, P.K.; Lin, C.C.H.; Chou, M.-Y.; Liu, J.-Y.; Yue, J.; Hsiao, T.; Tsai, H.; Chao, H.; Kung, M. Rapid conjugate appearance of the giant ionospheric Lamb wave signatures in the northern hemisphere after HungaTonga volcano eruptions. Geophys. Res. Lett. 2022, 49, e2022GL098222. [Google Scholar] [CrossRef]
- Themens, D.R.; Watson, C.; Žagar, N.; Vasylkevych, S.; Elvidge, S.; McCaffrey, A.; Prikryl, P.; Reid, B.; Wood, A.; Jayachandran, P.T. Global propagation of ionospheric disturbances associated with the 2022 Tonga volcanic eruption. Geophys. Res. Lett. 2022, 49, e2022GL098158. [Google Scholar] [CrossRef]
- Wright, C.; Hindley, N.; Alexander, M.J.; Barlow, M.; Hoffmann, L.; Mitchell, C.; Prata, F.; Bouillon, M.; Carstens, J.; Clerbaux, C.; et al. Tonga eruption triggered waves propagating globally from surface to edge of space. Nature 2022, 609, 741–746. [Google Scholar] [CrossRef]
Figure 1.
Temporal variations in Em and the SYM-H index from 14–15 January 2022. The vertical red dashed line denotes the onset of the Tonga volcanic eruption. The red arrows denote radially upward FRC variations, and while the blue arrows denote radially downward FRC fluctuations.
Figure 1.
Temporal variations in Em and the SYM-H index from 14–15 January 2022. The vertical red dashed line denotes the onset of the Tonga volcanic eruption. The red arrows denote radially upward FRC variations, and while the blue arrows denote radially downward FRC fluctuations.
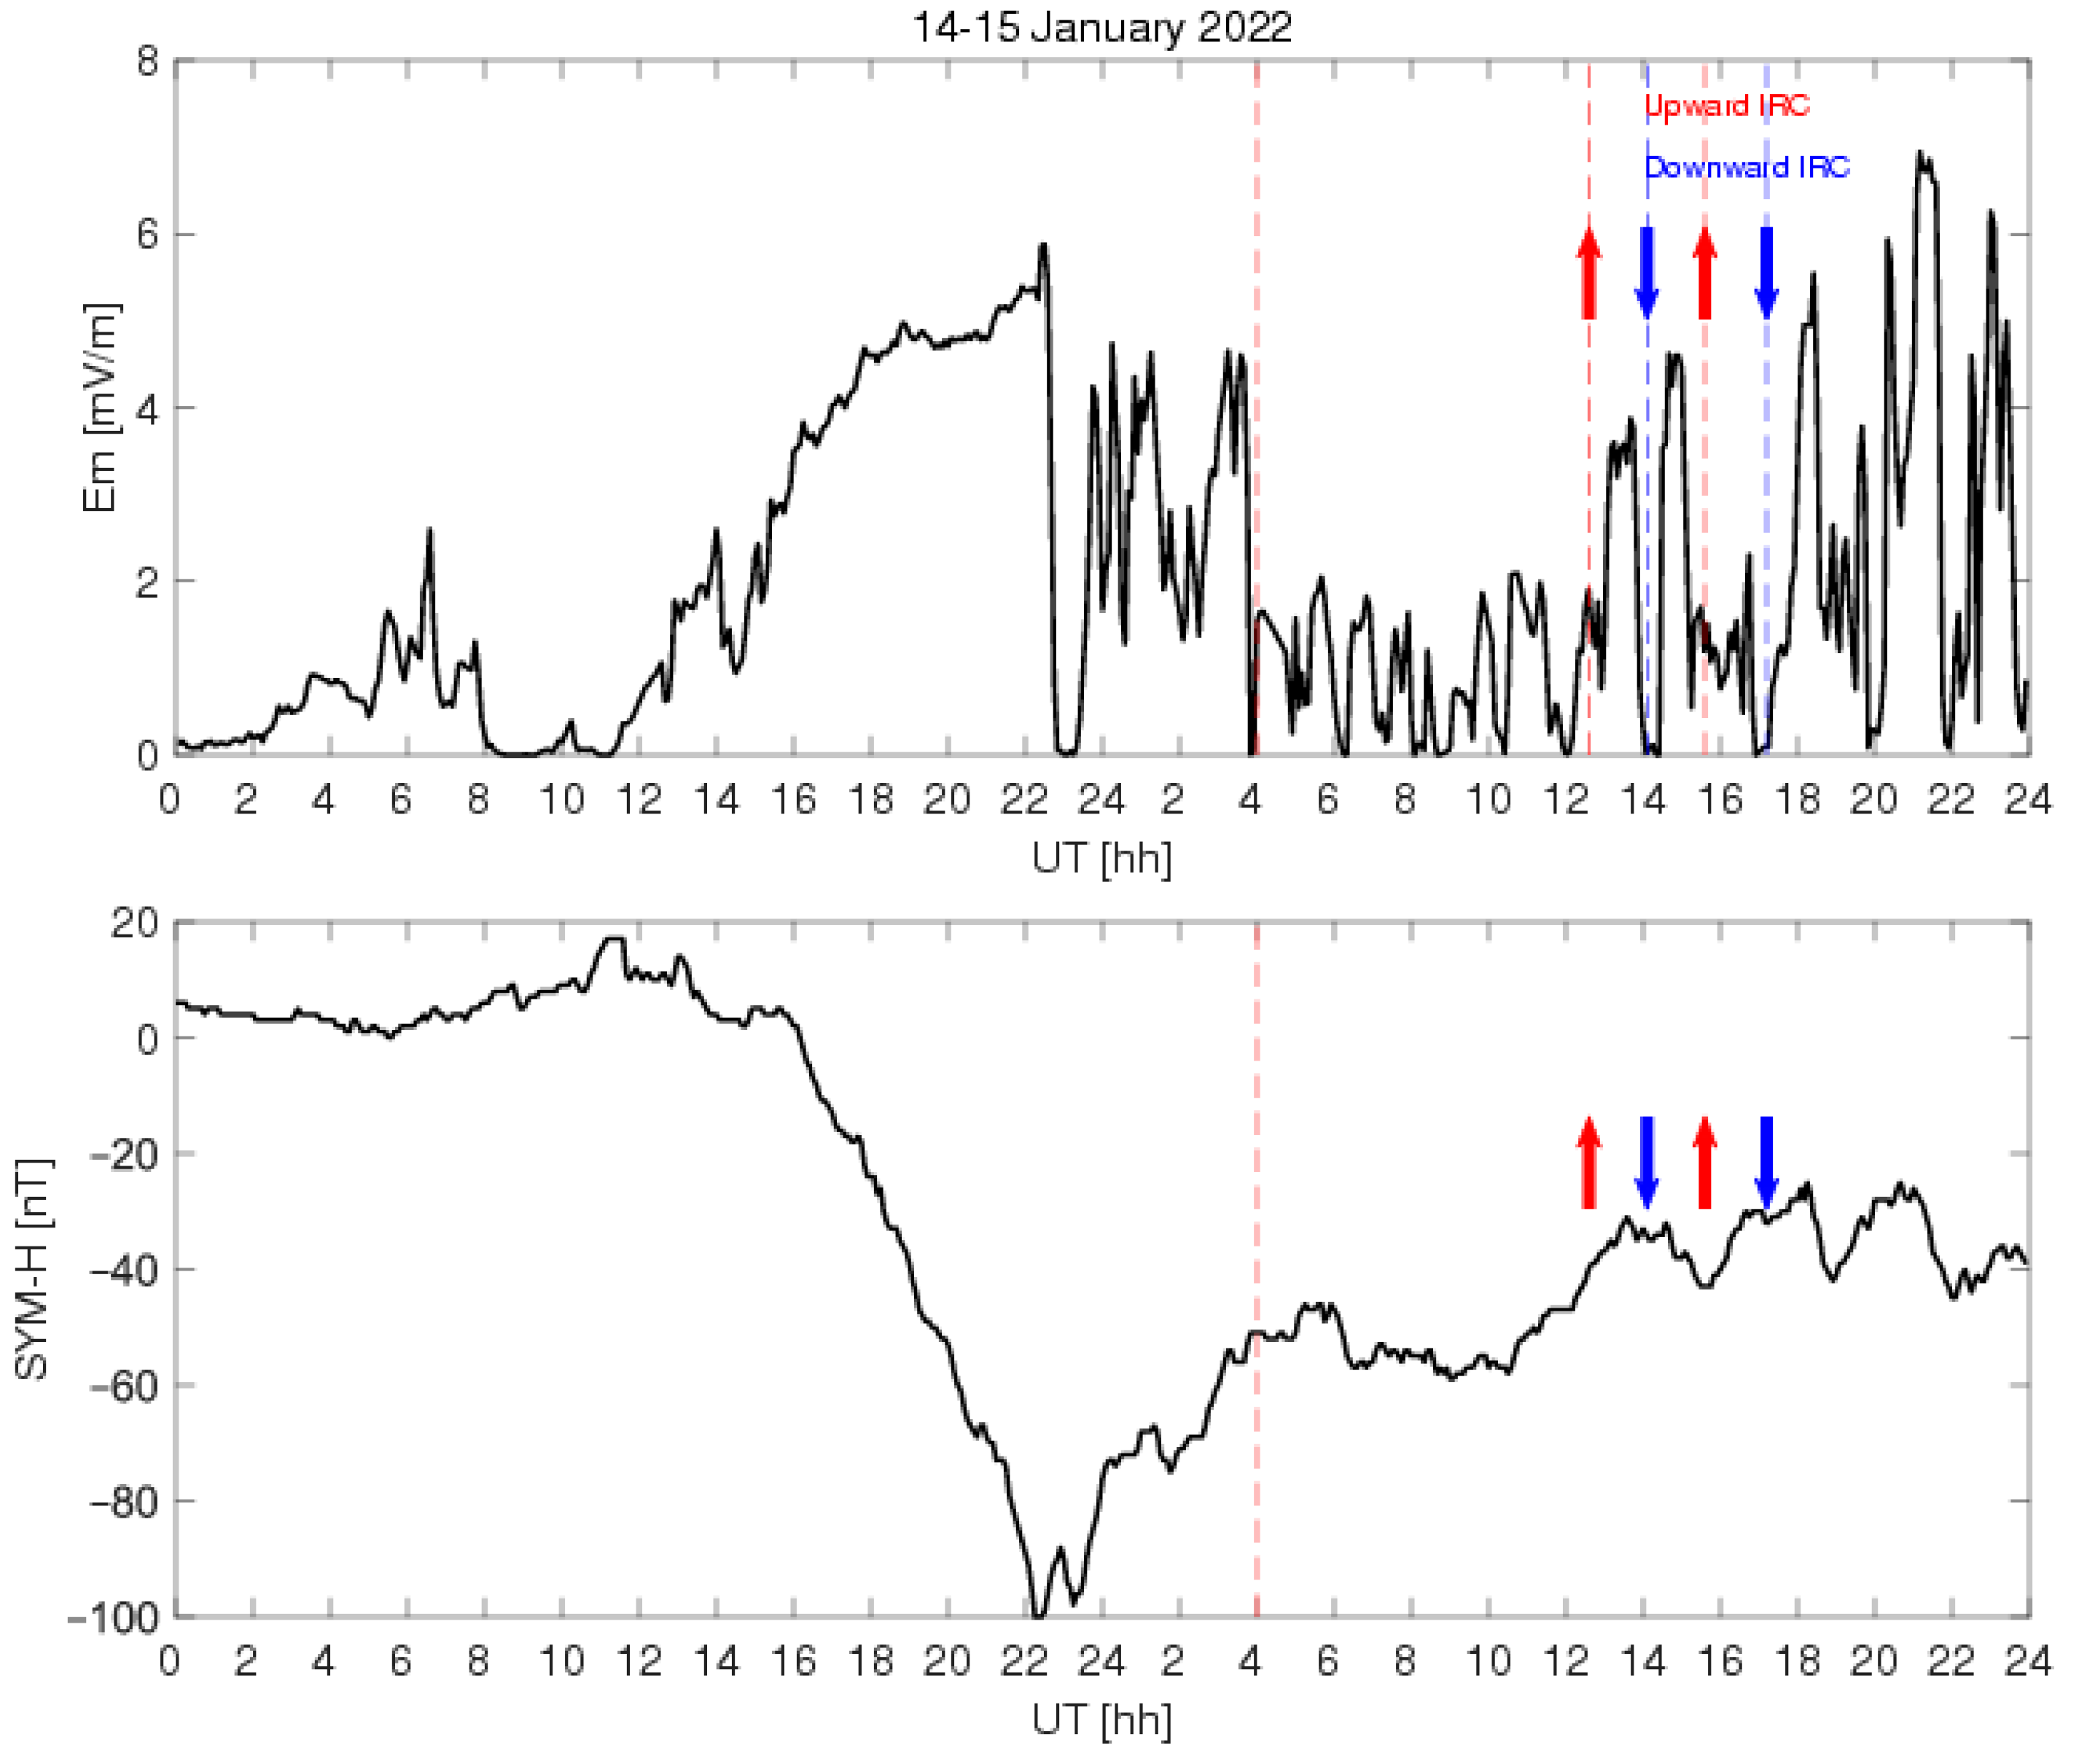
Figure 2.
Top panel: Latitudinal variations in the normalized FRC within ±1° MLat observed by dual Swarm A and C satellites on 15 January 2022. The vertical dashed lines indicate the zero current, while the positive (negative) FRC incidents deviate to the right (left). The x-axis range is from −1 to 1. Bottom panel: Temporal variations in the latitudinal averaged FRC during 13–15 January. Black curve is on 13 January, red curve is on 14 January, and blue curve is on 15 January. Positive values denote the radially upward FRC, while negative value denote the radially downward FRC. The red arrows and vertical dashed lines denote the radially upward FRC on 15 January, while the blue arrows and vertical dashed lines denote the radially downward FRC on 15 January.
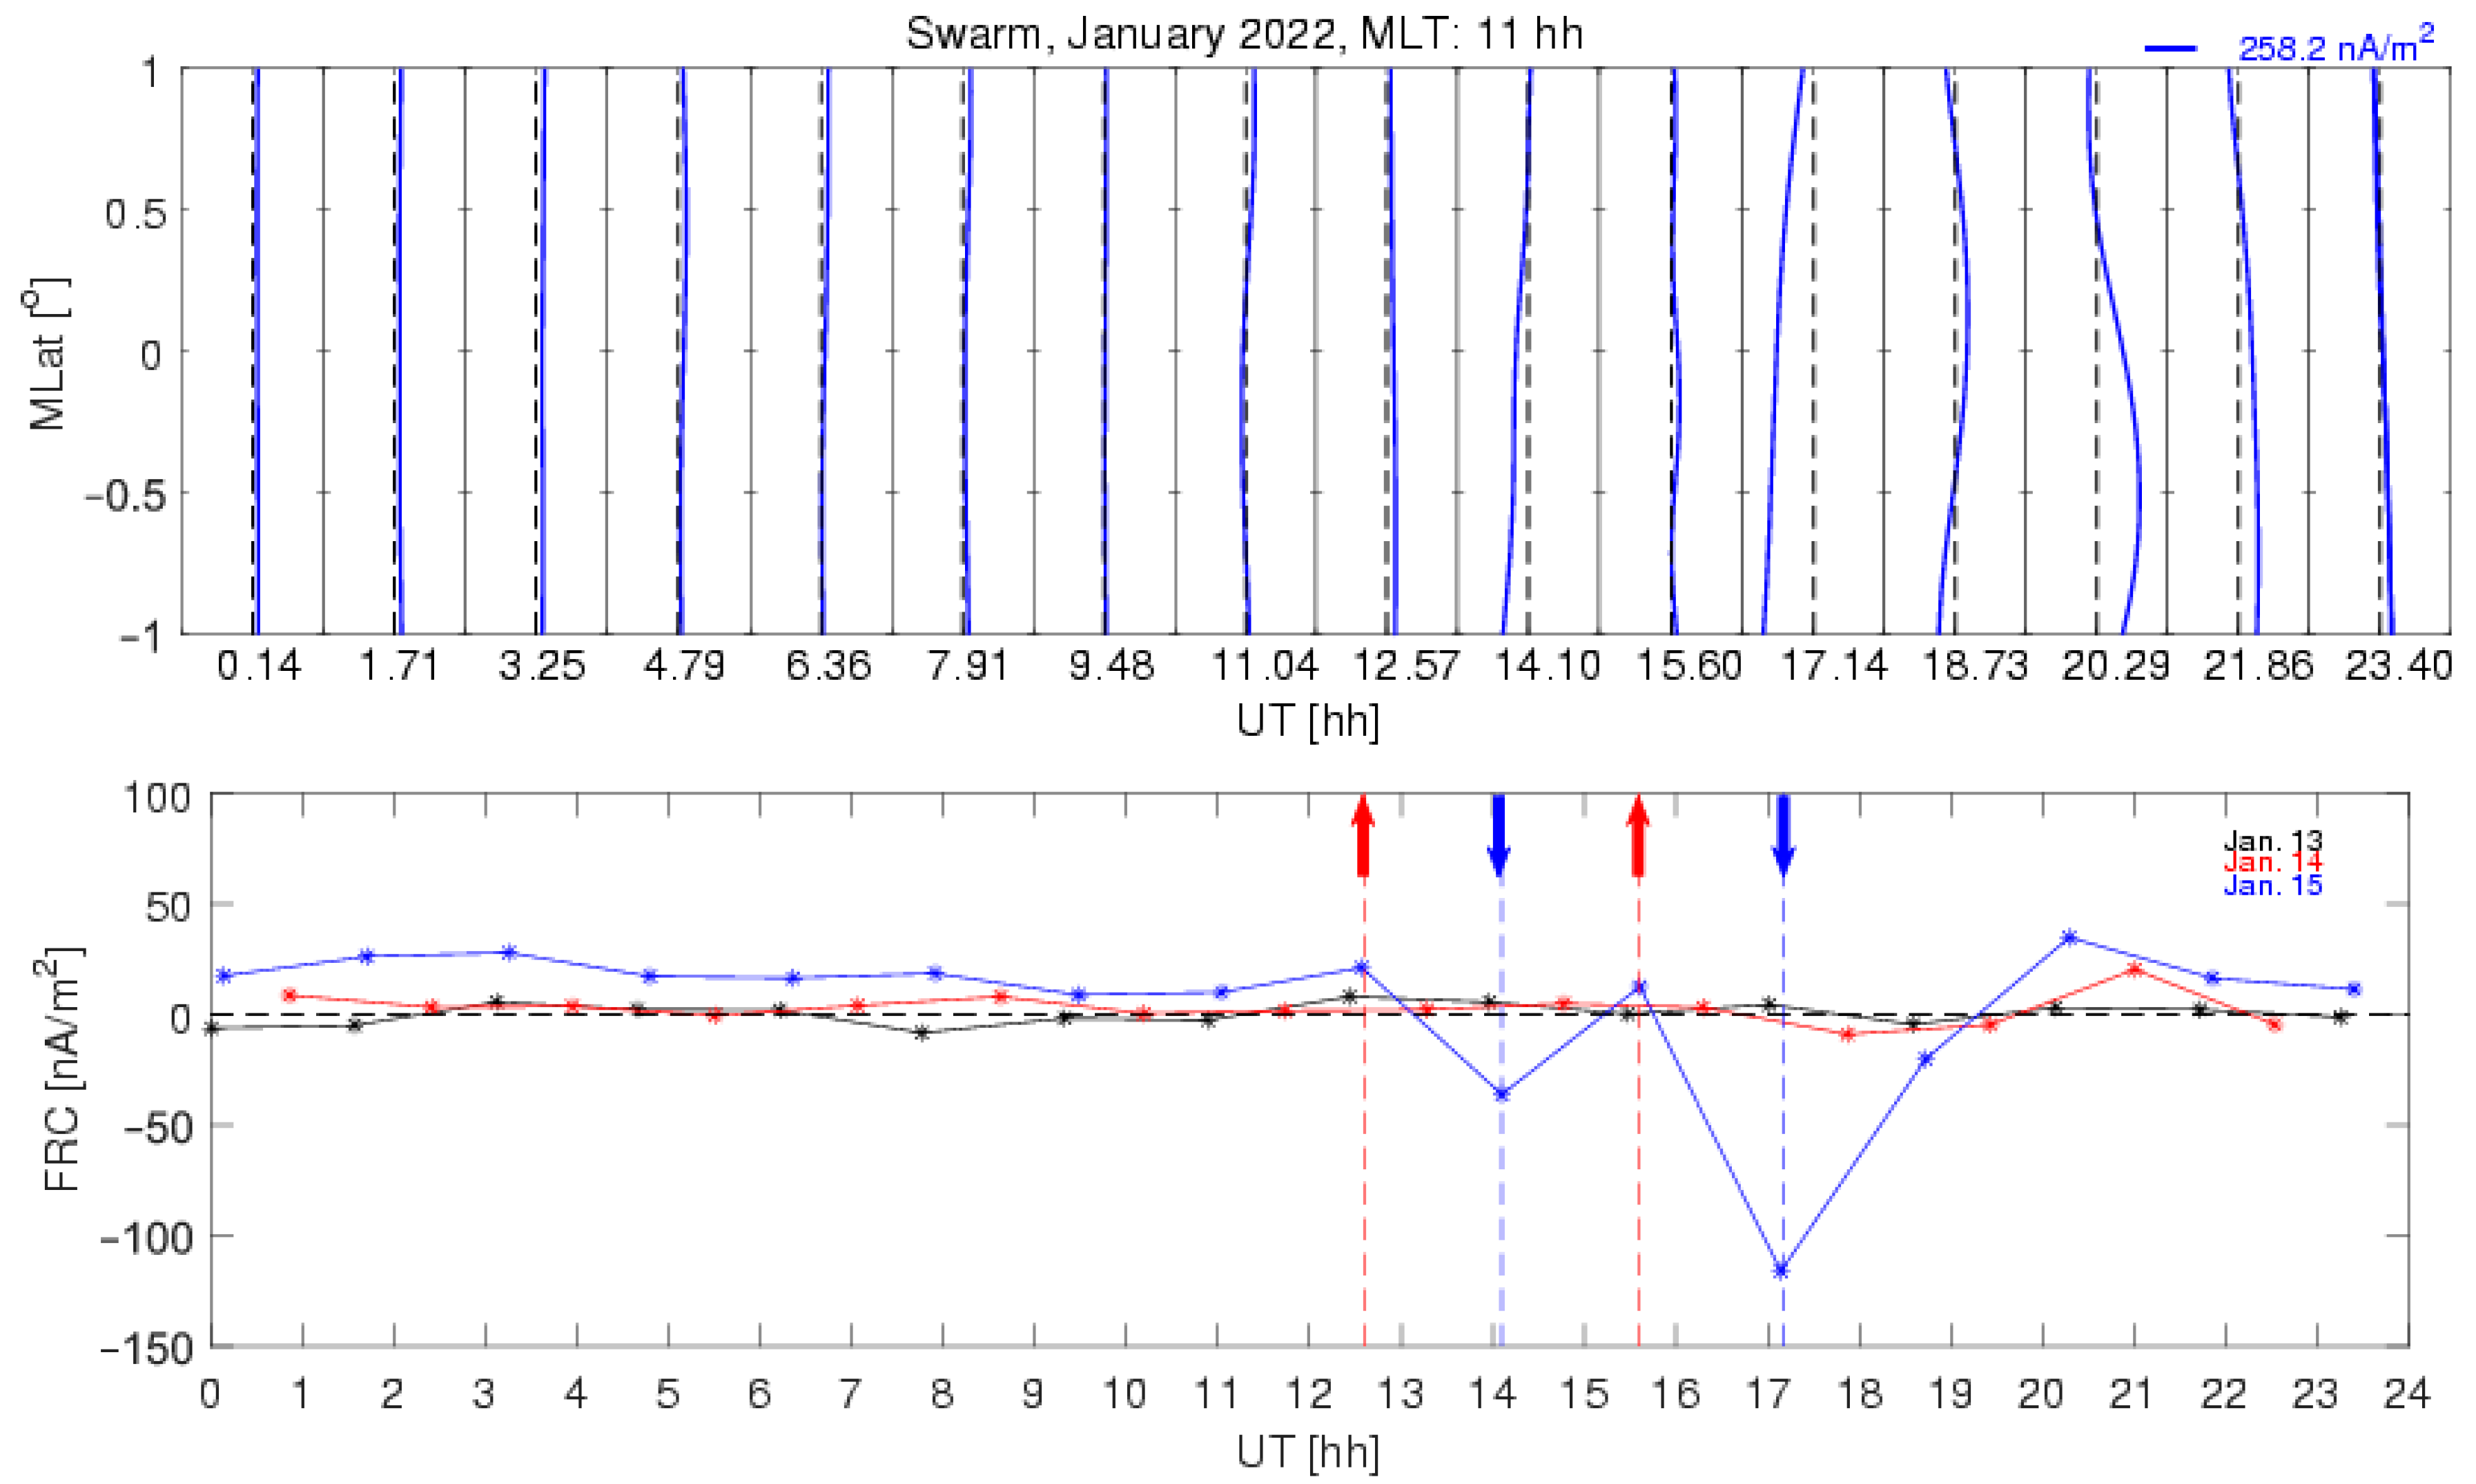
Figure 3.
Panels (a,b,e,f): The ICON orbit track segment is displayed as a blue curve as a function of the geographic latitude and longitude. The iso-distance lines surrounding the Tonga volcano eruption epicenter are marked at 2000-km intervals in green. The black dashed curves mark the magnetic equator. The red vertical dashed line shows the longitude of the upward FRC observed by the Swarm constellation, while the blue vertical dashed line shows the longitude of the downward FRC observed by the Swarm satellites in the daytime. Panels (c,d,g,h): The magnetic zonal wind is displayed as a function of the altitude and geographic longitude. The red arrows and vertical dashed lines denote the longitude of the radially upward FRC, while the blue arrows and vertical dashed lines denote the radially downward FRC.
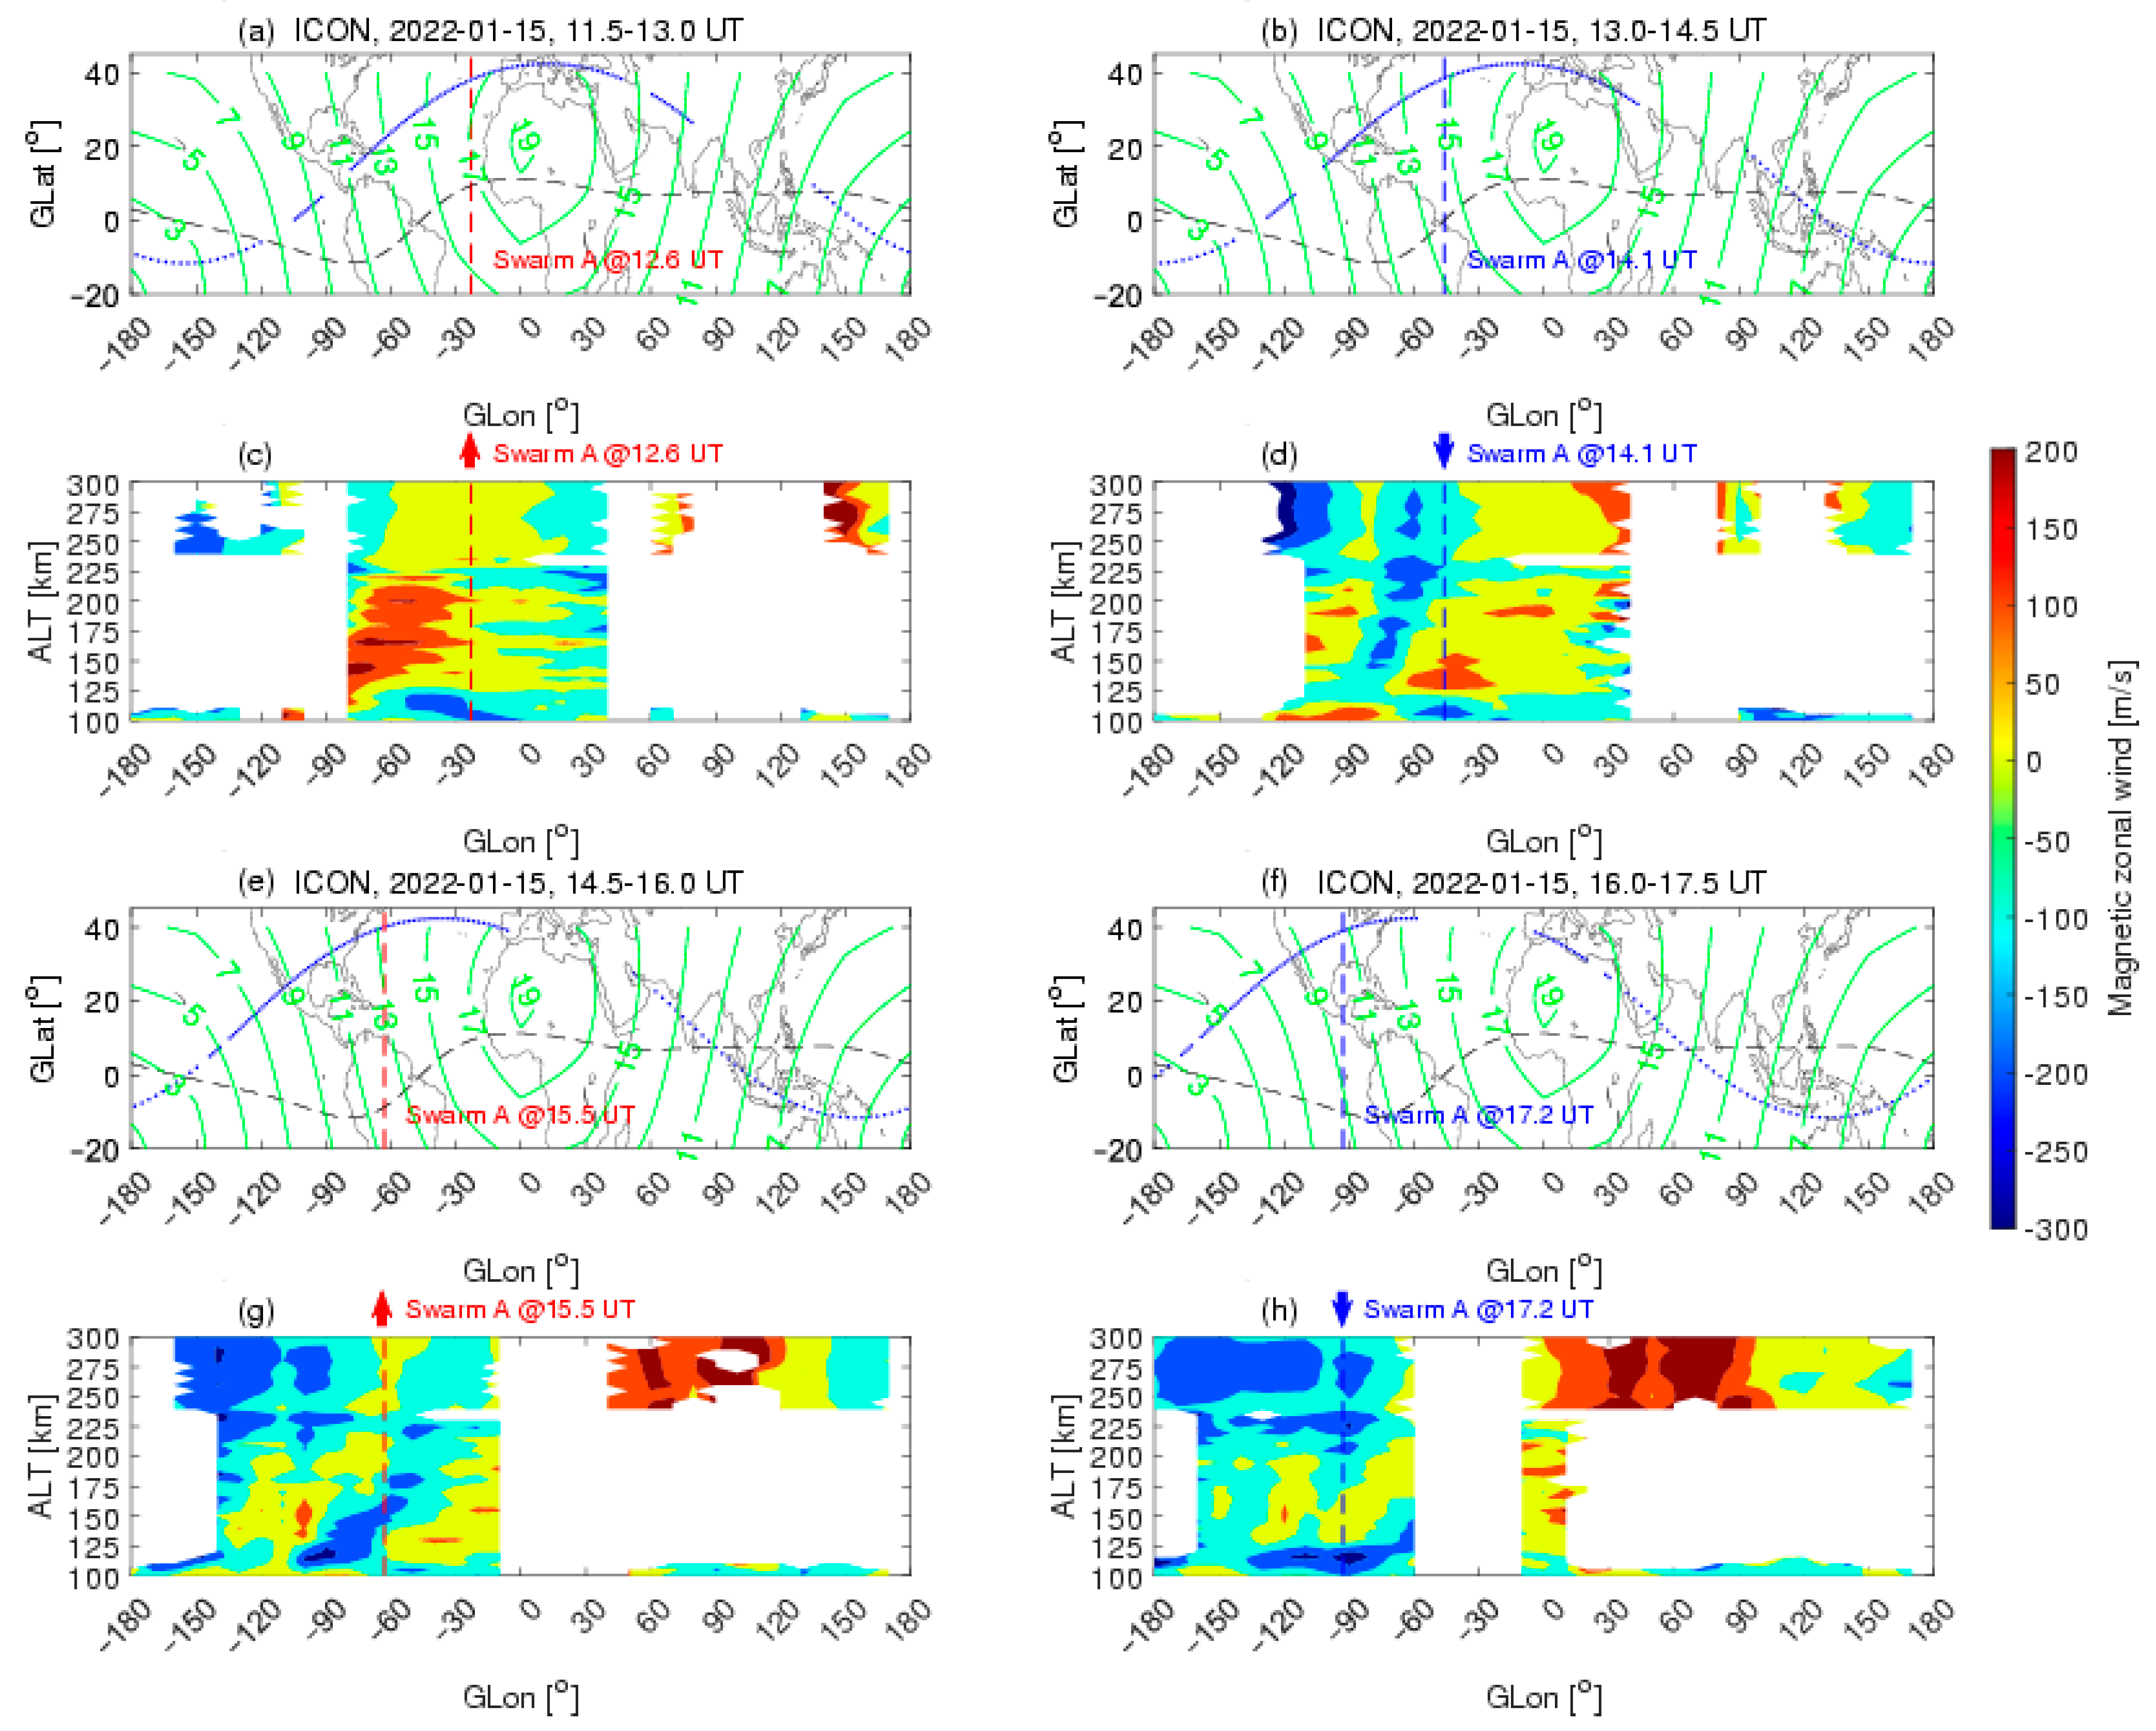
Figure 4.
The magnetic latitudinal variation of ionospheric F region electron density in the daytime (11 MLT) observed by Swarm C between 12:00 UT and 16:00 UT on 15 January 2022 (blue curve). For comparison, Ne between 13:00 UT and 16:00 UT on 13 January 2022 are also shown in black curve. The UT and GLon of the satellite passing through the magnetic equator are listed on the right axis.
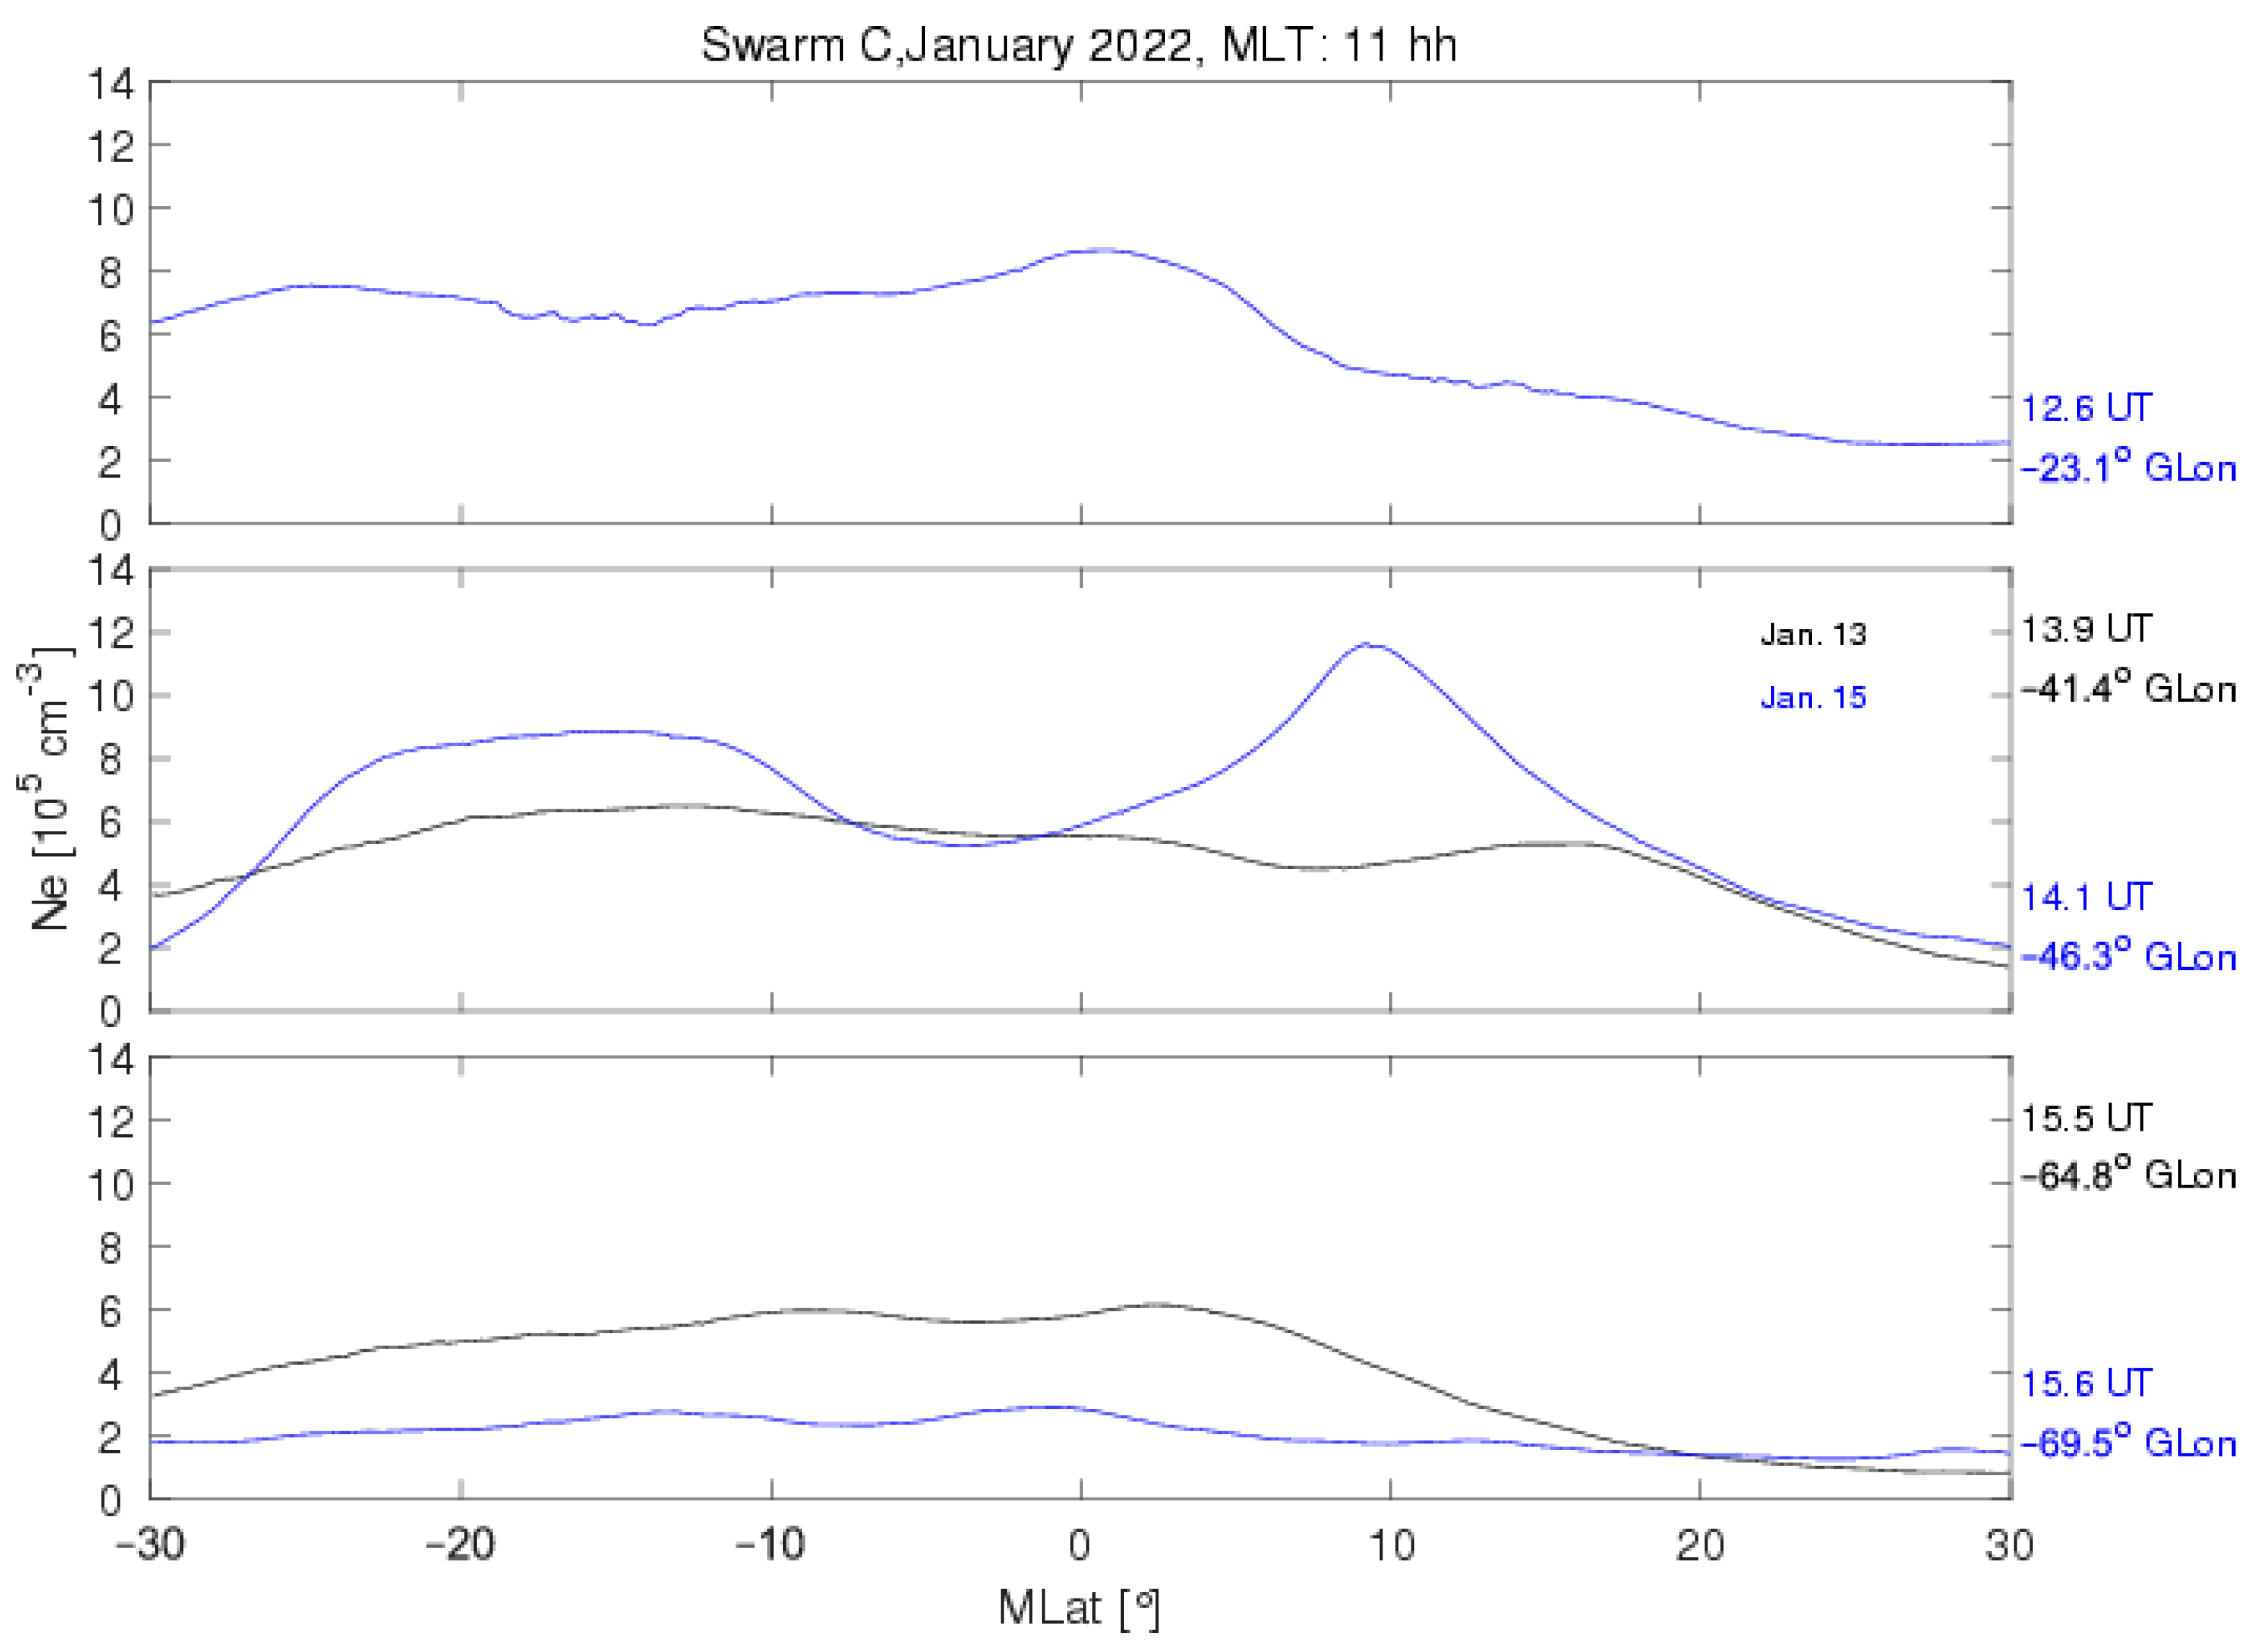
Figure 5.
The magnetic zonal wind as observed by ICON is displayed as a function of the altitude and geographic longitude. Panels (a–f) are before the arrival of the volcanic eruption at Swarm longitudes, and panels (g,h) are after the arrival of the eruption at Swarm longitudes. The vertical dashed lines denote the longitude of Swarm A. Longitudinal wave structure with reversed polarities are as indicated by the solid and dashed white curves in panels (g,h).
Publisher’s Note: MDPI stays neutral with regard to jurisdictional claims in published maps and institutional affiliations. |
© 2022 by the authors. Licensee MDPI, Basel, Switzerland. This article is an open access article distributed under the terms and conditions of the Creative Commons Attribution (CC BY) license (https://creativecommons.org/licenses/by/4.0/).
Share and Cite
MDPI and ACS Style
Wang, H.; Xia, H.; Zhang, K. Variations in the Equatorial Ionospheric F Region Current during the 2022 Tonga Volcanic Eruption. Remote Sens. 2022, 14, 6241. https://doi.org/10.3390/rs14246241
AMA Style
Wang H, Xia H, Zhang K. Variations in the Equatorial Ionospheric F Region Current during the 2022 Tonga Volcanic Eruption. Remote Sensing. 2022; 14(24):6241. https://doi.org/10.3390/rs14246241
Chicago/Turabian StyleWang, Hui, Hao Xia, and Kedeng Zhang. 2022. "Variations in the Equatorial Ionospheric F Region Current during the 2022 Tonga Volcanic Eruption" Remote Sensing 14, no. 24: 6241. https://doi.org/10.3390/rs14246241
Note that from the first issue of 2016, this journal uses article numbers instead of page numbers. See further details here.