
How Many Pan-Arctic Lakes Are Observed by ICESat-2 in Space and Time?


1
Key Laboratory of Watershed Geographic Sciences, Nanjing Institute of Geography and Limnology, Chinese Academy of Sciences, Nanjing 210008, China
2
University of Chinese Academy of Sciences, Beijing 100049, China
3
School of Geographical Sciences, Nanjing University of Information Science and Technology, Nanjing 210044, China
*
Author to whom correspondence should be addressed.
Remote Sens. 2022, 14(23), 5971; https://doi.org/10.3390/rs14235971
Submission received: 24 October 2022
/
Revised: 18 November 2022
/
Accepted: 23 November 2022
/
Published: 25 November 2022
(This article belongs to the Special Issue Remote Sensing Monitoring for Arctic Region)
Abstract
:High-latitude lakes are sensitive indicators of climate change. Monitoring lake dynamics in high-latitude regions (e.g., pan-Arctic regions) is essential to improving our understanding of the impacts of climate change; however, the lack of in situ water level measurements limits comprehensive quantification of the lake hydrologic dynamics in high-latitude regions. Fortunately, the newly launched ICESat-2 laser altimeter can provide finer footprint measurements and denser ground tracks, thus enabling us to measure the water level changes for more lakes than with conventional radar altimeters. This study aims to comprehensively assess the number and frequency of pan-Arctic lakes (>1 km2, north of 60°N) observable by the ICESat-2 in space and time over the past three years. Further, we analyze the spatial and temporal characteristics of the ICESat-2-based water level observations of these pan-Arctic lakes based on our customized classification of seasonal coverage patterns (wet/dry season, monthly, and ten-day). We find that the ICESat-2 observed 80,688 pan-Arctic lakes (97% of the total). Among the observed lakes, the ICESat-2 retrieved the seasonal coverage patterns for 40,192 lakes (~50% of observed lakes), accounting for nearly 84% of the area and 95% of the volumetric capacity. Most lakes (99%) have seasonal water-level fluctuation amplitudes within a range of 0–1 m. The latitudinal zonality analysis demonstrates that the seasonal change in pan-Arctic lake levels gently fluctuates around 0.5 m between 60°N and 74°N and becomes intense (range of level change from 1 m to 2 m) beyond 74°N. Our results are expected to offer an overall reference for the spatio-temporal coverage of the ICESat-2’s observations of pan-Arctic lakes, which is crucial for comprehending the hydrologic response of high-latitude lakes to ongoing climate change.

1. Introduction
About 50% of the world’s lakes are distributed in the high-latitude region north of 60°N [1]. These pan-Arctic lakes remain among the least impacted by humans. As the prominent feature of Arctic ecosystems, lakes have experienced substantial changes in the context of the warming climate, including the lake temperature, duration of ice cover, and precipitation regime [2,3,4]. Due to the polar amplification of global warming, Arctic lakes have become sensitive indicators of global climate change [5], yet our knowledge of lake hydrologic dynamics in Arctic regions is very limited due to the sparseness of in situ water level measurements. Such a knowledge gap greatly impedes our understanding of changes to Arctic lakes. This necessitates the demand for monitoring the dynamics of Arctic lakes and investigating their temporal and spatial variation patterns.
Satellite radar altimetry techniques have been used for many years to measure the surface water level due to the advantages of monitoring the areas where gauge data are difficult to access [6,7,8,9,10,11,12,13,14]. For example, Zakharova et al. [15] analyzed the seasonal variability of lake levels in Western Siberia by using ENVISAT RA-2 altimetry data. Yang et al. [16] employed TOPEX/Poseidon and Jason-1/2/3 altimeter missions to measure large ice-covered lake level changes in the Mackenzie River Basin in the Arctic. Chen et al. [17] estimated seasonal water budgets for 463 lakes worldwide above 10 km2 by combining multi-source satellite radar altimeter-derived water levels; however, the large ground footprints of conventional radar altimeters limit their capability to observe small- and medium-sized lakes, which account for the dominant percentage in the pan-Arctic region. As a result, studies have increasingly opted to use the SAR radar altimeter onboard the Sentinel-3 [18,19,20,21] or the ICESat laser altimeter [22,23,24,25] to derive denser elevation measurements with smaller footprints.
The Ice, Cloud, and Land Elevation Satellite-2 (ICESat-2), recently launched by the National Aeronautics and Space Administration (NASA), which carries the Advanced Topographic Laser Altimeter System (ATLAS), provides finer footprint (approximately 17 m in diameter) measurements [26] for observing small- and medium-sized lakes in Arctic regions than the ICESat (approximately 70 m in diameter). A few earlier studies confirmed the ICESat-2’s potential for water level observation on regional or global scales. For example, Yuan et al. [27] and Madson et al. [28] evaluated the water levels derived from the ICESat-2 for Chinese and U.S. lakes, respectively, at the national scale. Ryan et al. [29] and Cooley et al. [30] applied the ICESat-2 altimeter’s observations to examine global surface water levels and to characterize human influences on global reservoir level changes in comparison with natural lakes. Several recent studies have estimated the lake water level and storage change globally during the past two decades by combing two generations of satellite laser altimeters (the ICESat/ICESat-2) [31,32,33,34]. Previous studies have exerted great effort on the ICESat-2’s observations for lake levels, yet the feasibility of the ICESat-2 altimetry for characterizing pan-Arctic lake level variations through spatio-temporal coverage analysis remains unknown. In anticipation of the new altimetry mission, we aim to answer the following questions: How many pan-Arctic lakes can be observed by the ICESat-2 in space and time within the denser orbital coverage at high latitudes, and at what frequency? Can the ICESat-2 (the 91-day repeat cycle) be employed to measure pan-Arctic lake level changes in seasonal or even monthly intervals?
Here, we first provide a comprehensive assessment of how many pan-Arctic lakes in the HydroLAKES inventory can be observed by the ICESat-2 during the past three years. Next, the observed pan-Arctic lakes are classified into different groups based on their temporal coverage frequency, which contains wet/dry season, monthly, and ten-day coverage patterns. Based on the classification of temporal coverage patterns, we calculate the corresponding seasonal water level (SWL) amplitude and explore the spatial characteristics of SWL changes. Lastly, we select a few lake cases with dense temporal ICESat-2 observations and compare the ICESat-2 water level retrievals with the radar altimetry and in situ water level data.
2. Materials and Methods
2.1. ICESat-2 ATLAS ATL13 Data
This study used the fifth release of the ICESat-2 L3A Inland Surface Water Height product (ATL13) data (1 December 2018 to 30 November 2021) to assess the satellite altimetry coverage and derived water level change for pan-Arctic lakes above 1 km2 situated north of 60°N. This product provides the along-track surface height for inland water bodies, including lakes, reservoirs, rivers, etc., with reference to the Earth Gravitational Model 2008 (EGM2008) [35]. More details about the ATL13 algorithm can be found in the Algorithm Theoretical Basis Document (ATBD) [36]. The new versions (after V3) of the ATL13 product allow for a robust analysis of all lakes above 1 km2 due to its adequate representation of the water bodies in the product’s water mask.
2.2. Auxiliary Data
To validate the ICESat-2-based lake levels, daily and monthly in situ water level observations were collected from the Historical Hydrometric Data by the government of Canada (https://wateroffice.ec.gc.ca/mainmenu/historical_data_index_e.html (accessed on 1 January 2022)) and the Information System on Water Resources and Water Management of the Russian River Basins (http://gis.vodinfo.ru/ (accessed on 1 December 2021)). Moreover, the radar altimetry-based water level time series from the DAHITI platform [37] was used for comparison. The HydroLAKES [1] dataset was used to determine lake boundaries above 60°N to study. A total of 83,183 lakes (>1 km2) are located in the study area. In addition, the ERA5-land reanalysis dataset, including the monthly total precipitation, was collected to discuss the influence of climate change on the spatial heterogeneity of SWL changes.
2.3. SWL Calculation by ICESat-2 Temporal Coverage Patterns
In this study, we first divided the temporal coverage patterns of the ICESat-2’s observations of pan-Arctic lakes into three categories, including wet/dry season coverage, monthly coverage, and ten-day coverage based on the criteria as listed in Table 1. Specifically, the wet/dry season coverage requires at least two observations each year: one in the dry season (January–April and November–December) and the other in the wet season (May–October) [38]. The observation interval between the wet season and dry season is no less than four months. For the monthly coverage pattern, at least 11 observations per year are required for lakes. Lakes in the ten-day coverage pattern are observed at least once every ten days within at least 11 months of each year. The aforementioned observation conditions should be met every year during the studied three-year period.
In this study, the difference between the maximum and minimum water levels falling in the wet and dry seasons, respectively, was defined as the seasonal water level variation of the observed lakes in Category 1. The observations used to calculate the SWL are, on average, six months apart in the study. For the lakes covered by Categories 2 and 3, the difference between the annual maximum and minimum water level throughout the year was used as the amplitude of the seasonal water level variation. Then, the three-year mean of the seasonal water level changes for each temporal coverage category was considered as the final seasonal lake level variation. That is to say, the seasonal water level change in the lake is not analyzed in this study if it does not meet the three aforementioned categories of seasonal coverage patterns.
2.4. Spatial Pattern Analysis of SWL
To analyze spatial patterns in the seasonal water level variability, we created a mesh of rectangles (1° × 1° grid square) and tessellated the pan-Arctic area into uniform units. Then, we covered each lake with the created 1° × 1° grid square according to the centroid coordinates for each lake. The median SWL change was calculated at each cell to reveal spatial patterns of the seasonal amplitude in pan-Arctic lakes. If there are no lakes within the fishnet cell, the SWL change value for that cell is set to zero. Similarly, we created a latitudinal zone at a 0.1° interval to analyze the characteristics of the SWL change along the latitude.
3. Results and Analyses
3.1. ICESat-2 Observation Coverage of Pan-Arctic Lakes
During the three study years of the ICESat-2 observation (December 2018 through November 2021), a total of 80,688 lakes (>1 km2) have at least one observation, accounting for 97% of the lakes in the study. The proportions of pan-Arctic lakes observed by the ICESat-2 in the Eastern and Western Hemispheres are 43% (Eurasian continent, hereinafter referred to as EURA) and 57% (North American continent, hereinafter referred to as NA), respectively. The observed lake size ranges from 1 km2 to 30,450.64 km2, and the size levels of 1–5 km2, 5–50 km2, and >50 km2 account for 85%, 14%, and 1%, respectively (Figure 1). Only 55 large lakes (>500 km2) are distributed in EURA (16) and NA (39). Further, the number of observed lakes in NA is higher than that in EURA at different size levels, as shown in the right panel in Figure 1.
Despite the fine footprint (<17 m) and dense cross tracks of the ICESat-2 in the Arctic, there are still 2130 lakes ranging from 1 km2 to 125.11 km2 (84% in 1–2 km2 and 15% in 2–5 km2) that were not observed (Figure 2). The majority of these unobserved lakes are too small to be measured by the ICESat-2 due to their unique shape and near-parallel alignment with the ICESat-2’s ground tracks. A few relatively larger unobserved lakes are mostly distributed in Greenland and are primarily concentrated north of 75°N. For example, the largest unobserved lake with an area of 125.11 km2 is located in North Greenland. It is a strange situation due to the defects of the ATL13 products (missing from the real data), which can be resolved by using the ATL06, ATL08, or ATL03 products. Excluding Greenland, the number of unobserved lakes in NA is proportionally greater than that in EURA (Figure 2).
3.2. Temporal Coverage Patterns of Pan-Arctic Lakes
As shown in Figure 3, it is clear to see that the pan-Arctic lakes with larger areas receive more annual observations than smaller ones. Among all observed lakes with a mean area of 1.66 km2, 33.7% received at least one observation per year on average. Lakes with increasing mean sizes of 2.44 km2, 4.93 km2, 20.11 km2, and 387.67 km2 receiving 2–4, 4–6, 6–12, and >12 observations per year account for 36.6%, 22.9%, 6.1%, and less than 1%, respectively. During the study period, the 33 lakes that received more than 36 observations per year have a mean area of 3836 km2. Among them, the top four lakes with the most frequent observations are Taymar Lake in Russia (176 observations), Hazen Lake (116 observations), Great Slave Lake (226 observations), and Great Bear Lake (132 observations) in Canada; their areas range from 547.21 km2 to 30,450.64 km2.
Among the 80,688 observed lakes in the HydroLAKES database, at least 40,192 lakes (~50%) could be observed by the ICESat-2 in Category 1 (wet/dry season coverage) (Table 2), which cover 84% of the area and 95% of the volume of pan-Arctic lakes. Another 50% of lakes that do not meet the seasonal observed characteristics are labeled “Non-seasonal” (Table 2). Table 2 shows that the area of the other observed lakes is less than 100 km2 and mostly concentrates between 1–5 km2 (95%). The spatial pattern and proportion of lakes in the wet/dry seasonal coverage are similar overall to those of all observed lakes (Figure 4). For the pan-Arctic lakes ranging 1–5 km2, most belong to the wet/dry seasonal coverage; only six lakes match the monthly coverage. By contrast, for lakes with an area in the range of 10–1000 km2, 78% can reach the monthly coverage. There are only 21 lakes that belong to the ten-day coverage, with a mean surface area of 5120 km2. All lakes larger than 1000 km2 received at least monthly observations (Table 2).
3.3. Spatial Pattern of SWL Changes
A notable spatial pattern of the SWL changes over the study period can be observed in Figure 4. The median SWL change by 1° × 1° grid square is 0.43 m, ranging from 0.01 m to 3.78 m. Nearly 90% of grid squares have an SWL change of less than 1 m, specifically including the groups 0–0.2 m (5%), 0.2–0.5 m (56%), 0.5–1 m (28%), 1–1.5 m (6%), 1.5–2 m (3%), and 2–4 m (2%) (Figure 5). Generally, lower SWL changes (0.2–0.5 m) are found in Canada and Alaska of NA as compared to the higher SWL changes (0.5–1 m) in northern Europe and Siberia of EURA. The highest SWL changes (>1 m) are observed in Greenland and scattered squares near the ocean, which can largely be explained by the unique and complex climate changes in these regions. In addition, we find that the range of the SWL change generally ascended with an increase in the lake area (see Figure 6). Lakes with an area of 100–1000 km2 had the largest range of SWL change with an upper and lower value of 0.55 and 1.75 m, respectively.
To further qualify the spatial patterns of the SWL change for pan-Arctic lakes, we calculate the SWL change at 0.1° latitude intervals for NA and EURA (Figure 7). The latitudinal zonality of the SWL change to the pan-Arctic lakes can be observed in both NA and EURA. In particular, the SWL change in the pan-Arctic lakes gently fluctuates around 0.5 m between 60°N and 74°N. Then, the SWL change begins to fluctuate and rise beyond 74°N. However, the reason to explain the SWL change fluctuation is different between NA and EURA at high latitudes. In NA, north of 74°N is mainly northern Greenland and several Nunavut islands. The lakes in NA beyond 74°N are particularly sensitive to climate change due to rare anthropogenic activities [39,40]. The SWL change in the lakes in these regions could be largely attributed to seasonal ice melting and permafrost thawing with climate warming [3,4]. However, few lakes are situated north of 74°N in EURA. These high-latitude lakes on the islands are facing lower temperatures and decreasing precipitation during the winter season and ice-free lakes in the summer season, resulting in the SWL change fluctuations [41,42].
4. Discussion
4.1. Comparison of Altimetry and Gauged Water Level
Based on the analysis of the temporal coverage pattern of pan-Arctic lakes by the ICESat-2 described above, we select four lakes with dense time series from the ICESat-2’s observations and compare the water levels with those derived from radar altimetry and gauge stations (Figure 8). We find that the ICESat-2 has high accuracy in water level monitoring for large lakes compared to the gauged water levels. The assessments of the comparison results are illustrated in Figure 8, showing a correlation coefficient (R) of 0.79–0.97 and RMSE of 0.07–0.12 m. Compared to the water levels measured by the gauge stations, the RMSEs of the water level time series derived from radar altimetry at the corresponding stages with the ICESat-2 (including the freeze-up period) for the selected lakes are 0.19 m (Great Bear Lake), 0.13 m (Great Slave Lake), 0.15 m (Ladoga Lake), and 0.10 m (Onega Lake), respectively. Obviously, the water levels of the high-latitude lakes measured by the ICESat-2 are superior overall to those by radar altimeters. One major reason can be attributed to microwave penetration of the lake ice which may introduce uncertainty into the water level extraction [43,44,45].
Moreover, we find that the ICESat-2 can observe denser water levels than radar altimetry. For example, the monthly average observations of the selected lakes based on the ICESat-2 altimetry is 8.2 times, while the monthly average observations based on the multi-source radar altimetry is 3.4 times. The ICESat-2 can densify the time series by nearly 2.5 times for the selected lakes, on average. For the Great Bear Lake and Great Slave Lake in NA, the average monthly observations of the ICESat-2 are more than 10 times, while the average monthly observations for the radar altimetry are only 2.3–2.6 times. However, the lakes selected for validation are large ones, and the time-series observations by the ICESat-2 will be denser than those for the radar altimetry of small- and medium-sized lakes. Therefore, we conclude that the ICESat-2 altimeter has the potential not only to monitor the water level dynamics of small- and medium-sized lakes but also to produce a denser water level time series for large lakes [32,33,34].
4.2. Characteristics of SWL Change and Potential Causes
The spatial patterns and characteristics of the SWL have been shown in the Results section, in which the area size of a lake may affect the SWL change. To quantify the impact of the lake area on the SWL variability, we calculated the median value, mean value, range, and STD of the SWL in different area groups according to Figure 6 (Table 3). As shown in Table 3, we find that the median, mean, range, and STD of the SWL change generally ascended with the lake area increase, respectively. When the lake area is above 1000 km2, the SWL change tends toward stability. Lakes with an area of 100–1000 km2 had the largest median, mean, range, and STD of the SWL change with 0.938 m, 1.050 m, 1.202 m, and 0.350 m, respectively. Therefore, it can be found that the SWL change is correlated with lake size.
In addition, another characteristic of the SWL change is spatial heterogeneity. The results show that relatively high SWL changes are found in Greenland and scattered squares near the ocean, especially at higher latitudes (above 74°N). The high-latitude lakes that are less affected by anthropogenic use will be more sensitive to climatic change. Considering that precipitation is an important factor affecting the water budget, which will also directly affect the change in the SWL, we collect the monthly ERA5-Land precipitation data to detect the seasonal amplitude of precipitation in different SWL change areas based on the grids in Figure 5 (Figure 9). We find that the median value of the seasonal precipitation varies with the SWL change when the SWL is greater than 0.2 m. In particular, the amplitude of seasonal precipitation is larger in the clusters with a high SWL change and ranges more than dozens of millimeters based on the median values. Increasing evidence has shown that precipitation changes are dominated by the effects of warming temperatures due to climate change, which results in glacial meltwater [46,47,48,49,50,51]. Then, the pan-Arctic lakes above 74°N, shown in Figure 7, with a high SWL change may be contingent on the glacial meltwater due to climate change. This also indicates that these high-latitude areas with a high SWL change, such as some islands in EURA and northern Greenland in NA have a water cycle dominated by snowmelt hydrology.
4.3. ICESat-2 ATL13 Product-Derived Water Levels
We successfully determined the SWL change in pan-Arctic lakes utilizing the ICESat-2 ATL13 product (Inland Surface Water Height product) in the study. We choose the ATL13 product to derive the water levels of the pan-Arctic lakes because the water mask for the ATL13 product adopts the HydroLAKES database. Of course, other data products (e.g., ATL03, ATL06, and ATL08) have also been reported in previous works to extract the lake or reservoir levels combined with the utilization of customized waterbody masks [52,53,54,55,56,57,58]. Moreover, we note that there is little difference in the water level extraction of the same lake with the different ICESat-2 products derived from ATL03 (Global Geolocated Photon Data) according to these studies. However, the ICESat-2 ATL13 product is not perfect or bug-free. For example, the new and expanding lakes not included in the waterbody masks of ATL13 will be missed by observation in this study. In these special cases, we think that the other ICESat-2 products can be used to make up for the data defects of the ATL13 product (e.g., the ATL06 product should be preferred for supplementation in the pan-Arctic region). Therefore, the ICESat-2 may be able to observe a few more pan-Arctic lakes than those analyzed in this study. In this study, we only assess the spatio-temporal coverage of pan-Arctic lakes by the ICESat-2 based on the HydroLAKES database.
5. Conclusions
This research explores the ICESat-2 coverage performance of pan-Arctic lakes in space and time based on the lake boundaries from the HydroLAKES database. Moreover, we analyze the characteristics of seasonal water level amplitude in the lake-size group and the spatial distribution according to our customized classification of temporal coverage patterns (wet/dry season, monthly, and ten-day coverages). During the three full years of the ICESat-2’s observations, we find that the ICESat-2 altimeter observed 97% of lakes above 1 km2 around the pan-Arctic region (north of 60°N) with a surface water area ranging from 1 km2 to 30,450.64 km2. Among the observed pan-Arctic lakes, the ICESat-2 can retrieve the SWL change in 40,192 lakes (50%), covering nearly 84% in area and 95% in volume according to the HydroLAKES inventory. Furthermore, the unobserved lakes are usually small ones that are concentrated in the pan-Arctic region located south of 75°N. Only less than 1% of the unobserved lakes are greater than 10 km2, and all are in Greenland.
The pan-Arctic lakes with larger areas received denser observations than the smaller ones, especially in the seasonal coverage patterns. The lakes with areas ranging from 1 to 5 km2 receive wet/dry season observations, and lakes that match the monthly observation are concentrated within 10–1000 km2. Only 21 lakes have ten-day observations with a mean surface area of 5120 km2. We also observe more intense SWL changes for larger lakes. There is notable spatial heterogeneity and latitudinal zonality of the SWL variation in pan-Arctic lakes due to their sensitive response to climate change with increasing latitude. The spatial heterogeneous characteristics of the SWL change can be observed among the North American continent, the Eurasian continent, and Greenland. The latitudinal direction zonality demonstrates that the SWL change in pan-Arctic lakes gently fluctuates around 0.5 m between 60°N and 74°N and becomes intense beyond 74°N.
Due to the limitation of only three years of the ICESat-2’s observations, we have not examined long-term water level changes in pan-Arctic lakes. This study confirms that the ICESat-2 altimeter has excellent potential for observing water levels and determining the SWL change in pan-Arctic lakes. Moreover, we conclude that the ICESat-2 altimeter has the potential not only to monitor the water level dynamics of small- and medium-sized lakes in high latitudes but also to produce denser water level time series for large lakes than radar altimeters. In the future, the ICESat-2 mission can further improve its seasonal and long-term coverage performance in the pan-Arctic lakes as the number of the ICESat-2’s observations increases year by year. Further, the upcoming altimetry water level retrievals from existing and newly launched altimetry satellites, combined with multi-altimetry satellite data fusion technology, has the potential to substantially improve our understanding of the hydrologic responses of pan-Arctic lakes to climate change.
Author Contributions
Conceptualization, C.S. and T.C.; methodology, C.S., T.C., P.Z. and J.M.; software, T.C., P.Z. and J.M.; validation, C.S., T.C., P.Z. and J.M.; formal analysis, C.S., T.C., P.Z. and J.M.; investigation, P.Z. and J.M.; resources, P.Z. and J.M.; data curation, T.C., P.Z. and J.M.; writing—original draft preparation, C.S., T.C., P.Z. and J.M.; writing—supervision, C.S., T.C. and P.Z.; visualization, T.C., P.Z. and J.M.; project administration, C.S. and T.C.; funding acquisition, C.S. and T.C. All authors have read and agreed to the published version of the manuscript.
Funding
This work was partly funded by the National Key Research and Development Program of China (Grant Nos. 2022YFF0711603, 2018YFD0900804, 2019YFA0607101, and 2018YFD1100101), the Strategic Priority Research Program of the Chinese Academy of Sciences (Grant No. XDA23100102), the National Natural Science Foundation of China (Grant Nos. 42277074, 42101402, 42171421, and 41971403), and the Natural Science Foundation of Jiangsu Province (Grant No. BK20210990).
Data Availability Statement
The ICESat-2 altimetry data can be accessed at https://nsidc.org/data/atl13/versions/5 (accessed on 1 January 2022 ). The lake water mask dataset can be accessed at https://www.hydrosheds.org/products/hydrolakes (accessed on 1 January 2022). The in situ lake water levels employed in the validation section can be accessed at https://wateroffice.ec.gc.ca/mainmenu/historical_data_index_e.html (accessed on 1 January 2022) and http://gis.vodinfo.ru/ (accessed on 1 December 2021).
Acknowledgments
We are grateful to the National Aeronautics and Space Administration for providing the ICESat-2 data (https://nsidc.org/data/atl13/versions/5 (accessed on 1 January 2022)) and thank to Lehner and Grill for providing the HydroLAKES product (https://www.hydrosheds.org/products/hydrolakes (accessed on 1 January 2022)). We thank to the Hydrometric Data center in the government of Canada (https://wateroffice.ec.gc.ca/mainmenu/historical_data_index_e.html(accessed on 1 December 2021)) and the Information System Water Resources and Water Management of the Russian River Basins (http://gis.vodinfo.ru/ (accessed on 1 January 2022)) for providing the historical in situ lake water levels.
Conflicts of Interest
The authors declare that they have no known competing financial interests or personal relationships that could have appeared to influence the work reported in this paper.
References
- Messager, M.L.; Lehner, B.; Grill, G.; Nedeva, I.; Schmitt, O. Estimating the volume and age of water stored in global lakes using a geo-statistical approach. Nat. Commun. 2016, 7, 13603. [Google Scholar] [CrossRef] [PubMed]
- Li, X.; Peng, S.; Xi, Y.; Woolway, R.I.; Liu, G. Earlier ice loss accelerates lake warming in the Northern Hemisphere. Nat. Commun. 2022, 13, 5156. [Google Scholar] [CrossRef] [PubMed]
- Urbański, J.A. Monitoring and classification of high Arctic lakes in the Svalbard Islands using remote sensing. Int. J. Appl. Earth Obs. Geoinf. 2022, 112, 102911. [Google Scholar] [CrossRef]
- Lehnherr, I.; St Louis, V.L.; Sharp, M.; Gardner, A.S.; Smol, J.P.; Schiff, S.L.; Muir, D.C.; Mortimer, C.A.; Michelutti, N.; Tarnocai, C. The world’s largest High Arctic lake responds rapidly to climate warming. Nat. Commun. 2018, 9, 1290. [Google Scholar] [CrossRef] [PubMed] [Green Version]
- Drake, T.W.; Holmes, R.M.; Zhulidov, A.V.; Gurtovaya, T.; Raymond, P.A.; McClelland, J.W.; Spencer, R.G. Multidecadal climate-induced changes in Arctic tundra lake geochemistry and geomorphology. Limnol. Oceanogr. 2019, 64, S179–S191. [Google Scholar] [CrossRef] [Green Version]
- Birkett, C.J.E. Transactions American Geophysical Union. Radar altimetry: A new concept in monitoring lake level changes. Eos Trans. Am. Geophys. Union 1994, 75, 273–275. [Google Scholar] [CrossRef]
- Crétaux, J.-F.; Arsen, A.; Calmant, S.; Kouraev, A.; Vuglinski, V.; Bergé-Nguyen, M.; Gennero, M.-C.; Nino, F.; Del Rio, R.A.; Cazenave, A. SOLS: A lake database to monitor in the Near Real Time water level and storage variations from remote sensing data. Adv. Space Res. 2011, 47, 1497–1507. [Google Scholar] [CrossRef]
- Song, C.; Huang, B.; Ke, L. Modeling and analysis of lake water storage changes on the Tibetan Plateau using multi-mission satellite data. Remote Sens. Environ. 2013, 135, 25–35. [Google Scholar] [CrossRef]
- Crétaux, J.-F.; Birkett, C. Lake studies from satellite radar altimetry. C. R. Geosci. 2006, 338, 1098–1112. [Google Scholar] [CrossRef]
- Zhang, G.; Xie, H.; Kang, S.; Yi, D.; Ackley, S.F. Monitoring lake level changes on the Tibetan Plateau using ICESat altimetry data (2003–2009). Remote Sens. Environ. 2011, 115, 1733–1742. [Google Scholar] [CrossRef]
- Busker, T.; de Roo, A.; Gelati, E.; Schwatke, C.; Adamovic, M.; Bisselink, B.; Pekel, J.-F.; Cottam, A. A global lake and reservoir volume analysis using a surface water dataset and satellite altimetry. Hydrol. Earth Syst. Sci. 2019, 23, 669–690. [Google Scholar] [CrossRef] [Green Version]
- Abdalla, S.; Kolahchi, A.A.; Ablain, M.; Adusumilli, S.; Bhowmick, S.A.; Alou-Font, E.; Amarouche, L.; Andersen, O.B.; Antich, H.; Aouf, L. Altimetry for the future: Building on 25 years of progress. Adv. Space Res. 2021, 68, 319–363. [Google Scholar] [CrossRef]
- Da Silva, J.S.; Calmant, S.; Seyler, F.; Rotunno Filho, O.C.; Cochonneau, G.; Mansur, W.J. Water levels in the Amazon basin derived from the ERS 2 and ENVISAT radar altimetry missions. Remote Sens. Environ. 2010, 114, 2160–2181. [Google Scholar] [CrossRef]
- Alsdorf, D.; Birkett, C.; Dunne, T.; Melack, J.; Hess, L. Water level changes in a large Amazon lake measured with spaceborne radar interferometry and altimetry. Geophys. Res. Lett. 2001, 28, 2671–2674. [Google Scholar] [CrossRef]
- Zakharova, E.A.; Kouraev, A.V.; Rémy, F.; Zemtsov, V.A.; Kirpotin, S.N. Seasonal variability of the Western Siberia wetlands from satellite radar altimetry. J. Hydrol. 2014, 512, 366–378. [Google Scholar] [CrossRef]
- Yang, Y.; Moore, P.; Li, Z.; Li, F. Lake Level Change from Satellite Altimetry Over Seasonally Ice-Covered Lakes in the Mackenzie River Basin. IEEE Trans. Geosci. Remote Sens. 2020, 59, 8143–8152. [Google Scholar] [CrossRef]
- Chen, T.; Song, C.; Ke, L.; Wang, J.; Liu, K.; Wu, Q. Estimating seasonal water budgets in global lakes by using multi-source remote sensing measurements. J. Hydrol. 2021, 593, 125781. [Google Scholar] [CrossRef]
- Shu, S.; Liu, H.; Beck, R.A.; Frappart, F.; Korhonen, J.; Xu, M.; Yang, B.; Hinkel, K.M.; Huang, Y.; Yu, B. Analysis of Sentinel-3 SAR altimetry waveform retracking algorithms for deriving temporally consistent water levels over ice-covered lakes. Remote Sens. Environ. 2020, 239, 111643. [Google Scholar] [CrossRef]
- Lawrence, I.R.; Armitage, T.W.; Tsamados, M.C.; Stroeve, J.C.; Dinardo, S.; Ridout, A.L.; Muir, A.; Tilling, R.L.; Shepherd, A. Extending the Arctic sea ice freeboard and sea level record with the Sentinel-3 radar altimeters. Adv. Space Res. 2021, 68, 711–723. [Google Scholar] [CrossRef]
- Zhang, X.; Jiang, L.; Kittel, C.M.; Yao, Z.; Nielsen, K.; Liu, Z.; Wang, R.; Liu, J.; Andersen, O.B.; Bauer-Gottwein, P. On the performance of Sentinel-3 altimetry over new reservoirs: Approaches to determine onboard a priori elevation. Geophys. Res. Lett. 2020, 47, e2020GL088770. [Google Scholar] [CrossRef]
- Taburet, N.; Zawadzki, L.; Vayre, M.; Blumstein, D.; Le Gac, S.; Boy, F.; Raynal, M.; Labroue, S.; Crétaux, J.-F.; Femenias, P. S3MPC: Improvement on inland water tracking and water level monitoring from the OLTC onboard Sentinel-3 altimeters. Remote Sens. 2020, 12, 3055. [Google Scholar] [CrossRef]
- Shu, S.; Liu, H.; Frappart, F.; Huang, Y.; Wang, S.; Hinkel, K.M.; Beck, R.A.; Yu, B.; Jones, B.M.; Arp, C.D. Estimation of snow accumulation over frozen Arctic lakes using repeat ICESat laser altimetry observations—A case study in northern Alaska. Remote Sens. Environ. 2018, 216, 529–543. [Google Scholar] [CrossRef]
- Song, C.; Sheng, Y.; Ke, L.; Nie, Y.; Wang, J. Glacial lake evolution in the southeastern Tibetan Plateau and the cause of rapid expansion of proglacial lakes linked to glacial-hydrogeomorphic processes. J. Hydrol. 2016, 540, 504–514. [Google Scholar] [CrossRef] [Green Version]
- Song, C.; Sheng, Y. Contrasting evolution patterns between glacier-fed and non-glacier-fed lakes in the Tanggula Mountains and climate cause analysis. Clim. Chang. 2016, 135, 493–507. [Google Scholar] [CrossRef]
- Yi, S.; Wang, Q.; Chang, L.; Sun, W.J.R.S. Changes in mountain glaciers, lake levels, and snow coverage in the Tianshan monitored by GRACE, ICESat, altimetry, and MODIS. Remote Sens. 2016, 8, 798. [Google Scholar] [CrossRef] [Green Version]
- Neumann, T.; Brenner, A.; Hancock, D.; Robbins, J.; Saba, J.; Harbeck, K.; Gibbons, A.; Lee, J.; Luthcke, S.; Rebold, T. ATLAS/ICESat-2 L2A Global Geolocated Photon Data, Version 3; NASA National Snow and Ice Data Center Distributed Active Archive Center: Boulder, CO, USA, 2020. [Google Scholar]
- Yuan, C.; Gong, P.; Bai, Y. Performance assessment of ICESat-2 laser altimeter data for water-level measurement over lakes and reservoirs in China. Remote Sens. 2020, 12, 770. [Google Scholar] [CrossRef] [Green Version]
- Madson, A.; Sheng, Y. Automated Water Level Monitoring at the Continental Scale from ICESat-2 Photons. Remote Sens. 2021, 13, 3631. [Google Scholar] [CrossRef]
- Ryan, J.C.; Smith, L.C.; Cooley, S.W.; Pitcher, L.H.; Pavelsky, T.M. Global characterization of inland water reservoirs using ICESat-2 altimetry and climate reanalysis. Geophys. Res. Lett. 2020, 47, e2020GL088543. [Google Scholar] [CrossRef]
- Cooley, S.W.; Ryan, J.C.; Smith, L.C. Human alteration of global surface water storage variability. Nature 2021, 591, 78–81. [Google Scholar] [CrossRef]
- Feng, Y.; Zhang, H.; Tao, S.; Ao, Z.; Song, C.; Chave, J.; Le Toan, T.; Xue, B.; Zhu, J.; Pan, J. Decadal Lake Volume Changes (2003–2020) and Driving Forces at a Global Scale. Remote Sens. 2022, 14, 1032. [Google Scholar] [CrossRef]
- Luo, S.; Song, C.; Ke, L.; Zhan, P.; Fan, C.; Liu, K.; Chen, T.; Wang, J.; Zhu, J. Satellite laser altimetry reveals a net water mass gain in global lakes with spatial heterogeneity in the early 21st century. Geophys. Res. Lett. 2022, 49, e2021GL096676. [Google Scholar] [CrossRef]
- Xu, N.; Ma, Y.; Wei, Z.; Huang, C.; Li, G.; Zheng, H.; Wang, X.H. Satellite observed recent rising water levels of global lakes and reservoirs. Environ. Res. Lett. 2022, 17, 074013. [Google Scholar] [CrossRef]
- Xu, N.; Zheng, H.; Ma, Y.; Yang, J.; Liu, X.; Wang, X. Global estimation and assessment of monthly lake/reservoir water level changes using ICESat-2 ATL13 Products. Remote Sens. 2021, 13, 2744. [Google Scholar] [CrossRef]
- Neumann, T.A.; Martino, A.J.; Markus, T.; Bae, S.; Bock, M.R.; Brenner, A.C.; Brunt, K.M.; Cavanaugh, J.; Fernandes, S.T.; Hancock, D.W. The Ice, Cloud, and Land Elevation Satellite–2 Mission: A global geolocated photon product derived from the advanced topographic laser altimeter system. Remote Sens. Environ. 2019, 233, 111325. [Google Scholar] [CrossRef] [PubMed]
- Jasinski, M.; Stoll, J.; Hancock, D.; Robbins, J.; Nattala, J.; Morison, J.; Jones, B.; Ondrusek, M.; Pavelsky, T.; Parrish, C. Algorithm Theoretical Basis Document (ATBD) for along Track Inland Surface Water Data, Release 004. 2021; Goddard Space Flight Center: Greenbelt, MD, USA, 2021.
- Schwatke, C.; Dettmering, D.; Bosch, W.; Seitz, F. DAHITI—An innovative approach for estimating water level time series over inland waters using multi-mission satellite altimetry. Hydrol. Earth Syst. Sci. 2015, 19, 4345–4364. [Google Scholar] [CrossRef] [Green Version]
- Setiawan, B. A simple method to determine patterns of wet and dry seasons. In Proceedings of the IOP Conference Series: Earth and Environmental Science; IOP Publishing: Bristol, UK, 2020; p. 12055. [Google Scholar]
- Schindler, D.W.; Smol, J.P. Cumulative effects of climate warming and other human activities on freshwaters of Arctic and subarctic North America. AMBIO J. Hum. Environ. 2006, 35, 160–168. [Google Scholar] [CrossRef]
- Mueller, D.R.; Van Hove, P.; Antoniades, D.; Jeffries, M.O.; Vincent, W.F. High Arctic lakes as sentinel ecosystems: Cascading regime shifts in climate, ice cover, and mixing. Limnol. Oceanogr. 2009, 54, 2371–2385. [Google Scholar] [CrossRef]
- Urabe, A.; Tateishi, M.; Inouchi, Y.; Matsuoka, H.; Inoue, T.; Dmytriev, A.; Khlystov, O.M. Lake-level changes during the past 100,000 years at Lake Baikal, southern Siberia. Quat. Res. 2004, 62, 214–222. [Google Scholar] [CrossRef]
- Juschus, O.; Pavlov, M.; Schwamborn, G.; Preusser, F.; Fedorov, G.; Melles, M. Late Quaternary lake-level changes of Lake El’gygytgyn, NE Siberia. Quat. Res. 2011, 76, 441–451. [Google Scholar] [CrossRef] [Green Version]
- Rémy, F.; Parouty, S. Antarctic ice sheet and radar altimetry: A review. Remote Sens. 2009, 1, 1212–1239. [Google Scholar] [CrossRef]
- Quartly, G.D.; Chen, G.; Nencioli, F.; Morrow, R.; Picot, N. An overview of requirements, procedures and current advances in the calibration/validation of radar altimeters. Remote Sens. 2021, 13, 125. [Google Scholar] [CrossRef]
- Birkett, C.M.; Beckley, B. Investigating the performance of the Jason-2/OSTM radar altimeter over lakes and reservoirs. Mar. Geod. 2010, 33, 204–238. [Google Scholar] [CrossRef]
- Adam, J.C.; Hamlet, A.F.; Lettenmaier, D.P. Implications of global climate change for snowmelt hydrology in the twenty-first century. Hydrol. Process. Int. J. 2009, 23, 962–972. [Google Scholar] [CrossRef]
- Laurent, L.; Buoncristiani, J.F.; Pohl, B.; Zekollari, H.; Farinotti, D.; Huss, M.; Mugnier, J.L.; Pergaud, J. The impact of climate change and glacier mass loss on the hydrology in the Mont-Blanc massif. Sci. Rep. 2020, 10, 10420. [Google Scholar] [CrossRef]
- Day, C.A. Modelling impacts of climate change on snowmelt runoff generation and streamflow across western US mountain basins: A review of techniques and applications for water resource management. Prog. Phys. Geog. 2009, 33, 614–633. [Google Scholar] [CrossRef]
- Pederson, G.T.; Gray, S.T.; Ault, T.; Marsh, W.; Fagre, D.B.; Bunn, A.G.; Graumlich, L.J. Climatic controls on the snowmelt hydrology of the northern Rocky Mountains. J. Clim. 2011, 24, 1666–1687. [Google Scholar] [CrossRef]
- Zona, D.; Lafleur, P.M.; Hufkens, K.; Bailey, B.; Gioli, B.; Burba, G.; Oechel, W.C. Earlier snowmelt may lead to late season declines in plant productivity and carbon sequestration in Arctic tundra ecosystems. Sci. Rep. 2022, 12, 3986. [Google Scholar]
- Casson, D.R.; Werner, M.; Weerts, A.; Solomatine, D. Global re-analysis datasets to improve hydrological assessment and snow water equivalent estimation in a sub-Arctic watershed. Hydrol. Earth Syst. Sci. 2018, 22, 4685–4697. [Google Scholar] [CrossRef] [Green Version]
- Luo, S.; Song, C.; Zhan, P.; Liu, K.; Chen, T.; Li, W.; Ke, L. Refined estimation of lake water level and storage changes on the Tibetan Plateau from ICESat/ICESat-2. Catena 2021, 200, 105177. [Google Scholar] [CrossRef]
- Zhang, G.; Chen, W.; Xie, H. Tibetan Plateau’s lake level and volume changes from NASA’s ICESat/ICESat-2 and Landsat Missions. Geophys. Res. Lett. 2019, 46, 13107–13118. [Google Scholar] [CrossRef]
- Dandabathula, G.; Verma, M.; Satyanarayana, P.; Rao, S.S. Evaluation of ICESat-2 ATL08 data product: Performance assessment in inland water. EJ-GEO 2020, 1. [Google Scholar] [CrossRef]
- Dandabathula, G.; Rao, S.S. Validation of ICESat-2 surface water level product ATL13 with near real time gauge data. Hydrology 2020, 8, 19–25. [Google Scholar] [CrossRef]
- Narin, O.G.; Abdikan, S. Multi-temporal analysis of inland water level change using ICESat-2 ATL-13 data in lakes and dams. Environ. Sci. Pollut. R 2022, 1–13. [Google Scholar] [CrossRef]
- Fricker, H.A.; Arndt, P.; Brunt, K.M.; Datta, R.T.; Fair, Z.; Jasinski, M.F.; Wouters, B. ICESat-2 Meltwater Depth Estimates: Application to Surface Melt on Amery Ice Shelf, East Antarctica. Geophys. Res. Lett. 2021, 48, e2020GL090550. [Google Scholar] [CrossRef]
- Fan, Y.; Hao, W.; Zhang, B.; Ma, C.; Gao, S.; Shen, X.; Li, F. Monitoring the Hydrological Activities of Antarctic Subglacial Lakes Using CryoSat-2 and ICESat-2 Altimetry Data. Remote Sens. 2022, 14, 898. [Google Scholar] [CrossRef]
Figure 1.
Global distribution of pan-Arctic lakes observed by the ICESat-2 in the HydroLAKES database. The right panel shows the number of observed lakes from different size groups in the Eastern and Western Hemispheres (NA and EURA).
Figure 1.
Global distribution of pan-Arctic lakes observed by the ICESat-2 in the HydroLAKES database. The right panel shows the number of observed lakes from different size groups in the Eastern and Western Hemispheres (NA and EURA).

Figure 2.
Spatial distribution of unobserved lakes by the ICESat-2 in the HydroLAKES database.
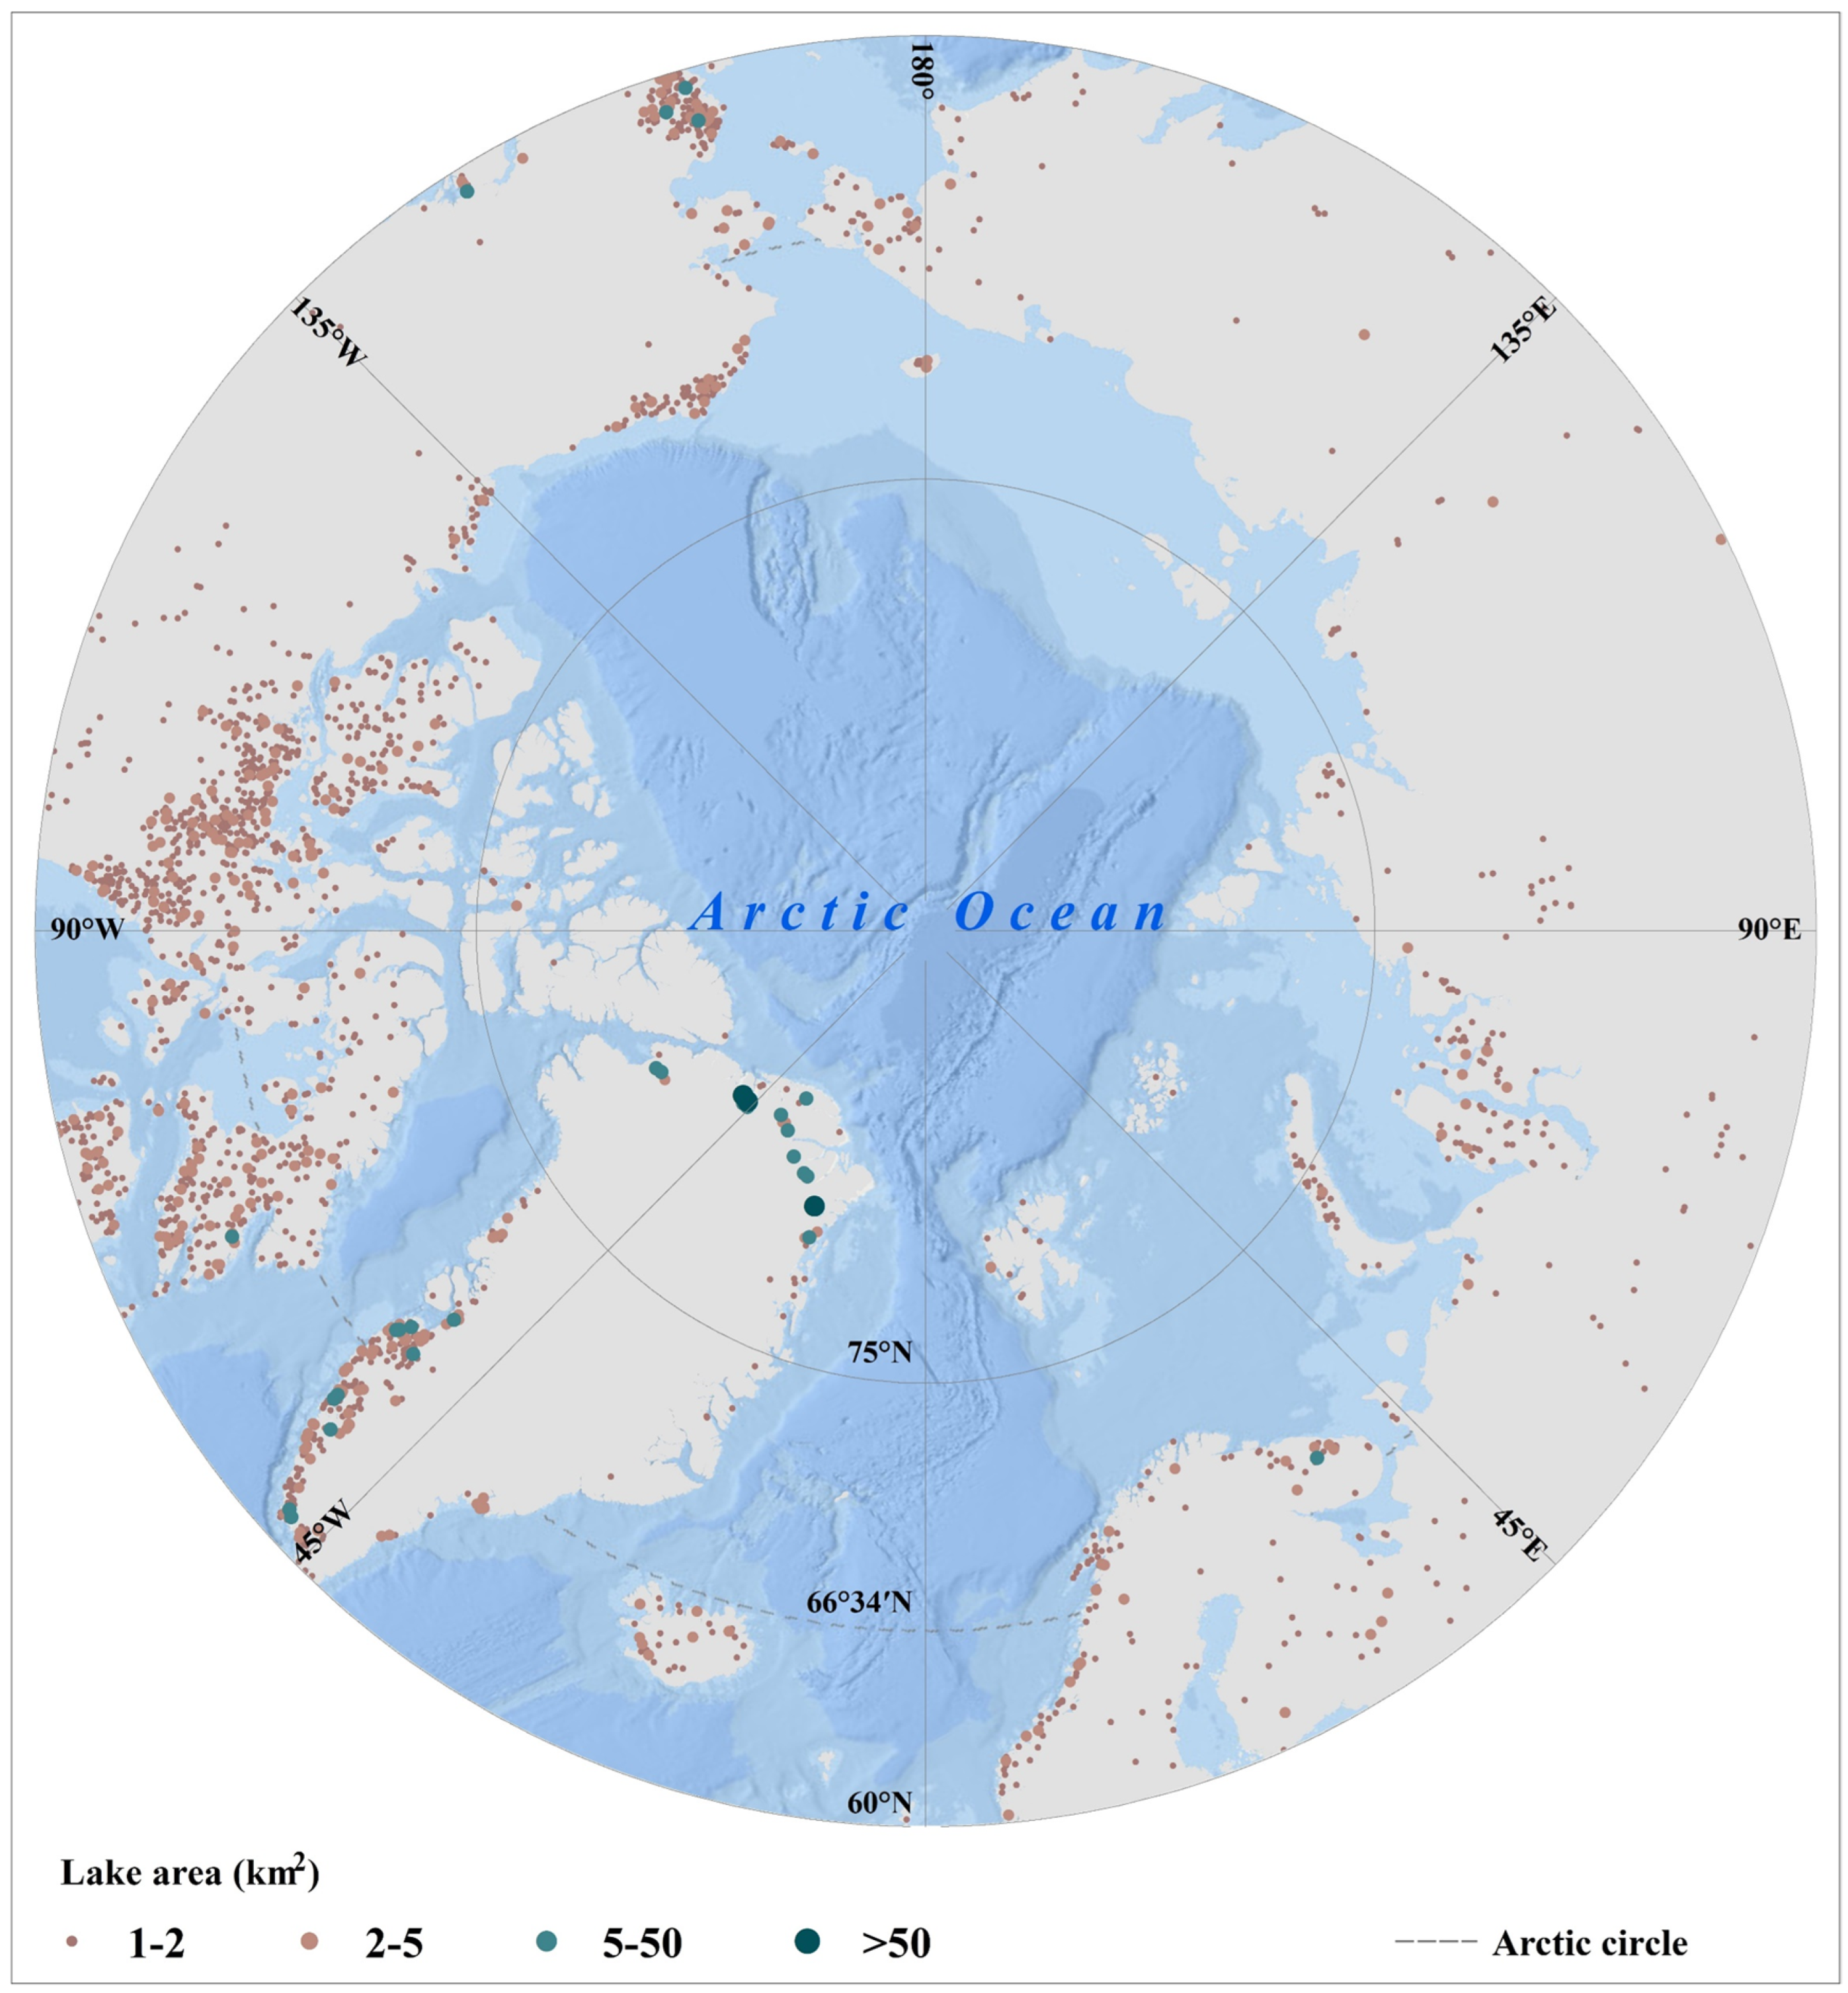
Figure 3.
Spatial patterns of observed lakes with annual number of observations.
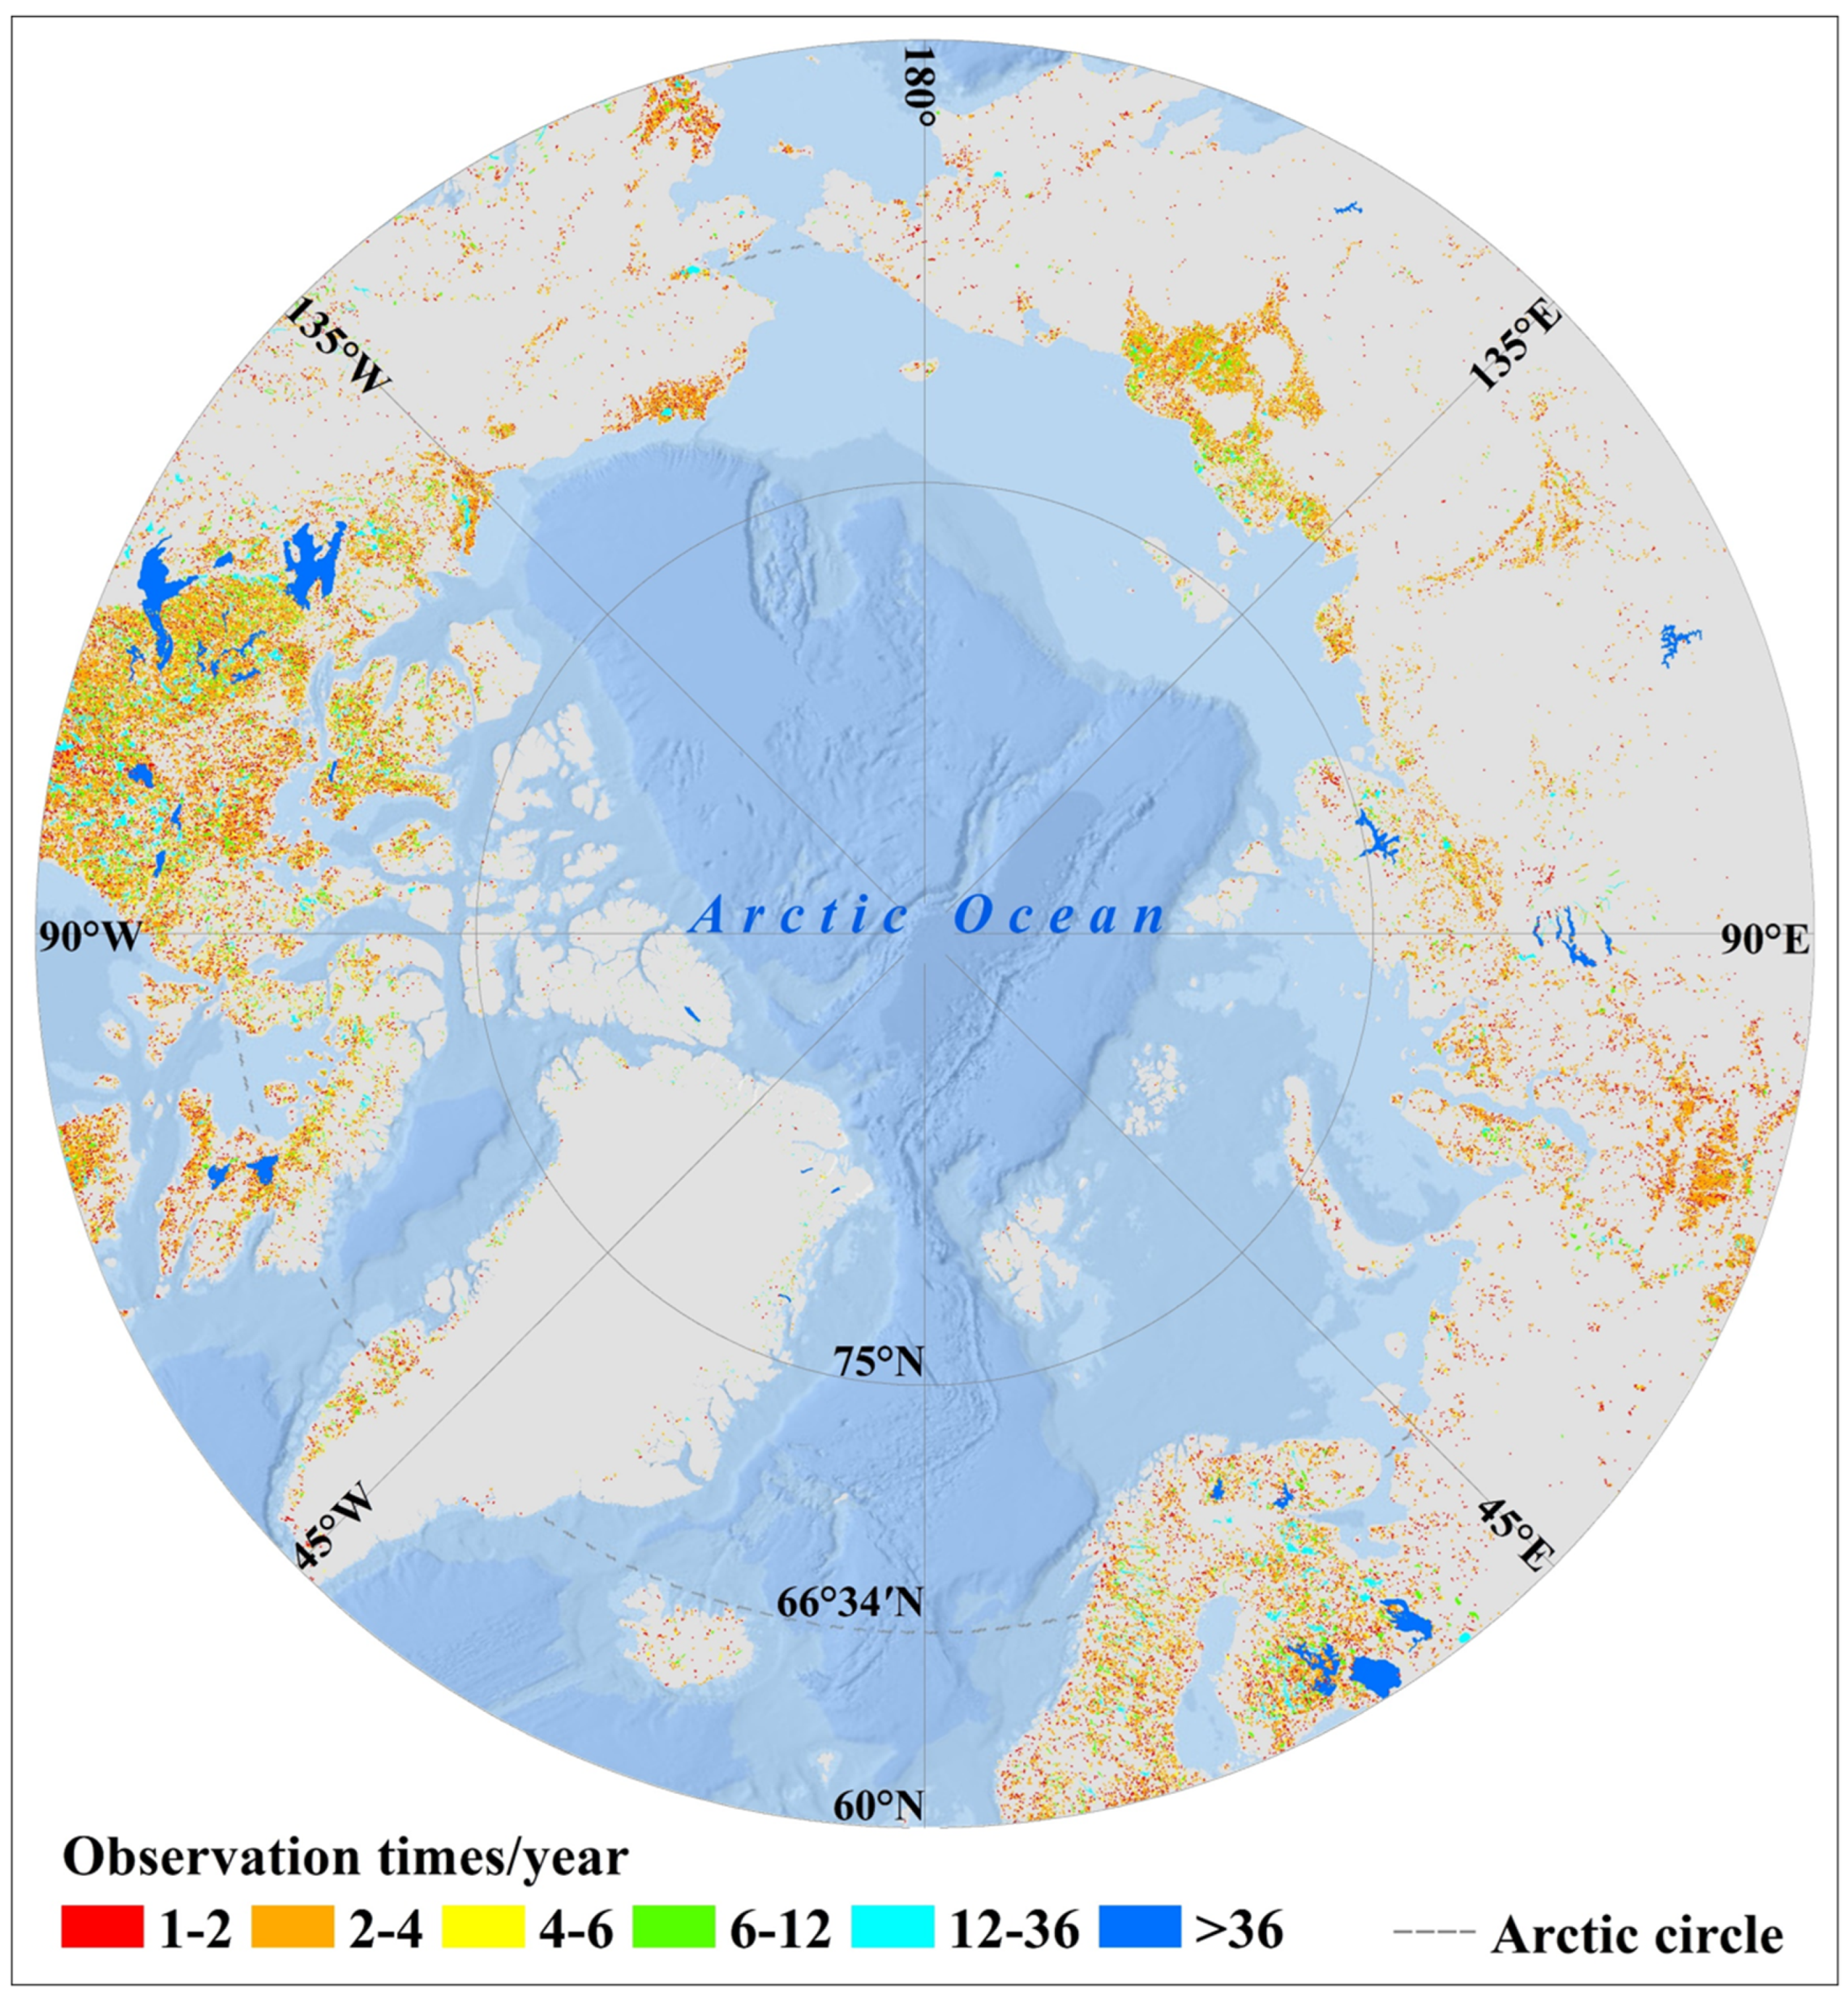
Figure 4.
Spatial patterns of observed lakes with seasonal coverage patterns.
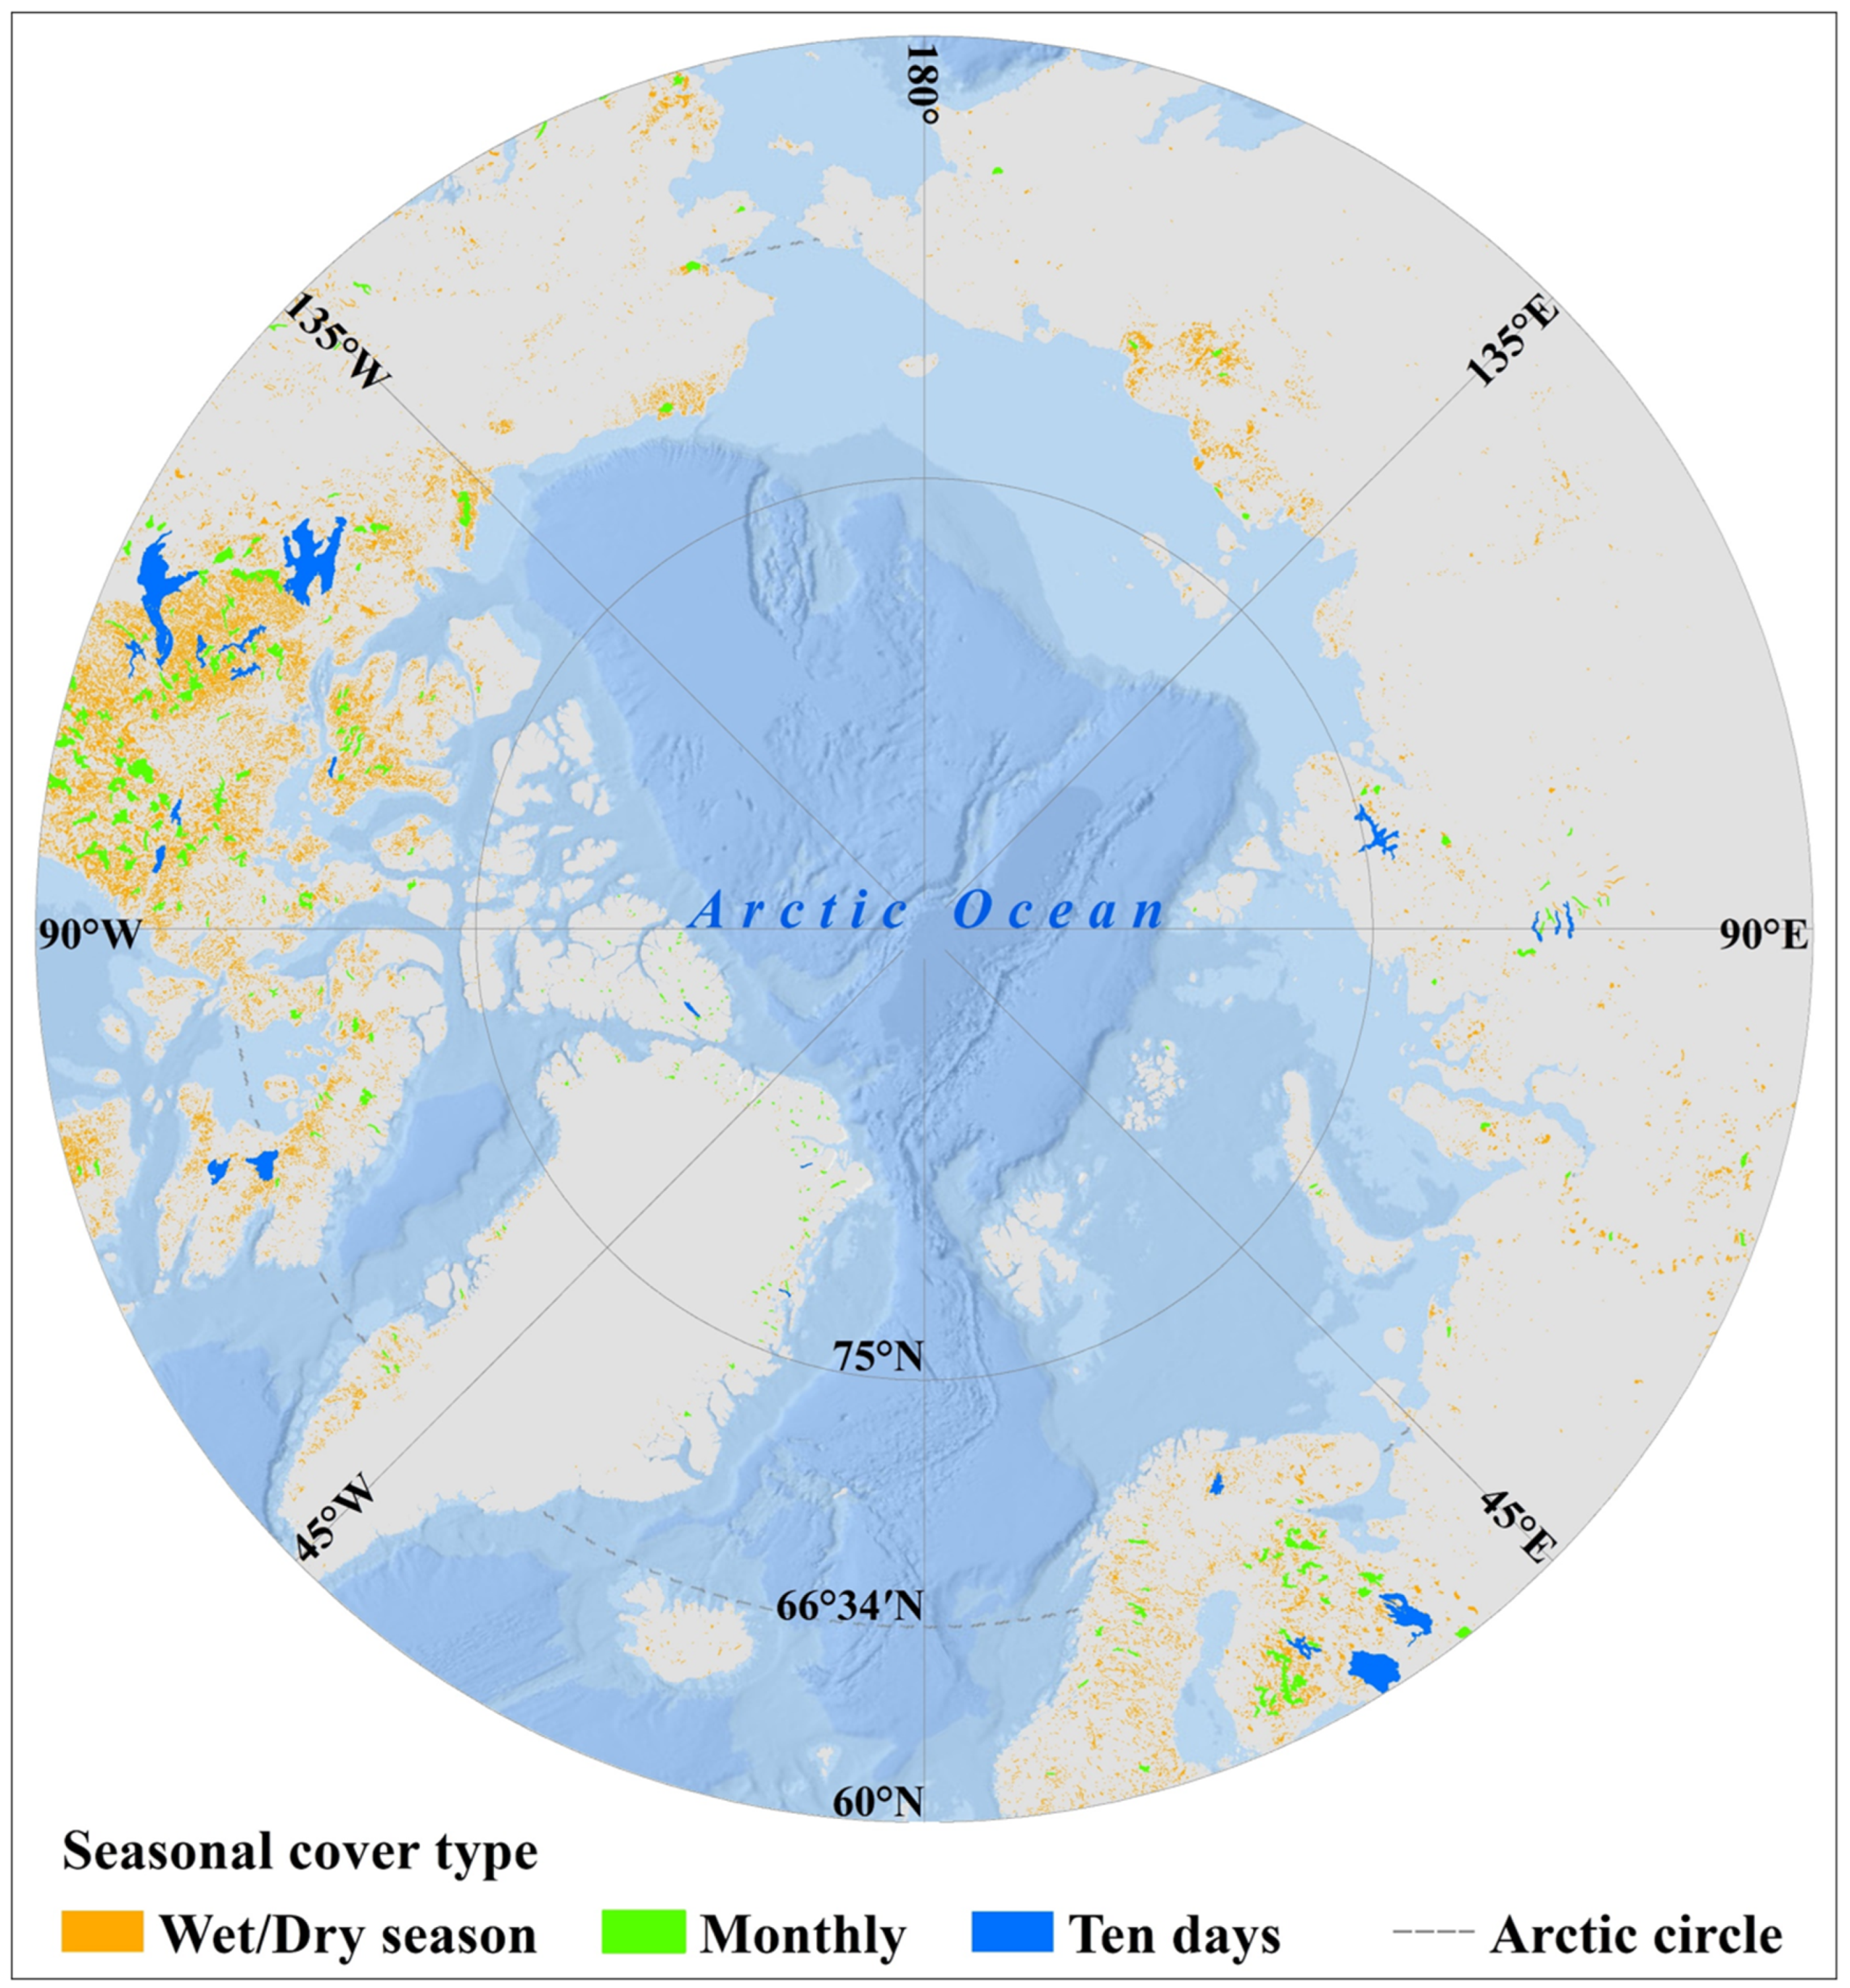
Figure 5.
Fishnet-based spatial patterns of seasonal water level variability within three years of observation by the ICESat-2. (a) shows the SWL change patterns. (b) shows the SWL range patterns. (c) shows the standard deviation (STD) patterns of the SWL.
Figure 5.
Fishnet-based spatial patterns of seasonal water level variability within three years of observation by the ICESat-2. (a) shows the SWL change patterns. (b) shows the SWL range patterns. (c) shows the standard deviation (STD) patterns of the SWL.
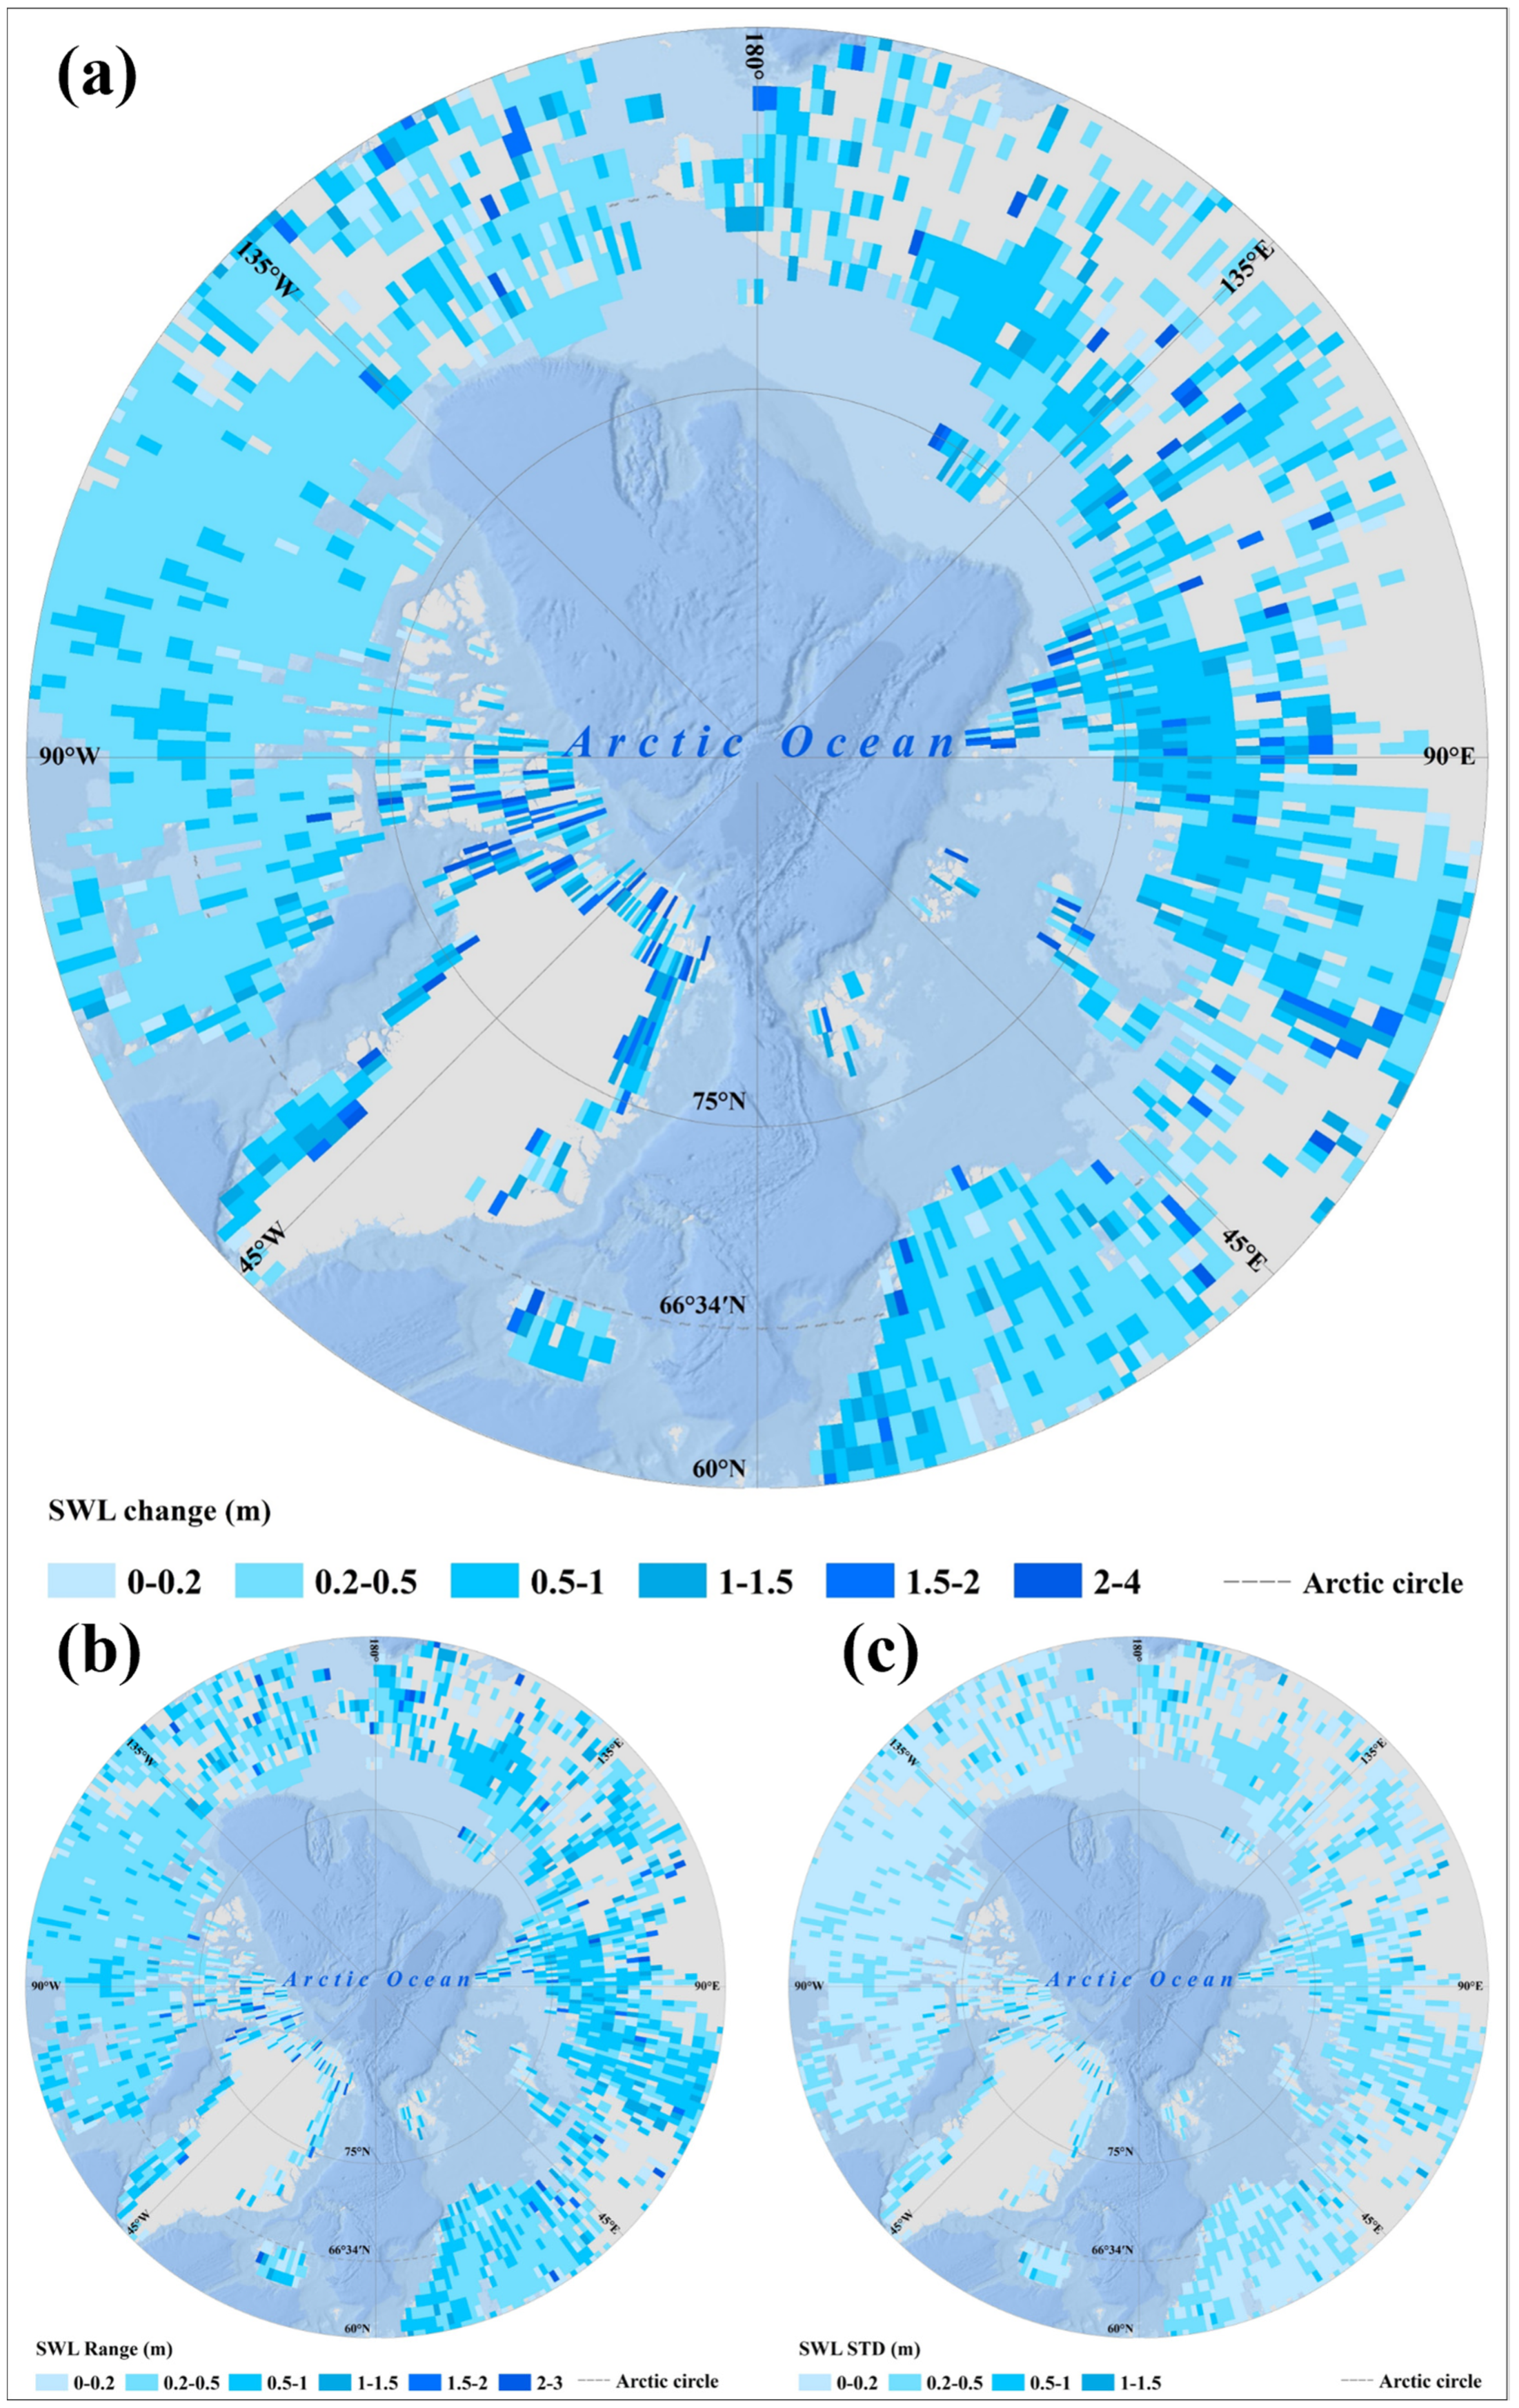
Figure 6.
Boxplot of seasonal water level amplitudes for lakes of different sizes. The horizontal line in the box represents the median SWL variation over the three years. The upper and lower limits of the box represent the range of SWL variation. Scatters are outliers for each box, and the number of outliers accounts for 20%, 20%, 17%, 24%, 23%, and l4%, respectively (the total number of lakes in each group is shown in Table 2).
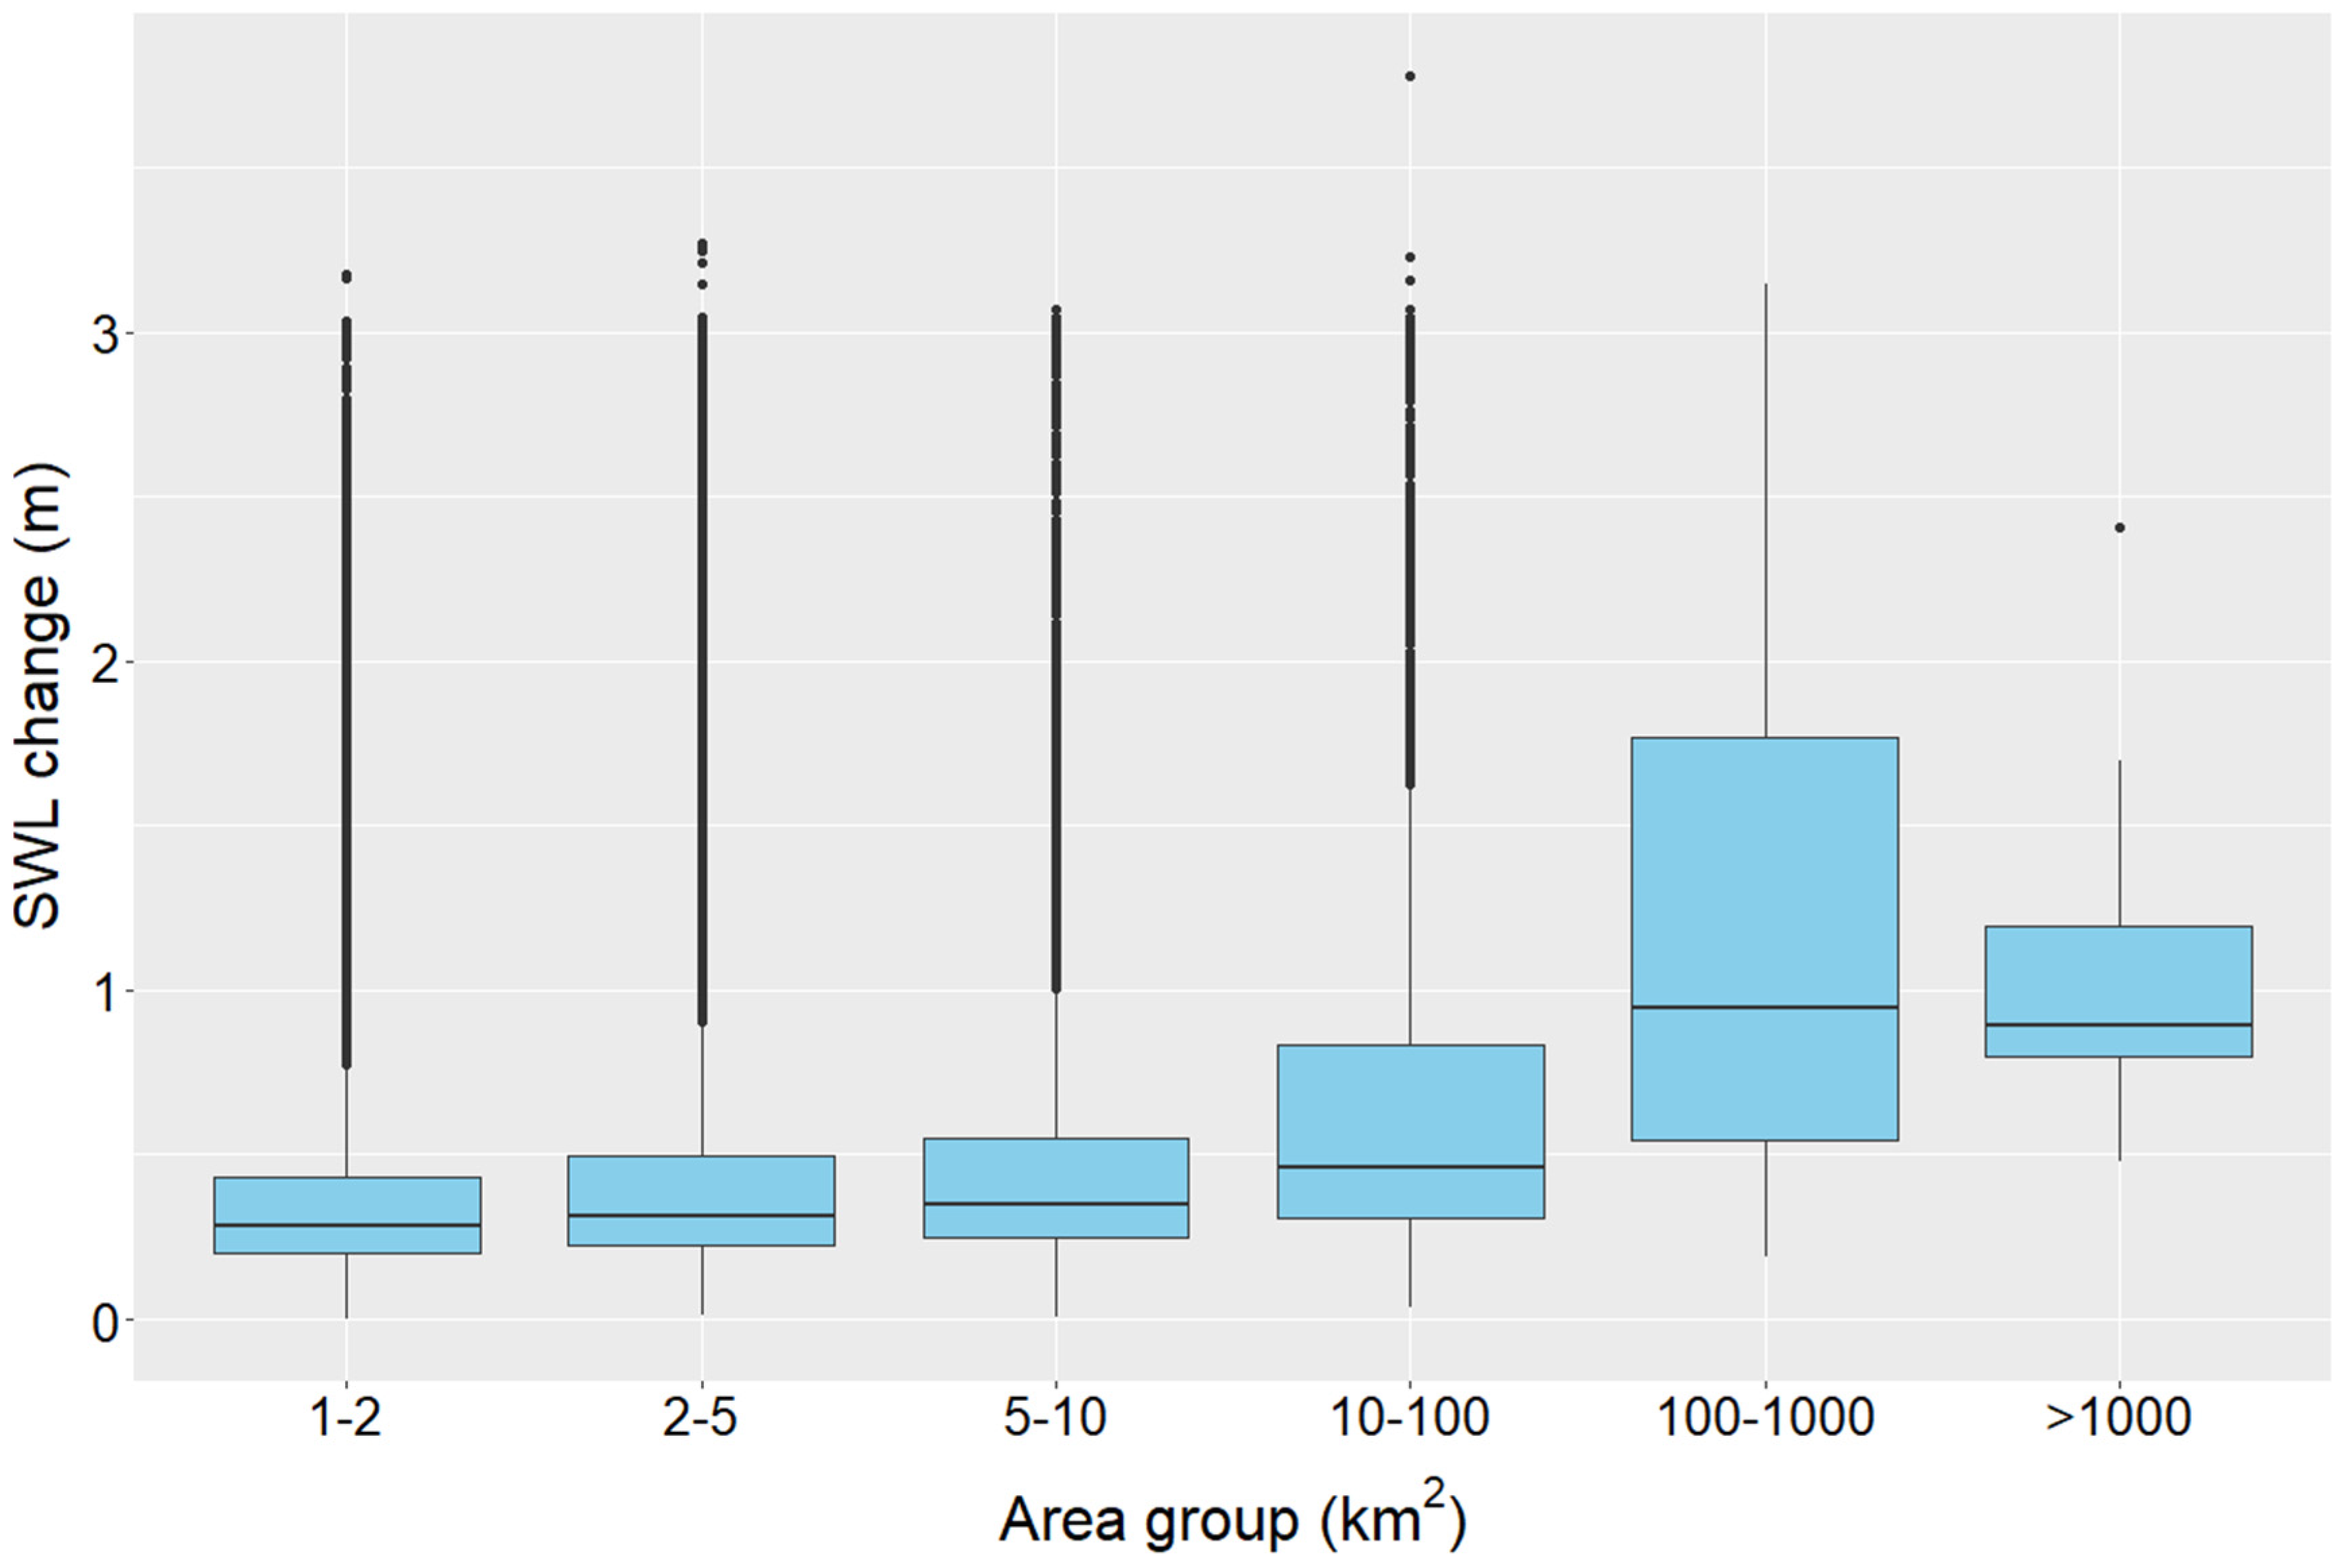
Figure 7.
SWL change in pan-Arctic lakes in the North American continent and Eurasian continent along the latitudinal.
Figure 7.
SWL change in pan-Arctic lakes in the North American continent and Eurasian continent along the latitudinal.
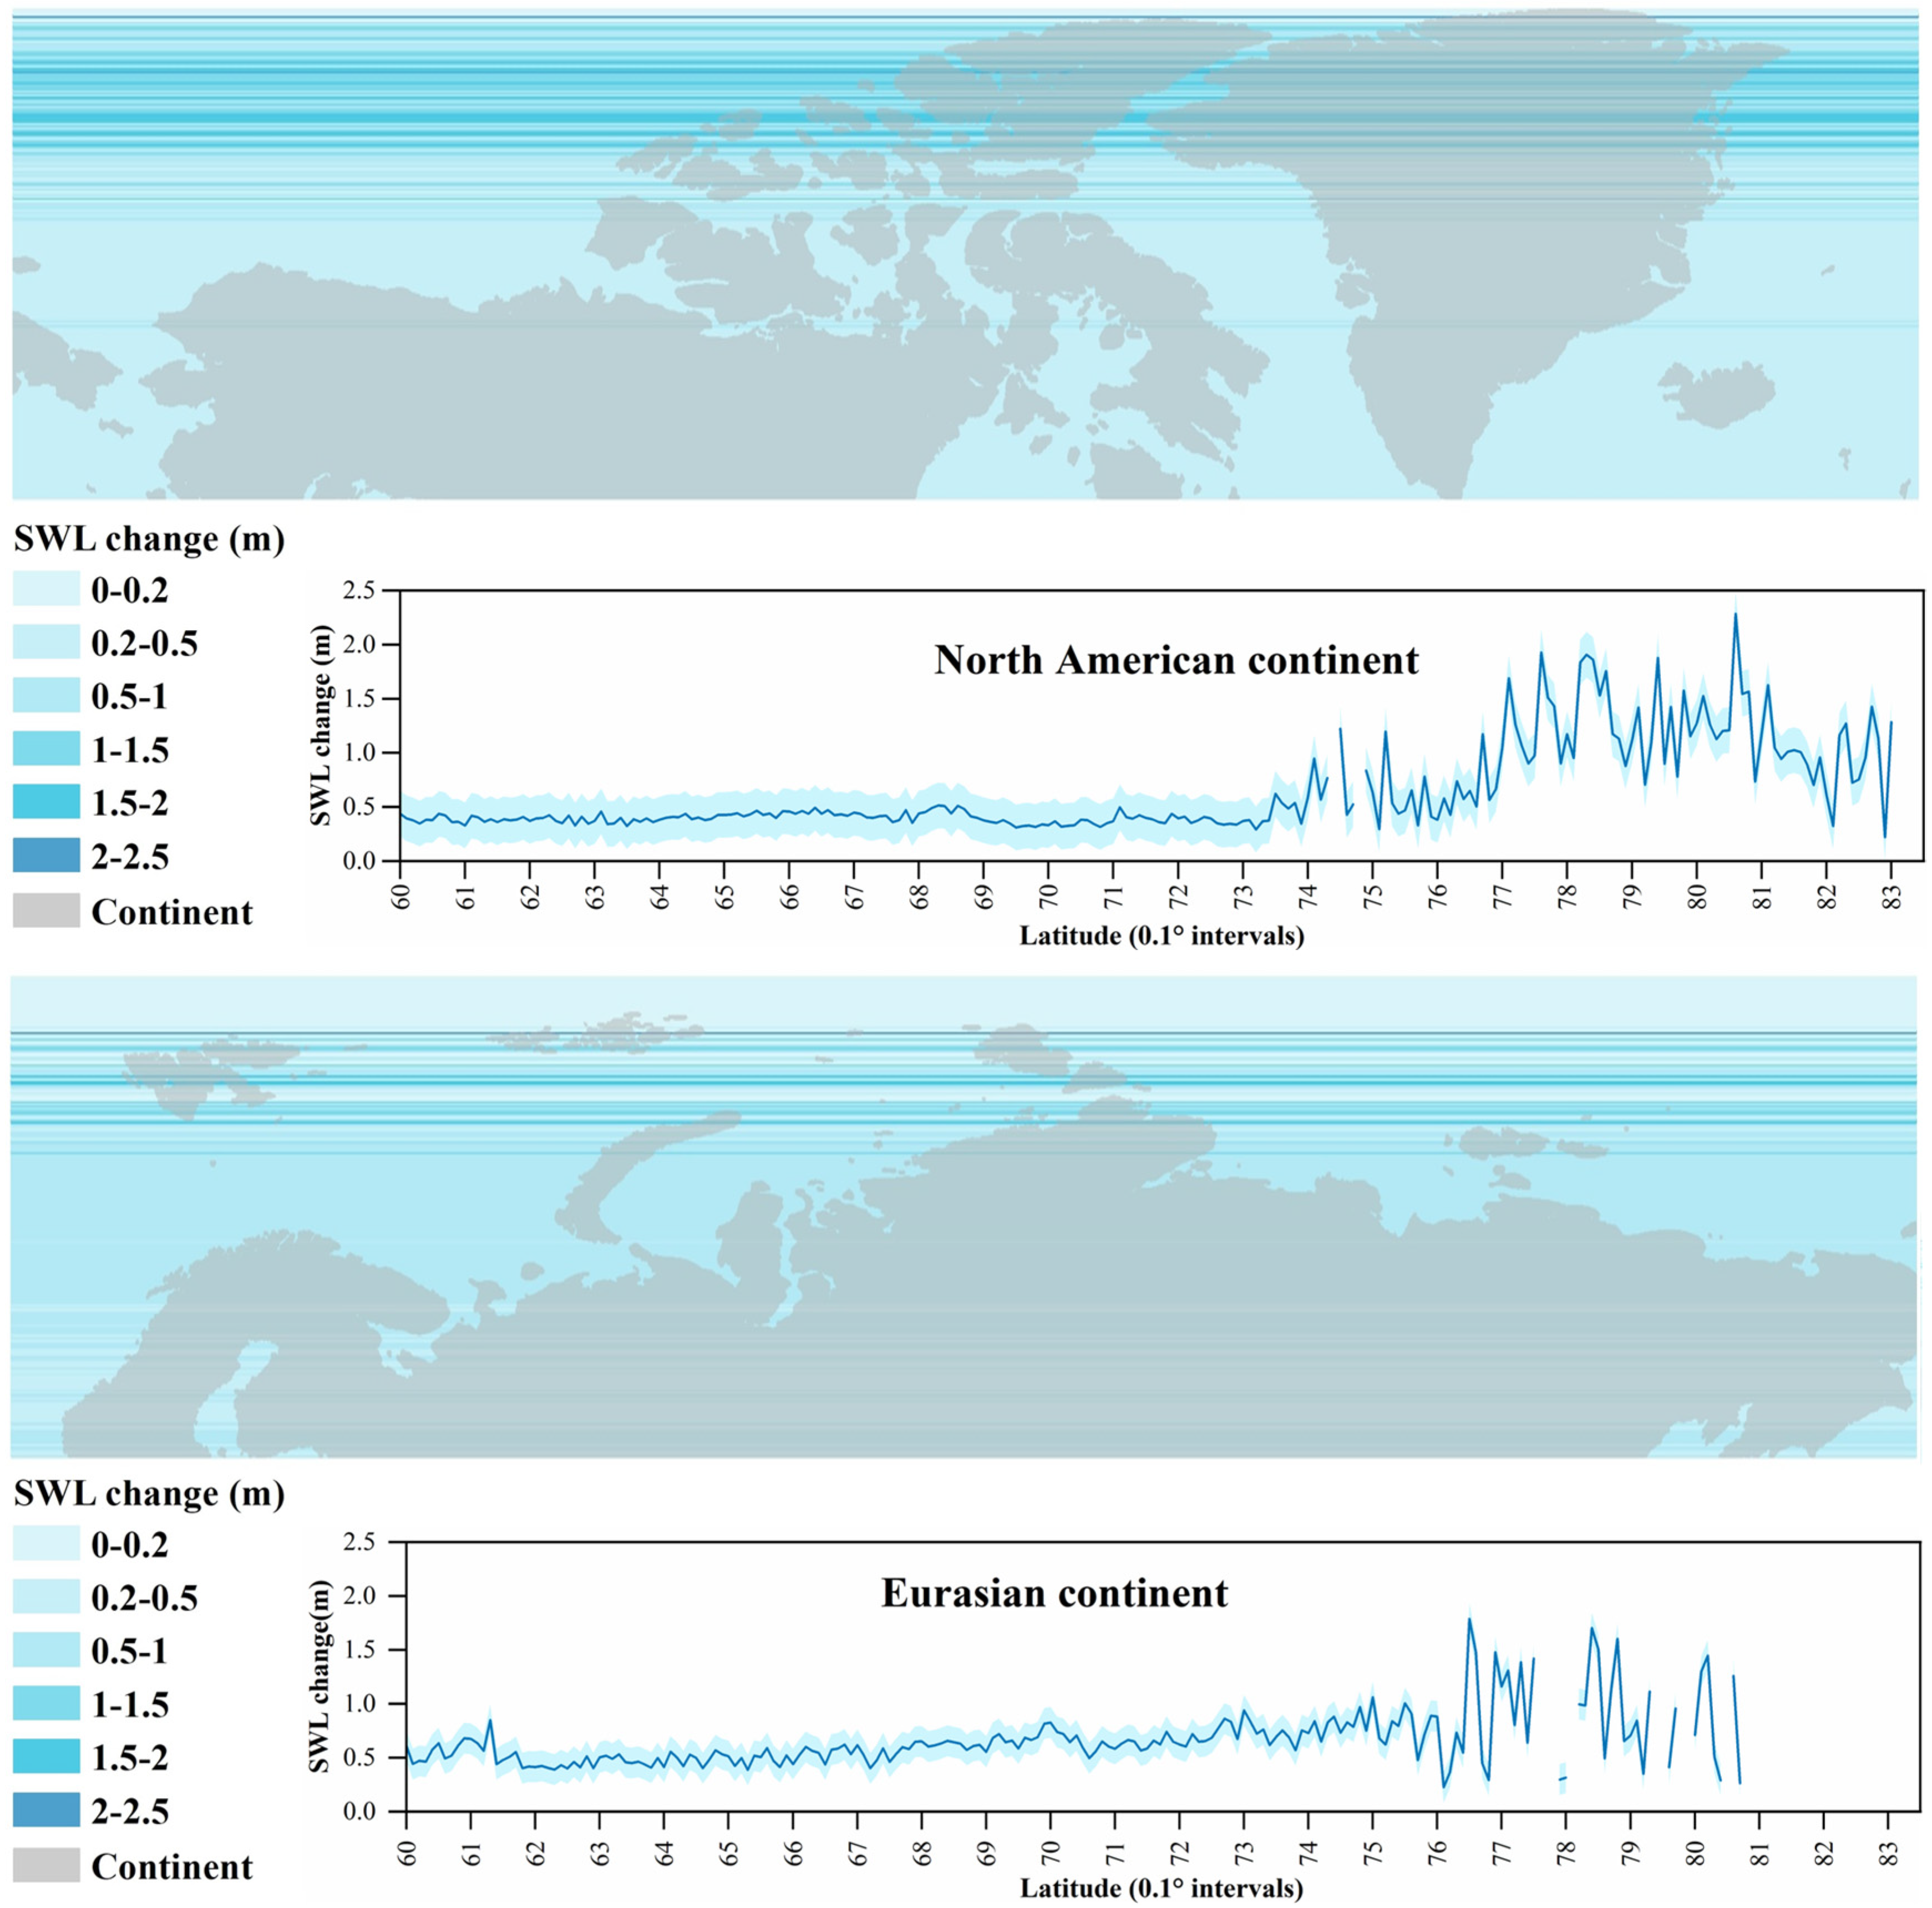
Figure 8.
Comparison of water levels from the ICESat-2 and radar altimeters, and gauge stations for four selected lakes (Great Bear Lake and Great Slave Lake in NA, Ladoga Lake, and Onega Lake in EURA) with long-time series ICESat-2 observations.
Figure 8.
Comparison of water levels from the ICESat-2 and radar altimeters, and gauge stations for four selected lakes (Great Bear Lake and Great Slave Lake in NA, Ladoga Lake, and Onega Lake in EURA) with long-time series ICESat-2 observations.

Figure 9.
Seasonal amplitudes of accumulated precipitation of the grid-based clusters in different SWL change areas. Black rhombuses are outliers in each SWL change group.
Figure 9.
Seasonal amplitudes of accumulated precipitation of the grid-based clusters in different SWL change areas. Black rhombuses are outliers in each SWL change group.


Table 1.
Three categories of temporal coverage patterns and combined criteria.
| Categories | Day | Month | Year |
|---|---|---|---|
| Wet/dry season | Obs. months/year ≥2 (interval >4) | 3/3 | |
| Monthly | Obs. months/year ≥11 | 3/3 | |
| Ten-day | Obs.1 days/ten-day ≥1 | Obs. months/year ≥11 | 3/3 |
1 Obs. is used to shorten observation.
Table 2.
Seasonal observation of lakes of different sizes.
| Area | Time Scale | Total | |||
|---|---|---|---|---|---|
| Non-Seasonal | Wet and Dry Seasons | Monthly | Ten-Day | ||
| 1–2 km2 | 27,925 | 15,454 | 6 | 43,385 | |
| 2–5 km2 | 10,632 | 14,094 | 27 | 24,753 | |
| 5–10 km2 | 1633 | 5477 | 29 | 7139 | |
| 10–100 km2 | 306 | 4624 | 109 | 5039 | |
| 100–1000 km2 | 196 | 145 | 9 | 350 | |
| >1000 km2 | 10 | 12 | 22 | ||
| Total | 40,496 | 39,845 | 326 | 21 | 80,688 |
Table 3.
SWL numerical statistics grouped by lake area.
| Area Threshold | SWL Change (m) | |||
|---|---|---|---|---|
| Median | Mean | Range | STD | |
| 1–2 km2 | 0.313 | 0.323 | 0.250 | 0.058 |
| 2–5 km2 | 0.335 | 0.349 | 0.260 | 0.069 |
| 5–10 km2 | 0.361 | 0.383 | 0.339 | 0.091 |
| 10–100 km2 | 0.494 | 0.519 | 0.499 | 0.126 |
| 100–1000 km2 | 0.938 | 1.050 | 1.202 | 0.350 |
| >1000 km2 | 0.907 | 0.985 | 0.451 | 0.156 |
Publisher’s Note: MDPI stays neutral with regard to jurisdictional claims in published maps and institutional affiliations. |
© 2022 by the authors. Licensee MDPI, Basel, Switzerland. This article is an open access article distributed under the terms and conditions of the Creative Commons Attribution (CC BY) license (https://creativecommons.org/licenses/by/4.0/).
Share and Cite
MDPI and ACS Style
Chen, T.; Song, C.; Zhan, P.; Ma, J. How Many Pan-Arctic Lakes Are Observed by ICESat-2 in Space and Time? Remote Sens. 2022, 14, 5971. https://doi.org/10.3390/rs14235971
AMA Style
Chen T, Song C, Zhan P, Ma J. How Many Pan-Arctic Lakes Are Observed by ICESat-2 in Space and Time? Remote Sensing. 2022; 14(23):5971. https://doi.org/10.3390/rs14235971
Chicago/Turabian StyleChen, Tan, Chunqiao Song, Pengfei Zhan, and Jinsong Ma. 2022. "How Many Pan-Arctic Lakes Are Observed by ICESat-2 in Space and Time?" Remote Sensing 14, no. 23: 5971. https://doi.org/10.3390/rs14235971
Note that from the first issue of 2016, this journal uses article numbers instead of page numbers. See further details here.