


Increasing Global Flood Risk in 2005–2020 from a Multi-Scale Perspective
by
 ,
,
Yu Duan
1,
Junnan Xiong
1,2,*,
Weiming Cheng
2,3,
Yi Li
4,
Nan Wang
5,
Gaoyun Shen
1 and
Jiawei Yang
1 1
School of Civil Engineering and Geomatics, Southwest Petroleum University, Chengdu 610500, China
2
State Key Laboratory of Resources and Environmental Information System, Institute of Geographic Sciences and Natural Resources Research, CAS, Beijing 100101, China
3
University of Chinese Academy of Sciences, Beijing 100049, China
4
Aerospace Information Research Institute, Chinese Academy of Sciences, Beijing 100094, China
5
School of Geographical Sciences, Northeast Normal University, Changchun 130024, China
*
Author to whom correspondence should be addressed.
Remote Sens. 2022, 14(21), 5551; https://doi.org/10.3390/rs14215551
Submission received: 9 October 2022
/
Revised: 29 October 2022
/
Accepted: 2 November 2022
/
Published: 3 November 2022
(This article belongs to the Special Issue Remote Sensing Analysis for Flood Risk)
Abstract
:In the context of global climate change, floods have become one of the major natural disasters affecting the safety of human life, economic construction, and sustainable development. Despite significant improvements in flood risk and exposure modeling in some studies, there is still a lack of evidence on the spatiotemporal distribution patterns associated with flood risk across the globe. Meanwhile, numerous studies mostly explore flood risk distribution patterns based on specific spatial scales, ignoring to some extent the fact that flood risk has different distribution patterns on different scales. Here, on the basis of hazard–vulnerability components quantified using game theory (GT), we proposed a framework for analyzing the spatiotemporal distribution patterns of global flood risk and the influencing factors behind them on multiple scales. The results revealed that global flood risk increased during 2005–2020, with the percentages of high-risk areas being 4.3%, 4.48%, 4.6%, and 5.02%, respectively. There were 11 global risk hotspots, mainly located in areas with high population concentration, high economic density, abundant precipitation, and low elevation. On the national scale, high-risk countries were mainly concentrated in East Asia, South Asia, Central Europe, and Western Europe. In our experiment, developed countries accounted for the majority of the 20 highest risk countries in the world, with Singapore being the highest risk country and El Salvador having the highest positive risk growth rate (growing by 19.05% during 2015–2020). The findings of this study offer much-needed information and reference for academics researching flood risk under climate change.
1. Introduction
Floods have become a global issue affecting most parts of the world and are one of the most serious natural disasters worldwide. Over the past 40 years, flood events are estimated to have caused damages worth more than 1 trillion USD, while in the past 20 years, floods influenced more than 1.65 billion individuals [1]. Studies show that in recent years, floods occurred more often than other natural hazards, such as earthquakes, extreme precipitation, and droughts [2,3], and floods have become one of the major disasters affecting people’s lives and property all over the world [4]. In fact, in the context of a warming climate and thus the intensifying of the hydrological cycle [5,6], the global flood risk may increase in the future [7,8]. For instance, studies show that even under an optimistic climate change scenario, the sea levels is expected to rise by 0.55 m by 2100, putting coastal cities, particularly large ones, at risk [9]. By 2100, the flood frequency is likely to increase significantly in Southeast Asia, East and Central Africa, and much of Latin America [10]. In response to the growing challenge of flooding, a framework from Sendai Framework for Disaster Risk Reduction 2015–2030 (SFDRR) was presented that aims to significantly decrease disaster risk and prevent serious loss of life, livelihood, and health [11]. Meanwhile, investments in flood management and prevention can reduce disaster-related mortality and property damage [12,13]. However, only about 13% of disaster funding is spent on preparedness, mitigation, and adaptation [14].
Recognizing the serious impact of disasters on socio-economic development, many scholars have explored the distribution patterns of flood risk on different spatial scales. Especially, since the middle 2000s, there have been extensive attempts to identify the global flood risk [15], often using the latest data available at the time, such as high-resolution assets and populations, making risk assessments increasingly accurate [9]. Additionally, previous studies show that the risk mapping of floods is one of the effective methods and important tools to mitigate flood hazards [16,17] and is applied in numerous ways in disaster warning, engineering assessment, emergency response, disaster avoidance planning, and disaster assessment [18,19]. However, due to the availability of data and the great economic value of risk, current studies focus on national scales, without a comprehensive analysis of flood risk mechanisms, especially in high-income countries such as the EU [20] and the US [21]. In this situation, different strategies and measures have been proposed to cope with floods. To respond to flooding, some countries implement (sometimes controversial) retreat plans by acquiring assets situated in floodplain-exposed areas [22,23]. Alternatively, some countries rely on structural protection measures, such as levees, to reduce the frequency of flooding [24,25]. However, many measures might have unexpected effects, such as potentially accelerating the urbanization of flood-exposed areas, thereby reducing the perception of flood risk [26]. Thus, a more refined flood risk assessment is essential to improve the understanding of flood risk in various countries and areas and provide a theoretical and technical foundation for decision makers across the globe to set flood prevention and mitigation targets and measures in specific areas.
Globally, three approaches to represent flood hazards exist: remote sensing (RS) of historical flood events, global flood models (GFMs), and the index system approach. The method that uses historical data is mainly based on disaster data, such as historical flooding records, and uses one or more mathematical models to statistically analyze the sample data to obtain statistical patterns of disaster intensity and losses. Typical mathematical analysis methods include regression models, time series models, cluster analysis, probability density functions, parameter estimation, and non-parametric estimation methods [16,27]. In relative terms, GFMs are mainly based on global datasets and use automated approaches and hydraulic equivalent equations to simulate global flood hazards [28]. Throughout history, GFMs have primarily been used to respond to disasters [29], inform policy decisions [30], and assess business risks [28]. However, both historical-data-based methods and GFMs focus mainly on global flood risk analysis at the national level [31,32] and lack research work on flooding at a more refined level. In this case, we included the index system approach, currently the most common method to assess flood risk, in our work. To some extent, the index system method has the advantages of calculation principles; application ideas are relatively simple, and it can subjectively respond to the relationship between flooding and each index. Meanwhile, current research shows that global data are now available at a high enough resolution to meet our requirements [28]; thus, index systematization was used in this study to quantify global flood risk.
In this study, we presented and used a framework to assess global flood risk and explore the spatiotemporal pattern at a higher resolution. This framework starts from the hazard–vulnerability elements and couples with technical tools such as GIS technology, statistical analysis, and hotspot analysis. Firstly, according to the actual situation of the study area and the principles of accessibility and scientificity of indexes, 19 indexes were selected to jointly construct the flood risk index system. Then, a game theory quantification method based on the triangular fuzzy number-based analytic hierarchy process (TFN-AHP) and the entropy method (EM) was used to assign weights to flood risk indexes, and the flood risk was quantified and analyzed from a multi-scale perspective based on the regional integrated flood risk grade (RIFRG) model. On this basis, the spatial distribution and temporal evolution of global flood risk were analyzed in terms of multiple scales (grid scale, hotspots, national scale, and continental scale). Against the background of growing international focus on preventing disasters and reducing the associated losses, the results of our study can provide a theoretical and technical foundation for policy makers in various countries and regions across the globe to set flood prevention and mitigation targets and measures in specific areas.
2. Data
In this study, the basic research unit was the grid cell with a 0.15° × 0.15° resolution (approximately 18 km × 18 km), and the spatiotemporal distributions of global flood risk were explored from three perspectives: hotspot regions, national scales, and continental scales. The data used were, among others, global administrative boundary data, hydro-meteorological data, topographic and geomorphological data, and socio-economic data. The global administrative boundary data were collected from Resource Environment Science and Data Center (https://www.resdc.cn/ accessed on 19 October 2021), while the other data, divided into hazard data and vulnerability data, are explained in the sections below.
2.1. Global Flood Hazard Data
After considering the reviews presented by relevant studies [28,33,34] and the availability of data, we used six kinds of data in this study: precipitation, land use, NDVI, river density, soil texture, and DEM (Table 1). Precipitation data were obtained from the GPM project of NASA. In this study, we took 5 years as the time scale to extract the maximum 5-day precipitation (M5DP) of these 5 years. Due to the availability of data, the precipitation index of 2020 could only use the precipitation data of three years, from 2018 to 2020. The river density data and the soil data were gained from OpenStreetMap (OSM) and Agriculture Organization (FAO), respectively. The two hazard indexes (elevation and slope) were extracted from the DEM data, collected from SRTM. Table 1 presents more details.
Since, throughout history, hazard factors have been measured on different scales [35], we needed to unify the indicators into the same dimension. Meanwhile, the results of several studies show that the quantile breakpoint method has good applications for unifying the dimensionality of the factors [35,36]. Thus, after literature reviews [35,37], we used the quantile method to classify the hazard factors on the basis of their contribution to flood probability into five categories, 1 (very low hazard), 2 (low hazard), 3 (moderate hazard), 4 (high hazard), and 5 (very high hazard), as shown in Table 2.
2.2. Global Flood Vulnerability Data
In this study, we used six basic flood vulnerability data (population data, economic data, land use data, infrastructure data, impervious surface data, and road data) and extracted 12 flood vulnerability indexes on the basis of references and citations in some studies [25,28], as shown in Table 3. Population data were collected from World Pop, and four vulnerability indexes (population density, female population density, child population density, and elderly population density) were extracted from population data. Here, economic data were obtained from two websites: (1) the 2005–2015 economic data from Gridded global datasets for Gross Domestic Product and Human Development Index over 1990–2015 [38] and (2) 2020 economic data from Global dataset of gridded population and GDP scenarios [39].
2.3. Flood Risk Index System
Flooding is a result of rainfall generated by abnormal atmospheric activity. Many studies have been conducted on flood risk; however, no unified system has been formed for the selection of indexes [40]. Here, flood risk assessment indexes were considered in terms of hazard and vulnerability. The flood risk index system was generated on the basis of the hazard system theory (three conditions for the formation of floods: disaster-causing factor, disaster-pregnant environment, and hazard-affected body) [41], the principles of index selection [42], and the research results of domestic and foreign scholars [25] (Figure 1). In such a theory, the system only provides a general framework for global flood risk assessment and has a certain reference value. In actual application, it is essential to take into account the unique environmental and socioeconomic conditions of the study area and consider the index system in combination with the resolution and accessibility of data.
3. Methods
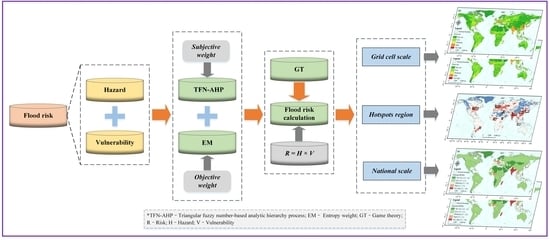
After collating sufficient theoretical knowledge related to flooding, the relevant flowchart was built (Figure 2). Firstly, the basic data were collected and an index system based on the hazard–vulnerability framework was generated. Then, the index weighting method to be used in this study was determined, i.e., the game theory weighting method (a combination of the TFN-AHP and the EM method) was chosen. Finally, based on the regional integrated flood risk grade (RIFRG) model, the global flood risk assessment and spatiotemporal difference patterns were conducted from multiple perspectives and scales.
3.1. The Triangular Fuzzy Number-Based Analytic Hierarchy Process
Traditionally, the AHP is weighting method commonly used to assess flood risk. The original AHP method uses pairwise comparisons to represent the relative importance of the assessment factors. However, such pairwise comparisons are somewhat subjective [18]. To reduce the subjectivity to some extent, we invoked fuzzy theory to replace clear numbers. In the TFN-AHP theory, the median value of the triangular fuzzy number represents the maximum likelihood of the assessment model, while the maximum and minimum values refer to the fuzziness corresponding to the maximum likelihood [43,44]. More detailed theoretical presentations and calculation procedures can be found in some studies [43,44].
3.2. Entropy Weight
Throughout history, entropy was first applied to information theory in 1948 by entropy researcher Shannon as a way to measure the order of a system [45]. Many methods have evolved from entropy theory, such as the maximum entropy algorithm [46,47,48] and the entropy power method [49]. Entropy weighting is an objective, multi-criterium decision-making method for optimizing decisions under a set of qualitative, quantitative, and sometimes conflicting factors [49]. As an objective weighting method, based on the information entropy theory, the entropy weight (EW) is reflective of the content of helpful information provided by indicators. The specific calculation steps can be found in previous research studies [50,51].
3.3. Game Theory
Subjective weighting (SW) and objective weighting (OW) are the two main types of weighting methods involving indexes. Previous studies indicate that SW and OW methods have their own strengths and weaknesses in different scenarios [52]. In such a theory, the SW method can reflect the subjective preferences and experiences of decision makers. The OW method, on the other hand, has a strong mathematical theoretical foundation and is based on the characteristics of the data themself, avoiding subjectivity to a certain extent. Therefore, a suitable model is needed to combine the advantages of SW and OW. Game theory (GT), a mathematical model of strategic interaction between rational and irrational subjects, specializes in resolving conflicts among two or more participants [53], since it allows the weight information of subjective or objective weights and the most satisfactory weight, also known as the combined weight (CW), to be efficiently used. In this study, the SW method and the OW method were considered as two participants in the flood risk assessment methodology; more details can be found in the two studies [52,54]. The specific calculation process was as follows:
- (1)
- We obtain I weights for n indexes according to I categories of weighting methods, since , i = 1, 2, …, I, and m = 1, 2, …, n. Therefore, we can construct a weight vector: ;
- (2)
- The possible combined weight, , is achieved by collecting and combining information on multiple weighting approaches. From this, we can see that ω* is denoted by W, as shown in Equation (1):
- (3)
- Suppose there exists a most appropriate linear combination of coefficients α*, such that the deviation between ω* and ωi (i = 1, 2, …, I) is minimized to achieve a compromise between the I weights. Thus, the optimization function is to minimize the deviations between ω* and ωi:
Moreover, based on the differential nature of the matrix, the terms for the best first-order derivatives are obtained using Equation (3):
Next, Equation (3) is presented in matrix form:
- (4)
- The weight coefficients are calculated and then normalized to obtain α*:
Eventually, ω* can be obtained as:
3.4. Flood Risk Calculation and Gradation
In this study, we quantified the flood hazards using Equation (7). As shown in Table 4, the index weights for 2005, 2010, 2015, and 2020 were obtained using three methods: TFN-AHP, EW, and GT. The equation used is as follows:
where H is the flood hazard, Ai is the degree of affiliation of each indicator, and ωi is the weight value of each index.
Vulnerability, as defined in the IPCC report [55], is the degree to which a system is susceptible to and unable to cope with adverse effects (climate change). In such a theory, the key parameters of vulnerability are exposure, sensitivity, adaptability, and coping capacity. Additionally, the index weights of vulnerability for 2005, 2010, 2015, and 2020 were obtained, as shown in Table 5. The specific equation of flood vulnerability is as follows:
where V is flood vulnerability, E is exposure, S is sensitivity, and C is coping capacity.
Flood risk is a comprehensive result of the interaction between the flood (hazard) and the disaster-bearing body (in terms of its vulnerability in relation to its socio-economic conditions, resilience, and mitigation capacity against the flood). Considering this point, the specific definition of flood risk is as follows:
where R is the flood risk, H is the flood hazard, and V is the vulnerability to the flood.
Referring to some ecological approaches, a risk index that reflects the combined degree of sub-regional flood risk was used. The index was compiled by reclassifying the risk level of each grid into a quantitative value: very low risk = 1, low risk = 2, medium risk = 3, high risk = 4, and very high risk = 5. Specifically, the definitions of the regional integrated flood risk grades (RIFRGs) were calculated using Equation (10):
where RIFRGi is the regional integrated flood risk grade for region i, Gj is the risk value for grade j, Aj is the area of flood risk grade for j in region i, and Sj is the entire area of region j.
4. Results and Discussion
4.1. Spatiotemporal Variations in Global Risk on the Grid Scale
With respect to the three major drivers of floods (disaster-causing factor, disaster-pregnant environment, and hazard-affected body), we selected 19 indexes to build the index system on the basis of the hazard–vulnerability framework. Then, combined with the quality and availability of data and other comprehensive considerations, we generated the global flood risk distribution map (2005–2020). Based on the natural breakpoint method, we classified the global flood risk during 2005–2020 into five levels, namely, very low, low, medium, high, and very high (Figure 3). To verify the accuracy of the proposed model and flood risk results in this study, we performed ROC curve validation based on the global flood location dataset, which we downloaded from the Dartmouth Flood Observatory website (http://floodobservatory.colorado.edu/ accessed on 19 October 2021). The relationship between model performance and the AUC could be classified into four levels [56]: poor (<0.6), moderate (0.6–0.7), good (0.7–0.8), and very good (0.8–1). The validation results showed that the GT model and the flood risk results had a high accuracy, with AUC values of 0.871 (Figure 4).
Since the differences in the spatial distribution of flood risk during 2005–2020 are not obvious, the distribution of flood risk in 2005 was taken as an instance to demonstrate the spatial distribution pattern of global flood risk. In accordance with the results of Fang et al. [16], the global flood risk distribution is closely related to population, economy, and precipitation. As shown in Figure 3, the regions at higher flood risk were primarily located in regions that had high population concentrations, high economic density, abundant precipitation, and low elevation, for example, North China Plain in China, the northern part of India, the Indus River Basin in Bangladesh, the central cities in Indonesia, and Nile River Basin in Egypt.
With respect to the temporal variations in global flood risk, the RIFRG was used for the statistics. As shown in Table 6, the global flood risk showed a gradual upward trend. From a more refined perspective, low-risk areas were the most widely distributed in 2005, 2010, 2015, and 2020, at 50.02%, 49.99%, 47.28%, and 49.07%, respectively. In addition to low-risk areas, areas at very low risk accounted for the largest share, at 36.81%, 34.64%, 35.97%, and 31.99%, respectively. Meanwhile, areas at low and very low risk tended to decrease in the period of 2005–2020, while areas at medium, high, and very high risk tended to increase. On this basis, the RIFRG model showed an increasing trend of global flood risk during 2005–2020, at 1.819 (2005), 1.865 (2010), 1.867 (2015), and 1.935 (2020), which indicated that the risk of global flood increased. A study from World Resources Institute shows that by 2030, as many as 750 million people worldwide are expected to be in 100-year flood zones [14]. In addition, some studies using climate models for future global flood risk projections indicate that global economic losses from floods grow more rapidly than the global economy (as indicated by the proportion of losses to GDP) and that on a global scale, absolute damage could increase 20-fold by 2100 if no action is taken [57].
4.2. Spatiotemporal Variations in Global Risk Hotspots
In this study, on the basis of the global flood risk assessment results on the grid scale, 11 global risk hotspot regions were identified using the hotspot analysis tool of ArcGIS. Assuming that each grid had one element, the condition for this grid to be a hotspot was that it had a high value itself and was surrounded by other elements that also had a high value [58]. In other words, for a statistically significant z-score, the higher the z-score was, the tighter the clustering of high values (hotspots) was. In this study, taking the distribution map of risk hotspot regions in 2005 as an example (Figure 5), there were 11 risk hotspot regions in the world, namely, (1) Japan Sea coast, (2) North China Plain, (3) the Jakarta region in Indonesia, (4) Ganges River Basin, (5) Eastern Mediterranean countries, (6) both sides of the English Channel, (7) Nile River Basin in Egypt, (8) countries around the Gulf of Guinea, (9) Ethiopia region, (10) Mid-Atlantic–Great Lakes region in the United States, and (11) the Rio de Janeiro region in Brazil.
It can be discovered from Figure 5 that global flood risk hotspots were mainly concentrated in Asia, as 5 of these 11 hotspots were in Asia, especially in East and South Asia. The remaining hotspots were scattered across other continents, while Oceania was the only continent without any hotspots. To some extent, precipitation is the main cause of high-risk aggregation, especially in East, Southeast, and South Asia [33,59]. For instance, the Japan Sea coast is located in the western Pacific Ocean and is affected by typhoons all year round, and the probability of flooding due to typhoons and heavy rainfall is much higher here than in other parts of Asia. Both sides of the English Channel are located in the westerly wind belt. According to incomplete statistics, there are more than 200 rainy days throughout the year. Thus, precipitation is abundant. Additionally, the coastal countries are highly developed capitalist countries, so the probability of flooding in the region and the resulting damage are higher than in other parts of Europe. In addition to precipitation, the disaster-pregnant environment and the hazard-affected body itself are also constraints on flood risk. As with most basins, the Nile River Basin is the economic and population concentration of Egypt. As expected, the risk of flooding and erosion is higher in the highly built-up and urbanized coastal areas, with the Nile Delta region being the most flood-prone area along the Egyptian coast [60].
To explore the changing pattern of global flood risk hotspot regions in a time series, we presented statistics at the different levels of risk and the change in RIFRG values in each hotspot region (Figure 6). Generally, the pattern of risk change in hotspot regions was consistent with the pattern of global risk change, with a gradual increase in the trend. Especially, the most obvious trends of increasing risk were concentrated along the Japan Sea coast (Figure 6a), the eastern Mediterranean countries (Figure 6e), both sides of the English Channel (Figure 6f), the Nile Basin in Egypt (Figure 6g), and the Mid-Atlantic–Great Lakes region in the United States (Figure 6j). Undoubtedly, these hotspots are the most urbanized regions. A study by Cao et al. [61] on the exposure of global cities to flood risk from 1985 to 2018 noted that global urban flood risk increased from 0.2% in 1985 to 1.2% in 2018. Specially, Thames Basin in southern England, Seine River in France, Rhine River Basin in Western Europe, Qiantang and Yongding River Basins in eastern China, Han River Basin in Korea, and the northeastern United States were hotspots of increased risk, which was consistent with the findings of this study.
In relative terms, the countries around the Gulf of Guinea (Figure 6h), the Ethiopian region (Figure 6i), and the Rio de Janeiro region in Brazil (Figure 6k), all showed varying degrees of increasing and then decreasing flood risk. In particular, the Ethiopian region had the highest increase in risk among these three hotspot regions. Throughout history, floods have been among the most prominent disasters in Africa. However, few studies have been conducted in recent years on the flood risk in Ethiopia [62]. Additionally, the RIFRG values of the hotspots in the Jakarta region in Indonesia (Figure 6c) and Ganges River Basin (Figure 6d) were the highest among the 11 hotspots, which meant that these two hotspots were at higher flood risk. Meanwhile, the distribution of the different levels of flood risk in these two hotspots was also even, with the other hotspots being mainly dominated by areas at very low risk (i.e., the Japan Sea coast, Eastern Mediterranean countries, and Nile River Basin in Egypt) (Figure 6).
It is challenging for global government agencies to mitigate the risk from increasing instances of flooding. The current rapid expansion of urban flood risk suggests that previous urban designs have not given sufficient attention to the management of flood risk, particularly in the Asian region [61]. Thus, future policies should prioritize land use planning in flood-exposed areas to minimize construction in flood-prone areas; mitigate damage from unavoidable flooding; and encourage urban growth and expansion, including migration and redevelopment, in flood-safe areas. Some initiatives may contribute to these goals, for instance, the government could take additional measures to strengthen flood prevention and mitigation to safeguard crucial urban infrastructure, such as shelters, hospitals, and railroads. Even in times of no flooding, the government should take measures to raise awareness of flood risk among residents [63]. Additionally, implementing flood insurance may be an effective means of controlling economic losses from floods [64].
4.3. Spatiotemporal Distribution of Flood Risk on the National Scale
Using the RIFRG model, the global flood risk on the national scale was calculated and then classified into five levels with reference to the natural breakpoint method (Figure 7). As shown in Figure 7, most countries were at low and very low risk, with high-risk countries (RIFRG values greater than 2.5) being concentrated in East and South Asia and Central and Western Europe. Specifically, Japan, North Korea, South Korea, Vietnam, the Philippines, India, Bangladesh, Pakistan, Italy, Germany, and the Netherlands had higher RIFRG values. In addition, five countries (India, Bangladesh, Pakistan, the Netherlands, and Madagascar) were at very high risk for the period 2005–2020, indicating that these five countries were among the countries with the highest risk of flooding during this 15-year period globally.
To explore more deeply the changes in the risk values over the time series for individual countries, the RIFRG values on the national scale were reclassified into five categories, with changes greater than or equal to one level being considered significant. Figure 8 indicates that flood risk showed the following trend: significantly increasing, leveling off, and then significantly increasing again. From 2005 to 2010 (Figure 8a), more than 10 countries were at significantly increased risk (Kazakhstan, Tajikistan, Ukraine, Sweden, Norway, Angola, South Africa, Ecuador, etc.), while a few countries were at significantly decreased risk, namely, Ireland, Denmark, and Turkmenistan. Subsequently, in 2010–2015, the number of countries at a significantly increased risk was about the same as the number of countries at a decreased risk (Figure 8b). However, the trend in risk change for the period of 2015–2020 returned to an increasing trend (Figure 8c), and the increasing trend was even greater than that for the period of 2005–2010 (Figure 8a). Specifically, these countries at significantly increased risk were mainly located in Asia and Europe, while countries at significantly decreased risk were mainly located in Africa (Figure 8c).
From the above elaboration, there were significant differences among countries affected by floods at the global level. Therefore, we investigated the relationship between RIFRG values and national income levels for each country from 2005 to 2020. According to the World Bank classification, countries are classified into four income levels: low income, lower-middle income, upper-middle income, and high income. The results presented in Figure 9 showed two trends in global flood risk on the national scale. Firstly, these results indicated that overall flood risk increased for all the countries in the world between 2005 and 2020, with the most pronounced increase in the period of 2015–2020 in particular. Secondly, a country’s flood risk was positively correlated with the country’s income level; in short, the flood risk of high-income countries was much higher than that of low-income countries, and the gap between the two tended to increase over time. Meanwhile, some studies suggest that globally, absolute damage from flooding could increase 20-fold by 2100 if no action is taken [57]. Thus, regardless of the income level, more efforts should be invested in future flood prevention and management, especially in high-income countries.
In this study, the top 20 countries with the highest RIFRG values were counted in order to assess the distribution of countries at the highest global flood risk. As shown in Table 7, the country at the highest risk of flooding was Singapore, with RIFRG values of 4.987, 4.987, 4.993, and 4.993 for 2005, 2010, 2015, and 2020, respectively. According to statistics, among these 20 countries, 11 were developed countries, namely, Singapore, Mauritius, Netherlands, Bahrain, Belgium, Liechtenstein, Trinidad and Tobago, Japan, South Korea, Germany, and Israel. This showed that the risk of flooding was closely correlated with the distribution of population and the economy of each country, and generally speaking, the more densely populated and economically developed countries were at a higher risk of flooding.
In terms of changes in the time series, the flood risk for these 20 countries showed an increasing trend over the period of 2005–2020, consistent with the trend on the grid scale. The two countries with the highest rate of change in risk in 2015–2020 were Haiti and El Salvador, with Haiti having the highest negative growth rate of −13.48% (2015–2020) and El Salvador having the highest positive growth rate of 19.05% from 2015–2020 (Table 7). Meanwhile, some studies point out that between 1986 and 2013, El Salvador experienced increased flood risk in many areas due to urbanization, and in the 2030 scenario, urban coverage would be more than double the urban coverage in 2013 [65]. Critically, due to the existing level of urbanization in El Salvador, current flood protection measures and plans may not be sufficient to mitigate future flood risks [65]. In addition, Vietnam was the only one of these 20 countries where the flood risk continued to grow in all three phases, and the growth trend kept rising, increasing from 0.11% in 2005–2010 to 1.92% in 2010–2015 and to 2.89% in 2015–2020. This is due, in large part, to Vietnam’s rapid population expansion, accelerated urbanization, and industrial growth in recent years [66].
4.4. Temporal Evolution of Flood Risk at the Continental Scale
Table 8 indicates the RIFRG values for the six global continents (except Antarctica), showing that, although there was a risk reduction in some years for individual continents, the global flood risk still showed an increasing trend. The statistical results of the global flood risk by continent showed that the continent at the highest global risk was Asia, with RIFRG values of 1.989, 2.027, 2.072, and 2.181 for 2005, 2010, 2015, and 2020, respectively. In relative terms, the flood risk in Asia increased, which meant that Asia is expected to be one of the continents most prone to and most affected by floods in the future. Compared to Asia, North America was the continent at the lowest risk (with RIFRG values of 1.717, 1.735, 1.760, and 1.837 for 2005, 2010, 2015, and 2020, respectively). Meanwhile, Europe was the continent with the second lowest flood risk, in the sense that the flood prevention infrastructure could be strengthened through a booming economy and advanced technology, greatly improving human response to floods and thus reducing human casualties and economic losses due to floods [31]. Among these six continents, Africa was at low risk due to its low flood hazard [67], with the most significant reduction in risk from 2010 to 2015 (RIFRG reduction of 0.051, Table 8).
4.5. Implications and Limitations
To the best of our knowledge, current global flood risk studies mainly take into account population mortality and economic loss rates [31]. This method ignores to some extent the interactions between the intrinsic factors of hazard and vulnerability, and the results present only a crude spatial distribution of the global flood risk on the national scale. On the basis of the studies on flood risk, in this study, we constructed a framework for analyzing the multi-scale spatiotemporal patterns of global floods. In this framework, we tried to start from the conditions of flood risk generation (disaster-causing factors, disaster-pregnant environment, and hazard-affected body) based on the grid scale and also integrated the components and interactions of the factors within hazard and vulnerability. Subsequently, we comprehensively considered the spatial and temporal distribution patterns of global flood risk, the underlying patterns and causes from multiple perspectives based on the RIFRG model. In relative terms, our results had high precision, validated using ROC curves (AUC value of 0.871 for risk results), EM-DAT data comparison, literature comparison, and other methods. The findings demonstrated that global flood risk was still on the rise under the current disaster prevention measures. From these results, patterns in the spatial distribution and temporal evolution of global flood risk highlighted the variations between disasters and natural hazards defined by human behavior, providing a much-needed perspective on the risk of human influence on climate [68,69]. The framework presented here can provide a reference and basis for other scholars to investigate the spatiotemporal distribution patterns of large-scale flood risk.
Although progresses and findings were obtained, here, some limitations still remained. Firstly, due to the difficulty in data collection, some of the data were sourced differently between 2005–2015 and 2020. Despite the fact that the data used in this study had a high degree of accuracy in previous studies, they may have also resulted in incomprehensiveness and loss of some accuracy in flood risk assessment. Then, to some extent, we may have somehow overlooked spatial heterogeneity due to the large size of the study area, and some common flood indexes were not taken into account (i.e., aspect, extreme precipitation data, and some normalized difference water indexes). Additionally, the simulation and prediction of future global flooding based on the CMIP6 model is a current hot topic, and relevant research can be conducted in the future.
5. Conclusions
Based on the hazard–vulnerability framework, this study explored the spatiotemporal patterns of the global flood risk on four scales for 2005–2020: the grid scale, hotspots, the national scale, and the continental scale. As per the results, the global flood risk increased during 2005–2020, and the high-risk areas were mainly located in areas with a high population density, a high economic density, abundant precipitation, and low elevation. The hotspot analysis showed that there were 11 risk hotspot areas globally, mainly located in the capital city areas where the population is concentrated and economically developed and around several major basins in the world. Specifically, East Asia, Southeast Asia, and South Asia were among the regions at the highest flood risk, with four risk hotspots in these regions. From the national-scale perspective, the high-risk countries (RIFRG values greater than 2.5) were concentrated in East Asia, South Asia, and Central and Western Europe. Generally, the flood risk of a country was positively proportional to the country’s income level, with the risk in low-income countries being much lower than the risk in high-income countries, and the gap between the two tended to increase over time. Additionally, developed countries accounted for most of the 20 countries of the world at the highest flood risk. The countries with the highest rate of change in risk from 2005 to 2020 were Haiti and El Salvador, with Haiti having the highest negative growth rate of (−13.48% in 2015–2020) and El Salvador having the highest positive growth rate (19.05% in 2015–2020).
Author Contributions
Y.D. and J.X. were responsible for the collection and processing of the dataset; Y.D. and W.C. conceptualized the study and developed the methodology; Y.D. and J.X. were responsible for the analysis and validation of the results and finished the original draft preparation; Y.D., J.X., W.C., Y.L., N.W., G.S. and J.Y. all participated in the reviewing of methodology, results, and article. All authors have read and agreed to the published version of the manuscript.
Funding
This study was supported by Strategic Priority Research Program of the Chinese Academy of Sciences (grant No. XDA20030302), the Key R&D project of Sichuan Science and Technology Department (grant No. 2021YFQ0042), National Flash Flood Investigation and Evaluation Project (grant No. SHZH-IWHR-57), National Key R&D Program of China (2020YFD1100701), and Science and Technology Project of Xizang Autonomous Region (grant No. XZ201901-GA-07), Project form Science and Technology Bureau of Altay Region in Yili Kazak Autonomous Prefecture. The authors are grateful for this support.
Data Availability Statement
Not applicable.
Conflicts of Interest
The authors declare no conflict of interest.
References
- UNDRR. Human Cost of Disasters: An Overview of the Last 20 Years 2000–2019; United Nations for Disaster Risk Reduction (UNISDR): Geneva, Switzerland, 2020. [Google Scholar]
- Njock, P.G.A.; Shen, S.L.; Zhou, A.; Lyu, H.M. Evaluation of soil liquefaction using AI technology incorporating a coupled ENN/t-SNE model. Soil Dyn. Earthq. Eng. 2020, 130, 105988. [Google Scholar] [CrossRef]
- He, Y.Y.; Zhou, J.Z.; Kou, P.G.; Lu, N.; Zou, Q. A fuzzy clustering iterative model using chaotic differential evolution algorithm for evaluating flood disaster. Expert Syst. Appl. 2011, 38, 10060–10065. [Google Scholar] [CrossRef]
- Jevrejeva, S.; Jackson, L.P.; Grinsted, A.; Lincke, D.; Marzeion, B. Flood damage costs under the sea level rise with warming of 1.5 degrees C and 2 degrees C. Environ. Res. Lett. 2018, 13, 074014. [Google Scholar] [CrossRef] [Green Version]
- Zhang, Q.; Li, J.F.; Singh, V.P.; Xiao, M.Z. Spatio-temporal relations between temperature and precipitation regimes: Implications for temperature-induced changes in the hydrological cycle. Glob. Planet. Change 2013, 111, 57–76. [Google Scholar] [CrossRef]
- Li, J.F.; Chen, Y.D.; Zhang, L.; Zhang, Q.; Chiew, F.H.S. Future Changes in Floods and Water Availability across China: Linkage with Changing Climate and Uncertainties. J. Hydrometeorol. 2016, 17, 1295–1314. [Google Scholar] [CrossRef]
- Jongman, B.; Ward, P.J.; Aerts, J. Global exposure to river and coastal flooding: Long term trends and changes. Glob. Environ. Change-Hum. Policy Dimens. 2012, 22, 823–835. [Google Scholar] [CrossRef]
- Swain, D.L.; Wing, O.E.J.; Bates, P.D.; Done, J.M.; Johnson, K.A.; Cameron, D.R. Increased Flood Exposure Due to Climate Change and Population Growth in the United States. Earths Future 2020, 8, e2020EF001778. [Google Scholar] [CrossRef]
- Rentschler, J.; Salhab, M.; Jafino, B.A. Flood exposure and poverty in 188 countries. Nat. Commun. 2022, 13, 3527. [Google Scholar] [CrossRef]
- Hirabayashi, Y.; Mahendran, R.; Koirala, S.; Konoshima, L.; Yamazaki, D.; Watanabe, S.; Kim, H.; Kanae, S. Global flood risk under climate change. Nat. Clim. Change 2013, 3, 816–821. [Google Scholar] [CrossRef]
- UNISDR. Sendai Framework for Disaster Risk Reduction 2015–2030; UNISDR: Geneva, Switzerland, 2015. [Google Scholar]
- Jongman, B.; Winsemius, H.C.; Aerts, J.; de Perez, E.C.; van Aalst, M.K.; Kron, W.; Ward, P.J. Declining vulnerability to river floods and the global benefits of adaptation. Proc. Natl. Acad. Sci. USA 2015, 112, E2271–E2280. [Google Scholar] [CrossRef]
- Ward, P.J.; Jongman, B.; Aerts, J.; Bates, P.D.; Botzen, W.J.W.; Loaiza, A.D.; Hallegatte, S.; Kind, J.M.; Kwadijk, J.; Scussolini, P.; et al. A global framework for future costs and benefits of river-flood protection in urban areas. Nat. Clim. Change 2017, 7, 642–646. [Google Scholar] [CrossRef] [Green Version]
- Tellman, B.; Sullivan, J.A.; Kuhn, C.; Kettner, A.J.; Doyle, C.S.; Brakenridge, G.R.; Erickson, T.A.; Slayback, D.A. Satellite imaging reveals increased proportion of population exposed to floods. Nature 2021, 596, 80–86. [Google Scholar] [CrossRef] [PubMed]
- Ward, P.J.; Blauhut, V.; Bloemendaal, N.; Daniell, J.E.; de Ruiter, M.C.; Duncan, M.J.; Emberson, R.; Jenkins, S.F.; Kirschbaum, D.; Kunz, M.; et al. Review article: Natural hazard risk assessments at the global scale. Nat. Hazards Earth Syst. Sci. 2020, 20, 1069–1096. [Google Scholar] [CrossRef] [Green Version]
- Fang, J.; Li, M.J.; Wang, J.A.; Shi, P.J. Assessment and mapping of global fluvial flood risk. J. Nat. Disasters 2015, 24, 1–8. [Google Scholar] [CrossRef]
- He, Y.F.; Ma, D.Y.; Xiong, J.N.; Cheng, W.M.; Jia, H.L.; Wang, N.; Guo, L.; Duan, Y.; Liu, J.; Yang, G. Flash flood vulnerability assessment of roads in China based on support vector machine. Geocarto Int. 2022, 37, 6141–6164. [Google Scholar] [CrossRef]
- Lyu, H.M.; Shen, S.L.; Zhou, A.N.; Zhou, W.H. Flood risk assessment of metro systems in a subsiding environment using the interval FAHP-FCA approach. Sustain. Cities Soc. 2019, 50, 101682. [Google Scholar] [CrossRef]
- Pham, B.T.; Luu, C.; Phong, T.V.; Nguyen, H.D.; Le, H.V.; Tran, T.Q.; Ta, H.T.; Prakash, I. Flood risk assessment using hybrid artificial intelligence models integrated with multi-criteria decision analysis in Quang Nam Province, Vietnam. J. Hydrol. 2021, 592, 125815. [Google Scholar] [CrossRef]
- Alfieri, L.; Feyen, L.; Dottori, F.; Bianchi, A. Ensemble flood risk assessment in Europe under high end climate scenarios. Glob. Environ. Change-Hum. Policy Dimens. 2015, 35, 199–212. [Google Scholar] [CrossRef]
- Tyler, J.; Sadiq, A.A.; Noonan, D.S. A review of the community flood risk management literature in the USA: Lessons for improving community resilience to floods. Nat. Hazards 2019, 96, 1223–1248. [Google Scholar] [CrossRef]
- Thaler, T.; Fuchs, S. Financial recovery schemes in Austria: How planned relocation is used as an answer to future flood events. Environ. Hazards-Hum. Policy Dimens. 2020, 19, 268–284. [Google Scholar] [CrossRef]
- Siders, A.R. Social justice implications of US managed retreat buyout programs. Clim. Change 2019, 152, 239–257. [Google Scholar] [CrossRef]
- D’Oria, M.; Maranzoni, A.; Mazzoleni, M. Probabilistic Assessment of Flood Hazard due to Levee Breaches Using Fragility Functions. Water Resour. Res. 2019, 55, 8740–8764. [Google Scholar] [CrossRef]
- Mazzoleni, M.; Mard, J.; Rusca, M.; Odongo, V.; Lindersson, S.; Di Baldassarre, G. Floodplains in the Anthropocene: A Global Analysis of the Interplay Between Human Population, Built Environment, and Flood Severity. Water Resour. Res. 2021, 57, e2020WR027744. [Google Scholar] [CrossRef]
- Haer, T.; Husby, T.G.; Botzen, W.J.W.; Aerts, J. The safe development paradox: An agent-based model for flood risk under climate change in the European Union. Glob. Environ. Change-Hum. Policy Dimens. 2020, 60, 102009. [Google Scholar] [CrossRef]
- Zhao, S.J.; Huang, C.F.; Guo, S.J. Scenario-driven risk analysis of regional natural disasters. J. Nat. Disasters 2012, 21, 9–17. [Google Scholar] [CrossRef]
- Bernhofen, M.V.; Cooper, S.; Trigg, M.; Mdee, A.; Carr, A.; Bhave, A.; Solano-Correa, Y.T.; Pencue-Fierro, E.L.; Teferi, E.; Haile, A.T.; et al. The Role of Global Data Sets for Riverine Flood Risk Management at National Scales. Water Resour. Res. 2022, 58, e2021WR031555. [Google Scholar] [CrossRef]
- Emerton, R.; Cloke, H.; Ficchi, A.; Hawker, L.; de Wit, S.; Speight, L.; Prudhomme, C.; Rundell, P.; West, R.; Neal, J.; et al. Emergency flood bulletins for Cyclones Idai and Kenneth: A critical evaluation of the use of global flood forecasts for international humanitarian preparedness and response. Int. J. Disaster Risk Reduct. 2020, 50, 101811. [Google Scholar] [CrossRef]
- Ward, P.J.; Jongman, B.; Salamon, P.; Simpson, A.; Bates, P.; De Groeve, T.; Muis, S.; de Perez, E.C.; Rudari, R.; Trigg, M.A.; et al. Usefulness and limitations of global flood risk models. Nat. Clim. Change 2015, 5, 712–715. [Google Scholar] [CrossRef]
- Hu, P.; Zhang, Q.; Shi, P.J.; Chen, B.; Fang, J.Y. Flood-induced mortality across the globe: Spatiotemporal pattern and influencing factors. Sci. Total Environ. 2018, 643, 171–182. [Google Scholar] [CrossRef]
- Bates, P.D.; Quinn, N.; Sampson, C.; Smith, A.; Wing, O.; Sosa, J.; Savage, J.; Olcese, G.; Neal, J.; Schumann, G.; et al. Combined Modeling of US Fluvial, Pluvial, and Coastal Flood Hazard Under Current and Future Climates. Water Resour. Res. 2021, 57, e2020WR028673. [Google Scholar] [CrossRef]
- Liu, J.; Wang, J.Y.; Xiong, J.N.; Cheng, W.M.; Li, Y.; Cao, Y.F.; He, Y.F.; Duan, Y.; He, W.; Yang, G. Assessment of flood susceptibility mapping using support vector machine, logistic regression and their ensemble techniques in the Belt and Road region. Geocarto Int. 2022, 1–30. [Google Scholar] [CrossRef]
- Alfieri, L.; Bisselink, B.; Dottori, F.; Naumann, G.; de Roo, A.; Salamon, P.; Wyser, K.; Feyen, L. Global projections of river flood risk in a warmer world. Earths Future 2017, 5, 171–182. [Google Scholar] [CrossRef]
- Mahmoud, S.H.; Gan, T.Y. Multi-criteria approach to develop flood susceptibility maps in arid regions of Middle East. J. Clean Prod. 2018, 196, 216–229. [Google Scholar] [CrossRef]
- Tehrany, M.S.; Pradhan, B.; Jebur, M.N. Spatial prediction of flood susceptible areas using rule based decision tree (DT) and a novel ensemble bivariate and multivariate statistical models in GIS. J. Hydrol. 2013, 504, 69–79. [Google Scholar] [CrossRef]
- Tehrany, M.S.; Pradhan, B.; Jebur, M.N. Flood susceptibility mapping using a novel ensemble weights-of-evidence and support vector machine models in GIS. J. Hydrol. 2014, 512, 332–343. [Google Scholar] [CrossRef]
- Kummu, M.; Taka, M.; Guillaume, J.H.A. Data Descriptor: Gridded global datasets for Gross Domestic Product and Human Development Index over 1990–2015. Sci. Data 2018, 5, 180004. [Google Scholar] [CrossRef] [Green Version]
- Murakami, D.; Yamagata, Y. Estimation of Gridded Population and GDP Scenarios with Spatially Explicit Statistical Downscaling. Sustainability 2019, 11, 2106. [Google Scholar] [CrossRef] [Green Version]
- Duan, Y.; Xiong, J.N.; Cheng, W.M.; Wang, N.; Li, Y.; He, Y.F.; Liu, J.; He, W.; Yang, G. Flood vulnerability assessment using the triangular fuzzy number-based analytic hierarchy process and support vector machine model for the Belt and Road region. Nat. Hazards 2022, 110, 269–294. [Google Scholar] [CrossRef]
- Shi, P.J. Theory on disaster science and disaster dynamics. J. Nat. Disasters 2002, 512, 332–343. [Google Scholar]
- Imamura, Y. Development of a Method for Assessing Country-Based Flood Risk at the Global Scale. Int. J. Disaster Risk Sci. 2022, 13, 87–99. [Google Scholar] [CrossRef]
- Lyu, H.M.; Shen, S.L.; Zhou, A.N.; Yang, J. Risk assessment of mega-city infrastructures related to land subsidence using improved trapezoidal FAHP. Sci. Total Environ. 2020, 717, 135310. [Google Scholar] [CrossRef] [PubMed]
- Lyu, H.M.; Zhou, W.H.; Shen, S.L.; Zhou, A.N. Inundation risk assessment of metro system using AHP and TFN-AHP in Shenzhen. Sustain. Cities Soc. 2020, 56, 102103. [Google Scholar] [CrossRef]
- Shannon, C.E. A Mathematical Theory of Communication. Bell Syst. Tech. J. 1948, 27, 379–423. [Google Scholar] [CrossRef] [Green Version]
- Lin, J.Y.; He, P.T.; Yang, L.; He, X.Y.; Lu, S.Y.; Liu, D.Y. Predicting future urban waterlogging-prone areas by coupling the maximum entropy and FLUS model. Sustain. Cities Soc. 2022, 80, 103812. [Google Scholar] [CrossRef]
- Zeng, Z.P.; Li, Y.J.; Lan, J.Y.; Hamidi, A.R. Utilizing User-Generated Content and GIS for Flood Susceptibility Modeling in Mountainous Areas: A Case Study of Jian City in China. Sustainability 2021, 13, 6929. [Google Scholar] [CrossRef]
- Eini, M.; Kaboli, H.S.; Rashidian, M.; Hedayat, H. Hazard and vulnerability in urban flood risk mapping: Machine learning techniques and considering the role of urban districts. Int. J. Disaster Risk Reduct. 2020, 50, 101687. [Google Scholar] [CrossRef]
- Malekinezhad, H.; Sepehri, M.; Pham, Q.B.; Hosseini, S.Z.; Meshram, S.G.; Vojtek, M.; Vojtekova, J. Application of entropy weighting method for urban flood hazard mapping. Acta Geophys. 2021, 69, 841–854. [Google Scholar] [CrossRef]
- Lai, C.G.; Chen, X.H.; Chen, X.Y.; Wang, Z.L.; Wu, X.S.; Zhao, S.W. A fuzzy comprehensive evaluation model for flood risk based on the combination weight of game theory. Nat. Hazards 2015, 77, 1243–1259. [Google Scholar] [CrossRef]
- Chen, C.H. A Novel Multi-Criteria Decision-Making Model for Building Material Supplier Selection Based on Entropy-AHP Weighted TOPSIS. Entropy 2020, 22, 259. [Google Scholar] [CrossRef] [Green Version]
- Zou, Q.; Liao, L.; Qin, H. Fast Comprehensive Flood Risk Assessment Based on Game Theory and Cloud Model Under Parallel Computation (P-GT-CM). Water Resour. Manag. 2020, 34, 1625–1648. [Google Scholar] [CrossRef]
- Wu, T.Y.; Lee, W.T.; Guizani, N.; Wang, T.M. Incentive mechanism for P2P file sharing based on social network and game theory. J. Netw. Comput. Appl. 2014, 41, 47–55. [Google Scholar] [CrossRef]
- Duan, Y.; Xiong, J.; Cheng, W.; Wang, N.; He, W.; He, Y.; Liu, J.; Yang, G.; Wang, J.; Yang, J. Assessment and spatiotemporal analysis of global flood vulnerability in 2005–2020. Int. J. Disaster Risk Reduct. 2022, 80, 103201. [Google Scholar] [CrossRef]
- IPCC. Summary for Policymakers. In Climate Change 2021: The Physical Science Basis. Contribution of Working Group I to the Sixth Assessment Report of the Intergovernmental Panel on Climate Change; Masson-Delmotte, V., Zhai, P., Pirani, A., Connors, S.L., Péan, C., Berger, S., Caud, N., Chen, Y., Goldfarb, L., Gomis, M.I., et al., Eds.; Cambridge University Press: Cambridge, UK, 2021; in press. [Google Scholar]
- Choubin, B.; Moradi, E.; Golshan, M.; Adamowski, J.; Sajedi-Hosseini, F.; Mosavi, A. An ensemble prediction of flood susceptibility using multivariate discriminant analysis, classification and regression trees, and support vector machines. Sci. Total Environ. 2019, 651, 2087–2096. [Google Scholar] [CrossRef]
- Winsemius, H.C.; Aerts, J.; van Beek, L.P.H.; Bierkens, M.F.P.; Bouwman, A.; Jongman, B.; Kwadijk, J.C.J.; Ligtvoet, W.; Lucas, P.L.; van Vuuren, D.P.; et al. Global drivers of future river flood risk. Nat. Clim. Change 2016, 6, 381–385. [Google Scholar] [CrossRef] [Green Version]
- Chen, W.S.; Liu, L.; Liang, Y.T. Retail center recognition and spatial aggregating feature analysis of retail formats in Guangzhou based on POI data. Geogr. Res. 2016, 35, 703–716. [Google Scholar]
- Yang, P.G.; Hu, J.F.; Ding, B.H.; Song, W.; Li, J. Spatial and temporal characteristics of flood disaster in Asia-Pacific region. J. Shaanxi Norm. Univ. Nat. Sci. Ed. 2013, 41, 74–81. [Google Scholar] [CrossRef]
- Torresan, S.; Furlan, E.; Critto, A.; Michetti, M.; Marcomini, A. Egypt’s Coastal Vulnerability to Sea-Level Rise and Storm Surge: Present and Future Conditions. Integr. Environ. Assess. Manag. 2020, 16, 761–772. [Google Scholar] [CrossRef]
- Cao, W.T.; Zhou, Y.Y.; Guneralp, B.; Li, X.C.; Zhao, K.G.; Zhang, H.G. Increasing global urban exposure to flooding: An analysis of long-term annual dynamics. Sci. Total Environ. 2022, 817, 153012. [Google Scholar] [CrossRef]
- Erena, S.H.; Worku, H. Urban flood vulnerability assessments: The case of Dire Dawa city, Ethiopia. Nat. Hazards 2019, 97, 495–516. [Google Scholar] [CrossRef]
- Glaus, A.; Mosimann, M.; Rothlisberger, V.; Ingold, K. How flood risks shape policies: Flood exposure and risk perception in Swiss municipalities. Reg. Environ. Change 2020, 20, 120. [Google Scholar] [CrossRef]
- Du, S.Q.; He, C.Y.; Huang, Q.X.; Shi, P.J. How did the urban land in floodplains distribute and expand in China from 1992-2015? Environ. Res. Lett. 2018, 13, 120. [Google Scholar] [CrossRef]
- Tellman, B.; Saiers, J.E.; Cruz, O.A.R. Quantifying the impacts of land use change on flooding in data-poor watersheds in El Salvador with community-based model calibration. Reg. Environ. Change 2016, 16, 1183–1196. [Google Scholar] [CrossRef]
- Luu, C.; von Meding, J.; Mojtahedi, M. Analyzing Vietnam’s national disaster loss database for flood risk assessment using multiple linear regression-TOPSIS. Int. J. Disaster Risk Reduct. 2019, 40, 101153. [Google Scholar] [CrossRef]
- Li, X.N.; Yan, D.H.; Wang, K.; Weng, B.; Qin, T.L.; Liu, S.Y. Flood Risk Assessment of Global Watersheds Based on Multiple Machine Learning Models. Water 2019, 11, 1654. [Google Scholar] [CrossRef] [Green Version]
- Piontek, F.; Muller, C.; Pugh, T.A.M.; Clark, D.B.; Deryng, D.; Elliott, J.; Gonzalez, F.D.C.; Florke, M.; Folberth, C.; Franssen, W.; et al. Multisectoral climate impact hotspots in a warming world. Proc. Natl. Acad. Sci. USA 2014, 111, 3233–3238. [Google Scholar] [CrossRef] [Green Version]
- Visser, H.; Petersen, A.C.; Ligtvoet, W. On the relation between weather-related disaster impacts, vulnerability and climate change. Clim. Change 2014, 125, 461–477. [Google Scholar] [CrossRef]
Figure 1.
The index system of global flood risk. Note: M5DP, maximum 5-day precipitation; LU, land use; RD, road density; ST, soil texture; SL, slope; EL, elevation; PD, population density; ED, economic density; BD, building density; FD, farmland density; FPD, female population density; CPD, child population density; EPD, elderly population density; IS, impervious surface; RD, road density; SD, shelter density; HD, hospital density; GPC, GDP per capita.

Figure 2.
Flowchart for global flood risk assessment and spatiotemporal analysis.

Figure 3.
Spatial distribution of global flood risk on a grid scale in (a) 2005, (b) 2010, (c) 2015, and (d) 2020.
Figure 3.
Spatial distribution of global flood risk on a grid scale in (a) 2005, (b) 2010, (c) 2015, and (d) 2020.

Figure 4.
Validation of GT model.

Figure 5.
Spatial distribution of global flood risk hotspot regions in 2005.

Figure 6.
Temporal evolution of global flood risk hotspot regions.

Figure 7.
Spatial distributions of the national RIFRGs in (a) 2005, (b) 2010, (c) 2015, and (d) 2020.
Figure 7.
Spatial distributions of the national RIFRGs in (a) 2005, (b) 2010, (c) 2015, and (d) 2020.

Figure 8.
Spatial variations in the national RIFRGs across three time periods: (a) 2005–2010, (b) 2010–2015, and (c) 2015–2020.
Figure 8.
Spatial variations in the national RIFRGs across three time periods: (a) 2005–2010, (b) 2010–2015, and (c) 2015–2020.

Figure 9.
National RIFRG changes at different income levels for 2005–2020.


Table 1.
Flood hazard data categories and resources.
| Data Category | Specific Criterium | Resource | Time | Resolution |
|---|---|---|---|---|
| Precipitation | Maximum 5-day precipitation (mm) | NASA | 2003–2020 | 0.1° × 0.1° |
| Land use | Land use | NASA | 2005, 2010, 2015 | 0.5 km × 0.5 km |
| GLOBELAND30 | 2020 | 30 m × 30 m | ||
| NDVI | NDVI | NASA | 2005, 2010, 2015, 2020 | 0.05° × 0.05° |
| River | River density (km/km2) | OpenStreetMap | 2021 | 1:50,000 |
| Soil | Soil texture | FAO | 2008 | 1 km × 1 km |
| DEM | Elevation (m) | SRTM | 2010 | 1 km × 1 km |
| Slope (°) |
Table 2.
Classes of flood hazard factors and their ratings.
| Number | Hazard Index | Classes | Rating |
|---|---|---|---|
| 1 | Maximum 5-day precipitation | 0–24.53 | 1 |
| 24.53–40.31 | 2 | ||
| 40.31–61.33 | 3 | ||
| 61.33–89.37 | 4 | ||
| 89.37–446.86 | 5 | ||
| 2 | Land use | Forest | 1 |
| Grasslands | 2 | ||
| Farmland | 3 | ||
| Permanent wetlands | 4 | ||
| Build up areas | 5 | ||
| Water bodies | 5 | ||
| 3 | NDVI | −0.16–0.07 | 5 |
| 0.07–0.13 | 4 | ||
| 0.13–0.22 | 3 | ||
| 0.22–0.32 | 2 | ||
| 0.32–0.72 | 1 | ||
| 4 | River density | 0–0.09 | 1 |
| 0.09–0.19 | 2 | ||
| 0.19–0.28 | 3 | ||
| 0.28–0.43 | 4 | ||
| 0.43–4.72 | 5 | ||
| 5 | Soil texture | Silt loam | 1 |
| Clay loam | 1 | ||
| Loam sand | 1 | ||
| Silty clay | 2 | ||
| Sandy loam | 2 | ||
| Silty clay loam | 2 | ||
| Sand | 2 | ||
| Loam | 3 | ||
| Clay | 3 | ||
| Sandy clay loam | 4 | ||
| Clay(heavy) | 5 | ||
| 6 | Slope | 0–1.39 | 5 |
| 1.39–4.45 | 4 | ||
| 4.45–8.90 | 3 | ||
| 8.90–15.29 | 2 | ||
| 15.29–70.91 | 1 | ||
| 7 | Elevation | −415–104.94 | 5 |
| 104.94–278.25 | 4 | ||
| 278.25–520.89 | 3 | ||
| 520.89–1075.50 | 2 | ||
| 1075.50–8424 | 1 |
Table 3.
Flood vulnerability data categories and resources.
| Data Category | Specific Criterium | Resource | Time | Resolution |
|---|---|---|---|---|
| Population | Population density (person/km2) | World Pop | 2005, 2010, 2015, 2020 | 1 km × 1 km |
| Female population density (person/km2) | ||||
| Child population density (person/km2) | ||||
| Elderly population density (person/km2) | ||||
| Economy | Economic density (dollar/km2) | Dryad | 2005, 2010, 2015 | 5′ × 5′ |
| CGER | 2020 | 0.5° × 0.5° | ||
| Land use | Building density (%) | NASA, | 2005, 2010 | 0.05° × 0.05° |
| Farmland density (%) | GLOBELAND30 | 2015, 2020 | 30 m × 30 m | |
| Infrastructure | Shelter density (number/km2) | OpenStreetMap | 2021 | 1:50,000 |
| Hospital density (number/km2) | ||||
| Impervious surface | Impervious surface (%) | GHSL | 2014 | 30 m × 30 m |
| Road | Road density (km/km2) | OpenStreetMap | 2021 | 1:50,000 |
Table 4.
Hazard index weights obtained via the three methods.
| Year | Method | Hazard Index | ||||||
|---|---|---|---|---|---|---|---|---|
| M5DP | LU | NDVI | RD | ST | SL | EL | ||
| 2005 | TFN-AHP | 0.258 | 0.165 | 0.116 | 0.197 | 0.149 | 0.040 | 0.075 |
| EM | 0.127 | 0.204 | 0.125 | 0.202 | 0.115 | 0.106 | 0.121 | |
| GT | 0.246 | 0.169 | 0.116 | 0.198 | 0.146 | 0.046 | 0.079 | |
| 2010 | TFN-AHP | 0.258 | 0.165 | 0.116 | 0.197 | 0.149 | 0.040 | 0.075 |
| EM | 0.126 | 0.202 | 0.128 | 0.203 | 0.115 | 0.105 | 0.121 | |
| GT | 0.246 | 0.169 | 0.117 | 0.197 | 0.146 | 0.046 | 0.079 | |
| 2015 | TFN-AHP | 0.258 | 0.165 | 0.116 | 0.197 | 0.149 | 0.040 | 0.075 |
| EM | 0.126 | 0.199 | 0.127 | 0.204 | 0.116 | 0.105 | 0.123 | |
| GT | 0.247 | 0.168 | 0.117 | 0.198 | 0.146 | 0.045 | 0.079 | |
| 2020 | TFN-AHP | 0.258 | 0.165 | 0.116 | 0.197 | 0.149 | 0.040 | 0.075 |
| EM | 0.123 | 0.212 | 0.126 | 0.201 | 0.114 | 0.104 | 0.120 | |
| GT | 0.239 | 0.172 | 0.117 | 0.198 | 0.144 | 0.049 | 0.081 | |
Table 5.
Vulnerability index weights obtained via the three methods.
| Year | Method | Exposure | Sensitivity | Coping Capacity | |||||||||
|---|---|---|---|---|---|---|---|---|---|---|---|---|---|
| PD | ED | BD | FD | FP | CP | OP | IS | RD | SD | HD | GPC | ||
| 2005 | TFN-AHP | 0.337 | 0.263 | 0.215 | 0.185 | 0.252 | 0.183 | 0.231 | 0.334 | 0.373 | 0.250 | 0.170 | 0.207 |
| EM | 0.224 | 0.288 | 0.297 | 0.191 | 0.218 | 0.216 | 0.223 | 0.343 | 0.079 | 0.491 | 0.246 | 0.184 | |
| GT | 0.295 | 0.273 | 0.245 | 0.187 | 0.237 | 0.197 | 0.228 | 0.338 | 0.173 | 0.414 | 0.222 | 0.191 | |
| 2010 | TFN-AHP | 0.337 | 0.263 | 0.215 | 0.185 | 0.252 | 0.183 | 0.231 | 0.334 | 0.373 | 0.250 | 0.170 | 0.207 |
| EM | 0.226 | 0.284 | 0.298 | 0.192 | 0.219 | 0.217 | 0.219 | 0.345 | 0.080 | 0.497 | 0.250 | 0.173 | |
| GT | 0.297 | 0.271 | 0.245 | 0.187 | 0.235 | 0.201 | 0.224 | 0.340 | 0.173 | 0.419 | 0.224 | 0.184 | |
| 2015 | TFN-AHP | 0.337 | 0.263 | 0.215 | 0.185 | 0.252 | 0.183 | 0.231 | 0.334 | 0.373 | 0.251 | 0.170 | 0.206 |
| EM | 0.227 | 0.283 | 0.299 | 0.191 | 0.220 | 0.214 | 0.220 | 0.346 | 0.080 | 0.497 | 0.249 | 0.174 | |
| GT | 0.298 | 0.270 | 0.245 | 0.187 | 0.234 | 0.200 | 0.225 | 0.341 | 0.173 | 0.418 | 0.224 | 0.185 | |
| 2020 | TFN-AHP | 0.337 | 0.263 | 0.215 | 0.185 | 0.252 | 0.183 | 0.231 | 0.334 | 0.373 | 0.250 | 0.170 | 0.207 |
| EM | 0.278 | 0.313 | 0.223 | 0.186 | 0.218 | 0.213 | 0.230 | 0.339 | 0.067 | 0.420 | 0.211 | 0.302 | |
| GT | 0.307 | 0.290 | 0.233 | 0.170 | 0.245 | 0.189 | 0.231 | 0.335 | 0.180 | 0.357 | 0.196 | 0.267 | |
Table 6.
Statistics of global flood risk grades for 2005, 2010, 2015, and 2020.
| Risk Grade | 2005 | 2010 | ||||
|---|---|---|---|---|---|---|
| GN | AP | RIFRG | GN | AP | RIFRG | |
| Very low | 265,777 | 36.81 | 1.819 | 250,110 | 34.64 | 1.865 |
| Low | 361,158 | 50.02 | 360,941 | 49.99 | ||
| Medium | 64,044 | 8.87 | 78,629 | 10.89 | ||
| High | 22,094 | 3.06 | 22,960 | 3.18 | ||
| Very high | 8953 | 1.24 | 9387 | 1.30 | ||
| Risk grade | 2015 | 2020 | ||||
| GN | AP | RIFRG | GN | AP | RIFRG | |
| Very low | 259,713 | 35.97 | 1.867 | 230,976 | 31.99 | 1.935 |
| Low | 341,374 | 47.28 | 354,299 | 49.07 | ||
| Medium | 87,726 | 12.15 | 100,506 | 13.92 | ||
| High | 23,682 | 3.28 | 25,488 | 3.53 | ||
| Very high | 9532 | 1.32 | 10,758 | 1.49 | ||
Note: GN stands for the number of grids, and AP stands for the areal percentage.
Table 7.
RIFRG values and changes for the 20 countries at the highest global flood risk (2005–2020).
Table 7.
RIFRG values and changes for the 20 countries at the highest global flood risk (2005–2020).
| Country | RIFRG | Rate of Change (%) | |||||
|---|---|---|---|---|---|---|---|
| 2005 | 2010 | 2015 | 2020 | 2005–2010 | 2010–2015 | 2015–2020 | |
| Singapore | 4.987 | 4.987 | 4.993 | 4.993 | 0 | 0.12% | 0 |
| Madagascar | 4.534 | 4.591 | 4.239 | 4.323 | 1.26% | −7.67% | 1.98% |
| Bangladesh | 4.399 | 4.397 | 4.485 | 4.571 | −0.05% | 2.00% | 1.92% |
| Mauritius | 3.776 | 3.888 | 3.776 | 4.060 | 2.97% | −2.88% | 7.52% |
| Netherlands | 3.658 | 3.567 | 3.453 | 3.918 | −2.49% | −3.20% | 13.47% |
| Bahrain | 3.632 | 4.031 | 4.031 | 4.017 | 10.99% | 0 | −0.35% |
| Belgium | 3.478 | 3.350 | 3.376 | 3.872 | −3.68% | 0.78% | 14.69% |
| India | 3.388 | 3.438 | 3.475 | 3.470 | 1.48% | 1.08% | −0.14% |
| Haiti | 3.096 | 3.232 | 3.375 | 2.920 | 4.39% | 4.42% | −13.48% |
| Liechtenstein | 3.041 | 2.776 | 2.888 | 2.888 | −8.71% | 4.03% | 0 |
| Trinidad and Tobago | 2.994 | 3.110 | 2.840 | 3.087 | 3.87% | −8.68% | 8.70% |
| Japan | 2.972 | 2.864 | 2.828 | 3.260 | −3.63% | −1.26% | 15.28% |
| South Korea | 2.944 | 2.975 | 2.961 | 3.380 | 1.05% | −0.47% | 14.15% |
| Rwanda | 2.944 | 2.928 | 3.302 | 3.215 | −0.54% | 12.77% | −2.63% |
| Germany | 2.900 | 2.876 | 2.857 | 3.264 | −0.83% | −0.66% | 14.25% |
| El Salvador | 2.884 | 2.774 | 2.787 | 3.318 | −3.81% | 0.47% | 19.05% |
| Philippines | 2.845 | 2.901 | 3.014 | 2.952 | 1.97% | 3.90% | −2.06% |
| Sri Lanka | 2.840 | 2.846 | 2.836 | 3.059 | 0.21% | −0.35% | 7.86% |
| Israel | 2.826 | 2.862 | 2.850 | 3.110 | 1.27% | −0.42% | 9.12% |
| Vietnam | 2.815 | 2.818 | 2.872 | 2.955 | 0.11% | 1.92% | 2.89% |
Table 8.
Statistics of continental RIFRG values for 2005, 2010, 2015, and 2020.
| Continent | RIFRG | Interannual Variation | |||||
|---|---|---|---|---|---|---|---|
| 2005 | 2010 | 2015 | 2020 | 2005–2010 | 2010–2015 | 2015–2020 | |
| Africa | 1.770 | 1.817 | 1.766 | 1.777 | 0.047 | −0.051 | 0.011 |
| Asia | 1.989 | 2.027 | 2.072 | 2.181 | 0.038 | 0.045 | 0.109 |
| Oceania | 1.796 | 1.806 | 1.813 | 1.836 | 0.010 | 0.0073 | 0.0233 |
| Europe | 1.775 | 1.854 | 1.852 | 1.995 | 0.079 | −0.002 | 0.143 |
| North America | 1.717 | 1.735 | 1.760 | 1.837 | 0.018 | 0.025 | 0.077 |
| South America | 1.911 | 1.983 | 1.963 | 1.977 | 0.072 | −0.020 | 0.014 |
Publisher’s Note: MDPI stays neutral with regard to jurisdictional claims in published maps and institutional affiliations. |
© 2022 by the authors. Licensee MDPI, Basel, Switzerland. This article is an open access article distributed under the terms and conditions of the Creative Commons Attribution (CC BY) license (https://creativecommons.org/licenses/by/4.0/).
Share and Cite
MDPI and ACS Style
Duan, Y.; Xiong, J.; Cheng, W.; Li, Y.; Wang, N.; Shen, G.; Yang, J. Increasing Global Flood Risk in 2005–2020 from a Multi-Scale Perspective. Remote Sens. 2022, 14, 5551. https://doi.org/10.3390/rs14215551
AMA Style
Duan Y, Xiong J, Cheng W, Li Y, Wang N, Shen G, Yang J. Increasing Global Flood Risk in 2005–2020 from a Multi-Scale Perspective. Remote Sensing. 2022; 14(21):5551. https://doi.org/10.3390/rs14215551
Chicago/Turabian StyleDuan, Yu, Junnan Xiong, Weiming Cheng, Yi Li, Nan Wang, Gaoyun Shen, and Jiawei Yang. 2022. "Increasing Global Flood Risk in 2005–2020 from a Multi-Scale Perspective" Remote Sensing 14, no. 21: 5551. https://doi.org/10.3390/rs14215551
Note that from the first issue of 2016, this journal uses article numbers instead of page numbers. See further details here.