
The Initial Performance Evaluation of Mixed Multi-Frequency Undifferenced and Uncombined BDS-2/3 Precise Point Positioning under Urban Environmental Conditions


Abstract
:1. Introduction
2. Methodology
3. Experiment and Discussion
3.1. Static Experiment
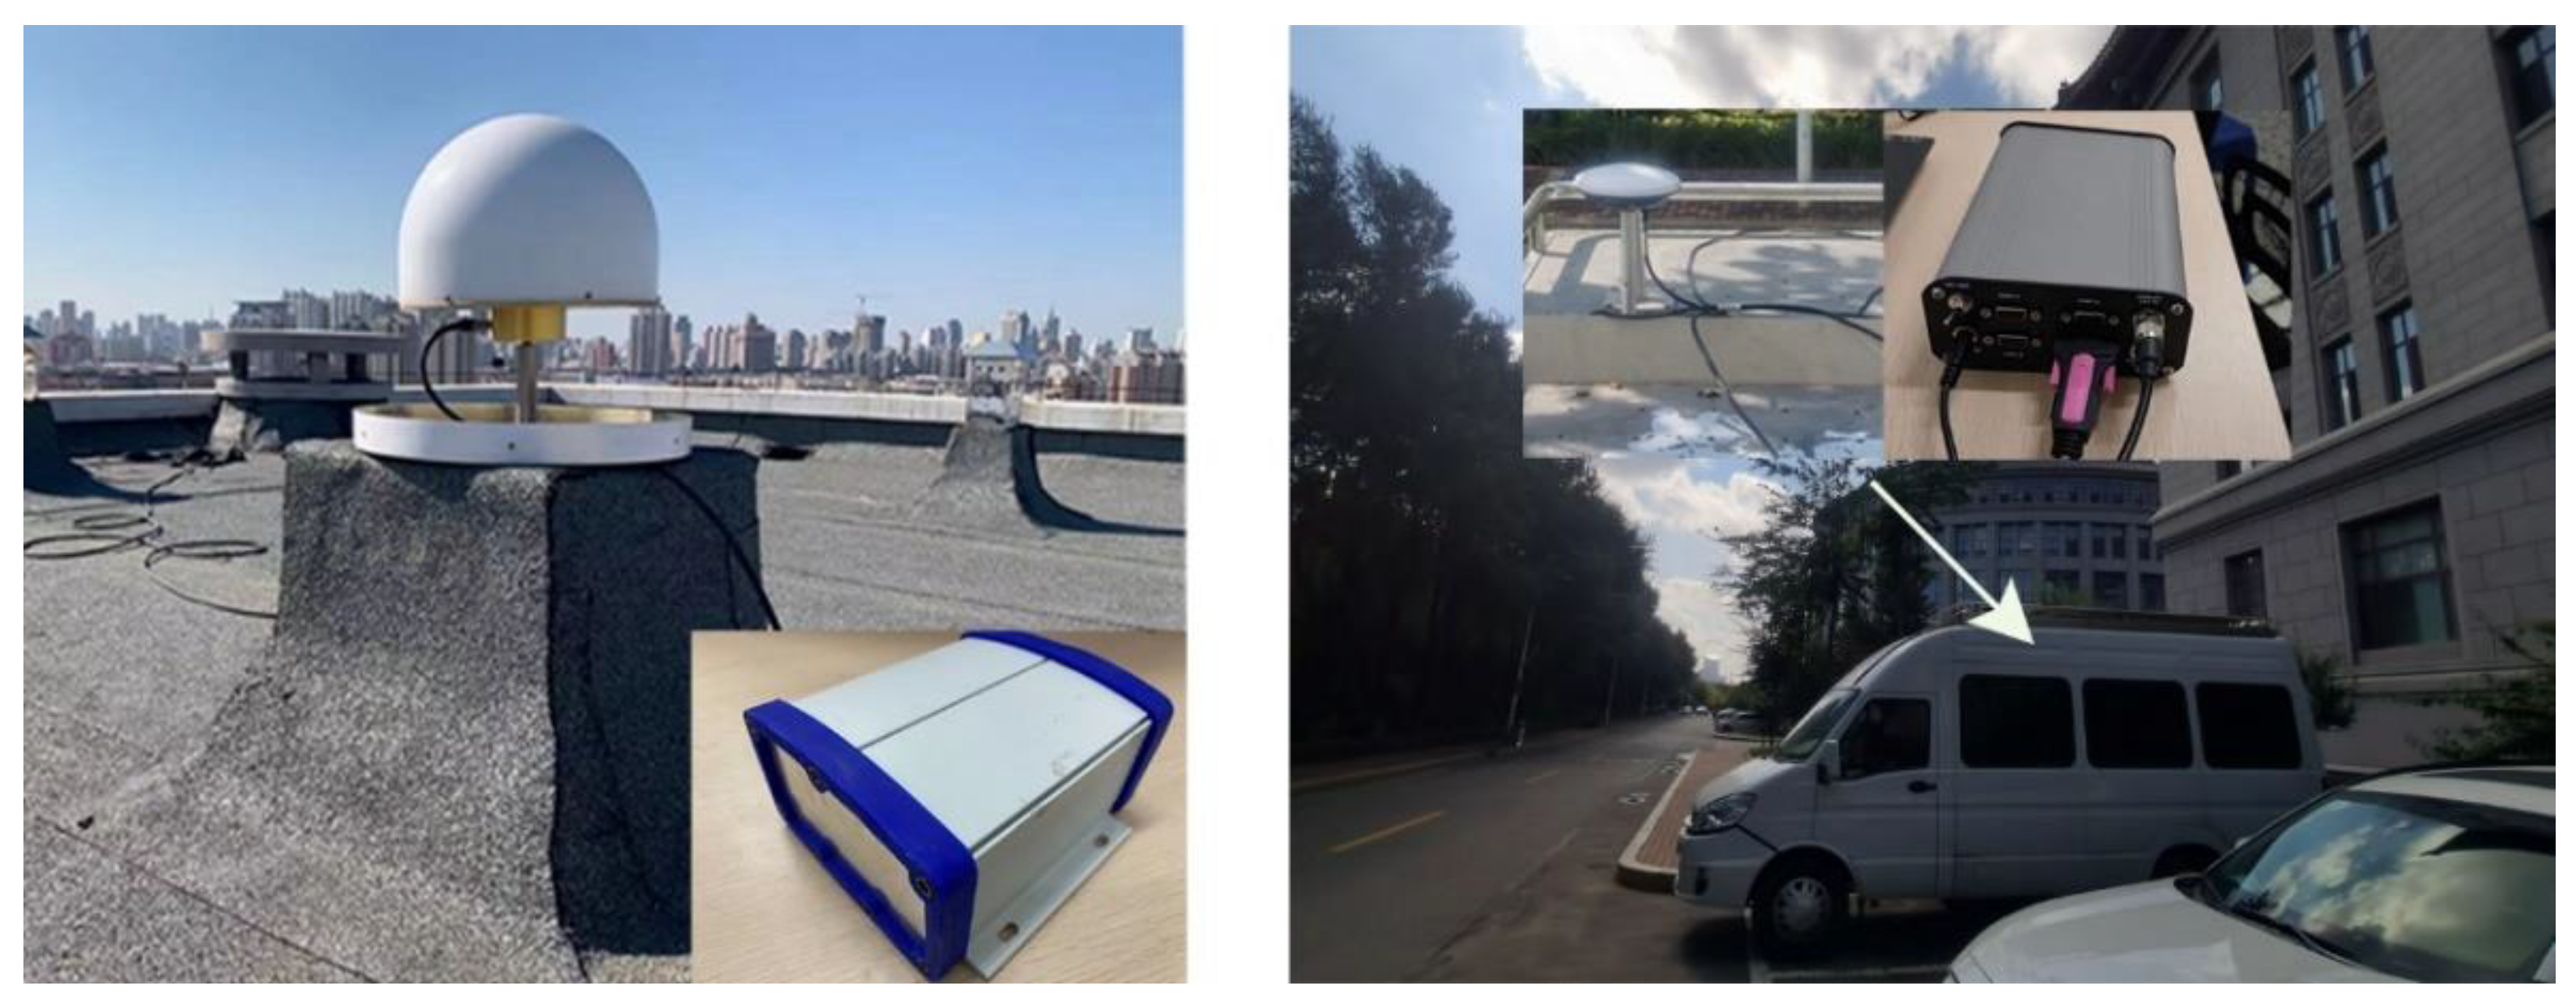
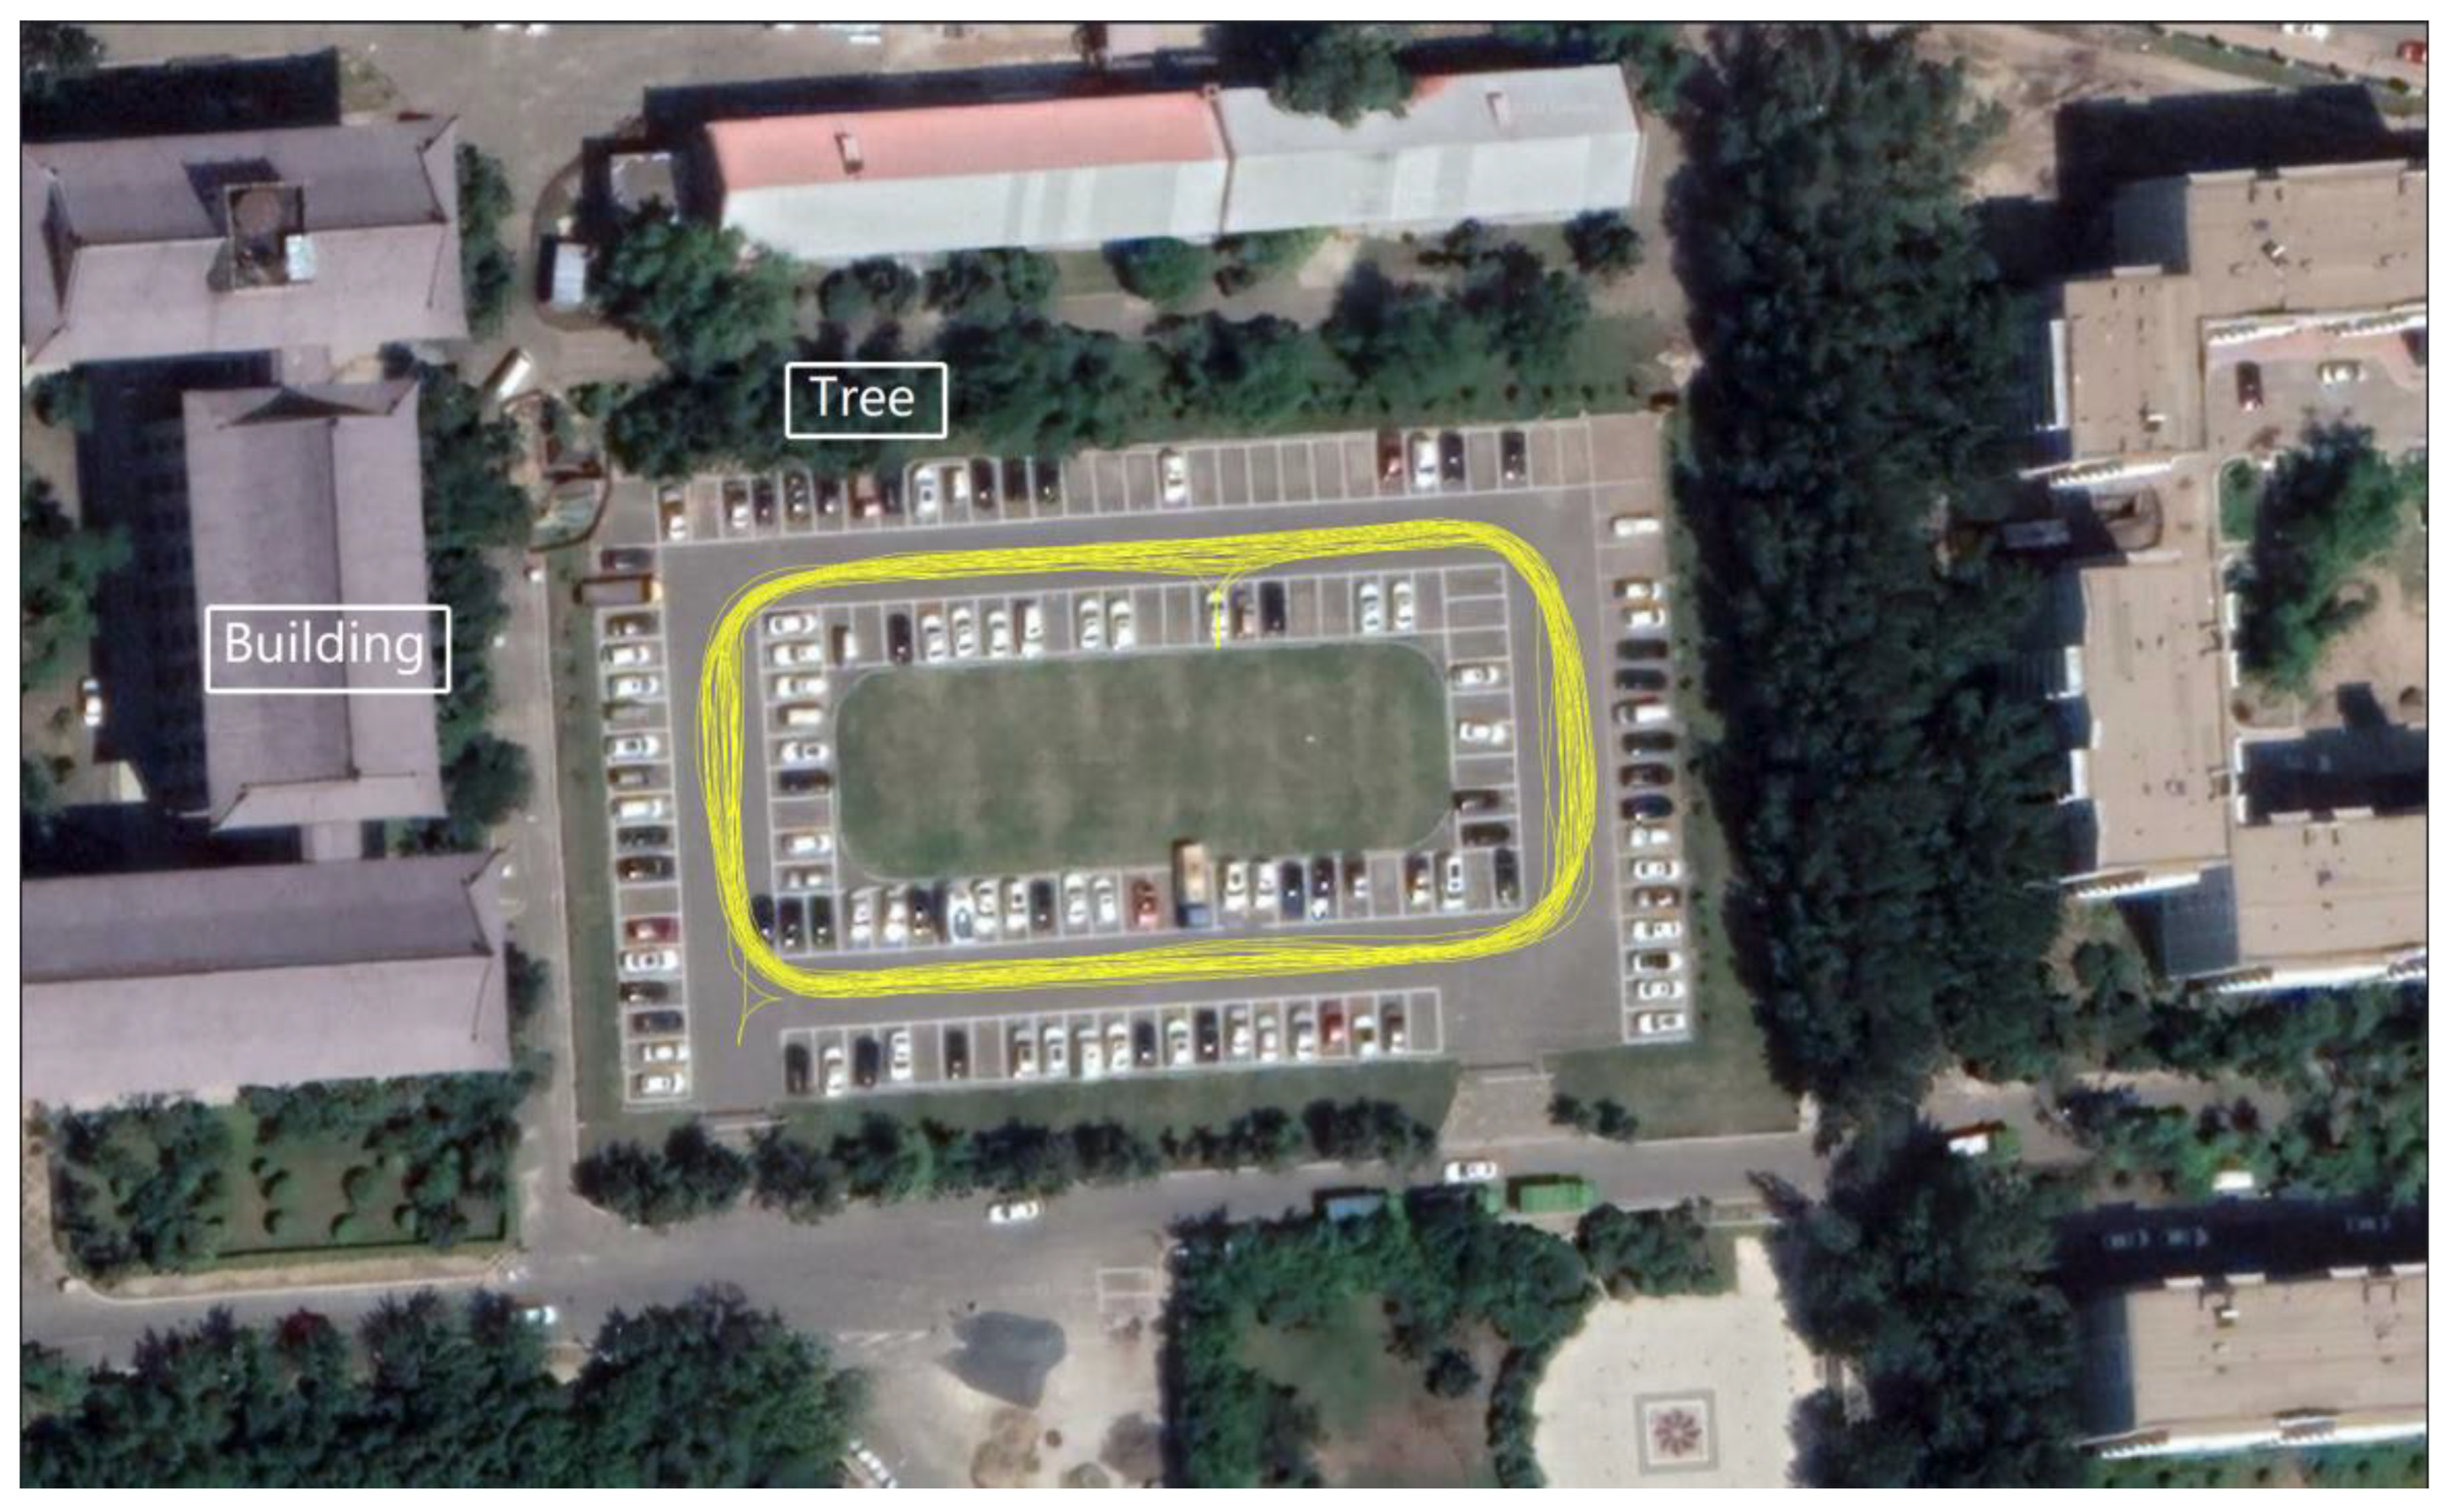
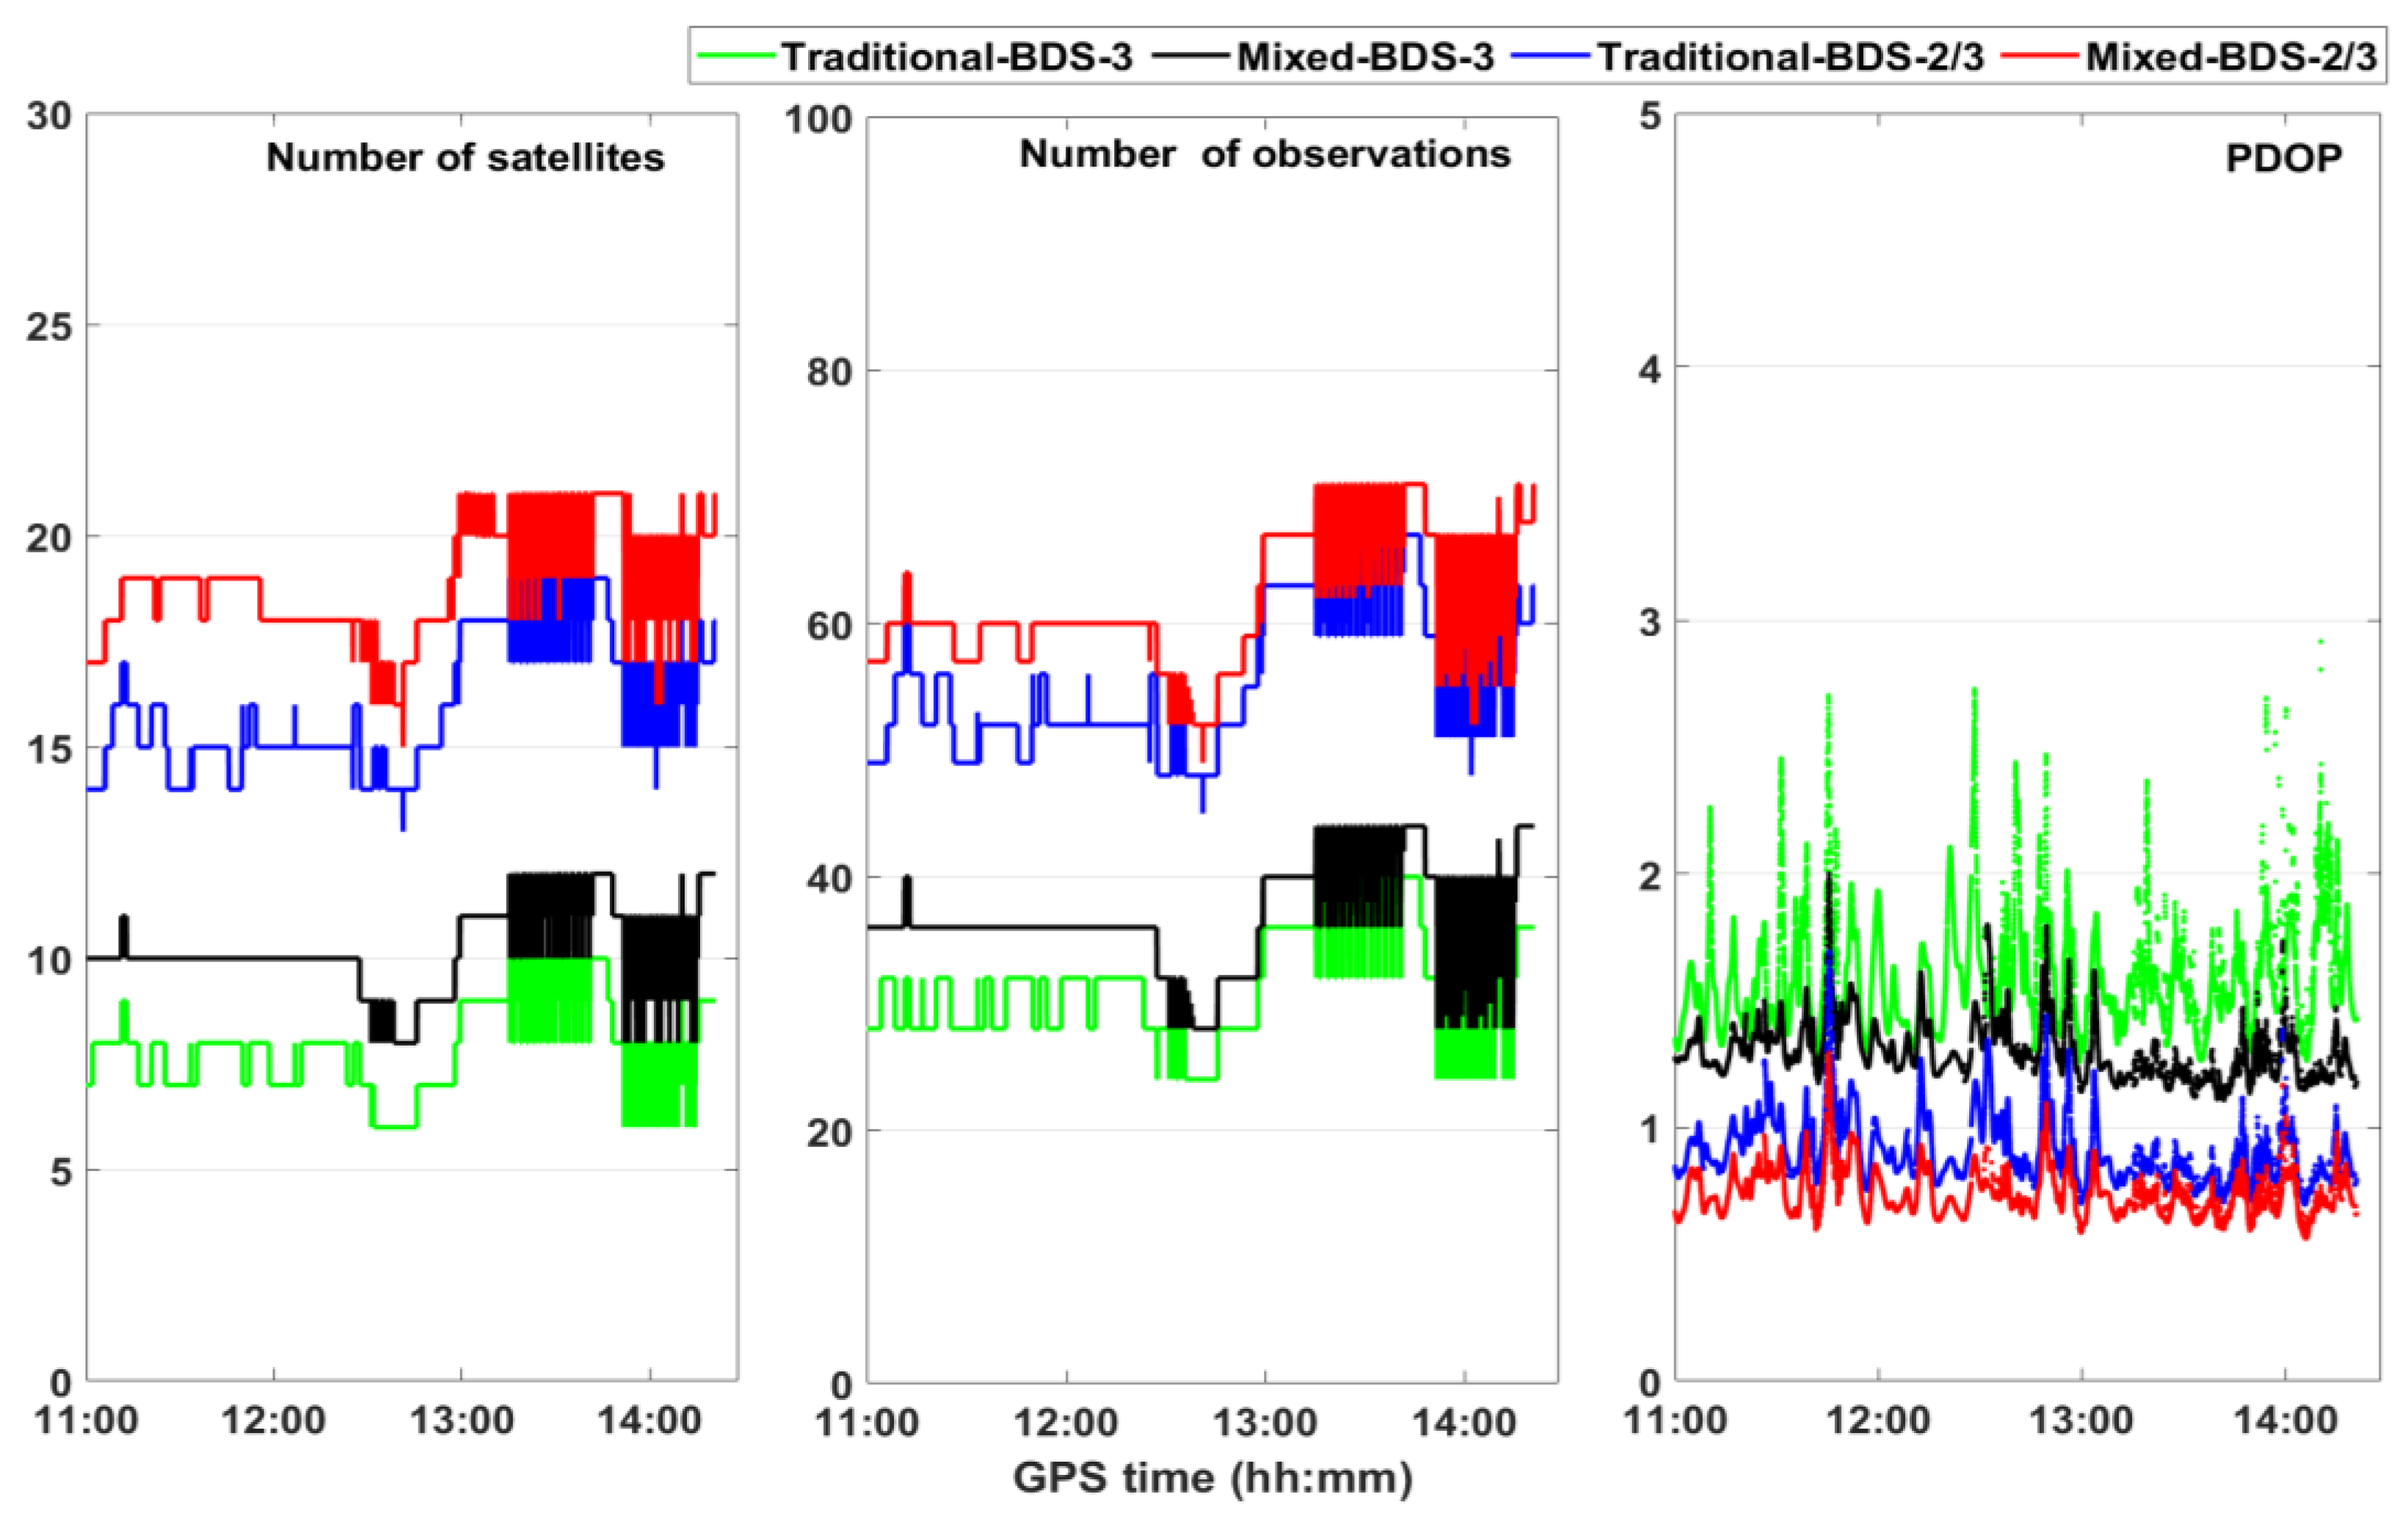
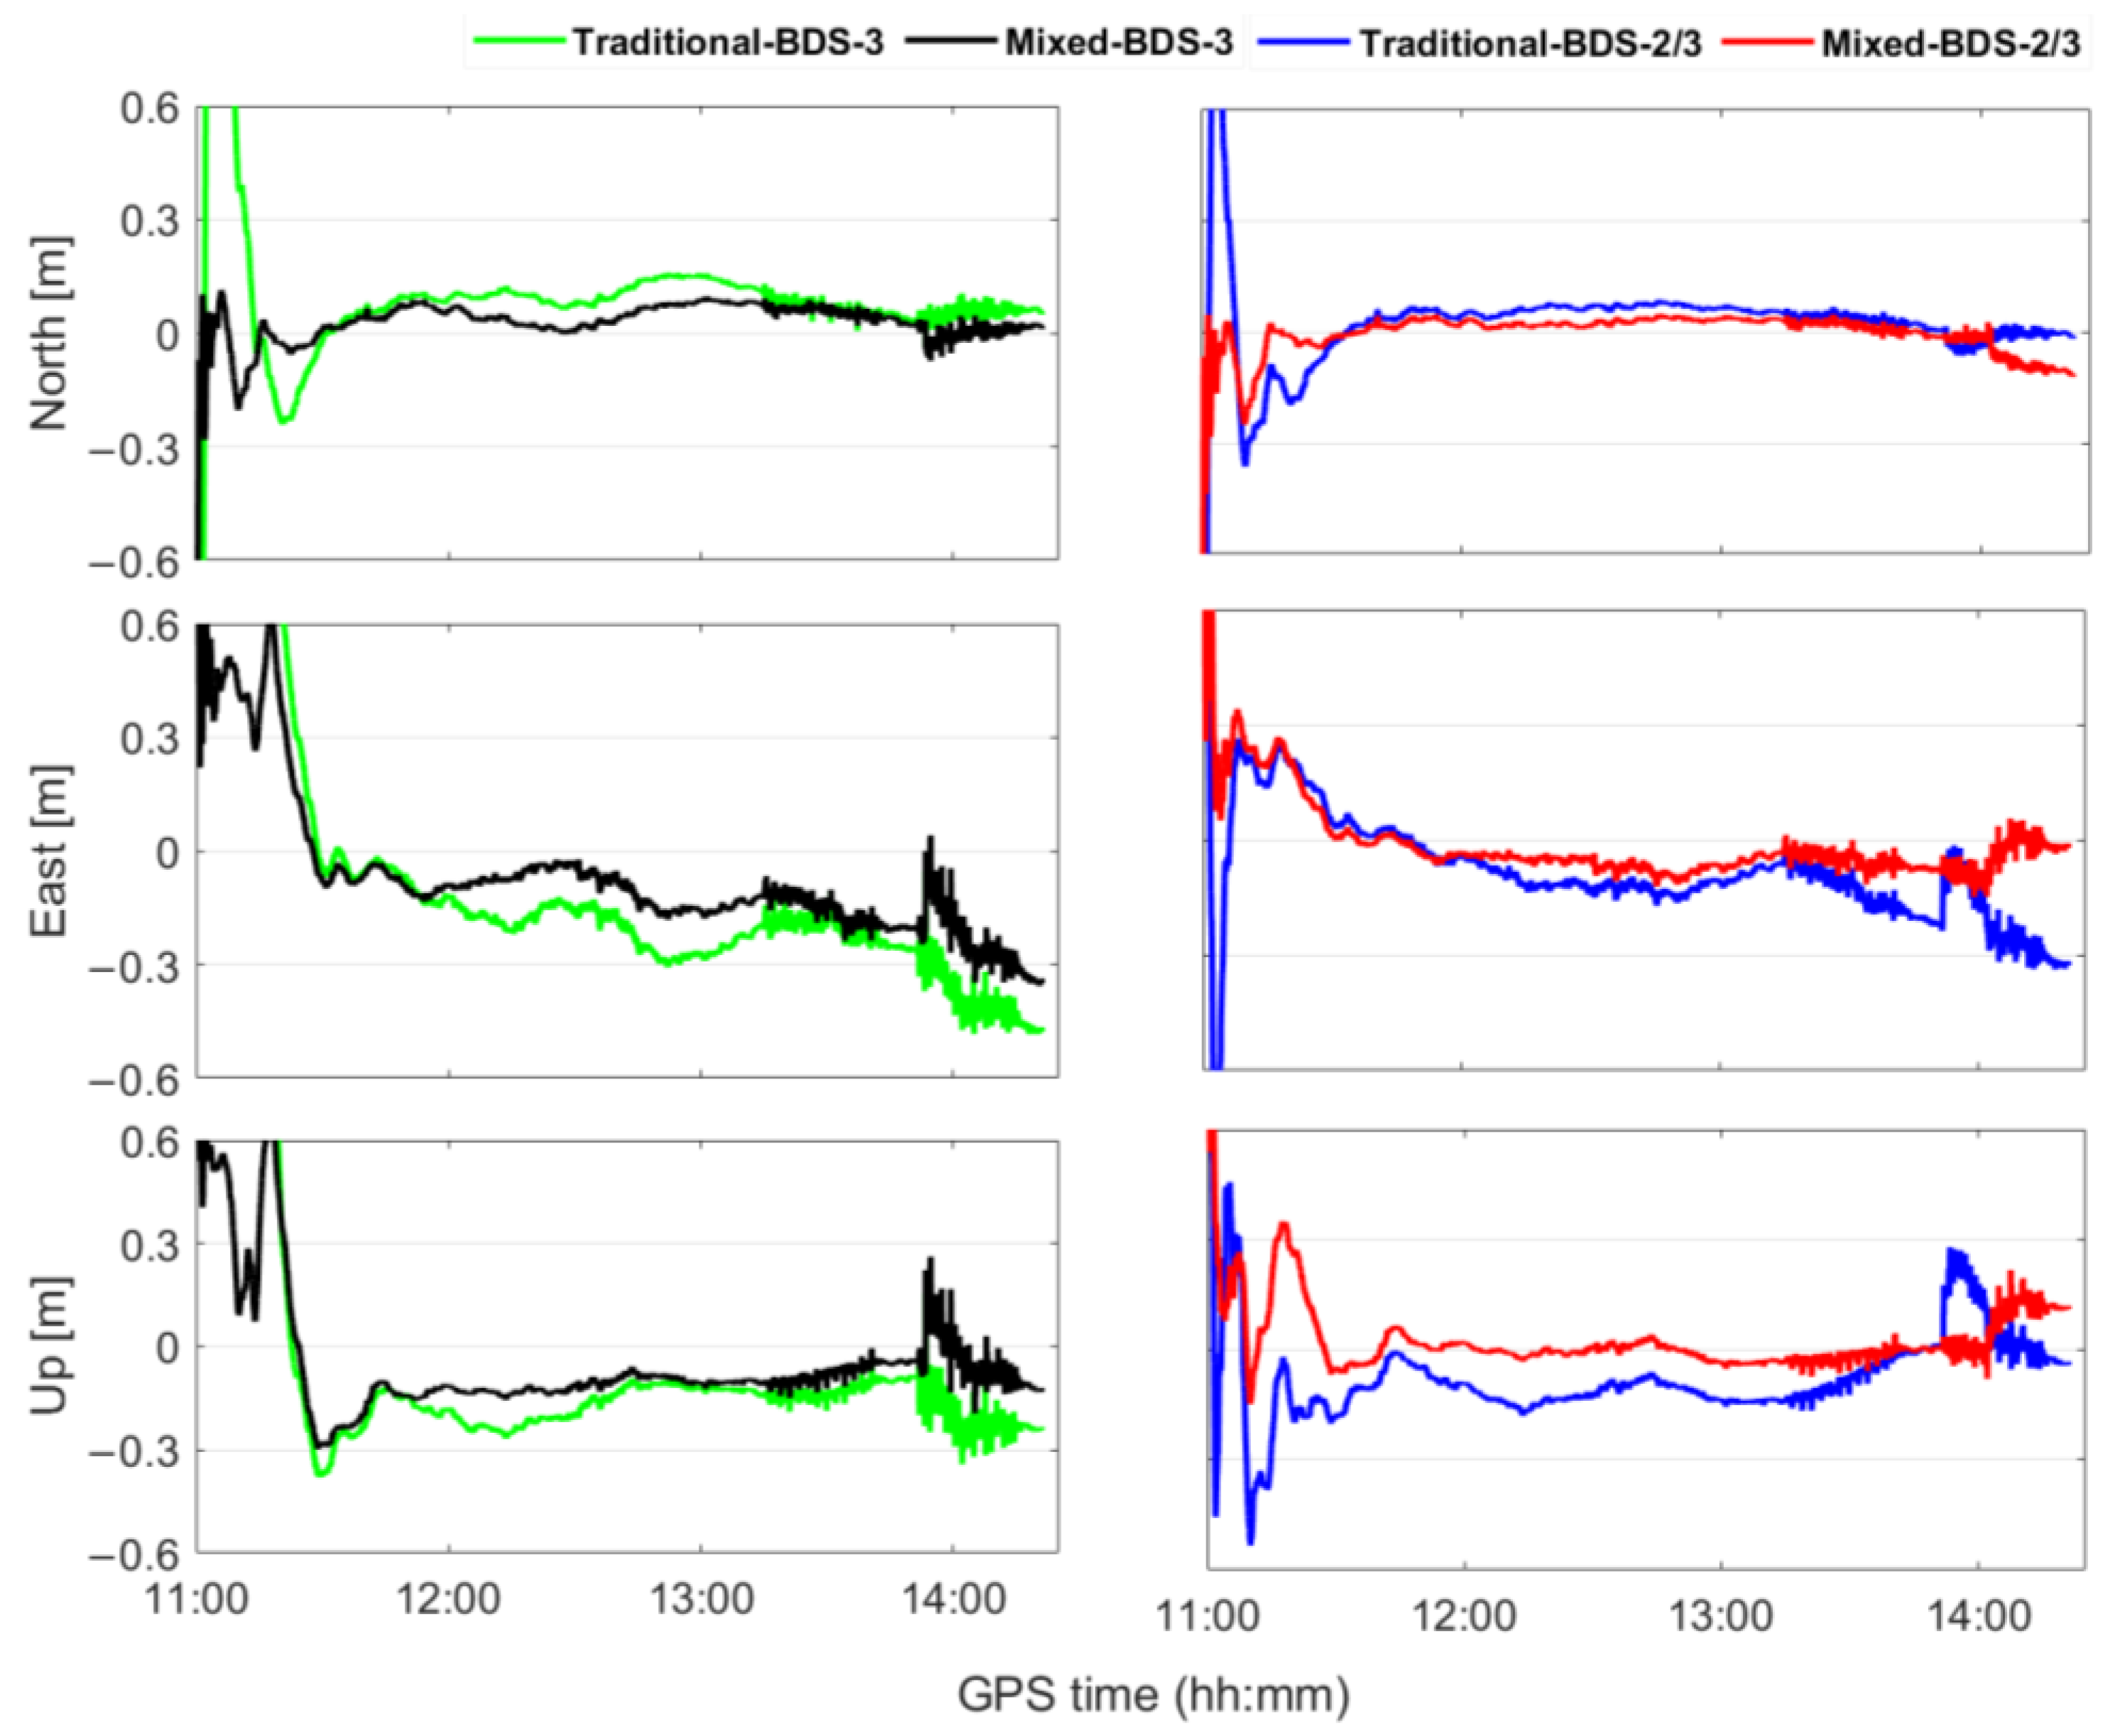
3.2. Kinematic Experiment
4. Discussion
5. Conclusions
Author Contributions
Funding
Data Availability Statement
Acknowledgments
Conflicts of Interest
References
- Zumberge, J.F.; Heflin, M.B.; Jefferson, D.C.; Watkins, M.M.; Webb, F.H. Precise point positioning for the efficient and robust analysis of GPS data from large networks. J. Geophys. Res. Solid Earth 1997, 102, 5005–5017. [Google Scholar] [CrossRef] [Green Version]
- Duan, B.B.; Hugentobler, U.; Chen, J.P.; Selmke, I.; Wang, J.X. Prediction versus real-time orbit determination for GNSS satellites. GPS Solut. 2019, 23, 10. [Google Scholar] [CrossRef]
- Geng, T.; Su, X.; Fang, R.X.; Xie, X.; Zhao, Q.L.; Liu, J.N. BDS Precise Point Positioning for Seismic Displacements Monitoring: Benefit from the High-Rate Satellite Clock Corrections. Sensors 2016, 16, 14. [Google Scholar] [CrossRef] [PubMed]
- Tegedor, J.; Lapucha, D.; Orpen, O.; Vigen, E.; Melgard, T.; Strandli, R.; Inst, N. The new G4 service: Multi-constellation Precise Point Positioning including GPS, GLONASS, Galileo and BeiDou. In Proceedings of the 28th International Technical Meeting of The Satellite-Division-of-the-Institute-of-Navigation (ION GNSS+), Tampa, FL, USA, 14–18 September 2015; pp. 1089–1095. [Google Scholar]
- Dai, L.W.; Chen, Y.Q.; Lie, A.; Zeitzew, M.; Zhang, Y.K.; Inst, N. StarFire (TM) SF3 Worldwide Centimeter-Accurate Real Time GNSS Positioning. In Proceedings of the 29th International Technical Meeting of The-Satellite-Division-of-the-Institute-of-Navigation, Portland, OR, USA, 12–16 September 2016; pp. 3295–3319. [Google Scholar]
- Leandro, R.; Landau, H.; Nitschke, M.; Glocker, M.; Seeger, S.; Chen, X.M.; Deking, A.; BenTahar, M.; Zhang, F.P.; Ferguson, K.; et al. RTX Positioning: The Next Generation of cm-accurate Real-Time GNSS Positioning. In Proceedings of the 24th International Technical Meeting of the Satellite Division of the Institute of Navigation, Nashville, TN, USA, 19–23 September 2010; pp. 1460–1475. [Google Scholar]
- Li, M.; Xu, T.; Guan, M.; Gao, F.; Jiang, N. LEO-constellation-augmented multi-GNSS real-time PPP for rapid re-convergence in harsh environments. GPS Solut. 2022, 26, 29. [Google Scholar] [CrossRef]
- Wang, L.; Li, Z.S.; Ge, M.R.; Neitzel, F.; Wang, X.M.; Yuan, H. Investigation of the performance of real-time BDS-only precise point positioning using the IGS real-time service. GPS Solut. 2019, 23, 12. [Google Scholar] [CrossRef]
- Guo, F.; Zhang, X.H.; Wang, J.L.; Ren, X.D. Modeling and assessment of triple-frequency BDS precise point positioning. J. Geod. 2016, 90, 1223–1235. [Google Scholar] [CrossRef]
- Zhao, Q.; Pan, S.G.; Gao, C.F.; Gao, W.; Xia, Y. BDS/GPS/LEO triple-frequency uncombined precise point positioning and its performance in harsh environments. Measurement 2020, 151, 11. [Google Scholar] [CrossRef]
- Lu, R.; Chen, W.; Zhang, C.L.; Li, L.; Peng, Y.; Zheng, Z.Q. Characteristics of the BDS-3 multipath effect and mitigation methods using precise point positioning. GPS Solut. 2022, 26, 17. [Google Scholar] [CrossRef]
- Srinivasu, V.K.D.; Dashora, N.; Prasad, D.; Niranjan, K. Loss of lock on GNSS signals and its association with ionospheric irregularities observed over Indian low latitudes. GPS Solut. 2022, 26, 12. [Google Scholar] [CrossRef]
- Yang, F.X.; Zhao, L.; Li, L.; Feng, S.J.; Cheng, J.H. Performance Evaluation of Kinematic BDS/GNSS Real-Time Precise Point Positioning for Maritime Positioning. J. Navig. 2019, 72, 34–52. [Google Scholar] [CrossRef]
- Cai, C.S.; Gao, Y. Modeling and assessment of combined GPS/GLONASS precise point positioning. GPS Solut. 2013, 17, 223–236. [Google Scholar] [CrossRef]
- Wang, K.; Khodabandeh, A.; Teunissen, P.J.G. Five-frequency Galileo long-baseline ambiguity resolution with multipath mitigation. GPS Solut. 2018, 22, 14. [Google Scholar] [CrossRef] [Green Version]
- Yang, Y.X.; Xu, Y.Y.; Li, J.L.; Yang, C. Progress and performance evaluation of BeiDou global navigation satellite system: Data analysis based on BDS-3 demonstration system. Sci. China-Earth Sci. 2018, 61, 614–624. [Google Scholar] [CrossRef]
- CSNO. BeiDou Navigation Satellite System Signal in Space Interface Control Document Open Service Signal B2b (Beta Version). 2019. Available online: http://www.beidou.gov.cn/xt/gfxz/202008/P020200803362059116442.pdf (accessed on 24 October 2019).
- Zhu, S.L.; Yue, D.J.; He, L.N.; Chen, J.; Liu, Z.Q. Modeling and performance assessment of BDS-2/BDS-3 triple-frequency ionosphere-free and uncombined precise point positioning. Measurement 2021, 180, 109564. [Google Scholar] [CrossRef]
- Kuang, K.F.; Wang, J.; Han, H.Z. Real-Time BDS-3 Clock Estimation with a Multi-Frequency Uncombined Model including New B1C/B2a Signals. Remote Sens. 2022, 14, 14. [Google Scholar] [CrossRef]
- Pan, L.; Li, X.P.; Yu, W.K.; Dai, W.J.; Kuang, C.L.; Chen, J.; Chen, F.D.; Xia, P.F. Performance Evaluation of Real-Time Precise Point Positioning with Both BDS-3 and BDS-2 Observations. Sensors 2020, 20, 20. [Google Scholar] [CrossRef]
- Zhang, J.; Zhao, L.; Yang, F.X.; Li, L.; Liu, X.S.; Zhang, R.Z. Integrity monitoring for undifferenced and uncombined PPP under local environmental conditions. Meas. Sci. Technol. 2022, 33, 12. [Google Scholar] [CrossRef]
- Li, X.; Li, X.X.; Liu, G.G.; Yuan, Y.Q.; Freeshah, M.; Zhang, K.K.; Zhou, F. BDS multi-frequency PPP ambiguity resolution with new B2a/B2b/B2a+b signals and legacy B1I/B3I signals. J. Geod. 2020, 94, 15. [Google Scholar] [CrossRef]
- He, C.; Wang, Z.Q.; Yang, H.Z. Performance Evaluation for BDS-2+BDS-3 Combined Precision Point Positioning. In Proceedings of the 7th IEEE International Conference on Computer Science and Network Technology (ICCSNT), Dalian, China, 19–20 October 2019; pp. 396–400. [Google Scholar]
- Bu, J.W.; Yu, K.G.; Qian, N.J.; Zuo, X.Q.; Chang, J. Performance Assessment of Positioning Based on Multi-Frequency Multi-GNSS Observations: Signal Quality, PPP and Baseline Solution. IEEE Access 2021, 9, 5845–5861. [Google Scholar] [CrossRef]
- Zhang, W.J.; Yang, H.Z.; He, C.; Wang, Z.Q.; Shao, W.P.; Zhang, Y.F.; Wang, J. Initial Performance Evaluation of Precise Point Positioning with Triple-Frequency Observations from BDS-2 and BDS-3 Satellites. J. Navig. 2020, 73, 763–775. [Google Scholar] [CrossRef]
- Cao, X.Y.; Shen, F.; Zhang, S.J.; Li, J.C. Satellite availability and positioning performance of uncombined precise point positioning using BeiDou-2 and BeiDou-3 multi-frequency signals. Adv. Space Res. 2021, 67, 1303–1316. [Google Scholar] [CrossRef]
- Wu, Z.Y.; Wang, Q.X.; Hu, C.; Yu, Z.H.; Wu, W. Modeling and assessment of five-frequency BDS precise point positioning. Satell. Navig. 2022, 3, 14. [Google Scholar] [CrossRef]
- Zhang, B.C. Study on the Theoretical Methodology and Applications of Precise Point Positioning Using Undifferenced and Uncombined GNSS Data. Acta Geod. Cartogr. Sin. 2014, 43, 1099. [Google Scholar]
- Li, Y.J.; Cai, C.S. A mixed single- and dual-frequency quad-constellation GNSS precise point positioning approach on Xiaomi Mi8 smartphones. J. Navig. 2019, 8, 15. [Google Scholar] [CrossRef]
- Fortunato, M.; Critchley-Marrows, J.; Siutkowska, M.; Ivanovici, M.L.; Benedetti, E.; Roberts, W. Enabling High Accuracy Dynamic Applications in Urban Environments Using PPP and RTK on Android Multi-Frequency and Multi-GNSS Smartphones. In Proceedings of the European Navigation Conference (ENC), Warsaw, Poland, 9–12 April 2019. [Google Scholar]
- Leick, A.; Rapoport, L.; Tatarnikov, D. GPS Satellite Surveying, 4th ed.; Wiley: Hoboken, NJ, USA, 2015. [Google Scholar]
- Kouba, J. A Guide to Using International GNSS Service (IGS) Products. 2009. Available online: https://igscb.jpl.nasa.gov/igscb/resource/pubs/UsingIGSProductsVer21.pdf (accessed on 9 March 2022).
- Dow, J.M.; Neilan, R.E.; Rizos, C. The International GNSS Service in a changing landscape of Global Navigation Satellite Systems. J. Geod. 2009, 83, 191–198. [Google Scholar] [CrossRef] [Green Version]
- Boehm, J.; Niell, A.; Tregoning, P.; Schuh, H. Global Mapping Function (GMF): A new empirical mapping function based on numerical weather model data. Geophys. Res. Lett. 2006, 33, 4. [Google Scholar] [CrossRef] [Green Version]
- Jin, S.G.; Wang, J.; Park, P.H. An improvement of GPS height estimations: Stochastic modeling. Earth Planets Space 2005, 57, 253–259. [Google Scholar] [CrossRef] [Green Version]
- Xiao, G.W.; Liu, G.Y.; Ou, J.K.; Liu, G.L.; Wang, S.L.; Guo, A.Z. MG-APP: An open-source software for multi-GNSS precise point positioning and application analysis. GPS Solut. 2020, 24, 13. [Google Scholar] [CrossRef]


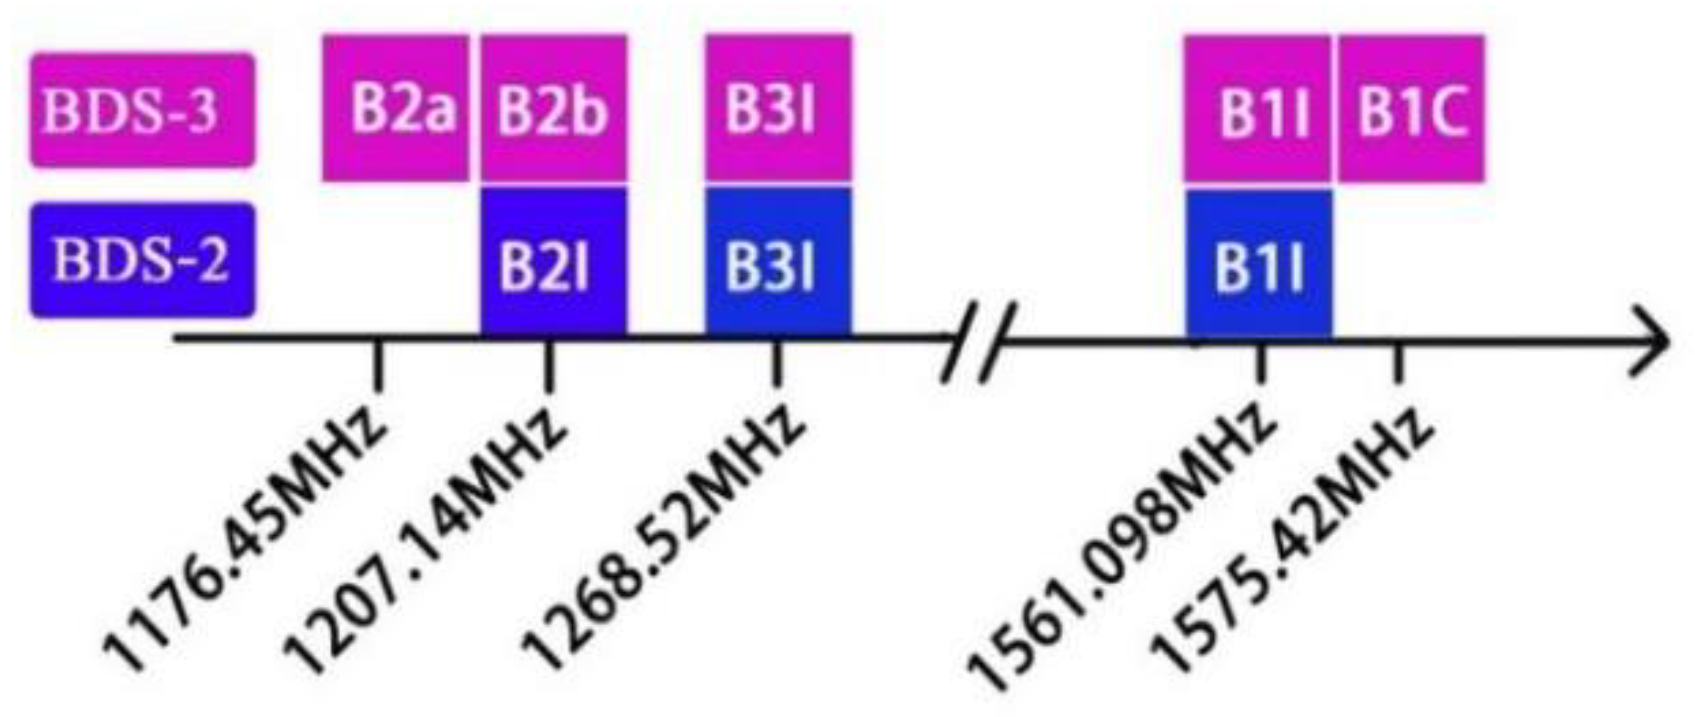
| System | Constellation | PRN | Signals |
|---|---|---|---|
| BDS-2 | GEO | C01-C05 | B1I, B2I, B3I |
| IGSO | C06-C10/C13/C16 | B1I, B2I, B3I | |
| MEO | C11/C12/C14 | B1I, B2I, B3I | |
| BDS-3 | GEO | C59-C61 | B1I, B1C, B2a, B2b, B3I |
| IGSO | C38-C40 | B1I, B1C, B2a, B2b, B3I | |
| MEO | C19-C30/C32-C37/C41-C46 | B1I, BI1C, B2a, B2b, B3I |
| Items | Strategies |
|---|---|
| Signal frequency | BDS-3: B1I/B1C/B2a/B3I; BDS-2/3: B1I/B1C/B2I/B2a/B3I; |
| Elevation cutoff | 10°, 20°, 30°, 40°; |
| Observation weighting | The a priori precision of pseudo-range and carrier phase is 0.6m and 0.006m, respectively. As a result of the comparatively lower accuracy of the orbit and clock data of BDS GEO satellites, their weight values are reduced by 100 times; |
| Receiver coordinate | Estimated as white noise process; |
| Receiver clock offset | Estimated as white noise process; |
| Ionospheric delay | Estimated as white noise process; |
| Tropospheric wet delay | Estimated as random walk process; |
| Inter-frequency bias | Estimated as random walk process; |
| Inter system bias | Estimated as constant; |
| Phase ambiguities | Estimated as constant; float values; |
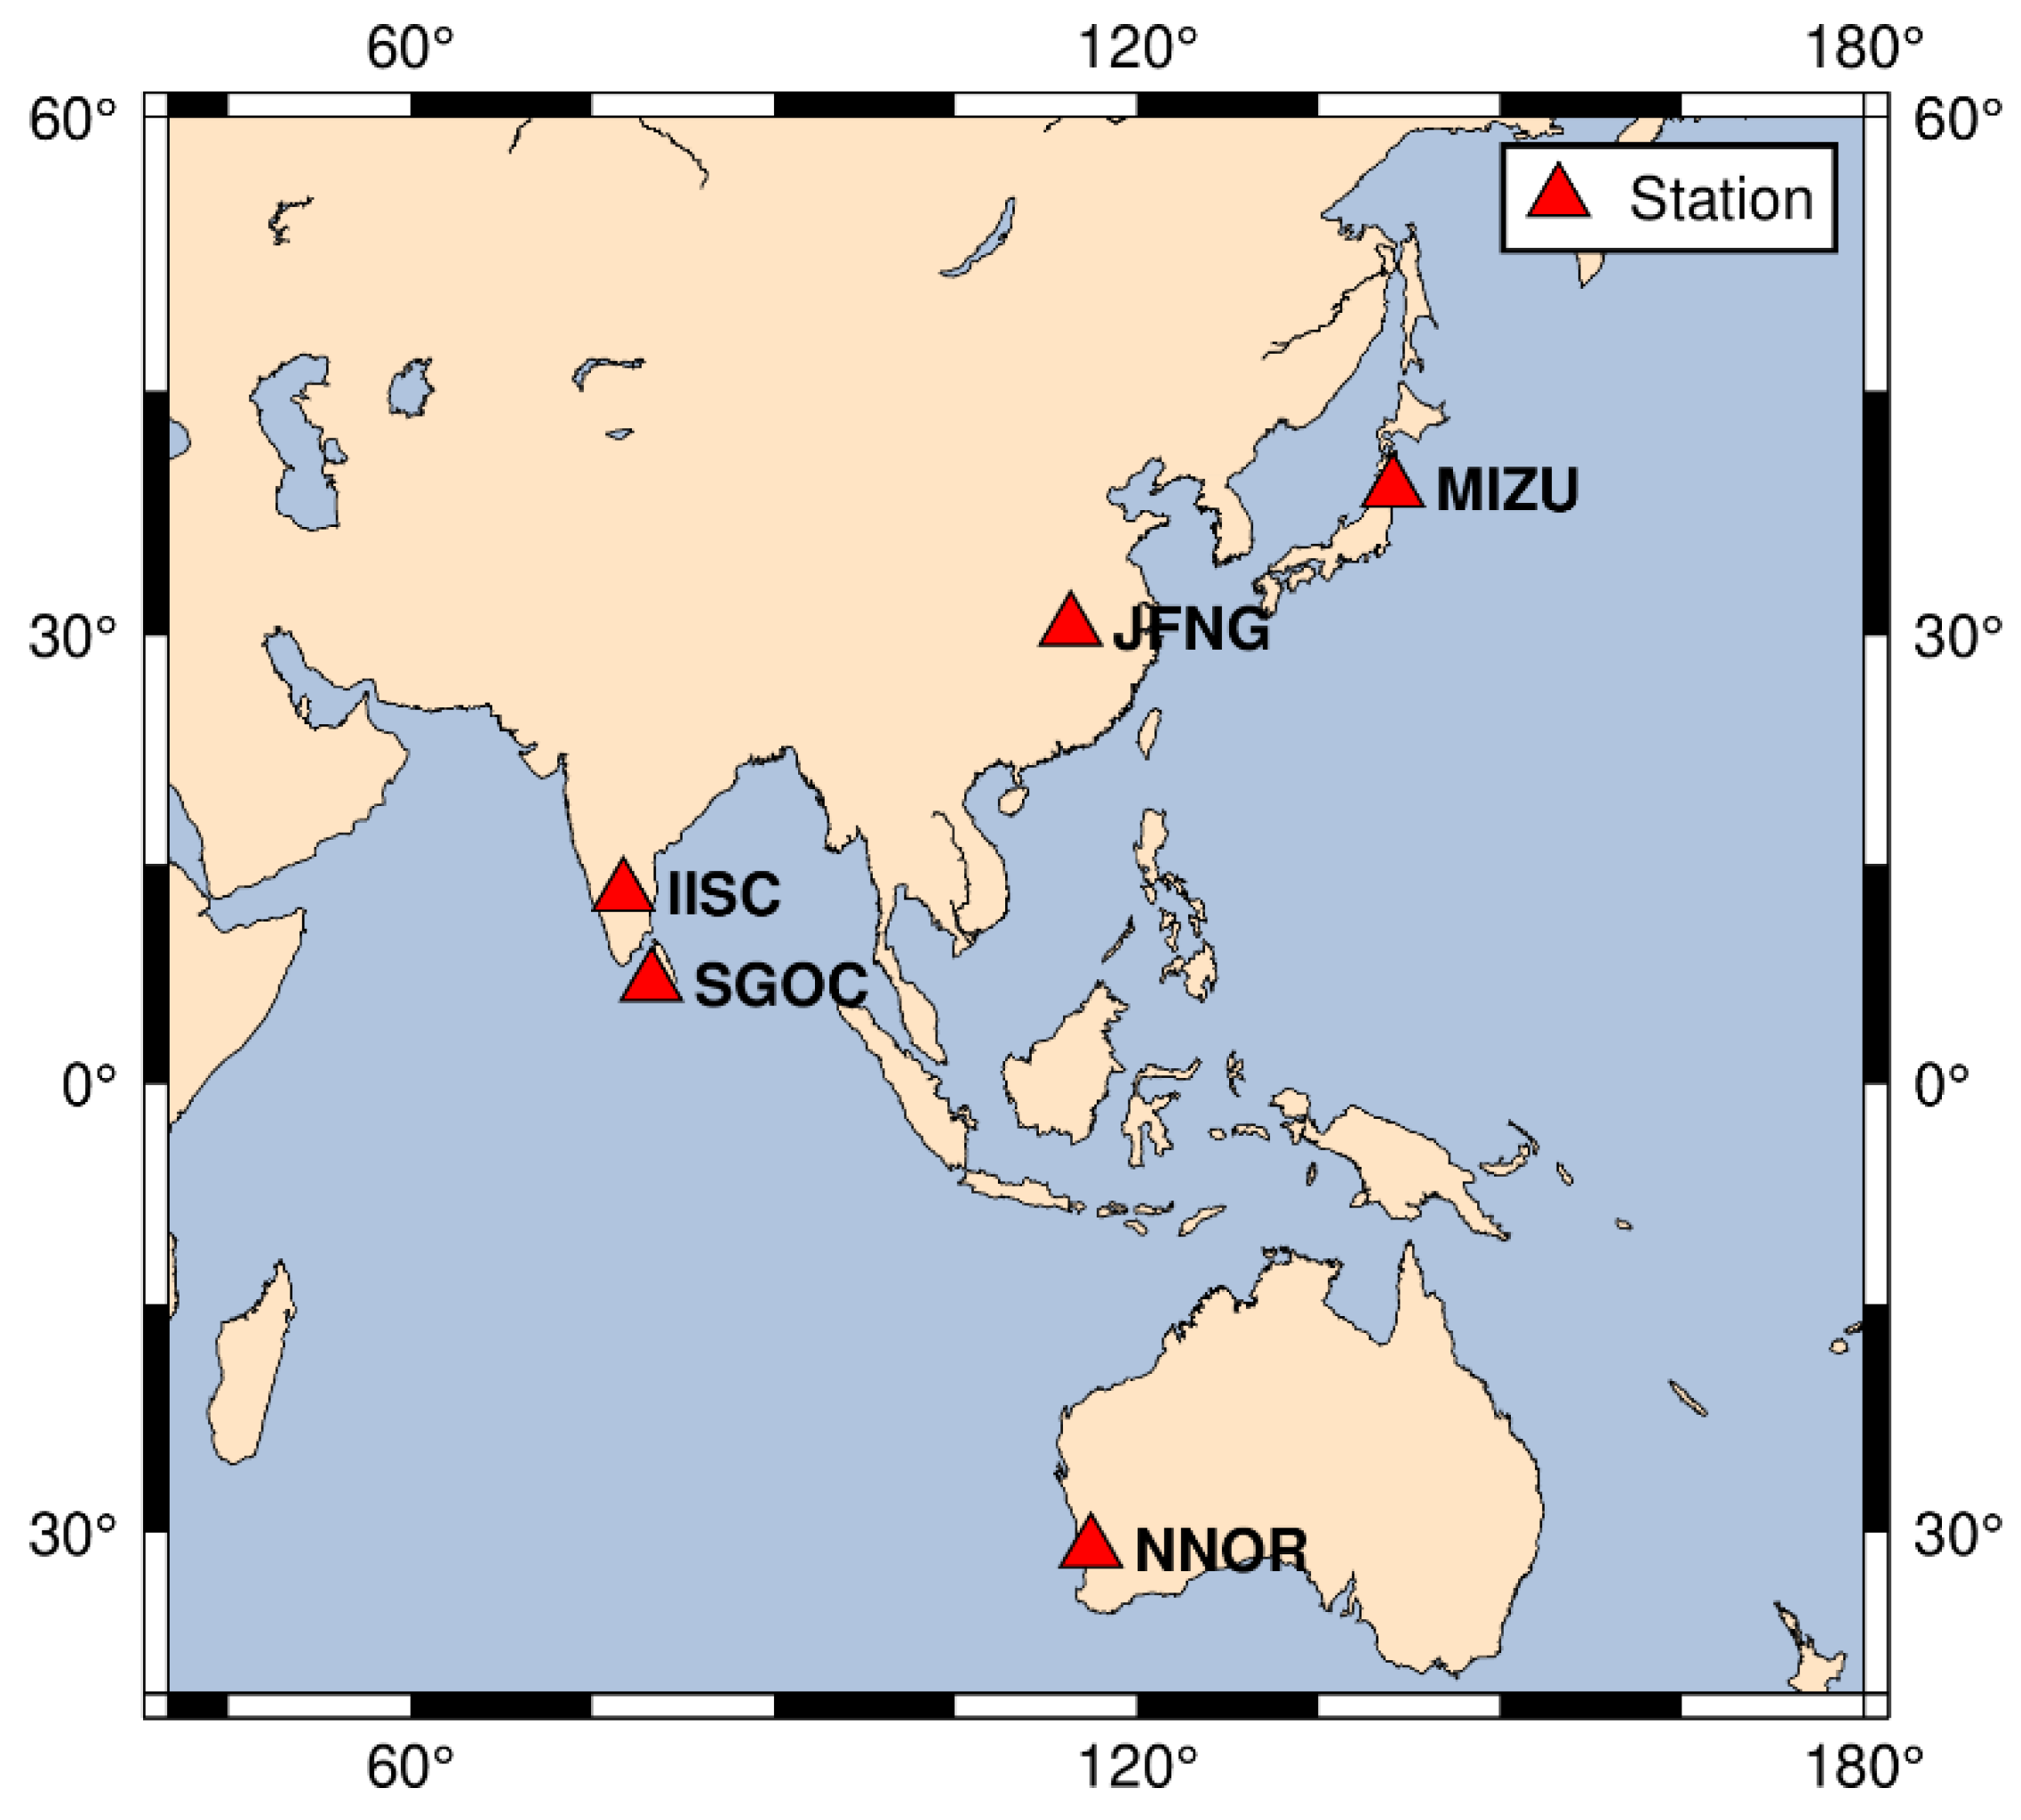
| No | Station | Location | Receiver | Frequency of BDS-2/3 |
| 1 | JFNG | China | TRIMBLE ALLOY | B1I, B2I, B3I, B1C, B2a |
| 2 | NNOR | Australia | SEPT POLARX5TR | B1I, B2I, B3I, B1C, B2a |
| 3 | MIZU | Japan | SEPT ASTERX4 | B1I, B2I, B3I, B1C, B2a |
| 4 | SGOC | Sri Lanka | JAVAD TRE_3 | B1I, B2I, B3I, B1C, B2a |
| 5 | IISC | India | SEPT POLARX5 | B1I, B2I, B3I, B1C, B2a |
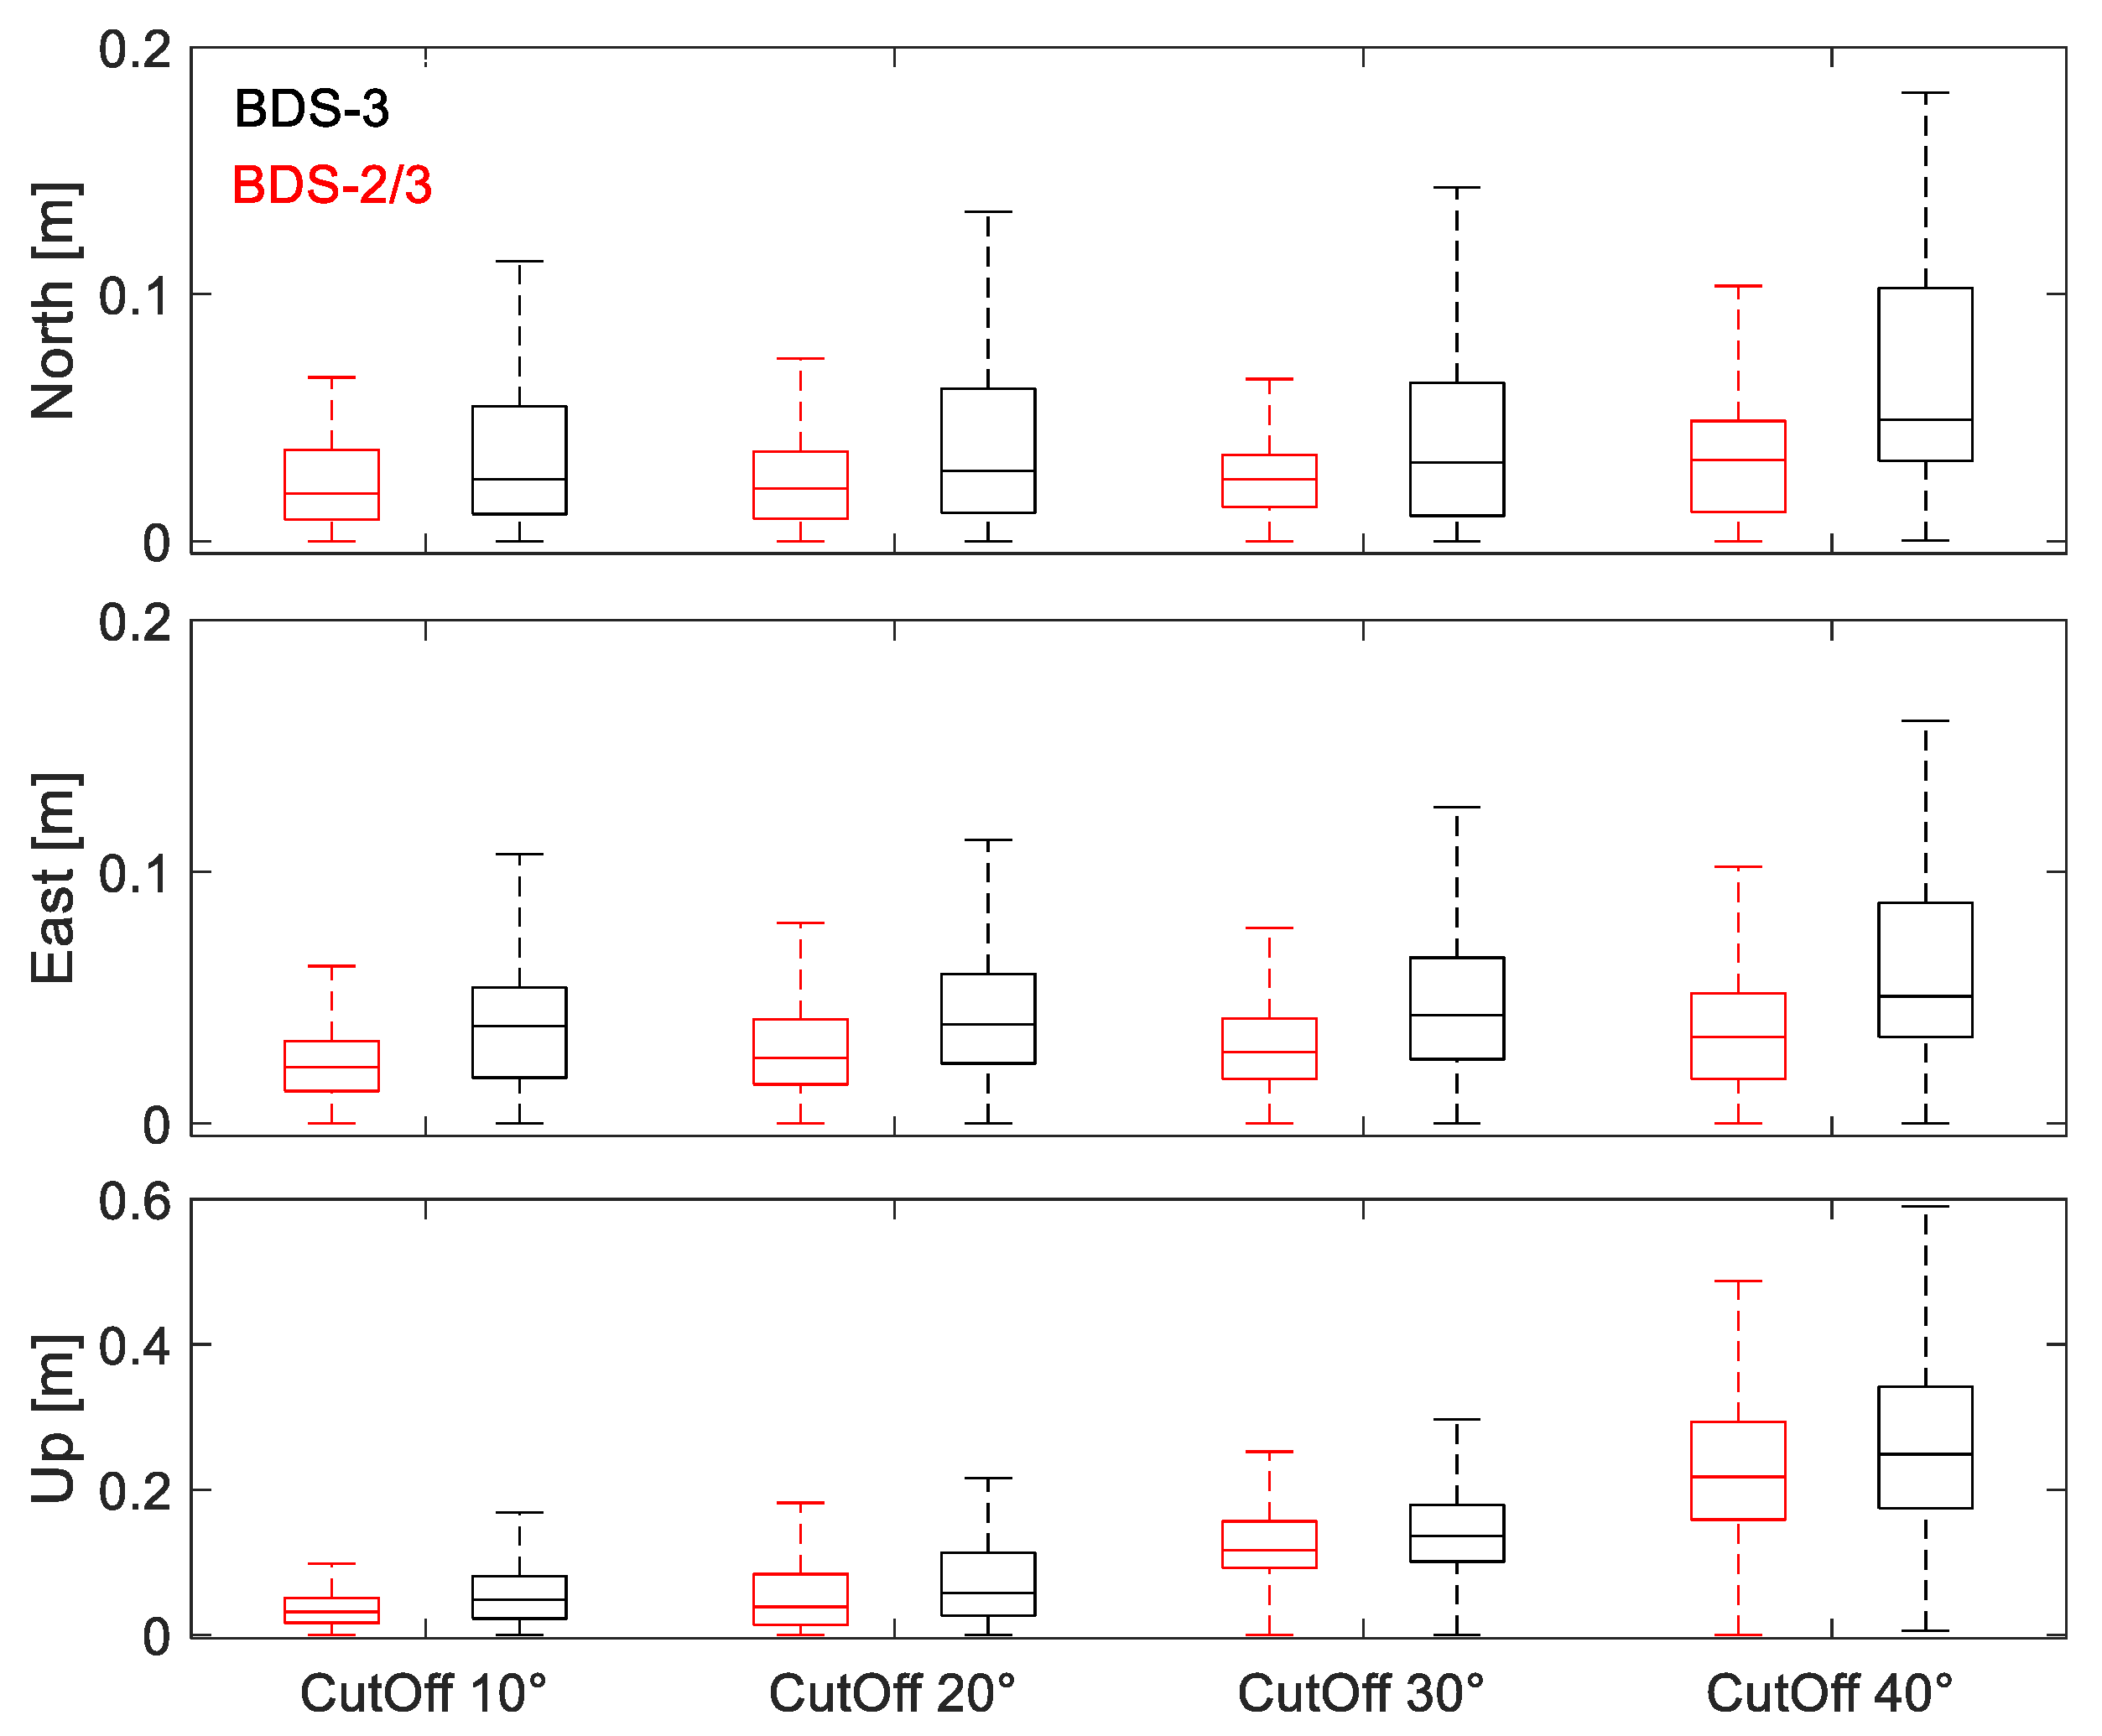
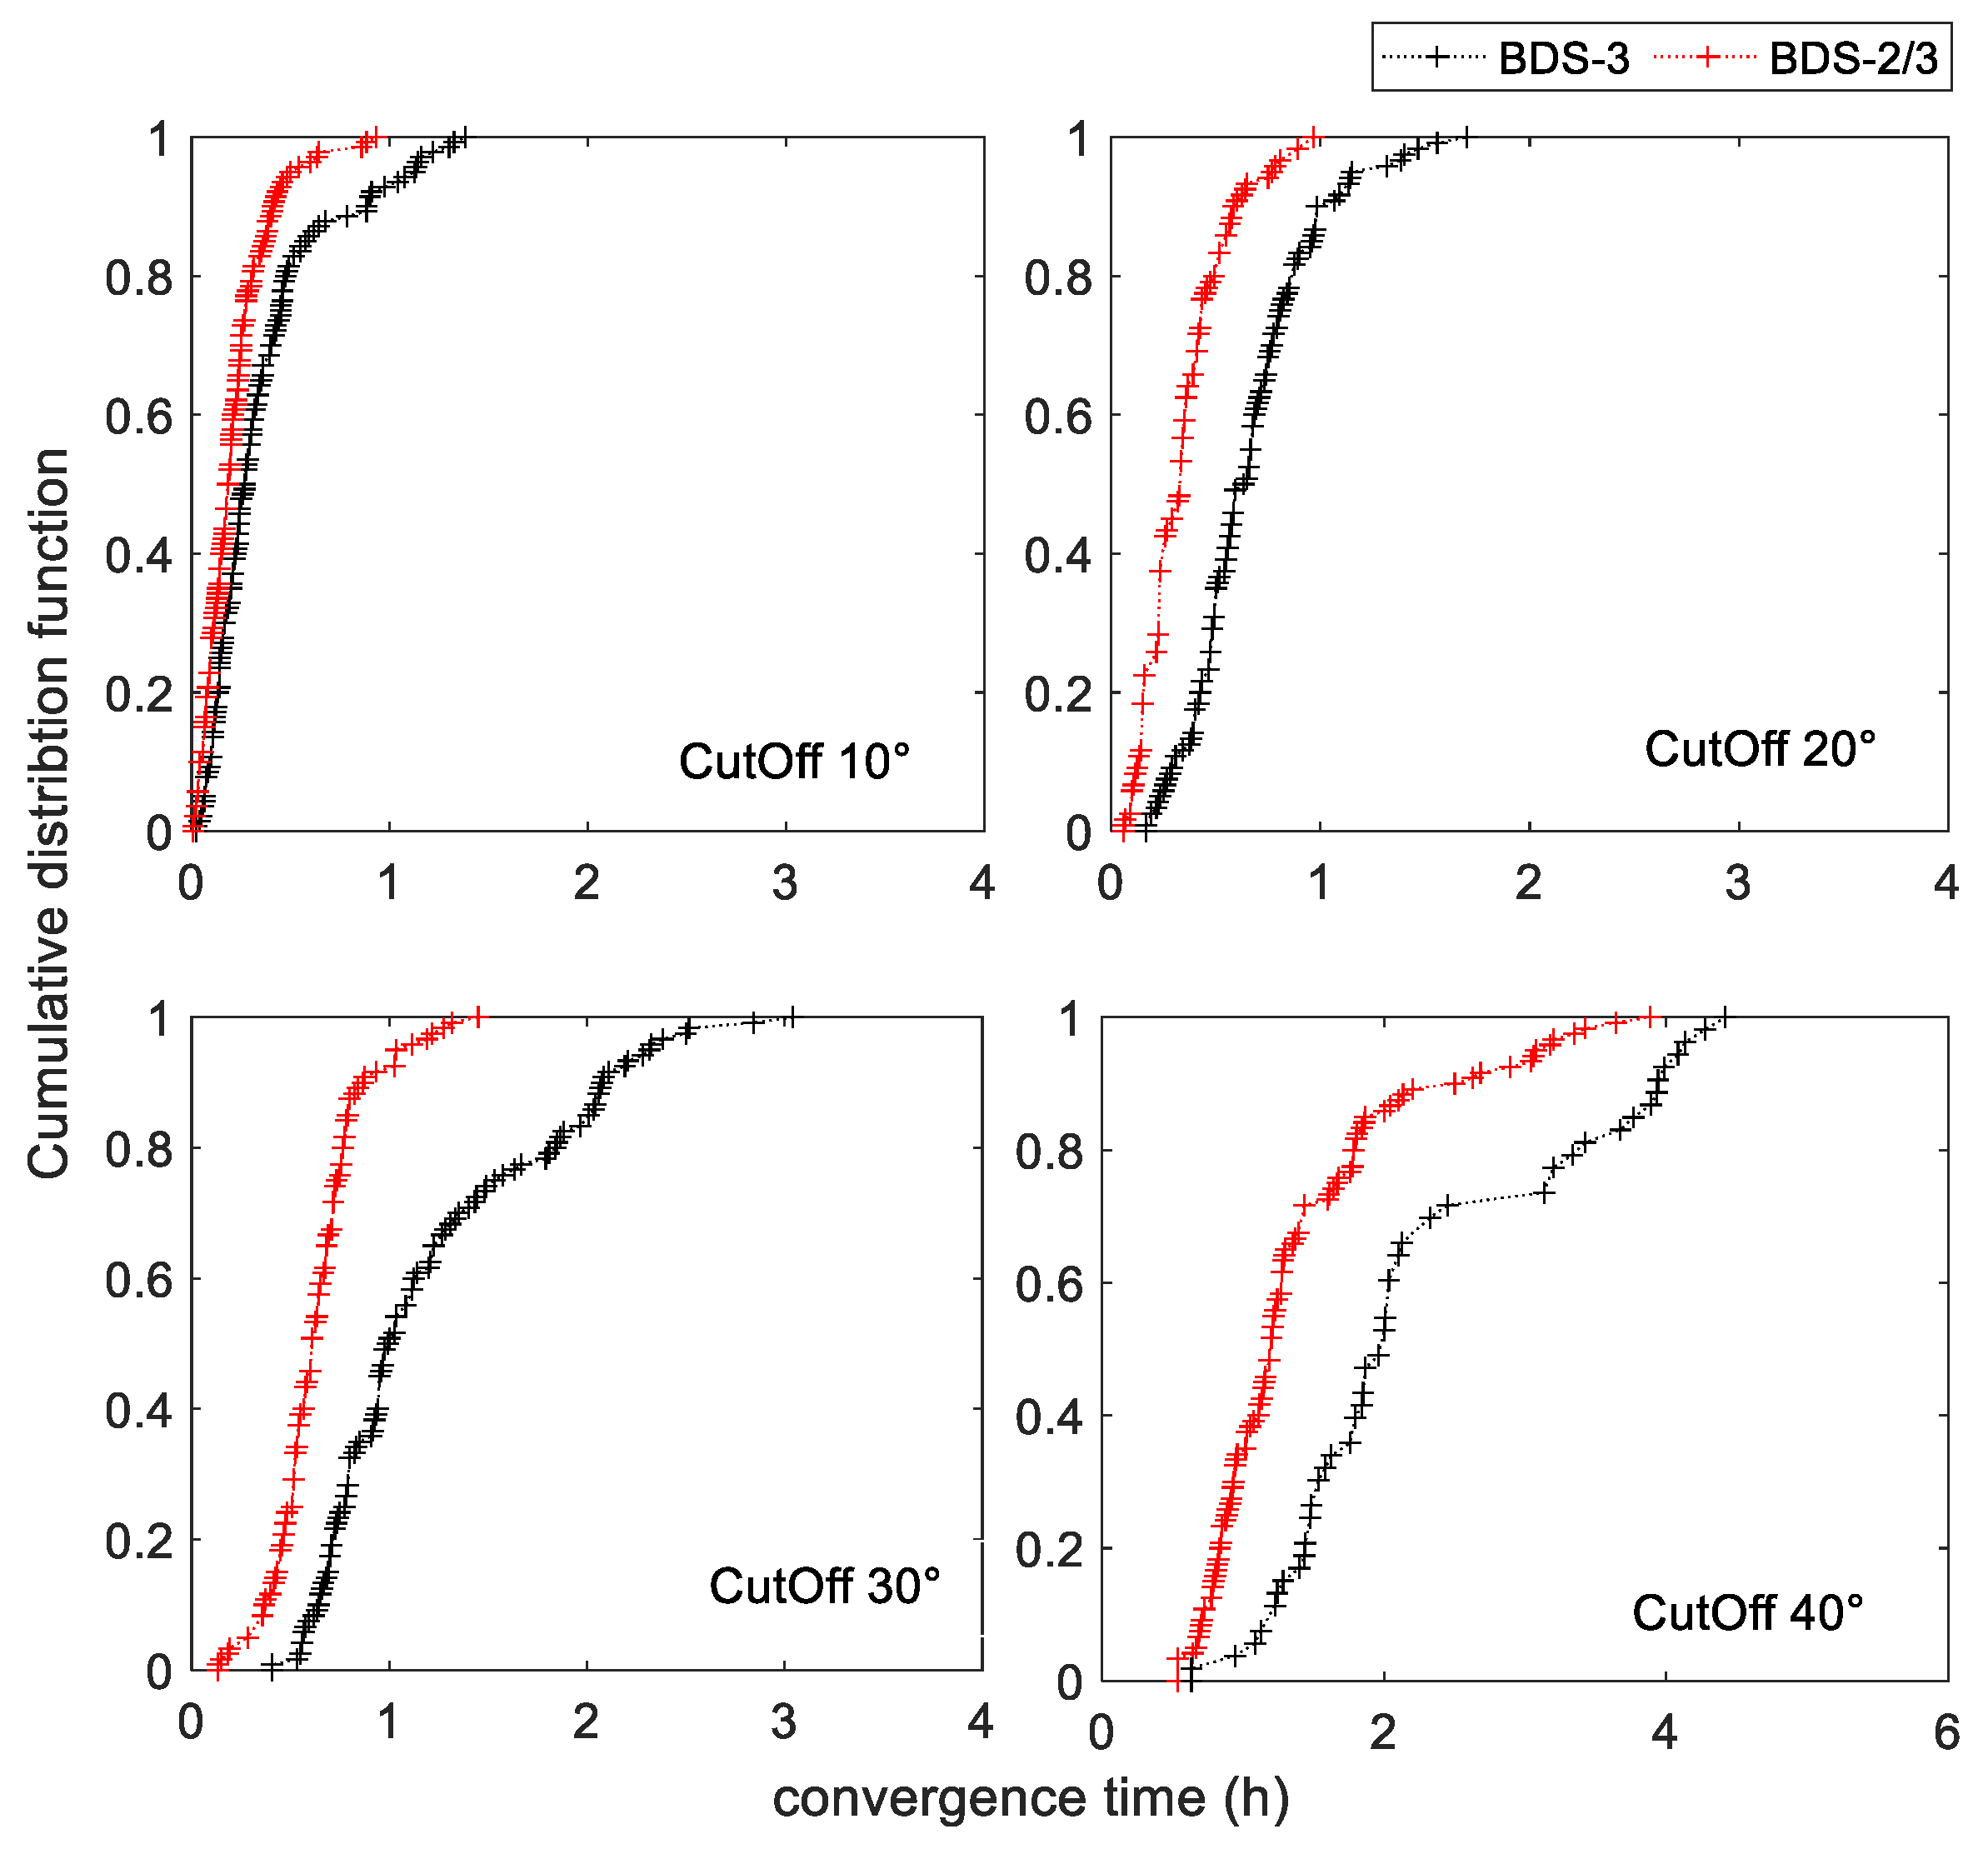
| Elevation Angle | Direction | BDS-3 | BDS-2/3 | Improvement |
|---|---|---|---|---|
| 10° | East | 0.044 m | 0.035 m | 20.45% |
| North | 0.027 m | 0.019 m | 29.63% | |
| Up | 0.052 m | 0.040 m | 23.08% | |
| CT | 0.38 h | 0.33 h | 13.16% | |
| 20° | East | 0.047 m | 0.036 m | 23.40% |
| North | 0.029 m | 0.019 m | 34.48% | |
| Up | 0.056 m | 0.040 m | 28.57% | |
| CT | 0.27 h | 0.17 h | 37.04% | |
| 30° | East | 0.051 m | 0.037 m | 27.45% |
| North | 0.030 m | 0.020 m | 33.33% | |
| Up | 0.115 m | 0.104 m | 9.57% | |
| CT | 0.41 h | 0.36 h | 12.20% | |
| 40° | East | 0.082 m | 0.036 m | 56.10% |
| North | 0.055 m | 0.026 m | 52.73% | |
| Up | 0.261 m | 0.161 m | 38.31% | |
| CT | 3.36 h | 1.52 h | 54.76% |
| Elevation Angle | Direction | BDS-3 | BDS-2/3 | Improvement |
|---|---|---|---|---|
| 10° | East | 0.039 m | 0.022 m | 43.59% |
| North | 0.025 m | 0.019 m | 24.00% | |
| Up | 0.048 m | 0.032 m | 33.33% | |
| 20° | East | 0.039 m | 0.026 m | 33.33% |
| North | 0.029 m | 0.021 m | 27.59% | |
| Up | 0.057 m | 0.039 m | 31.58% | |
| 30° | East | 0.043 m | 0.028 m | 34.88% |
| North | 0.034 m | 0.025 m | 26.47% | |
| Up | 0.136 m | 0.117 m | 13.97% | |
| 40° | East | 0.050 m | 0.035 m | 30.00% |
| North | 0.049 m | 0.033 m | 32.65% | |
| Up | 0.249 m | 0.218 m | 12.45% |
| Traditional BDS3 | Mixed BDS3 | Traditional BDS-2/3 | Mixed BDS-2/3 | |
|---|---|---|---|---|
| North | 0.097 m | 0.049 m | 0.058 m | 0.038 m |
| East | 0.287 m | 0.172 m | 0.132 m | 0.081 m |
| Up | 0.245 m | 0.149 m | 0.128 m | 0.068 m |
| Time | 0.43 h | 0.38 h | 0.20 h | 0.12 h |
Publisher’s Note: MDPI stays neutral with regard to jurisdictional claims in published maps and institutional affiliations. |
© 2022 by the authors. Licensee MDPI, Basel, Switzerland. This article is an open access article distributed under the terms and conditions of the Creative Commons Attribution (CC BY) license (https://creativecommons.org/licenses/by/4.0/).
Share and Cite
Yang, F.; Zheng, C.; Zhang, J.; Sun, Z.; Li, L.; Zhao, L. The Initial Performance Evaluation of Mixed Multi-Frequency Undifferenced and Uncombined BDS-2/3 Precise Point Positioning under Urban Environmental Conditions. Remote Sens. 2022, 14, 5525. https://doi.org/10.3390/rs14215525
Yang F, Zheng C, Zhang J, Sun Z, Li L, Zhao L. The Initial Performance Evaluation of Mixed Multi-Frequency Undifferenced and Uncombined BDS-2/3 Precise Point Positioning under Urban Environmental Conditions. Remote Sensing. 2022; 14(21):5525. https://doi.org/10.3390/rs14215525
Chicago/Turabian StyleYang, Fuxin, Chuanlei Zheng, Jie Zhang, Zhiguo Sun, Liang Li, and Lin Zhao. 2022. "The Initial Performance Evaluation of Mixed Multi-Frequency Undifferenced and Uncombined BDS-2/3 Precise Point Positioning under Urban Environmental Conditions" Remote Sensing 14, no. 21: 5525. https://doi.org/10.3390/rs14215525