
Study of the Buried Basin C-H, Based on the Multi-Source Remote Sensing Data

1
School of Land Science and Technology, China University of Geosciences (Beijing), Beijing 100083, China
2
Research Center of Lunar and Planetary Remote Sensing Exploration, China University of Geosciences (Beijing), Beijing 100083, China
3
Subcenter of International Cooperation and Research on Lunar and Planetary Exploration, Center of Space Exploration, Ministry of Education of the People’s Republic of China, Beijing 100083, China
*
Author to whom correspondence should be addressed.
Remote Sens. 2022, 14(21), 5284; https://doi.org/10.3390/rs14215284
Submission received: 25 July 2022
/
Revised: 6 October 2022
/
Accepted: 18 October 2022
/
Published: 22 October 2022
(This article belongs to the Special Issue Planetary Geologic Mapping and Remote Sensing)
Abstract
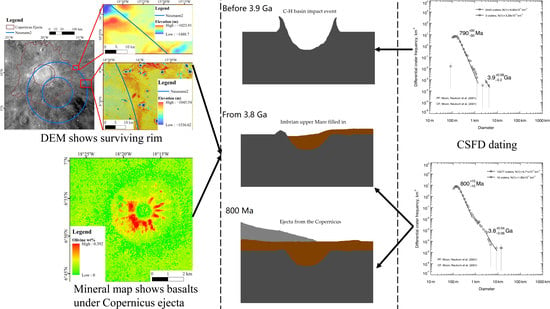
:We use multi-source remote sensing data to identify the details of a mascon south-east of the lunar Copernicus crater. Studies of the topography, gravity, geochronology and mineral are combined to prove that the mascon is a buried peak-ring basin with diameters of about 130 km and 260 km. The underground structure is covered by 890 m thick mare basalts, as determined by analyzing the spectral features of the impact crater, Copernicus H. The determination of the crater size–frequency distribution (CSFD) suggests that the impact that created the C-H basin occurred earlier than 3.9 Ga. Then, a Hawaiian-style eruption in the late Imbrian period formed the Sinus Aestuum-I dark mantling deposit (DMD). Soon, mare basalts covered the basin several times from 3.8 Ga. Finally, the ejecta from the Copernicus impact event at about 800 Ma, and the weathering processes caused the disappearance of the C-H basin rim from the lunar surface.
1. Introduction
Over the last half-century of lunar exploration, vast amounts of images and spectral data were collected, as well as data describing the topography, gravity and magnetism. Combining these multi-source data allowed scientists to learn the general process of planetary geology evolution. Craters are one of the most noticeable geomorphological features on the lunar surface. Most recent studies focus on their morphological characteristics and spatial distributions [1,2,3,4]. The use of multi-source data allowed to scientists reconstruct the geological history of the lunar craters, among the most noticeable geomorphological features on the Moon. For example, the repetitive lava filling events in Sinus Iridum Bay were identified by combining images, topography, spectral data and dating results [5]. In addition to craters and basins exposed on the lunar surface, there are also some basins buried by basalt. These buried basins have positive gravity anomalies and are called mascons. Mascons were discovered in 1968, in association with the giant circular basins [6]. Numerous theories of the relationship between mascons and the mechanisms for creation of the circular basins have been suggested, such as: mantle plugs upwelling into giant impact basins followed by volcanic filling [7,8], the puddling of high-density meteorite material [9], crater in a low-density lunar crust filled by normal-density basaltic lava [10], and the uplift of the basin center [11].
Prior to the gravity model derived from the doppler tracking of the Lunar Prospector (LP) spacecraft, mascons were distributed at equatorial latitudes on the lunar nearside, filled with mare. The LP model helped to identify seven new mascons on both sides of the Moon: three of them have no visible mare fill, supporting the mantle plug contribution [12]. Gravity Recovery and Interior Laboratory (GRAIL), launched in 2011, returned high resolution gravity data leading to the discovery of more mascons. The discoveries were not limited to the impact basins, but included apparently buried basins. Scientists proposed a new term for these small sizes mascons: quasi-circular mass anomalies (QCMAs) [13] and positive Bouguer gravity anomalies (PBGAs) [14]. With new 900 or 1200 degree gravity models, the additional small mascons have been identified. Evans et al. revealed more than 100 QCMAs on the lunar nearside and inferred a 1.5 km lower bound on the average thickness for the nearside lunar mare [13]. Two buried basins (200 km and 160 km in diameter), located in the north-western rim of Lacus Somniorum and Maria Tranquillitatis, validated the forward modeling approach [15]. Neumann et al. doubled the GRAIL inventory of the lunar basins and determined the main ring diameters of the previously known degraded basins [16]. In Oceanus Procellarum, four PBGAs were recognized which also support the inference of Evans et al. [14]. The GRAIL data also played an important role in clarifying the theory that mascons are caused by an isostatic adjustment, cooling and contraction of a voluminous melt pool [11,17,18,19]. Klokočník et al. used gravity aspects (the gravity disturbance, the Marussi tensor, two gravity invariants, dimensionality ratio, the strike angles, and the virtual deformations) to study the Copernicus area and amended the definition of ‘mascon’ into: “An object that has dilatation regime of the virtual deformations in the crater center while the rims are in compressional regime [20]”. However, most of the above studies were based on the gravitational and topographical data and hardly brought in remote sensing images to try to prove their inference.
Copernicus is one of the most prominent craters on the Moon. It constitutes a classic example of a relatively young, well-preserved lunar impact crater. Copernicus is found in the Oceanus Procellarum, located at 10°N, 20°W, near the southern rim of the Imbrium Basin (Mare Imbrium) impact structure (Figure 1). Copernicus measures 93 km (58 miles) in diameter. The abundant geomorphic features are developed in the impact crater, such as the central peak, the ladder-like crater wall, the catena, and the extensive fusion coating [21]. Copernicus has a young geological age and a well-defined ray system and is classified as a highland crater. As the geological map shows (Figure 1c), the crater is located on Montes Carpatus. This is a highly diverse morphological area and is characterized by peaks and elevated terrains (Nbm in Figure 1c). In addition, it is punctuated by valleys and low-elevation corridors that are mostly flooded with mare-like materials (Em and Im2 in Figure 1c) [22]. The occurrence of the Copernicus impact resulted in the formation of an ejecta blanket (The largest Cc part in Figure 1c). What’s more, there are many Imbrian and Eratosthenian craters in the area (Ic and Ec in Figure 1c). Thus, the impact occurred on a highly stratigraphically complex and heterogeneous region of the lunar surface, mostly composed of feldspathic highland materials rather than mare [23].
In the south-eastern area of the Copernicus crater, a buried basin is present, called C-H [16]. The classification of the basin’s type and the diameter is uncertain [13,16,20,24]. Such cases suggest that the current basin catalogs need further correction. As a start, in this paper, gravity, images, topography and spectral data are used to survey the morphology features and discuss the evolution of the C-H basin.
2. Data and Methods
2.1. Datasets
In this study, we make use of a high-resolution gravity field model of the degree and order 1200 in spherical harmonics, obtained by NASA’s Gravity Recovery and Interior Laboratory mission (GRGM1200A) [25]. A digital elevation model (DEM), created by Lunar Orbiter Laser Altimeter (LOLA) and SELenological and Engineering Explorer (SELENE) Kaguya Team called Moon LRO LOLA-SELENE Kaguya TC DEM Merge(59 m/pixel) [26] and Chang’e-2 digital orthophoto map (CE2 DOM, 7 m/pixel) show the high-resolution topography. The Kaguya TC Ortho Mosaic Global image (7.4 m/pixel) helps to analyze the morphology and chronology of the C-H basin. Olivine and optical maturity (OMAT) parameter images (59 m/pixel) from Kaguya MI, are also used [27]. Some olivine-bearing places, such as the Copernicus central peaks, represent an olivine lithology occurring at depth [28] and high regional olivine contents might show the existence of basalts in the western mare [29]. The OMAT is the degree to which a particular lunar soil possesses the quantitative characteristics consistent with that exposure [30]. It shows the time that the lunar surface was exposed to the space environment to distinguish the type of surface. In addition, the “Unified Geologic Map of the Moon, 1:5M, 2020” from NASA, is used to learn the geology background of the research area [31]. The Moon LRO LROC WAC Global Morphology Mosaic (100 m/pixel) and Moon LROC WAC DTM GLD100 (118 m/pixel) are also used to display the study area. Both of them are available through Astropedia (https://astrogeology.usgs.gov/site/annex (accessed on 30 May 2022).
2.2. Gravity
In this study, the field of Bouguer gravity data was truncated to the degree and order 600 and derived from the GRAIL GRGM900C gravity model, after subtracting the gravity resulting from the topography, that assumed a density of 2500 kg/m3 [13,25,32,33]. The stretched renderer is adopted to display the continuous pixel values across a gradual ramp of colors and to improve the display. Thus, the mascons can be directly observed on the Bouguer gravity data. The proposed basins may be recognized by their distinctive circular outlines in the Bouguer gravity map view [16]. For the peak-ring basins, such as the C-H basin, several features are important: (1) the roughly circular rings, which are sometimes discontinuous. (2) A central positive Bouguer anomaly that is confined within the peak-ring. (3) A negative Bouguer anomaly annulus that extends from the edge of the positive anomaly outward to the rim crest. (4) A number of degraded basins, lacking interior peak-rings, have diameters and gravity patterns similar to those of the well-preserved peak-ring basins [19].
2.3. Topography
In this paper, the terrain analysis and morphologic analysis are introduced for the recognition of the C-H basin and to determine their diameters. The terrain analysis is based on the DEM. On the edge of an impact basin, there is a circle of a raised rim which is usually the highest part of the basin. What’s more, a peak-ring of mountains first develops within the crater, at about 140 km in diameter and the diameter of this inner “peak-ring” is roughly half the crater rim diameter [34]. The rim and ring are the most visible characteristics of the peak-ring basins on the mosaic images. However, craters on the Moon suffer from various mass-wasting processes and meteoroid bombardment. As a result, the rim height should decrease, due to the downslope movement of the rim and the ejecta materials, over time [35]. Furthermore, most of the basin rim and peak-ring may disappear from the surface in the event of severe geological processes, such as an impact and volcanism.
As previous research suggests, some mascons surrounded by linear rilles or mare ridges are impact craters/basins filled with basalts [34]. Therefore, the geological map is used to check if there are rilles or ridges around the mascon beside Copernicus.
2.4. Geochronology
The date of the C-H basin was measured using the crater size–frequency distribution (CSFD) [36]. This approach requires an accurate measurement of the crater diameters within and the well-defined geologic units [5]. The craters were mapped with “CraterTools”, an ArcGIS plug-in [37]. With three evenly distributed points identified on the crater rims, the diameters would be accurate. The secondary craters, which were distributed in chains, were excluded from the dating process [38]. The Copernicus ejecta is from the “Unified Geologic Map of the Moon, 1:5M, 2020” and used to eliminate the influence of the division of the geological units. The resurfacing events may occur several times in the area and erase the relatively small craters. As a result, based on the craters of different sizes, the CSFD shows the ages that correspond to the different resurfacing events [39]. For example, a once buried basin has resurfaced, the smallest group stands for the age of latest resurfacing event; the middle group represents the time of the basalts fill, the largest group denotes the date of the impact event. The dates of the different events were fitted by a differential fit using the Craterstats 2.0 tool, with the lunar chronology function (CF) and the production function (PF) from Neukum (2001) [36].
2.5. Olivine Contents and OMAT
We searched for a large enough fresh crater in the mascon to establish the outcrop and to study the underground layer. Olivine and OMAT, from spectrum data, suggest the nature of fill material through the outcrop. This may show the original surface of the C-H basin. Then, the depth of the C-H basin can be estimated, when combined with the DEM.
Lucey et al. provided algorithms to inverse the OMAT based on the Clementine UV/VIS images [30].
where is the reflectance of the origin, is the ratio value of the origin, is the reflectance at 750 nm of a pixel or spectrum, and is the reflectance at 950 nm of a pixel or spectrum. For the Clementine data, the constants are and .
In this study, the OMAT were derived from the Kaguya MI data. Thus, the regression coefficients, described by Lemelin et al. [27], should be applied to the Multiband Imager data at 750 () and 950 () nm, in order to match the reflectance of the Clementine data at these bands (, ).
The method, developed by Lemelin et al. use Hapke’s radiative transfer equations and the reflectance data from the Kaguya Multiband Imager are used to obtain the abundances of olivine [27]. This method computes a spectrum library of the mineral mixtures of plagioclase, orthopyroxene, clinopyroxene, and olivine. Then, we compared this with the central peak spectra with the library, to arrive at an estimated composition. To assign a mineralogical composition to a MI pixel spectrum, Lemelin et al. use an evenly weighted average of the correlation between the library and the unknown spectrum and the sum of the absolute difference in the reflectance between the library and the given pixel spectrum, to find the closest spectral match. They compute the FeO abundance, consistent with the stoichiometric abundance of each mineral mixture, in the spectral library. Once the closest spectral match in the library is obtained, a gradient descent algorithm is used to refine the abundance of plagioclase, orthopyroxene, clinopyroxene, and olivine [40].
3. Results
3.1. Bouguer Gravity Anomaly
The Bouguer gravity anomaly is calculated by removing the separately measured topography. A typical peak-ring basin usually has a large positive Bouguer gravity anomaly within the peak-ring and a small or negative anomaly between the peak-ring and the inward edge of the rim [19]. This pattern is helpful to recognize the degraded basins that lack apparent rings.
There is a Bouguer gravity anomaly which is located to the south-east of Copernicus and fits the feature pattern. It has a typical positive Bouguer gravity anomaly and a negative Bouguer anomaly annulus that extends from the edge of the positive anomaly of the mascons, as shown in Figure 2. The Bouguer gravity anomaly has a center at 7.42°N 17.87°W and 123 km in diameter. In the mascons, the maximum positive Bouguer anomaly is 373.04 mGal, the minimum value is 263.85 mGal, and the mean value is 338.72 mGal.
3.2. Morphology and Topography
Some previous studies gave out a diverse scale of the C-H basin. Neumann et al. measured the mascon as a buried peak-ring basin which is located at 7.2°N 18.2°W, with a rim diameter = 260 km and a peak-ring diameter = 130 km [16] (blue circle in Figure 3). The results of Liu et al. confirm the basin type and the location of the central part of the basin, but they provide different values for the rim-to-rim diameter (483 km) and for the ring diameter (221 km) [24] (pink circle in Figure 3). Evans et al. measured the mascon as a single ring basin, located at 7.28°N 18.26°W and 175 km in diameter (orange circles in Figure 3) [13]. The study of Klokočník et al. did not focus on the features except the gravity and magnetism. They only pointed out that the diameter of the C-H basin had ahigh gravity anomaly that is about 150–160 km and they did not indicate the center position of the C-H basin [20].
Most of the basin rim and the peak-ring disappeared from the lunar surface. However, at the north-eastern part of Neumann’s basin rim, two rims are still visible, as can be observed in Figure 4. Both surviving rims are about −1140 m high.
Solomon and Head [41] discovered that all of the mascon basins display an associated tectonic feature: the linear rilles or mare ridges tend to be concentric to the mascon. The C-H basin might match this feature. There are rilles to the south-west and ridges to the south-east, as exhibited by the red arrows in Figure 5.
3.3. Age
We pick the intersection of the Copernicus ejecta and the Bouguer gravity anomaly, which is 123 km in diameter and inside all of the three previous basins, as the dating area, to avoid different previous opinions about the scale of the C-H basin and the different geological units, as well as the abundant secondary craters’ influence on the dating result (Figure 6a). The 8848 small craters located in the C-H basin were signed with a diameter range from 100 m to 4500 m. Two-hundred and two of them are distributed in chains and were recognized as secondary craters (Figure 6a yellow circle) and they were rejected, in order to eliminate any errors. The small sized craters suggest the age of the surface ejecta and the large sized craters show age of the unit below the ejecta [42]. In our experiment, the craters between 170–1400 m gave 790 Ma, which represent the age of Copernicus (Figure 6b). Those between 3000–4500 m, separately proved an Imbrian age of 3.9 Ga (Figure 6b). In order to check the accuracy of the dating result, we also investigated the craters on the Copernicus ejecta (Figure 7a). A similar age of 800 Ma supports the age of Copernicus. Both Copernicus ejecta dating results approach to the 800 Ma isotope dating result [43,44,45], suggesting an accurate experiment result. The unit below the ejecta is 3.8 Ga (Figure 7b), and belongs to the Imbrian period. The Imbrian ages of Copernicus show that the C-H basin was refreshed by Imbrian lava. To allow for the Imbrian upper Mare unit (Im2), located to the south-east of Copernicus, in Figure 5, the units below the ejecta might be Im2.
3.4. Mineral
The Copernicus Crater H (Figure 8), provided a partial clue, that gave us access to learn more about the C-H basin. The fresh crater, located on the ejecta blanket of the Copernicus crater (6.89°N 18.29°W) and 4.4 km in diameter. Copernicus H is a classic dark-haloed crater which is surrounded by dark deposits extending almost two crater diameters from the rim crest [46]. The depth is 890 m, as measured on the LOLA-SELENE Kaguya TC DEM. The profile indicates that Copernicus H is a flat-bottomed crater (Figure 9). Because the mass wasting and the downslope movement have disrupted the regolith maturation process, the fresh basalts, relatively free of the weathering effects, are often exposed on the steep inner walls of Copernicus H [46]. The mineral maps from the Kaguya MI images are used to study this. The OMAT map in Figure 10a demonstrates that the crater rim wall has a high OMAT value, indicating that the crater wall is weakly weathered. Hence, Copernicus H is believed to accurately show the material composition of the lower stratum. The geology map and the CSFD dating help to identify the unit on the rim wall of Copernicus H as Im. This conforms to the high olivine content on the crater rim wall in Figure 10b. Bell et al. also believed that Copernicus H has excavated mare basalt from beneath the ejecta material [46].
Some regions of the Moon exhibit dark mantling deposits that were formed by fire-fountain style eruptions, similar to some Hawaiian eruptions [47,48,49,50,51]. These regions are called dark mantle deposits (DMDs) which are diffuse deposits with a very low albedo [51]. DMDs are the remnants of pyroclastic eruptions. Unlike the effusively emplaced mare basalts, the pyroclastic eruptions were more energetic because the erupted material contained more volatiles and formed volcanic glass beads. In some cases, pyroclastics are found in small, localized areas, surrounding a vent. The largest of the DMDs are near the edges of the lunar mare [51]. They cover many thousands of square kilometers and include a range of knobs and other highland features [51]. Thus, because lava only flows downhill, these units cannot be lava flows. Instead, they seem to mark areas where a thin layer has been draped over an older surface. They may have resembled Hawaiian fire fountains, but on a much larger scale. There are also many smaller dark mantling units on the Moon. Most of these features are only a few kilometers in diameter. They are almost always located near the mare or in the large crater floors. Many also lie along clear fault lines [51]. Since most have a small central pit or crater, they are likely sites for small volcanic explosions. Some of these small eruptions may have released gases from shallow lunar intrusions.
The DMD area Sinus Aestuum-I [48] is located on the south-east part of the mascon (Figure 11). It is 90 km across and situated on small highland hills. The OMAT map on Figure 11 shows that the Sinus Aestuum-I DMD has a lower OMAT value than the surrounding mare and has been heavily disrupted by the ejecta and the secondary impacts. This evidence suggests that the Sinus Aestuum-I DMD formed earlier than the surrounding mare, as well as the Copernicus crater.
4. Discussion
4.1. Confirmation and Characteristics of the C-H Basin
Because Neumann et al., Liu et al. and Evans et al. have contrasting conclusions about the scale and the type of the C-H basin, confirming the accurate scale and type becomes an important work. The mascon fits all of the features of a peak-ring basin (in Section 2.2). It should be classified as a peak-ring crater. Liu et al. (pink circles in Figure 12) gave a much larger scale than Neumann et al. (blue circles in Figure 12). However, the rim, given by Liu et al., overlays the rims of the Imbrium basin, as given by Neumann et al. (white circles in Figure 12). The topographic feature suggests that the highland, north of Copernicus, should belong to the rim of the Imbrium basin. In addition, the morphology and topography results in this paper show a surviving rim which fits the rim given by Neumann. From our results, the C-H basin has a rim diameter of 260 km and a peak-ring diameter of 130 km. The center of the basin is 7.2°N 18.2°W.
4.2. Age of the Sinus Aestuum-I DMD
The existence of the Sinus Aestuum-I DMD suggests that there are a variety of volcanoes in the C-H basin area. Clarifying the ages and sequences of these volcanic activities are meaningful to reconstruct the history of the region and to understand the evolution of the lunar geological activities. Although, the Sinus Aestuum-I DMD has fewer superposed craters than the nearby Im2 units, analyses of the Apollo 17 samples from Taurus–Littrow indicated that the DMDs could not be unequivocally associated with youth on the lunar landscape. Due to the abnormally rapid degradation of the small craters in the unconsolidated pyroclastic material, the exact ages of the DMDs are not at all clear without samples [49,51]. Therefore, we can only judge the sequence of the DMD, Im2 and Copernicus ejecta according to their intersection relations and spectral characteristics. As result of the minerals, the Sinus Aestuum-I DMD has a lower OMAT value than Im2 and Copernicus (Figure 11). Considering the slope of the Sinus Aestuum-I DMD is not obviously lower than Im2 and the Copernicus ejecta (Figure 13d), such a difference is mainly caused by the different formation ages. On the LROC WAC Global Morphology Mosaic and the OMAT map, the radial texture from Copernicus can be seen in the falls on the Sinus Aestuum-I DMD (Figure 13a). This phenomenon, combined with the result of the minerals, show that the Copernicus ejecta is younger than the Sinus Aestuum-I DMD.
Weitz et al. showed that the Sinus Aestuum-I DMD shares a centralized vent with the Sinus Aestuum-II DMD (Figure 14). The central vent would be at 4°N 12°W [48]. However, the DMD at this location and other lowlands became buried by Im. Such a case and the OMAT map together, indicate that the Hawaiian-style eruption which formed the Sinus Aestuum-I DMD and the Sinus Aestuum-II DMD is earlier than Im.
4.3. Olivine Rich Strata in Copernicus H
An early study by Bell et al., suggested that the Copernicus H crater exposes the excavation of mare basalt from beneath the Copernicus ejecta deposits, based on the basalt excavation theory of the dark-haloed crater [46]. According to the theory, the rich olivine in the Copernicus H wall comes from Im. Following years of research, a variety of olivine origin theories have been presented and indicated that the olivine-bearing lithologies of Copernicus are diverse and did not all form in the same way [22,28]. Therefore, it is necessary to study the differences between the rich olivine area in Copernicus H and the other regions, and to clarify the type of olivine in the Copernicus H wall. There is an olivine-bearing crystallizing melt pond in the northern wall of Copernicus (Figure 15). The crystallizing melt pond breached and flowed down the crater wall because of the geological process of the impact melt [28]. However, the prominent line nature of the melt pond in the northern wall of Copernicus does not exit from the wall of Copernicus H (Figure 9 and Figure 10).
What’s more, the Sinus Aestuum-I DMD is another olivine-bearing occurrence near the C-H basin. We found two craters in the Sinus Aestuum-I DMD from which we can learn more about the olivine rich strata. As Figure 16 shows, compared with the Sinus Aestuum-I DMD, olivine inside both craters is poorer. Considering that the depths of these two craters are 190 m (Figure 16b,c) and 350 m (Figure 16d,e), respectively, and much shallower than Copernicus H (Figure 9). Thus, olivine in Copernicus H is also different from the olivine in the Sinus Aestuum-I DMD. Above all, the opinion of Bell et al. that Copernicus H exposes Im2 under the Copernicus ejecta is still reliable [46].
4.4. Evolution of the C-H Basines
The olivine value in the flat bottom of Copernicus H is similar to the ejecta from it. Figure 10a,b suggests that the flat bottom has a similar composition to the crater wall and has not exposed the original surface of the C-H basin. Thus, the depth of the C-H basin surface should be deeper than that of Copernicus H (890 m, Figure 9). Meanwhile, In Figure 10a, the rich olivine rim wall of Copernicus suggests that it is basalt which is located above the original surface of the C-H basin. Thus, 3.8 Ga should correspond to the Imbrian basalt and the age of the C-H basin should older than 3.9 Ga. This age range covers the result of Liu et al. [24]. Considering the Stadius crater (Figure 17), which is located 186 km east of Copernicus, was obviously buried by Im2, the assumption that the C-H basin was buried by the Imbrian basalt, and the rim of the C-H basin is eroded by the ejecta from the Copernicus impact event and the weathering processes, is reasonable. Evans et al. divided the QCMAs with diameters greater than 80 km into high/low-relative-Bouguer-anomaly groups, interpreted as craters formed prior to and after the onset of the local mare [13]. However, they did not specify this characteristic of the C-H basin in their study. According to our assumption, the C-H basin formed prior to Im2 and should be divided into the high-relative-Bouguer-anomaly groups.
The ages of the Sinus Aestuum-I DMD (the Id part in Figure 17) cannot be obtained from the CSFD because their unconsolidated nature is thought to have artificially reduced the number of small craters observed on their surfaces [49,51]. Considering that the Sinus Aestuum-I DMD has a lower OMAT value than the mare, the corresponding Hawaiian-style eruption event should be earlier than the formation of the last Imbrian lava event.
Based on the age of Copernicus, the evolution of the C-H basin can be expressed as: an impact event occurred more than 3.7 Ga. From 3.7 Ga to 3.4 Ga, the mantle plugs upwelling into giant impact basins, followed by the volcanic filling in Copernicus and the nearby area, thus forming the positive Bouguer gravity anomaly buried basin and the Im2 units. During that time, a Hawaiian-style eruption formed the whole Sinus Aestuum DMD. Some DMDs on high places, such as Aestuum-I and II survived from the last Imbrian lava event. Then ejecta from the Copernicus impact event in about 820 Ma, and the weathering processes cause the rim of the C-H basin to almost disappear from the lunar surface. Finally, Copernicus H is exposed to the original surface.
5. Conclusions
We use multi-source remote sensing data including: images, topography, spectrum to analyze the positive Bouguer gravity anomaly to the south-east of Copernicus. Our results show that the mascon (QCMA) is a buried basin. The details of the C-H basin lead to the following conclusions:
- The C-H basin’s basic parameters are updated and located in 7.2°N 18.2°W, with a rim 260 km in diameter and a peak-ring 130 km in diameter. It should be classified as peak-ring basin and divided into the high-relative-Bouguer-anomaly groups.
- The DEM and the spectral data on Copernicus H suggest that the thickness of Im2 in the C-H basin is 890 m. What’s more, the surface of the C-H basin is buried deeper than 890 m.
- The C-H basin impact event occurred earlier than 3.9 Ga, maybe during the Aitkennian Epoch [24]. Then, a Hawaiian-style eruption formed the Sinus Aestuum-I DMD. Soon, Im2 filled it in, from 3.8 Ga. In addition to the intrusive basalts, the ejecta from the Copernicus impact event in about 800 Ma and the weathering processes also cause the disappearance of the C-H basin’s rim from the lunar surface. The Bouguer gravity anomaly was formed by the mantle upwelling [20]. However, the lunar dynamo likely ceased sometime between 1.92 Ga–0.80 Ga [52], earlier than the formation of Copernicus. There was not enough heat for the mantle upwelling and formation. Therefore, the Copernicus crater does not have a “mascon” characteristic.
Author Contributions
Conceptualization, X.X.; methodology, X.X. and T.H.; formal analysis, X.X. and T.H.; data curation, X.X., X.D. and L.Z.; writing—original draft preparation, X.X.; supervision, Z.K.; project administration, Z.K.; funding acquisition, Z.K. All authors have read and agreed to the published version of the manuscript.
Funding
This work was supported by National Key R&D Program of China (Grant Nos. 2020YFE0202100 and 2019YFE0123300), the National Natural Science Foundation of China (Grant No. 41872207), the Pre-research Project on Civil Aerospace Technologies Funded by China National Space Ad-ministration (CNSA) (No. D020204).
Data Availability Statement
GRGM1200A bouguer data gggrx_1200l_boug_l660 are obtained from NASA’s Planetary Data System (PDS): https://ode.rsl.wustl.edu/moon/indexDatasets.aspx (accessed on 30 May 2022). Moon LRO LOLA-SELENE Kaguya TC DEM Merge, olivine and optical maturity (OMAT) parameter images from Kaguya MI and Kaguya TCortho Mosaic Global image are available at https://astrogeology.usgs.gov/site/annex (accessed on 30 May 2022). Unified Geologic Map of the Moon, 1:5M, 2020 from NASA can be downloaded at https://astrogeology.usgs.gov/search/map/Moon/Geology/Unified_Geologic_Map_of_the_Moon (accessed on 30 May 2022). Moon LRO LROC WAC Global Morphology Mosaic can be downloaded at https://astrogeology.usgs.gov/search/map/Moon/LRO/LROC_WAC/Lunar_LRO_LROC-WAC_Mosaic_global_100m_June2013.cub (accessed on 30 May 2022). Moon LROC WAC DTM GLD100 can be downloaded at https://astrogeology.usgs.gov/search/map/Moon/LRO/LROC_WAC/Lunar_LROC_WAC_GLD100_79s79n_118m_v1_1.cub (accessed on 30 May 2022). CE2 DOM can be downloaded at https://moon.bao.ac.cn/ce5web/moonGisMap.search (accessed on 30 May 2022).
Conflicts of Interest
The authors declare no conflict of interest.
References
- Kang, Z.; Wang, X.; Hu, T.; Yang, J. Coarse-to-Fine Extraction of Small-Scale Lunar Impact Craters From the CCD Images of the Chang’E Lunar Orbiters. IEEE Trans. Geosci. Remote Sens. 2019, 57, 181–193. [Google Scholar] [CrossRef]
- Jia, M.N.; Di, K.C.; Yue, Z.Y.; Liu, B.; Wan, W.H.; Niu, S.L.; Liu, J.Z.; Cheng, W.M.; Lin, Y.T. Multi-scale morphologic investigation of craters in the Chang’ e-4 landing area. Icarus 2021, 355, 114164. [Google Scholar] [CrossRef]
- Robbins, S.J. A New Global Database of Lunar Impact Craters >1–2 km: 1. Crater Locations and Sizes, Comparisons With Published Databases, and Global Analysis. J. Geophys. Res. Planets 2019, 124, 871–892. [Google Scholar] [CrossRef]
- Wang, Y.; Wu, B.; Xue, H.; Li, X.; Ma, J. An Improved Global Catalog of Lunar Impact Craters (≥1 km) With 3D Morphometric Information and Updates on Global Crater Analysis. J. Geophys. Res. Planets 2021, 126, e2020JE006728. [Google Scholar] [CrossRef]
- Hu, T.; Kang, Z.; Massironi, M.; Hiesinger, H.; van der Bogert, C.H.; Gamba, P.; Brunetti, M.T.; Melis, M.T. Geological evolution of the Sinus Iridum basin. Planet. Space Sci. 2020, 194, 105134. [Google Scholar] [CrossRef]
- Muller, P.M.; Sjogren, W.L. Mascons: Lunar Mass Concentrations. Science 1968, 161, 680–684. [Google Scholar] [CrossRef] [PubMed]
- Wise, D.U.; Yates, M.T. Mascons as structural relief on a lunar ‘moho’. J. Geophys. Res. 1970, 75, 261–268. [Google Scholar] [CrossRef] [Green Version]
- Phillips, R.J.; Dvorak, J. The origin of lunar mascons: Analysis of the Bouguer gravity associated with Grimaldi. In Proceedings of the Conference on Multi-ring Basins: Formation and evolution, Houston, TX, USA, 10–12 November 1980; p. 91. [Google Scholar]
- Urey, H.C. Mascons and the History of the Moon. Science 1968, 162, 1408–1410. [Google Scholar] [CrossRef]
- Conel, J.E.; Holstrom, G.B. Lunar Mascons: A Near-Surface Interpretation. Science 1968, 162, 1403–1405. [Google Scholar] [CrossRef]
- Andrews-Hanna, J.C. The origin of the non-mare mascon gravity anomalies in lunar basins. Icarus 2013, 222, 159–168. [Google Scholar] [CrossRef]
- Konopliv, A.S.; Binder, A.B.; Hood, L.L.; Kucinskas, A.B.; Sjogren, W.L.; Williams, J.G. Improved gravity field of the moon from lunar prospector. Science 1998, 281, 1476–1480. [Google Scholar] [CrossRef] [PubMed] [Green Version]
- Evans, A.J.; Soderblom, J.M.; Andrews-Hanna, J.C.; Solomon, S.C.; Zuber, M.T. Identification of buried lunar impact craters from GRAIL data and implications for the nearside maria. Geophys. Res. Lett. 2016, 43, 2445–2455. [Google Scholar] [CrossRef] [Green Version]
- Deutsch, A.N.; Neumann, G.A.; Head, J.W.; Wilson, L. GRAIL-identified gravity anomalies in Oceanus Procellarum: Insight into subsurface impact and magmatic structures on the Moon. Icarus 2019, 331, 192–208. [Google Scholar] [CrossRef] [PubMed]
- Sood, R.; Chappaz, L.; Melosh, H.J.; Howell, K.C.; Milbury, C.; Blair, D.M.; Zuber, M.T. Detection and characterization of buried lunar craters with GRAIL data. Icarus 2017, 289, 157–172. [Google Scholar] [CrossRef]
- Neumann, G.A.; Zuber, M.T.; Wieczorek, M.A.; Head, J.W.; Baker, D.M.H.; Solomon, S.C.; Smith, D.E.; Lemoine, F.G.; Mazarico, E.; Sabaka, T.J.; et al. Lunar impact basins revealed by Gravity Recovery and Interior Laboratory measurements. Sci. Adv. 2015, 1, e1500852. [Google Scholar] [CrossRef] [PubMed] [Green Version]
- Melosh, H.J.; Freed, A.M.; Johnson, B.C.; Blair, D.M.; Andrews-Hanna, J.C.; Neumann, G.A.; Phillips, R.J.; Smith, D.E.; Solomon, S.C.; Wieczorek, M.A.; et al. The Origin of Lunar Mascon Basins. Science 2013, 340, 1552–1555. [Google Scholar] [CrossRef]
- Montesi, L.G.J. Solving the Mascon Mystery. Science 2013, 340, 1535–1536. [Google Scholar] [CrossRef]
- Baker, D.M.H.; Head, J.W.; Phillips, R.J.; Neumann, G.A.; Bierson, C.J.; Smith, D.E.; Zuber, M.T. GRAIL gravity observations of the transition from complex crater to peak-ring basin on the Moon: Implications for crustal structure and impact basin formation. Icarus 2017, 292, 54–73. [Google Scholar] [CrossRef]
- Klokočník, J.; Kostelecký, J.; Cílek, V.; Kletetschka, G.; Bezděk, A. Gravity aspects from recent gravity field model GRGM1200A of the Moon and analysis of magnetic data. Icarus 2022, 384, 115086. [Google Scholar] [CrossRef]
- Zhou, C.; Zhang, Y.; Chen, S.; Zhu, B. Analyzing the Magnesium (Mg) Number of Olivine on the Lunar Surface and Its Geological Significance. Remote Sens. 2019, 11, 1544. [Google Scholar] [CrossRef]
- Bugiolacchi, R.; Mall, U.; Bhatt, M.; McKenna-Lawlor, S.; Banaszkiewicz, M.; Brønstad, K.; Nathues, A.; Søraas, F.; Ullaland, K.; Pedersen, R.B. An in-depth look at the lunar crater Copernicus: Exposed mineralogy by high-resolution near-infrared spectroscopy. Icarus 2011, 213, 43–63. [Google Scholar] [CrossRef] [Green Version]
- McCord, T.B.; Charette, M.P.; Johnson, T.V.; Lebofsky, L.A.; Pieters, C.; Adams, J.B. Lunar spectral types. J. Geophys. Res. 1972, 77, 1349–1359. [Google Scholar] [CrossRef]
- Liu, J.; Liu, J.; Yue, Z.; Zhang, L.; Wang, J.; Zhu, K. Characterization and interpretation of the global lunar impact basins based on remote sensing. Icarus 2022, 378, 114952. [Google Scholar] [CrossRef]
- Goossens, S.; Sabaka, T.J.; Wieczorek, M.A.; Neumann, G.A.; Mazarico, E.; Lemoine, F.G.; Nicholas, J.B.; Smith, D.E.; Zuber, M.T. High-Resolution Gravity Field Models from GRAIL Data and Implications for Models of the Density Structure of the Moon’s Crust. J. Geophys. Res. Planets 2020, 125, e2019JE006086. [Google Scholar] [CrossRef]
- Barker, M.K.; Mazarico, E.; Neumann, G.A.; Zuber, M.T.; Haruyama, J.; Smith, D.E. A new lunar digital elevation model from the Lunar Orbiter Laser Altimeter and SELENE Terrain Camera. Icarus 2016, 273, 346–355. [Google Scholar] [CrossRef] [Green Version]
- Lemelin, M.; Lucey, P.G.; Gaddis, L.R.; Hare, T.; Ohtake, M. Global Map Products from the Kaguya Multiband Imager at 512 ppd: Minerals, FeO, and OMAT. In Proceedings of the 47th Annual Lunar and Planetary Science Conference, The Woodlands, TX, USA, 21–25 March 2016; p. 2994. [Google Scholar]
- Dhingra, D.; Pieters, C.M.; Head, J.W. Multiple origins for olivine at Copernicus crater. Earth Planet. Sci. Lett. 2015, 420, 95–101. [Google Scholar] [CrossRef]
- Lucey, P.G. Mineral maps of the Moon. Geophys. Res. Lett. 2004, 31, 1–4. [Google Scholar] [CrossRef]
- Lucey, P.G.; Blewett, D.T.; Taylor, G.J.; Hawke, B.R. Imaging of lunar surface maturity. J. Geophys. Res. 2000, 105, 20377–20386. [Google Scholar] [CrossRef]
- Fortezzo, C.M.; Spudis, P.D.; Harrel, S.L. Release of the Digital Unified Global Geologic Map of the Moon at 1:5,000,000-Scale. In Proceedings of the Lunar and Planetary Science Conference, The Woodlands, TX, USA, 16–20 March 2020; p. 2760. [Google Scholar]
- Konopliv, A.S.; Park, R.S.; Yuan, D.-N.; Asmar, S.W.; Watkins, M.M.; Williams, J.G.; Fahnestock, E.; Kruizinga, G.; Paik, M.; Strekalov, D.; et al. High-resolution lunar gravity fields from the GRAIL Primary and Extended Missions. Geophys. Res. Lett. 2014, 41, 1452–1458. [Google Scholar] [CrossRef]
- Lemoine, F.G.; Goossens, S.; Sabaka, T.J.; Nicholas, J.B.; Mazarico, E.; Rowlands, D.D.; Loomis, B.D.; Chinn, D.S.; Neumann, G.A.; Smith, D.E.; et al. GRGM900C: A degree 900 lunar gravity model from GRAIL primary and extended mission data. Geophys. Res. Lett. 2014, 41, 3382–3389. [Google Scholar] [CrossRef]
- Melosh, H.J. Impact Cratering: A Geologic Process; Oxford University Press: New York, NY, USA, 1989. [Google Scholar]
- Du, J.; Fa, W.; Wieczorek, M.A.; Xie, M.; Cai, Y.; Zhu, M.-H. Thickness of Lunar Mare Basalts: New Results Based on Modeling the Degradation of Partially Buried Craters. J. Geophys. Res. Planets 2019, 124, 2430–2459. [Google Scholar] [CrossRef]
- Neukum, G.; Ivanov, B.A.; Hartmann, W.K. Cratering Records in the Inner Solar System in Relation to the Lunar Reference System. Space Sci. Rev. 2001, 96, 55–86. [Google Scholar] [CrossRef]
- Kneissl, T.; van Gasselt, S.; Neukum, G. Map-projection-independent crater size-frequency determination in GIS environments—New software tool for ArcGIS. Planet. Space Sci. 2011, 59, 1243–1254. [Google Scholar] [CrossRef]
- Michael, G.G.; Platz, T.; Kneissl, T.; Schmedemann, N. Planetary surface dating from crater size–frequency distribution measurements: Spatial randomness and clustering. Icarus 2012, 218, 169–177. [Google Scholar] [CrossRef]
- Michael, G.; Neukum, G. Planetary Surface Dating from Crater Size-Frequency Distribution Measurements: Differential Forms of Production Function Polynomials. In Proceedings of the Lunar and Planetary Science Conference, The Woodlands, TX, USA, 1–5 March 2010. [Google Scholar]
- Lemelin, M.; Lucey, P.G.; Song, E.; Taylor, G.J. Lunar central peak mineralogy and iron content using the Kaguya Multiband Imager: Reassessment of the compositional structure of the lunar crust. J. Geophys. Res. Planets 2015, 120, 869–887. [Google Scholar] [CrossRef]
- Solomon, S.C.; Head, J.W. Lunar Mascon Basins: Lava filling, tectonics, and evolution of the lithosphere. Rev. Geophys. 1980, 18, 107–141. [Google Scholar] [CrossRef]
- Yue, Z.; Yang, M.; Jia, M.; Michael, G.; Di, K.; Gou, S.; Liu, J. Refined model age for Orientale Basin derived from zonal crater dating of its ejecta. Icarus 2020, 346, 113804. [Google Scholar] [CrossRef]
- Eberhardt, P.; Geiss, J.; Grögler, N.; Stettler, A. How old is the crater copernicus? Moon 1973, 8, 104–114. [Google Scholar] [CrossRef]
- Alexander, E.C., Jr.; Bates, A.; Coscio, M.R., Jr.; Dragon, J.C.; Murthy, V.R.; Pepin, R.O.; Venkatesan, T.R. K/Ar dating of lunar soils II. Lunar Planet. Sci. Conf. Proc. 1976, 1, 625–648. [Google Scholar]
- Hiesinger, H.; van der Bogert, C.H.; Pasckert, J.H.; Funcke, L.; Giacomini, L.; Ostrach, L.R.; Robinson, M.S. How old are young lunar craters? J. Geophys. Res. Planets 2012, 117, 1–15. [Google Scholar] [CrossRef]
- Bell, J.F.; Hawke, B.R. Lunar dark-haloed impact craters: Origin and implications for Early Mare volcanism. J. Geophys. Res. Solid Earth 1984, 89, 6899–6910. [Google Scholar] [CrossRef]
- Chen, Y.; Wang, X.; Liu, J.; Ren, X.; Huang, H.; Zhang, H.; Li, C. The Identification and Analysis of Gas-Related Volcanic Features within Chang’e-5 Landing Region. Remote Sens. 2021, 13, 3879. [Google Scholar] [CrossRef]
- Weitz, C.M.; Head, J.W.; Pieters, C.M. Lunar regional dark mantle deposits: Geologic, multispectral, and modeling studies. J. Geophys. Res. Planets 1998, 103, 22725–22759. [Google Scholar] [CrossRef]
- Gaddis, L.R.; Staid, M.I.; Tyburczy, J.A.; Hawke, B.R.; Petro, N.E. Compositional analyses of lunar pyroclastic deposits. Icarus 2003, 161, 262–280. [Google Scholar] [CrossRef]
- Jawin, E.R.; Besse, S.; Gaddis, L.R.; Sunshine, J.M.; Head, J.W.; Mazrouei, S. Examining spectral variations in localized lunar dark mantle deposits. J. Geophys. Res. Planets 2015, 120, 1310–1331. [Google Scholar] [CrossRef] [Green Version]
- Gustafson, J.O.; Bell, J.F.; Gaddis, L.R.; Hawke, B.R.; Giguere, T.A. Characterization of previously unidentified lunar pyroclastic deposits using Lunar Reconnaissance Orbiter Camera data. J. Geophys. Res. Planets 2012, 117, 1–21. [Google Scholar] [CrossRef]
- Mighani, S.; Wang, H.P.; Shuster, D.L.; Borlina, C.S.; Nichols, C.I.O.; Weiss, B.P. The end of the lunar dynamo. Sci. Adv. 2020, 6. [Google Scholar] [CrossRef]
Figure 1.
Copernicus crater and the surrounding area. (a) Copernicus area on a LROC WAC Global Morphology Mosaic; (b) Copernicus area on a LROC WAC DTM GLD100; (c) Copernicus area on a “Unified Geologic Map of the Moon, 1:5M, 2020”.
Figure 1.
Copernicus crater and the surrounding area. (a) Copernicus area on a LROC WAC Global Morphology Mosaic; (b) Copernicus area on a LROC WAC DTM GLD100; (c) Copernicus area on a “Unified Geologic Map of the Moon, 1:5M, 2020”.

Figure 2.
Bouguer gravity of the Copernicus area.

Figure 3.
Previous studies of the C-H basin, as shown on the LROC WAC Global Morphology Mosaic. Blue circles from Neumann et al. [16]; pink circles from Evans et al. [13]; orange circle from Liu et al. [24].

Figure 4.
Surviving rim on the basin rim, as given by Neumann. The elevations are from the LOLA-SELENE Kaguya TC DEM.
Figure 4.
Surviving rim on the basin rim, as given by Neumann. The elevations are from the LOLA-SELENE Kaguya TC DEM.

Figure 5.
Geology map of the Copernicus area showing the linear rilles and mare ridges.

Figure 6.
Bouguer gravity anomaly CSFD dating. (a) Primary craters (red) and secondary craters (yellow) in the intersection of the Copernicus ejecta and the Bouguer gravity anomaly (blue); (b) Differential crater frequency and geologic time of the Bouguer gravity anomaly.
Figure 6.
Bouguer gravity anomaly CSFD dating. (a) Primary craters (red) and secondary craters (yellow) in the intersection of the Copernicus ejecta and the Bouguer gravity anomaly (blue); (b) Differential crater frequency and geologic time of the Bouguer gravity anomaly.

Figure 7.
Copernicus ejecta CSFD dating. (a) Primary craters (red) and secondary craters (yellow) in the intersection of the Copernicus ejecta; (b) Differential crater frequency and geologic time of the Copernicus ejecta.
Figure 7.
Copernicus ejecta CSFD dating. (a) Primary craters (red) and secondary craters (yellow) in the intersection of the Copernicus ejecta; (b) Differential crater frequency and geologic time of the Copernicus ejecta.

Figure 8.
Position of Copernicus H crater on the Kaguya TCortho Mosaic.

Figure 9.
Elevation Profile of Copernicus H from the LOLA-SELENE Kaguya TC DEM.

Figure 10.
Mineral maps of the OMAT and olivine of Copernicus H. (a) OMAT in Copernicus H; (b) Olivine values on Copernicus H.
Figure 10.
Mineral maps of the OMAT and olivine of Copernicus H. (a) OMAT in Copernicus H; (b) Olivine values on Copernicus H.

Figure 11.
Position and the OMAT map of Sinus Aestuum-I DMD.

Figure 12.
Previous study results and the Imbrium basin, shown on the LROC WAC DTM GLD100. Blue circles from Neumann et al. [16]; pink circles from Evans et al. [13]; orange circle from Liu et al. White circles from Neumann et al. are rims of the Imbrium basin [24].

Figure 13.
Sinus Aestuum-Ⅰ DMD. (a) Sinus Aestuum-Ⅰ DMD on the Kaguya TCortho Mosaic, the red arrow points to the radial texture from Copernicus; (b) Geological map of the Sinus Aestuum-Ⅰ DMD; (c) Elevation of the Sinus Aestuum-I DMD; (d) Slope of the Sinus Aestuum-Ⅰ DMD.
Figure 13.
Sinus Aestuum-Ⅰ DMD. (a) Sinus Aestuum-Ⅰ DMD on the Kaguya TCortho Mosaic, the red arrow points to the radial texture from Copernicus; (b) Geological map of the Sinus Aestuum-Ⅰ DMD; (c) Elevation of the Sinus Aestuum-I DMD; (d) Slope of the Sinus Aestuum-Ⅰ DMD.

Figure 14.
Aestuum Ⅰ DMD and the Sinus Aestuum-Ⅱ DMD. (a) Aestuum Ⅰ DMD and the Sinus Aestuum-Ⅱ DMD on the LROC WAC Global Morphology Mosaic; (b) Geology of the Aestuum Ⅰ DMD and the Sinus Aestuum-Ⅱ DMD.
Figure 14.
Aestuum Ⅰ DMD and the Sinus Aestuum-Ⅱ DMD. (a) Aestuum Ⅰ DMD and the Sinus Aestuum-Ⅱ DMD on the LROC WAC Global Morphology Mosaic; (b) Geology of the Aestuum Ⅰ DMD and the Sinus Aestuum-Ⅱ DMD.

Figure 15.
Olivine-bearing exposure in the northern wall of Copernicus. (a) Olivine-bearing exposure shown on the CE2 DOM G122; (b) Olivine map of the exposure.
Figure 15.
Olivine-bearing exposure in the northern wall of Copernicus. (a) Olivine-bearing exposure shown on the CE2 DOM G122; (b) Olivine map of the exposure.

Figure 16.
Two craters in the Sinus Aestuum-Ⅰ DMD. (a) Position of the craters on the Sinus Aestuum-Ⅰ DMD shown on the Kaguya TCortho Mosaic; (b) Crater A shown on the CE2 DOM G222; (c) Olivine map of Crater A; (d) Crater B shown on the CE2 DOM G222 and G223; (e) Olivine map of Crater B.
Figure 16.
Two craters in the Sinus Aestuum-Ⅰ DMD. (a) Position of the craters on the Sinus Aestuum-Ⅰ DMD shown on the Kaguya TCortho Mosaic; (b) Crater A shown on the CE2 DOM G222; (c) Olivine map of Crater A; (d) Crater B shown on the CE2 DOM G222 and G223; (e) Olivine map of Crater B.


Figure 17.
Stadius crater on the geological map and the Kaguya TCortho Mosaic.

Publisher’s Note: MDPI stays neutral with regard to jurisdictional claims in published maps and institutional affiliations. |
© 2022 by the authors. Licensee MDPI, Basel, Switzerland. This article is an open access article distributed under the terms and conditions of the Creative Commons Attribution (CC BY) license (https://creativecommons.org/licenses/by/4.0/).
Share and Cite
MDPI and ACS Style
Xu, X.; Hu, T.; Kang, Z.; Du, X.; Zhao, L. Study of the Buried Basin C-H, Based on the Multi-Source Remote Sensing Data. Remote Sens. 2022, 14, 5284. https://doi.org/10.3390/rs14215284
AMA Style
Xu X, Hu T, Kang Z, Du X, Zhao L. Study of the Buried Basin C-H, Based on the Multi-Source Remote Sensing Data. Remote Sensing. 2022; 14(21):5284. https://doi.org/10.3390/rs14215284
Chicago/Turabian StyleXu, Xiaojian, Teng Hu, Zhizhong Kang, Xing Du, and Lin Zhao. 2022. "Study of the Buried Basin C-H, Based on the Multi-Source Remote Sensing Data" Remote Sensing 14, no. 21: 5284. https://doi.org/10.3390/rs14215284
Note that from the first issue of 2016, this journal uses article numbers instead of page numbers. See further details here.