
A Data Fusion Method for Generating Hourly Seamless Land Surface Temperature from Himawari-8 AHI Data
by
 , ,
, ,
Shengyue Dong
1,2,
Jie Cheng
1,2,* ,
,
Jiancheng Shi
3,
Chunxiang Shi
4,
Shuai Sun
4 and
Weihan Liu
1,2 1
State Key Laboratory of Remote Sensing Science, Jointly Sponsored by Beijing Normal University and Airspace Information Research Institute of Chinese Academy of Sciences, Beijing 100875, China
2
Institute of Remote Sensing Science and Engineering, Faculty of Geographical Science, Beijing Normal University, Beijing 100875, China
3
National Space Science Center, Chinese Academy of Sciences, Beijing 100190, China
4
National Meteorological Information Centre, China Meteorological Administration, Beijing 100081, China
*
Author to whom correspondence should be addressed.
Remote Sens. 2022, 14(20), 5170; https://doi.org/10.3390/rs14205170
Submission received: 12 August 2022
/
Revised: 12 October 2022
/
Accepted: 13 October 2022
/
Published: 16 October 2022
(This article belongs to the Special Issue Thermal Remote Sensing for Monitoring Terrestrial Environment)
Abstract
:High temporal resolution and spatially complete (seamless) land surface temperature (LST) play a crucial role in numerous geoscientific aspects. This paper proposes a data fusion method for producing hourly seamless LST from Himawari-8 Advanced Himawari Imager (AHI) data. First, the high-quality hourly clear-sky LST was retrieved from AHI data by an improved temperature and emissivity separation algorithm; then, the hourly spatially complete China Land Data Assimilation System (CLDAS) LST was calibrated by a bias correction method. Finally, the strengths of the retrieved AHI LST and bias-corrected CLDAS LST were combined by the multiresolution Kalman filter (MKF) algorithm to generate hourly seamless LST at different spatial scales. Validation results showed the bias and root mean square error (RMSE) of the fused LST at a finer scale (0.02°) were −0.65 K and 3.38 K under cloudy sky conditions, the values were −0.55 K and 3.03 K for all sky conditions, respectively. The bias and RMSE of the fused LST at the coarse scale (0.06°) are −0.46 K and 3.11 K, respectively. This accuracy is comparable to the accuracy of all-weather LST derived by various methods reported in the published literature. In addition, we obtained the consistent LST images across different scales. The seamless finer LST data over East Asia can not only reflect the spatial distribution characteristics of LST during different seasons, but also exactly present the diurnal variation of the LST. With the proposed method, we have produced a 0.02° seamless LST dataset from 2016 through 2021 that is freely available at the National Tibetan Plateau Data Center. It is the first time that we can obtain the hourly seamless LST data from AHI.
1. Introduction
Land surface temperature (LST) is a key parameter controlling the energy exchange between the atmosphere and the surface in land surface processes [1,2,3] and has been widely used in various disciplines, such as climate change [4,5], evapotranspiration [6], agriculture [7], hydrology [8] and urban climate studies [9,10].
Typically, LST is obtained from ground measurements, satellite remote sensing and land surface modeling [11]. Among them, ground measurements can monitor LST with a high temporal continuity in the small footprint of the sparsely distributed ground sites [12]. Thermal-infrared (TIR) remote sensing is an effective tool for obtaining LST at a large scale. TIR observations from polar-orbiting satellites, such as the MODerate resolution Imaging Spectroradiometer (MODIS) and Landsat series [13,14], and geostationary satellites, such as Fengyun-4A, Himawari-8 and Meteosat Second Generation (MSG) [15,16,17] have already been explored to generate LST products. Specifically, polar-orbiting satellites provide TIR observations with relatively fine spatial resolution and coarse temporal resolution, which hinders the application of LST in numerous fields, such as soil freeze/thaw status discrimination [18], diurnal variation in Earth-atmosphere system parameters modeling [19] and land surface hydrological process simulation [8]. Geostationary satellites can achieve a temporal resolution up to 2.5 min, which can compensate for the deficiencies in the temporal continuity of polar-orbiting satellites. However, the TIR observations of both polar-orbiting satellites and geostationary satellites are spatially incomplete because TIR signals cannot penetrate clouds and obtain LST information underneath clouds. Microwave (MW) remote sensing can obtain cloudy sky LST [20]. Unfortunately, both the accuracy and spatial resolution of MW LST under clear-sky conditions are inferior to TIR LST thus far.
Recently, a large number of methods for estimating cloudy-sky LST have been proposed and significant progress has been achieved. These methods can be roughly categorized as spatial interpolation methods, surface energy balance (SEB) methods, machine learning methods and spatiotemporal data fusion methods. Spatial interpolation methods [21,22,23,24], such as inverse distance weighting (IDW) and kriging interpolation, rely on the correlations of neighboring pixels by treating these neighboring pixels as reference data. Therefore, it may be inappropriate for images with a large amount of missing data. Jin and Dickinson [25] proposed the method of obtaining the LST of cloudy pixels via its neighboring pixels (NP) based on SEB theory. Lu et al. [26] then expanded the application of NP to geostationary satellite data by capitalizing the information on the temporal domain, but the accuracy was not as excellent as expected. Notwithstanding, the SEB method is physics-based for both polar-orbiting satellites and geostationary satellites, while spatially NP or temporally NP may be invalid in large cloud coverage areas or long cloud cover times. Recently, machine learning presented an excellent ability to reconstruct missing remote sensing data [27,28,29]. Shwetha and Kumar [30] formulated the relationship between LST and the microwave polarization difference index (MPDI) via an artificial neural network (ANN) model to utilize it to estimate cloudy-sky LST for different land cover classes. Compared with physical-based methods, machine learning methods are data driven and the output of machine learning methods is commonly hard to interpret [31]. Some pitfalls associated with the primary characteristics of machine learning, for example, the risk of sampling biases, ignorance of other factors and excessive reliance on input data, should be avoided using prior knowledge. The spatiotemporal data fusion methods become a practical method of obtaining all weather LST [32,33]. For example, the enhanced spatial and temporal adaptive reflectance fusion model (ESTARFM) [34] was employed to generate 1 km MODIS-like LST under all weather conditions by fusing the China Land Data Assimilation System (CLDAS) LST and MODIS LST [35]. However, most of these methods were developed for the polar-orbiting satellites by virtue of extra assumptions and empirical relationships, the utility of which remains unknown for geostationary satellites. For example, spatial interpolation methods and ESTARFM estimated the cloudy-sky LST considering the relationships with the LST of adjacent pixels, and it is doubtful whether LST can be expressed by the adjacent pixels due to its dramatic variability. Meanwhile, the spatial resolution of geostationary satellites is relatively coarser than that of polar-orbiting satellites, and spatially adjacent pixels determined by a certain rule may actually be quite far away from the target pixel in distance, which are less representative. Therefore, it is crucial to explore the way of obtaining seamless hourly LST from the geostationary satellite observations, which will certainly benefit many fields, such as summer high-temperature heat wave monitoring [36] and soil freeze/thaw status discrimination [18].
Land surface models (LSMs) are incorporated into the many land data assimilation systems, such as the China Land Data Assimilation System (CLDAS) [37], global land data assimilation system (GLDAS) [38] and North American Land Data Assimilation System (NLDAS) [39,40], which offer new possibilities to obtain LST with high temporal resolution and spatiotemporal continuity. However, the spatial resolution of the LSM-simulated LST is quite coarse. For example, the spatial resolutions of CLDAS LST, NLDAS LST and GLDAS LST are 0.0625°, 0.125° and 0.25°, respectively. Meanwhile, a large deviation exists in the LSM-simulated LST, compared with the remotely sensed LST [41,42,43]. It is essential to improve the quality of LSM LST before exploring its strengths.
It is a promising field to combine geostationary satellite-derived LST and the LSM-simulated LST to generate high spatial-temporal resolution seamless LST. However, few studies have been conducted to combine these two LSTs to generate high temporal resolution seamless LSTs due to the large differences in spatial resolution, spatial completeness and accuracy [44,45]. The purpose of this study is to propose a data fusion method that can effectively fuse geostationary satellite-derived high-quality hourly clear-sky LST and hourly spatial continuous LSM LST and generate hourly seamless LST data, in which the CLDAS LST was first calibrated by the AHI/Himawari-8 LST. Then, these two distinctive LSTs were fused by the multiresolution Kalman filter (MKF) algorithm, which has been successfully applied to fuse land surface variables at different spatial scales [46]. The paper is structured as follows. Section 2 describes the employed data and proposed methodology. The results and discussions are presented in Section 3 and Section 4, respectively, and finally, the conclusions are provided in Section 5.
2. Data and Methodology
2.1. Data
As shown in Table 1, three types of datasets were employed in this paper, including satellite data, CLDAS LST data and ground measurements. The AHI/Himawari-8 full disk data were used to retrieve the clear-sky LST, in conjunction with the auxiliary data, such as the Modern-Era Retrospective analysis for Research and Applications version 2 (MERRA-2) [47], MODIS series products (including NDVI product [48], snow cover product [49] and land cover product [50]) and the Combined ASTER and MODIS Emissivity for Land (CAMEL) product [51,52]. The CLDAS LST data were employed as an input of the MKF algorithm. The ground-measured surface longwave downward radiation and surface longwave upward radiation collected from the Heihe Watershed Allied Telemetry Experimental Research (HiWATER) network were used to derive in situ LST and validate the fused LST at finer and coarse scales.
2.1.1. Satellite Data
The Himawari-8 geostationary meteorological satellite entered the operational phase on 7 July 2015. Located at approximately 140°E, Himawari-8 can cover East Asia and Western Pacific regions (60°N~60°S, 80°E~160°W). Compared with its predecessor MTSat-2 (Himawari-7), Himawari-8 makes significant advances and can complete continuous full-disk observations every 10 min. There are 16 bands for the Advanced Himawari Imager (AHI) onboard Himawari-8, 6 of which are thermal infrared bands with a spatial resolution of 0.02° at nadir [53].
In this study, TIR band 11 (8.5 μm), band 13 (10.31 μm), band 14 (11.2 μm) and band 15 (12.3 μm) are employed to retrieve the LST, since band 12 (9.61 μm) and band 16 (13.3 μm) are located in the spectral region with strong ozone and carbon dioxide absorption [15]. The AHI cloud product is employed to distinguish clear-sky pixels and cloud sky pixels. During the retrieval of the clear-sky AHI LST, the MERRA-2 reanalysis data [47] were employed for the atmospheric correction. In this study, inst6_3d_ana_Np data, which contain the air temperature, geopotential height, and specific humidity for 42 pressure levels (from 1000 hPa to 0.1 hPa) every 6 h from 00:00 to 24:00 UTC with a spatial resolution of 0.5° × 0.625°, were selected, and the product (netCDF-4 format) was available from https://search.earthdata.nasa.gov (accessed on 1 July 2021).
Three MODIS products, i.e., MYD13A2, MOD10C1, and MCD12Q1, were selected in this study. MYD13A2 provides the NDVI dataset every 16 days with a spatial resolution of 1 km. MOD10C1 indicates global daily snow cover conditions, the value of which represents the percentage of snow cover in the corresponding grid. MCD12Q1 divides the global land surface into 17 classes according to the International Geosphere-Biosphere Programme (IGBP) system and provides land cover data accordingly. All the employed MODIS products can be freely accessed from https://search.earthdata.nasa.gov (accessed on 1 July 2021).
The CAMEL product is the synthetic emissivity product from the ASTER GED4 dataset and MODIS infrared emissivity dataset with spatial and temporal resolutions of 0.05° and 1 month, respectively. Here, it was chosen as the background emissivity value for AHI LST retrieval. Detailed information about the CAMEL dataset can refer to https://lpdaac.usgs.gov/products/cam5k30emv002 (accessed on 1 July 2021).
2.1.2. CLDAS LST Data
The CLDAS (CMA Land Data Assimilation System) was developed by the National Meteorological Information Center. Based on the STMAS (Space-Time Multiscale Analysis System) assimilation algorithm, the CLDAS atmosphere forcing data were established using multisource data, including ground measurements, ECMWF numerical analysis/forecast product, GFS numerical analysis/forecast product and satellite data. Subsequently, the forcing data was used to derive six LSMs (CLM 3.5, CoLM and Noah-MP 1–4) to produce simulated LSTs, from which the CLDAS LST was generated by averaging six LSM LSTs [37]. Compared to other land data assimilation systems, such as GLDAS [38] and NLDAS [39,40], CLDAS has a higher spatial resolution (0.0625° × 0.0625°) and temporal resolution (1 h). More detailed information can be found in http://data.cma.cn/ (accessed on 1 July 2021). Before being imported into the MKF algorithm, the CLDAS LST was resampled to a 0.06° × 0.06° spatial resolution and calibrated by a bias correction method.
2.1.3. Ground Measurements
To validate the LST estimated by the proposed data fusion method, ground-measured surface longwave radiation at six flux sites in the HiWATER network was employed (http://data.tpdc.ac.cn/zh-hans/ (accessed on 1 July 2021)) [54,55]. Detailed information regarding the sites is shown in Table 2.
In situ LSTs were calculated from the ground-measured surface longwave upward and downward radiation according to Stefan–Boltzmann’s law:
where is the in situ LST, is the surface longwave upward radiation, is the surface longwave downward radiation, is the surface broadband emissivity (BBE) and is Stefan–Boltzmann’s constant (5.67 × 10⁻⁸ W/m2/K4). Here, the broadband emissivity was obtained from the Global LAnd Surface Satellite (GLASS) BBE product, whose spatial resolution is 1 km and temporal resolution is 8 days [56,57,58].
The measurement accuracy of CNR1 net radiometers was approximately −8 W/m2 and 3 W/m2 in daytime and nighttime, respectively [59], which resulted in the uncertainty of the LST calculated using Equation (1) being 1.62 K and 0.37 K in daytime and nighttime, respectively [15].
As shown in Table 3, supposing that the field of view (FOV) of the flux towers is 170°, the footprint of the six sites in diameter ranges from 114 m to 274 m, which is much coarser than the spatial resolution of AHI. Therefore, it is doubtful whether the tower measurements are representative within the corresponding pixels of the AHI LST and the CLDAS LST. The high spatial resolution (90 m) ASTER LST product (AST_08) was collected to assess the spatial thermal homogeneity of the six sites [60]. In addition, the standard deviations (STDs) of the ASTER LST data from 2014 to 2019 were calculated for 23 × 23 pixel and 69 × 69 pixel windows, corresponding to the spatial resolutions of the AHI LST and CLDAS LST, respectively. The details of the median, minimum and maximum LST STDs are provided in Figure 1. The median STDs of 23 × 23 ASTER LST subsets were less than 2 K for all six sites, which is acceptable for LST validation. Meanwhile, the CLDAS LST exhibits a slightly lower spatial homogeneity with the highest STD of 2.73 K (AR site), which is caused by the fact that the spatial resolution of CLDAS LST is three times lower than that of AHI LST.
2.2. Methodology
As reported in Section 1, geostationary satellite-derived clear-sky LST has high accuracy and temporal resolution, but it is spatially incomplete, whereas the LSM-simulated LST is spatially continuous but has coarse spatial resolution and lower accuracy. Fusing these two distinctive complementary LSTs can effectively combine their respective advantages and is a promising solution to generate hourly seamless LST data.
The MKF algorithm is capable of filling the gaps of remote sensing products and reducing the inconsistency across different scales [46,61,62,63]. It can significantly improve the accuracy of coarse-scale data and improve the accuracy of finer-scale data to some extent.
As indicated by the evaluation results of LSM LSTs [41,42,43], there is a systematic deviation between LSM LST and remotely sensed LST due to the imperfect model mechanism or driven force. Thus, CLDAS LST should be calibrated by the more reliable AHI LST. Then, the calibrated CLDAS LST and clear-sky AHI LST are integrated by the MKF algorithm.
The flowchart for generating the hourly seamless LST is shown in Figure 2, which includes three steps: (1) retrieval of the clear-sky AHI LST via the iTES algorithm; (2) bias correction of the CLDAS LST to reduce the systematic deviation; and (3) fusion of the two scale LSTs with the MKF algorithm.
2.2.1. Clear-Sky AHI LST Retrieval
Due to the lack of official AHI LST products, a couple of split-window (SW) algorithms have been developed [64,65,66]. The SW algorithm assumed that the land surface emissivity (LSE) was known in advance, yet accurate LSE was extremely hard to obtain. Zhou and Cheng [15] proposed an improved temperature and emissivity separation (iTES) algorithm to simultaneously retrieve LST&E from AHI data. The iTES algorithm avoids determining the LSE before LST inversion and realizes accurate inversion of LST and LSE. Two core improvements were put forward in their study, i.e., a modified water vapor scaling method (WVS) [67] and a recalibrated empirical relationship over the vegetated surfaces. Compared with the original TES algorithm, the modified WVS broadens the application area for all land cover with a comparable accuracy, and the recalibrated empirical relationship improved the LST retrieval accuracy over the vegetated surface. According to the validation results using ground measurements from the HiWATER network and New Zealand flux tower network (OzFlux), the biases (RMSEs) of the retrieved AHI LST are 0.19 K (2.93 K) and −0.43 K (1.95 K) in the daytime and nighttime, respectively. Hence, the iTES algorithm was employed to retrieve clear-sky AHI LST in this study.
2.2.2. Calibration of CLDAS LST
Land surface models (LSMs) can simulate the spatiotemporally continuous LST based on its inner physical processes and dynamic mechanisms [68]. However, limitations still exist in LSM simulations, for example, land surface features, such as land surface heterogeneity, soil property variation and land cover diversity, cannot be accurately characterized by simple parameterization schemes of geophysical variables and land surface parameters [69]. As a result, systematic deviations inevitably arise when comparing the simulated LST to remotely sensed LST, which is the direct LST information of the true state instantaneously [68,70].
The bias correction method has been proven to be an effective approach in removing the systematic deviation between two LST products [71]. In this paper, the retrieved hourly AHI LST is treated as the reference data for its high accuracy and matched temporal resolution. The bias correction method was executed through the following procedures:
- (1)
- Aggregate the AHI LST from 0.02° to 0.06° spatially in a 3 × 3 window. The aggregated AHI LST was defined as the mean value of the AHI LST within the 3 × 3 window only when the number of clear-sky pixels within a CLDAS pixel (0.06° × 0.06°) was larger than 60%. For the spatial aggregation strategy, since the mean value of multiple small pixels is used as the value of the large pixel, the random deviation of the aggregated LST will be relatively reduced [72].
- (2)
- The CLDAS LST was corrected via a linear regression relationship.
2.2.3. The MKF Algorithm
The MKF algorithm was initially developed by Chou et al. [73] to estimate the random process of a signal. Due to the superior algorithm performance and computational efficiency of MKF, it was applied to fuse multiscale remote sensing data, for example, soil moisture [63], land surface albedo [61], broadband emissivity [46], and fraction of absorbed photosynthetically active radiation [62]. These studies showed that the MKF algorithm is effective in mitigating the inconsistency between different scales and generating spatially complete remote sensing products.
The idea of MKF is based on Kalman filtering [74]. Different from the regular Kalman filtering, which predicts the variables in the temporal domain, the MKF algorithm treats the data of different scales as the different temporal dimensions of Kalman filtering, assuming that the different-scale data are autoregressive and can be organized into a tree structure. Two critical steps successively implemented in the MKF algorithm are Kalman filtering from finer scale to coarse scale and Kalman smoothing from coarse scale to finer scale, the major purposes of which are to fill the gaps and obtain the optimal estimate at different scales, respectively. After the Kalman smoothing process, the data became gapless and consistent across different scales.
The tree structure of the MKF algorithm can be represented by a tree-node model with different scales (Figure 3). The nodes at each scale can be treated as the pixels within the corresponding spatial resolution. Coarse resolution data serve as root nodes, and the fine resolution data serve as leaf nodes. Note that the spatial extent of all the nodes of each scale is the same. In the MKF algorithm, the relationship between node and its parent node (called the state model) can be described as the linear dynamic model:
where and are the state estimates at scale and its parent scale , respectively. is the state transition matrix to obtain the variable from its parent scale and is generally assigned to an identity matrix. is the white noise independent of the state.
In addition, the predictor can be linked with the observations by:
where is the observation matrix and is the measurement noise, where . Before the MKF, the prior background variance can be obtained from root to leaves by:
where is the process variance obtained by the variance in the corresponding child nodes.
The MKF process involves two procedures: Kalman filtering and Kalman smoothing. In the Kalman filtering, the optimal estimator at scale can be updated by Kalman filter with the observations at scale :
where is the Kalman gain obtained by
Then, the predictors of scale can be obtained by the mentioned state model with the optimal estimator :
While all the child nodes have been predicted into a parent node, they should be blended based on their respective variance. The value of the parent node is a weighted average result with the reciprocal of the variance as the weighting factor.
where is the number of child nodes corresponding to a parent node.
Once the Kalman filtering has reached the root node, the final predicted value can be obtained via the Kalman smoothing step, following Equations (15) and (16).
where is the weighting coefficient.
In addition, the AHI LST and CLDAS LST were detrended before fusing because of the zero-mean assumption in the MKF, following the equations below:
where and are the CLDAS LST and AHI LST, respectively. and are the error variances of the CLDAS LST and AHI LST, respectively. Additionally, was calculated by Zhou and Cheng [15], whereas was obtained by the CLDAS LST and the aggregated AHI LST. is the background error variance.
The employed tree structure in the MKF algorithm is shown in Table 4. The bias-corrected CLDAS LST and the AHI LST were set to scale 7 and scale 8, respectively.
3. Results
3.1. Validation
The calculated in situ LST in 2016 was used to validate the fused LSTs at a finer scale (0.02°). The outliers in the samples were removed using the “3σ-Hempel identifier” [75] before validation. As shown in Figure 4, the fused LSTs at a finer scale are consistent with the in situ LSTs, and the samples are distributed around the diagonal line. The bias and root mean square error (RMSE) are −0.43 K and 2.59 K under clear-sky conditions, respectively, and the determination coefficient (R2) is 0.96, whereas the bias and RMSE are −0.65 K and 3.38 K under cloudy sky conditions, respectively, and the R2 is 0.98. The bias and RMSE are −0.55 K and 3.03 K under all sky conditions. To assess the extent of accuracy improvement through MKF, the original clear-sky AHI LST was also evaluated by the same in situ LSTs. The evaluation results are shown in Figure 5. The bias, RMSE and R2 are −0.52 K, 2.75 K and 0.98, respectively. These validation results of finer LST and original clear-sky AHI LST are consistent with the validation results in Zhou and Cheng [15]. According to Figure 4 and Figure 5, the finer scale LST is slightly improved over the original clear-sky AHI LST.
The statistical results in the daytime and nighttime are listed in Table 5. During the daytime, the biases are 0.34 K and −0.16 K, the RMSEs are 3.23 K and 3.77 K, and the determination coefficients are 0.95 and 0.93 under clear-sky and cloudy sky conditions, respectively. Regarding the nighttime, the biases are −0.89 K and −1.08 K, the RMSEs are 2.14 K and 2.99 K, and the determination coefficients are 0.98 and 0.96 under clear-sky and cloudy sky conditions, respectively. The RMSE of finer-scale LST is lower during nighttime than during daytime because the heterogeneity of the surface during nighttime is weaker than that during daytime.
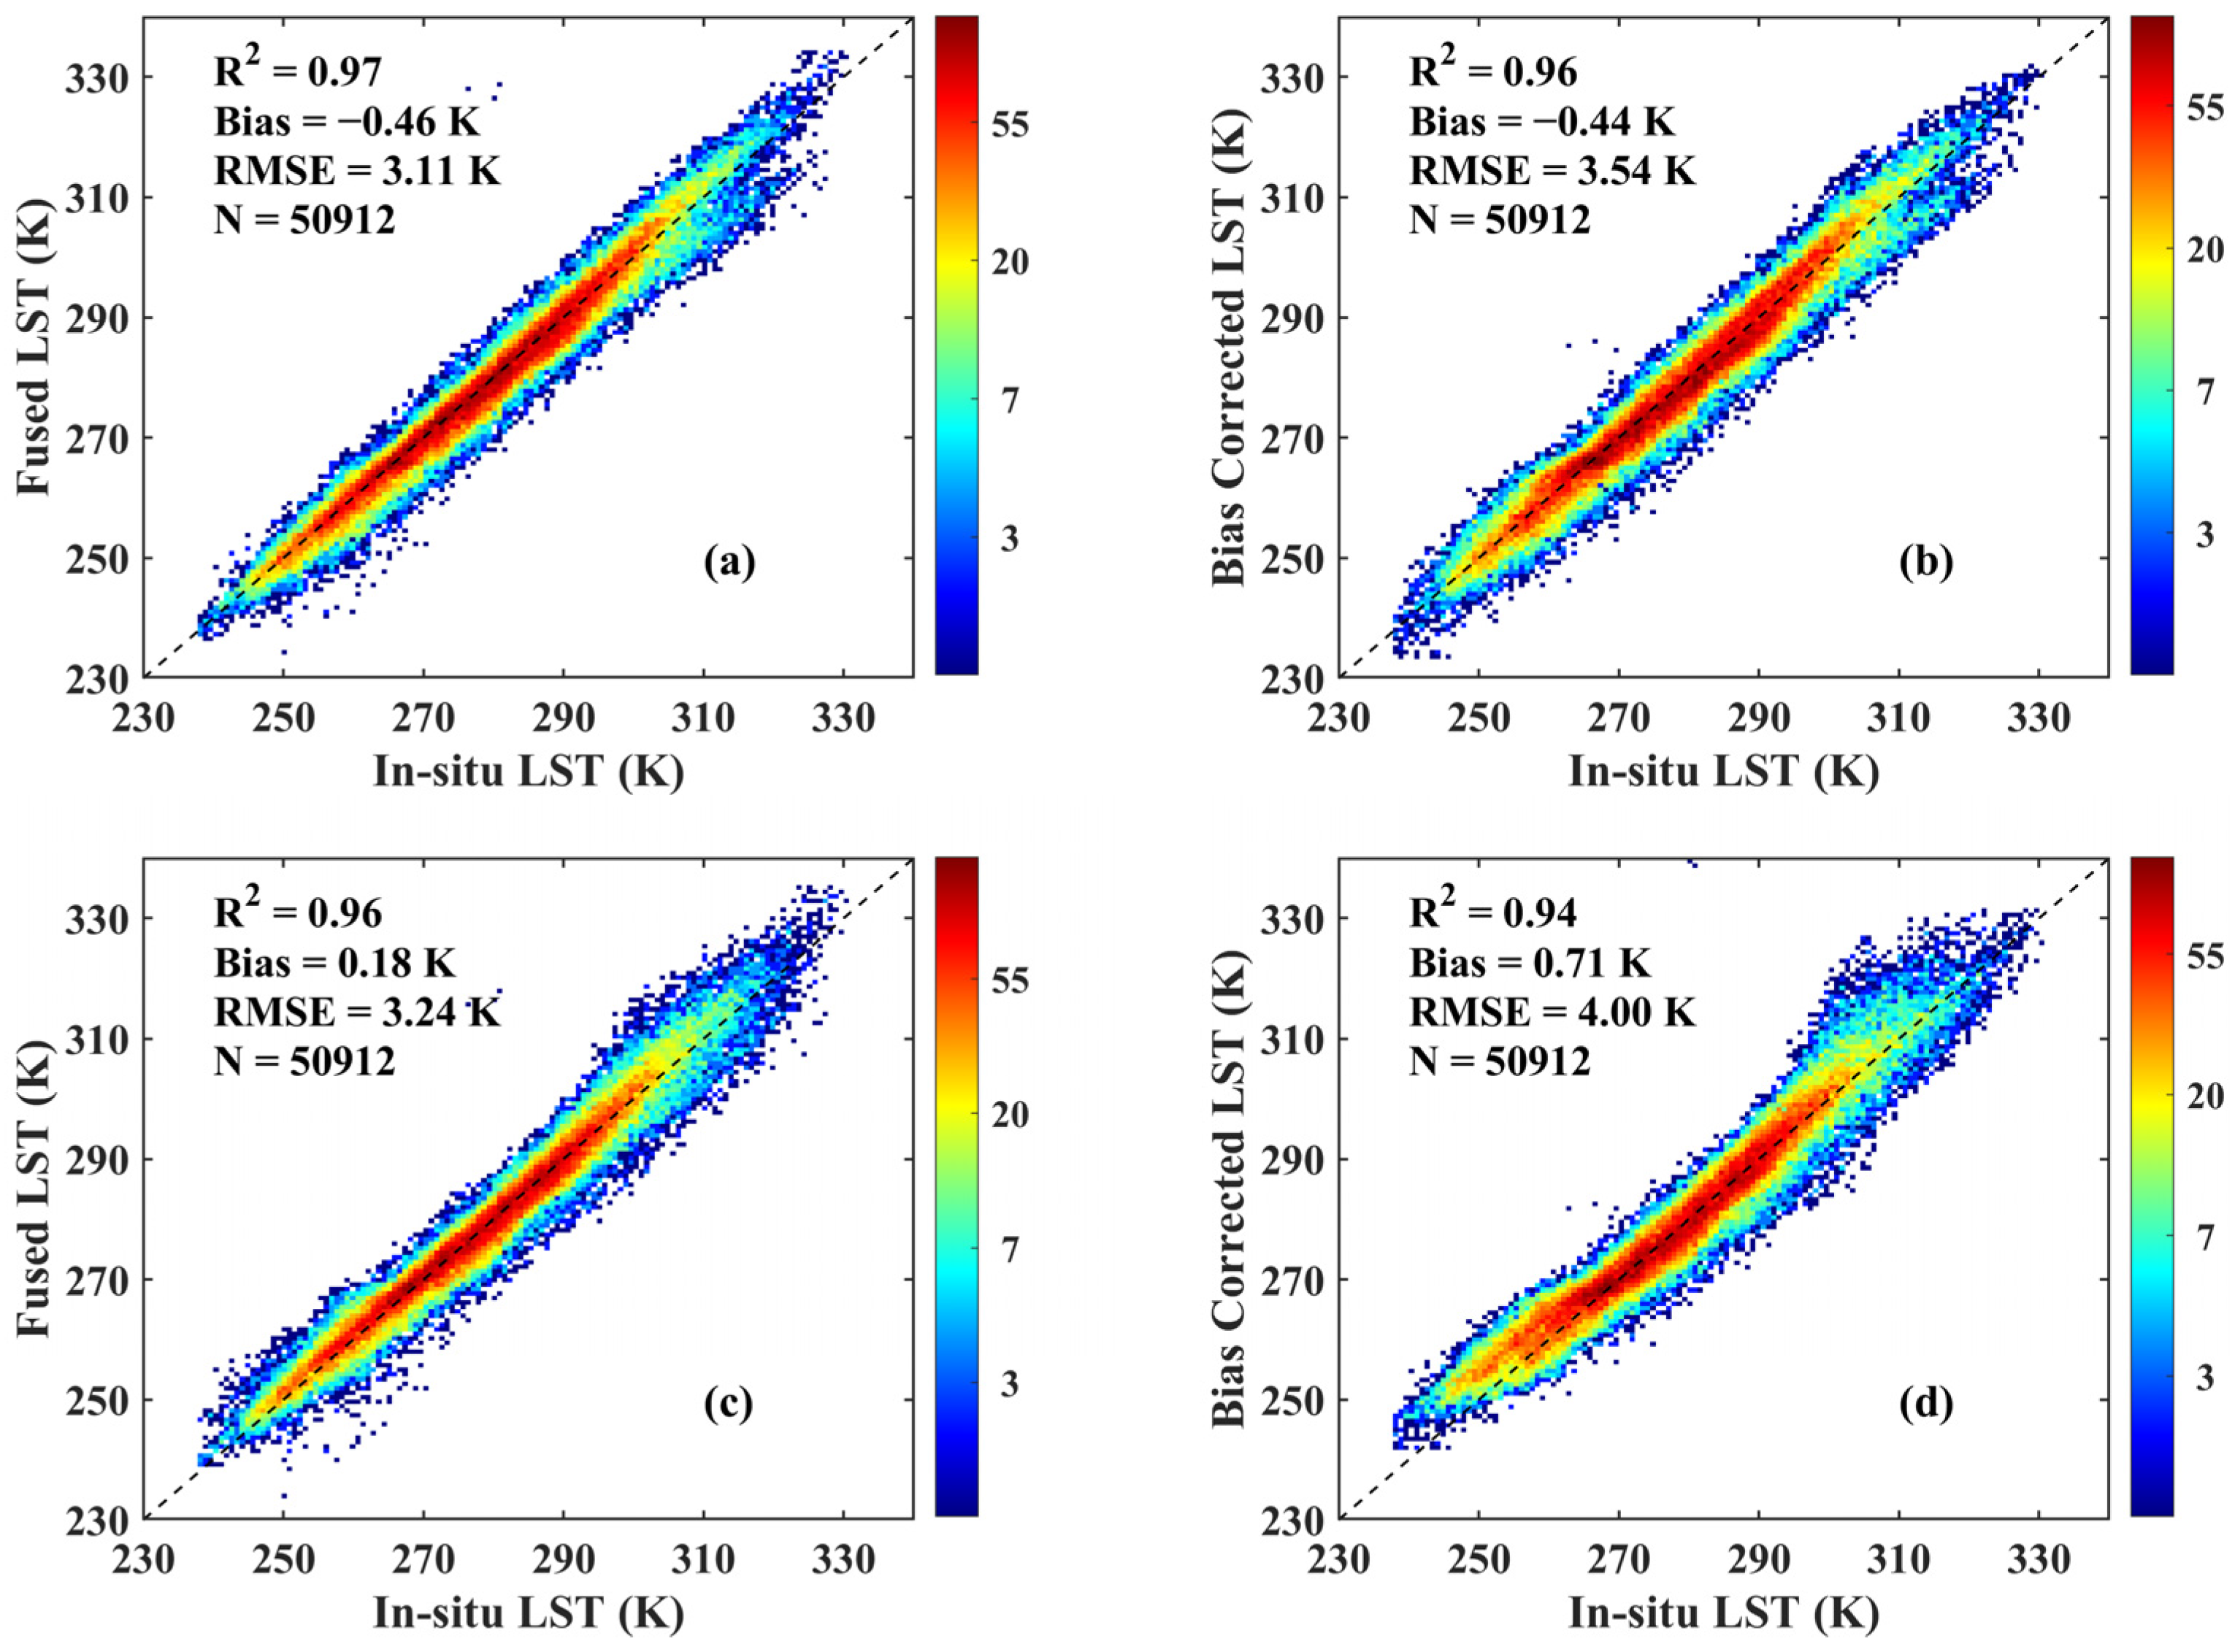
To illustrate the efficacy of the MKF algorithm on improving the accuracy of coarse-scale LST, we also evaluate the accuracy of the CLDAS LST, the bias-corrected CLDAS LST and the fused LST at a coarse scale (0.06°). The validation results are shown in Figure 6. As shown in Figure 6a,b, the bias correction method effectively improved the quality of the CLDAS LST, in terms of both visual effect and statistical indices. The samples were more concentrated on the 1:1 line, and the bias was reduced from 1.76 K to −0.44 K and the RMSE was reduced from 4.01 K to 3.54 K. After the MKF fusion, the RMSE was further reduced from 3.54 K to 3.11 K. The variations in R2 and bias remain almost unchanged.
According to the validation results mentioned above, the MKF algorithm effectively improved the quality of both finer-scale LST and coarse-scale LST. Although the degree of quality improvement is distinct, the improvement is smaller for finer-scale LSTs than for coarse-scale LSTs. The reasonable explanation relied on the fact that the coarse-scale LST was combined with the contributions of higher-quality AHI LST and tended to be close to the finer-scale LST under clear-sky conditions. However, there is no additional more accurate information involved for the finer-scale LST.
3.2. Spatial-Temporal Variations
3.2.1. Spatial Consistency between the Finer-Scale LST and Coarse-Scale LST
Figure 7 shows the image pairs of the AHI LST and CLDAS LST before and after MKF fusion. Due to the cloud contamination, there are many missing pixels in the AHI LST, whereas the bias-corrected CLDAS LST is spatially complete. However, the two LST images are remarkable inconsistent, especially in the Tibetan Plateau (the red rectangle in Figure 7a,b), which is a climate change-sensitive area. After MKF fusion, the missing values in the AHI LST image are all filled with reasonable values, and the consistency in spatial pattern between the finer and coarse LST images is greatly improved, as clearly shown in the red rectangle of Figure 7c,d.
3.2.2. Temporal Variability in the Fused LST
Figure 8 shows the fused finer-scale LST images at 00:00 UTC on the 15th day of each month over East Asia in 2016. The LST images are not only spatially complete but also accurately reflect the spatial distribution characteristics of LST over East Asia during different seasons. The LST shows an increasing trend from January to July, whereas the LST drops gradually from August to December, with the highest LST appearing in the summer (June, July and August) of the Northern Hemisphere.
To illustrate the efficacy of the proposed data fusion method, Figure 9 shows the time series of the AHI LST, the bias-corrected CLDAS LST, the fused LSTs at finer and coarse scales, and in situ LST. In general, the LSTs evolve according to a standard diurnal variation curve, i.e., the cosine function curve during daytime and the exponential function curve during nighttime [76].
As shown in Figure 9a–f, both the finer-scale LST (red circles) and the AHI LST (blue circles) were consistent with the in situ LST (black squares). The finer-scale LST was more complete than the AHI LST and changed very little, compared to the retrieved clear-sky AHI LST. However, when the AHI LST was missing, the values of fused finer-scale LST under cloudy sky conditions mainly came from the bias-corrected CLDAS LST (blue triangles in Figure 9), for example, finer-scale LST from 01:00 to 06:00 at the AR site (Figure 9a). The bias-corrected CLDAS LST showed worse consistency with the in situ LST than the AHI LST, and the consistency was greatly improved by MKF fusion through the adjustment toward the high-quality clear-sky AHI LST. The result indicated the same conclusion as Section 3.1 that the MKF algorithm was capable of generating consistent gapless LSTs across different scales and improving the quality of both finer-scale LST and coarse-scale LST.
4. Discussion
4.1. The Choice of the Bias Correction Method
In the correction of the CLDAS LST, we assumed that the relationship between the CLDAS LST and AHI LST under clear-sky conditions can be applied to cloudy sky conditions. To test the reasonability of this assumption, we compared the CLDAS LST before and after bias correction. The comparison results are shown in Figure 10. Under clear-sky conditions, the bias and RMSE of CLDAS LST were 2.00 K and 4.25 K, the values were decreased to −0.28 K and 3.59 K after bias correction, respectively. Regarding cloudy sky conditions, the bias and RMSE of CLDAS LST were 1.53 K and 3.77 K, and the values were reduced to −0.58 K and 3.49 K after bias correction, respectively. The R2 did not change. These results indicated that the bias correction is reliable for addressing the systematic deviation between the AHI LST and CLDAS LST.
Additionally, the samples were more concentrated on the 1:1 line, and a few outliers were removed after bias correction. Clearly, the bias correction can greatly reduce the bias between the AHI LST and CLDAS LST and improve the quality of the CLDAS LST under both clear-sky and cloudy sky conditions, but the improvement under cloudy sky conditions is weaker than that under clear-sky conditions.
MODIS LST data are also high-quality data that can be used to correct the CLDAS LST data. Here, we test the performance of MODIS LST (MOD11A1 and MYD11A1) in bias correction. The CLDAS LST was temporally interpolated to the MODIS overpass time before the bias correction. The MODIS LST was aggregated to the spatial resolution of the CLDAS LST. A linear bias correction equation was established as:
where the is the aggregated MODIS LST, is the CLDAS LST and and are the fitting coefficients. Here, only the MODIS LST pixels obeying the following rules were selected:
- (1)
- (2)
- It is marked as ‘Good quality’ in the corresponding quality control (QC) band.
The cumulative distribution function (CDF) matching method is also capable of removing the systematic bias between two datasets [79]. CDF matching establishes the piecewise–linear relationship between the CDFs of the target data and reference data and adjusts the CDF of the target data using the established relationship. Here, the AHI LST and the CLDAS LST were treated as the reference dataset and the target dataset, respectively. In addition, similar to the AHI LST-based method, the CDF method involves time series data at a single point.
Figure 11 shows the validation results of the finer-scale LST outputted by the MKF algorithm using the CLDAS LST corrected by different methods as input, i.e., the AHI LST-based bias correction method, MODIS LST-based bias correction method and CDF method. Under clear-sky conditions, the performance of the three methods is very similar, the samples are evenly distributed around the 1:1 line, the biases and RMSEs are very close and the determination coefficients are all 0.98. Regarding cloudy sky conditions, the samples for the AHI LST-based bias correction method are more reasonable than those of the remaining methods. The AHI LST-based bias correction method has the highest determination coefficient (0.96), lowest RMSE (3.38 K) and a modest bias (−0.65 K). Compared to the MODIS LST-based bias correction method and CDF method, whose RMSEs are 3.75 K and 3.58 K, the improvement of the AHI LST-based correction method is 0.37 K and 0.20 K, respectively.
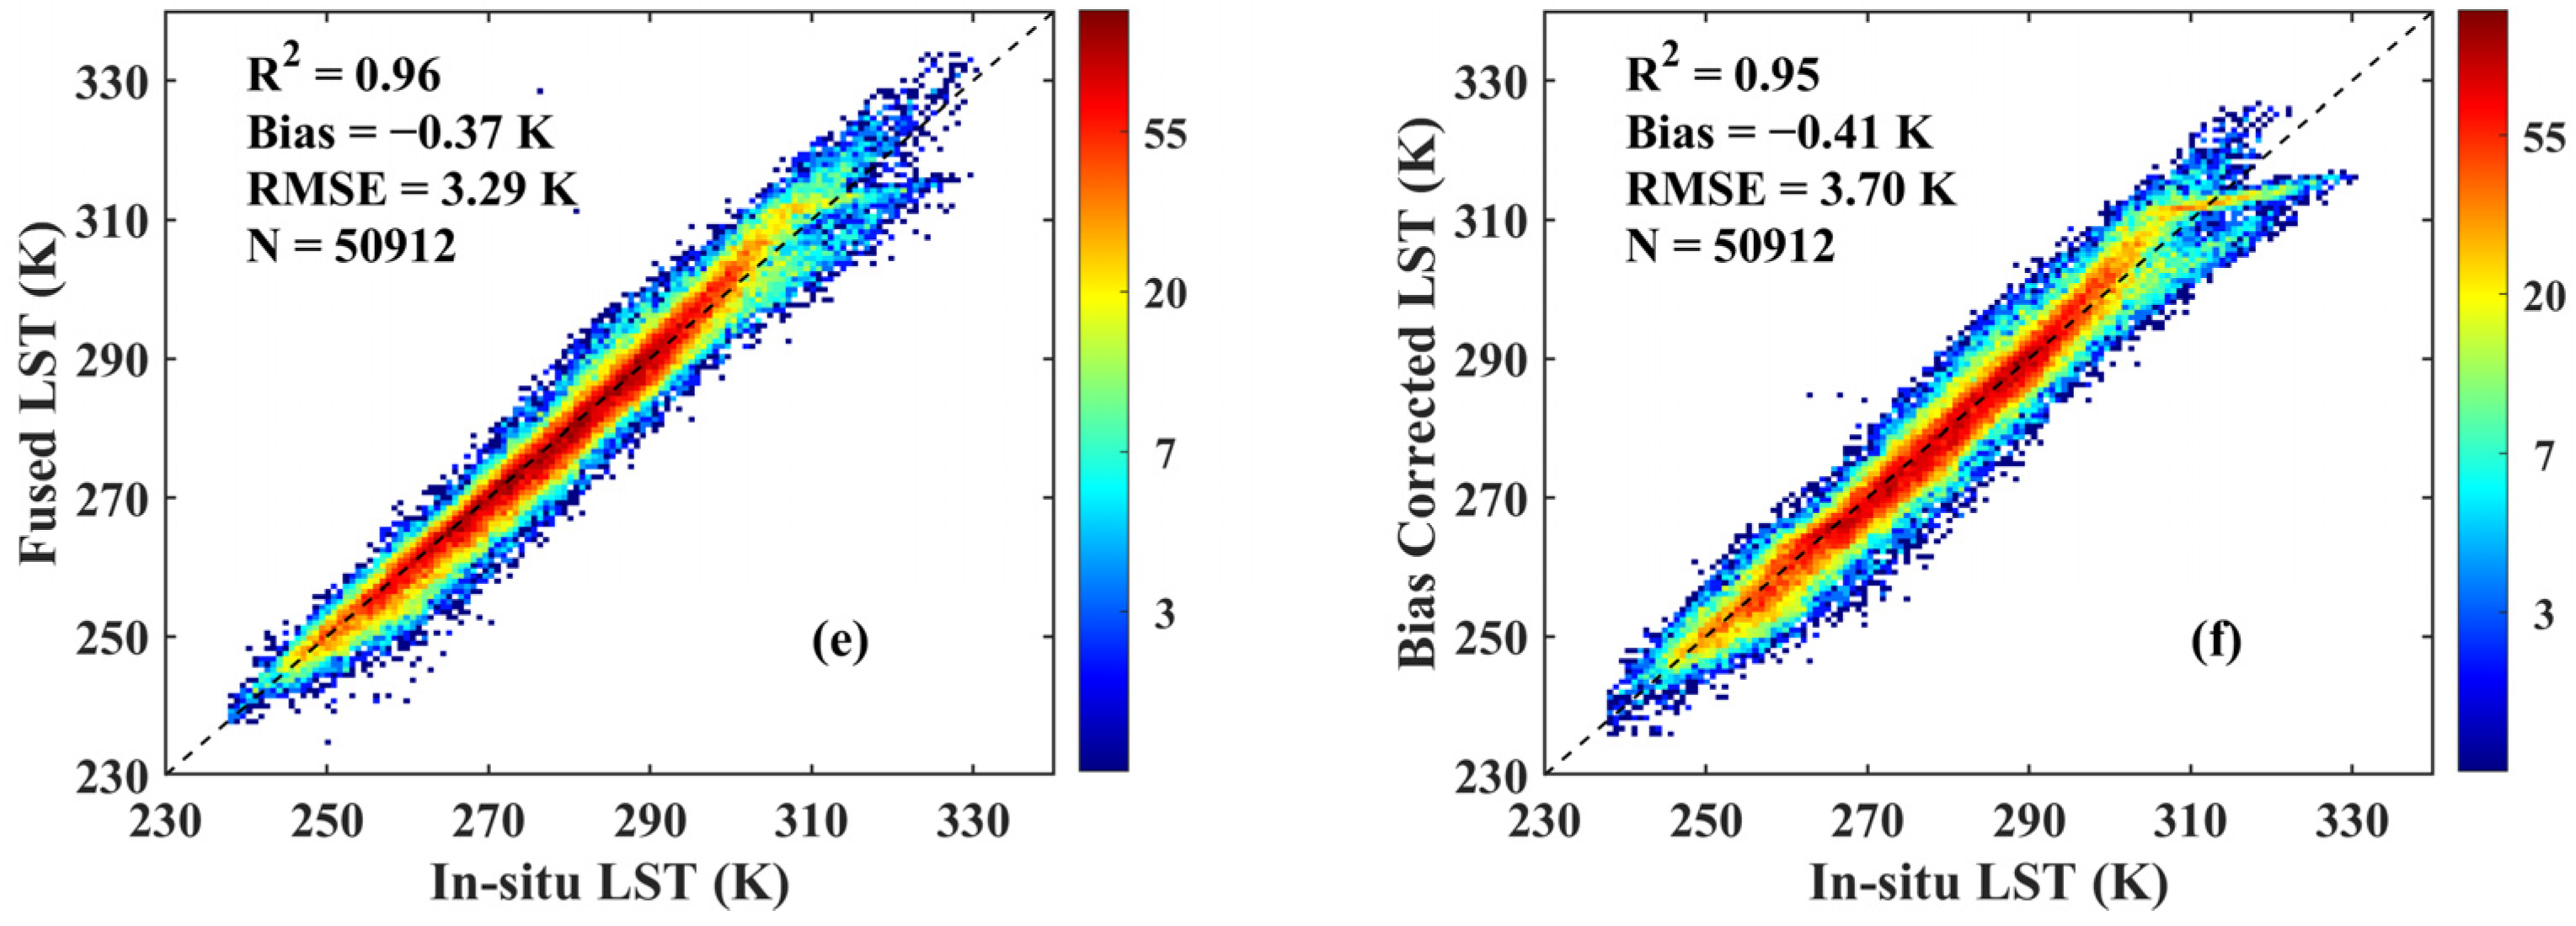
We tested the effects of different bias correction methods on the estimation of coarse resolution LST. The test results are shown in Figure 12. For the bias-corrected CLDAS LST, the AHI LST-based bias correction method has the most reasonable scatter distribution with the lowest RMSE of 3.54 K, a modest bias of −0.44 K and the highest R2 of 0.96, showing better performance than the MODIS LST-based bias correction method and the CDF method, with the RMSE of 4.00 K and 3.70 K, respectively. Considering the fused coarse-scale LST, the AHI LST-based bias correction method also has the lowest RMSE of 3.11 K, compared to the MODIS LST-based bias correction method and the CDF method, the RMSEs of which are 3.24 K and 3.29 K, respectively. In conclusion, the performance of the AHI LST-based bias correction method is slightly better than that of the CDF method, while the MODIS LST-based bias correction method presented the worst results. The explanations relied on the fact that the MODIS LST product can only provide observations no more than four times per day in low and mid latitudes. Limited observations of MODIS lead to the CLDAS LST, needing temporal interpolation to match the overpass time of TERRA/MODIS and AQUA/MODIS, as a result, precision will be more or less lost.
Additionally, apart from the better in situ validation, the AHI LST-based bias correction method is evidently more intuitive and convenient than the CDF method. Compared to the MODIS LST-based method, only the CLDAS LST and the AHI LST were utilized in the AHI LST-based bias correction method, which greatly avoids introducing extraordinary errors from other LST products.
4.2. The Pros and Cons of the Proposed Data Fusion Method
The exploration of generating hourly seamless LST from geostationary satellites is rarely available. Lu, Venus, Skidmore, Wang and Luo [26] proposed a temporal NP approach to reconstruct LST under clouds for geostationary satellites. However, the performance of the approach is not acceptable. The RMSE of the retrieved cloudy-sky LST was larger than 5 K at the two field sites. Moreover, the employed meteorological data were from field experiments, and it is ambiguous whether the algorithm can be expanded to generate seamless LST products at regional or global scales. Martins et al. [80] presented an all-weather LST product from the Spinning Enhanced Visible and Infrared Imager (SEVIRI) on MSG. The reported RMSE of cloudy-sky LST is 3.8 K, although it cannot cover East Asia. The cloudy-sky LST was derived via SEB theory, employing the Land Surface Analysis Satellite Application Facility (LSA-SAF) MSG evapotranspiration (ET) product, whereas Himawari-8 has not developed the corresponding ET product. Therefore, this method cannot be fully duplicated to AHI/Himawari-8. Therefore, we proposed an effective data fusion method to obtain high-quality hourly seamless LST from AHI/Himawari-8 data and the product was freely released to the public (http://data.tpdc.ac.cn, accessed on 15 October 2022).
The incorporation of the bias correction method in the data fusion method significantly improved the quality of the CLDAS LST, which guaranteed the quality of the input of the MKF algorithm, which not only filled the missing data at a finer scale but also reduced the inconsistency between different scales. Regarding the validation accuracy of the fused LSTs at the finer and coarse scales, the accuracy of the coarse-scale LST was greatly improved, whereas the accuracy of the finer-scale LST was slightly improved. This is consistent with the conclusion of previous studies that employed the MKF algorithm [61,62,63,81]. Compared to the existing studies that estimate all-weather LST from polar orbit satellites [35,44,81], the accuracy of the all-weather (seamless) LST is comparable, but the temporal resolution of the derived all-weather LST is hourly. In short, the proposed data fusion method provides a practical and universal way to generate hourly seamless LST.
Similarly, there are some shortcomings in this study. The bias correction method is a data-driven statistical method that relies on the quality of the reference dataset. Similar to the study of Xu and Cheng [81] and Zhang et al. [82], even the assumption that the established empirical relationship under clear-sky conditions can be applied to cloudy skies, according to the limited test, may be unreasonable elsewhere. The MKF algorithm is essentially an optimal estimation algorithm that does not theoretically involve the radiative transfer process. The zero-mean assumption in the MKF algorithm may be inappropriate for land surface variables. The abundant temporal information contained in the geostationary satellite-derived LST is not explored in the current MKF algorithm, which deserves to be mined by incorporating the annual temperature cycle (ATC) [83,84] and the diurnal temperature cycle (DTC) models [19,85].
According to previous studies, a phase-lag exists between two LST datasets [86,87,88]. This phenomenon was not considered in the MKF fusion of AHI LST and bias-corrected CLDAS LST. It is worth exploring in the following research. In addition, satellite-retrieved TIR LST represents the temperature of several micrometers in depth, while CLDAS LST is skin temperature. The representative depths of two LSTs need to be considered but are not considered in this paper.
5. Conclusions
Hourly seamless LST datasets are extremely crucial in many disciplines, such as the discrimination of soil freeze/thaw status, diurnal variation in earth–atmosphere system parameters modeling and land surface hydrological process simulation. This study proposed a data fusion method to generate hourly seamless LST from Himawari-8 AHI data. In the method, high-quality hourly clear-sky AHI LST was first retrieved by an improved temperature and emissivity separation algorithm, and then a bias correction method was employed to remove the systematic bias between the matched CLDAS LST and AHI LST. Finally, the high-quality AHI LST and the bias-corrected spatially complete CLDAS LST were fused by the MKF algorithm, which is not only capable of filling the missing values at a finer scale and improving the data quality at both finer and coarse resolutions but also reduces the inconsistency across different scales.
According to in situ validation, the bias and RMSE of the fused LST at a finer scale (0.02°) are −0.65 K and 3.38 K under cloudy sky conditions, whereas the values are −0.43 K and 2.59 K under clear-sky conditions, respectively. The accuracy of clear-sky finer-scale LST is slightly better than the retrieved AHI LST. Under all-sky conditions, the bias and RMSE are −0.55 K and 3.03 K, accordingly. The bias and RMSE of coarse-scale (0.06°) LST are −0.46 K and 3.11 K, which is superior to the CLDAS LST, whose bias and RMSE are 1.76 K and 4.01 K, respectively. After the MKF fusion, the missing values in the AHI LST are all filled by reasonable values, and the consistency between the fused LSTs at finer and coarse scales is greatly improved. The seamless finer-scale LST data can not only reflect the spatial distribution characteristics of LST during different seasons but also exactly present the diurnal variation of the LST.
Conclusively, the proposed method in this paper makes full use of the strengths of the geostationary satellite-derived LST and the LSM-simulated LST and provides a practical method to generate an hourly seamless LST dataset. The generated hourly seamless LST dataset from 2016 through 2021 has been released to the public at the National Tibetan Plateau Data Center [89] (http://data.tpdc.ac.cn, accessed on 15 October 2022) and is expected to benefit many geoscientific studies. This method can be easily adapted to other geostationary satellites to generate hourly seamless full disk and regional (60°S~60°N) LST data, provided that regional and global LSM LST data are available.
Author Contributions
Conceptualization and methodology, J.C.; software, S.D.; validation, S.D.; formal analysis, S.D.; resources, C.S., S.S. and W.L.; data curation, S.D. and W.L.; writing—original draft preparation, S.D.; writing—review and editing, J.C., J.S. and C.S.; visualization, S.D.; supervision, J.C.; project administration, J.C.; funding acquisition, J.C. All authors have read and agreed to the published version of the manuscript.
Funding
This work was supported in part by the Second Tibetan Plateau Scientific Expedition and Research Program (STEP) under Grant 2019QZKK0206 and in part by the National Natural Science Foundation of China under Grants 42071308, 42192581, 42192580 and 42090012.
Data Availability Statement
The generated 0.02° hourly seamless LST dataset from 2016 to 2021 has been released to the public at the National Tibetan Plateau Data Center (http://data.tpdc.ac.cn, accessed on 15 October 2022).
Conflicts of Interest
The authors declare no conflict of interest.
References
- Wan, Z.; Dozier, J. A generalized split-window algorithm for retrieving land-surface temperature from space. IEEE Trans. Geosci. Remote Sens. 1996, 34, 892–905. [Google Scholar]
- Li, Z.-L.; Tang, B.-H.; Wu, H.; Ren, H.; Yan, G.; Wan, Z.; Trigo, I.F.; Sobrino, J.A. Satellite-derived land surface temperature: Current status and perspectives. Remote Sens. Environ. 2013, 131, 14–37. [Google Scholar] [CrossRef] [Green Version]
- Cheng, J.; Liang, S.; Wang, J.; Li, X. A Stepwise Refining Algorithm of Temperature and Emissivity Separation for Hyperspectral Thermal Infrared Data. IEEE Trans. Geosci. Remote Sens. 2010, 48, 1588–1597. [Google Scholar] [CrossRef]
- Ma, Y.; Ma, W.; Zhong, L.; Hu, Z.; Li, M.; Zhu, Z.; Han, C.; Wang, B.; Liu, X. Monitoring and Modeling the Tibetan Plateau’s climate system and its impact on East Asia. Sci. Rep. 2017, 7, 44574. [Google Scholar] [CrossRef] [PubMed] [Green Version]
- Jin, M.; Dickinson, R.E. New observational evidence for global warming from satellite. Geophys. Res. Lett. 2002, 29, 39-1–39-4. [Google Scholar] [CrossRef] [Green Version]
- Cheng, J.; Kustas, W. Using Very High Resolution Thermal Infrared Imagery for More Accurate Determination of the Impact of Land Cover Differences on Evapotranspiration in an Irrigated Agricultural Area. Remote Sens. 2019, 11, 613. [Google Scholar] [CrossRef] [Green Version]
- Goldberg, A.; Panov, N.; Gutman, G.G.; Imhoff, M.L.; Anderson, M.; Pinker, R.T.; Agam, N.; Karnieli, A. Use of NDVI and Land Surface Temperature for Drought Assessment: Merits and Limitations. J. Clim. 2010, 23, 618–633. [Google Scholar]
- Qi, J.; Wang, L.; Zhou, J.; Song, L.; Li, X.; Zeng, T. Coupled Snow and Frozen Ground Physics Improves Cold Region Hydrological Simulations: An Evaluation at the upper Yangtze River Basin (Tibetan Plateau). J. Geophys. Res.-Atmos. 2019, 124, 12985–13004. [Google Scholar] [CrossRef]
- Zhang, Y.; Cheng, J. Spatio-Temporal Analysis of Urban Heat Island Using Multisource Remote Sensing Data: A Case Study in Hangzhou, China. IEEE J. Sel. Top. Appl. Earth Observ. Remote Sens. 2019, 12, 3317–3326. [Google Scholar] [CrossRef]
- Weng, Q. Thermal infrared remote sensing for urban climate and environmental studies: Methods, applications, and trends. ISPRS J. Photogramm. Remote Sens. 2009, 64, 335–344. [Google Scholar] [CrossRef]
- Ouyang, X.; Chen, D.; Lei, Y. A Generalized Evaluation Scheme for Comparing Temperature Products from Satellite Observations, Numerical Weather Model, and Ground Measurements Over the Tibetan Plateau. IEEE Trans. Geosci. Remote Sens. 2018, 56, 3876–3894. [Google Scholar] [CrossRef]
- Ma, J.; Zhou, J.; Liu, S.; Göttsche, F.-M.; Zhang, X.; Wang, S.; Li, M. Continuous evaluation of the spatial representativeness of land surface temperature validation sites. Remote Sens. Environ. 2021, 265, 112669. [Google Scholar] [CrossRef]
- Wan, Z. New refinements and validation of the collection-6 MODIS land-surface temperature/emissivity product. Remote Sens. Environ. 2014, 140, 36–45. [Google Scholar] [CrossRef]
- Cheng, J.; Meng, X.; Dong, S.; Liang, S. Generating the 30-m land surface temperature product over continental China and USA from landsat 5/7/8 data. Sci. Remote Sens. 2021, 4, 100032. [Google Scholar] [CrossRef]
- Zhou, S.; Cheng, J. An Improved Temperature and Emissivity Separation Algorithm for the Advanced Himawari Imager. IEEE Trans. Geosci. Remote Sens. 2020, 58, 7105–7124. [Google Scholar] [CrossRef]
- Liu, W.; Shi, J.; Liang, S.; Zhou, S.; Cheng, J. Simultaneous Retrieval of Land Surface Temperature and Emissivity from the Fengyun-4A Advanced Geosynchronous Radiation Imager. Int. J. Digit. Earth 2022, 15, 198–225. [Google Scholar] [CrossRef]
- Niclòs, R.; Galve, J.M.; Valiente, J.A.; Estrela, M.J.; Coll, C. Accuracy assessment of land surface temperature retrievals from MSG2-SEVIRI data. Remote Sens. Environ. 2011, 115, 2126–2140. [Google Scholar] [CrossRef]
- Zhao, T.; Shi, J.; Hu, T.; Zhao, L.; Zou, D.; Wang, T.; Ji, D.; Li, R.; Wang, P. Estimation of high-resolution near-surface freeze/thaw state by the integration of microwave and thermal infrared remote sensing data on the Tibetan Plateau. Earth Space Sci. 2017, 4, 472–484. [Google Scholar] [CrossRef]
- Duan, S.-B.; Li, Z.-L.; Wang, N.; Wu, H.; Tang, B.-H. Evaluation of six land-surface diurnal temperature cycle models using clear-sky in situ and satellite data. Remote Sens. Environ. 2012, 124, 15–25. [Google Scholar] [CrossRef]
- Hagan, D.F.T.; Wang, G.J.; Parinussa, R.M.; Shi, X. Inter-comparing and improving land surface temperature estimates from passive microwaves over the Jiangsu province of the People’s Republic of China. Int. J. Remote Sens. 2019, 40, 5563–5584. [Google Scholar] [CrossRef]
- Sun, L.; Chen, Z.; Gao, F.; Anderson, M.; Song, L.; Wang, L.; Hu, B.; Yang, Y. Reconstructing daily clear-sky land surface temperature for cloudy regions from MODIS data. Comput. Geosci. 2017, 105, 10–20. [Google Scholar] [CrossRef]
- Xu, Y.; Shen, Y. Reconstruction of the land surface temperature time series using harmonic analysis. Comput. Geosci. 2013, 61, 126–132. [Google Scholar] [CrossRef]
- Neteler, M. Estimating Daily Land Surface Temperatures in Mountainous Environments by Reconstructed MODIS LST Data. Remote Sens. 2010, 2, 333–351. [Google Scholar] [CrossRef] [Green Version]
- Westermann, S.; Langer, M.; Boike, J. Spatial and temporal variations of summer surface temperatures of high-arctic tundra on Svalbard—Implications for MODIS LST based permafrost monitoring. Remote Sens. Environ. 2011, 115, 908–922. [Google Scholar] [CrossRef]
- Jin, M.; Dickinson, R.E. A generalized algorithm for retrieving cloudy sky skin temperature from satellite thermal infrared radiances. J. Geophys. Res.-Atmos. 2000, 105, 27037–27047. [Google Scholar] [CrossRef]
- Lu, L.; Venus, V.; Skidmore, A.; Wang, T.; Luo, G. Estimating land-surface temperature under clouds using MSG/SEVIRI observations. Int. J. Appl. Earth Obs. Geoinf. 2011, 13, 265–276. [Google Scholar] [CrossRef]
- Zhang, Q.; Yuan, Q.; Zeng, C.; Li, X.; Wei, Y. Missing Data Reconstruction in Remote Sensing Image with a Unified Spatial–Temporal–Spectral Deep Convolutional Neural Network. IEEE Trans. Geosci. Remote Sens. 2018, 56, 4274–4288. [Google Scholar] [CrossRef] [Green Version]
- Malek, S.; Melgani, F.; Bazi, Y.; Alajlan, N. Reconstructing Cloud-Contaminated Multispectral Images with Contextualized Autoencoder Neural Networks. IEEE Trans. Geosci. Remote Sens. 2018, 56, 2270–2282. [Google Scholar] [CrossRef]
- Wu, P.; Yin, Z.; Zeng, C.; Duan, S.; Göttsche; Ma, X.; Li, X.; Yang, H.; Shen, H. Spatially Continuous and High-Resolution Land Surface Temperature Product Generation: A review of reconstruction and spatiotemporal fusion techniques. IEEE Trans. Geosci. Remote Sens. Mag. 2021, 9, 112–137. [Google Scholar] [CrossRef]
- Shwetha, H.R.; Kumar, D.N. Prediction of high spatio-temporal resolution land surface temperature under cloudy conditions using microwave vegetation index and ANN. ISPRS J. Photogramm. Remote Sens. 2016, 117, 40–55. [Google Scholar] [CrossRef]
- Reichstein, M.; Camps-Valls, G.; Stevens, B.; Jung, M.; Denzler, J.; Carvalhais, N.; Prabhat. Deep learning and process understanding for data-driven Earth system science. Nature 2019, 566, 195–204. [Google Scholar] [CrossRef]
- Weng, Q.; Fu, P.; Gao, F. Generating daily land surface temperature at Landsat resolution by fusing Landsat and MODIS data. Remote Sens. Environ. 2014, 145, 55–67. [Google Scholar] [CrossRef]
- Gao, F.; Kustas, W.P.; Anderson, M.C. A Data Mining Approach for Sharpening Thermal Satellite Imagery over Land. Remote Sens. 2012, 4, 3287–3319. [Google Scholar] [CrossRef] [Green Version]
- Zhu, X.; Chen, J.; Gao, F.; Chen, X.; Masek, J.G. An enhanced spatial and temporal adaptive reflectance fusion model for complex heterogeneous regions. Remote Sens. Environ. 2010, 114, 2610–2623. [Google Scholar] [CrossRef]
- Long, D.; Yan, L.; Bai, L.; Zhang, C.; Li, X.; Lei, H.; Yang, H.; Tian, F.; Zeng, C.; Meng, X.; et al. Generation of MODIS-like land surface temperatures under all-weather conditions based on a data fusion approach. Remote Sens. Environ. 2020, 246, 111863. [Google Scholar] [CrossRef]
- Russo, S.; Dosio, A.; Graversen, R.G.; Sillmann, J.; Carrao, H.; Dunbar, M.B.; Singleton, A.; Montagna, P.; Barbola, P.; Vogt, J.V. Magnitude of extreme heat waves in present climate and their projection in a warming world. J. Geophys. Res.-Atmos. 2014, 119, 12501–12512. [Google Scholar] [CrossRef] [Green Version]
- Shi, C.; Xie, Z.; Qian, H.; Liang, M.; Yang, X. China land soil moisture EnKF data assimilation based on satellite remote sensing data. Sci. China-Earth Sci. 2011, 54, 1430–1440. [Google Scholar] [CrossRef]
- Rodell, M.; Houser, P.R.; Jambor, U.; Gottschalck, J.; Mitchell, K.; Meng, C.J.; Arsenault, K.; Cosgrove, B.; Radakovich, J.; Bosilovich, M.; et al. The Global Land Data Assimilation System. Bull. Amer. Meteorol. Soc. 2004, 85, 381–394. [Google Scholar] [CrossRef] [Green Version]
- Xia, Y.; Mitchell, K.; Ek, M.; Cosgrove, B.; Sheffield, J.; Luo, L.; Alonge, C.; Wei, H.; Meng, J.; Livneh, B.; et al. Continental-scale water and energy flux analysis and validation for North American Land Data Assimilation System project phase 2 (NLDAS-2): 2. Validation of model-simulated streamflow. J. Geophys. Res. 2012, 117. [Google Scholar] [CrossRef]
- Xia, Y.; Mitchell, K.; Ek, M.; Sheffield, J.; Cosgrove, B.; Wood, E.; Luo, L.; Alonge, C.; Wei, H.; Meng, J.; et al. Continental-scale water and energy flux analysis and validation for the North American Land Data Assimilation System project phase 2 (NLDAS-2): 1. Intercomparison and application of model products. J. Geophys. Res. 2012, 117. [Google Scholar] [CrossRef]
- Chen, Y.-y.; Shi, J.-c.; Du, J.-y.; Jiang, L.-m. Numerical experiments of surface energy balance over China area based on GLDAS. Adv. Water Sci. 2009, 20, 25–31. [Google Scholar]
- Mitchell, K.E. The multi-institution North American Land Data Assimilation System (NLDAS): Utilizing multiple GCIP products and partners in a continental distributed hydrological modeling system. J. Geophys. Res.-Atmos. 2004, 109, D07S90. [Google Scholar] [CrossRef] [Green Version]
- Sun, S.; Shi, C.; Liang, X.; Han, S.; Jiang, Z.; Zhang, T. Assessment of Ground Temperature Simulation in China by Different Land Surface Models Based on Station Observations. J. Appl. Meteor. 2017, 28, 737–749. [Google Scholar]
- Zhang, X.; Zhou, J.; Liang, S.; Wang, D. A practical reanalysis data and thermal infrared remote sensing data merging (RTM) method for reconstruction of a 1-km all-weather land surface temperature. Remote Sens. Environ. 2021, 260, 112437. [Google Scholar] [CrossRef]
- Zhang, Q.; Cheng, J.; Wang, N. Fusion of All-Weather Land Surface Temperature From AMSR-E and MODIS Data Using Random Forest Regression. IEEE Geosci. Remote Sens. Lett. 2022, 19, 1–5. [Google Scholar] [CrossRef]
- Shi, L.; Liang, S.; Cheng, J.; Zhang, Q. Integrating ASTER and GLASS broadband emissivity products using a multi-resolution Kalman filter. Int. J. Digit. Earth 2016, 9, 1098–1116. [Google Scholar] [CrossRef]
- Gelaro, R.; McCarty, W.; Suarez, M.J.; Todling, R.; Molod, A.; Takacs, L.; Randles, C.; Darmenov, A.; Bosilovich, M.G.; Reichle, R.; et al. The Modern-Era Retrospective Analysis for Research and Applications, Version 2 (MERRA-2). J. Clim. 2017, 30, 5419–5454. [Google Scholar] [CrossRef]
- Huete, A.; Didan, K.; Miura, T.; Rodriguez, E.P.; Gao, X.; Ferreira, L.G. Overview of the radiometric and biophysical performance of the MODIS vegetation indices. Remote Sens. Environ. 2002, 83, 195–213. [Google Scholar] [CrossRef]
- Salomonson, V.V.; Appel, I. Estimating fractional snow cover from MODIS using the normalized difference snow index. Remote Sens. Environ. 2004, 89, 351–360. [Google Scholar] [CrossRef]
- Friedl, M.A.; McIver, D.K.; Hodges, J.C.F.; Zhang, X.Y.; Muchoney, D.; Strahler, A.H.; Woodcock, C.E.; Gopal, S.; Schneider, A.; Cooper, A.; et al. Global land cover mapping from MODIS: Algorithms and early results. Remote Sens. Environ. 2002, 83, 287–302. [Google Scholar] [CrossRef]
- Borbas, E.; Hulley, G.; Feltz, M.; Knuteson, R.; Hook, S. The Combined ASTER MODIS Emissivity over Land (CAMEL) Part 1: Methodology and High Spectral Resolution Application. Remote Sens. 2018, 10, 643. [Google Scholar] [CrossRef] [Green Version]
- Feltz, M.; Borbas, E.; Knuteson, R.; Hulley, G.; Hook, S. The Combined ASTER MODIS Emissivity over Land (CAMEL) Part 2: Uncertainty and Validation. Remote Sens. 2018, 10, 664. [Google Scholar] [CrossRef] [Green Version]
- Bessho, K.; Date, K.; Hayashi, M.; Ikeda, A.; Imai, T.; Inoue, H.; Kumagai, Y.; Miyakawa, T.; Murata, H.; Ohno, T.; et al. An Introduction to Himawari-8/9—Japan’s New-Generation Geostationary Meteorological Satellites. J. Meteorol. Soc. Jpn. 2016, 94, 151–183. [Google Scholar] [CrossRef] [Green Version]
- Li, X.; Cheng, G.; Liu, S.; Xiao, Q.; Ma, M.; Jin, R.; Che, T.; Liu, Q.; Wang, W.; Qi, Y.; et al. Heihe Watershed Allied Telemetry Experimental Research (HiWATER): Scientific Objectives and Experimental Design. Bull. Am. Meteorol. Soc. 2013, 94, 1145–1160. [Google Scholar] [CrossRef]
- Liu, S.; Li, X.; Xu, Z.; Che, T.; Xiao, Q.; Ma, M.; Liu, Q.; Jin, R.; Guo, J.; Wang, L.; et al. The Heihe Integrated Observatory Network: A Basin-Scale Land Surface Processes Observatory in China. Vadose Zone J. 2018, 17, 180072. [Google Scholar] [CrossRef]
- Liang, S.; Cheng, J.; Jia, K.; Jiang, B.; Liu, Q.; Xiao, Z.; Yao, Y.; Yuan, W.; Zhang, X.; Zhao, X.; et al. The Global Land Surface Satellite (GLASS) Product Suite. Bull. Am. Meteorol. Soc. 2021, 102, E323–E337. [Google Scholar] [CrossRef]
- Cheng, J.; Liang, S. Estimating the broadband longwave emissivity of global bare soil from the MODIS shortwave albedo product. J. Geophys. Res.-Atmos. 2014, 119, 614–634. [Google Scholar] [CrossRef]
- Cheng, J.; Liang, S.; Verhoef, W.; Shi, L.; Liu, Q. Estimating the Hemispherical Broadband Longwave Emissivity of Global Vegetated Surfaces Using a Radiative Transfer Model. IEEE Trans. Geosci. Remote Sens. 2016, 54, 905–917. [Google Scholar] [CrossRef]
- Xu, Z.; Liu, S.; Li, X.; Shi, S.; Wang, J.; Zhu, Z.; Xu, T.; Wang, W.; Ma, M. Intercomparison of surface energy flux measurement systems used during the HiWATER-MUSOEXE. J. Geophys. Res.-Atmos. 2013, 118, 13–140. [Google Scholar] [CrossRef]
- Göttsche, F.-M.; Olesen, F.-S.; Trigo, I.; Bork-Unkelbach, A.; Martin, M. Long Term Validation of Land Surface Temperature Retrieved from MSG/SEVIRI with Continuous in-Situ Measurements in Africa. Remote Sens. 2016, 8, 410. [Google Scholar] [CrossRef] [Green Version]
- He, T.; Liang, S.; Wang, D.; Shuai, Y.; Yu, Y. Fusion of Satellite Land Surface Albedo Products Across Scales Using a Multiresolution Tree Method in the North Central United States. IEEE Trans. Geosci. Remote Sens. 2014, 52, 3428–3439. [Google Scholar] [CrossRef]
- Tao, X.; Liang, S.; Wang, D.; He, T.; Huang, C. Improving Satellite Estimates of the Fraction of Absorbed Photosynthetically Active Radiation Through Data Integration: Methodology and Validation. IEEE Trans. Geosci. Remote Sens. 2018, 56, 2107–2118. [Google Scholar] [CrossRef]
- Parada, L.M. Optimal multiscale Kalman filter for assimilation of near-surface soil moisture into land surface models. J. Geophys. Res.-Atmos. 2004, 109, D24109. [Google Scholar] [CrossRef]
- Choi, Y.-Y.; Suh, M.-S. Development of Himawari-8/Advanced Himawari Imager (AHI) Land Surface Temperature Retrieval Algorithm. Remote Sens. 2018, 10, 2013. [Google Scholar] [CrossRef]
- Yamamoto, Y.; Ishikawa, H.; Oku, Y.; Hu, Z. An Algorithm for Land Surface Temperature Retrieval Using Three Thermal Infrared Bands of Himawari-8. J. Meteorol. Soc. Jpn. 2018, 96B, 59–76. [Google Scholar] [CrossRef] [Green Version]
- Li, R.; Li, H.; Sun, L.; Yang, Y.; Hu, T.; Bian, Z.; Cao, B.; Du, Y.; Liu, Q. An Operational Split-Window Algorithm for Retrieving Land Surface Temperature from Geostationary Satellite Data: A Case Study on Himawari-8 AHI Data. Remote Sens. 2020, 12, 2613. [Google Scholar] [CrossRef]
- Tonooka, H. Accurate atmospheric correction of ASTER thermal infrared imagery using the WVS method. IEEE Trans. Geosci. Remote Sens. 2005, 43, 2778–2792. [Google Scholar] [CrossRef]
- Li, X.; Huang, C.; Che, T.; Jin, R.; Wang, S.; Wang, J.; Gao, F.; Zhang, S.; Qiu, C.; Wang, C. Development of a Chinese land data assimilation system: Its progress and prospects. Prog. Nat. Sci. 2007, 17, 881–892. [Google Scholar]
- Trigo, I.F.; Boussetta, S.; Viterbo, P.; Balsamo, G.; Beljaars, A.; Sandu, I. Comparison of model land skin temperature with remotely sensed estimates and assessment of surface-atmosphere coupling. J. Geophys. Res.-Atmos. 2015, 120, 12096–12111. [Google Scholar] [CrossRef] [Green Version]
- Orth, R.; Dutra, E.; Trigo, I.F.; Balsamo, G. Advancing land surface model development with satellite-based Earth observations. Hydrol. Earth Syst. Sci. 2017, 21, 2483–2495. [Google Scholar] [CrossRef] [Green Version]
- Crosson, W.L.; Al-Hamdan, M.Z.; Hemmings, S.N.J.; Wade, G.M. A daily merged MODIS Aqua–Terra land surface temperature data set for the conterminous United States. Remote Sens. Environ. 2012, 119, 315–324. [Google Scholar] [CrossRef]
- Ermida, S.L.; DaCamara, C.C.; Trigo, I.F.; Pires, A.C.; Ghent, D.; Remedios, J. Modelling directional effects on remotely sensed land surface temperature. Remote Sens. Environ. 2017, 190, 56–69. [Google Scholar] [CrossRef] [Green Version]
- Chou, K.C.; Willsky, A.S.; Benveniste, A. Multiscale recursive estimation, data fusion, and regularization. IEEE Trans. Autom. Control 1994, 39, 464–478. [Google Scholar] [CrossRef]
- Kalman, R.E. A New Approach to Linear Filtering and Prediction Problems. J. Basic Eng. 1960, 82, 35–45. [Google Scholar] [CrossRef] [Green Version]
- Göttsche, F.-M.; Olesen, F.-S.; Bork-Unkelbach, A. Validation of land surface temperature derived from MSG/SEVIRI with in situ measurements at Gobabeb, Namibia. Int. J. Remote Sens. 2012, 34, 3069–3083. [Google Scholar] [CrossRef]
- Jiang, G.-M.; Li, Z.-L.; Nerry, F. Land surface emissivity retrieval from combined mid-infrared and thermal infrared data of MSG-SEVIRI. Remote Sens. Environ. 2006, 105, 326–340. [Google Scholar] [CrossRef]
- Ren, H.; Yan, G.; Chen, L.; Li, Z. Angular effect of MODIS emissivity products and its application to the split-window algorithm. ISPRS J. Photogramm. Remote Sens. 2011, 66, 498–507. [Google Scholar] [CrossRef]
- Cao, B.; Liu, Q.; Du, Y.; Roujean, J.-L.; Gastellu-Etchegorry, J.-P.; Trigo, I.F.; Zhan, W.; Yu, Y.; Cheng, J.; Jacob, F.; et al. A review of earth surface thermal radiation directionality observing and modeling: Historical development, current status and perspectives. Remote Sens. Environ. 2019, 232, 111304. [Google Scholar] [CrossRef]
- Liu, Y.Y.; Parinussa, R.M.; Dorigo, W.A.; De Jeu, R.A.M.; Wagner, W.; van Dijk, A.I.J.M.; McCabe, M.F.; Evans, J.P. Developing an improved soil moisture dataset by blending passive and active microwave satellite-based retrievals. Hydrol. Earth Syst. Sci. 2011, 15, 425–436. [Google Scholar] [CrossRef] [Green Version]
- Martins, J.P.A.; Trigo, I.F.; Ghilain, N.; Jimenez, C.; Göttsche, F.-M.; Ermida, S.L.; Olesen, F.-S.; Gellens-Meulenberghs, F.; Arboleda, A. An All-Weather Land Surface Temperature Product Based on MSG/SEVIRI Observations. Remote Sens. 2019, 11, 3044. [Google Scholar] [CrossRef] [Green Version]
- Xu, S.; Cheng, J. A new land surface temperature fusion strategy based on cumulative distribution function matching and multiresolution Kalman fltering. Remote Sens. Environ. 2021, 254, 112256. [Google Scholar] [CrossRef]
- Zhang, X.; Zhou, J.; Gottsche, F.-M.; Zhan, W.; Liu, S.; Cao, R. A Method Based on Temporal Component Decomposition for Estimating 1-km All-Weather Land Surface Temperature by Merging Satellite Thermal Infrared and Passive Microwave Observations. IEEE Trans. Geosci. Remote Sens. 2019, 57, 4670–4691. [Google Scholar] [CrossRef]
- Bechtel, B. Robustness of Annual Cycle Parameters to Characterize the Urban Thermal Landscapes. IEEE Geosci. Remote Sens. Lett. 2012, 9, 876–880. [Google Scholar] [CrossRef]
- Zhan, W.; Zhou, J.; Ju, W.; Li, M.; Sandholt, I.; Voogt, J.; Yu, C. Remotely sensed soil temperatures beneath snow-free skin-surface using thermal observations from tandem polar-orbiting satellites: An analytical three-time-scale model. Remote Sens. Environ. 2014, 143, 1–14. [Google Scholar] [CrossRef]
- Göttsche, F.-M.; Olesen, F.S. Modelling of diurnal cycles of brightness temperature extracted from METEOSAT data. Remote Sens. Environ. 2001, 76, 337–348. [Google Scholar] [CrossRef]
- Holmes, T.R.H.; Crow, W.T.; Hain, C. Spatial patterns in timing of the diurnal temperature cycle. Hydrol. Earth Syst. Sci. 2013, 17, 3695–3706. [Google Scholar] [CrossRef] [Green Version]
- Holmes, T.R.H.; Owe, M.; De Jeu, R.A.M.; Kooi, H. Estimating the soil temperature profile from a single depth observation: A simple empirical heatflow solution. Water Resour. Res. 2008, 44, W02412. [Google Scholar] [CrossRef] [Green Version]
- Parinussa, R.M.; Holmes, T.R.H.; Yilmaz, M.T.; Crow, W.T. The impact of land surface temperature on soil moisture anomaly detection from passive microwave observations. Hydrol. Earth Syst. Sci. 2011, 15, 3135–3151. [Google Scholar] [CrossRef] [Green Version]
- Cheng, J.; Dong, S.; Shi, J. 0.02° seamless hourly land surface temperature dataset over East Asia (2016–2021). A Big Earth Data Platf. Three Poles 2022. [Google Scholar] [CrossRef]
Figure 1.
Standard deviation of ASTER LST subsets centered around each HiWATER site. (a) 23 × 23 window; (b) 69 × 69 window. In the boxplots, the lines in the middle of the boxes represent the median, and the upper and lower whiskers indicate the maximum and minimum, respectively. The lower and upper edges of the blue box are lower quartile and upper quartile, while the red ‘+’ represents outliers.
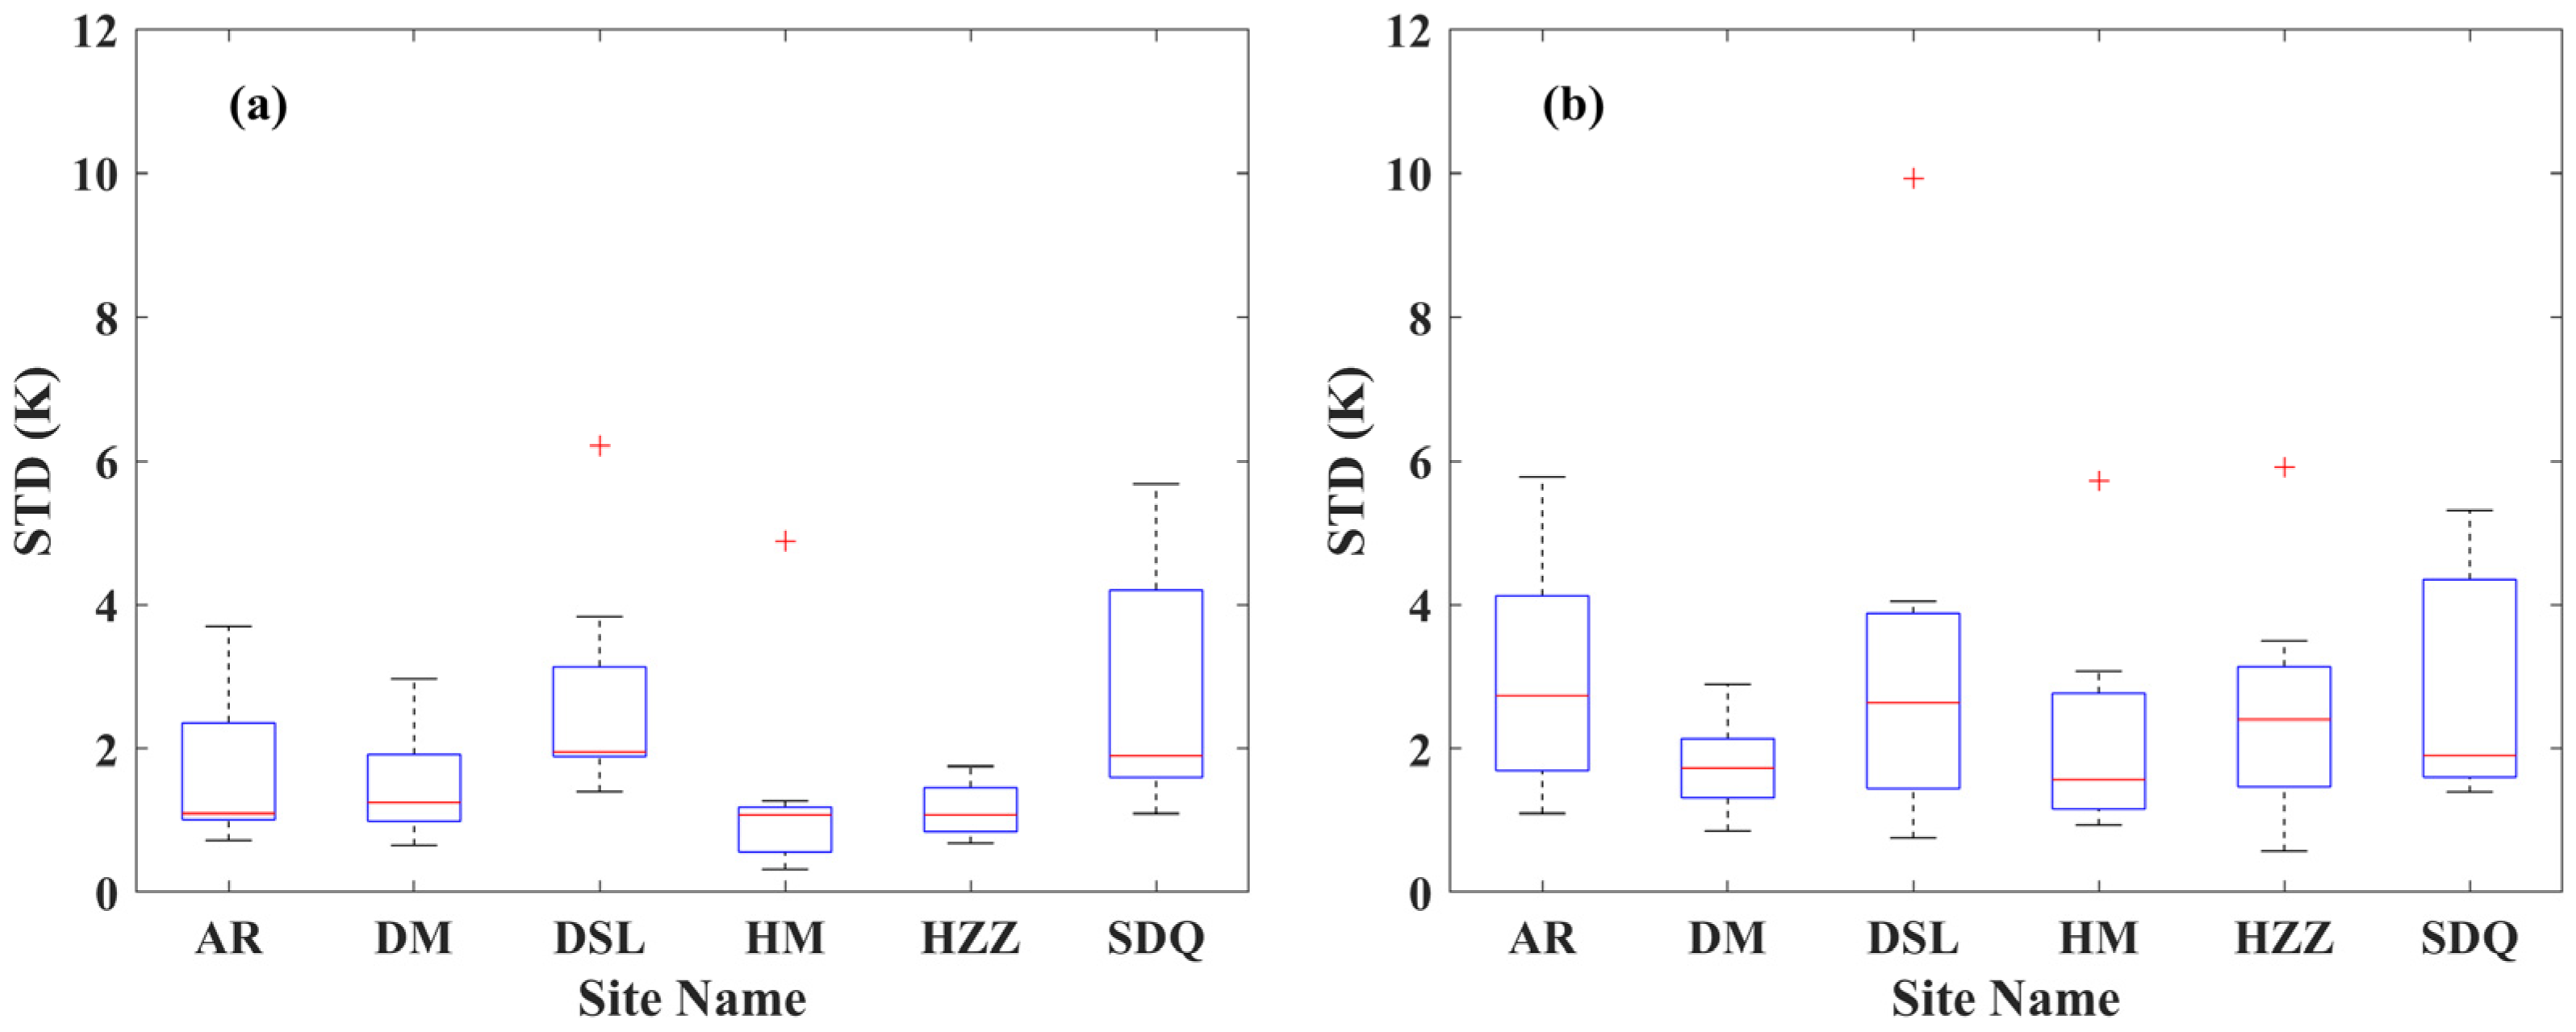
Figure 2.
Flowchart of the proposed method for generating hourly seamless LST.
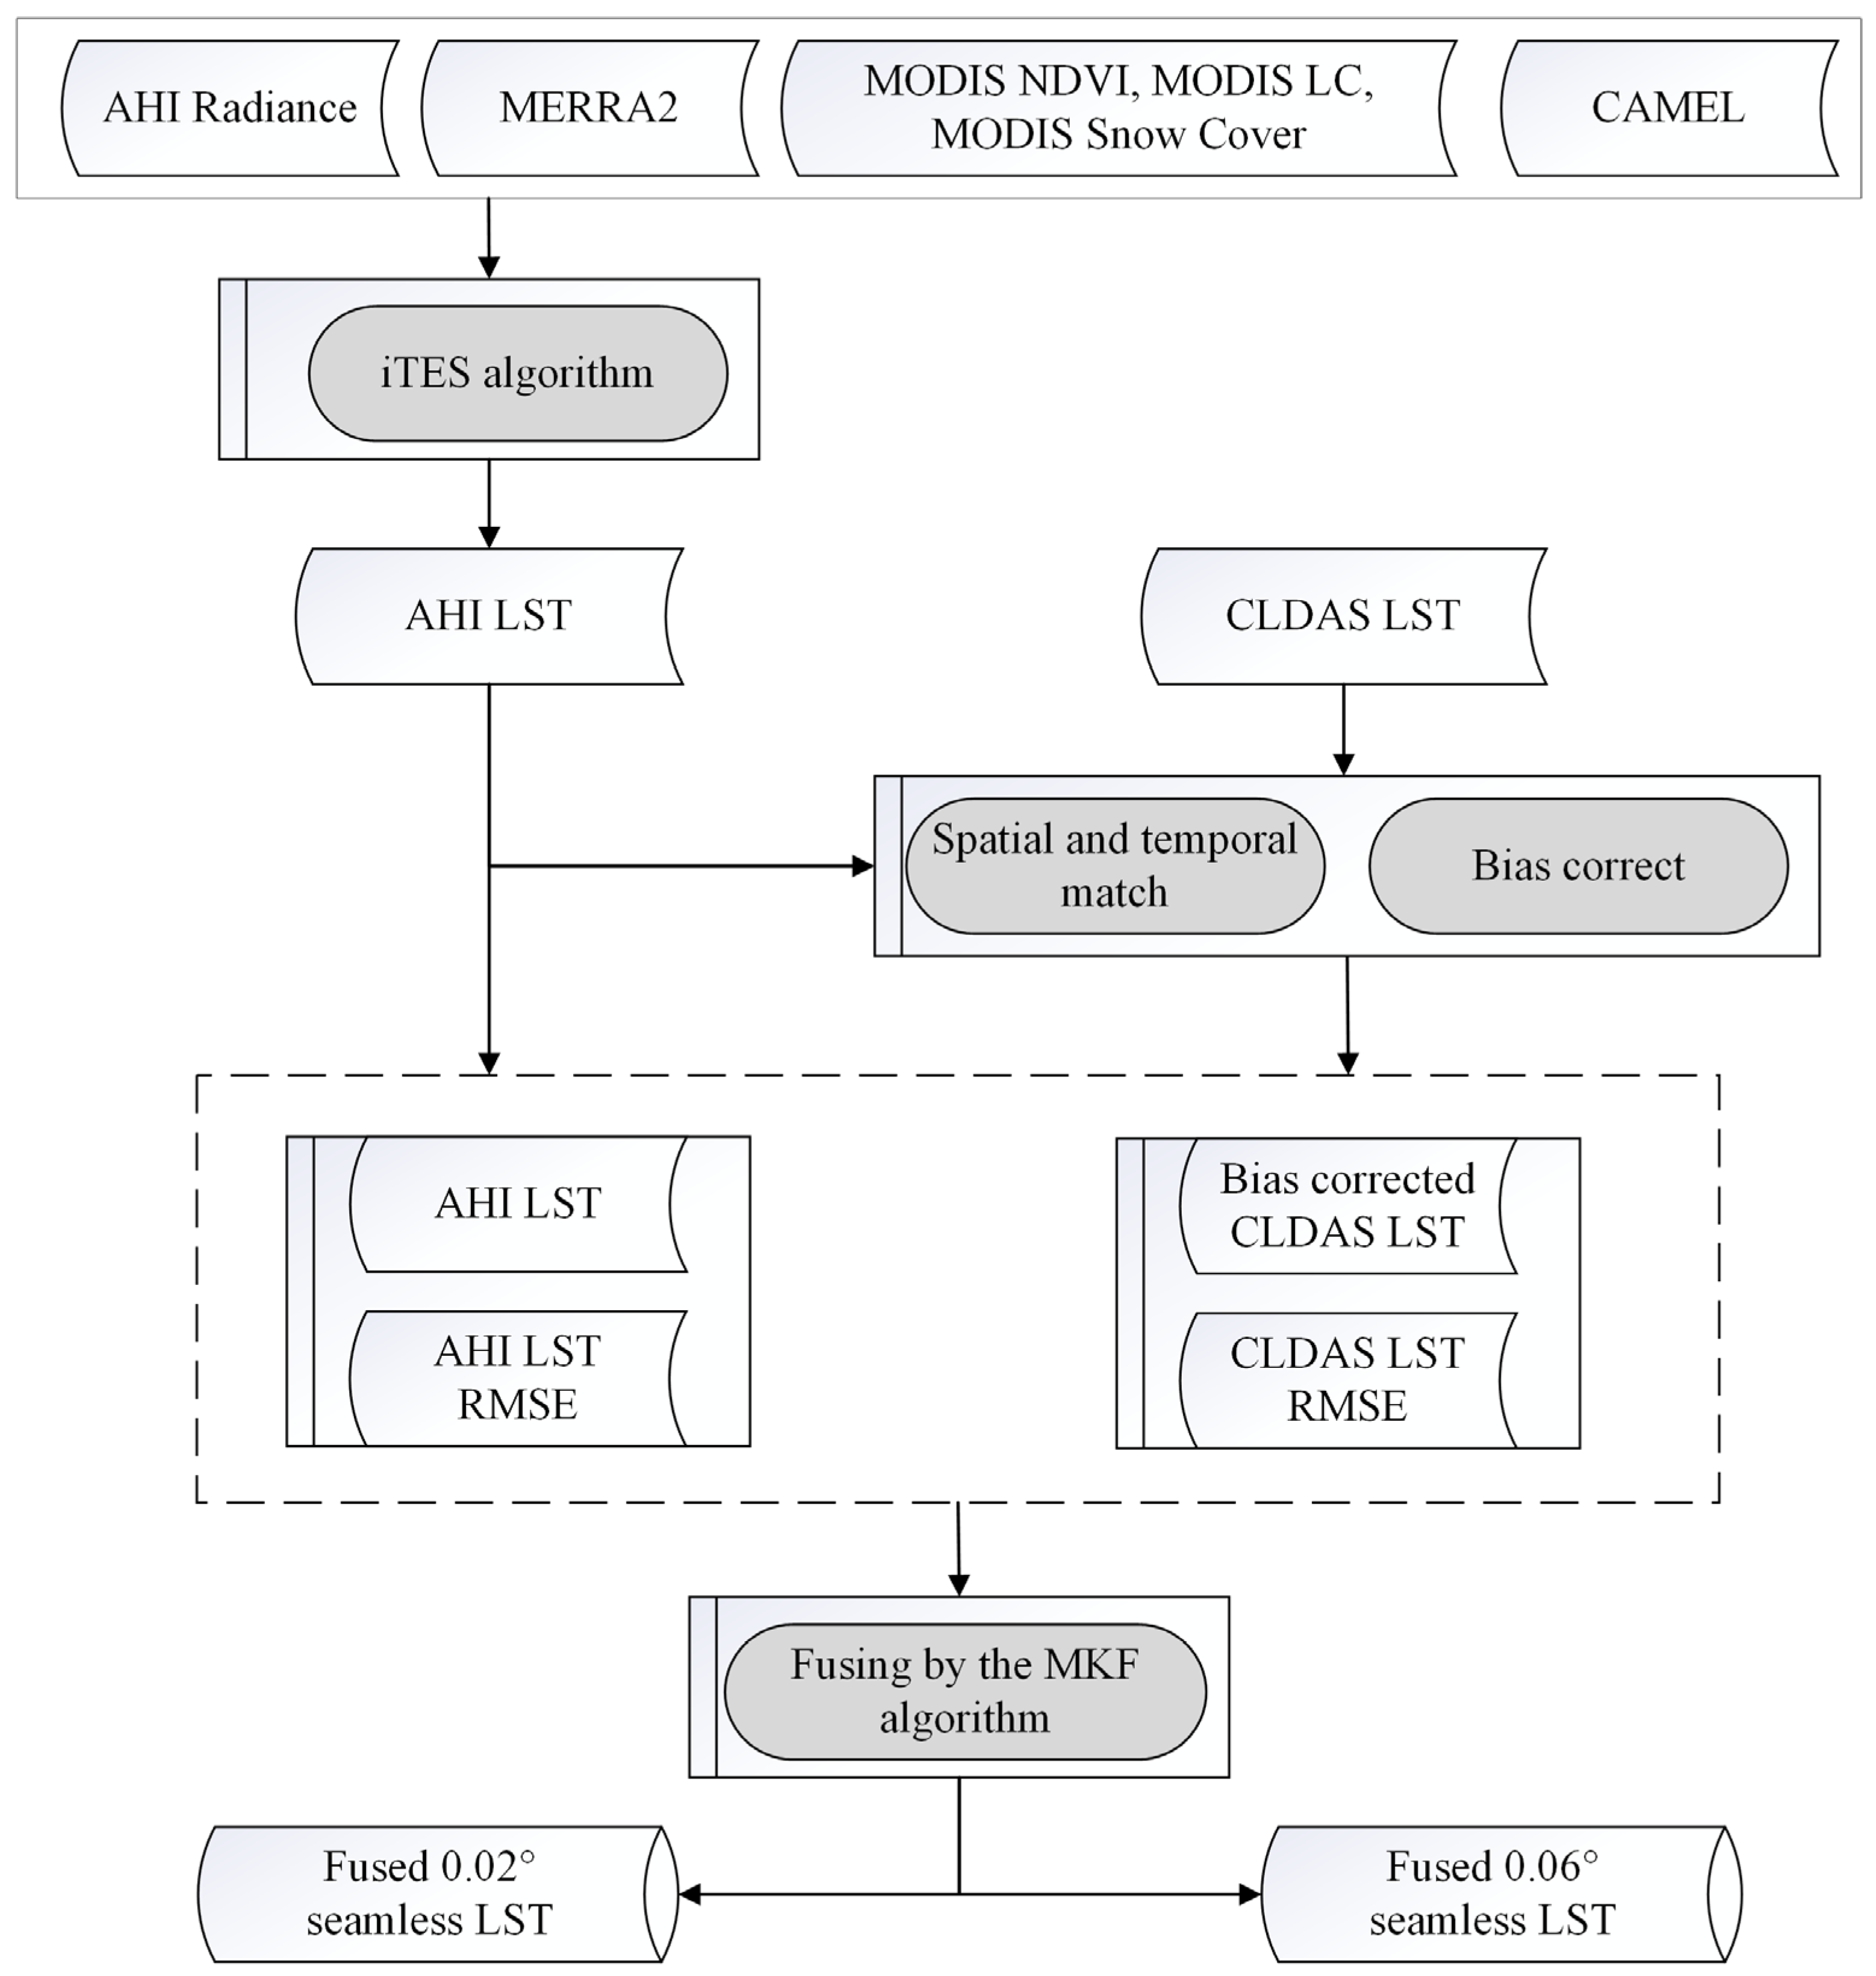
Figure 3.
The tree structure of the MKF algorithm.
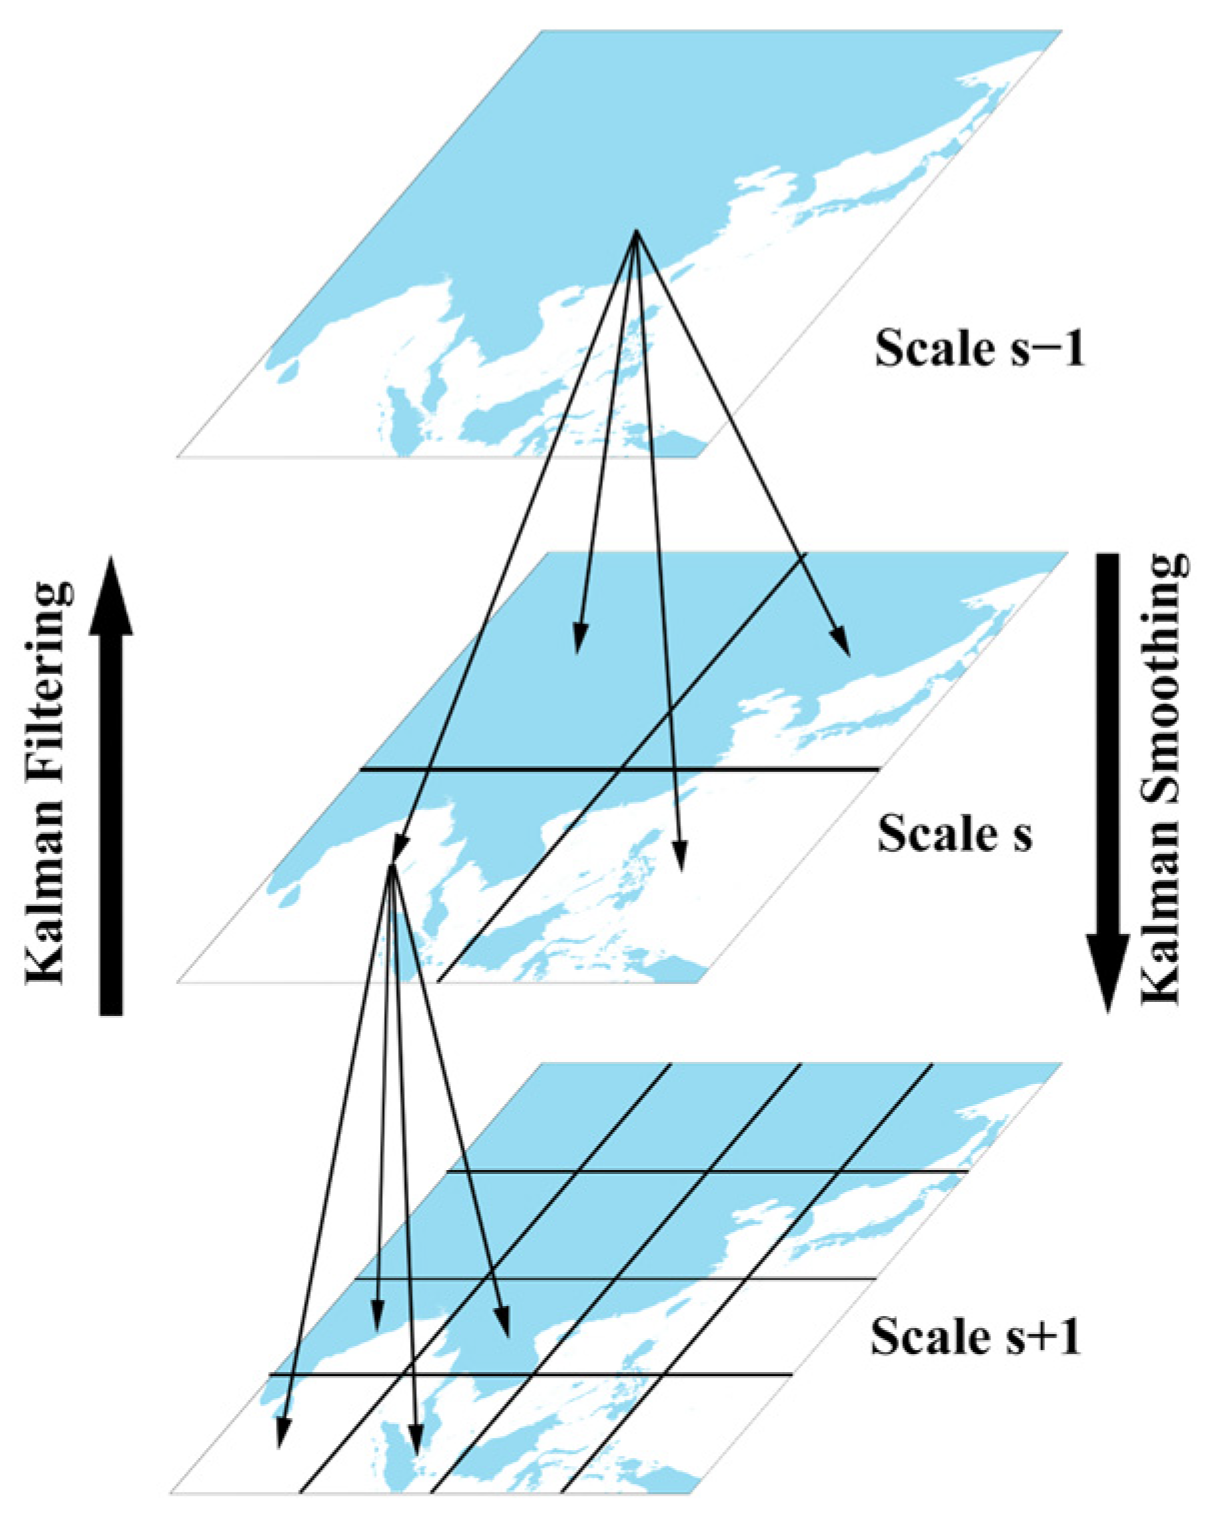
Figure 4.
Validation results for the fused LSTs at a finer scale under clear-sky (a) and cloudy sky (b) conditions.
Figure 4.
Validation results for the fused LSTs at a finer scale under clear-sky (a) and cloudy sky (b) conditions.
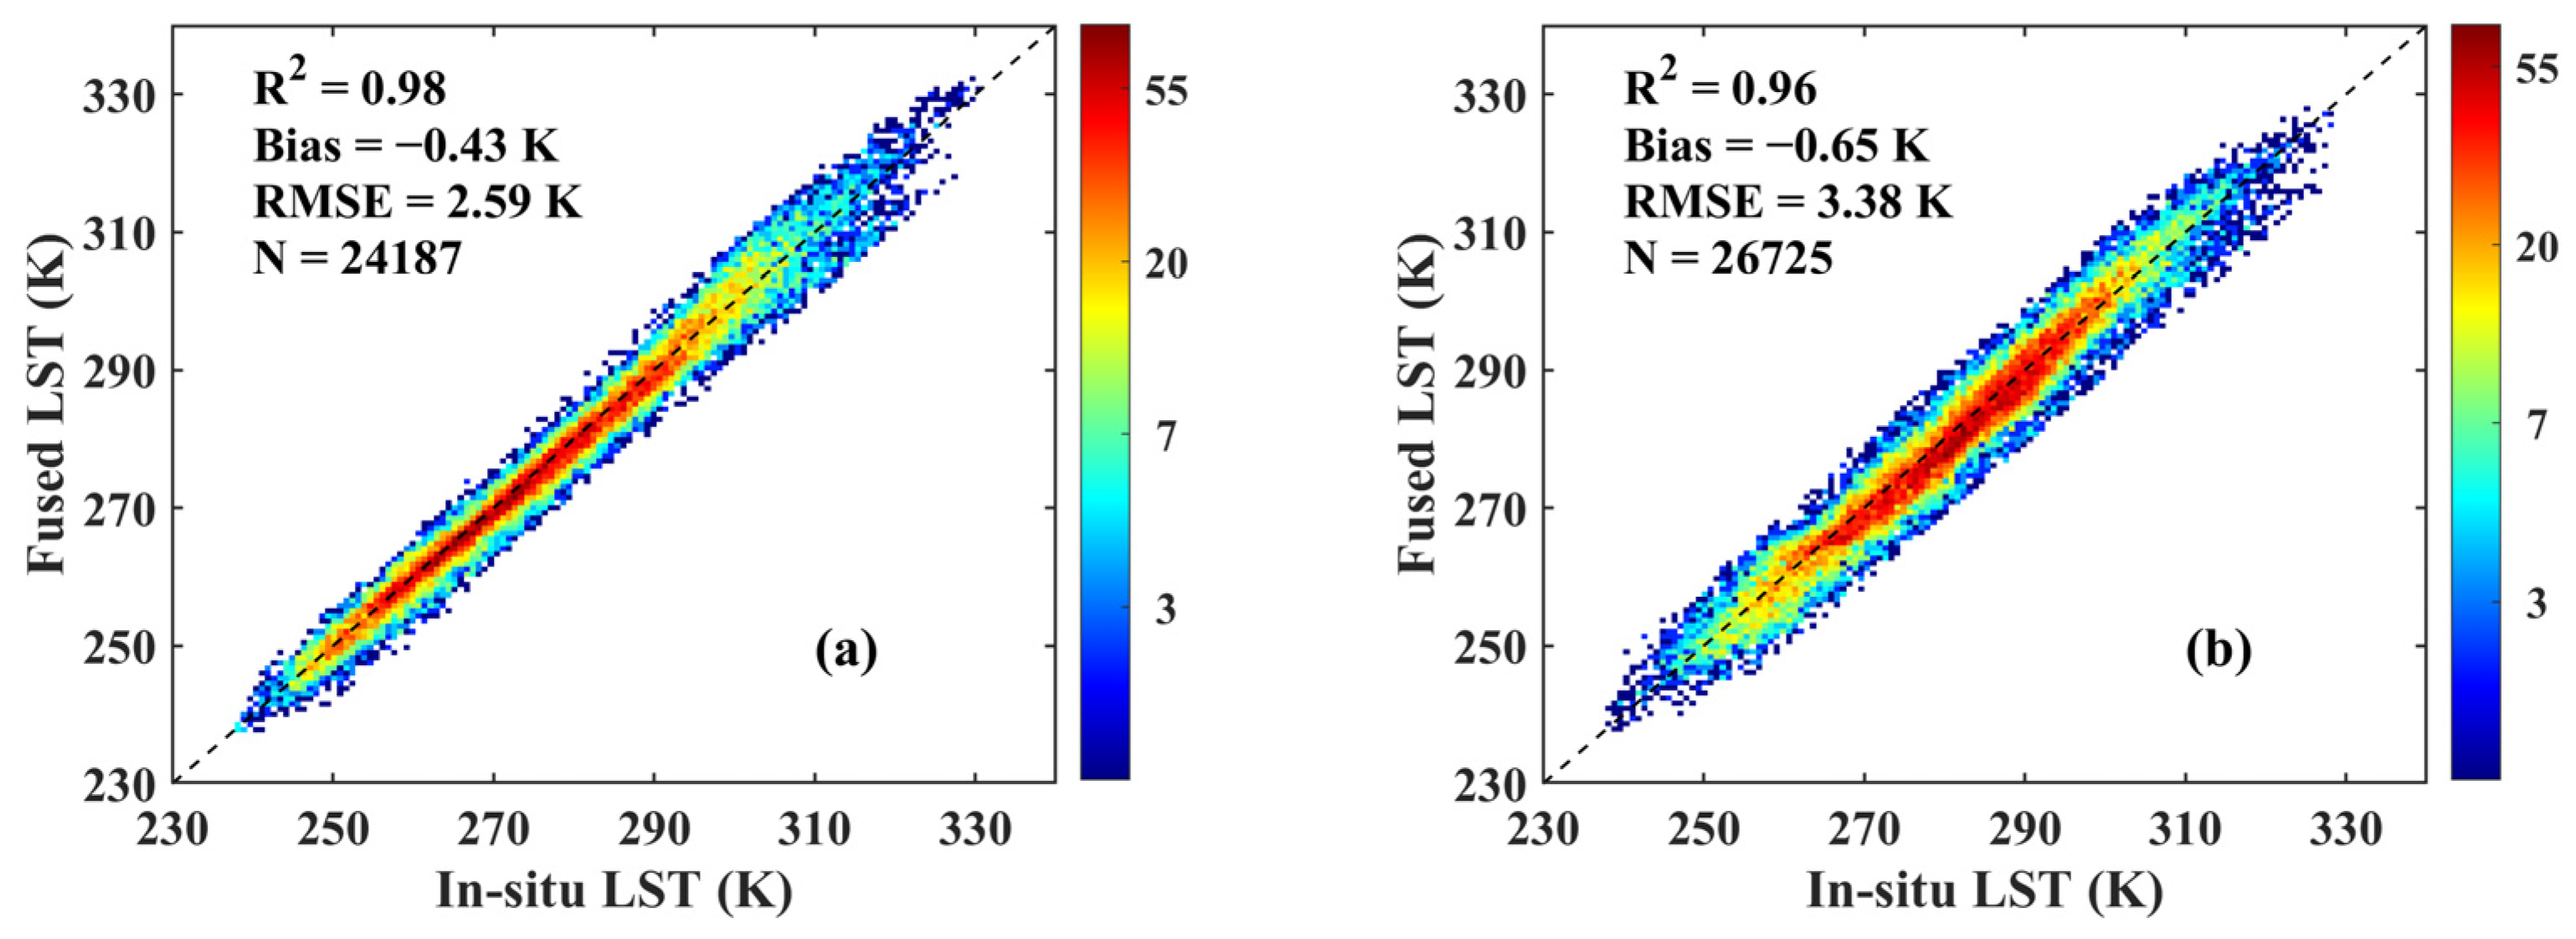
Figure 5.
Validation results of the retrieved clear-sky AHI LST.
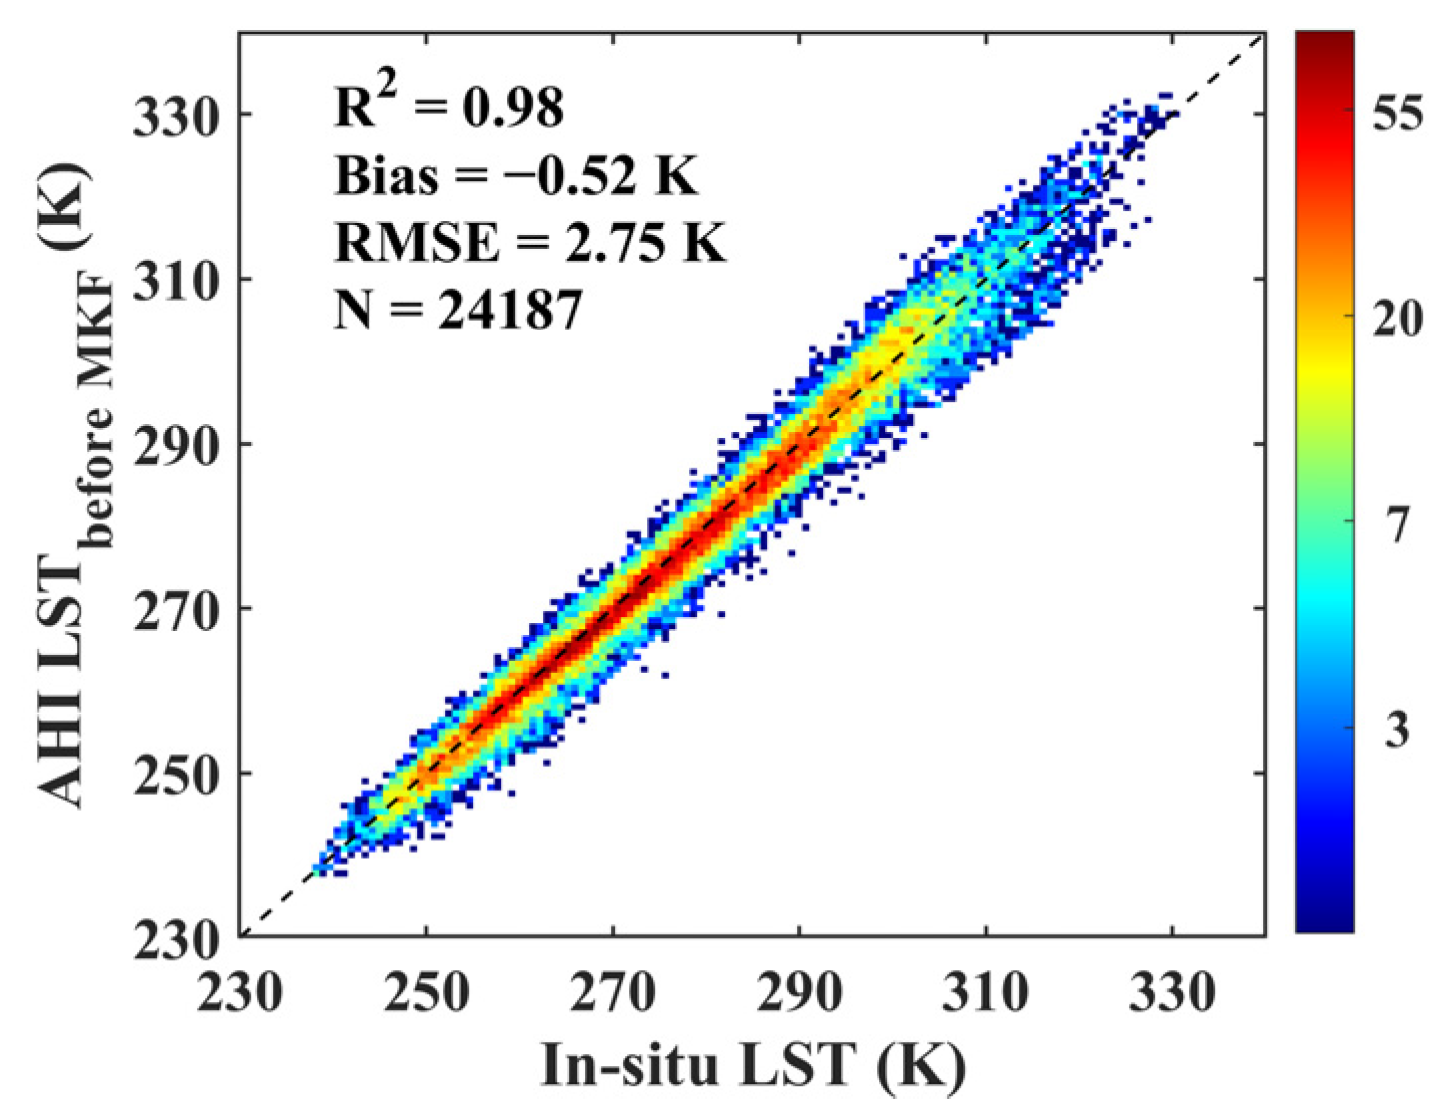
Figure 6.
Validation results of (a) CLDAS LST, (b) bias-corrected CLDAS LST and (c) fused LST at the coarse scale.
Figure 6.
Validation results of (a) CLDAS LST, (b) bias-corrected CLDAS LST and (c) fused LST at the coarse scale.

Figure 7.
LST images at 00:00 UTC on the 15 July 2016. (a) The AHI LST; (b) the bias-corrected CLDAS LST; (c) the fused LSTs at a finer scale; (d) the fused LSTs at a coarse scale.
Figure 7.
LST images at 00:00 UTC on the 15 July 2016. (a) The AHI LST; (b) the bias-corrected CLDAS LST; (c) the fused LSTs at a finer scale; (d) the fused LSTs at a coarse scale.
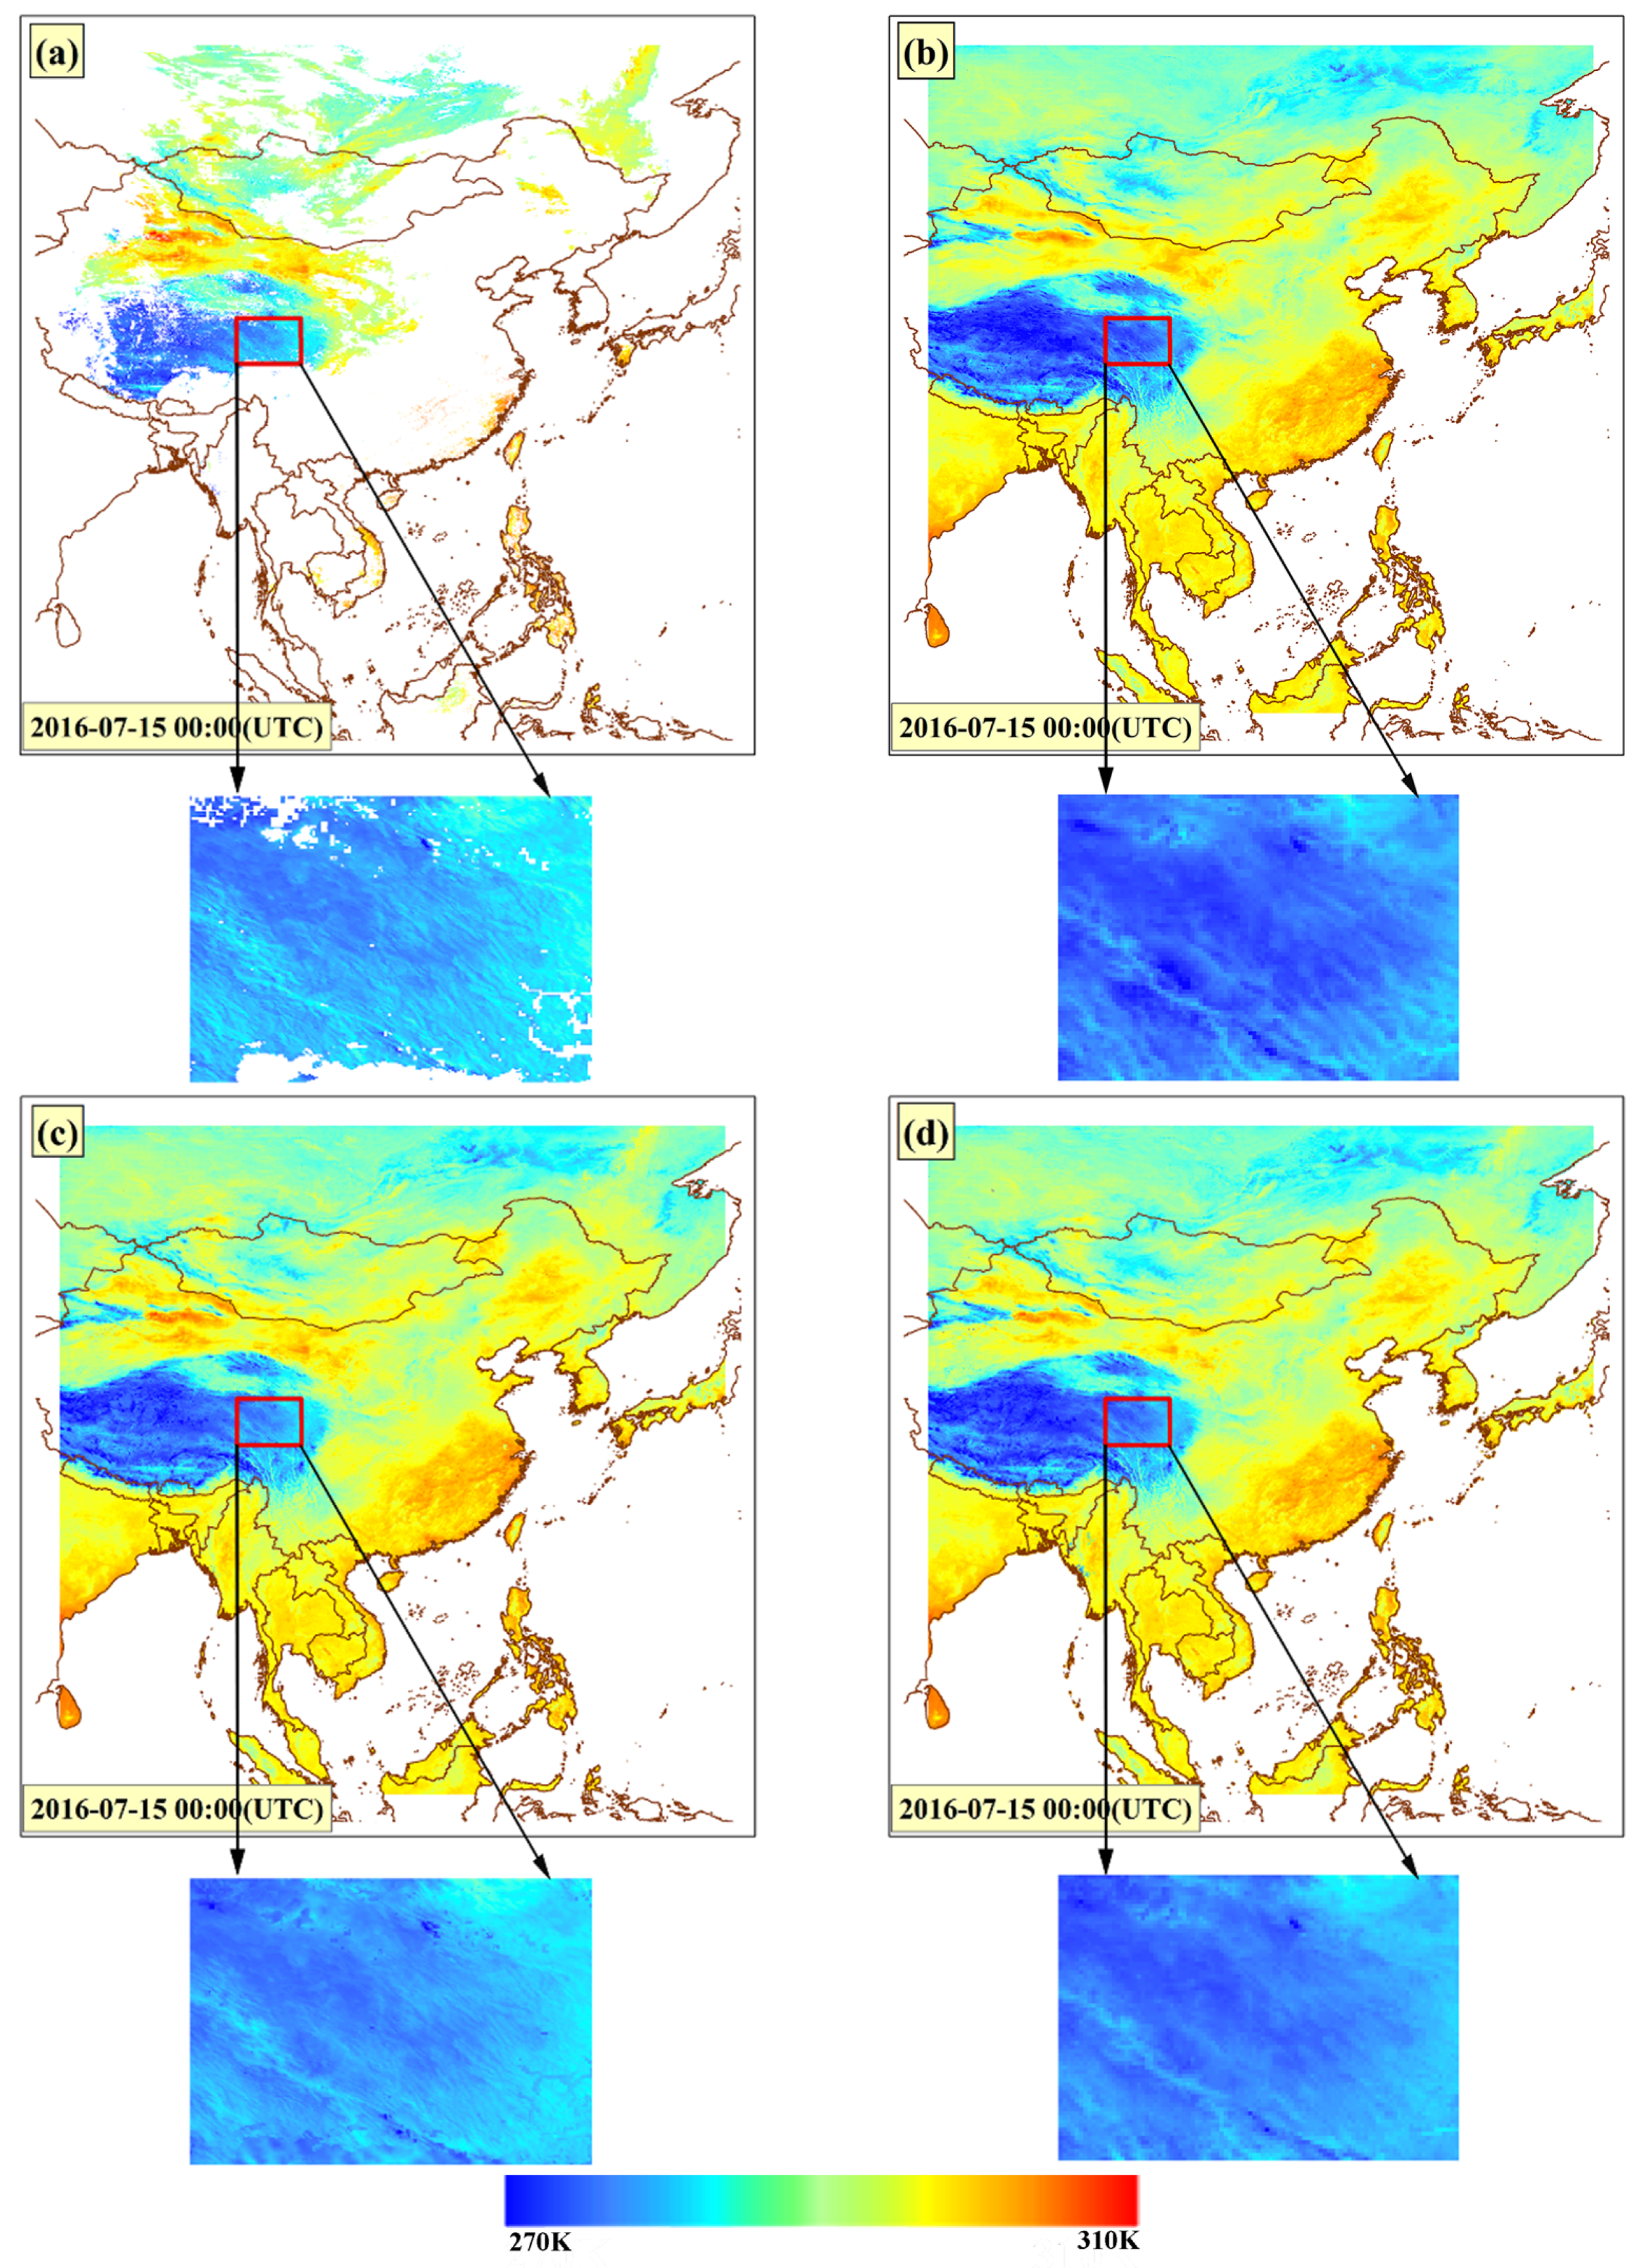
Figure 8.
The produced 0.02° seamless LST at 00:00 UTC on the 15th day of each month in 2016.

Figure 9.
Comparison of the temporal variations (DOY: 291) of the AHI LST, the bias-corrected CLDAS LST, the finer-scale LST, the coarse-scale LST and in situ LST at six sites from the HiWATER network.
Figure 9.
Comparison of the temporal variations (DOY: 291) of the AHI LST, the bias-corrected CLDAS LST, the finer-scale LST, the coarse-scale LST and in situ LST at six sites from the HiWATER network.
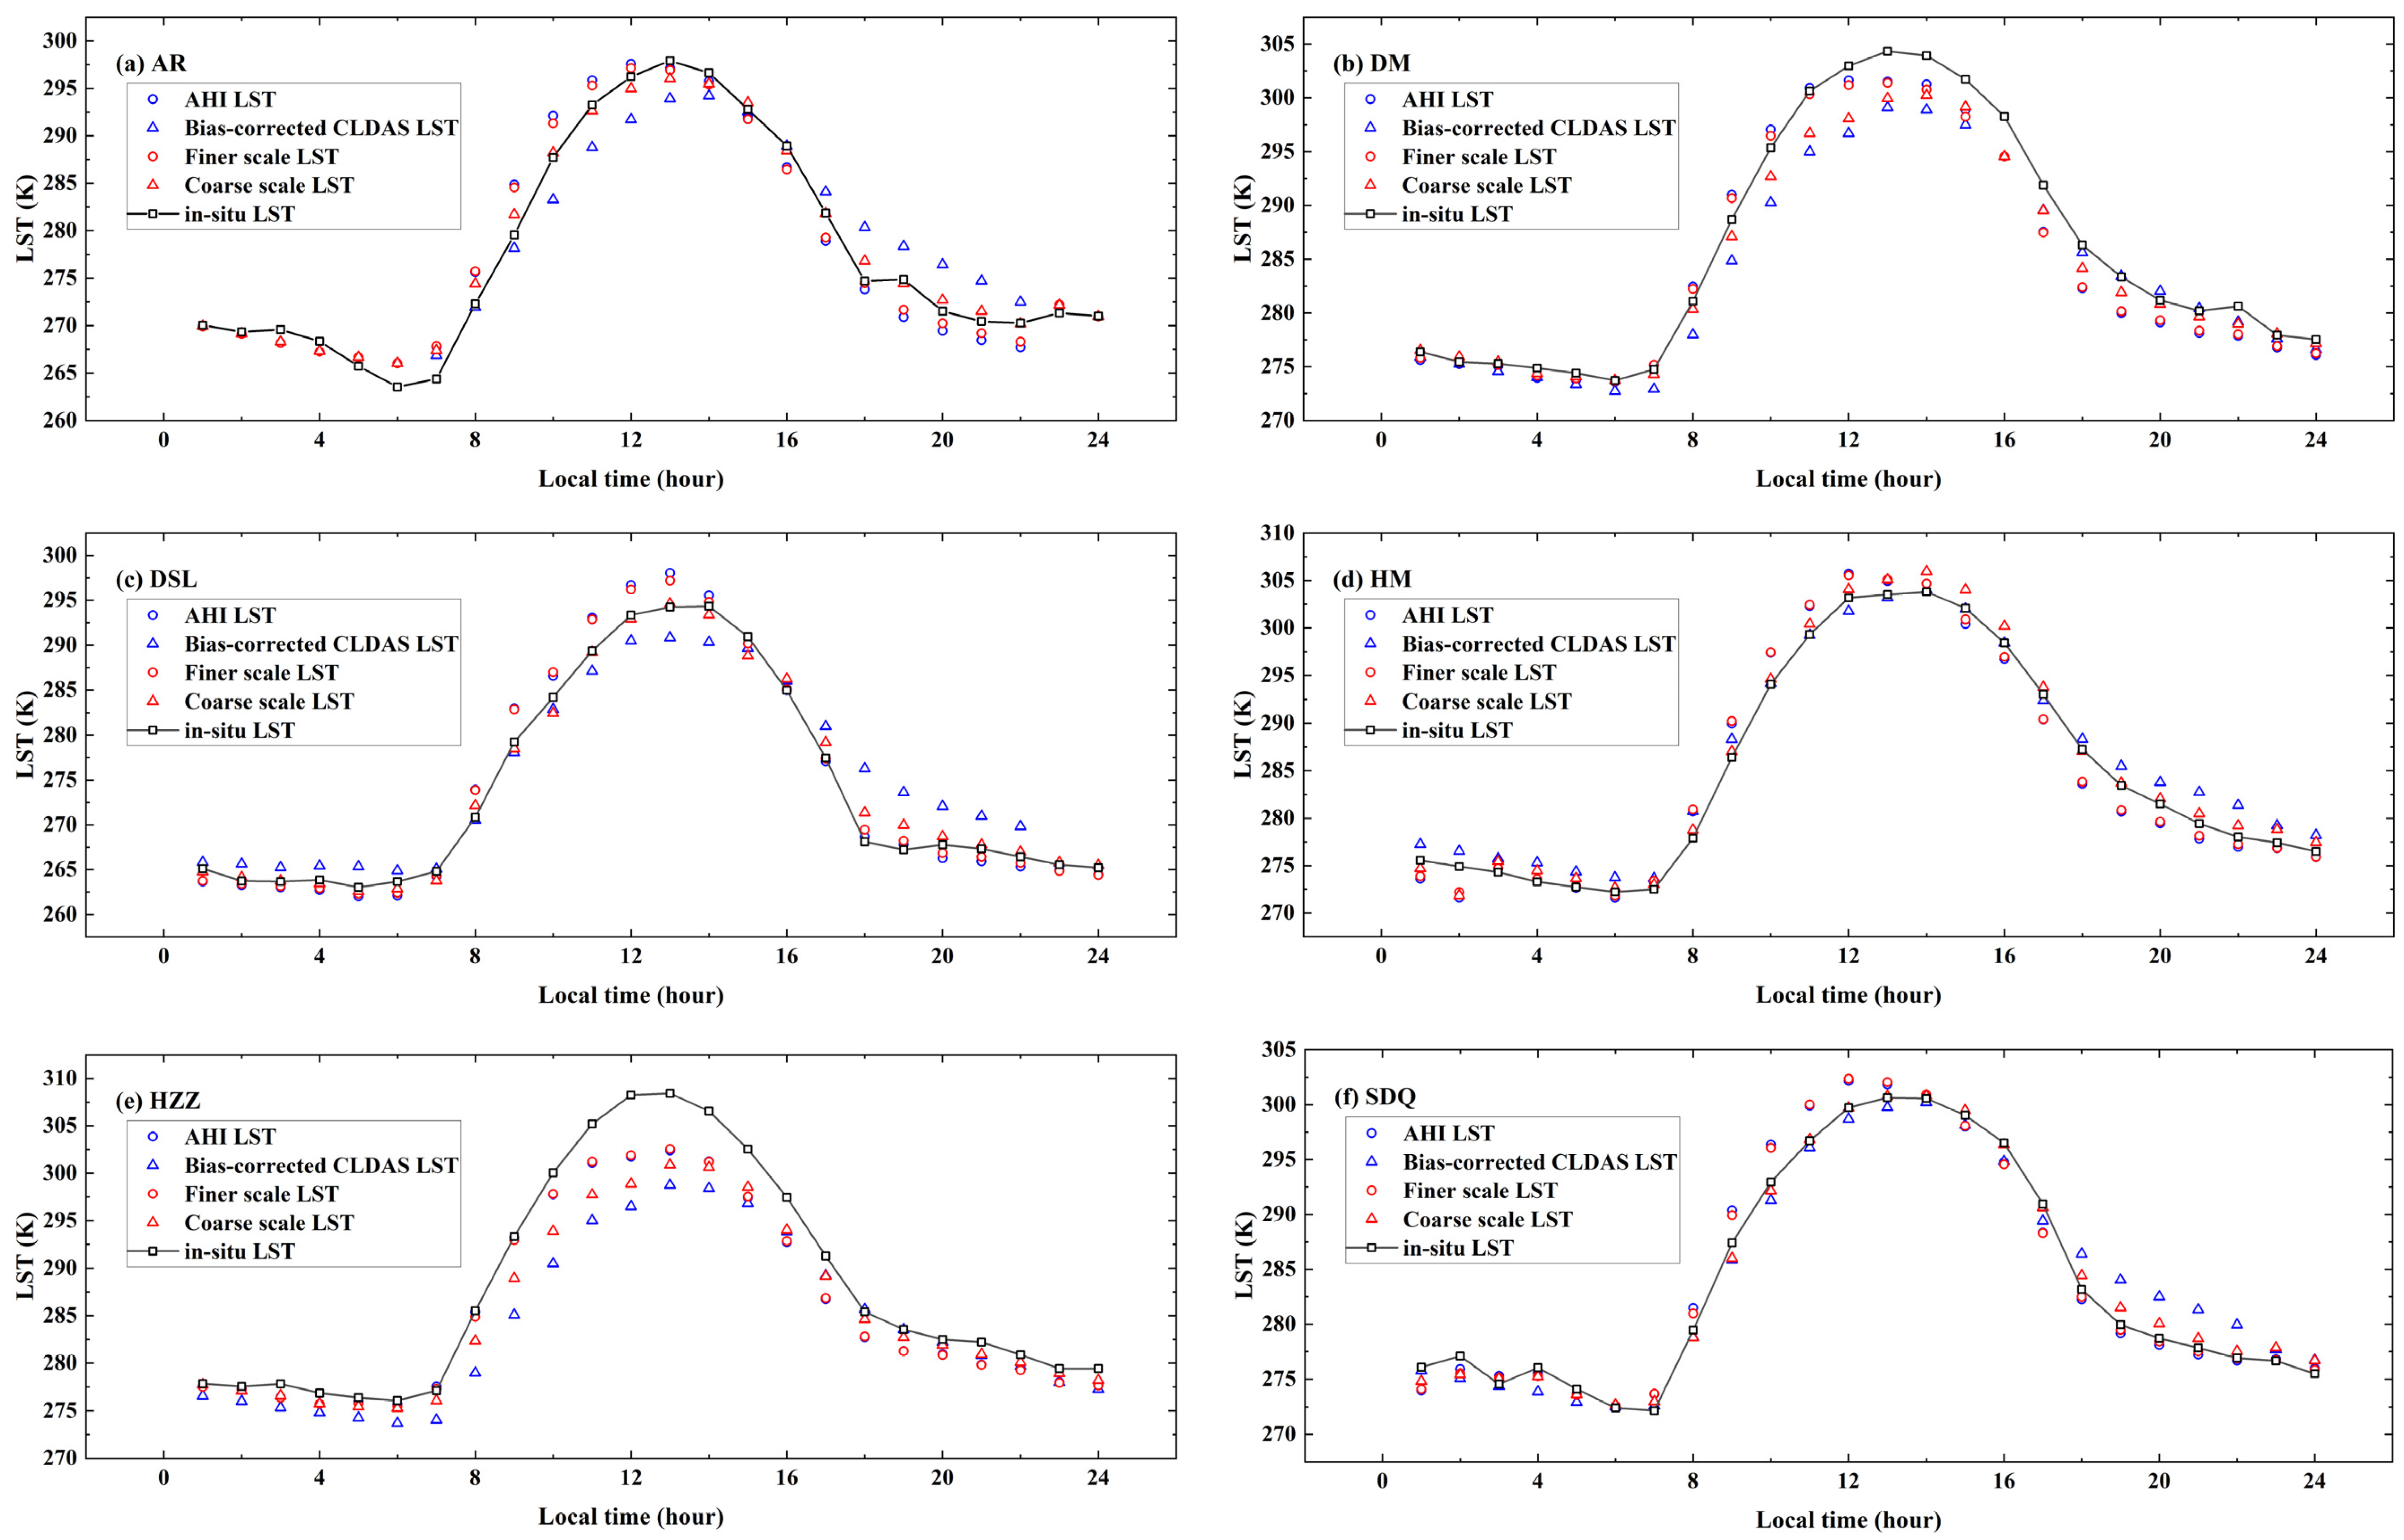
Figure 10.
Validation results for the CLDAS LST and the bias-corrected CLDAS LST. (a) clear-sky CLDAS LST; (b) bias-corrected CLDAS LST under clear-sky conditions, (c) cloudy-sky CLDAS LST, (d) bias-corrected CLDAS LST under cloudy sky conditions.
Figure 10.
Validation results for the CLDAS LST and the bias-corrected CLDAS LST. (a) clear-sky CLDAS LST; (b) bias-corrected CLDAS LST under clear-sky conditions, (c) cloudy-sky CLDAS LST, (d) bias-corrected CLDAS LST under cloudy sky conditions.
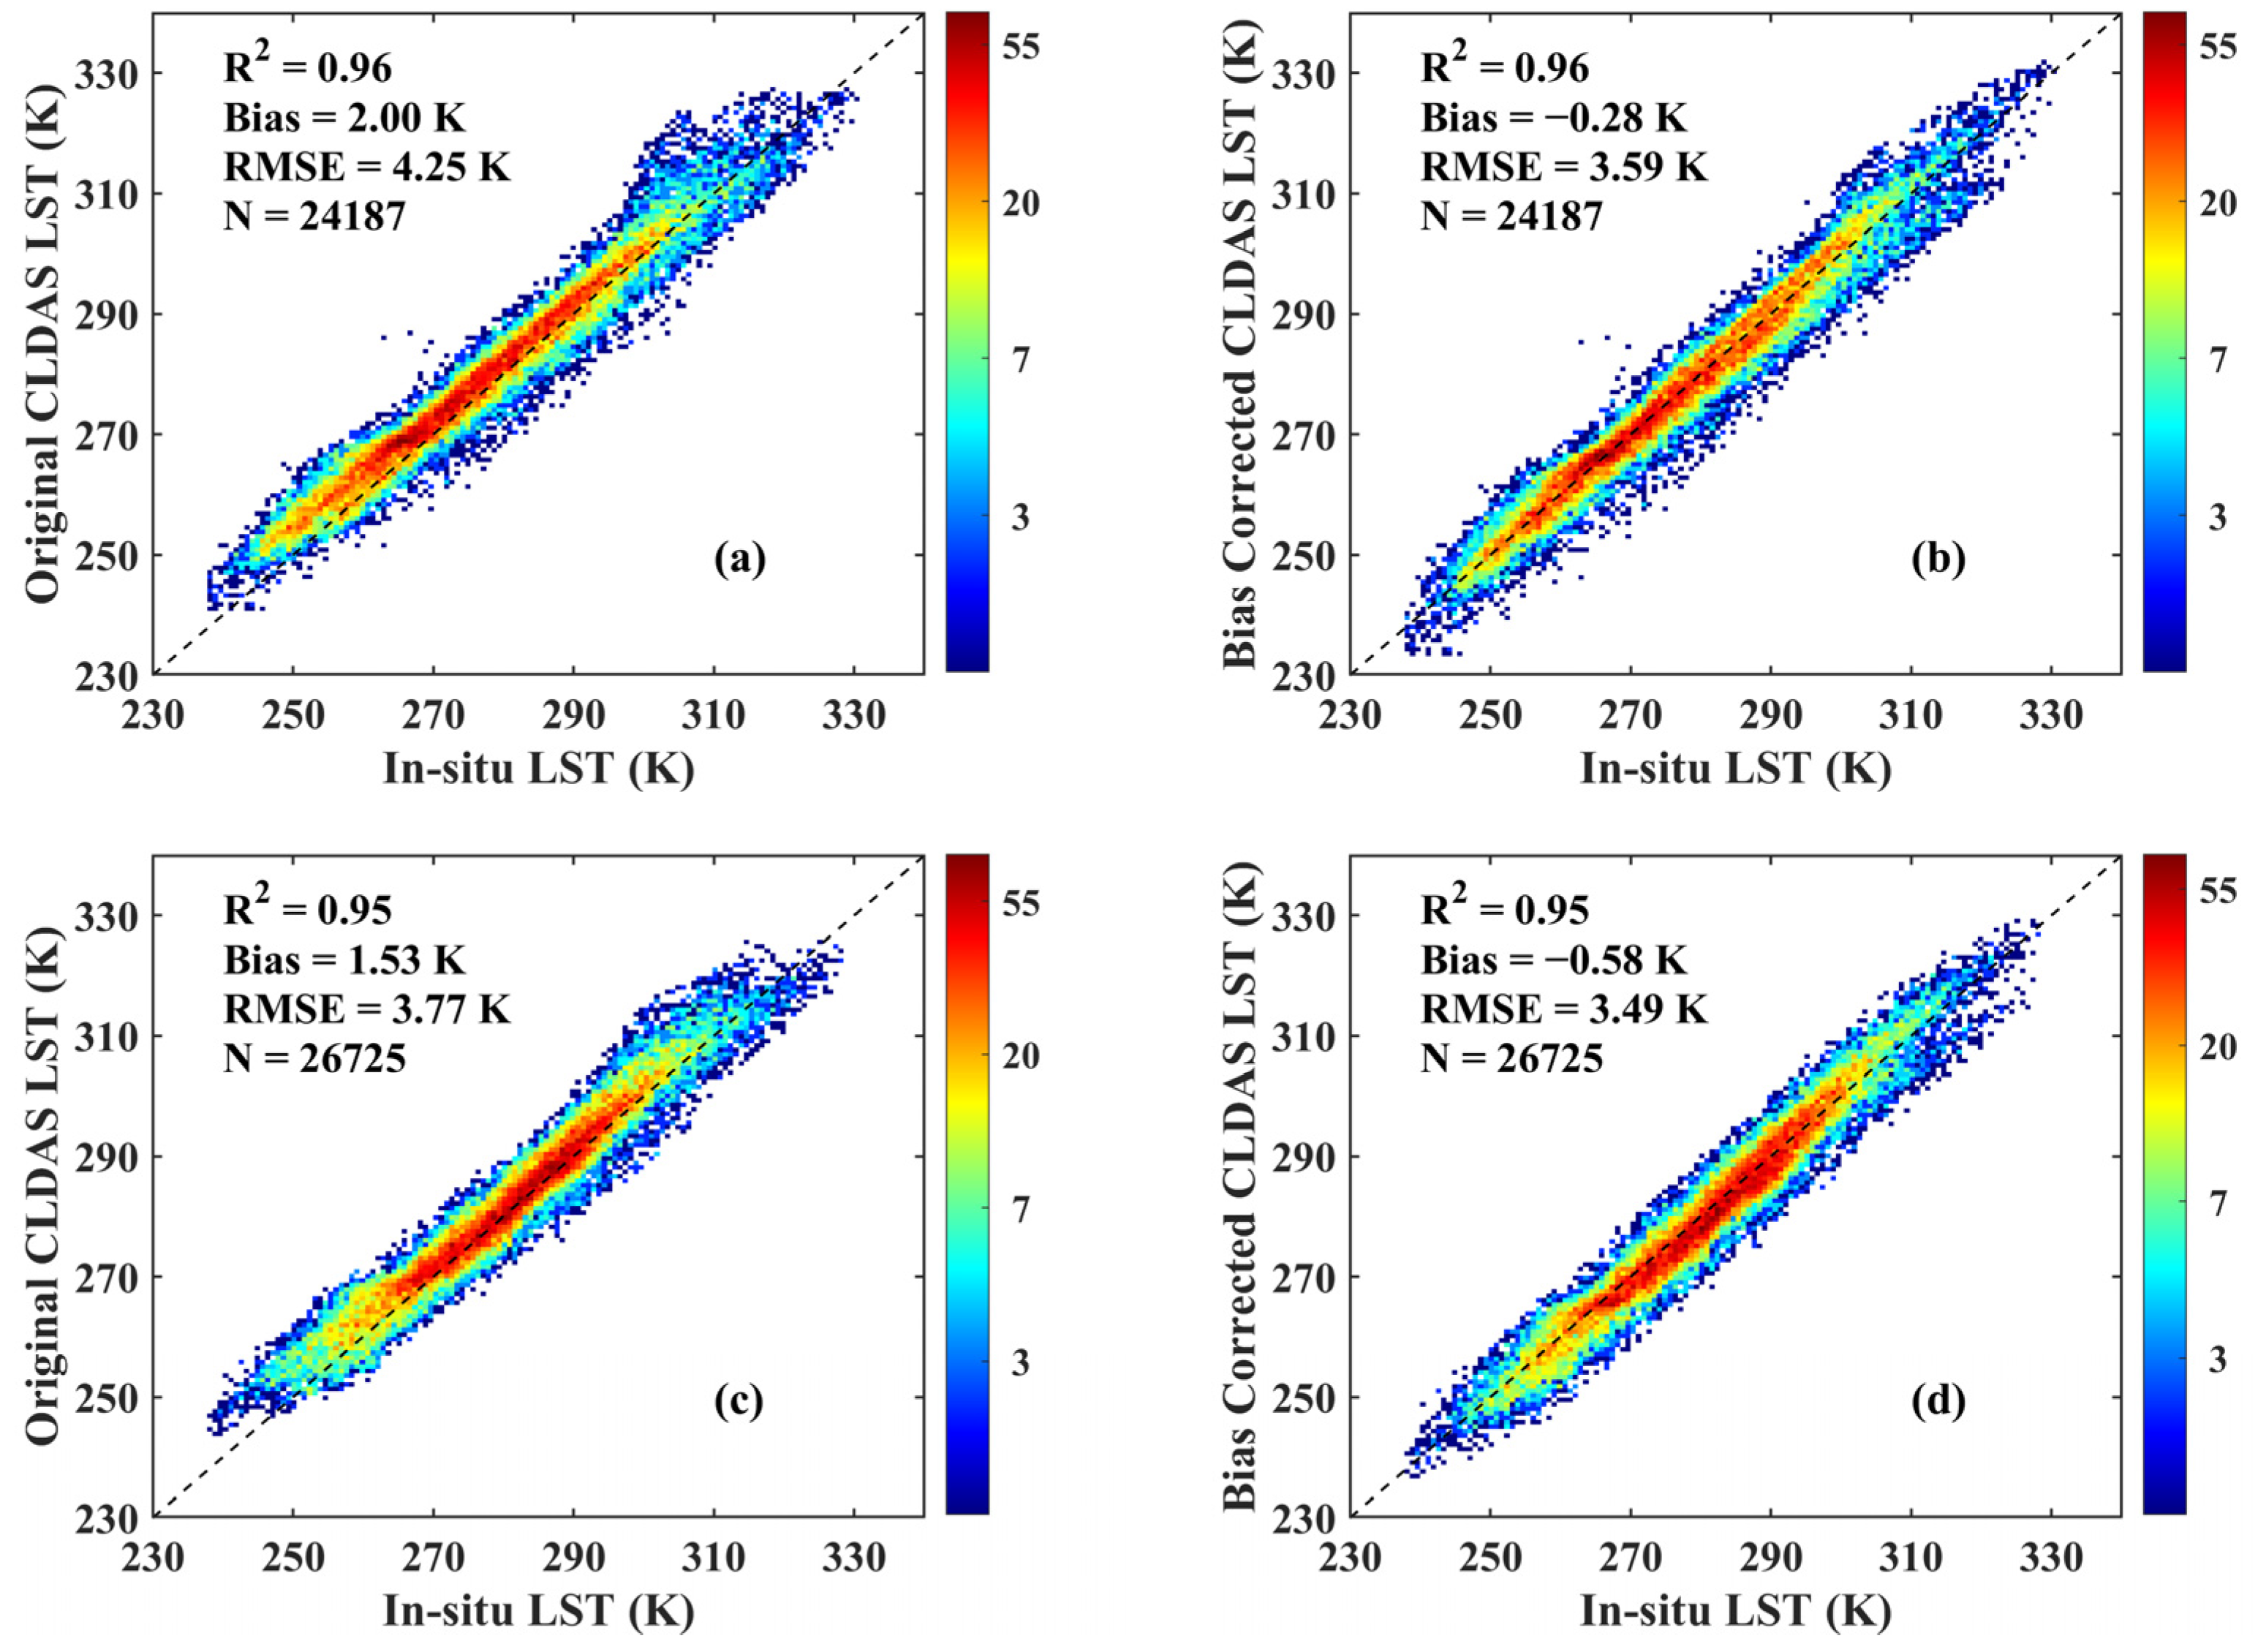
Figure 11.
Validation results for the finer-scale LSTs by using CLDAS LST corrected by different methods as input. The first (a,b), second (c,d) and third (e,f) rows represent the AHI LST-based bias correction method, the MODIS LST-based bias correction method and the CDF method, respectively. The first (a,c,e) and second (b,d,f) columns represent the fused finer-scale LSTs under clear sky and cloudy sky conditions, respectively.

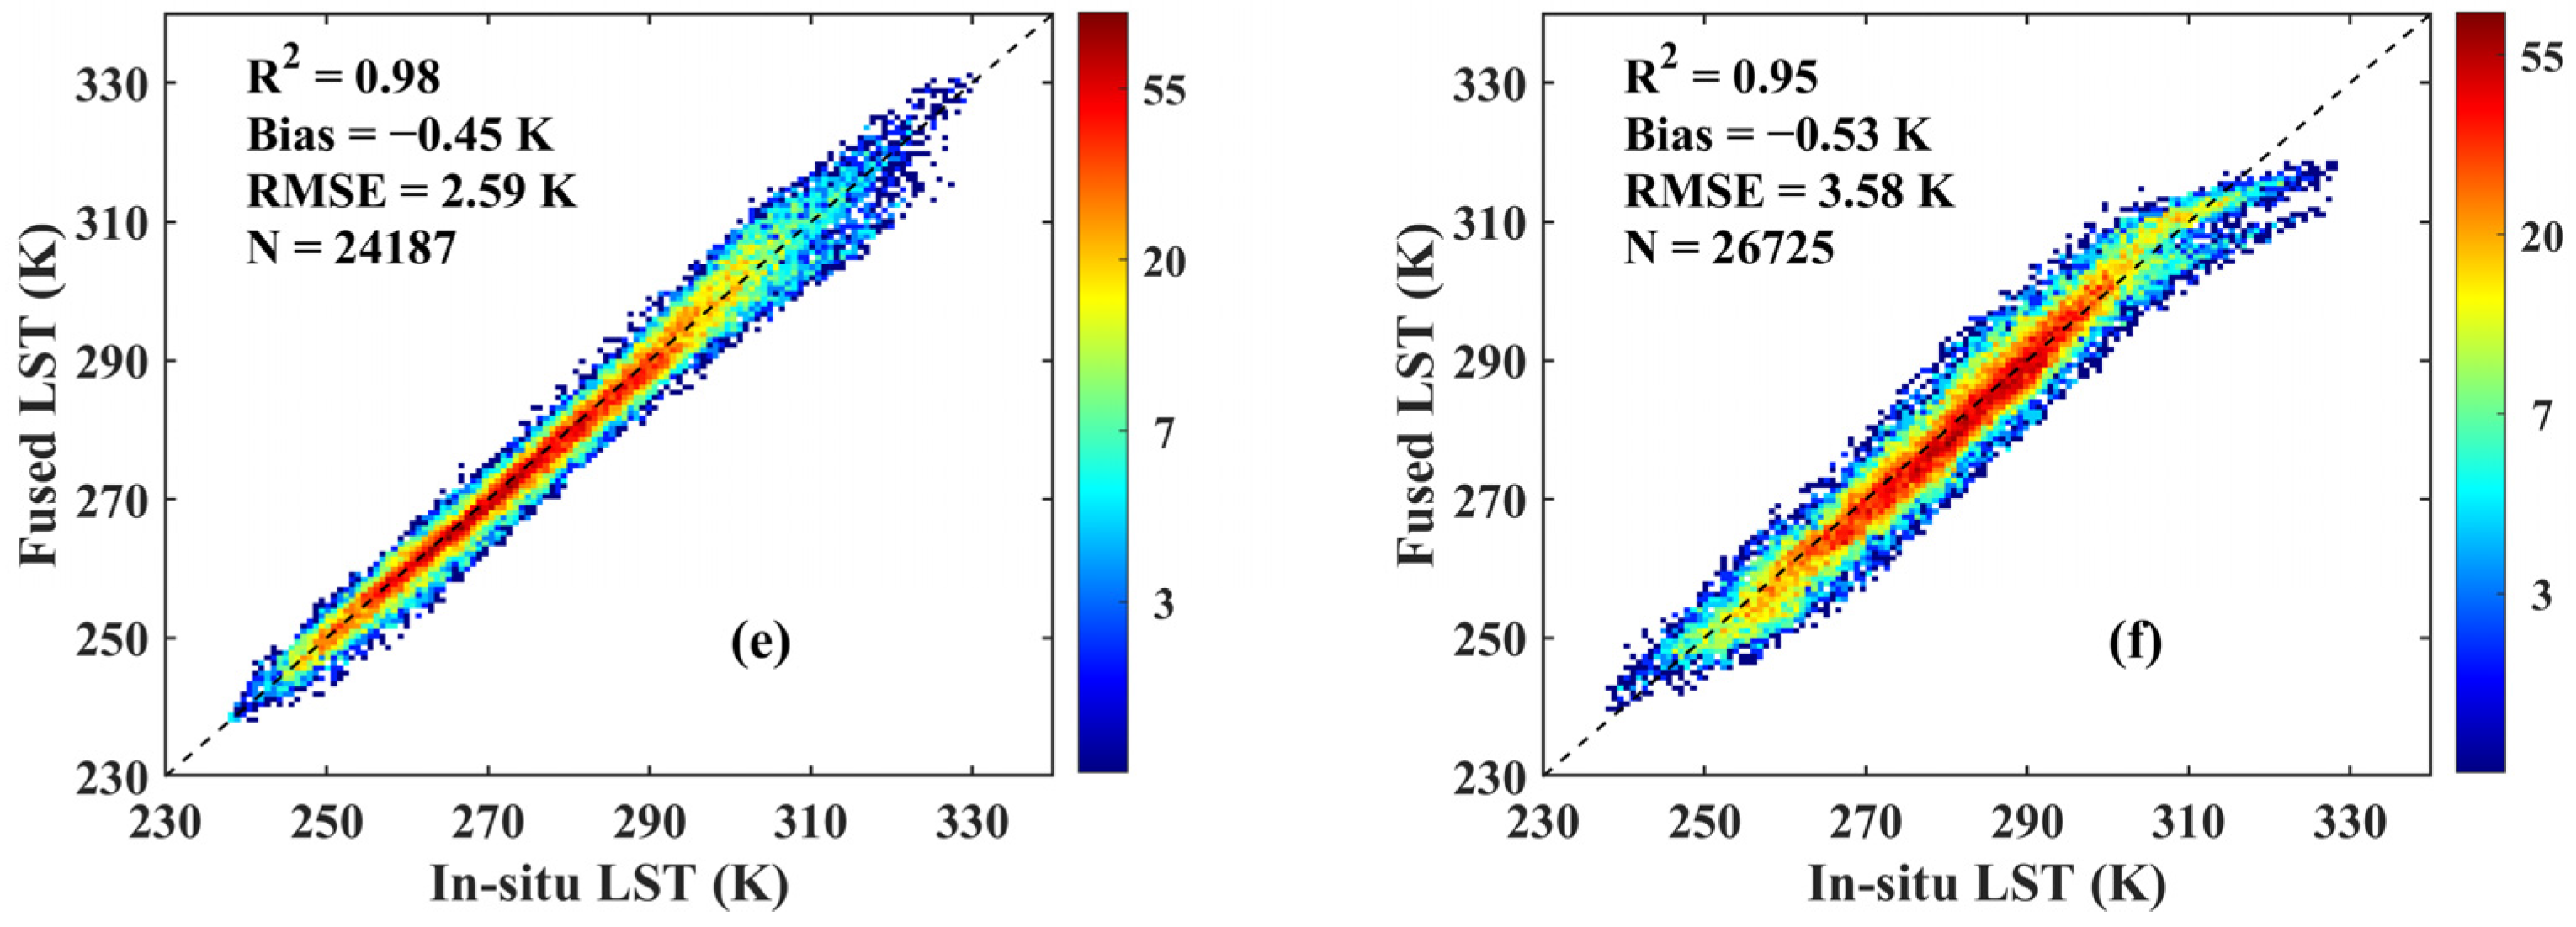
Figure 12.
Validation results for the fused coarse-scale LST and bias-corrected CLDAS LST corrected by different bias correction methods. The first (a,b), second (c,d) and third (e,f) rows represent the AHI LST-based bias correction method, the MODIS LST-based bias correction method and the CDF method, respectively. The first (a,c,e) and second (b,d,f) columns represent the fused coarse-scale LST and bias-corrected CLDAS LST, respectively.

Table 1.
Details of the data and material used in this study.
| Source | Dataset | Spatial Resolution | Temporal Resolution |
|---|---|---|---|
| Satellite Data | AHI full disk data | 0.02° × 0.02° | 10 min |
| AHI cloud product | 0.02° × 0.02° | 10 min | |
| MERRA-2 | 0.5° × 0.625° | 6 h | |
| MYD13A2 | 1 km × 1 km | 16 days | |
| MOD10C1 | 0.05° × 0.05° | 1 day | |
| MCD12Q1 | 0.05° × 0.05° | 1 year | |
| CAMEL | 0.05° × 0.05° | 1 month | |
| CLDAS LST data | - | 0.0625° × 0.0625° | 1 h |
| Ground measurements | - | - | 10 min |
Table 2.
Details of the selected sites from the HiWATER network.
| Site Name | Location (°N, °E) | Land Cover | Data Interval | Instrument | Climatic Type * |
|---|---|---|---|---|---|
| A’Rou (AR) | (38.047, 100.464) | Savanna and grassland | 10 min | CNR1 | temperate continental climate |
| Daman (DM) | (38.856, 100.372) | Maize | 10 min | CNR1 | temperate continental climate |
| Dashalong (DSL) | (38.840, 98.941) | Marsh alpine meadow | 10 min | CNR1 | temperate continental climate |
| Huangmo (HM) | (42.114, 100.987) | Bare soil | 10 min | CNR1 | temperate continental climate |
| Huazhaizi (HZZ) | (38.765, 100.319) | Bare soil | 10 min | CNR1 | temperate continental climate |
| Sidaoqiao (SDQ) | (42.001, 101.137) | Tamarix | 10 min | CNR1 | temperate continental climate |
* Koppen climate classification system.
Table 3.
The height and footprint of each flux tower in the HiWATER network.
| Site Name | AR | DM | DSL | HM | HZZ | SDQ |
|---|---|---|---|---|---|---|
| Height (m) | 5 | 12 | 6 | 6 | 6 | 10 |
| Footprint in diameter (m) | 114 | 274 | 142 | 142 | 142 | 229 |
Table 4.
The adopted tree structure in the MKF algorithm.
| Scale | Spatial Resolution | Pixel Number | Input Data |
|---|---|---|---|
| 1 | 60° × 60° | 1 | |
| 2 | 30° × 30° | 2 × 2 | |
| 3 | 6° × 6° | 10 × 10 | |
| 4 | 3° × 3° | 20 × 20 | |
| 5 | 0.6° × 0.6° | 100 × 100 | |
| 6 | 0.3°× 0.3° | 200 × 200 | |
| 7 | 0.06° × 0.06° | 1000 × 1000 | The bias-corrected CLDAS LST |
| 8 | 0.02° × 0.02° | 3000 × 3000 | The AHI LST |
Table 5.
Validation results of the finer-scale LST during nighttime and daytime, respectively.
| Accuracy | Daytime | Nighttime | ||
|---|---|---|---|---|
| Clear-Sky | Cloudy Sky | Clear-Sky | Cloudy Sky | |
| R2 | 0.95 | 0.93 | 0.98 | 0.96 |
| Bias (K) | 0.34 | −0.16 | −0.89 | −1.08 |
| RMSE (K) | 3.23 | 3.77 | 2.14 | 2.99 |
Publisher’s Note: MDPI stays neutral with regard to jurisdictional claims in published maps and institutional affiliations. |
© 2022 by the authors. Licensee MDPI, Basel, Switzerland. This article is an open access article distributed under the terms and conditions of the Creative Commons Attribution (CC BY) license (https://creativecommons.org/licenses/by/4.0/).
Share and Cite
MDPI and ACS Style
Dong, S.; Cheng, J.; Shi, J.; Shi, C.; Sun, S.; Liu, W. A Data Fusion Method for Generating Hourly Seamless Land Surface Temperature from Himawari-8 AHI Data. Remote Sens. 2022, 14, 5170. https://doi.org/10.3390/rs14205170
AMA Style
Dong S, Cheng J, Shi J, Shi C, Sun S, Liu W. A Data Fusion Method for Generating Hourly Seamless Land Surface Temperature from Himawari-8 AHI Data. Remote Sensing. 2022; 14(20):5170. https://doi.org/10.3390/rs14205170
Chicago/Turabian StyleDong, Shengyue, Jie Cheng, Jiancheng Shi, Chunxiang Shi, Shuai Sun, and Weihan Liu. 2022. "A Data Fusion Method for Generating Hourly Seamless Land Surface Temperature from Himawari-8 AHI Data" Remote Sensing 14, no. 20: 5170. https://doi.org/10.3390/rs14205170
Note that from the first issue of 2016, this journal uses article numbers instead of page numbers. See further details here.