Article

Detection of Peanut Leaf Spot Disease Based on Leaf-, Plant-, and Field-Scale Hyperspectral Reflectance

1
College of Information and Electrical Engineering, Shenyang Agricultural University, Shenyang 110866, China
2
College of Computer Science and Technology, Inner Mongolia University for Nationalities, Tongliao 028000, China
3
School of Information Science and Engineering, Shenyang Ligong University, Shenyang 110180, China
4
Liaoning Engineering Research Center for Information Technology in Agriculture, Shenyang 110866, China
*
Author to whom correspondence should be addressed.
Remote Sens. 2022, 14(19), 4988; https://doi.org/10.3390/rs14194988
Submission received: 18 August 2022 / Revised: 28 September 2022 / Accepted: 5 October 2022 / Published: 7 October 2022
(This article belongs to the Special Issue Agricultural Applications Using Hyperspectral Data)

Abstract

:
Leaf spot (LS) caused by Cercosporidium personatum is one of the most harmful peanut diseases in the late growth stage and severely affects the yield of peanuts. Hyperspectral disease detection technology is efficient, objective, and accurate and is suitable for large-scale crop management practices. To establish a multi-scale spectral index (SI) with high accuracy and stability for the detection of peanut LS disease, the spectral reflectance of different disease severity levels at leaf, plant, and field scales was collected, and the difference in wavelength caused by disease severity was analyzed using the mean, variance, and dispersion matrix of hyperspectral reflectance. Meanwhile, the feature weights at different scales were obtained using Relief-F, and the average feature weights identified 540, 660, and 770 nm as multi-scale sensitive wavelengths. Three new SIs were constructed by combining single, ratiometric, and normalized wavelengths. The new SIs were compared and analyzed with 35 commonly used SIs by correlation analysis and M-statistic values, and 6 SIs were significantly correlated with disease severity levels and had good separability. Finally, k-nearest neighbor (KNN) and multinomial logistic regression (MLR) were used to evaluate the ability of the above SIs to detect LS severity. The results showed that the leaf spot multi-scale spectral index (LS-MSSI) constructed in this study was superior to the other SIs and obtained high accuracy at different scales simultaneously. At the leaf and plant scales, the MLR obtained high accuracy, with the overall accuracy (OA) reaching 93.77% and 92.50% and Kappa reaching 91.59% and 89.97%, respectively. At the field scale, the KNN obtained high accuracy, with the OA and Kappa reaching 90.29% and 87.04%, respectively. The LS-MSSI proposed in this study has high accuracy, stability, and robustness in the detection of LS severity at multiple scales, providing a technical basis and scientific guidance for the detection and precise management of peanuts.

1. Introduction

The peanut (Arachis hypogaea L.) is an important economic crop and a major source of protein and vegetable oil. Peanuts are widely grown in more than 100 countries worldwide, especially in China, India, Nigeria, and the United States [1]. Climate and environmental changes have continuously expanded the distribution, host range, and influence of peanut diseases, threatening food security and the environment [2,3]. Among them, leaf spot (LS) caused by Cercosporidium personatum is a common peanut disease in the late growth stage. Crops infected with LS show dark brown or black lesions on the leaves. If left uncontrolled, defoliation rates can reach 100% and yield losses of up to 70% [4]. At present, fungicide spraying is a standard measure to control LS. However, the excessive use of fungicides increases the cost of peanut disease management and causes problems such as environmental pollution and threats to food safety [5]. Therefore, precision spraying according to the occurrence of diseases in the field can effectively save economic costs, protect the environment, and ensure food safety [6].
The traditional way to obtain crop disease information in the field is visual investigation. This method requires the relevant expertise of plant protection personnel and has the disadvantages of being highly subjective, inefficient, and lagging. In addition, an enzyme-linked immunosorbent assay (ELISA) and polymerase chain reaction (PCR) based on biochemical technology can accurately detect disease severity. However, the processing of these methods is complex, has high loop-breaking, and is time-consuming [7,8]. Neither of these methods can quickly and accurately obtain information on the severity and spatial distribution of crop diseases, so it is difficult to meet the needs of large-scale scientific monitoring and early detection of crop diseases.
Remote sensing technology is a non-contact, long-distance detection technology that can use electromagnetic radiation or reflection characteristics of objects to detect and identify diseases. It has been one of the most important tools for agricultural monitoring in recent years due to its advantages of being objective, non-destructive, and efficient [9]. Among the different types of remote sensing technology, hyperspectral technology has been widely studied in crop identification [10], biomass estimation [11], pest detection [12], and other aspects. However, since hyperspectral data contain redundant information, many scholars reduce the dimension of data by selecting sensitive wavelengths and constructing a spectral index (SI) to reduce application costs and improve the speed and accuracy of the disease detection model. The authors of [13] collected the hyperspectral reflectance of wheat powdery mildew at the leaf scale, selected sensitive wavelengths using sub-window permutation analysis (SPA), and constructed SI. The authors of [14] collected the leaf-scale hyperspectral reflectance of the late blight, target, and bacterial spot disease of tomatoes at different stages and selected 30 SIs by principal component analysis (PCA). The authors of [15] collected the hyperspectral reflectance of healthy and diseased wheat ears at flowering and filling stages in the laboratory. The sensitive wavelengths were selected using random forest (RF), and a new Fusarium disease index (FDI) was constructed. The above studies used the leaf-scale hyperspectral reflectance collected in the laboratory to establish SIs to detect crop diseases. Leaf-scale hyperspectral reflectance is less susceptible to environmental factors such as light, temperature, and humidity. It can accurately detect the subtle changes in crops affected by diseases, which is suitable for basic research under laboratory conditions. However, the low throughput of the leaf-scale technique makes it unsuitable for practical applications [16].
The hyperspectral reflectance acquired on the ground in the field maintains a high spatial resolution and improves the throughput of measurement to a certain extent. The authors of [17] analyzed the plant-scale hyperspectral reflectance of healthy and infected yellow rust wheat at different stages. The obtained sensitive wavelengths were linearly combined to select the optimal SI of yellow rust at different growth stages of wheat. The authors of [18] used Relief-F and correlation analysis on the plant-scale hyperspectral reflectance of winter wheat powdery mildew to identify the most sensitive wavelengths and generated a new vegetation index based on the normalized difference vegetation index (NDVI) approach. The authors of [19] collected the hyperspectral reflectance of tea anthracnose and used spectral sensitivity to select sensitive wavelengths. The tea anthracnose ratio index (TARI) and tea anthracnose normalization index (TANI) were created using sensitive wavelengths. Due to the short distance from the target crop, the plant-scale hyperspectral reflectance collected in the field could obtain high accuracy and be less affected by the interference of the environment. However, its limited area for detecting crops is not conducive to the large-scale detection of crop diseases.
Compared with leaf-scale and plant-scale techniques, unmanned aerial vehicle (UAV) remote sensing technology is efficient, flexible, and convenient and can be applied to field-scale disease detection. The authors of [20] collected the hyperspectral reflectance of the target spot and bacterial spot of tomato at different stages at leaf and field scales and selected the optimal SI from 35 SIs. The authors of [21] used the leaf-scale and field-scale hyperspectral reflectance to detect powdery mildew with different pumpkin disease levels. The selected sensitive wavelengths and SIs were evaluated at different scales, and the best SIs at different scales for different periods were obtained. The authors of [22] collected leaf-scale hyperspectral reflectance in the laboratory to classify citrus canker disease at different stages using radial basis function (RBF) and k-nearest neighbor (KNN) and validated them at the field scale. The authors of [23] obtained the hyperspectral reflectance of tomato yellow leaf curl, bacterial spot, and target spot at leaf and field scales, respectively. The infected and healthy plants were classified by stepwise discriminant analysis (STDA) and RBF. The hyperspectral reflectance acquired by UAVs is susceptible to factors such as light intensity, incident light angle, and environmental conditions, making the stability of field-scale disease detection models poor.
The studies mentioned above mostly used leaf-scale hyperspectral reflectance to obtain optimal SIs and applied them at the field scale. However, the hyperspectral reflectance at different scales responds to different disease features. For example, leaf-scale hyperspectral reflectance mainly responds to the effect of disease on the biochemical indicators of leaves. However, plant-scale and field-scale hyperspectral reflectance can also respond to the effect of disease on plant canopy structure. Therefore, there are some biases in the transferability and reliability of SIs between different scales, which leads to the ineffective results of leaf-scale SIs in applications to field-scale disease detection [24,25,26]. Therefore, to explore the transferability and reliability of SIs in spans-scale disease detection more comprehensively, the main work of this study is as follows: (1) The hyperspectral reflectance of peanut LS disease at leaf, plant, and field scales was obtained, and the association and difference in spectral response caused by the disease between different scales were explored by data analysis. (2) The sensitive wavelength selection algorithm was used to find the feature weights of each wavelength at different scales, and the multi-scale feature weights were determined by combining the feature weights of different scales. (3) The multi-scale SIs were constructed using the commonly used waveband combination method. (4) The ability of the constructed SIs to detect the LS disease severity was evaluated using different classifiers.

2. Materials and Methods

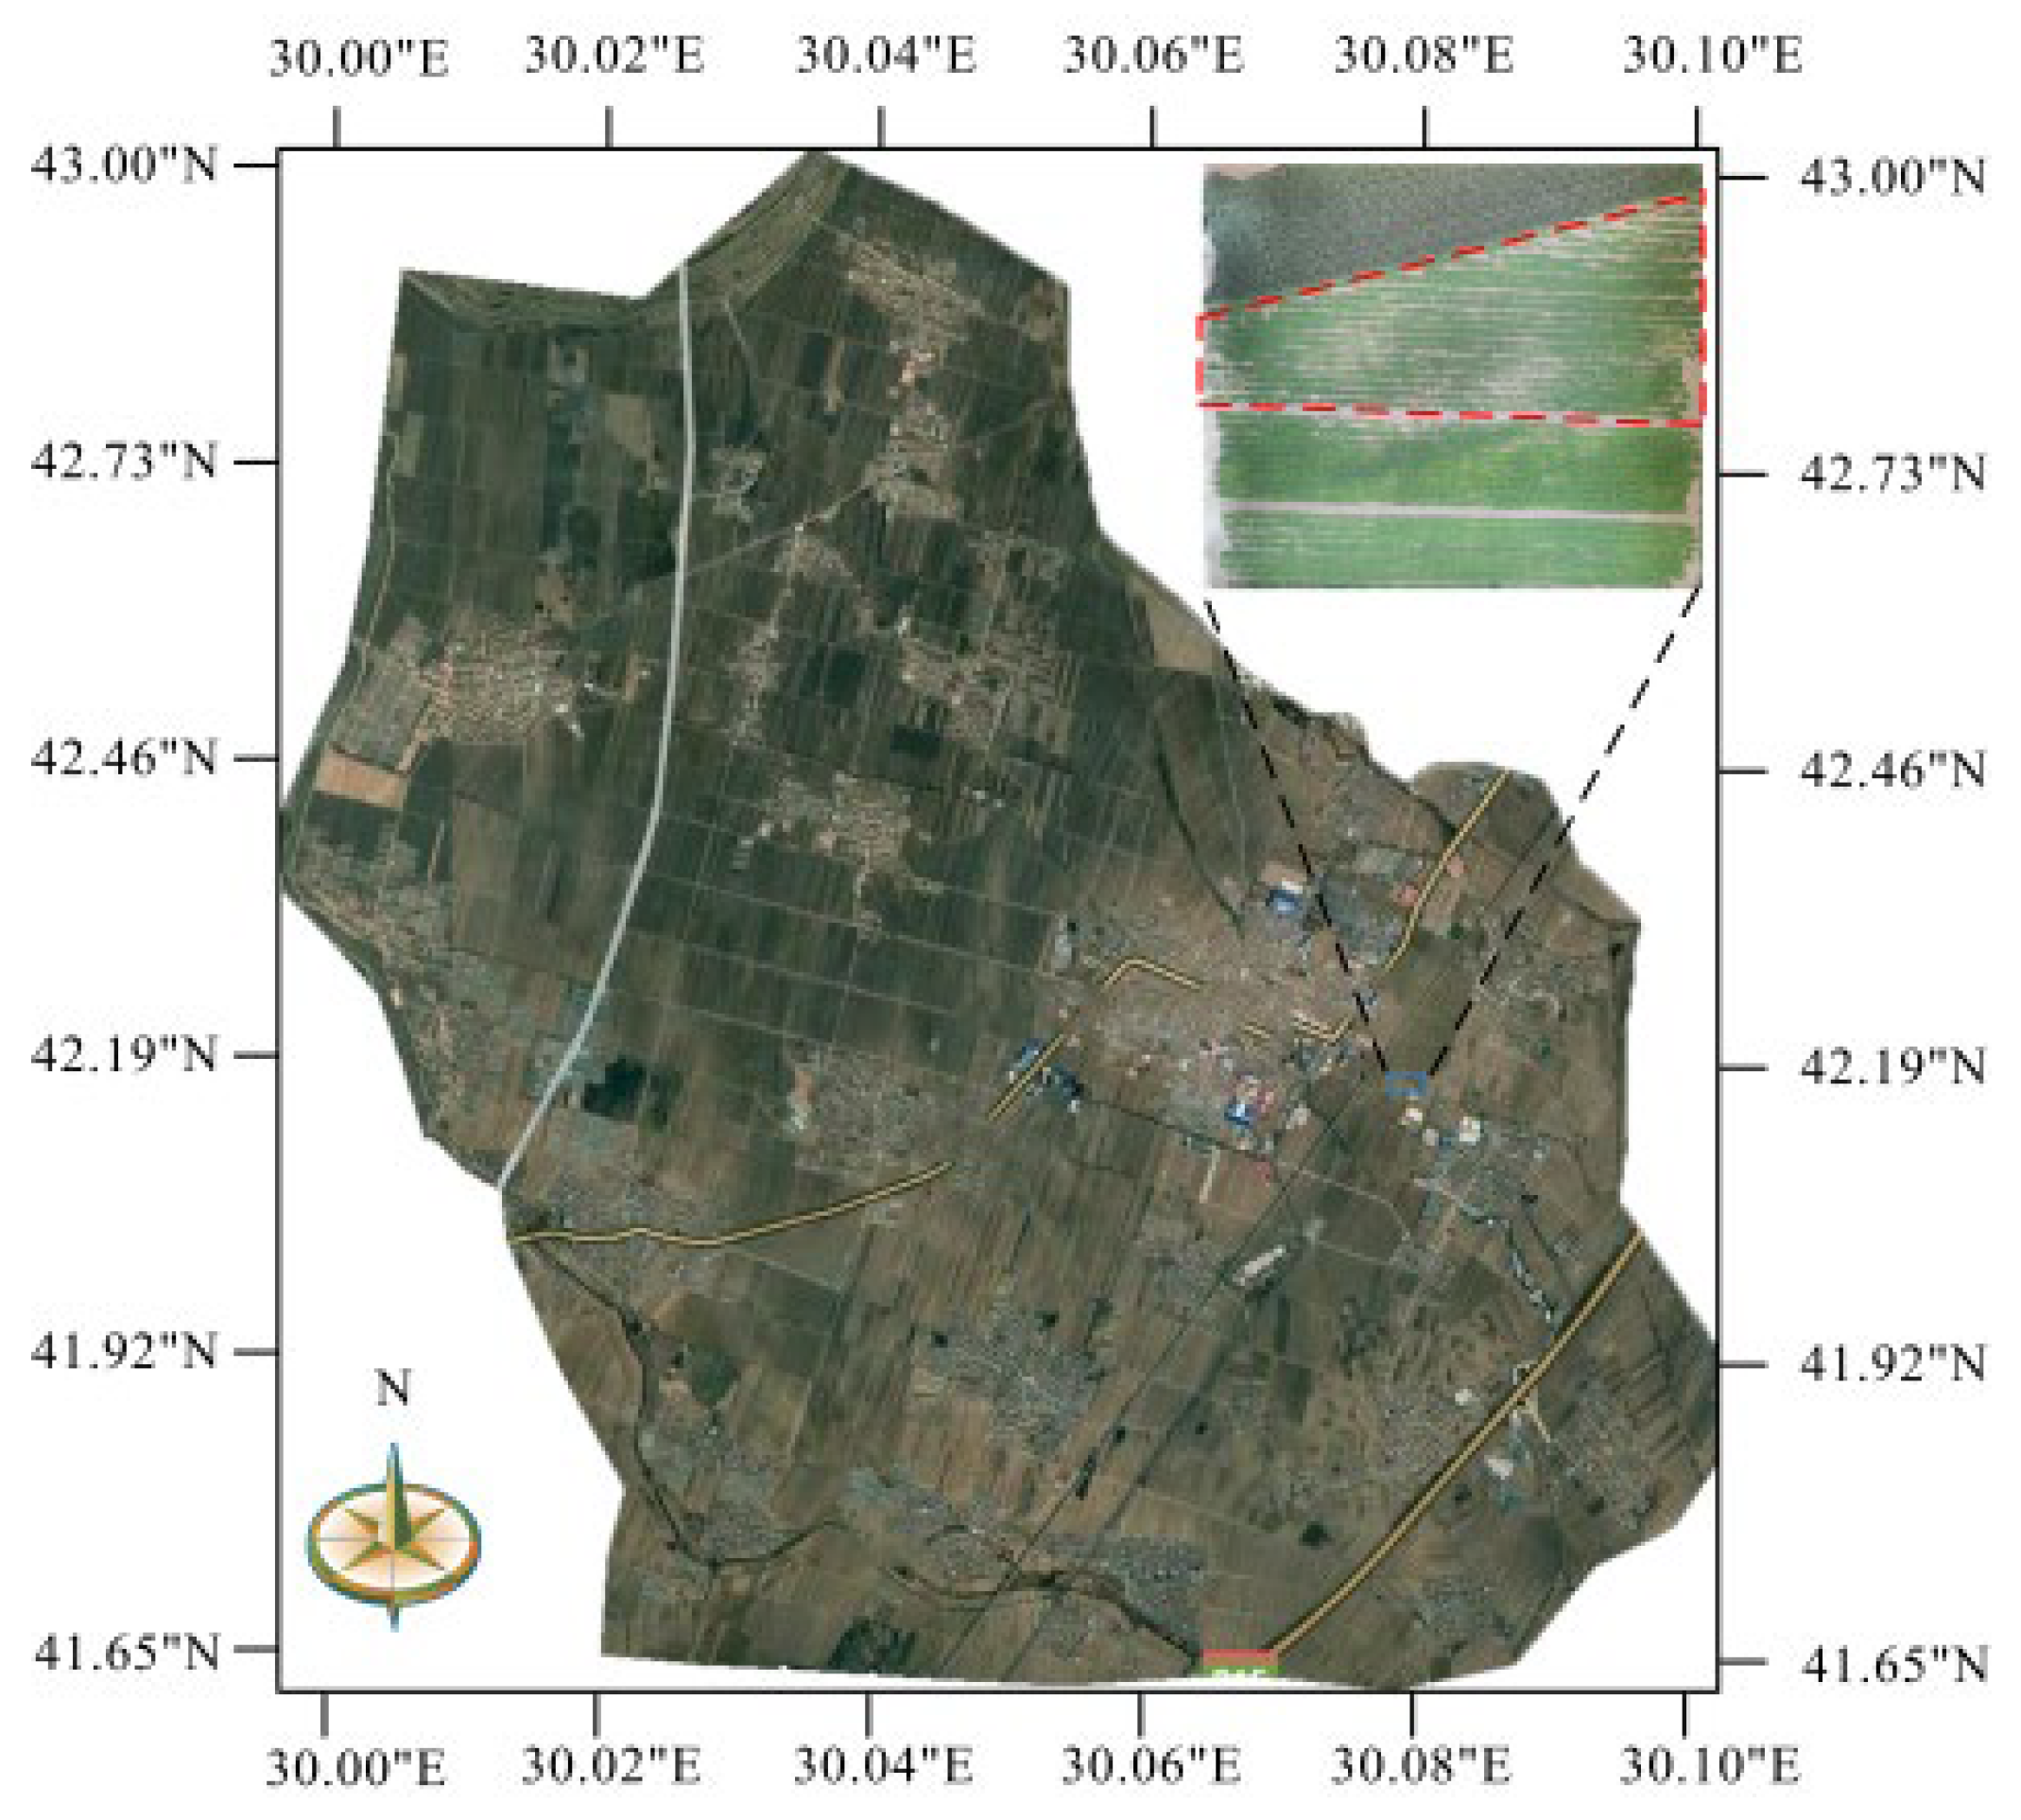
2.1. Overview of the Experiment Site

The experimental site was located at the Haicheng campus of Shenyang Agricultural University, Gengzhuang Town, Anshan City, Liaoning Province, China (N40°58′41.64″-N40°58′43.05″, E122°43′29.29″-E122°43′30.14″, 13 m above sea level), as shown in Figure 1. The peanuts tested were of the LS-susceptible variety ‘Baisha’, the main cultivar in Liaoning. Peanuts were planted on 20 May 2021, with a row spacing of 45 cm and a plant spacing of 35 cm, and the test field area was about 1200 m2. N-P2O5-K2O compound fertilizer of 81 kg ha−1 was applied before sowing. Weeds, pests, and other diseases were controlled according to local agronomic measures. LS occurred naturally throughout the experimental field. Sixty days after emergence, some of the crops in the field were infected with slight disease severity. In mid-August, the crops in the field were infected with different disease severity levels. Therefore, experiments were carried out on 15 August, 19 August, and 23 August.

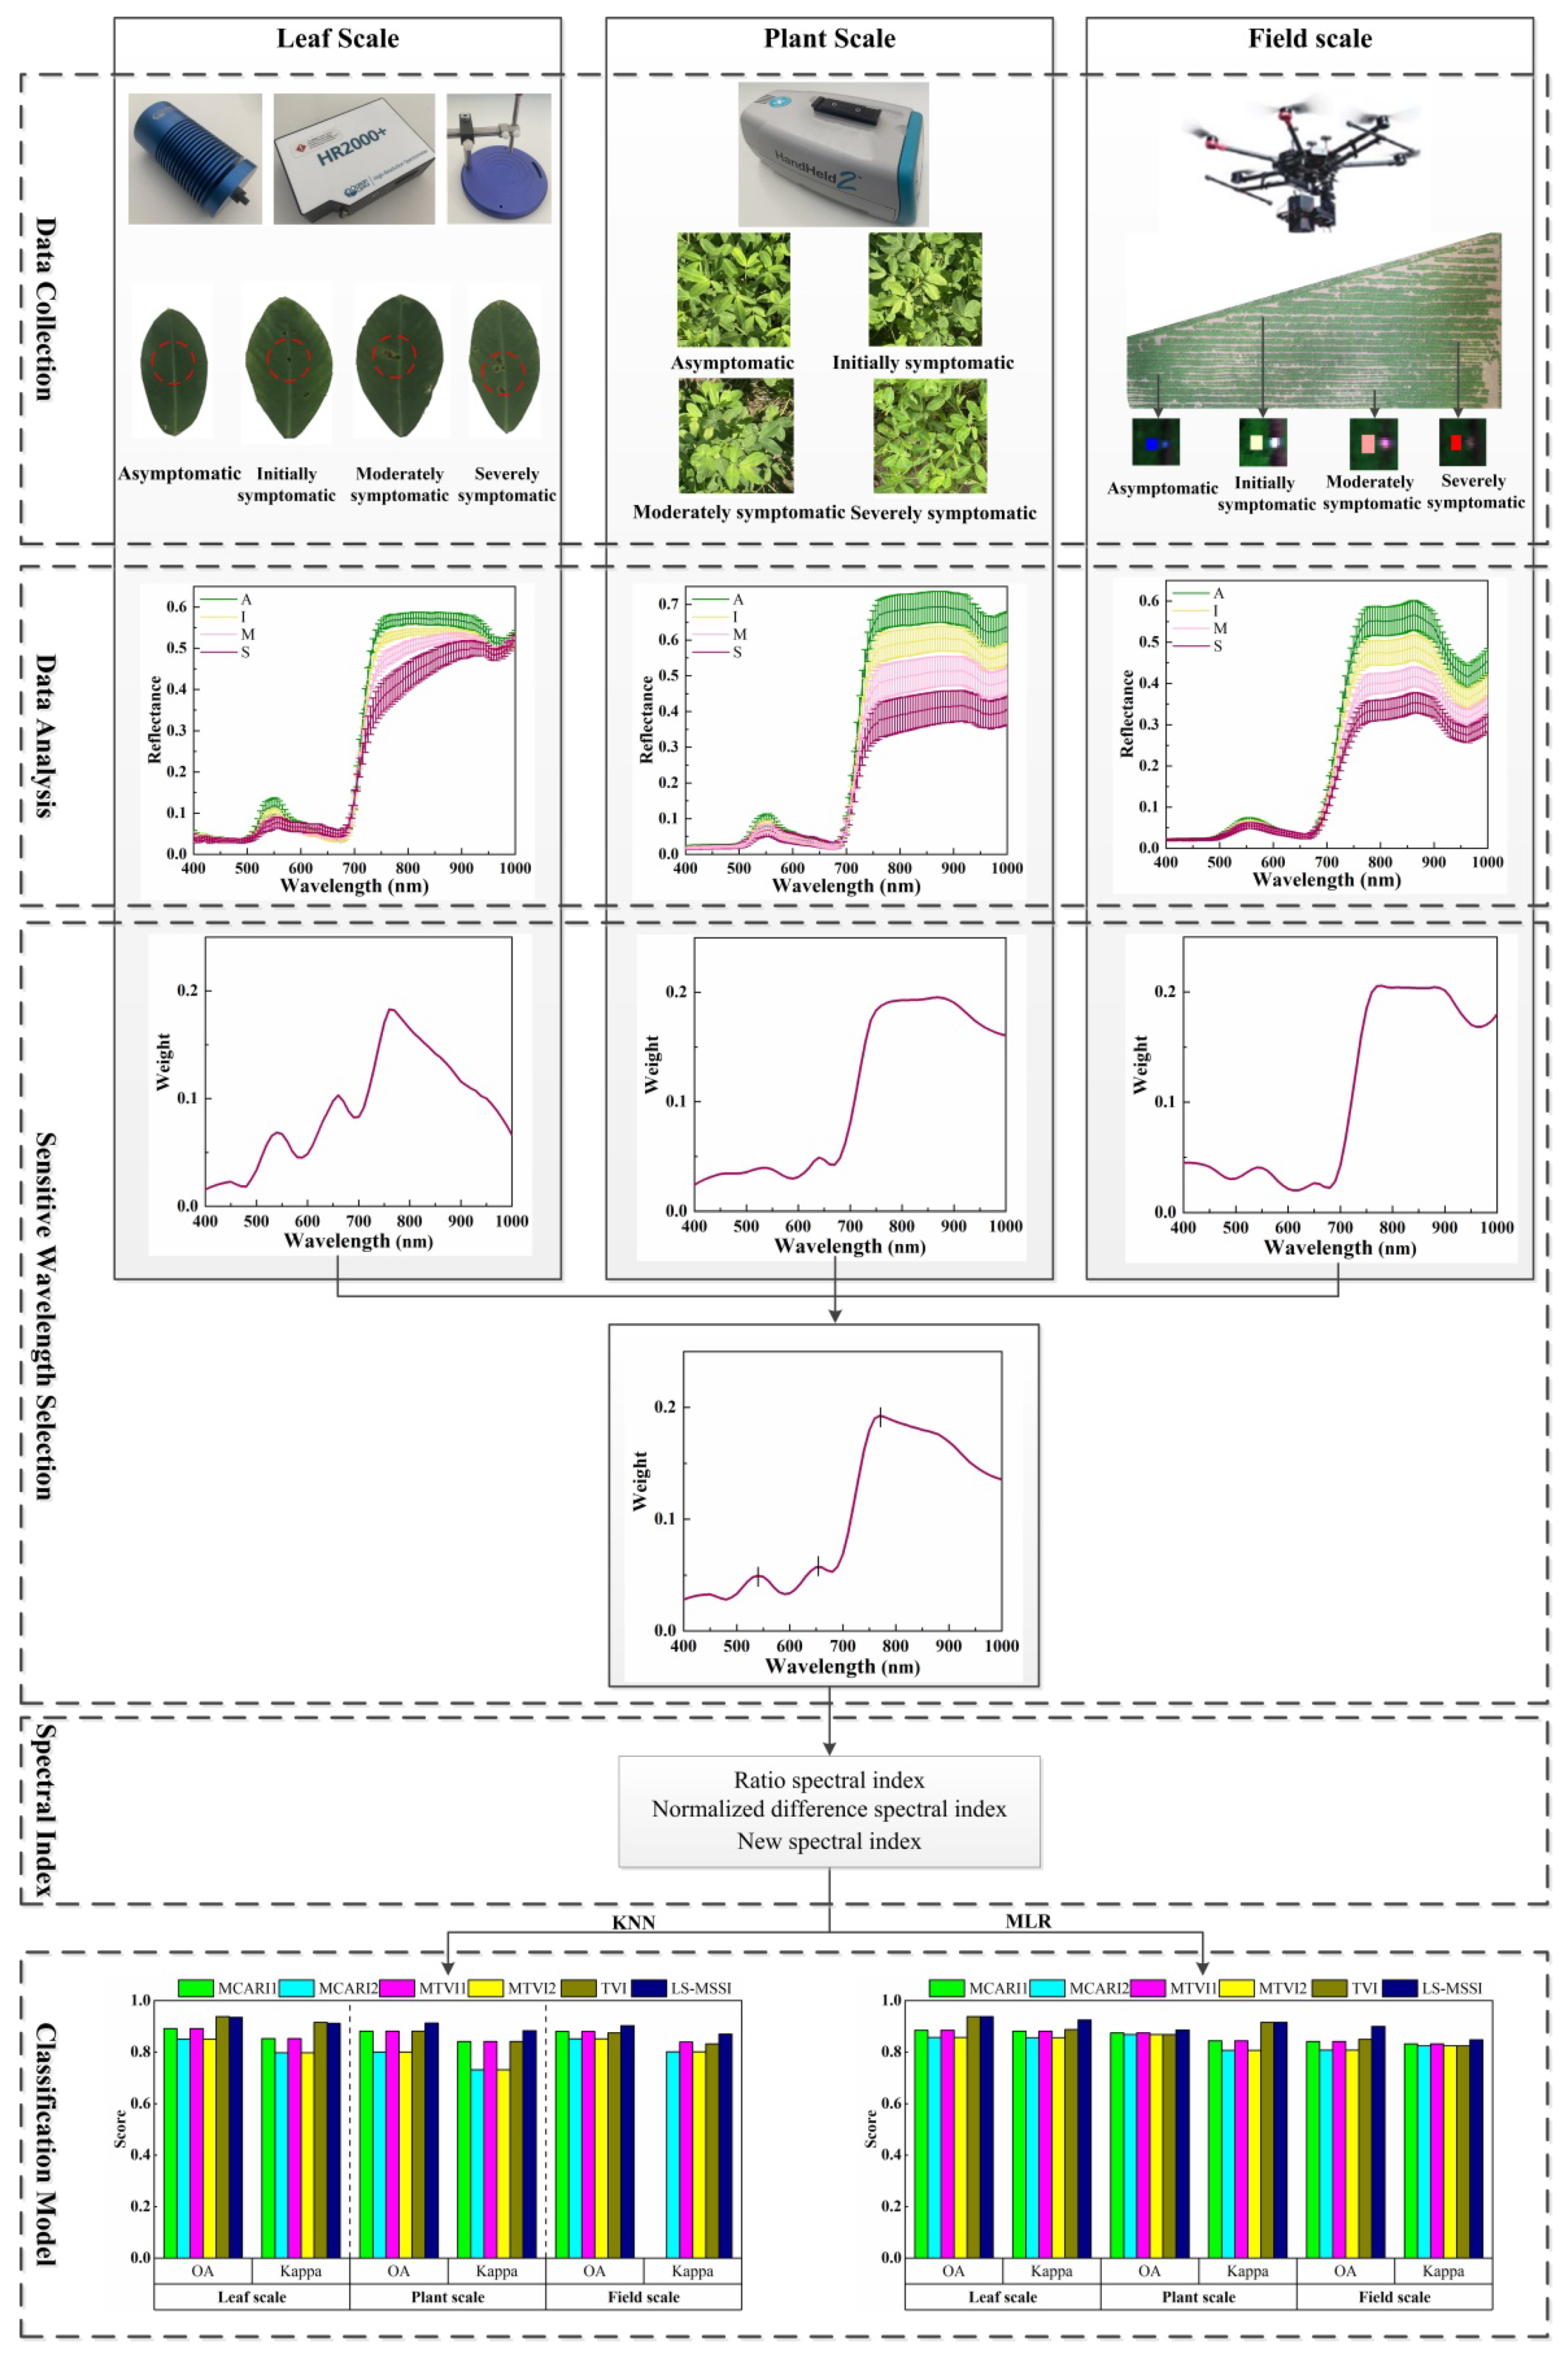
2.2. Data Collection

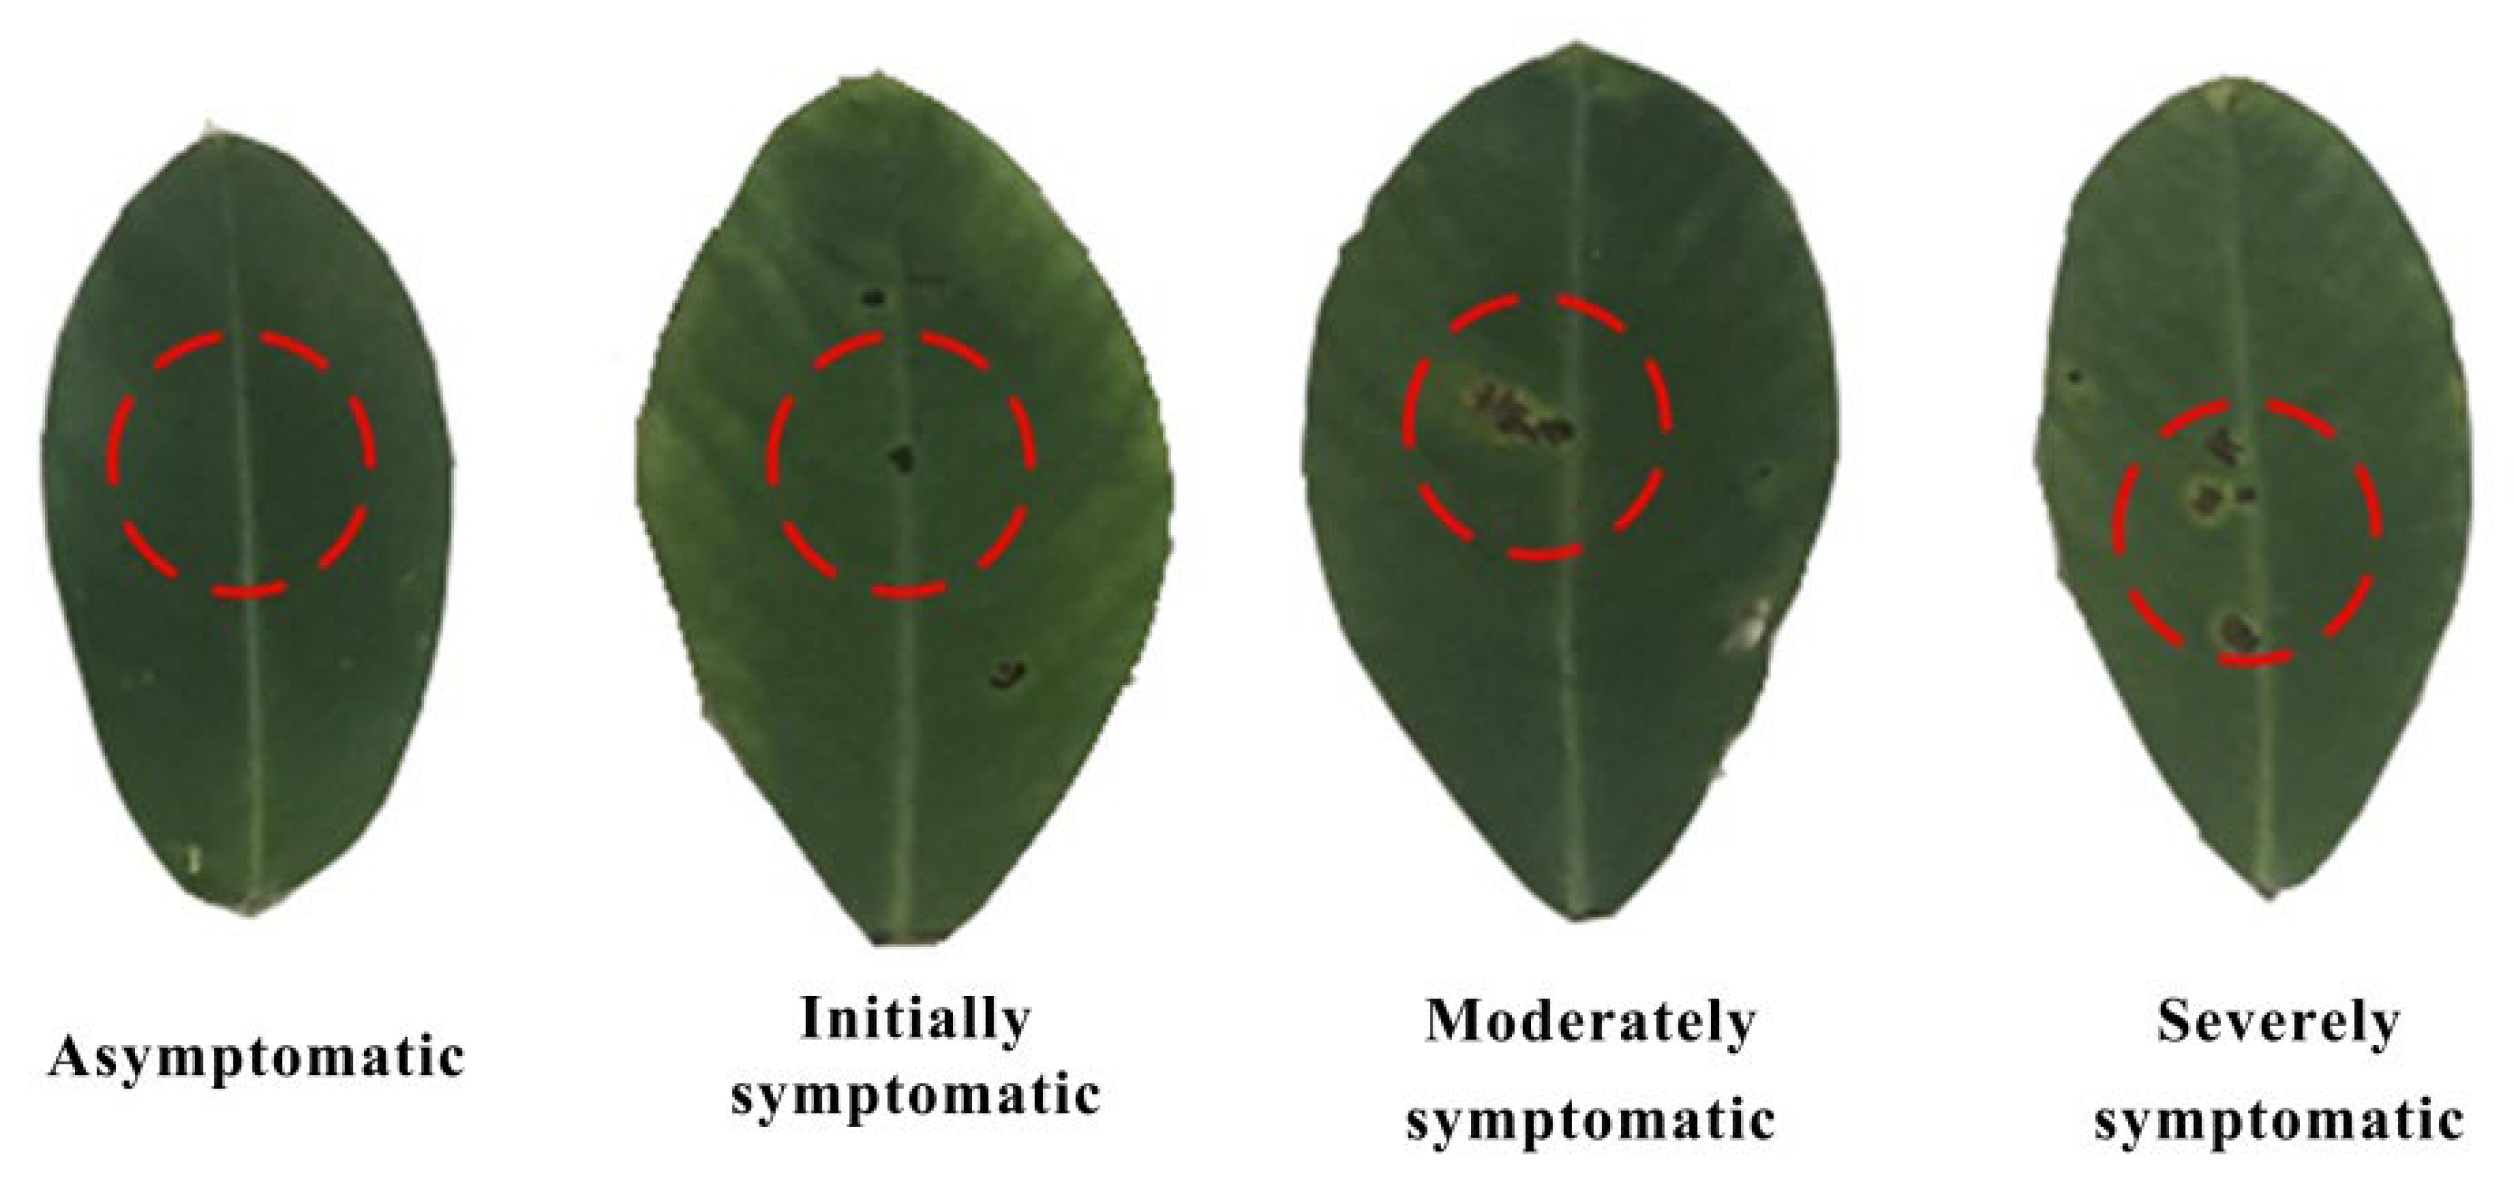
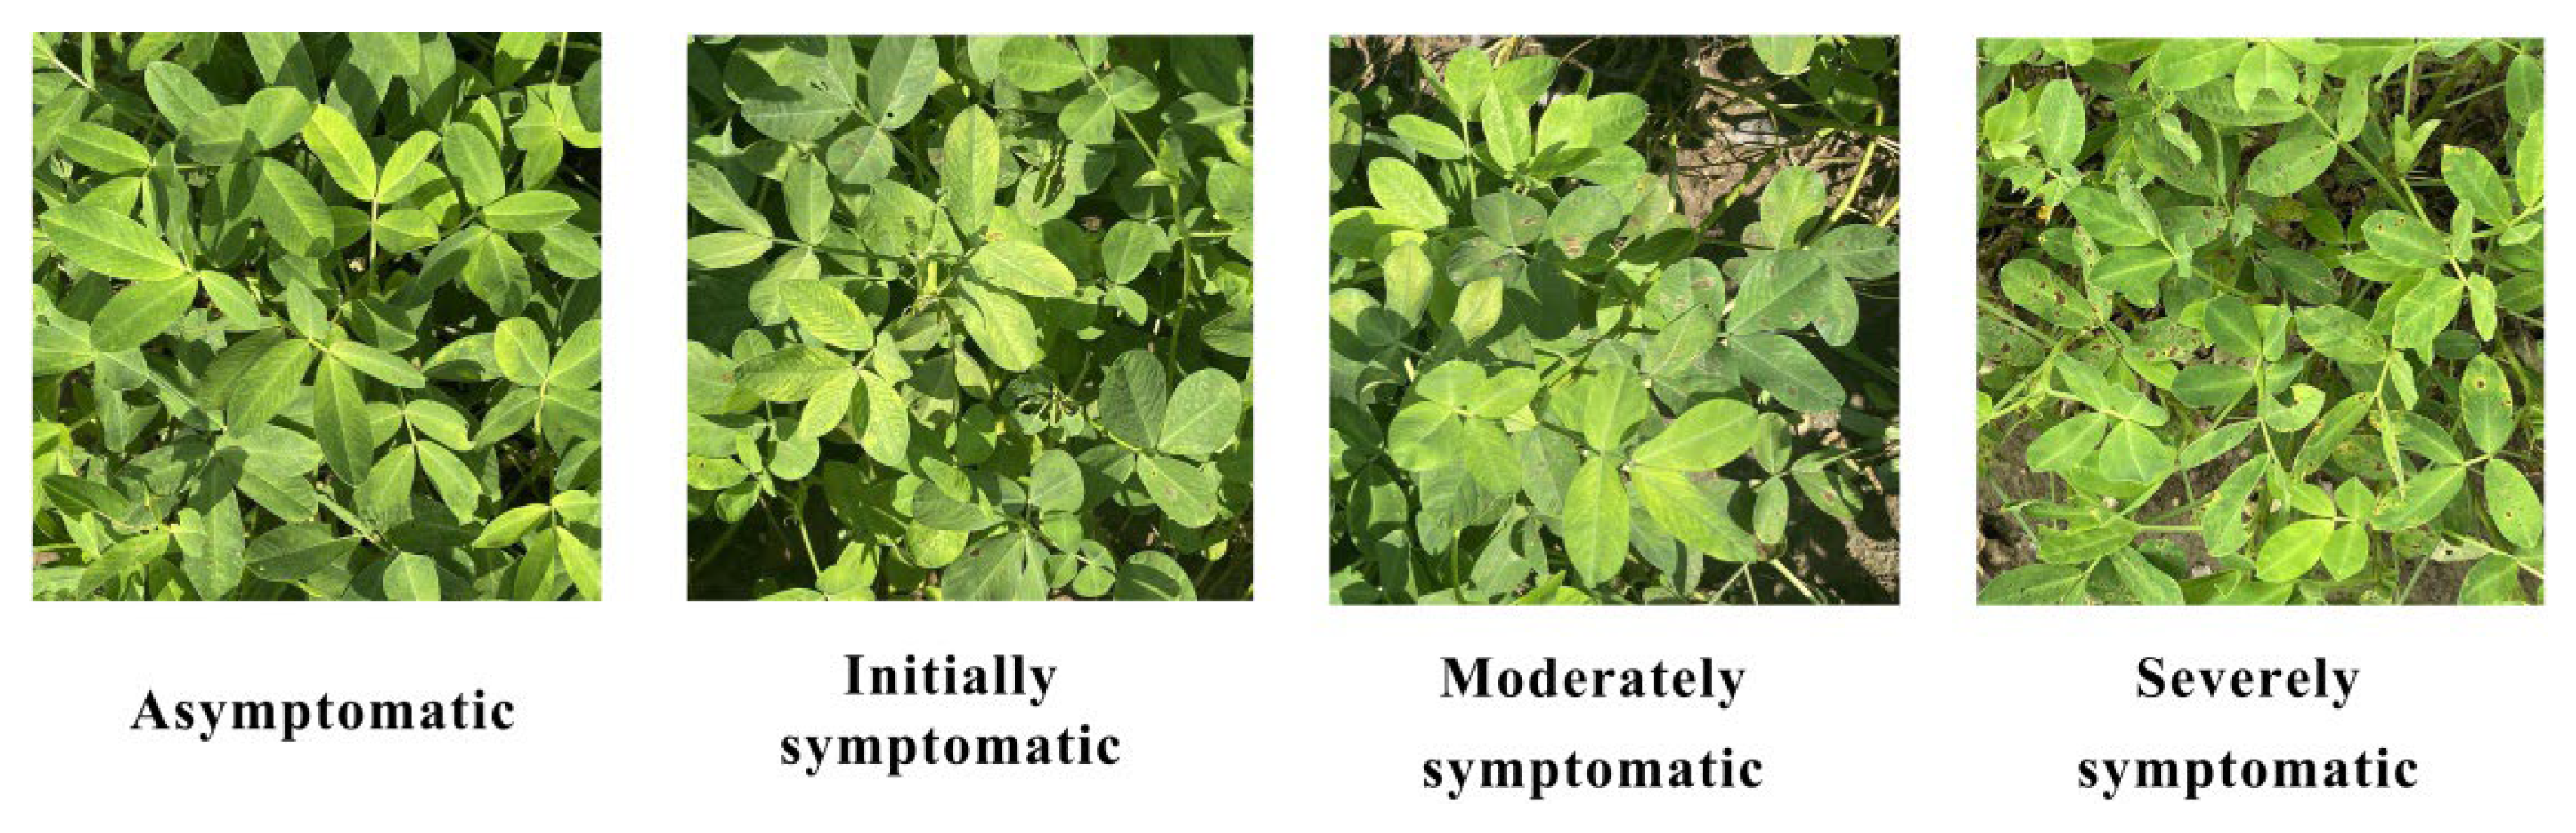
2.2.1. Disease Severity Assessment

On the leaf scale, disease severity is mainly based on the percentage of the total area of disease symptoms on the leaves [27,28]. According to the Technical Regulations for Identification of Peanut Varieties Resistant to Leaf Spot Disease (DB21/T 3074–2018), LS was classified into six severity levels. Since detecting disease severity at mid-growth is a critical period for effective control of disease development, the experiment was conducted at the mid-growth stage. However, the disease at mid-growth did not develop to an extremely severe level, and level 5 and level 6 diseases were not detected at mid-growth. Therefore, LS leaves with four different severity levels, asymptomatic, initially symptomatic, moderately symptomatic, and severely symptomatic, were collected according to the actual disease occurrence in the field, as shown in Table 1. In addition, since peanut leaf spot disease occurs naturally throughout the test field, detecting infected but asymptomatic samples in the field is very difficult. Therefore, this study defined all samples without disease spots on the leaves as the asymptomatic level (no distinction between healthy and infected but asymptomatic).
At the plant and field scales, disease severity is determined by the disease index (DI) [29]. DI is calculated as follows.
DI = 0   ×   n 0   +   1   ×   n 1   +   2   ×   n 2   +   3   ×   n 3 3   ×   ( n 0   +   n 1   +   n 2 )
where n 0 is the number of asymptomatic leaves, n 1 is the number of initially symptomatic leaves, n 2 is the number of moderately symptomatic leaves, and n 3 is the number of severely symptomatic leaves. Therefore, disease severity levels are defined at the plant and field scales. A: asymptomatic ( DI = 0 ) , I: initially symptomatic ( 0   <   DI     0 . 1 ) , M: moderately symptomatic ( 0 . 1   <   DI     0 . 25 ) , S: severely symptomatic ( 0 . 25   <   DI     0 . 5 ) .

2.2.2. Leaf-Scale Spectral Collection

The HR2000+ high-resolution spectrometer from Azumi Optical Instruments (Shanghai) Co., Ltd., was used to equip a reflection sensor, and an HL-2000 tungsten halogen lamp light source was used to obtain the hyperspectral reflectance of leaves with different disease severity levels. Six fiber legs in the reflection probe are connected to the light source, and the other fiber leg is connected to the spectrometer to achieve optimal performance. The receiving angle of the probe is 24.8°. Before measurement, the holder held the probe at a distance of 3 cm above the leaf, and the reflectance collected was the average reflectance of a circular area with a diameter of 1.3 cm. Before each measurement, the spectrometer was calibrated with a diffuse reflection reference plate. During the measurement, the reflectance of the area was measured 10 times, and the average was the absolute hyperspectral reflectance of the area. The range of the hyperspectral wavelengths was 190–1100 nm, and the spectral resolution was 1 nm (full width at half maximum, FWHM). Because of the noise between 190 and 400 nm and between 1000 and 1100 nm, the hyperspectral reflectance between 400 and 1000 nm was considered in this study. Figure 2 shows the leaves with different disease severity levels.

2.2.3. Plant-Scale Spectral Collection

The FieldSpec HandHeld 2 was used to obtain hyperspectral reflectance of the crop with different disease severity levels at the plant scale. The device has an effective wavelength range of 325–1075 nm, a spectral resolution of 3 nm (FWHM), and a field of view of 25°. Due to noise effects at both ends of the spectral range, the hyperspectral reflectance between 400 and 1000 nm was considered in this study. Measurements were conducted from 10:00 to 14:00 (Beijing time) on sunny days. Data were collected with the spectrometer probe at a distance of 0.5 m from the crop canopy, and the regions of interest (ROIs) collected were approximately 0.17 m2. Panel radiation measurements were used to optimize and calibrate the instrument before each measurement. Ten repeated measurements were performed over the same region, and their average was calculated as the absolute hyperspectral reflectance of the ROI. Figure 3 shows the canopy images with different disease severity levels at the plant scale.

2.2.4. Field-Scale Spectral Collection

The UAV Matrice 600 was selected as the remote sensing platform to obtain the field-scale hyperspectral reflectance. The remote sensing platform was equipped with GaiaSky-mini hyperspectral imager with a spectral range of 400–1000 nm and a resolution of 3.5 nm (FWHM). The UAV was flown at an altitude of 100 m and hovered to acquire data. The acquired hyperspectral images were pre-processed with SpectralView software for lens calibration, reflectivity calibration, and atmospheric calibration. Hyperspectral reflectance was extracted from the pre-processed hyperspectral images using ENVI 5.3 software. ROIs were generated on the marked disease-level plants. The average of all pixels in the ROI was considered the absolute hyperspectral reflectance. Figure 4 shows the hyperspectral image at the field scale and a selected ROI. The leaf-scale and plant-scale spectral reflectance used in this study were automatically adjusted to a sampling interval of 1 nm on the device. At the field scale, the effect of the environment was reduced by increasing the sampling interval when collecting hyperspectral data. The sampling interval was adjusted to 1 nm during the pre-processing process. However, the errors caused by interpolation at the field scale are acceptable, and their effects are much smaller than those caused by the environment. In this study, the hyperspectral reflectance at different scales was uniformly adjusted to a sampling interval of 1 nm, allowing for a more accurate exploration of correlations and differences between wavelengths at different scales and more extensive validation and practical validation applications.
In this study, by excluding the hyperspectral data under the influence of noise, a total of 1071 spectral reflectances with different disease severity levels were collected at the leaf scale, 534 spectral reflectances with different disease severity levels were collected at the plant scale, and a total of 586 ROIs with different disease severity levels were selected from the hyperspectral images. The number of samples with different disease severity levels at the three scales is shown in Table 2.

2.3. Sensitive Wavelength Selection

Relief is a feature selection algorithm that can determine the feature weights of wavelengths [30]. Relief is widely used because of its simplicity, high operational efficiency, and satisfactory results, but it can only handle two data classes. The authors of [31] extended it and created Relief-F, which can handle multi-class problems. In this study, Relief-F was used to obtain the feature weights of wavelengths at different scales. Due to the high correlation between adjacent wavelengths of the hyperspectral reflectance, the wavelengths corresponding to the peaks of the feature weights in the local range were identified as sensitive wavelengths in this study.

2.4. SI Construction

In the field, the simple use of high spectral reflectance is not conducive to accurate and repeatable disease detection because solar irradiance varies with time and weather. Therefore, many scholars used a combination of wavelengths to avoid the negative effects of being susceptible to interference from environmental factors. This approach is called SI. In this study, the selected sensitive wavelengths were used to construct the SIs in the form of Table 3.
Plant diseases can cause changes in chlorophyll content, water stress, and cell structure, and the changes caused by diseases can be evaluated by visible and near-infrared (NIR) bands [34,35]. Therefore, 35 commonly used and 3 new SIs were selected to detect the LS severity, as shown in Table 4.

2.5. Classification Methods

2.5.1. KNN

KNN applies to classification tasks in a supervised learning environment and is one of the most classical machine learning algorithms [58]. The main idea of KNN is to determine the category to which one belongs based on the category of neighbors that are close to each other. The algorithm first calculates the distance between the test samples and all samples in the training dataset. Secondly, the nearest K samples in the distance are found as the neighbors of the test sample. Finally, the category with the highest frequency among the K samples is the category to which the test sample belongs. KNN is efficient and easy to implement without estimating parameters and training.

2.5.2. Multinomial Logistic Regression

Multinomial logistic regression (MLR) is the extension for the (binary) logistic regression when the categorical dependent outcome has more than two levels [59]. The main idea of MLR is to use the activation function to predict the probability of the dependent variable (category) by the linear combination of independent variables (features) and corresponding parameters. Among them, the parameters corresponding to the independent variables are calculated by the training dataset, and these parameters become regression coefficients. In this study, the softmax function was used as the activation function, and the log-likelihood loss function was used as the loss function. The iterative weighted least square was used to find the optimal regression coefficient.

2.6. Flow of the Study

In this study, the hyperspectral reflectance of peanut LS disease with varying severity at the leaf, plant, and field scales was obtained. The multi-scale SIs for detecting the severity of peanut LS disease were determined by data analysis, feature weight calculation, sensitive band selection, and spectral index construction. The ability of the SIs to detect the severity of peanut LS disease was evaluated using KNN and MLR classifiers. The specific process is shown in Figure 5.

3. Evaluation Indicators

3.1. Evaluation Indicators of Wavelength

Mean and variance were used to evaluate the difference in wavelengths qualitatively. The mean of the spectra assesses the overall features of the spectral reflectance with different disease severity levels. The variance assesses the consistency of spectral reflectance for the same disease severity level and the difference in spectral reflectance between different disease severity levels.
The dispersion matrix was used to evaluate the separability of the wavelengths quantitatively. The dispersion matrix is a favorable indicator of separability evaluated in linear discriminant analysis (LDA). According to [60], the overall dispersion matrix is defined as follows:
S T = i = 1 C n i m i μ m i μ T + i = 1 C x C i x m i x m i T
where C is the total number of classes, n i is the number of samples in class i , m i is the mean of class i , and μ is the mean of the overall sample.

3.2. Evaluation Indicators of SI

The M-statistic values were used to evaluate the separation of SI to distinguish between different disease levels [61]. The M-statistic value was normalized to the difference between the means of the two categories by the sum of their standard deviations. M < 1 . 0 means poor separation, M > 1 . 0 means good separation, and a larger M-statistic value means better separation [62]. The M-statistic value is defined as follows:
M = Mean α Mean β σ α + σ β
where α and β represent different categories.
Overall accuracy (OA) and Kappa coefficients were used to evaluate the ability of SI to detect disease severity. All of these indicators can be calculated based on true positives (TP), true negatives (TN), false positives (FP), and false negatives (FN), as shown in Table 5. The specific formulas for OA and Kappa are as follows.
OA = TP + TN TP + TN + FP + FN
p e = i = 1 C TP i + FN i + TP i + FP i N 2
Kappa = OA p e 1 p e
where N is the total number of samples.

4. Results

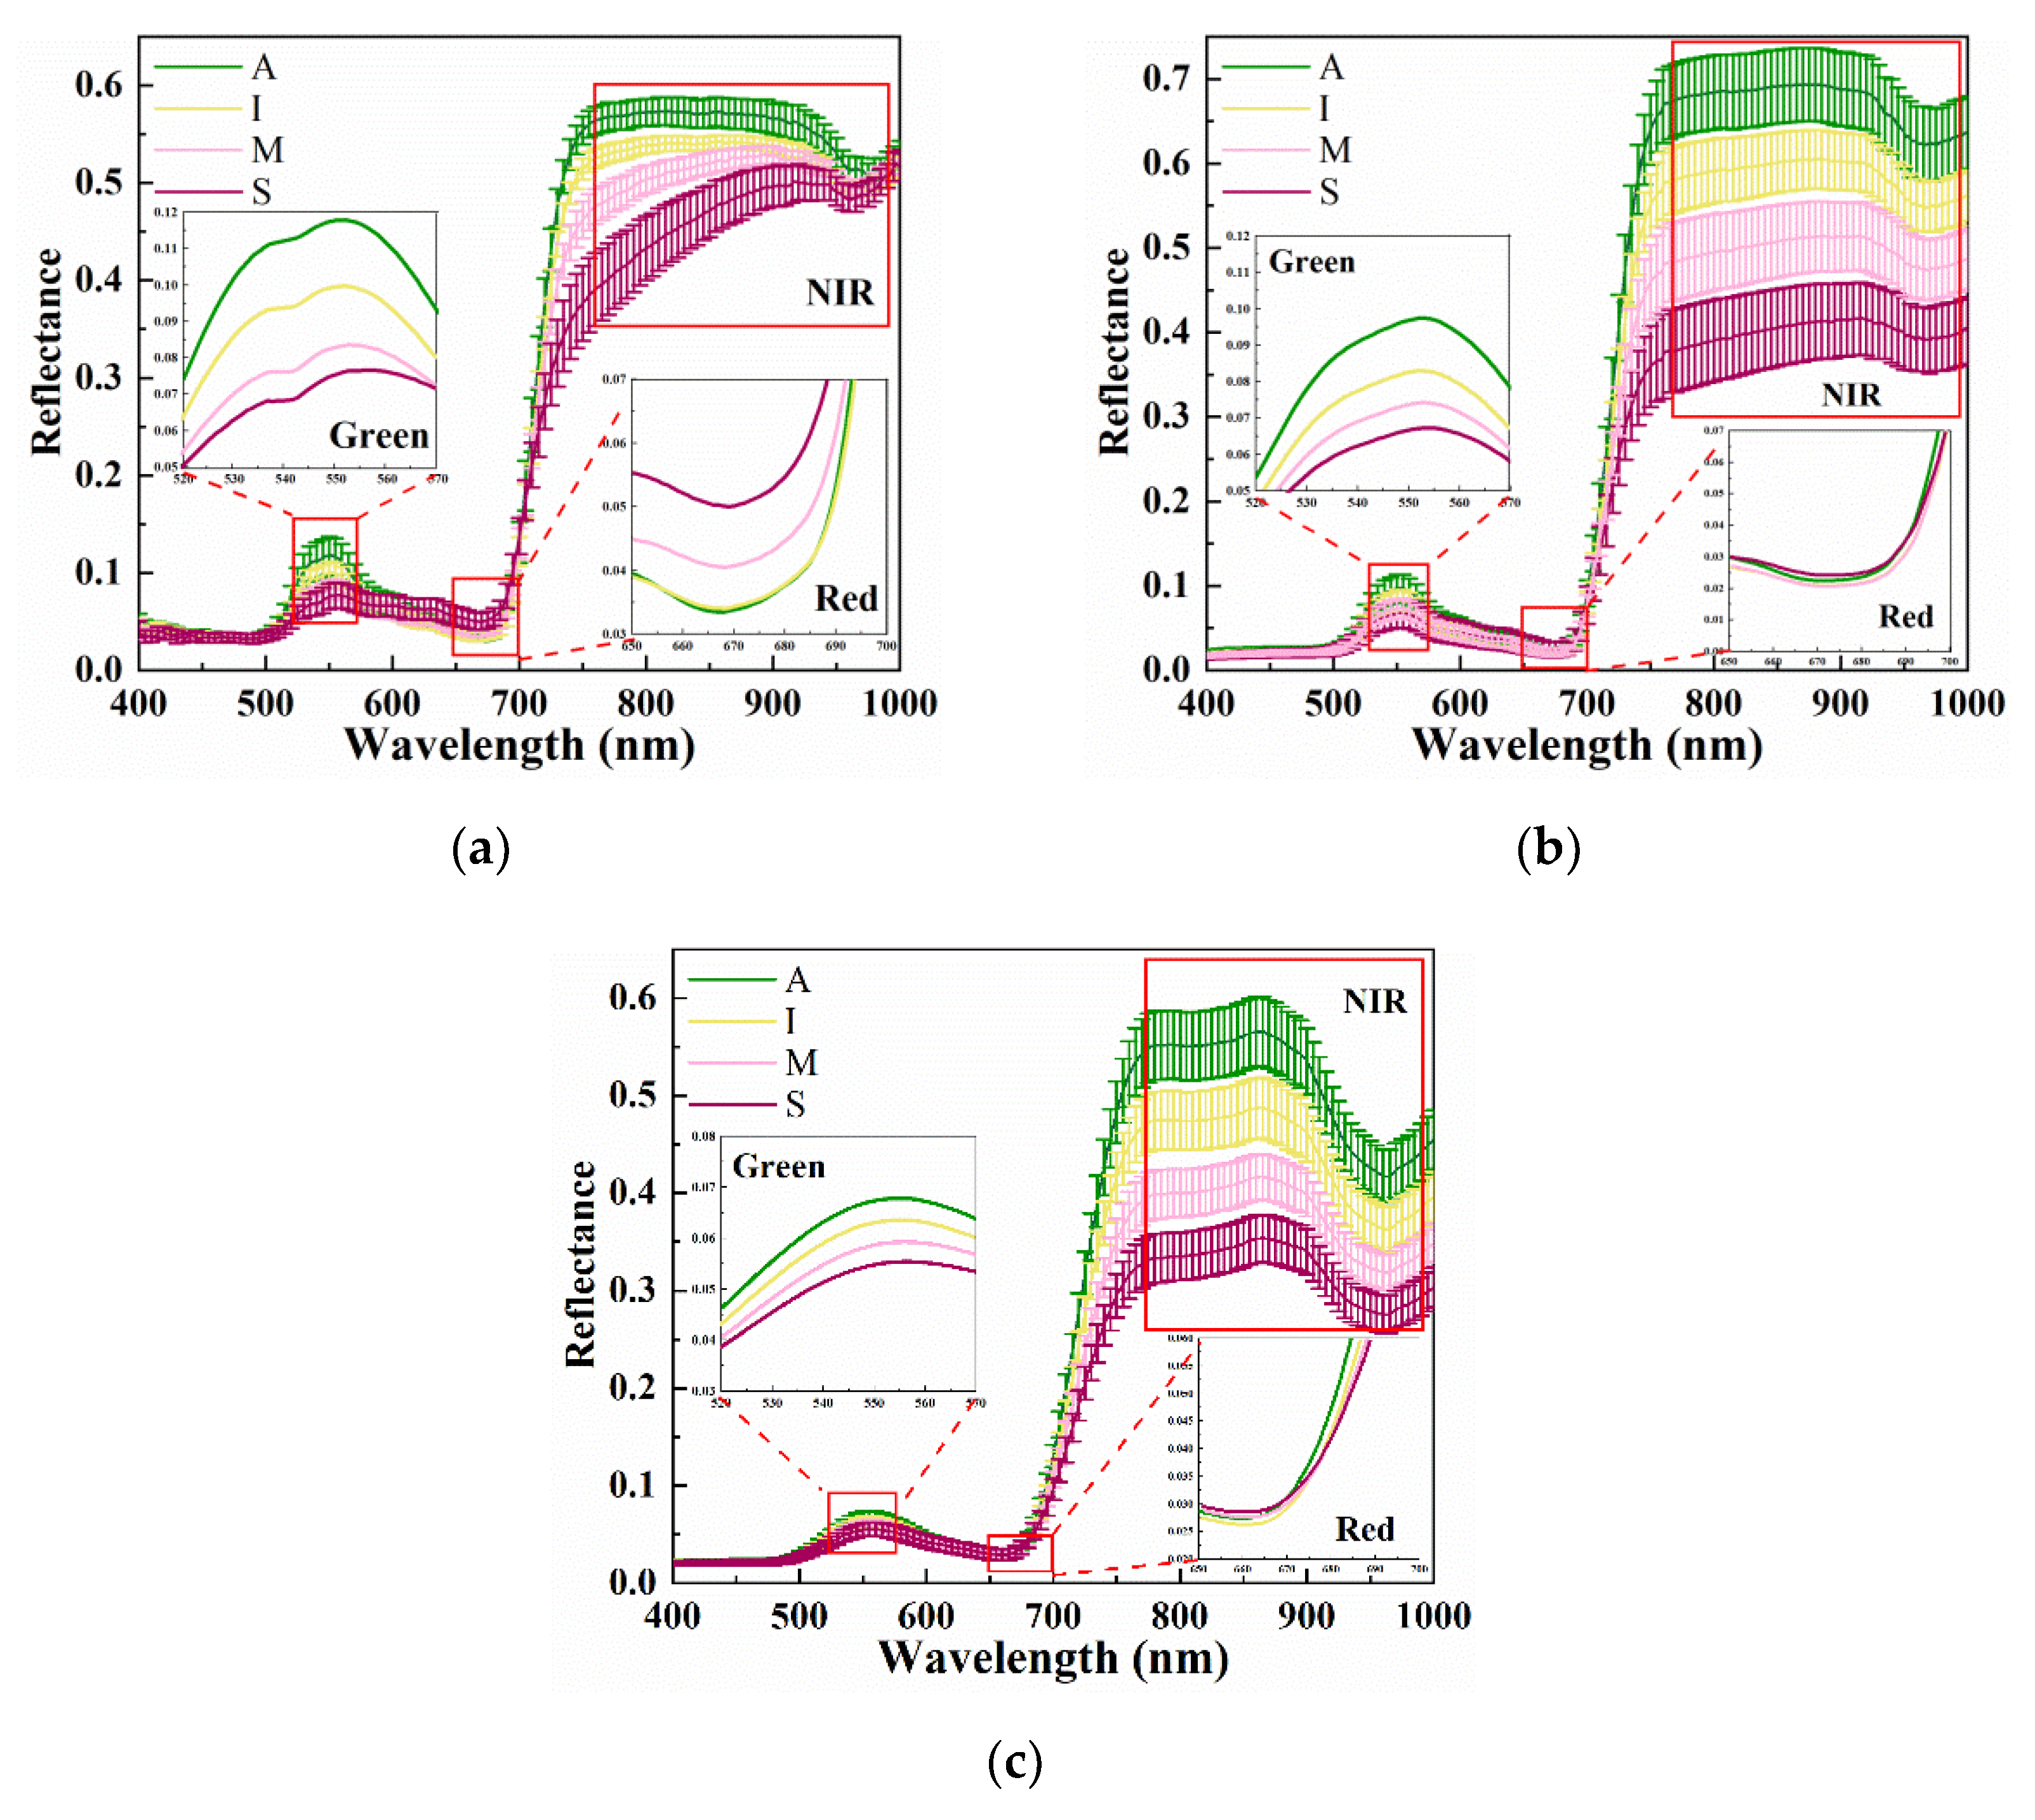
4.1. Multi-Scale Spectral Features

Figure 6 shows the mean and variance of spectral reflectance with different disease severity levels at multiple scales. The absorption of photosynthetic pigments was higher in the visible range, and the peak appeared at 520–570 nm (green band). At 650–760 nm (red band), it reached the trough. At 670–760 nm (red edge band), the reflectance gradually increased to a peak and remained at a high value at 760–900 nm (NIR band).
Figure 6a shows the leaf-scale spectral reflectance with different disease severity levels. At 520–570 nm, asymptomatic leaves had the highest reflectance. The reflectance decreased as the disease severity levels increased. At 650–670 nm, the reflectance of asymptomatic leaves was the smallest, and the reflectance increased slightly with the increase in disease severity levels; at 670–760nm, the reflectance increased differently for each disease severity level, resulting in a blue shift of the ‘red edge’ of the reflectance. At 760–1000nm, the highest reflectance was found in asymptomatic leaves, and the reflectance gradually decreased with the increase in disease severity levels. Meanwhile, the difference in the reflectance between different disease severity levels decreased with the increase in wavelength. Figure 6b shows the plant-scale spectral reflectance with different disease severity levels. At 520–570 nm, there were differences in reflectance between different disease severity levels. At 750–1000 nm, the difference in reflectance between different disease severity levels was larger. Figure 6c shows the field-scale spectral reflectance with different disease severity levels. A weak difference was shown in the green band between the different disease severity levels. At 750–1000 nm, there was a large variation in reflectance between different disease severity levels, similar to the plant scale.

4.2. Multi-Scale Spectral Separability

The separability of the wavelength was quantitatively evaluated by dispersion. Figure 7 shows the dispersion of all wavelengths at different scales. The dispersion was normalized to compare the relative importance of the separations, with ‘1’ representing the best separation and ‘0’ representing the worst separation. At the leaf scale, a large dispersion value appeared at 720–780 nm, where the maximum value was reached at 750 nm. At the same time, a local extreme value was observed at 546 nm, with a certain separability in the green band. At the plant scale, a high separability was obtained at 730–950 nm, with the highest value at 760 nm. Meanwhile, a local extreme value was also obtained at 553 nm, but the relative dispersion value here was smaller than that at the leaf scale. At the field scale, a high separability was obtained at 750–900 nm, with the highest value at 780 nm. From the above results, it can be seen that the separability of the green band gradually decreased and that of the NIR band gradually increased as the spatial resolution decreased, which is consistent with the results of the qualitative evaluation analysis in Section 4.1.

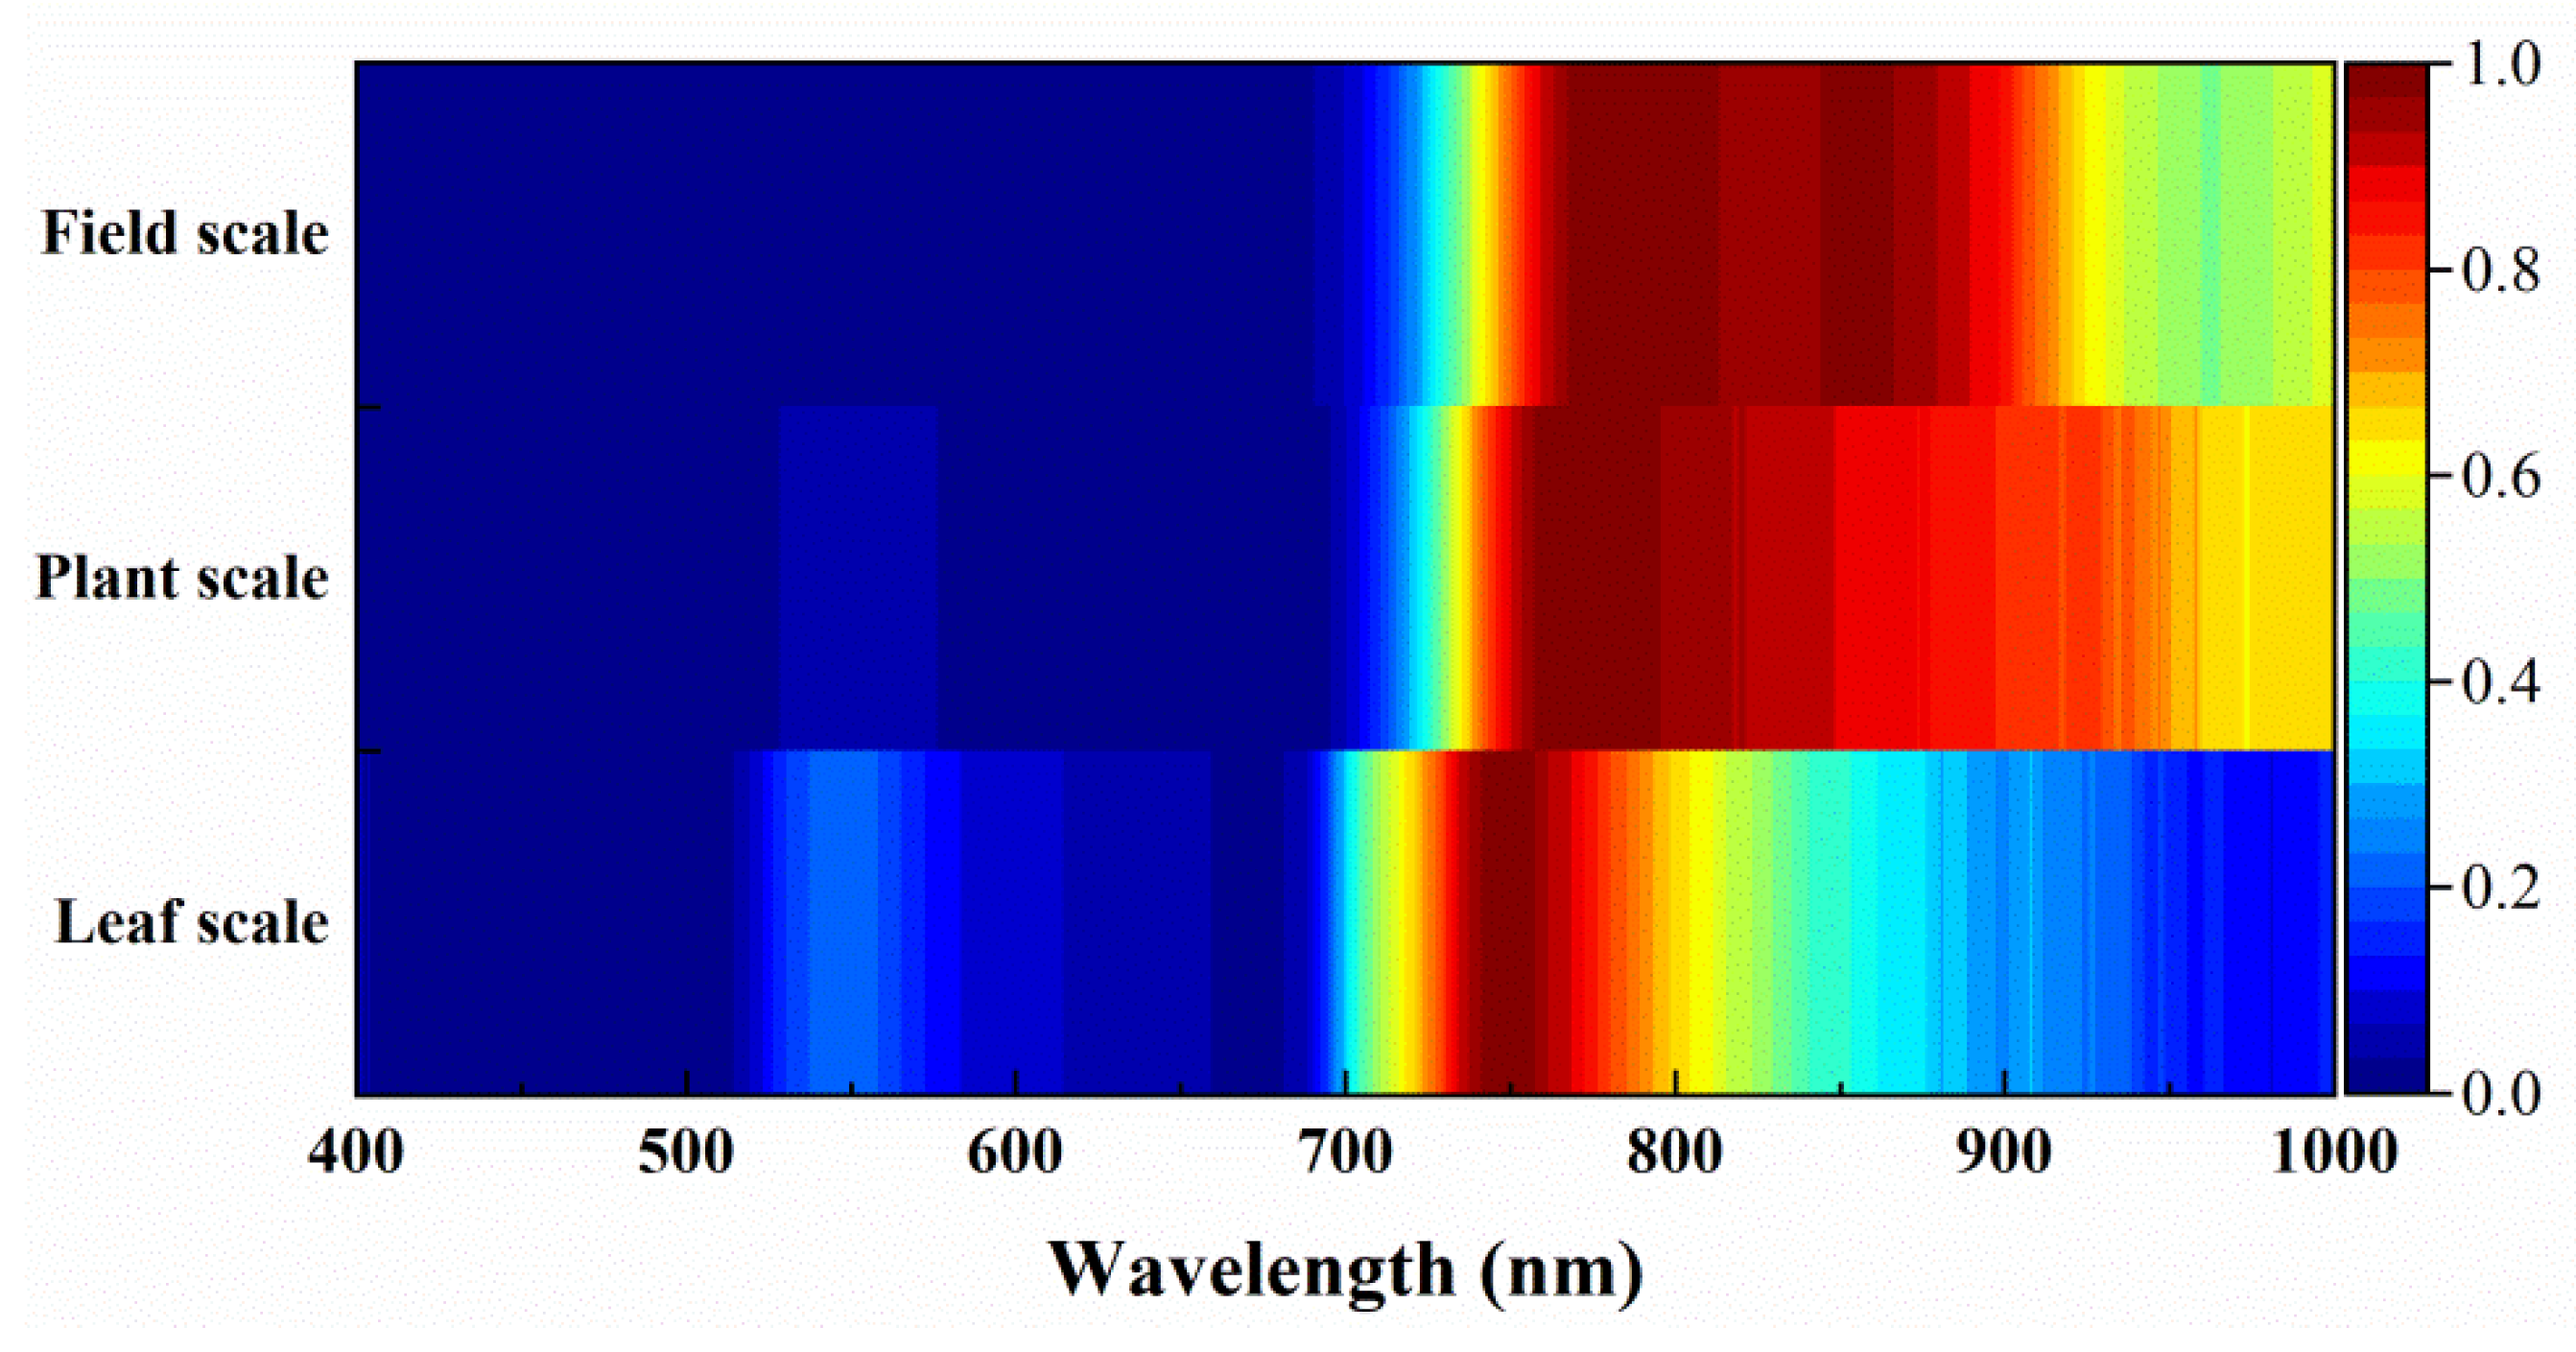
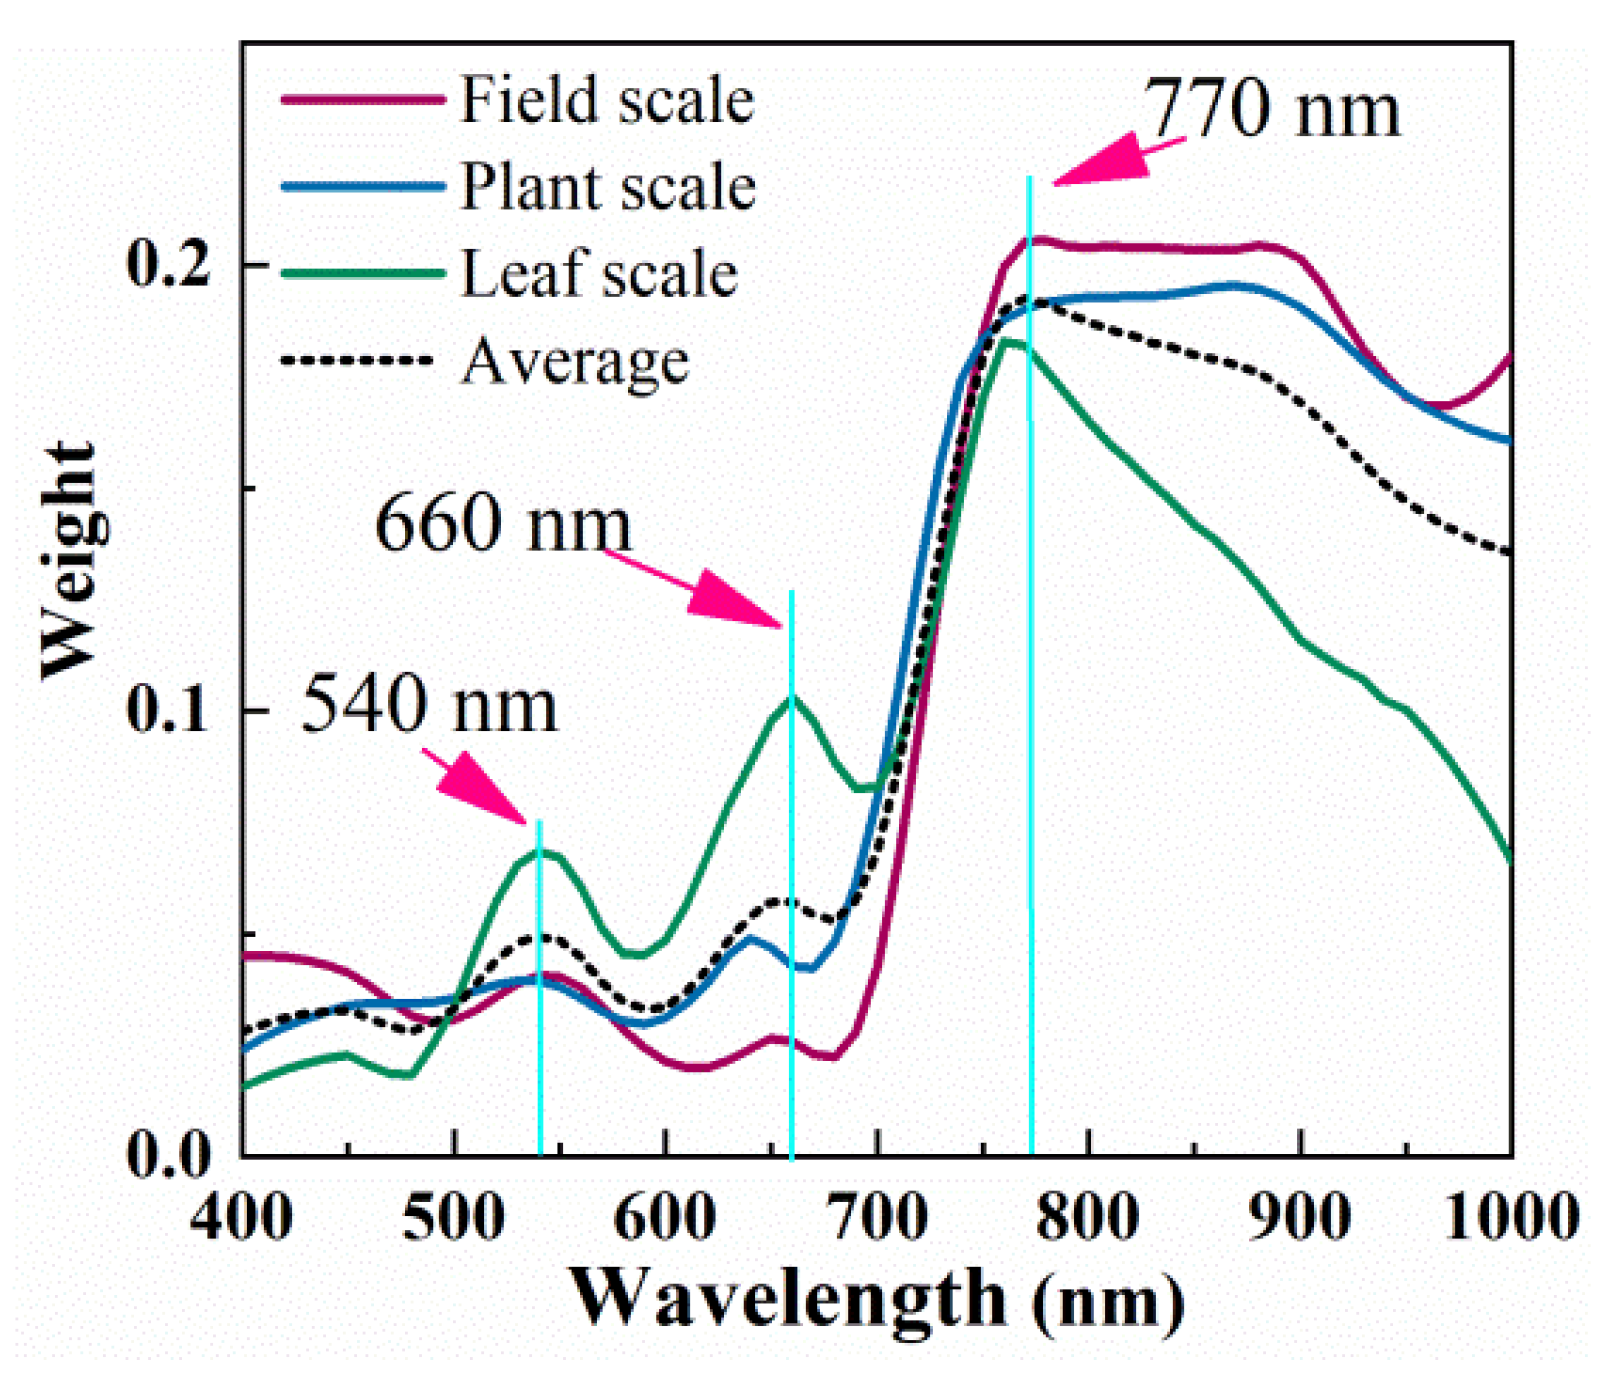
4.3. Multi-Scale Sensitive Wavelength Selection

Relief-F was used to obtain the feature weights of wavelengths at multiple scales. The results are shown in Figure 8. At the leaf scale, higher weights were obtained in the NIR band. Among them, the highest weight was obtained at 760 nm. The weights gradually decreased as the wavelengths increased in the region of 760–1000 nm. Meanwhile, certain weights were obtained at 520–570 and 650–700 nm, and local peaks were obtained at 540 and 660 nm. At the plant scale, higher weights were obtained at 760–900 nm, and the highest weight was obtained at 770 nm. With increasing wavelengths, a smaller trend of weights was observed at 900–1000 nm. Local peaks were observed at 530 and 640 nm, but the weights decreased compared to the leaf scale. At the field scale, high and stable weights appeared at 760–900 nm, and the maximum weight was obtained at 770 nm. Local peaks appeared at 540 and 650 nm. The weights at different scales were considered together, and the weights obtained at the leaf, plant, and field scales were averaged, as shown in the dashed line in Figure 8. The average weights obtained local peaks in the green, red, and NIR bands, and the peaks corresponded to 540, 660, and 770 nm, respectively. Therefore, the three wavelengths were used as multi-scale sensitive wavelengths.
The ability of individual-scale sensitive wavelengths, multi-scale sensitive wavelengths, and full wavelengths to detect disease severity was compared using KNN and MLR, and the results are shown in Table 6. Among them, 540, 660, and 760 nm are sensitive wavelengths at the leaf scale, 530, 640, and 770 nm are sensitive wavelengths at the plant scale, and 540, 660, and 770 nm are sensitive wavelengths at the field scale. The results of the comparison between KNN and MLR show that KNN outperforms MLR when using the full wavelength for disease class detection and that MLR outperforms KNN when using the sensitive wavelength for disease class detection. The comparison results of KNN show that the classification accuracy of the full wavelength is higher than that of the sensitive wavelength at different scales. This is due to the fact that the full wavelength has more features, which improves disease detection. However, too many features tend to affect the speed of the disease detection model and increase the cost in practical applications. In addition, the results of MLR show that individual-scale sensitive wavelengths can have a high detection accuracy at the current scale, and a decrease in accuracy occurs when span-scale applications are performed. The multi-scale sensitive wavelengths identified in this study can achieve high and stable classification accuracy at different scales.

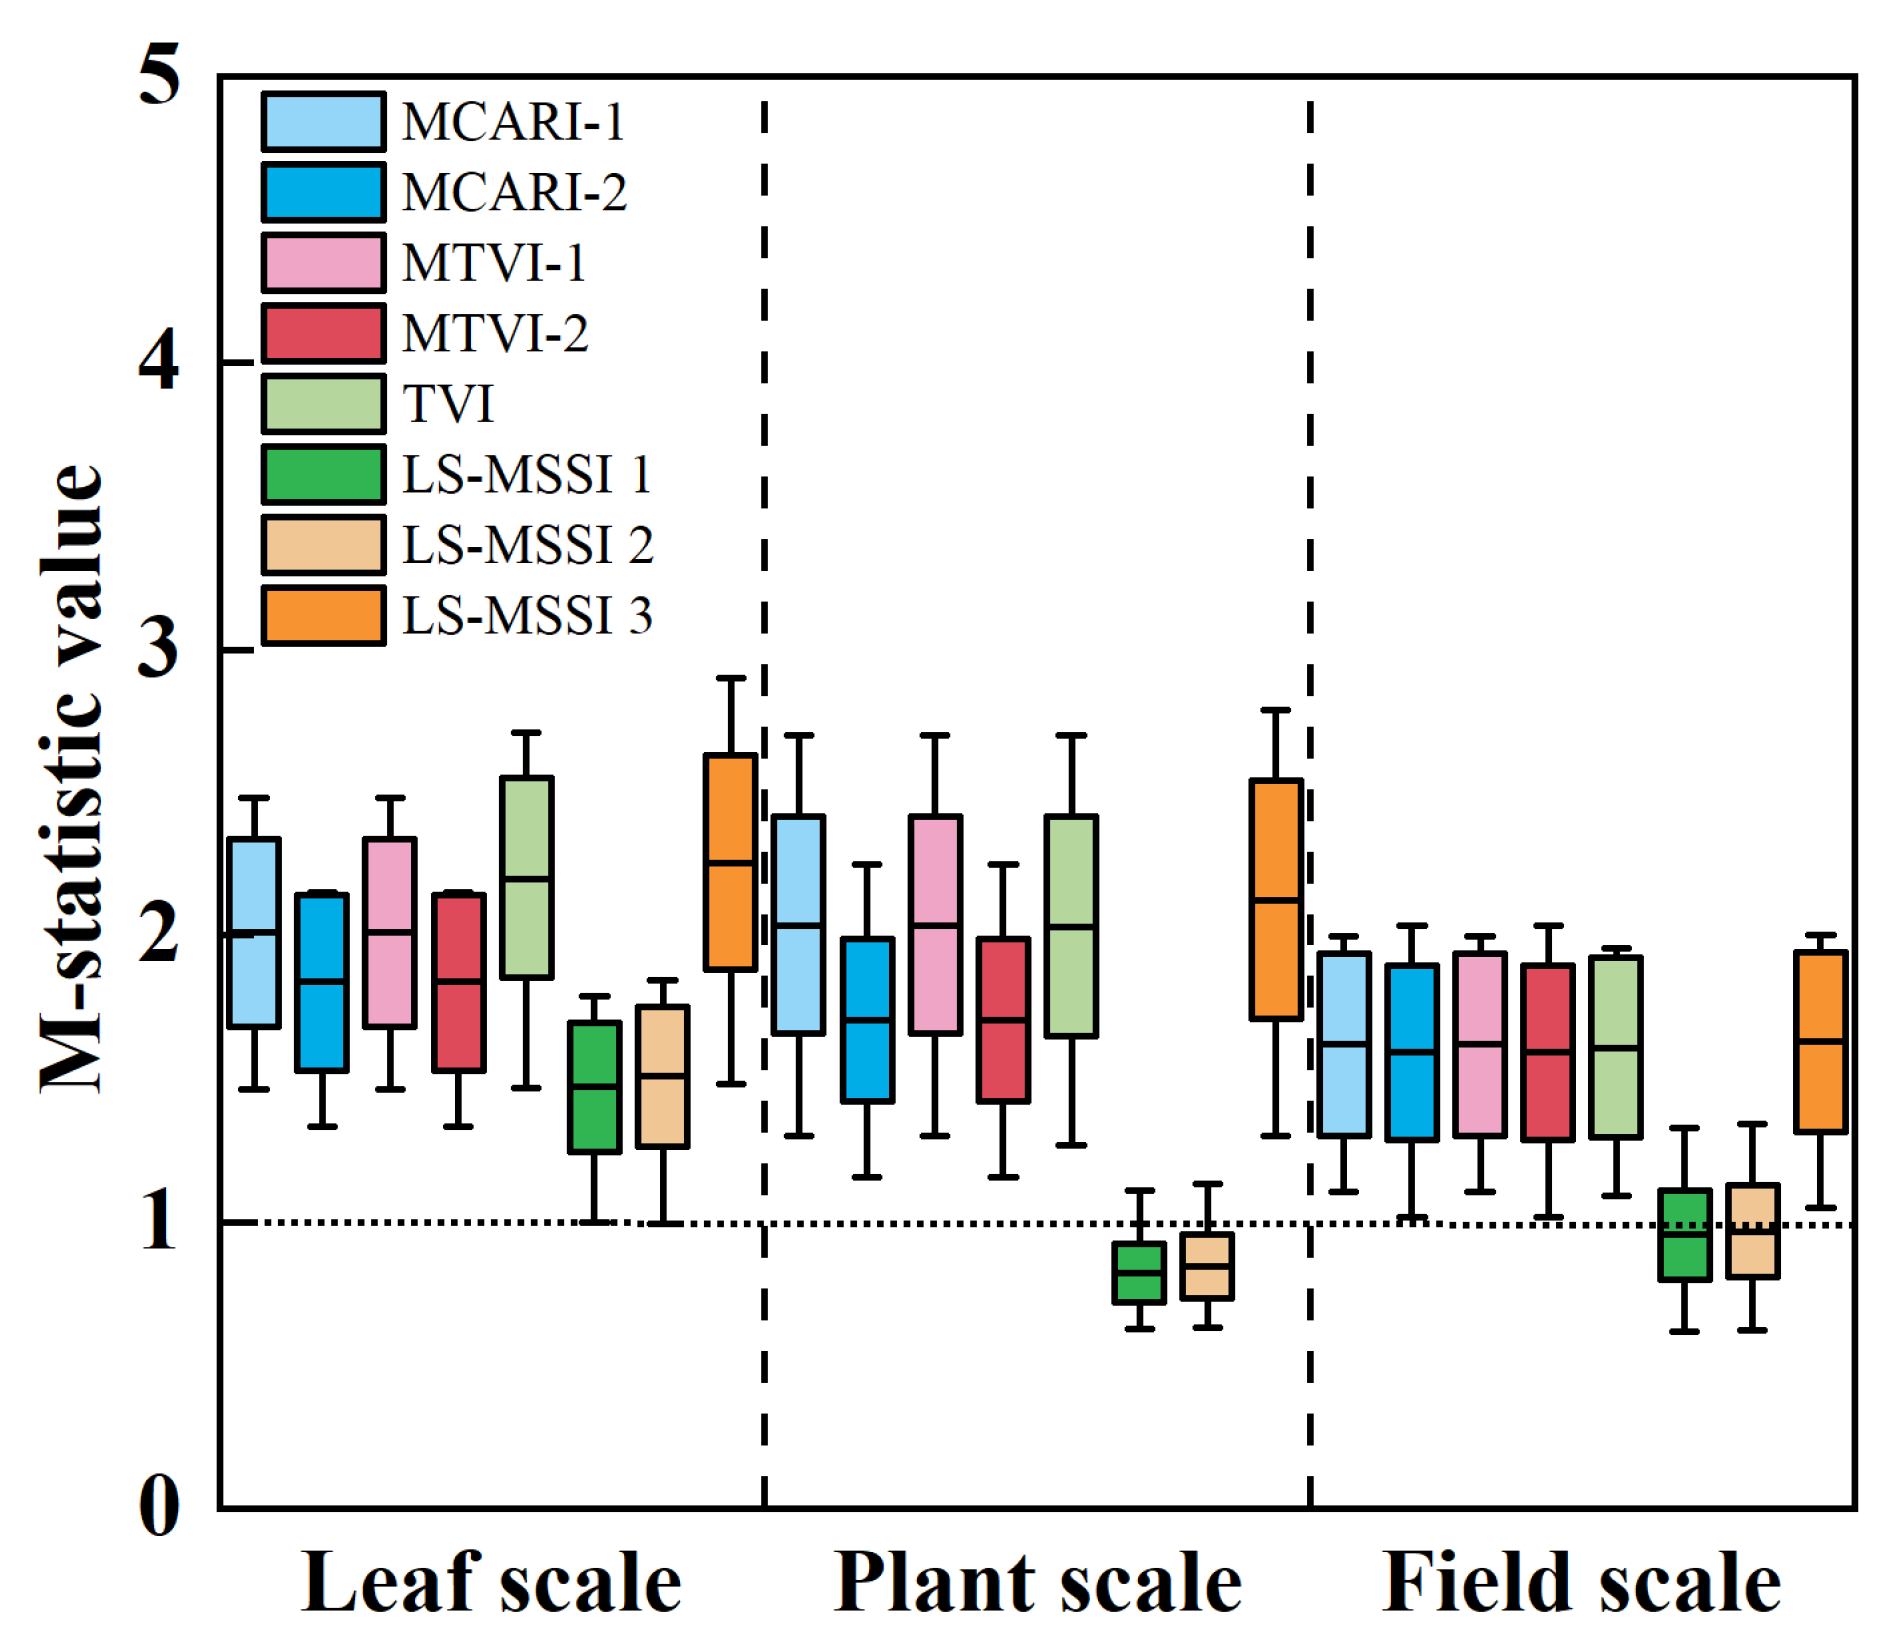
4.4. Comparison of New SI and Traditional SI

In this study, three new SIs of LS, LS-MSSI 1, LS-MSSI 2, and LS-MSSI 3, were constructed by the selected sensitive wavelengths ( λ 1 = 770   nm , λ 2 = 540   nm , and λ 3 = 660   nm ). The 38 SIs (including the 3 new SIs) were correlated with disease severity levels using Spearman’s ranked coefficient, and the results are shown in Table 7. At the leaf scale, 17 SIs—NDVI, AI, MCARI-1, MCARI-2, MTVI-1, MTVI-2, WI, TVI, NWI-1, NWI-2, ARI, PSSRa, LSI, LLSI, LS-MSSI 1, LS-MSSI 2, and LS-MSSI 3—were significantly correlated ( | R | > 0.80 ) with disease severity levels. At the plant scale, 10 SIs—MCARI-1, MCARI-2, MTVI-1, MTVI-2, TVI, ARI, LLSI, LS-MSSI 1, LS-MSSI 2, and LS-MSSI 3—were significantly correlated with disease severity levels. At the field scale, 13 SIs—SIPI, RARSa, RARSc, NSI-1, MCARI-1, MCARI-2, MTVI-1, MTVI-2, TVI, PSSRb, LS-MSSI 1, LS-MSSI 2, and LS-MSSI 3—were significantly correlated with disease severity levels. Eight SIs—MCARI-1, MCARI-2, MTVI-1, MTVI-2, TVI, LS-MSSI 1, LS-MSSI 2, and LS-MSSI 3—were significantly correlated with disease severity levels at three scales simultaneously.
The separability of the significantly correlated SIs was evaluated using the M-statistic value at multiple scales. Figure 9 shows the M-statistic mean, maximum, and minimum values between different disease severity levels. Overall, the mean M-statistic values of all six SIs—MCARI-1, MCARI-2, MTVI-1, MTVI-2, TVI, and LS-MSSI 3—were greater than 1, indicating that they had good separability. At the leaf scale, the M-statistic values of all SIs were greater than 1, indicating that they had good differentiability. In contrast, the mean values of M-statistics of LS-MSSI 1 and LS-MSSI 2 were less than 1 at both plant and field scales, indicating that they did not have good differentiability. In addition, the mean value of the highest M-statistic was obtained for LS-MSSI 3 at the leaf, plant, and field scales, indicating that it has the best separability for all scales. Therefore, LS-MSSI 3 was identified as the final leaf spot multi-scale spectral index (LS-MSSI).

4.5. Classification Results

KNN and MLR were used to evaluate the ability of six SIs—MCARI-1, MCARI-2, MTVI-1, MTVI-2, TVI, and LS-MSSI—to detect LS severity, and the results are shown in Table 8. From the classification results of KNN, the highest accuracy was obtained for TVI at the leaf scale, with OA and Kappa reaching 93.77% and 91.59%, respectively. At the plant and field scales, LS-MSSI obtained the highest accuracy, with OA reaching 91.25% and 90.29% and Kappa reaching 88.29% and 87.04%, respectively. From the classification results of MLR, at the leaf scale, TVI and LS-MSSI obtained the highest accuracy, with OA and Kappa reaching 93.77% and 91.59%, respectively. At the plant and field scales, LS-MSSI obtained the highest accuracy, with OA reaching 92.50% and 88.57% and Kappa reaching 89.97% and 84.75%, respectively. From the overall classification results, LS-MSSI can achieve the highest accuracy at all three scales simultaneously.

5. Discussion

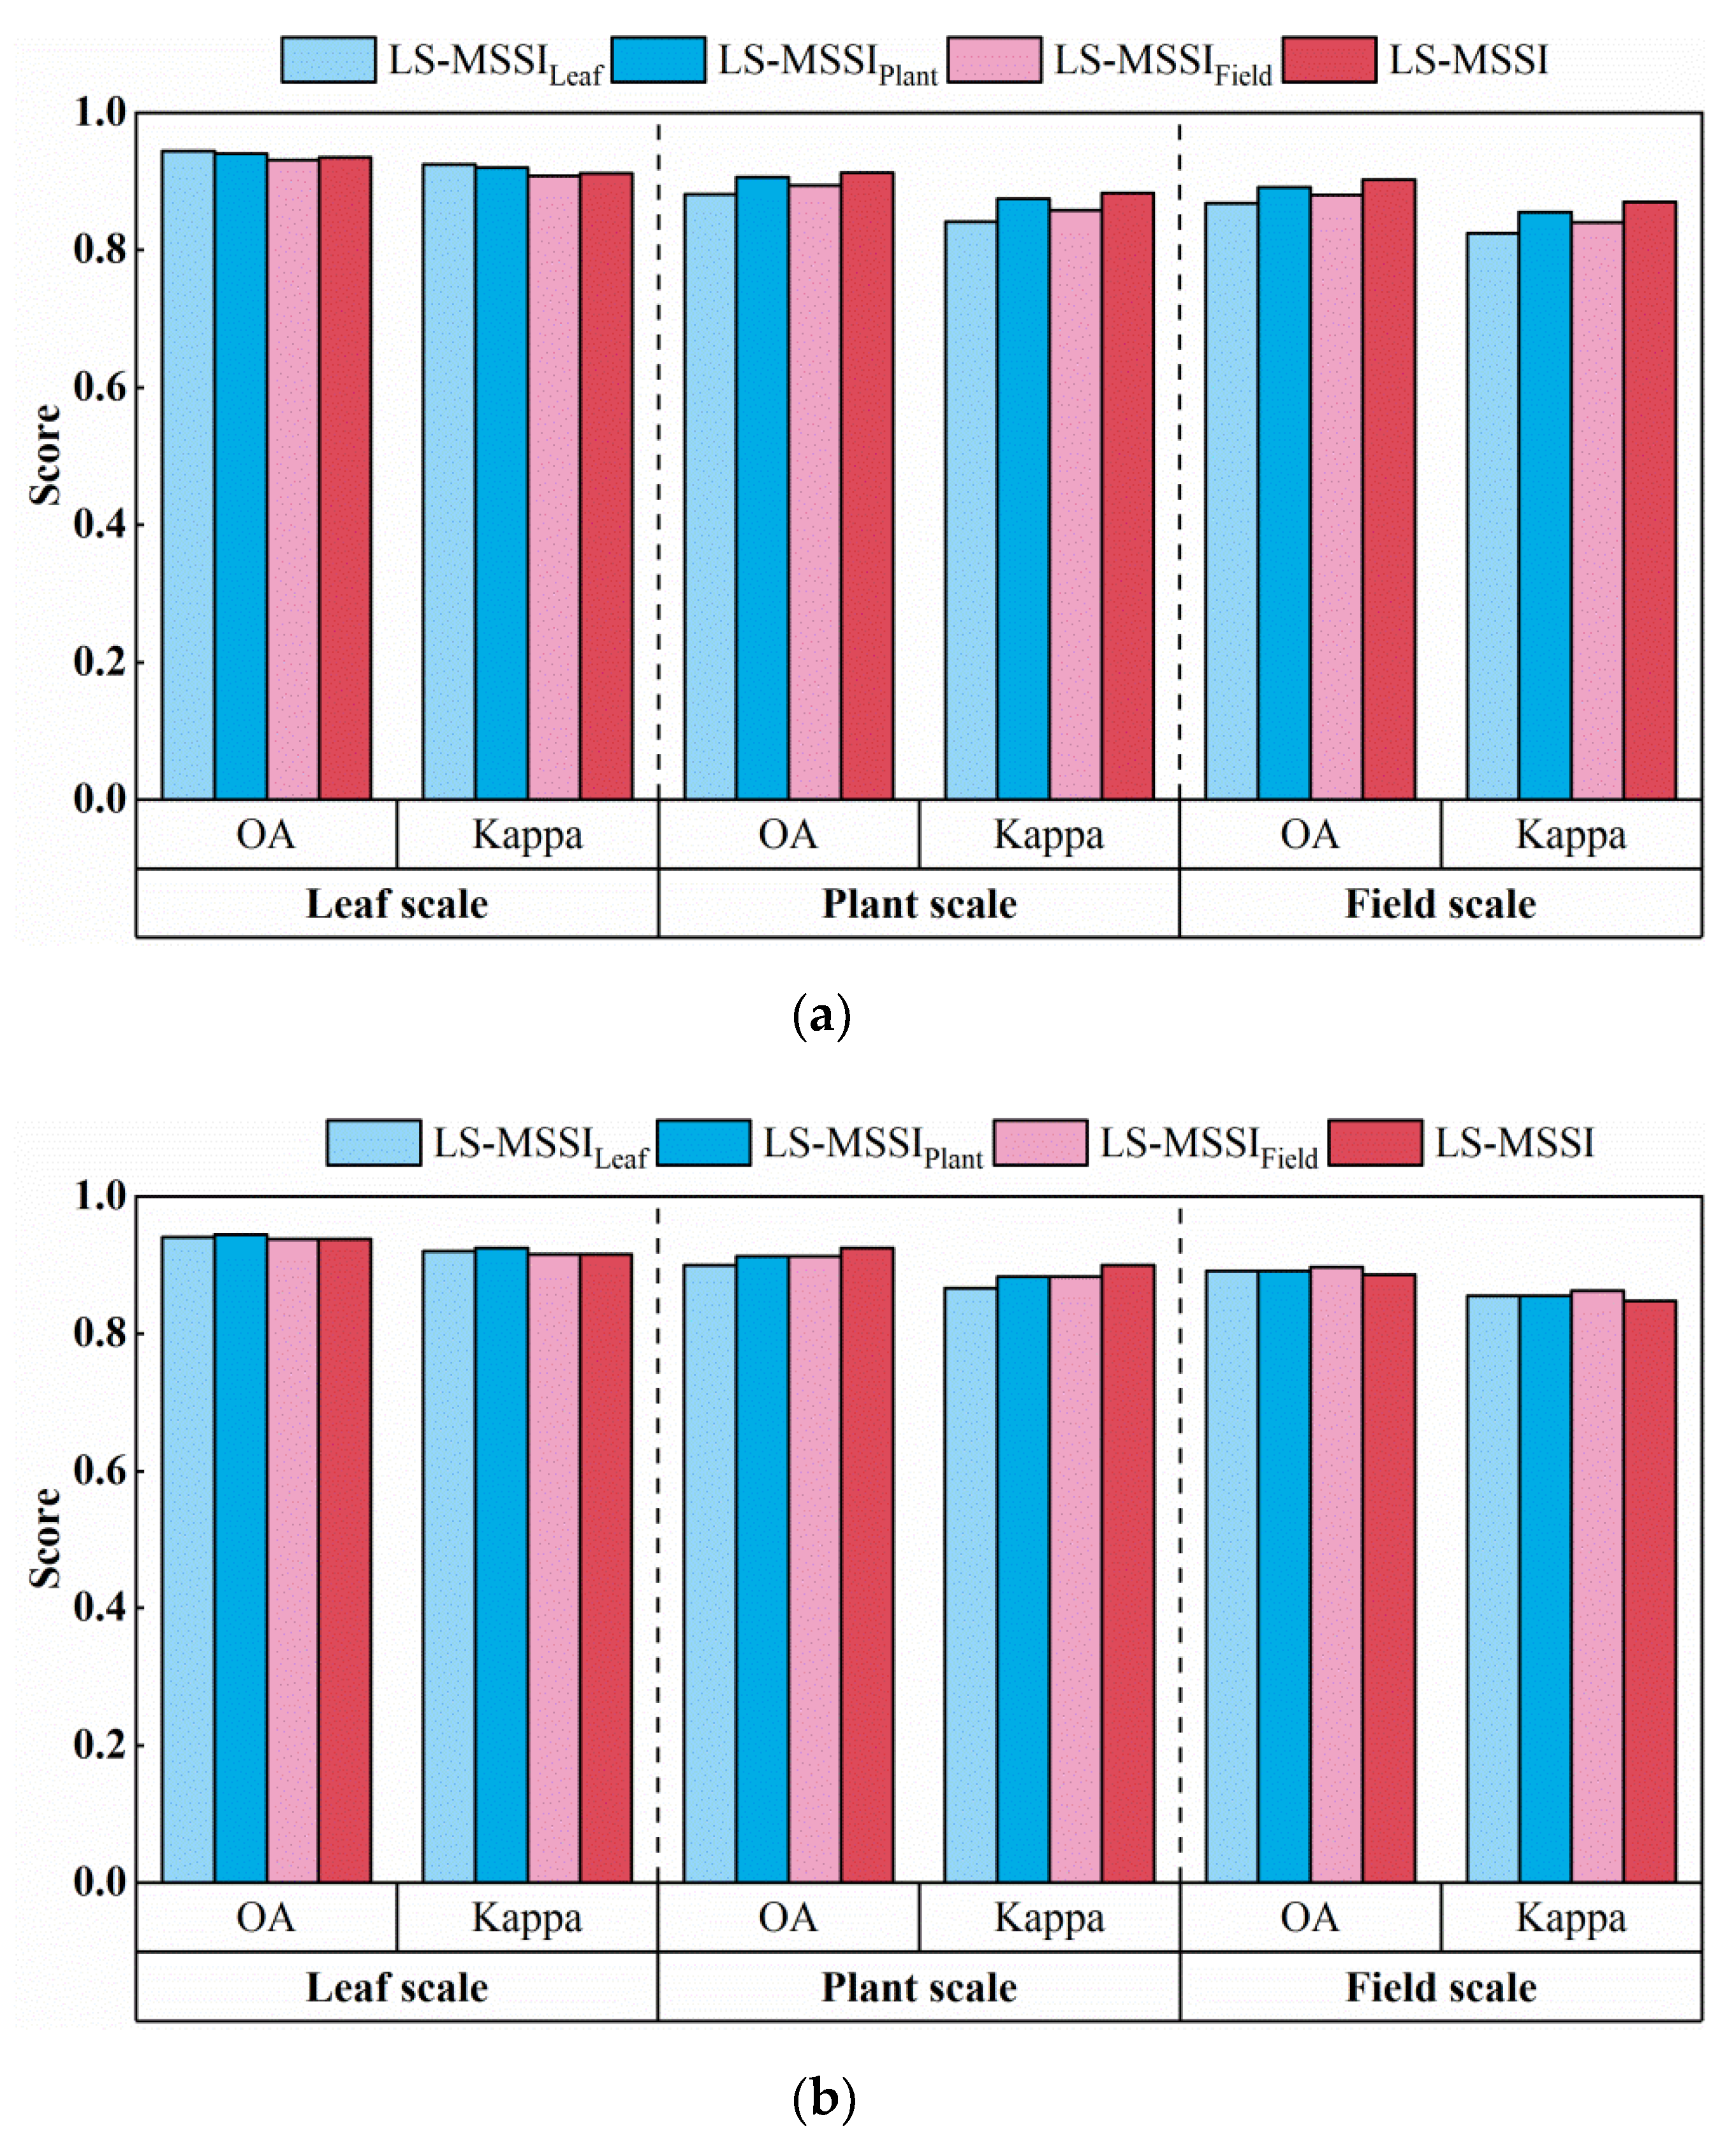
5.1. Analysis of Individual-Scale SI and Multi-Scale SI

To explore the transferability and reliability of the SIs at individual scales for spans-scale disease detection, the SIs at each scale were obtained separately in this study. LS-MSSILeaf, LS-MSSIPlant, and LS-MSSIField were SIs established at the leaf, plant, and field scales. KNN and MLR were used to evaluate the accuracy of SIs at individual scales for detecting disease severity at other scales, and the results are shown in Figure 10.
From the classification results of KNN shown in Figure 10a, it can be seen that LS-MSSILeaf obtained high accuracy at the leaf scale, while lower accuracy was obtained at the plant and the field scales. From the classification results of MLR shown in Figure 10b, it can be seen that LS-MSSIField obtained higher accuracy at the field scale and lower accuracy at the leaf and plant scales. The above results illustrate that the SIs established at individual scales can have a high detection accuracy at their respective scale, while applications at other scales are less effective. The above conclusions are similar to the results of previous studies. For example, the authors of [20] used different SIs for disease detection at the leaf and field scales. The authors of [21] used different SIs for the detection of powdery mildew disease at the leaf and field scales, respectively. Therefore, the SIs determined at individual scales may decrease the accuracy of disease detection in span-scale applications.
Not all SIs applied at different scales can result in a decline in accuracy. The authors of [23] demonstrated that MTVI-1 and the reformed difference vegetation index (RDVI) can detect bacterial spot (BS), target spot (TS), and tomato yellow leaf curl (TYLC) at the leaf and field scales. The authors of [28] created SIs at the leaf scale, and four SIs were verified on the multispectral images obtained at the field scale. The authors of [63] determined the most effective wavelengths at the leaf scale and applied them to multispectral aerial images taken by a UAV. Moreover, similar results were obtained in this study. From the classification results of KNN, it can be seen that LS-MSSIPlant obtained higher classification results at the plant and field scales. In contrast, the accuracy at the leaf scale was slightly lower than that of LS-MSSILeaf. From the classification results of MLR, it can be seen that LS-MSSIPlant obtained higher classification results at leaf and plant scales, while the accuracy at the field scale was slightly lower than that of LS-MSSIField. The above results suggest that the SIs determined at individual scales can be applied to other scales.
Comprehensive analysis shows that the accuracy of SIs for disease detection determined at individual scales is unstable at other scales. Therefore, this study combined the feature weights obtained at different scales to obtain multi-scale sensitive wavelengths and used the sensitive wavelengths to construct a multi-scale SI. From the results of KNN and MLR, the LS-MSSI was slightly lower than the accuracy of LS-MSSILeaf and LS-MSSIPlant at the leaf scale and better than the SIs determined at individual scales at the plant scale. LS-MSSI obtained the highest accuracy at the field scale using KNN, while LS-MSSI was slightly less accurate than LS-MSSIField using MLR. The results show that the LS-MSSI determined at multiple scales has high accuracy, which is conducive to constructing a peanut LS detection model with higher accuracy, stability, and robustness. In practical applications, the detection of peanut LS disease severity at different scales using LS-MSSI can reduce the application cost of the equipment. In addition, this study investigated the variation pattern of spectral reflectance for different disease severity levels from the leaf scale to the plant scale to the field scale and determined the multi-scale SI. It can be inferred that the SI proposed in this study can be used for disease detection at any scale between leaf, plant, and field scales, making the multi-scale SI more applicable in practical applications.

5.2. Analysis of the Proposed New SI and the Traditional SI

According to research [64,65], the detection of different diseases of different crops requires specific sensitive wavelengths. Therefore, the spectral reflectance of peanut LS disease with different disease severity levels was analyzed at the leaf, plant, and field scales, respectively. It can be seen from the results that the sensitive wavelengths at different scales have similarities and are mainly concentrated in the green band, red band, and NIR band. The reason for this is that, when pathogens interact with host plants, color changes and necrosis symptoms lead to the decrease in reflectance in the green band and the increase in reflectance in the red band. The decrease in crop biomass caused by pathogens can reduce reflectance in the NIR band, which is consistent with the results of [56]. Previous studies have shown that the decrease in reflectance in the green band is related to the breakdown of chlorophyll and that the difference in reflectance in the red band may be related to changes in carotenoid and lutein pigments [66]. The decrease in reflectance in the NIR band is mainly influenced by changes in leaf structure and water content [67,68]. In addition, the authors of [69,70] showed that the NIR band is also a sensitive indicator of canopy structure changes.
Meanwhile, as the spatial resolution decreased (leaf scale to plant scale to field scale), the separability in the red and green bands gradually decreased, and the separability in the NIR band gradually increased. This may be because the average reflectance of a region in the field is obtained at the plant and field scales. The mixed information region gradually weakens the separability in the green and red bands [24]. In addition, the reflectance in the NIR band is mainly influenced by leaf shape, transpiration rate, canopy morphology, and plant density variation, making the leaf-scale features different from the plant-scale and field-scale features. From the above, it can be seen that the spectral reflectance at different scales responds to different disease features, and the individual-scale sensitive wavelengths do not allow for comprehensive assessment and detection, which can make the detection accuracy unstable during the spans-scale application. To improve the transferability of features, the peaks of the average weights of the three scales were used as sensitive wavelengths in this study, namely, 540, 660, and 770 nm.
This study constructed three SIs (LS-MSSI 1, LS-MSSI 2, and LS-MSSI 3) by selected sensitive wavelengths. The 38 SIs were correlated with disease severity levels. Eight SIs—MCARI-1, MCARI-2, MTVI-1, MTVI-2, TVI, LS-MSSI 1, LS-MSSI 2, and LS-MSSI 3—were significantly correlated with LS severity levels at all three scales simultaneously, and six SIs—MCARI-1, MCARI-2, MTVI-1, MTVI-2, TVI, and LS-MSSI 3—with good separability were evaluated using M-statistic values. MCARI and TVI measure photosynthetically active radiation associated with chlorophyll absorption. MCARI-1, MCARI-2, MTVI-1, and MTVI-2 are improved versions of MCARI and TVI. The authors of [20,35] considered TVI as one of the most significant indices for detecting target spot (TS) disease in tomatoes. The results of [56] regarding the detection of LS showed that 12 SIs, such as MCARI, were significantly associated with the DI. The improved detection of the above SIs may be because the diseased parts of the leaves are mainly dark brown or black when the LS occurs in peanut crops. Different physiological symptoms such as leaf discoloration, a curling shape, and sparse leaves appear in the plant canopy, changing the canopy density and green leaf area index [3].
The LS-MSSI proposed in this study and TVI are constructed from three sensitive wavelengths, and their sensitive wavelengths are very close. However, the equations for constructing the spectral index show that TVI uses 550 nm as the most sensitive wavelength, while LS-MSSI uses 770 nm as the most sensitive wavelength. TVI is mainly used to measure photosynthetically active radiation related to chlorophyll absorption. The reflectance variation in the green band, where 550 nm is located, is closely related to chlorophyll content. Our study found hyperspectral reflectance of different disease severity levels was different in green, red, and NIR bands. Among them, the NIR band is the band with the greatest variability. Therefore, LS-MSSI and TVI have similar sensitive wavelengths, while there are differences in the construction methods. In both KNN and MLR, TVI obtained high accuracy at the leaf scale. However, at plant and field scales, KNN and MLR showed lower accuracy of TVI than LS-MSSI. Our results showed that the differences in the red and green bands gradually decreased, and the differences in the NIR region gradually increased with the change from leaf scale to plant scale to field scale. TVI is sensitive to chlorophyll content, resulting in a poor ability to detect crop disease severity at the plant and field scale. Therefore, a comprehensive comparison showed that LS-MSSI and TVI had similar disease detection abilities at the leaf scale. However, the accuracy of LS-MSSI was better than TVI for detecting the disease severity at the plant and field scales.
The LS-MSSI proposed in this study can obtain high accuracy at all three scales simultaneously, and its results are superior to other SIs. The results also show that the highest accuracy was obtained at the leaf scale and the lowest was obtained at the field scale. These results may be due to the hyperspectral reflectance that can be obtained under an ideal environment in the laboratory. In contrast, the acquisition of hyperspectral reflectance in the field is easily affected by weather, light, and the environment, resulting in lower accuracy and stability at the plant and field scales than at the leaf scale.

6. Conclusions

When diseases infect plants, photosynthesis, biochemical indexes, and the physical structure of plants will change, thereby affecting the absorption of light on the plant surface. The spectral difference between healthy and diseased plants is the key to identifying specific diseases. Determining the sensitive wavelengths with a large difference, high separability, and strong expansibility can effectively improve the accuracy and stability of disease identification. Therefore, this study explored the sensitive wavelengths at multiple scales to construct the SI of specific LS.
In this study, the hyperspectral reflectance of peanut LS with different severity levels was collected at the leaf, plant, and field scales. The difference and separability of wavelengths were evaluated considering mean, variance, and dispersion. The feature weights of wavelengths at different scales were obtained using Relief-F, and sensitive wavelengths were obtained by averaging the feature weights at three scales. The SIs were constructed using sensitive wavelengths. Correlation analysis and M-statistics values were performed between 35 commonly used SIs and 3 new ones, and 6 SIs were finally identified for detecting LS severity. KNN and MLR evaluated the ability of SIs to detect LS severity. The results show that the LS-MSSI proposed in this study had better accuracy, reaching 93.77% and 91.59% for OA and Kappa at the leaf scale, respectively. At the plant scale, OA and Kappa reached 92.50% and 89.97%, respectively. At the field scale, OA and Kappa reached 90.29% and 87.04%, respectively.
The above conclusions show that the LS-MSSI determined in this study can be used to detect LS severity at multiple scales. The LS-MSSI considered three sensitive wavelengths, which were selected in an experimental environment and tested with a specific cultivar. In future work, we will validate the proposed SI under different conditions. We also need to consider whether the SI proposed in this study can distinguish between other biotic and abiotic stresses.

Author Contributions

Conceptualization, K.S. and T.X.; data curation, Q.G.; formal analysis, K.S.; funding acquisition, T.X.; investigation, Q.G.; methodology, Q.G.; project administration, F.Y.; resources, T.X.; software, F.Y.; supervision, K.S.; validation, Q.G. and S.F.; visualization, S.F.; writing—original draft, Q.G.; writing—review and editing, T.X. All authors have read and agreed to the published version of the manuscript.

Funding

This research was partially funded by the Liaoning Provincial Key R&D Program Project (2019JH2/10200002), the Higher Education Science Research Project of Inner Mongolia Autonomous Region of China (NJZY21419), and the Science and Technology Plan Project of Inner Mongolia Autonomous Region of China (2020GG0189).

Data Availability Statement

Not applicable.

Conflicts of Interest

The authors declare that they have no conflict of interest.

References

  1. Khera, P.; Pandey, M.K.; Wang, H.; Feng, S.; Qiao, L.; Culbreath, A.K.; Kale, S.; Wang, J.; Holbrook, C.C.; Zhuang, W.J.P.O. Mapping quantitative trait loci of resistance to tomato spotted wilt virus and leaf spots in a recombinant inbred line population of peanut (Arachis hypogaea L.) from SunOleic 97R and NC94022. PLoS ONE 2016, 11, e0158452. [Google Scholar] [CrossRef] [PubMed] [Green Version]
  2. Zhang, N.; Yang, G.; Pan, Y.; Yang, X.; Chen, L.; Zhao, C. A Review of Advanced Technologies and Development for Hyperspectral-Based Plant Disease Detection in the Past Three Decades. Remote Sens. 2020, 12, 3188. [Google Scholar] [CrossRef]
  3. Gremillion, S.; Culbreath, A.; Gorbet, D.; Mullinix, B.; Pittman, R.; Stevenson, K.; Todd, J.; Condori, M. Response of progeny bred from Bolivian and North American cultivars in integrated management systems for leaf spot of peanut (Arachis hypogaea). Crop Prot. 2011, 30, 698–704. [Google Scholar] [CrossRef]
  4. Chiteka, Z.A.; Gorbet, D.W.; Shokes, F.M.; Kucharek, T.A.; Knauft, D.A. Components of Resistance to Late Leafspot in Peanut. I. Levels and Variability—Implications for Selection1. Peanut Sci. 1988, 15, 25–30. [Google Scholar] [CrossRef]
  5. Partel, V.; Charan Kakarla, S.; Ampatzidis, Y. Development and evaluation of a low-cost and smart technology for precision weed management utilizing artificial intelligence. Comput. Electron. Agric. 2019, 157, 339–350. [Google Scholar] [CrossRef]
  6. Mueller, D.S.; Bradley, C.A.; Grau, C.R.; Gaska, J.M.; Kurle, J.E.; Pedersen, W.L. Application of thiophanate-methyl at different host growth stages for management of sclerotinia stem rot in soybean. Crop Prot. 2004, 23, 983–988. [Google Scholar] [CrossRef]
  7. Reen, D.J. Enzyme-Linked Immunosorbent Assay (ELISA). In Basic Protein and Peptide Protocols; Walker, J.M., Ed.; Humana Press: Totowa, NJ, USA, 1994; pp. 461–466. [Google Scholar] [CrossRef]
  8. Rahman, M.T.; Uddin, M.S.; Sultana, R.; Moue, A.; Setu, M. Polymerase Chain Reaction (PCR): A Short Review. Anwer Khan Mod. Med. Coll. J. 2013, 4, 30–36. [Google Scholar] [CrossRef]
  9. Weiss, M.; Jacob, F.; Duveiller, G. Remote sensing for agricultural applications: A meta-review. Remote Sens. Environ. 2020, 236, 111402. [Google Scholar] [CrossRef]
  10. Pantazi, X.-E.; Moshou, D.; Bravo, C. Active learning system for weed species recognition based on hyperspectral sensing. Biosyst. Eng. 2016, 146, 193–202. [Google Scholar] [CrossRef]
  11. Vaglio Laurin, G.; Chen, Q.; Lindsell, J.A.; Coomes, D.A.; Frate, F.D.; Guerriero, L.; Pirotti, F.; Valentini, R. Above ground biomass estimation in an African tropical forest with lidar and hyperspectral data. ISPRS J. Photogramm. Remote Sens. 2014, 89, 49–58. [Google Scholar] [CrossRef]
  12. Zhao, D.; Feng, S.; Cao, Y.; Yu, F.; Guan, Q.; Li, J.; Zhang, G.; Xu, T. Study on the Classification Method of Rice Leaf Blast Levels Based on Fusion Features and Adaptive-Weight Immune Particle Swarm Optimization Extreme Learning Machine Algorithm. Front. Plant Sci. 2022, 13, 879668. [Google Scholar] [CrossRef]
  13. Cao, X.; Luo, Y.; Zhou, Y.; Fan, J.; Xu, X.; West, J.S.; Duan, X.; Cheng, D.J.P.O. Detection of powdery mildew in two winter wheat plant densities and prediction of grain yield using canopy hyperspectral reflectance. PLoS ONE 2015, 10, e0121462. [Google Scholar] [CrossRef] [Green Version]
  14. Lu, J.; Ehsani, R.; Shi, Y.; de Castro, A.I.; Wang, S. Detection of multi-tomato leaf diseases (late blight, target and bacterial spots) in different stages by using a spectral-based sensor. Sci. Rep. 2018, 8, 2793. [Google Scholar] [CrossRef] [Green Version]
  15. Zhang, D.; Wang, Q.; Lin, F.; Yin, X.; Gu, C.; Qiao, H. Development and Evaluation of a New Spectral Disease Index to Detect Wheat Fusarium Head Blight Using Hyperspectral Imaging. Sensors 2020, 20, 2260. [Google Scholar] [CrossRef]
  16. Mahlein, A.-K. Plant Disease Detection by Imaging Sensors—Parallels and Specific Demands for Precision Agriculture and Plant Phenotyping. Plant Dis. 2015, 100, 241–251. [Google Scholar] [CrossRef] [Green Version]
  17. Zheng, Q.; Huang, W.; Cui, X.; Dong, Y.; Shi, Y.; Ma, H.; Liu, L. Identification of Wheat Yellow Rust Using Optimal Three-Band Spectral Indices in Different Growth Stages. Sensors 2019, 19, 35. [Google Scholar] [CrossRef] [Green Version]
  18. Huang, L.; Ding, W.; Liu, W.; Zhao, J.; Huang, W.; Xu, C.; Zhang, D.; Liang, D. Identification of wheat powdery mildew using in-situ hyperspectral data and linear regression and support vector machines. J. Plant Pathol. 2019, 101, 1035–1045. [Google Scholar] [CrossRef]
  19. Yuan, L.; Yan, P.; Han, W.; Huang, Y.; Wang, B.; Zhang, J.; Zhang, H.; Bao, Z. Detection of anthracnose in tea plants based on hyperspectral imaging. Comput. Electron. Agric. 2019, 167, 105039. [Google Scholar] [CrossRef]
  20. Abdulridha, J.; Ampatzidis, Y.; Kakarla, S.C.; Roberts, P. Detection of target spot and bacterial spot diseases in tomato using UAV-based and benchtop-based hyperspectral imaging techniques. Precis. Agric. 2020, 21, 955–978. [Google Scholar] [CrossRef]
  21. Abdulridha, J.; Ampatzidis, Y.; Roberts, P.; Kakarla, S.C. Detecting powdery mildew disease in squash at different stages using UAV-based hyperspectral imaging and artificial intelligence. Biosyst. Eng. 2020, 197, 135–148. [Google Scholar] [CrossRef]
  22. Abdulridha, J.; Batuman, O.; Ampatzidis, Y. UAV-Based Remote Sensing Technique to Detect Citrus Canker Disease Utilizing Hyperspectral Imaging and Machine Learning. Remote Sens. 2019, 11, 1373. [Google Scholar] [CrossRef] [Green Version]
  23. Abdulridha, J.; Ampatzidis, Y.; Qureshi, J.; Roberts, P. Laboratory and UAV-Based Identification and Classification of Tomato Yellow Leaf Curl, Bacterial Spot, and Target Spot Diseases in Tomato Utilizing Hyperspectral Imaging and Machine Learning. Remote Sens. 2020, 12, 2732. [Google Scholar] [CrossRef]
  24. Thomas, S.; Kuska, M.T.; Bohnenkamp, D.; Brugger, A.; Alisaac, E.; Wahabzada, M.; Behmann, J.; Mahlein, A.-K. Benefits of hyperspectral imaging for plant disease detection and plant protection: A technical perspective. J. Plant Dis. Prot. 2018, 125, 5–20. [Google Scholar] [CrossRef]
  25. Li, Z.; Li, Z.; Fairbairn, D.; Li, N.; Xu, B.; Feng, H.; Yang, G. Multi-LUTs method for canopy nitrogen density estimation in winter wheat by field and UAV hyperspectral. Comput. Electron. Agric. 2019, 162, 174–182. [Google Scholar] [CrossRef]
  26. Liu, S.; Li, L.; Gao, W.; Zhang, Y.; Liu, Y.; Wang, S.; Lu, J. Diagnosis of nitrogen status in winter oilseed rape (Brassica napus L.) using in-situ hyperspectral data and unmanned aerial vehicle (UAV) multispectral images. Comput. Electron. Agric. 2018, 151, 185–195. [Google Scholar] [CrossRef]
  27. Bauriegel, E.; Giebel, A.; Geyer, M.; Schmidt, U.; Herppich, W.B. Early detection of Fusarium infection in wheat using hyper-spectral imaging. Comput. Electron. Agric. 2011, 75, 304–312. [Google Scholar] [CrossRef]
  28. Chen, T.; Yang, W.; Zhang, H.; Zhu, B.; Zeng, R.; Wang, X.; Wang, S.; Wang, L.; Qi, H.; Lan, Y.; et al. Early detection of bacterial wilt in peanut plants through leaf-level hyperspectral and unmanned aerial vehicle data. Comput. Electron. Agric. 2020, 177, 105708. [Google Scholar] [CrossRef]
  29. Huang, W.; Lamb, D.W.; Niu, Z.; Zhang, Y.; Liu, L.; Wang, J. Identification of yellow rust in wheat using in-situ spectral reflectance measurements and airborne hyperspectral imaging. Precis. Agric. 2007, 8, 187–197. [Google Scholar] [CrossRef]
  30. Kira, K.; Rendell, L.A. A Practical Approach to Feature Selection. In Machine Learning Proceedings 1992; Sleeman, D., Edwards, P., Eds.; Morgan Kaufmann: San Francisco, CA, USA, 1992; pp. 249–256. [Google Scholar] [CrossRef]
  31. Robnik-Šikonja, M.; Kononenko, I. Theoretical and Empirical Analysis of ReliefF and RReliefF. Mach. Learn. 2003, 53, 23–69. [Google Scholar] [CrossRef] [Green Version]
  32. Zhang, J.; Huang, Y.; Reddy, K.N.; Wang, B. Assessing crop damage from dicamba on non-dicamba-tolerant soybean by hyperspectral imaging through machine learning. Pest Manag. Sci. 2019, 75, 3260–3272. [Google Scholar] [CrossRef]
  33. Huang, W.; Guan, Q.; Luo, J.; Zhang, J.; Zhao, J.; Liang, D.; Huang, L.; Zhang, D. New Optimized Spectral Indices for Identifying and Monitoring Winter Wheat Diseases. IEEE J. Sel. Top. Appl. Earth Obs. Remote Sens. 2014, 7, 2516–2524. [Google Scholar] [CrossRef]
  34. Penuelas, J.; Pinol, J.; Ogaya, R.; Filella, I. Estimation of plant water concentration by the reflectance Water Index WI (R900/R970). Int. J. Remote Sens. 1997, 18, 2869–2875. [Google Scholar] [CrossRef]
  35. Haboudane, D.; Miller, J.R.; Pattey, E.; Zarco-Tejada, P.J.; Strachan, I.B. Hyperspectral vegetation indices and novel algorithms for predicting green LAI of crop canopies: Modeling and validation in the context of precision agriculture. Remote Sens. Environ. 2004, 90, 337–352. [Google Scholar] [CrossRef]
  36. Carter, G.A. Ratios of leaf reflectances in narrow wavebands as indicators of plant stress. Int. J. Remote Sens. 1994, 15, 697–703. [Google Scholar] [CrossRef]
  37. Rouse, J.W., Jr.; Haas, R.H.; Schell, J.A.; Deering, D.W. Monitoring Vegetation Systems in the Great Plains with ERTS. In Proceedings of the 3rd Earth Resources Technology Satellite-1 Symposium, Washington, DC, USA, 10–14 December 1973; Volume 351, p. 309. [Google Scholar]
  38. Mirik, M.; Michels, G.J., Jr.; Kassymzhanova-Mirik, S.; Elliott, N.C.; Bowling, R. Hyperspectral Spectrometry as a Means to Differentiate Uninfested and Infested Winter Wheat by Greenbug (Hemiptera: Aphididae). J. Econ. Entomol. 2006, 99, 1682–1690. [Google Scholar] [CrossRef]
  39. Pen¯Uelas, J.; Filella, I.; Lloret, P.; Mun¯Oz, F.; Vilajeliu, M. Reflectance assessment of mite effects on apple trees. Int. J. Remote Sens. 1995, 16, 2727–2733. [Google Scholar] [CrossRef]
  40. Mirik, M.; Michels, G.J.; Kassymzhanova-Mirik, S.; Elliott, N.C.; Catana, V.; Jones, D.B.; Bowling, R. Using digital image analysis and spectral reflectance data to quantify damage by greenbug (Hemitera: Aphididae) in winter wheat. Comput. Electron. Agric. 2006, 51, 86–98. [Google Scholar] [CrossRef]
  41. Barnes, J.D.; Balaguer, L.; Manrique, E.; Elvira, S.; Davison, A.W. A reappraisal of the use of DMSO for the extraction and determination of chlorophylls a and b in lichens and higher plants. Environ. Exp. Bot. 1992, 32, 85–100. [Google Scholar] [CrossRef]
  42. Read, J.J.; Tarpley, L.; McKinion, J.M.; Reddy, K.R. Narrow-Waveband Reflectance Ratios for Remote Estimation of Nitrogen Status in Cotton. J. Environ. Qual. 2002, 31, 1442–1452. [Google Scholar] [CrossRef]
  43. Zhao, D.; Reddy, K.R.; Kakani, V.G.; Read, J.J.; Koti, S. Selection of Optimum Reflectance Ratios for Estimating Leaf Nitrogen and Chlorophyll Concentrations of Field-Grown Cotton. Agron. J. 2005, 97, 89–98. [Google Scholar] [CrossRef] [Green Version]
  44. Chappelle, E.W.; Kim, M.S.; McMurtrey, J.E. Ratio analysis of reflectance spectra (RARS): An algorithm for the remote estimation of the concentrations of chlorophyll A, chlorophyll B, and carotenoids in soybean leaves. Remote Sens. Environ. 1992, 39, 239–247. [Google Scholar] [CrossRef]
  45. Prabhakar, M.; Prasad, Y.G.; Thirupathi, M.; Sreedevi, G.; Dharajothi, B.; Venkateswarlu, B. Use of ground based hyperspectral remote sensing for detection of stress in cotton caused by leafhopper (Hemiptera: Cicadellidae). Comput. Electron. Agric. 2011, 79, 189–198. [Google Scholar] [CrossRef]
  46. Wang, Z.J.; Wang, J.H.; Liu, L.Y.; Huang, W.J.; Zhao, C.J.; Wang, C.Z. Prediction of grain protein content in winter wheat (Triticum aestivum L.) using plant pigment ratio (PPR). Field Crops Res. 2004, 90, 311–321. [Google Scholar] [CrossRef]
  47. Gamon, J.A.; Peñuelas, J.; Field, C.B. A narrow-waveband spectral index that tracks diurnal changes in photosynthetic efficiency. Remote Sens. Environ. 1992, 41, 35–44. [Google Scholar] [CrossRef]
  48. Haboudane, D.; Miller, J.R.; Tremblay, N.; Zarco-Tejada, P.J.; Dextraze, L. Integrated narrow-band vegetation indices for prediction of crop chlorophyll content for application to precision agriculture. Remote Sens. Environ. 2002, 81, 416–426. [Google Scholar] [CrossRef]
  49. Merzlyak, M.N.; Gitelson, A.A.; Chivkunova, O.B.; Rakitin, V.Y.U. Non-destructive optical detection of pigment changes during leaf senescence and fruit ripening. Physiol. Plant. 1999, 106, 135–141. [Google Scholar] [CrossRef] [Green Version]
  50. Peñuelas, J.; Isla, R.; Filella, I.; Araus, J.L. Visible and Near-Infrared Reflectance Assessment of Salinity Effects on Barley. Crop Sci. 1997, 37, 198–202. [Google Scholar] [CrossRef]
  51. Broge, N.H.; Leblanc, E. Comparing prediction power and stability of broadband and hyperspectral vegetation indices for estimation of green leaf area index and canopy chlorophyll density. Remote Sens. Environ. 2001, 76, 156–172. [Google Scholar] [CrossRef]
  52. Babar, M.A.; Reynolds, M.P.; van Ginkel, M.; Klatt, A.R.; Raun, W.R.; Stone, M.L. Spectral Reflectance to Estimate Genetic Variation for In-Season Biomass, Leaf Chlorophyll, and Canopy Temperature in Wheat. Crop Sci. 2006, 46, 1046–1057. [Google Scholar] [CrossRef] [Green Version]
  53. Peñuelas, J.; Gamon, J.A.; Fredeen, A.L.; Merino, J.; Field, C.B. Reflectance indices associated with physiological changes in nitrogen- and water-limited sunflower leaves. Remote Sens. Environ. 1994, 48, 135–146. [Google Scholar] [CrossRef]
  54. Gitelson, A.A.; Merzlyak, M.N.; Chivkunova, O.B. Optical Properties and Nondestructive Estimation of Anthocyanin Content in Plant Leaves. Photochem. Photobiol. 2001, 74, 38–45. [Google Scholar] [CrossRef]
  55. Blackburn, G.A. Spectral indices for estimating photosynthetic pigment concentrations: A test using senescent tree leaves. Int. J. Remote Sens. 1998, 19, 657–675. [Google Scholar] [CrossRef]
  56. Chen, T.; Zhang, J.; Chen, Y.; Wan, S.; Zhang, L. Detection of peanut leaf spots disease using canopy hyperspectral reflectance. Comput. Electron. Agric. 2019, 156, 677–683. [Google Scholar] [CrossRef]
  57. Omran, E.-S.E. Early sensing of peanut leaf spot using spectroscopy and thermal imaging. Arch. Agron. Soil Sci. 2017, 63, 883–896. [Google Scholar] [CrossRef]
  58. Abdullah, M.Z.; Guan, L.C.; Mohd Azemi, B.M.N. Stepwise Discriminant Analysis for Colour Grading of Oil Palm Using Machine Vision System. Food Bioprod. Process. 2001, 79, 223–231. [Google Scholar] [CrossRef]
  59. Böhning, D. Multinomial logistic regression algorithm. Ann. Inst. Stat. Math. 1992, 44, 197–200. [Google Scholar] [CrossRef]
  60. Fukunada, K. Introduction to Statistical Pattern Recognition; Computer Science and Scientific Computing; Academic Press: Cambridge, MA, USA, 1990. [Google Scholar]
  61. Kaufman, Y.J.; Remer, L.A. Detection of forests using mid-IR reflectance: An application for aerosol studies. IEEE Trans. Geosci. Remote Sens. 1994, 32, 672–683. [Google Scholar] [CrossRef]
  62. Smith, A.M.S.; Drake, N.A.; Wooster, M.J.; Hudak, A.T.; Holden, Z.A.; Gibbons, C.J. Production of Landsat ETM+ reference imagery of burned areas within Southern African savannahs: Comparison of methods and application to MODIS. Int. J. Remote Sens. 2007, 28, 2753–2775. [Google Scholar] [CrossRef]
  63. De Castro, A.I.; Ehsani, R.; Ploetz, R.; Crane, J.H.; Abdulridha, J. Optimum spectral and geometric parameters for early detection of laurel wilt disease in avocado. Remote Sens. Environ. 2015, 171, 33–44. [Google Scholar] [CrossRef]
  64. Ashourloo, D.; Mobasheri, M.R.; Huete, A. Developing Two Spectral Disease Indices for Detection of Wheat Leaf Rust (Pucciniatriticina). Remote Sens. 2014, 6, 4723–4740. [Google Scholar] [CrossRef] [Green Version]
  65. Mahlein, A.K.; Rumpf, T.; Welke, P.; Dehne, H.W.; Plümer, L.; Steiner, U.; Oerke, E.C. Development of spectral indices for detecting and identifying plant diseases. Remote Sens. Environ. 2013, 128, 21–30. [Google Scholar] [CrossRef]
  66. Devadas, R.; Lamb, D.W.; Simpfendorfer, S.; Backhouse, D. Evaluating ten spectral vegetation indices for identifying rust infection in individual wheat leaves. Precis. Agric. 2009, 10, 459–470. [Google Scholar] [CrossRef]
  67. Gitelson, A.A.; Kaufman, Y.J.; Stark, R.; Rundquist, D. Novel algorithms for remote estimation of vegetation fraction. Remote Sens. Environ. 2002, 80, 76–87. [Google Scholar] [CrossRef] [Green Version]
  68. Jacquemoud, S.; Baret, F. PROSPECT: A model of leaf optical properties spectra. Remote Sens. Environ. 1990, 34, 75–91. [Google Scholar] [CrossRef]
  69. Malthus, T.J.; Madeira, A.C. High resolution spectroradiometry: Spectral reflectance of field bean leaves infected by Botrytis fabae. Remote Sens. Environ. 1993, 45, 107–116. [Google Scholar] [CrossRef]
  70. Franke, J.; Menz, G. Multi-temporal wheat disease detection by multi-spectral remote sensing. Precis. Agric. 2007, 8, 161–172. [Google Scholar] [CrossRef]
Figure 1. Location and overview of the experimental site.
Remotesensing 14 04988 g001
Figure 2. Leaves with different disease severity levels.
Remotesensing 14 04988 g002
Figure 3. Canopy images with different disease severity levels at the plant scale.
Remotesensing 14 04988 g003
Figure 4. The hyperspectral image at the field scale and a selected ROI.
Remotesensing 14 04988 g004
Figure 5. Flowchart of peanut LS detection using multi-scale hyperspectral reflectance.
Remotesensing 14 04988 g005
Figure 6. Mean and variance of the reflectance of different disease severity levels at multiple scales. (a) Leaf scale, (b) plant scale, and (c) field scale.
Remotesensing 14 04988 g006
Figure 7. The dispersion of each wavelength at multiple scales.
Remotesensing 14 04988 g007
Figure 8. Multi-scale sensitive wavelength selection.
Remotesensing 14 04988 g008
Figure 9. M-statistic values of the significantly correlated SIs.
Remotesensing 14 04988 g009
Figure 10. Comparison results of individual-scale SIs and multi-scale SI: (a) KNN; (b) MLR.
Remotesensing 14 04988 g010
Table 1. Disease severity levels at the leaf scale.
LevelDisease SeverityArea Ratio
AAsymptomatic DI = 0
IInitially symptomatic 0   <   DI     0.1
MModerately symptomatic 0.1   <   DI     0.25
SSeverely symptomatic 0.25   <   DI     0.5
Table 2. Number of samples at different scales.
Disease SeverityLeaf-Scale
Samples
Plant-Scale
Samples
Field-Scale
Samples
Asymptomatic261136148
Initially symptomatic338148157
Moderately symptomatic242138138
Severely symptomatic230112143
Total1071534586
Table 3. Commonly used SI construction methods.
MethodCalculation FormulaReference
Ratio spectral index (RSI) a   ×   R λ 1 R λ 3 + b   ×   R λ 1 R λ 2 [32]
Normalized difference spectral index (NDSI) a   ×   R λ 1     R λ 3 R λ 1   +   R λ 3   +   b   ×   R λ 1     R λ 2 R λ 1   +   R λ 2 [32]
New spectral index (NSI) a   ×   R λ 1   +   b   ×   R λ 2 R λ 3 [33]
Note: λ 1 is the most sensitive wavelength, λ 2 and λ 3 are the second most sensitive wavelengths, and the coefficients a and b are determined by fitting Fisher discriminant analysis based on the training dataset.
Table 4. SIs used in this study.
NO.SICalculation FormulaReference
1Simple ratio (SR) R 695 R 420 [36]
2Normalized difference vegetation index (NDVI) R 800 R 670 R 800 + R 670 [37]
3Aphid index (AI) R 761 R 908 R 712 R 719 [38]
4Structural independent pigment index (SIPI) R 800 R 445 R 800 R 680 [39]
5Damage-sensitive spectral index-1 (DSSI-1) R 719 R 873 R 509 R 537 R 719 R 87 + R 509 R 537 [40]
6Damage-sensitive spectral index-2 (DSSI-2) R 747 R 901 R 537 R 572 R 747 R 90 + R 537 R 572 [40]
7Chlorophyll index (CI) R 415 R 435 R 415 + R 435 [41]
8Chl stress index-1 (Chl SI-1) R 415 R 695 [42]
9Chl stress index-2 (Chl SI-2) R 708 R 915 [43]
10Chl stress index-3 (Chl SI-3) R 551 R 915 [43]
11Ratio analysis of reflectance spectral chlorophyll a (RARSa) R 675 R 700 [44]
12Ratio analysis of reflectance spectral chlorophyll b (RARSb) R 675 R 700   ×   R 650 [44]
13Ratio analysis of reflectance spectra chlorophyll c (RARSc) R 760 R 500 [44]
14Leaf hopper index (LHI) R 761 R 691 R 550 R 715 [45]
15Nitrogen stress index-1 (NSI-1) R 415 R 710 [42]
16Nitrogen stress index-2 (NSI-2) R 517 R 413 [43]
17Plant pigment ratio (PPR) R 550 R 450 R 550 + R 450 [46]
18Physiological reflectance index (PRI) R 550 R 531 R 550 + R 531 [47]
19Transformed chlorophyll absorption and reflectance index (TCARI) 3   ×   [ ( R 700 R 670 ) 0 . 2   ×   ( R 700 R 550 )   ×   R 700 R 670 ] [48]
20Modified chlorophyll absorption in reflectance index-1 (MCARI-1) 1.2   ×   [ 2.5   ×   ( R 800 R 670 )   1.3   ×   ( R 800 R 550 ) ] [35]
21Modified chlorophyll absorption in reflectance index-2 (MCARI-2) 1 . 5   ×   [ 2 . 5   ×   ( R 800 R 670 ) 1 . 3   ×   ( R 800 R 550 ) ]   SQ [ ( 2   ×   R 800 + 1 ) ˆ 2 ( 6   ×   R 800 5   ×   SQ ( R 670 ) ) 0 . 5 ] [35]
22Modified triangular vegetation index-1 (MTVI-1) 1 . 2   ×   [ 1 . 2   ×   ( R 800 R 550 ) 2 . 5 ( R 670 R 550 ) ] [35]
23Modified triangular vegetation index-2 (MTVI-2) 1 . 5   ×   [ 1 . 2   ×   ( R 800 R 550 ) 2 . 5 ( R 670 R 550 ) ] SQ [ ( 2   ×   R 800 + 1 ) ˆ 2 ( 6   ×   R 800 5   ×   SQ ( R 670 ) ) 0 . 5 ] [35]
24Plant senescence reflectance index (PSRI) R 678 R 550 R 750 [49]
25Water index (WI) R 970 R 900 [50]
26Triangle vegetation index (TVI) 0 . 5   ×   [ 120   ×   ( R 750 R 550 ) 200   ×   ( R 670 R 550 ) ] [51]
27Normalized water index-1 (NWI-1) R 970 R 900 R 970 + R 900 [52]
28Normalized water index-2 (NWI-2) R 970 R 850 R 970 + R 850 [52]
29Normalized pigment chlorophyll ratio index (NPCI) R 680 R 430 R 680 + R 430 [53]
30Anthocyanin reflectance index (ARI) 1 R 550 1 R 700 [54]
31Pigment-specific simple ratio (PSSRa) R 800 R 680 [55]
32Pigment-specific simple ratio (PSSRb) R 800 R 635 [55]
33Leaf spot index (LSI) R 938 R 761 R 938 R 761 [56]
34Early leaf spot index (ELSI) R 600 R 430 [57]
35Late leaf spot index (LLSI) R 701 R 569 [57]
36Leaf spot multi-scale spectral index 1 (LS-MSSI 1) R 770 R 660 + R 770 R 540 This study
37Leaf spot multi-scale spectral index 2 (LS-MSSI 2) R 770 R 660 R 770 + R 660 + R 770 R 540 R 770 + R 540 This study
38Leaf spot multi-scale spectral index 3 (LS-MSSI 3) R 770 + R 660 R 540 This study
Table 5. Confusion matrix.
Actual ClassPredicted Class
PositiveNegative
PositiveTPFN
NegativeFPTN
Table 6. Classification results of individual-scale sensitive wavelengths, multi-scale sensitive wavelengths, and full wavelengths.
ScaleWavelengths (nm)KNNMLR
OA (%)Kappa (%)OA (%)Kappa (%)
Leaf540, 660, 76089.7286.0693.8390.32
530, 640, 77091.5988.6293.4691.21
540, 650, 77089.1085.2192.2189.50
540, 660, 77089.4185.6292.2189.48
All98.4497.9195.9594.56
Plant 540, 660, 76084.3878.9690.0086.58
530, 640, 77086.8882.3590.6287.43
540, 650, 77083.1377.2592.5089.94
540, 660, 77085.6280.6491.8789.10
All91.8789.1390.0086.65
Field540, 660, 76087.4383.2488.5784.75
530, 640, 77088.0084.0288.0083.97
540, 650, 77087.4383.2288.5784.74
540, 660, 77087.4383.2289.1485.52
All89.7186.2789.1485.50
Table 7. The correlation coefficient of 38 SIs with disease severity levels.
NO.SILeaf ScalePlant ScaleField Scale
1SR0.57 0.47 −0.66
2NDVI−0.83 ** −0.70 −0.79
3AI0.91 ** 0.77 0.55
4SIPI−0.76 −0.64 −0.80 **
5DSSI-1−0.19 0.52 0.68
6DSSI-2−0.03 −0.56 −0.04
7CI−0.26 −0.11 0.10
8Chl SI-1−0.59 −0.45 0.65
9Chl SI-2−0.02 0.44 0.38
10Chl SI-3−0.61 0.22 0.62
11RARSa0.59 0.65 0.83 **
12RARSb−0.10 0.49 0.71
13RARSc−0.62 −0.62 −0.82 **
14LHI−0.47 −0.51 −0.72
15NSI-1−0.01 0.17 0.82 **
16NSI-2−0.23 −0.02 −0.47
17PPR−0.55 −0.50 −0.54
18PRI0.76 −0.31 −0.19
19TCARI−0.65 −0.76 −0.53
20MCARI-1−0.93 ** −0.94 ** −0.92 **
21MCARI-2−0.93 ** −0.94 ** −0.91 **
22MTVI-1−0.93 ** −0.94 ** −0.92 **
23MTVI-2−0.93 ** −0.94 ** −0.91 **
24PSRI0.77 0.02 0.11
25WI0.88 ** 0.51 0.58
26TVI−0.95 ** −0.94 ** −0.92 **
27NWI-10.88 ** 0.51 0.58
28NWI-20.93 ** 0.68 0.65
29NPCI0.78 0.75 0.05
30ARI0.92 ** 0.82 ** 0.27
31PSSRa−0.83 ** −0.70 −0.76
32PSSRb−0.70 −0.59 −0.80 **
33LSI0.92 ** 0.70 0.59
34ELSI0.36 0.20 0.07
35LLSI0.87 ** 0.80 ** −0.65
36LS-MSSI 1−0.91 ** −0.83 ** −0.81 **
37LS-MSSI 2−0.91 ** −0.83 ** −0.81 **
38LS-MSSI 3−0.95 ** −0.94 ** −0.92 **
Note: ** indicates a significant correlation.
Table 8. Classification results of SIs at multiple scales.
MethodVIsLeaf ScalePlant ScaleField Scale
OA (%)Kappa (%)OA (%)Kappa (%)OA (%)Kappa (%)
KNNMCARI-189.1085.2388.13 84.10 88.0083.97
MCARI-285.0579.7880.00 73.18 85.1480.17
MTVI-189.1085.2388.13 84.10 88.0083.97
MTVI-285.0579.7880.00 73.18 85.1480.17
TVI93.7791.5988.13 84.10 87.4383.23
LS-MSSI93.4691.1591.25 88.29 90.2987.04
MLRMCARI-188.4784.3888.13 84.11 87.4383.22
MCARI-285.6780.6585.63 80.75 86.8682.45
MTVI-188.4784.3888.13 84.11 87.4383.22
MTVI-285.6780.6585.63 80.75 86.8682.45
TVI93.7791.5988.75 84.95 86.8682.47
LS-MSSI93.7791.5992.50 89.97 88.5784.75
Publisher’s Note: MDPI stays neutral with regard to jurisdictional claims in published maps and institutional affiliations.

