


Statistical Characteristics of Warm Season Raindrop Size Distribution in the Beibu Gulf, South China
1
School of Geography and Tourism, Jiaying University, Meizhou 514015, China
2
Key Laboratory of Environment Change and Resources Use in Beibu Gulf, School of Geographic Sciences and Planning, Nanning Normal University, Ministry of Education, Nanning 530100, China
3
Key Laboratory of Remote Sensing of Gansu Province, Heihe Remote Sensing Experimental Research Station, Northwest Institute of Eco-Environment and Resources, Chinese Academy of Sciences, Lanzhou 730000, China
4
Southern Laboratory of Ocean Science and Engineering, Zhuhai 519000, China
5
Key Laboratory of Tropical Atmosphere-Ocean System, School of Atmospheric Sciences, Sun Yat-sen University, Ministry of Education, Zhuhai 519000, China
6
Key laboratory of Land Surface Process and Climate Change in Cold and Arid Regions, Northwest Institute of Eco-Environment and Resources, Chinese Academy of Sciences, Lanzhou 730000, China
7
Nagqu Station of Plateau Climate and Environment, Northwest Institute of Eco-Environment and Resources, Chinese Academy of Sciences, Nagqu 852000, China
*
Author to whom correspondence should be addressed.
Remote Sens. 2022, 14(19), 4752; https://doi.org/10.3390/rs14194752
Submission received: 3 August 2022
/
Revised: 10 September 2022
/
Accepted: 19 September 2022
/
Published: 23 September 2022
(This article belongs to the Special Issue Remote Sensing for Precipitation Retrievals)
Abstract
:Raindrop size distribution (DSD) can be used to improve the accuracy of radar quantitative precipitation estimation (QPE) and further understand the microphysical process of precipitation; however, its spatio-temporal characteristics vary with different climates, rain types, and geographical locations. Due to the lack of observations, the DSD characteristics in the Beibu Gulf, especially at the rainfall center of Guangxi in South China, is poorly understood. In this paper, these regional DSD characteristics were analyzed during the warm season with an upgraded version of the OTT Particle Size Velocity (Parsivel) (OTT2) disdrometer. The DSD datasets from June to October 2020 and March to May 2021 were grouped into convective and stratiform precipitation by rain rate (R). The rainfall parameters were calculated from DSDs to further understand the rain characteristics. The results showed that: (1) the regional DSDs feature the lowest concentration of largest-sized drops when compared with the statistical results for other areas such as Zhuhai in South China, Nanjing in East China, Hubei province in Central China and Beijing in North China; (2) the raindrop spectra have an excellent fit with the three-parameter gamma distribution, particularly in regard to the medium-size raindrops; (3) the – relation is closer to the coastal regions than the inland area of South China; (4) the localized Z−R relations differ greatly for convective rainfall (Z = 202.542 R1.553) and stratiform rainfall (Z = 328.793 R1.363). This study is the first study on DSDs in the Beibu Gulf region. The above findings will provide a better understanding of the microphysical nature of surface precipitation for different rain types along the Beibu Gulf in southern China, which may improve precipitation retrievals from remote sensing observations.
1. Introduction
As an important part of the global hydrological cycle, precipitation is the product of large-scale dynamical procedures as well as local microphysical processes [1]. Raindrop size distribution (DSD) is a basic characterization of rainfall microphysics that allows further understanding of the microphysical properties of rainfall processes, and improves the accuracy of rain rate (R) estimation. The DSD varies with rain types, weather systems, geographical locations, and seasons. Furthermore, the evaporation and precipitation rate of microphysical processes are associated with this parameter [2,3,4,5]. Knowledge of the rain DSD plays a key role in improving not only quantitative precipitation estimation (QPE) [6,7] but also in microphysical parameterizations in numerical weather prediction models [8,9]. Additionally, the modeling of DSD parameters is critical for rainfall estimation based on observations from active and passive satellite-based microwave sensors. For example, the precipitation estimation algorithms of both the Tropical Rainfall Measuring Mission (TRMM) precipitation radar and Global Precipitation Measurement Dual-Frequency precipitation radar use three-parameter gamma distribution [10].
Using accurate DSD and scattering models, essential variables such as the radar reflectivity factor (Z), liquid water content (LWC) and R can be simulated [11]. Two main types of ground-based disdrometers can be used to directly observe DSD, including acoustic and optical disdrometers. Acoustic disdrometers are still very limited for measuring rainfall parameters and are based on the produced sound when raindrops hit the water surface. In optical disdrometers, on the other hand, data acquisition comes from a light source (usually a laser) and a light detector (e.g., a photodiode), and relies on the signals derived from rainfall particles across the calculated area [12,13]. These measurements can provide spatially representative point information about the surrounding area [14].
A great number of studies have focused on the DSD characteristics in many parts of the world and have provided the relationship between radar variables, especially dual-polarization radar variables and rain rates. For example, these include the microphysical characteristics associated with seasonal and diurnal variations in Gadanki, Singapore and Kototabang [15], summer season rainfall over the Western Pacific [16], tropical cyclones and non-tropical cyclones over Darwin [17], and the pre-monsoon season, post-monsoon season and summer monsoon season over the coast of India [18]. Based on ground disdrometer observations over Beijing and Xinjiang, North China, several studies have highlighted the variation of DSDs in rainstorms and on the ground, the categorization of rain types and rain rates, and established the Z-R and polarimetric rainfall relationships [19,20,21,22,23,24]. Research has been done to better understand the microphysics of DSD and its variation by season and during the day and night time in the Tibetan Plateau [5,25,26], Central China [1,24], and East China [27,28,29]. By employing limited observations from disdrometers and radar, more and more studies have reported on a variety of rain DSDs in the Pearl River Delta region [19,30,31,32,33,34,35], Fujian province [36,37], and Taiwan [10,38] in South China. These studies’ results indicate that DSDs have different characteristics based on precipitation types, seasons, orography, and weather systems including typhoons and squall lines. Therefore, by statistically analyzing such raindrop size information, the average DSDs can be considered as regionally representative. Through these studies, a series of relational expressions for different regions are proposed for the QPE of radar variables and rain rate, including various combination relations of reflectivity at horizontal polarization (), differential reflectivity (), specific differential phase shift () and R. For instance, relations such as , , , , and so on could be suitable for local precipitation characteristics. Such relationships are effective in improving the accuracy of radar QPE and forecasts for local areas.
In contrast, none of the studies have examined the microphysical characteristics of precipitation in the Guangxi Beibu Gulf in southern China, which is an integral part of China; not only is it situated in an important connecting area between South China, Southwest China, and the Association of Southeast Asian Nations (ASEAN) economic circle, but it is also the only coastal area in southwestern China and the remaining maritime corridor between China and ASEAN countries [39]. In this study, raindrop size distributions are given for the coastal Beibu Gulf in Guangxi, South China. Particularly, the low vortex type of heavy rainfall mainly occurs along the coastline of Guangxi Province, and the convective available potential energy in the low vortex type is the strongest [40]. The objective of this study was to quantitatively analyze the variation in the warm season DSD from June to October 2020 and March to May 2021 in the Qinzhou area, one of the rainy centers in Guangxi, South China [40,41]. South China is located in the East Asian monsoon region and is one of the regions with the highest precipitation in China. An analysis of the characteristics of the rainfall over South China can bring significant predictive value to the shift of rain belts in China [42]. Consequently, the research on DSD characteristics in the Beibu Gulf is crucial in understanding the shift of rain belts in China, and can help to improve the accuracy of QPE based on local weather radar observations.
Following this introduction, Section 2 briefly describes the datasets and methods utilized in this study. Section 3 introduces the DSD statistical results for different rainfall types in detail and compares their characteristics. Section 4 includes the summary and conclusions drawn from the observations.
2. Data and Methods
2.1. Datasets and Instruments
The datasets used in this study were collected with an upgraded version of the OTT Parsivel disdrometer (OTT2) at Qinzhou station (21.7°N, 108.5°E) located in the coastal Beibu Gulf in South China (Figure 1). The Beibu Gulf has a subtropical monsoon climate with southerly ocean winds prevailing from April to September and abundant rainfall [39]. Usually, summer in Guangxi is long, humid, and hot [43]. The temperature is high with occasional typhoons in October, such as Nangka in 2020. Therefore, data spanning the warm season from June to October 2020 and March to May 2021 were selected for the present study. The DSD characteristics of tropical cyclones are distinct from those of seasonal rainfall [17,44], thus rain DSD datasets collected during typhoons were excluded in this study. The geographic location of the disdrometer is illustrated by the red thimble in Figure 1. The results from this disdrometer can be used to characterize the DSD of the coastal Beibu Gulf since the observations were situated along the coast and in the hilly area while the observed area avoids the mountainous terrain.
The accuracy of the OTT2 measurements was affected by various factors such as noise and sampling effects, which include strong winds and raindrop splashes. These potential instrument errors may result in unrealistically small fast-falling and large slow-falling particles [16]. Herein, the following data quality controls were implemented for this research: (1) one-minute samples with raindrop numbers of less than 10 or a rain rate of less than 0.5 mm/h obtained from the disdrometer were considered as noise and eliminated; (2) raindrops with diameters over 8 mm (bin 24–32) were excluded since the bigger the diameter, the flatter the shape, and the greater the difference between and the drop size directly derived by the instrument [19,29,33,45]. Finally, 6369 one-minute DSD samples for the warm season were used in this study. Similar to the classification scheme of Bringi et al. [3] and Chen et al. [29], a standard deviation of R () over 10 consecutive DSD samples was used. If R 5.0 mm h−1 and 1.5 mm h−1, this was categorized as convective rainfall, otherwise, if R 0.5 mm h−1 and 1.5 mm h−1, it was assumed to be stratiform or else it was removed from the investigation. As a result, this study consists of nearly 6.8% and 53.9% convective (432 one-minute samples) and stratiform (3435 one-minute samples) rainfall samples, respectively. The mean R values for convective and stratiform rains are 30.07 mm h−1 and 1.53 mm h−1, respectively.
The OTT2 disdrometer is a laser-optical measurement device based on laser attenuation of particles passing through a beam. It can comprehensively and reliably measure various types of precipitation. DSD parameters such as rainfall intensity, radar reflectivity, and precipitation type can be inferred by measuring the particle size and falling velocity of raindrops [14,46]. The optical sensor of the instrument produces a nominal sampling area of 54 cm2, but the effective sampling area is recalculated as 180 × (30 − /2))/106 m2 ( stands for raindrop size) considering the boundary effect of the instrument in the actual detection. The OTT2′s spectral data are divided into 32 diameter bins by 32 fall speed bins. The diameter ranges from 0 to 25 mm, and the class width increases from 0.125 to 3 mm. Usually, the first two size classes (bin 1–2) are discarded and the minimum detectable diameter is approximately 0.25 mm because of the low signal-to-noise ratio. The falling speed ranges from 0 to 20 m s−1 and the class width grows with the falling speed. The OTT2 is an upgraded, second-version OTT Parsivel after the first-generation OTT Parsivel (OTT1) and it provides better homogeneity of the laser sheet than the OTT1 by using a more expensive laser device; thus, its accuracy has been improved [45,47].
2.2. Raindrop Size Distribution
According to the selected DSD samples, the concentration of raindrops per unit volume per unit size interval for raindrop diameter, (mm−1 m−3), can be given by
where denotes the raindrop counts within the size bin and velocity bin ; S(m2) and ∆T(s) are the effective sampling area and time (set to 60 s), respectively. (m/s) is the falling speed for velocity bin j, and (mm) represents the width of the diameter interval at the size . However, the falling speed measurements from the OTT2 were not used in this study because they were overestimated when the fall velocity of the raindrops was over 3.35 mm [47]. Instead, the model-based velocity relation, which can obtain more realistic doppler spectra [48] as follows, was used to access raindrop observations.
The nth-moment of the DSD () is defined as
The gamma distribution is popularly used to model rain DSDs [4] and it shows excellent agreement with the observed raindrop spectra [49]. The gamma distribution is expressed as
where , , are the numerical concentration, the shape, and the slope parameter, respectively, when D (mm) is the equivalent volume diameter. Furthermore, the three control parameters in this paper were estimated from the gamma DSD by the truncated second-third-fourth moment estimator [50].
Based on the measured DSD and fall velocity, the integral rainfall parameters such as the radar reflectivity factor (Z, mm6 m−3), liquid water content (LWC, g m−3), rain rate (R, mm h−1), mass-weighted mean diameter (, mm) and normalized intercept parameter (, m−3 mm−1) were calculated as follows to further determine the characteristics of the rainfall. Additionally, the calculation of the reflectivity factor (Z) uses the scattering amplitudes from a T-matrix method [51].
where represents the S-band radar wavelength (10 cm), considering that the S-band dual-polarization weather radar is widely used for monitoring severe storms and tropical cyclones over coastal regions; and are the minimum and maximum raindrop size, respectively; denotes the dielectric constant factor of water; and (mm) is the backscattering amplitude of the droplet at the horizontal polarization.
where (1.0 g cm−3) is the density of water.
3. Results
3.1. Distribution of Dm and Nw
Figure 2 presents the frequency histograms of and for the whole dataset and each rain type dataset. The key indexes such as the mean (Mean), standard deviation (SD), and skewness (SK) were also calculated as shown in Figure 2. Regarding the whole dataset (Figure 2a), the histogram is slightly negatively skewed, whereas the histogram shows positive skewness. The standard deviation of and are both large (0.56 for and 0.48 for ), suggesting that the variability of and for the analyzed dataset is high. When the whole dataset is grouped into convective and stratiform, it is interesting to note that all the histograms also have positive skewness while all the values are negatively skewed (Figure 2b,c). Compared to convective rainfall, stratiform rainfall has lower skewness on both the and histogram, while showing a larger standard deviation for but a smaller standard deviation for . In comparison with the stratiform, the convective histogram exhibits a larger value of and .
On average, the overall DSD in the Beibu Gulf is characterized by the largest-sized drops (1.70 for ) and lowest concentrations (3.15 for ) when compared to those of other regions such as Zhuhai in South China (1.46 for , 3.86 for ) [33], Nanjing in East China (1.40 for , 3.55 for ) [29], Hubei province in Central China (1.13 for , 3.76 for ) [1] and Beijing in North China (1.07 for , 3.58 for ) [22]. This is probably because the rain type in this study is primarily influenced by the low vortex type of heavy rainfall [40]. Additionally, both elevation difference and orographic effects are important to the variability of DSD characteristics in South China [33].
To further explore the raindrop spectra of both rain types, Figure 3 plots the distribution of – scatter points in addition to the statistical results from other areas that are more than 500 km away from this study in South China. The solid circles represent the average – taken from this study (Qinzhou). The plus signs represent the corresponding results reported by Zhang et al. (2019) for the summer monsoon climate of Zhuhai [33]. The cross symbol denotes the results of the summer precipitation in Longmen, which were obtained by Huo et al. (2019) [30]. The solid triangle shows the summer results in Taiwan from Seela et al. (2018) [10]. It is noted that different regions have different DSD characteristics, indicating that the results are different since they come from research in different regions of South China.
Figure 3 also depicts two boxes marked “marine-like” (with ≈ 1.5–1.75 mm and ≈ 4–4.5) and “continental-like” (with ≈ 2.0–2.75 mm and ≈ 3–3.5) as proposed by Bringi et al. (2003) [3]. In terms of the convective rain, none of the convective samples belong to the “marine-like” cluster, whereas 23.1% of the convective samples fall into the “continental-like” cluster even though the observations were located along the coast, possibly because of the orographic effects. This suggests that compared with the previously defined “marine-like” and “continental-like” clusters, no small-sized DSDs feature in a higher concentration, and some points are distinguished by a lower concentration of larger-size drops.
The mean and measured in Qinzhou (this study), Zhuhai, and Taiwan are all located in the coastal area. Both the Qinzhou and Zhuhai results are from the OTT2 disdrometer, while the Taiwan study uses the Joss–Waldvogel disdrometer (JWD) [10,33]. In addition, the mean and were measured by the OTT1 in Longmen, which is located inland [30]. It was interesting to find that the mean of this study was much lower than other regions. With regard to the mean , the other regions show smaller-sized drops, particularly in Longmen and Taiwan. Briefly, as shown in Figure 3, the rain DSDs of this study are also mainly characterized by the lowest concentration of largest-sized drops compared to the statistical results for surrounding areas in South China (Zhuhai, Longmen, and Taiwan). The research on Arecibo, Sydney [3] and northern China [20] found that the orographic effects may play a significant role in convective rain belonging to the continental-like cluster, with lower concentrations and larger mass-weighted diameters. Interestingly, the observed area in this study avoids the mountainous terrain, whereas the observed areas in Zhuhai [33], Longmen [30] and Taiwan [10] are closer to the mountains.
To investigate the variability of the and for rain types and rain rates, the and versus the convective rain rate (CR) and stratiform rain rate (SR), and the relations from the Zhuhai [33] and Longmen results [30] are shown in Figure 4. The –R and −R relationships are fitted power-law relationships calculated by the least-squares method. For both CR and SR plots, the −R and −R exponents from Zhang et al. [33], Huo et al. [30] and this paper are all positive, indicating that the and values increase with increased R for convective and stratiform rain relative to a lower R because of more efficient coalescence and breakup mechanisms [29].
For the –R relationships, the exponents from both Zhang et al. [33] and Huo et al. [30] are lower than those of this study and the raindrop size in Qinzhou in this study increases significantly faster for convective rainfall. There is no significant difference in the −R relation for both rain types between this study (Qinzhou) and the Longmen results, whereas the Zhuhai results show that the raindrop size increases faster for SR than CR with increased R compared with the Qinzhou results. Finally, the Zhuhai results overlap with the Qinzhou results in regard to the −R relation for stratiform rainfall. It can be seen that the raindrop size in this study has similar characteristics to those in Zhuhai, mainly because they have similar coastal locations. In this study, the shows the largest values among the three regions and tends to be a stable value of about 3.0 mm for convective precipitation and 2.8 mm for stratiform precipitation at a higher rain rate, which is expected in equilibrium-state DSD [3]. The −R relationship is not reported in the Longmen study. Although there is no pronounced difference in the −R relation between the Qinzhou and Zhuhai study for CR and SR due to the similar tendency and close gap. The −R relations in these two regions are quite different. For CR, the values from Qinzhou are very far from the Zhuhai result (Figure 4c), but the difference in the SR is smaller (Figure 4d). As concluded from Figure 4, raindrops increase as the rain rate increases over both the coastal and inland regions of South China, whereas the values over Zhuhai are higher than those over the Beibu Gulf. Compared to the convective rain, the stratiform values from Zhuhai are closer to the results of this study. As the Zhuhai study includes DSD observations over typhoon periods [33], typhoon DSDs encompass a larger concentration of small to moderate drop sizes [17], which may lead to the difference in the between Zhuhai and this study.
3.2. Composite Raindrop Spectra
To further understand the rainfall microphysical processes, Figure 5 shows the composite raindrop spectra for the two precipitation systems, which were obtained from the average of all the instant size spectra for each subset. Moreover, Table 1 lists the integral rain parameters and gamma parameters that were calculated from the composite spectra. Here, the composite raindrop spectrum for both rainfall systems was fitted to three-parameter gamma distribution models by truncated moments using the second, third and fourth moment method. The red line and the blue line in Figure 5 are the gamma function fitted for the convective and stratiform spectrum, respectively.
Generally, the spectral widths for the convective and stratiform precipitation become wider with the increased raindrop diameters. The convective spectrum is much broader than the stratiform spectrum and the is larger at each diameter D, revealing that R and LWC are much higher in convective regions than those from stratiform regions (see Table 1). The peaks of the two types of precipitation relatively overlapped, around 0.5 mm. Nevertheless, the maximum raindrop diameter of the convective spectra is 7.5 mm, while the stratiform spectrum is narrower, with a maximum raindrop diameter of 5.5 mm. A three-parameter gamma distribution can better depict the measured raindrop size distribution, particularly for convective rainfall and the medium raindrop sizes (1.0 to 3.25 mm) for stratiform rainfall. However, the gamma distribution does not fit so well with the large raindrop size in the stratiform spectrum for underestimating drops larger than 3.25 mm in diameter. Natural rain DSD may not be the same as the mathematically modeled gamma distribution [52], especially for stratiform rain in this study. The biases of RDSD parameters are not considered here (for more detailed error propagation from moment estimators to RDSD parameter estimators can be found in [52]). Furthermore, the three parameters of the gamma DSD for the convective spectrum are all smaller than those for the stratiform spectrum (Table 1).
3.3. μ−Λ Relation
It is known that the three parameters, intercept (), slope (), and shape (), are not separate from each other [4]. The – relationship not only provides useful information through the description of the mean behavior of DSD parameters and the characteristics of actual DSDs, but it also improves the retrieval of DSD parameters with measurements (e.g., radar reflectivity) from remote observation instruments (e.g., ground- and satellite-based radar), thus reducing the bias and standard errors in the retrieval of rainfall parameters [52]. The shape and slope relations are dependent on precipitation types, climatological conditions, and geographical location [1]. Figure 6 shows the scatterplot between the and values of convective rainfall. To minimize the sampling error effects, only convective DSDs with a large number of counts (over 1000) were selected in this study, and only those results with 0 20 were applicable since larger values were regarded as a result of measurement errors [52,53].
The – relations exhibited in Figure 6 by the red line, blue line, cyan line, and green line were derived from OTT2 observations in the Beibu Gulf, Zhuhai [33], the South China Sea [54], and using JWD measurements from Taiwan [10], respectively. These four studies use measurements from coastal locations in South China and show nearly consistent trends, which could be related to their similar locations. In particular, the relationships in the Beibu Gulf overlap with the results from Zhuhai with ranging from 2.0 to 3.0. However, the – relation in this work (Beibu Gulf) differs from Longmen’s study in the inland region, which is in Guangdong province in southern China [30], which gradually deviate from each other with the increased value. These results could possibly be due to different instruments, climatic regimes, rain microphysics, and geographical locations [55].
Ulbrich [4] found that the shape–slope relationship can also be expressed as , hence calculating by a given and . As illustrated in Figure 6, the fitted parameters in the coastal area of South China (Zhuhai, South China Sea, and Taiwan) are located in a relatively higher region than those of the Longmen study. When all five − relationships are derived for South China with a given value larger than 5 mm−1, the values in the Longmen study are lower than those of other coastal areas, showing that lower may lead to a smaller for the same . This result is similar to the study on Indian summer monsoons [55]. Figure 6 demonstrates that the DSDs in coastal regions show larger values compared to those in inland regions, revealing that the shape–slope relations rely on geographical location. Previous research has shown that a lower total concentration of drops and higher mass-weighted mean diameter appear from 0000–0600 LST and 1800–2400 LST than in the daytime (0600–1800 LST) in West Sumatra (coastal region) [56], while there are more large-size drops in the daytime precipitation over the Tibetan Plateau (inland region) [57]. Possibly, large drops contribute more to precipitation at night than during the daytime in coastal regions, whereas large drops contribute more to precipitation in the daytime in inland areas.
3.4. Z−R Relation
The relationship Z = aRb has been widely used in single polarized radar QPE. Nevertheless, the Z–R relations are not unique since the coefficient a and exponent b are considerably dependent on the DSD variability [21,58] and vary with rainfall types, atmospheric conditions, and geographical locations [59]. Therefore, a better understanding of the DSD characteristics in the Beibu Gulf during the warm season is helpful for improving radar rainfall estimation there.
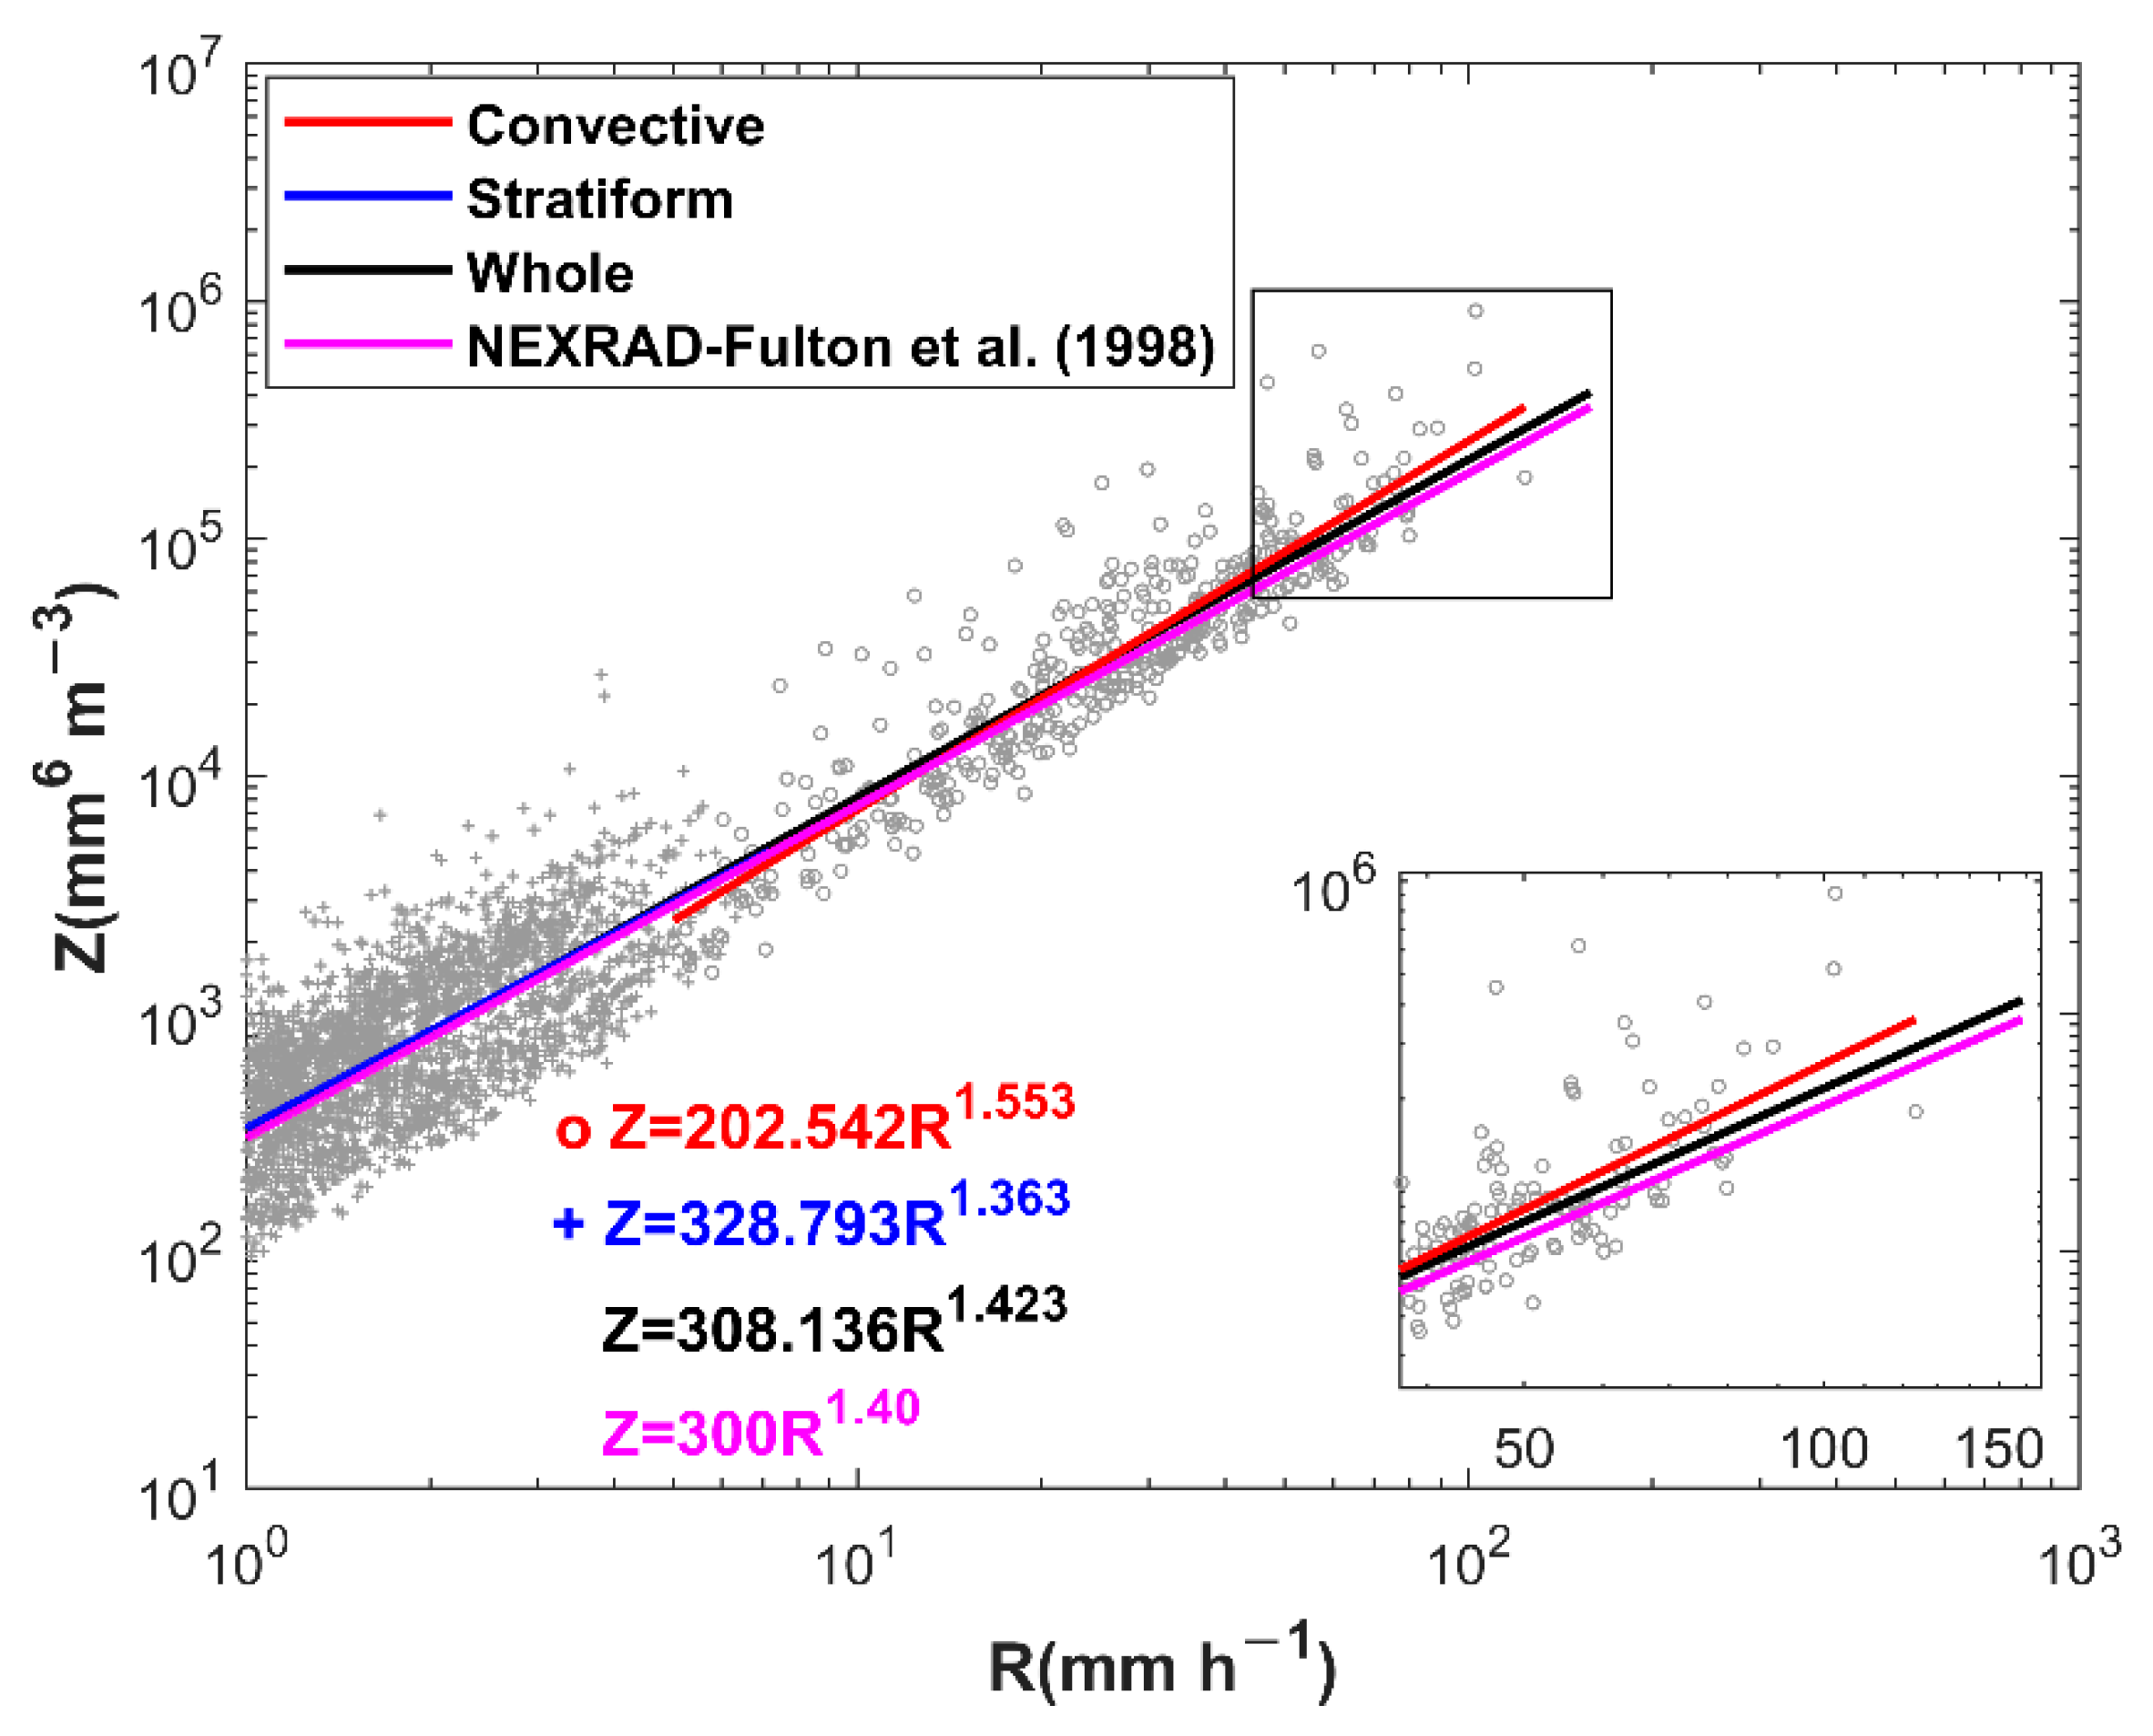
Figure 7 presents the scatterplots between radar reflectivity and rain rate for both precipitation types and the whole categorized dataset. The exponents from the three rainfall types are all over 1, mainly being influenced by the size or mixed controlled processes such as collision–coalescence [60,61]. However, the Z–R relations between convective rainfall and stratiform rainfall show great differences in regard to the coefficient and exponent. For a better comparison, Z = 300 R1.40 [62] for the standard Next-Generation Weather Radar (NEXRAD) of the United States is also overlaid in Figure 7. This relationship for the whole categorized dataset is in good agreement with the measured data.
In addition, the Z–R relations from other regions are also compared in Table 2. Interestingly, the coefficients for stratiform rainfall are all higher than that of convective rainfall in South China, whereas both East China and North China have higher coefficients for convective rainfall than for stratiform rainfall. This might be because South China is under the influence of the South China Sea (SCS) monsoon, thus the environmental conditions, as well as microphysical structures and processes in South China, are generally different from those of other continental regions [35,63]. Moreover, the obvious difference in these Z–R relations can be observed whether the same OTT2 disdrometers were used for similar climatic regimes or different regions with different disdrometers were studied in the similar period. Therefore, this paper further confirms the conclusion from previous studies, which is that Z–R relationships depends on the geographical locations, climatic regimes, and disdrometers [42,59].
4. Conclusions
In this paper, the DSD characteristics for the warm season (June–October 2020, March–May 2021) were studied using measurements from the OTT2 disdrometer deployed at a coastal site in the Beibu Gulf, South China. The main findings of this study are summarized as follows:
- (1)
- For the distribution of and , the histogram is negatively skewed, whereas the histogram shows positive skewness for all types of rainfall. The convective histogram exhibits a larger value of and than those for stratiform rain. The rain DSDs of this study are primarily characterized by the lowest concentration of largest-sized drops among the statistical results from other regions in China (Zhuhai, Longmen, and Taiwan in South China, Nanjing in East China, Hubei in Central China, and Beijing in North China), which match the continental-like cluster reported by Bringi et al. (2003) for some of the convective rain. The and of raindrops increase with increasing R in both the coastal and inland region of South China.
- (2)
- The raindrop spectra in this study for both convective and stratiform rain rates when diameters D range from 1.0 to 3.25 mm fit well with a three-parameter gamma distribution. The convective spectra have a larger at each size bin corresponding to a much higher R and LWC than those from the stratiform region. The three parameters for the gamma DSD of the convective spectra are all smaller than those of the stratiform spectra. The – relation in this paper is closer to the coastal region in Zhuhai, the South China Sea and Taiwan. The DSDs in these coastal areas have higher values than those in the inland area (Longmen in Guangdong province in southern China).
- (3)
- The Z–R relations differ greatly for convective rainfall (Z = 202.542 R1.553) and stratiform rainfall (Z = 328.793 R1.363), and when this relation is derived for the whole dataset (Z = 308.136 R1.423) it is in good agreement with the one for NEXRAD in the United States (Z = 300 R1.4). Obvious differences appeared for the Z–R relations whether the same OTT2 disdrometers were used for similar climatic regimes or different regions with different disdrometers were studied in a similar period.
This study is the first to investigate the characteristics of DSD measured by the OTT2 in the Guangxi Beibu Gulf, South China. Through the DSD results of this study, a series of relational expressions for the QPE of radar variables and precipitation rate can be proposed that are suitable for precipitation characteristics of the Beibu Gulf so that QPE developers can further improve the accuracy of radar QPE products in this region. Despite some interesting findings that were obtained from the DSD characteristics of different types of warm-season rainfall in the Beibu Gulf, these conclusions are not complete because the sample size of precipitation episodes is still limited and due to the lack of intensive observations for sufficient surface sites. Long-term observations should be adopted with more collected data. Moreover, the statistical characteristics of cold season on DSDs is not yet well understood, and observations during the cold season are needed to compare with the warm season. Instrumental errors will result in incorrect DSD measurements. Thus, the raindrop data from different observation tools such as radar, the two-dimensional video disdrometer (2DVD) and meteorological particle spectrometer (MPS) [33,64,65] can be used to better understand and compare the characteristics of DSD. Distinct weather categories such as typhoon cases can also be analyzed individually in the near future when more DSD data for typhoon cases are available for the Beibu Gulf. Some related research will be completed in our future work.
Author Contributions
S.C. conceived the conceptualization and methodology of this study; X.L. performed the experiments and analyzed the data; C.H. investigated and prepared the data; S.C., Z.L. and J.H. helped to analyze the results and revise the manuscript; X.L. and S.C. wrote the paper. All authors have read and agreed to the published version of the manuscript.
Funding
This research was funded by the National Natural Science Foundation of China (41875182), Key Laboratory of Environment Change and Resources Use in the Beibu Gulf (NNNU-KLOP-K2103) at Nanning Normal University, Guangxi Key R&D Program (Grant No. AB22035016, 2021AB40137), and the High-level Talent Program (E2290702) in the Northwest Institute of Eco-Environment and Resources, Chinese Academy of Sciences.
Data Availability Statement
Not applicable.
Acknowledgments
We thank Asi Zhang from Guangdong Meteorological Observatory, China for her helpful suggestion for this study. We also highly appreciate the detailed reviews and the helpful comments and suggestions from the editor and reviewers. Also, thanks for the support of Geography discipline construction project at Jiaying University.
Conflicts of Interest
The authors declare no conflict of interest.
References
- Fu, Z.; Dong, X.; Zhou, L.; Cui, W.; Wang, J.; Wan, R.; Leng, L.; Xi, B. Statistical Characteristics of Raindrop Size Distributions and Parameters in Central China During the Meiyu Seasons. J. Geophys. Res. Atmos. 2020, 125, e2019JD031954. [Google Scholar]
- Zhang, G.; Sun, J.; Brandes, E.A. Improving parameterization of rain microphysics with disdrometer and radar observations. J. Atmos. Sci. 2006, 63, 1273–1290. [Google Scholar] [CrossRef]
- Bringi, V.; Chandrasekar, V.; Hubbert, J.; Gorgucci, E.; Randeu, W.; Schoenhuber, M. Raindrop size distribution in different climatic regimes from disdrometer and dual-polarized radar analysis. J. Atmos. Sci. 2003, 60, 354–365. [Google Scholar] [CrossRef]
- Ulbrich, C.W. Natural variations in the analytical form of the raindrop size distribution. J. Clim. Appl. Meteorol. 1983, 22, 1764–1775. [Google Scholar] [CrossRef]
- Wang, G.; Zhou, R.; Zhaxi, S.; Liu, S. Raindrop size distribution measurements on the Southeast Tibetan Plateau during the STEP project. Atmos. Res. 2021, 249, 105311. [Google Scholar]
- Cifelli, R.; Chandrasekar, V.; Lim, S.; Kennedy, P.C.; Wang, Y.; Rutledge, S.A. A new dual-polarization radar rainfall algorithm: Application in Colorado precipitation events. J. Atmos. Ocean. Technol. 2011, 28, 352–364. [Google Scholar] [CrossRef]
- Chen, H.; Chandrasekar, V.; Bechini, R. An improved dual-polarization radar rainfall algorithm (DROPS2. 0): Application in NASA IFloodS field campaign. J. Hydrometeorol. 2017, 18, 917–937. [Google Scholar] [CrossRef]
- Milbrandt, J.; Yau, M. A multimoment bulk microphysics parameterization. Part II: A proposed three-moment closure and scheme description. J. Atmos. Sci. 2005, 62, 3065–3081. [Google Scholar] [CrossRef]
- Sun, J. Initialization and numerical forecasting of a supercell storm observed during STEPS. Mon. Weather Rev. 2005, 133, 793–813. [Google Scholar]
- Seela, B.K.; Janapati, J.; Lin, P.L.; Wang, P.K.; Lee, M.T. Raindrop size distribution characteristics of summer and winter season rainfall over north Taiwan. J. Geophys. Res. Atmos. 2018, 123, 11,602–611,624. [Google Scholar] [CrossRef]
- Marzano, F.S.; Cimini, D.; Montopoli, M. Investigating precipitation microphysics using ground-based microwave remote sensors and disdrometer data. Atmos. Res. 2010, 97, 583–600. [Google Scholar] [CrossRef]
- Baltas, E.; Panagos, D.; Mimikou, M. Statistical analysis of the raindrop size distribution using disdrometer data. Hydrology 2016, 3, 9. [Google Scholar] [CrossRef]
- Jwa, M.; Jin, H.-G.; Lee, J.; Moon, S.; Baik, J.-J. Characteristics of Raindrop Size Distribution in Seoul, South Korea According to Rain and Weather Types. Asia-Pac. J. Atmos. Sci. 2021, 57, 605–617. [Google Scholar] [CrossRef]
- Jaffrain, J.; Studzinski, A.; Berne, A. A network of disdrometers to quantify the small-scale variability of the raindrop size distribution. Water Resour. Res. 2011, 47, W00H06. [Google Scholar] [CrossRef]
- Kozu, T.; Reddy, K.K.; Mori, S.; Thurai, M.; Ong, J.T.; Rao, D.N.; Shimomai, T. Seasonal and diurnal variations of raindrop size distribution in Asian monsoon region. J. Meteorol. Soc. Japan. Ser. II 2006, 84, 195–209. [Google Scholar] [CrossRef]
- Wu, Z.; Zhang, Y.; Zhang, L.; Lei, H.; Xie, Y.; Wen, L.; Yang, J. Characteristics of summer season raindrop size distribution in three typical regions of western Pacific. J. Geophys. Res. Atmos. 2019, 124, 4054–4073. [Google Scholar] [CrossRef]
- Deo, A.; Walsh, K.J. Contrasting tropical cyclone and non-tropical cyclone related rainfall drop size distribution at Darwin, Australia. Atmos. Res. 2016, 181, 81–94. [Google Scholar] [CrossRef]
- Lavanya, S.; Kirankumar, N.; Aneesh, S.; Subrahmanyam, K.; Sijikumar, S. Seasonal variation of raindrop size distribution over a coastal station Thumba: A quantitative analysis. Atmos. Res. 2019, 229, 86–99. [Google Scholar] [CrossRef]
- Tang, Q.; Xiao, H.; Guo, C.; Feng, L. Characteristics of the raindrop size distributions and their retrieved polarimetric radar parameters in northern and southern China. Atmos. Res. 2014, 135, 59–75. [Google Scholar] [CrossRef]
- Wen, G.; Xiao, H.; Yang, H.; Bi, Y.; Xu, W. Characteristics of summer and winter precipitation over northern China. Atmos. Res. 2017, 197, 390–406. [Google Scholar] [CrossRef]
- Ma, Y.; Ni, G.; Chandra, C.V.; Tian, F.; Chen, H. Statistical characteristics of raindrop size distribution during rainy seasons in the Beijing urban area and implications for radar rainfall estimation. Hydrol. Earth Syst. Sci. 2019, 23, 4153–4170. [Google Scholar] [CrossRef]
- Ji, L.; Chen, H.; Li, L.; Chen, B.; Xiao, X.; Chen, M.; Zhang, G. Raindrop size distributions and rain characteristics observed by a PARSIVEL disdrometer in Beijing, Northern China. Remote Sens. 2019, 11, 1479. [Google Scholar] [CrossRef]
- Luo, L.; Xiao, H.; Yang, H.; Chen, H.; Guo, J.; Sun, Y.; Feng, L. Raindrop size distribution and microphysical characteristics of a great rainstorm in 2016 in Beijing, China. Atmos. Res. 2020, 239, 104895. [Google Scholar] [CrossRef]
- Li, H.; Zhang, Z. A Study of Raindrop Size Distributions in Central and Northwest China and Their Effects on Some Propagation Parameters for Wavelengths from 0.86 cm to 10 cm. Ann. Télécommun. 1980, 35, 405–410. [Google Scholar] [CrossRef]
- Chen, B.; Hu, Z.; Liu, L.; Zhang, G. Raindrop size distribution measurements at 4,500 m on the Tibetan Plateau during TIPEX-III. J. Geophys. Res. Atmos. 2017, 122, 11,092–011,106. [Google Scholar] [CrossRef]
- Wu, Y.; Liu, L. Statistical characteristics of raindrop size distribution in the Tibetan Plateau and southern China. Adv. Atmos. Sci. 2017, 34, 727–736. [Google Scholar] [CrossRef]
- Wen, L.; Zhao, K.; Wang, M.; Zhang, G. Seasonal variations of observed raindrop size distribution in East China. Adv. Atmos. Sci. 2019, 36, 346–362. [Google Scholar] [CrossRef]
- Pu, K.; Liu, X.; Wu, Y.; Hu, S.; Liu, L.; Gao, T. A comparison study of raindrop size distribution among five sites at the urban scale during the East Asian rainy season. J. Hydrol. 2020, 590, 125500. [Google Scholar] [CrossRef]
- Chen, B.; Yang, J.; Pu, J. Statistical characteristics of raindrop size distribution in the Meiyu season observed in eastern China. J. Meteorol. Soc. Japan. Ser. II 2013, 91, 215–227. [Google Scholar] [CrossRef]
- Huo, Z.; Ruan, Z.; Wei, M.; Ge, R.; Li, F.; Ruan, Y. Statistical characteristics of raindrop size distribution in south China summer based on the vertical structure derived from VPR-CFMCW. Atmos. Res. 2019, 222, 47–61. [Google Scholar] [CrossRef]
- Ma, N.; Liu, L.; Chen, Y.; Zhang, Y. Analysis of the Vertical Air Motions and Raindrop Size Distribution Retrievals of a Squall Line Based on Cloud Radar Doppler Spectral Density Data. Atmosphere 2021, 12, 348. [Google Scholar] [CrossRef]
- Liu, X.; Wan, Q.; Wang, H.; Xiao, H.; Zhang, Y.; Zheng, T.; Feng, L. Raindrop size distribution parameters retrieved from Guangzhou S-band polarimetric radar observations. J. Meteorol. Res. 2018, 32, 571–583. [Google Scholar] [CrossRef]
- Zhang, A.; Hu, J.; Chen, S.; Hu, D.; Liang, Z.; Huang, C.; Xiao, L.; Min, C.; Li, H. statistical characteristics of raindrop size distribution in the monsoon season observed in Southern China. Remote Sens. 2019, 11, 432. [Google Scholar] [CrossRef] [Green Version]
- Huang, H.; Zhao, K.; Zhang, G.; Lin, Q.; Wen, L.; Chen, G.; Yang, Z.; Wang, M.; Hu, D. Quantitative precipitation estimation with operational polarimetric radar measurements in southern China: A differential phase–based variational approach. J. Atmos. Ocean. Technol. 2018, 35, 1253–1271. [Google Scholar] [CrossRef]
- Huang, H.; Zhao, K.; Chan, J.C.; Hu, D. Microphysical Characteristics of Extreme-Rainfall Convection over the Pearl River Delta Region, South China from Polarimetric Radar Data during the Pre-summer Rainy Season. Adv. Atmos. Sci. 2022, 1–13. [Google Scholar] [CrossRef]
- Chen, B.-j.; Wang, Y.; Ming, J. Microphysical characteristics of the raindrop size distribution in Typhoon Morakot (2009). J. Trop. Meteorol. 2012, 18, 162–171. [Google Scholar]
- Bao, X.; Wu, L.; Zhang, S.; Li, Q.; Lin, L.; Zhao, B.; Wu, D.; Xia, W.; Xu, B. Distinct raindrop size distributions of convective inner-and outer-rainband rain in Typhoon Maria (2018). J. Geophys. Res. Atmos. 2020, 125, e2020JD032482. [Google Scholar] [CrossRef]
- Jung, S.-A.; Lee, D.-I.; Jou, B.J.-D.; Uyeda, H. Microphysical properties of maritime squall line observed on June 2, 2008 in Taiwan. J. Meteorol. Soc. Japan. Ser. II 2012, 90, 833–850. [Google Scholar] [CrossRef]
- Liu, Z.; Yang, H.; Wei, X. Spatiotemporal variation in precipitation during rainy season in Beibu Gulf, South China, from 1961 to 2016. Water 2020, 12, 1170. [Google Scholar] [CrossRef]
- Sun, J.; Zhang, Y.; Liu, R.; Fu, S.; Tian, F. A review of research on warm-sector heavy rainfall in China. Adv. Atmos. Sci. 2019, 36, 1299–1307. [Google Scholar] [CrossRef]
- Zhao, Y.; Deng, Q.; Lin, Q.; Cai, C. Quantitative analysis of the impacts of terrestrial environmental factors on precipitation variation over the Beibu Gulf Economic Zone in Coastal Southwest China. Sci. Rep. 2017, 7, 44412. [Google Scholar] [CrossRef] [PubMed]
- Lai, R.; Liu, X.; Hu, S.; Xiao, H.; Xia, F.; Feng, L.; Li, H. Raindrop size distribution characteristic differences during the dry and wet seasons in South China. Atmos. Res. 2022, 266, 105947. [Google Scholar] [CrossRef]
- Nie, C.; Li, H.; Yang, L.; Ye, B.; Dai, E.; Wu, S.; Liu, Y.; Liao, Y. Spatial and temporal changes in extreme temperature and extreme precipitation in Guangxi. Quat. Int. 2012, 263, 162–171. [Google Scholar] [CrossRef]
- Kumar, S.B.; Reddy, K.K. Rain drop size distribution characteristics of cyclonic and north east monsoon thunderstorm precipitating clouds observed over Kadapa (14.47 N, 78.82 E), tropical semi-arid region of India. Mausam 2013, 64, 35–48. [Google Scholar] [CrossRef]
- Tokay, A.; Petersen, W.A.; Gatlin, P.; Wingo, M. Comparison of raindrop size distribution measurements by collocated disdrometers. J. Atmos. Ocean. Technol. 2013, 30, 1672–1690. [Google Scholar] [CrossRef]
- Löffler-Mang, M.; Joss, J. An optical disdrometer for measuring size and velocity of hydrometeors. J. Atmos. Ocean. Technol. 2000, 17, 130–139. [Google Scholar] [CrossRef]
- Tokay, A.; Wolff, D.B.; Petersen, W.A. Evaluation of the new version of the laser-optical disdrometer, OTT Parsivel2. J. Atmos. Ocean. Technol. 2014, 31, 1276–1288. [Google Scholar] [CrossRef]
- Atlas, D.; Srivastava, R.; Sekhon, R.S. Doppler radar characteristics of precipitation at vertical incidence. Rev. Geophys. 1973, 11, 1–35. [Google Scholar] [CrossRef]
- Tokay, A.; Short, D.A. Evidence from tropical raindrop spectra of the origin of rain from stratiform versus convective clouds. J. Appl. Meteorol. Climatol. 1996, 35, 355–371. [Google Scholar] [CrossRef]
- Cao, Q.; Zhang, G. Errors in estimating raindrop size distribution parameters employing disdrometer and simulated raindrop spectra. J. Appl. Meteorol. Climatol. 2009, 48, 406–425. [Google Scholar] [CrossRef]
- Zhang, G.; Vivekanandan, J.; Brandes, E. A method for estimating rain rate and drop size distribution from polarimetric radar measurements. IEEE Trans. Geosci. Remote Sens. 2001, 39, 830–841. [Google Scholar] [CrossRef]
- Zhang, G.; Vivekanandan, J.; Brandes, E.A.; Meneghini, R.; Kozu, T. The shape–slope relation in observed gamma raindrop size distributions: Statistical error or useful information? J. Atmos. Ocean. Technol. 2003, 20, 1106–1119. [Google Scholar] [CrossRef]
- Cao, Q.; Zhang, G.; Brandes, E.; Schuur, T.; Ryzhkov, A.; Ikeda, K. Analysis of video disdrometer and polarimetric radar data to characterize rain microphysics in Oklahoma. J. Appl. Meteorol. Climatol. 2008, 47, 2238–2255. [Google Scholar] [CrossRef]
- Huang, C.; Chen, S.; Zhang, A.; Pang, Y. Statistical Characteristics of Raindrop Size Distribution in Monsoon Season over South China Sea. Remote Sens. 2021, 13, 2878. [Google Scholar] [CrossRef]
- Murali Krishna, U.V.; Das, S.K.; Sulochana, E.G.; Bhowmik, U.; Deshpande, S.M.; Pandithurai, G. Statistical characteristics of raindrop size distribution over the Western Ghats of India: Wet versus dry spells of the Indian summer monsoon. Atmos. Chem. Phys. 2021, 21, 4741–4757. [Google Scholar] [CrossRef]
- Ramadhan, R.; Vonnisa, M.; Hashiguchi, H.; Shimomai, T. Diurnal Variation in the Vertical Profile of the Raindrop Size Distribution for Stratiform Rain as Inferred from Micro Rain Radar Observations in Sumatra. Adv. Atmos. Sci. 2020, 37, 832–846. [Google Scholar] [CrossRef]
- CHANG, Y.; XueLiang, G. Characteristics of convective cloud and precipitation during summer time at Naqu over Tibetan Plateau. Chin. Sci. Bull. 2016, 61, 1706–1720. [Google Scholar] [CrossRef]
- You, C.H.; Kang, M.Y.; Lee, D.I.; Uyeda, H. Rainfall estimation by S-band polarimetric radar in Korea. Part I: Preprocessing and preliminary results. Meteorol. Appl. 2014, 21, 975–983. [Google Scholar] [CrossRef]
- Rosenfeld, D.; Ulbrich, C.W. Cloud Microphysical Properties, Processes, and Rainfall Estimation Opportunities. In Radar and Atmospheric Science: A Collection of Essays in Honor of David Atlas; Springer: Berlin/Heidelberg, Germany, 2003; pp. 237–258. [Google Scholar]
- Seela, B.K.; Janapati, J.; Lin, P.-L.; Lan, C.-H.; Shirooka, R.; Hashiguchi, H.; Reddy, K.K. Raindrop Size Distribution Characteristics of the Western Pacific Tropical Cyclones Measured in the Palau Islands. Remote Sens. 2022, 14, 470. [Google Scholar] [CrossRef]
- Steiner, M.; Smith, J.A.; Uijlenhoet, R. A microphysical interpretation of radar reflectivity–rain rate relationships. J. Atmos. Sci. 2004, 61, 1114–1131. [Google Scholar] [CrossRef]
- Fulton, R.A.; Breidenbach, J.P.; Seo, D.-J.; Miller, D.A.; O’Bannon, T. The WSR-88D rainfall algorithm. Weather Forecast. 1998, 13, 377–395. [Google Scholar] [CrossRef]
- Xu, W.; Zipser, E.J.; Liu, C. Rainfall characteristics and convective properties of mei-yu precipitation systems over South China, Taiwan, and the South China Sea. Part I: TRMM observations. Mon. Weather Rev. 2009, 137, 4261–4275. [Google Scholar] [CrossRef]
- Wen, L.; Zhao, K.; Zhang, G.; Liu, S.; Chen, G. Impacts of instrument limitations on estimated raindrop size distribution, radar parameters, and model microphysics during Mei-Yu season in East China. J. Atmos. Ocean. Technol. 2017, 34, 1021–1037. [Google Scholar] [CrossRef]
- Raupach, T.H.; Thurai, M.; Bringi, V.; Berne, A. Reconstructing the drizzle mode of the raindrop size distribution using double-moment normalization. J. Appl. Meteorol. Climatol. 2019, 58, 145–164. [Google Scholar] [CrossRef]
Figure 1.
Geographical location of the Beibu Gulf. The red-colored thimble shows the location of the OTT2.
Figure 1.
Geographical location of the Beibu Gulf. The red-colored thimble shows the location of the OTT2.

Figure 2.
Histogram of and for the whole (a), convective (b) and stratiform (c) subsets.

Figure 3.
Scatterplot of and for convective (sky blue) and stratiform (orange) rainfall during the warm season. MP denotes the Marshall–Palmer value of = 8000 or = 3.9 and the two gray rectangles show the “marine-like” and “continental-like” DSDs defined by Bringi et al. (2003) [3]. Solid circles illustrate the average result of Beibu Gulf warm rainfall, plus signs represent the Zhuhai result in monsoon season from Zhang et al. (2019) [33], cross symbols represent the Longmen result in summer from Huo et al. (2019) [30], and solid triangles represent the Taiwan result in summer from Seela et al. (2018) [10].
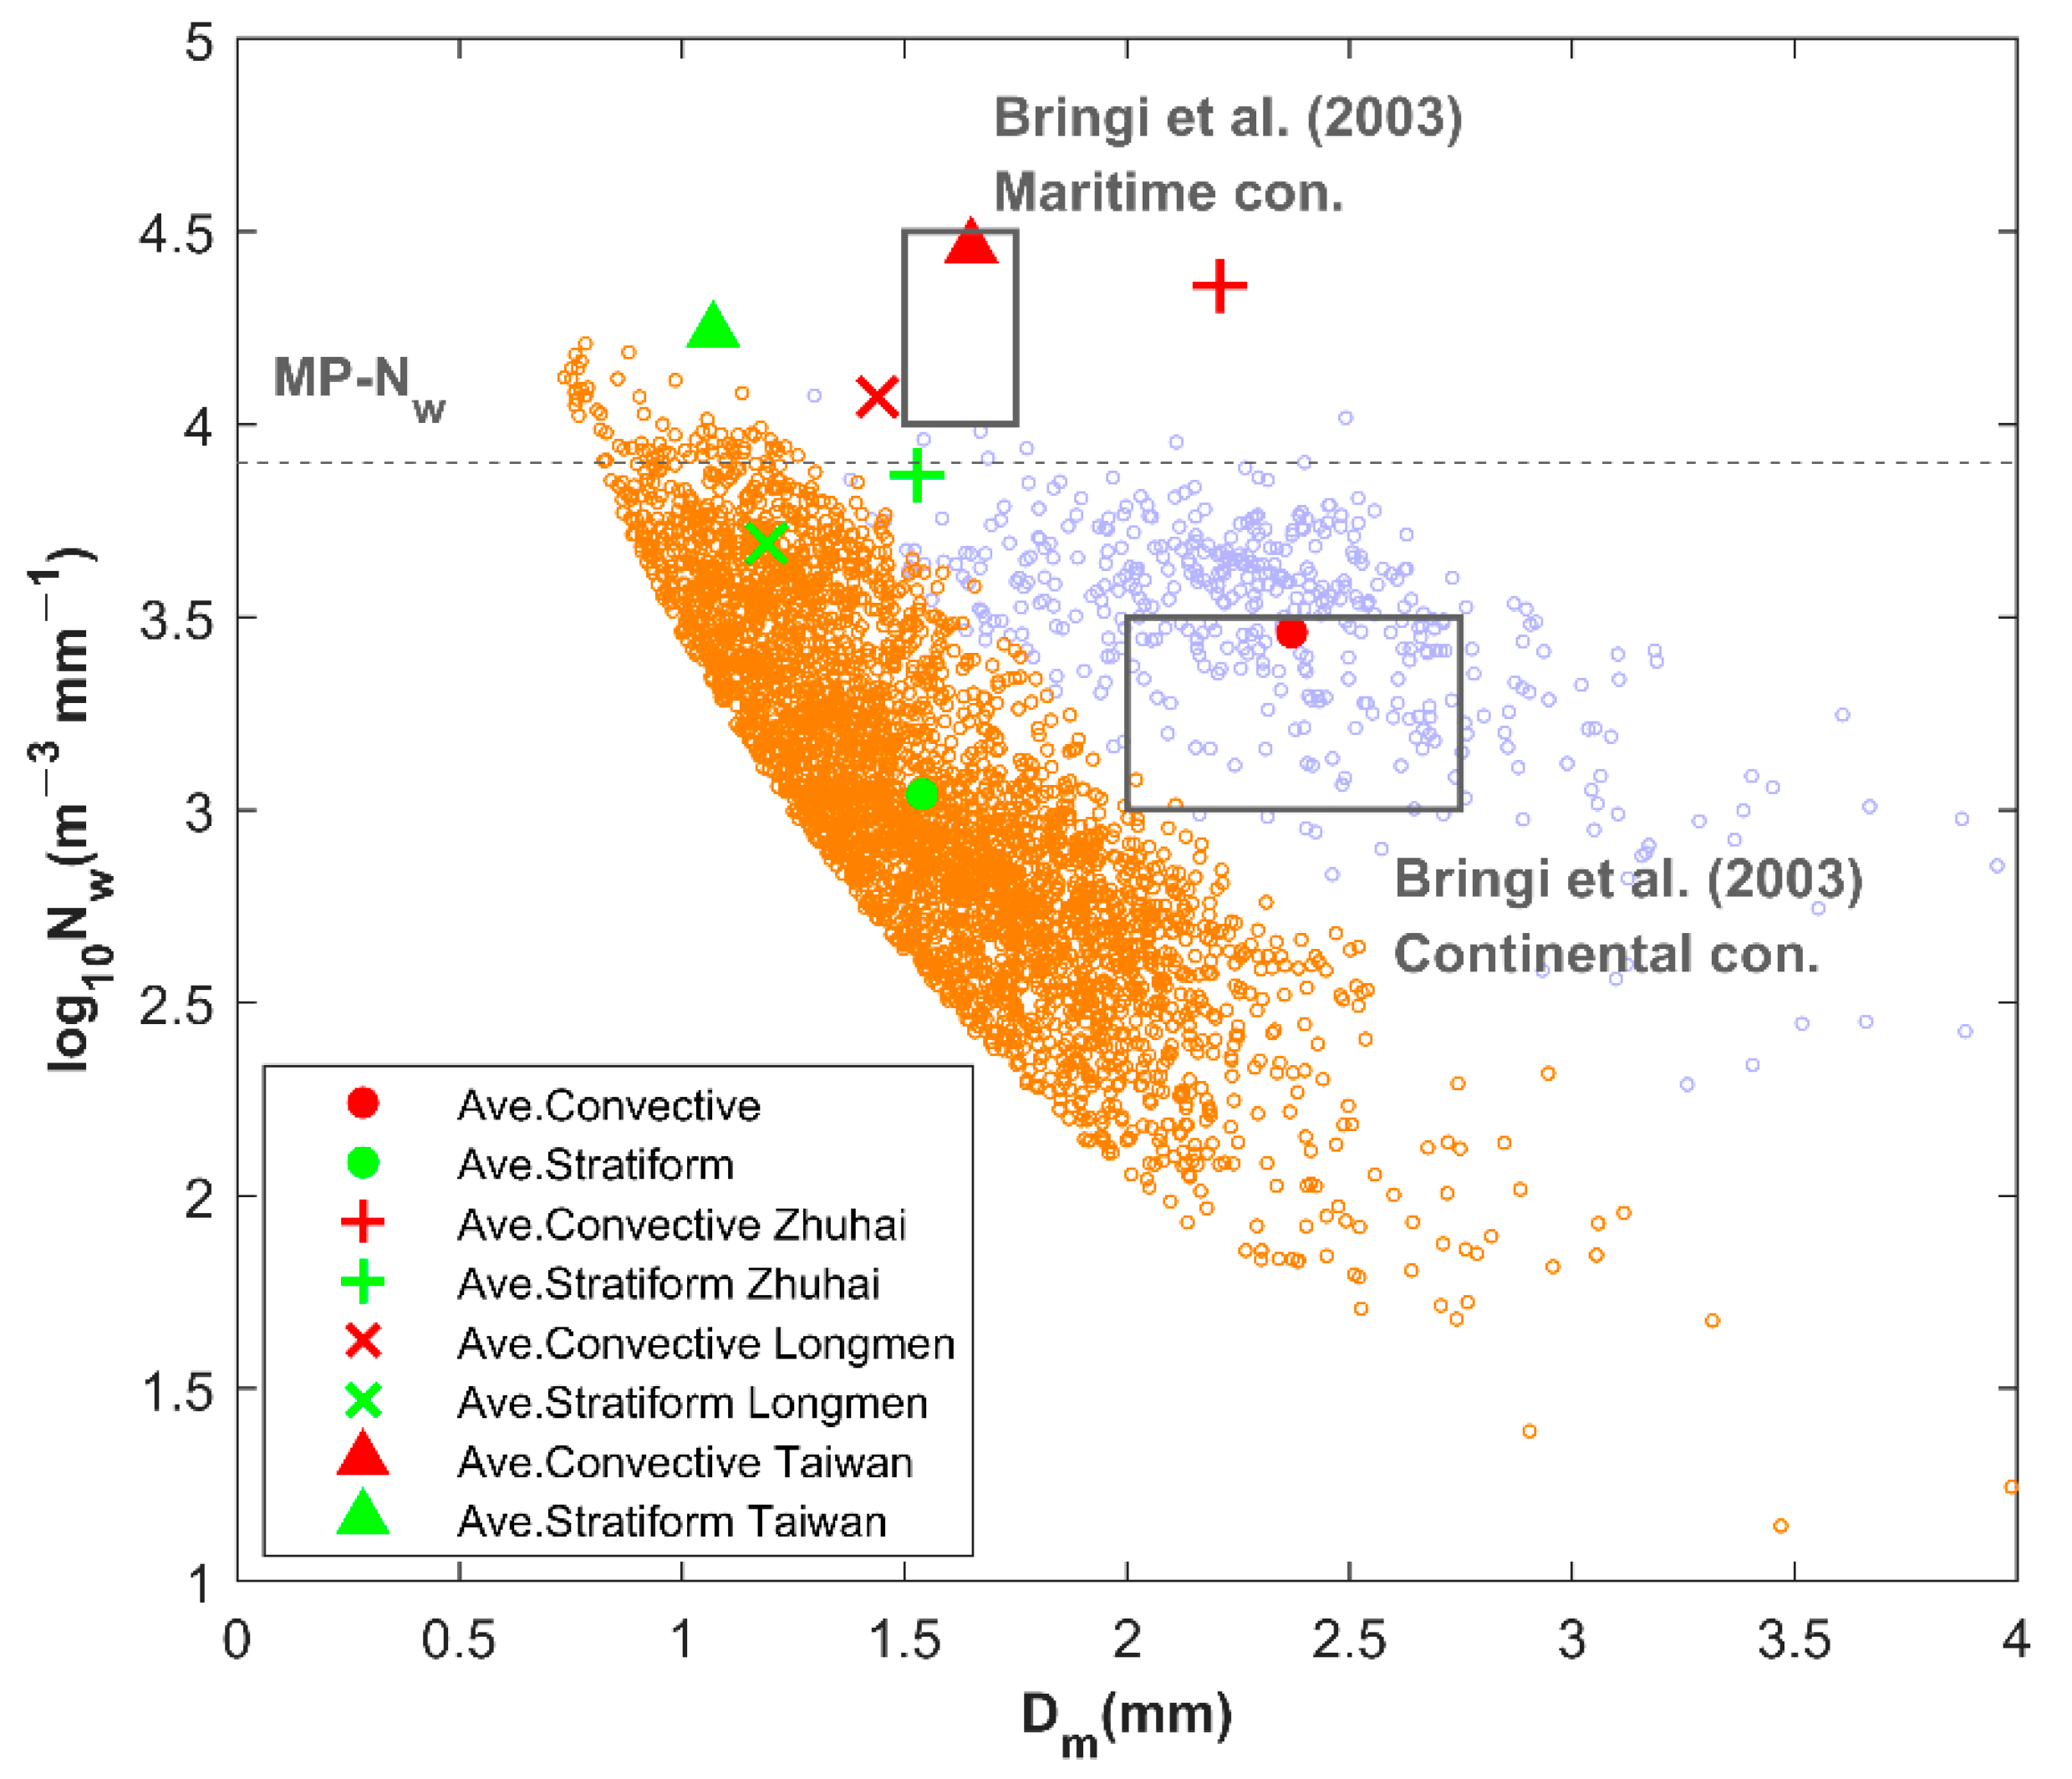
Figure 4.
Scatterplots of and vs. R for stratiform rain (SR) and convective rain (CR) as well as their fitted curves. (a) −R relationship and (c) −R relationship for SR; (b) −R relationship and (d) −R relationship for CR.
Figure 4.
Scatterplots of and vs. R for stratiform rain (SR) and convective rain (CR) as well as their fitted curves. (a) −R relationship and (c) −R relationship for SR; (b) −R relationship and (d) −R relationship for CR.
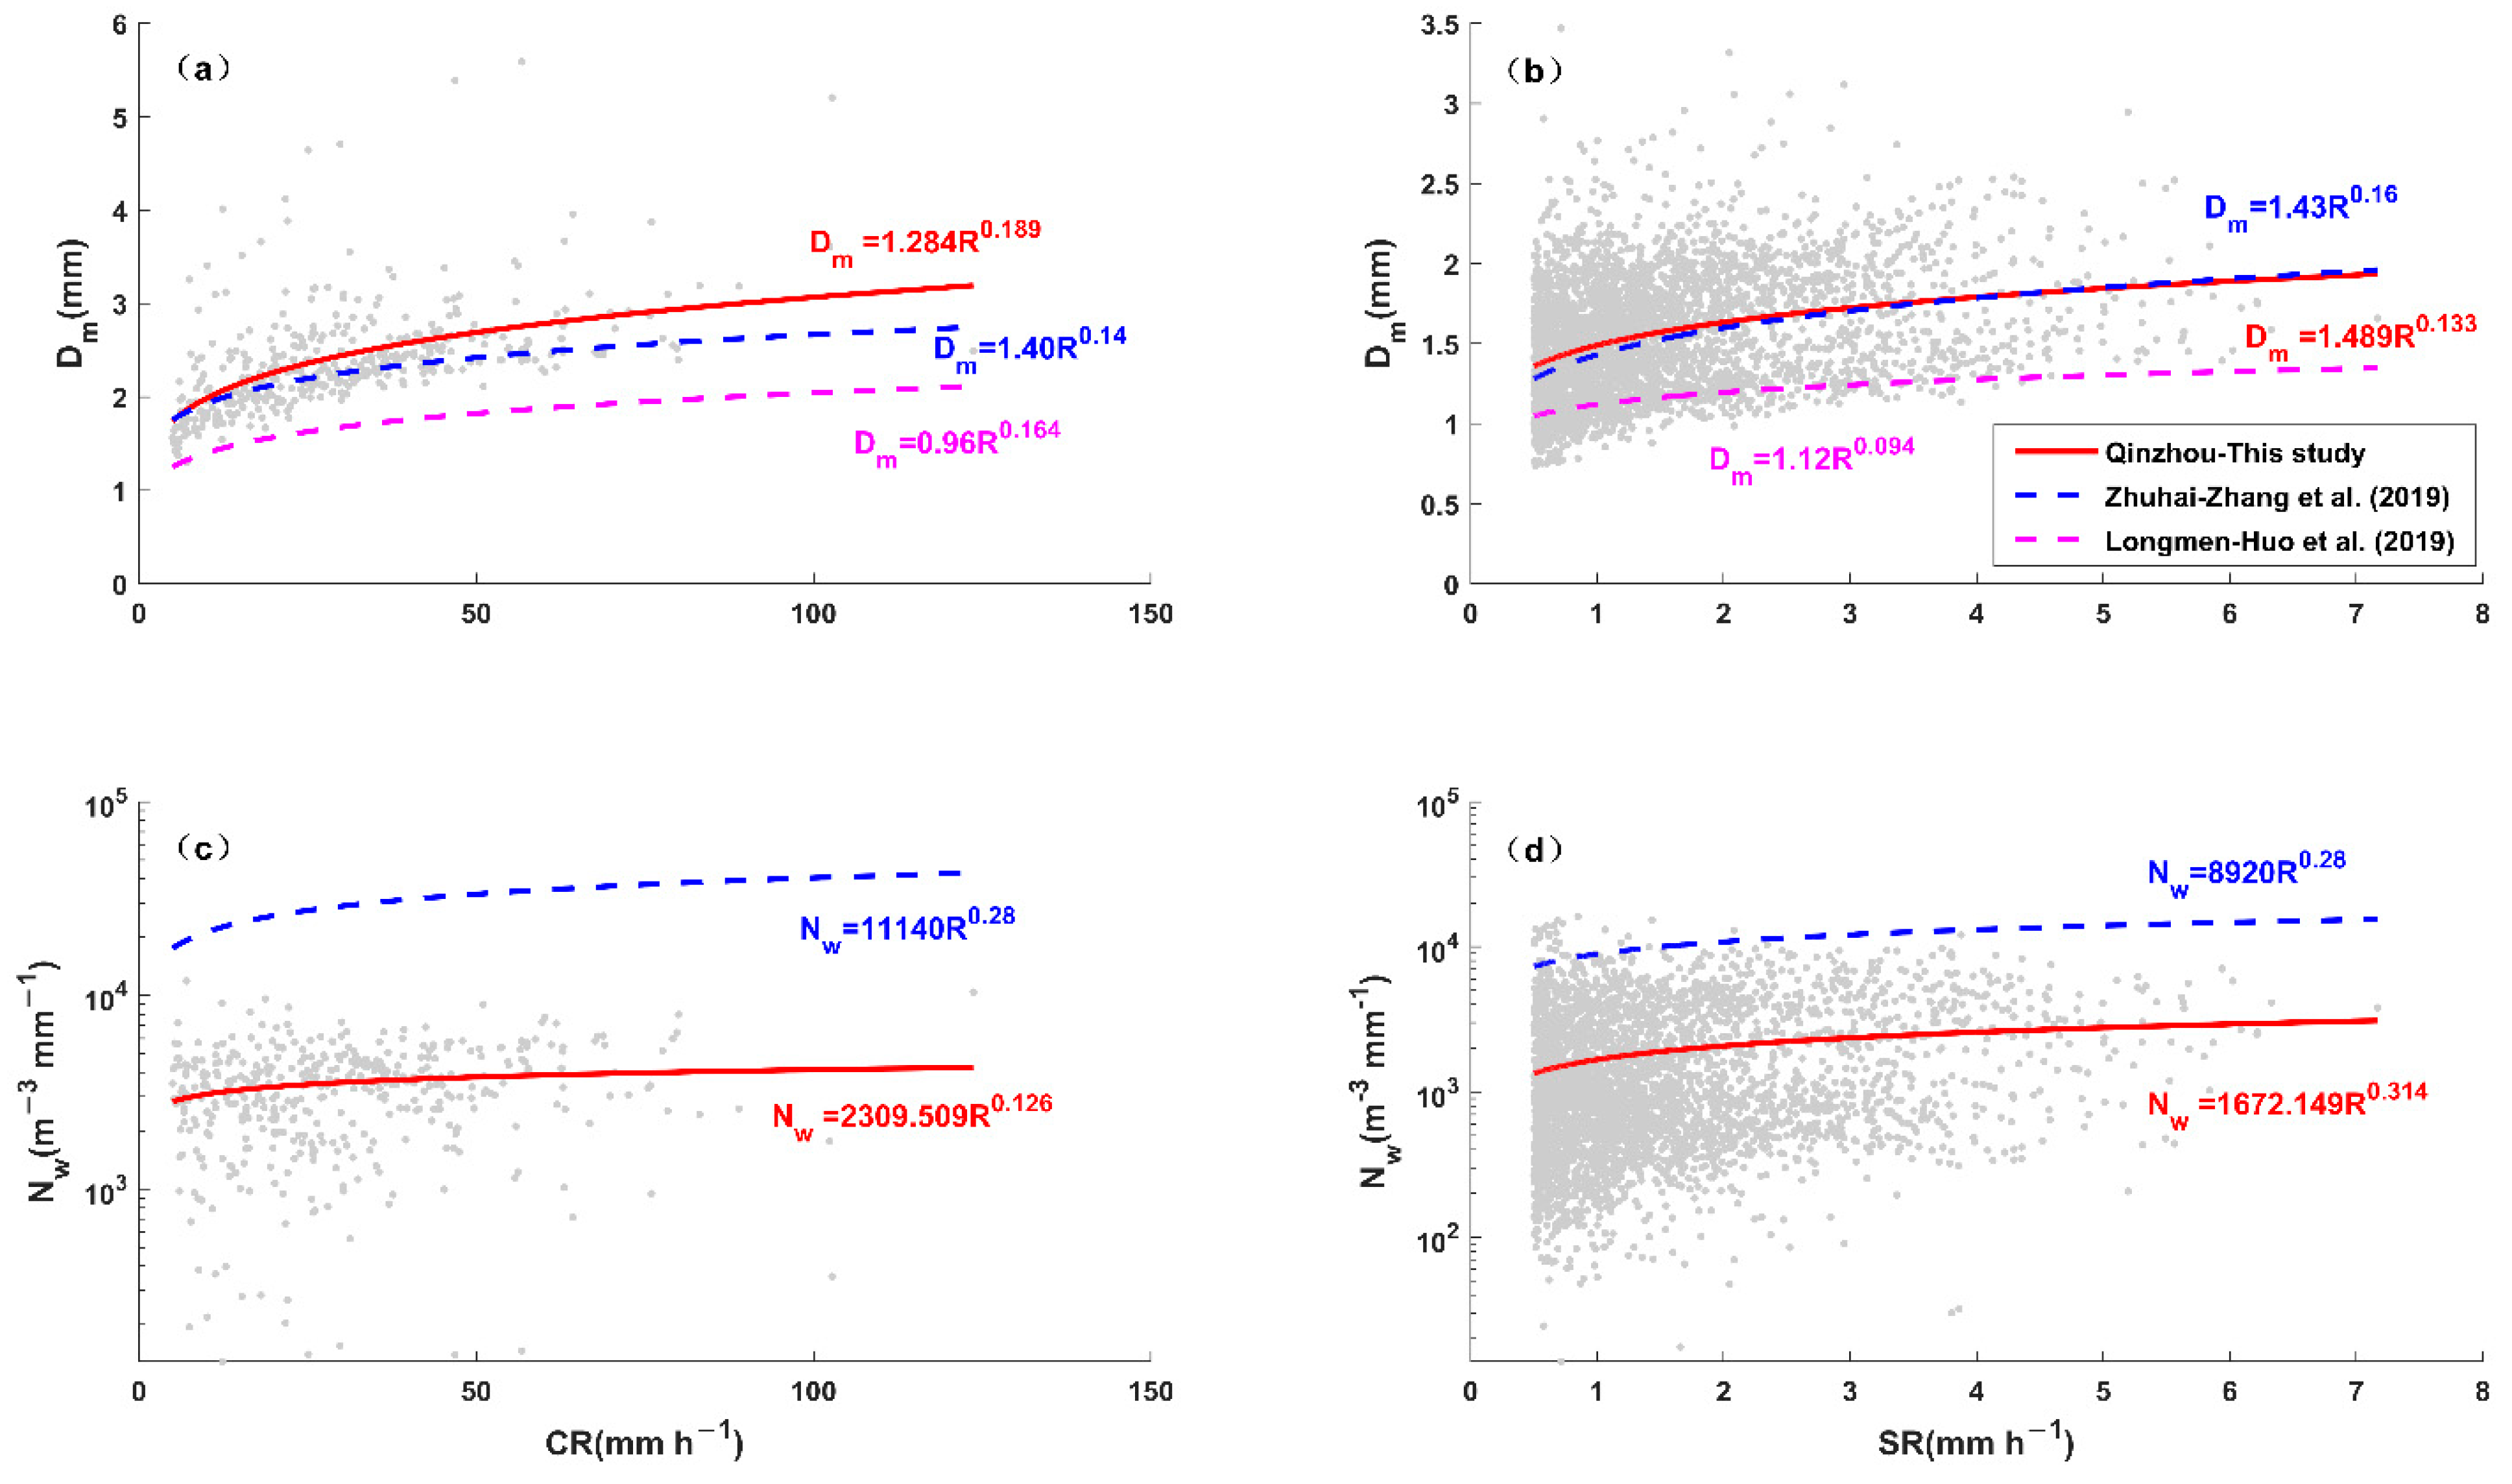
Figure 5.
Composite raindrop spectra for two different rain types (convective and stratiform).

Figure 6.
Scatterplots of versus for convective rainfall with the filtered whole drop counts over 1000. The red line, blue line, cyan line, green line and magenta line exhibit the results from this study and other areas of South China. The black dashed lines show the corresponding expression with of 1.5, 2.0, and 3.0 mm.
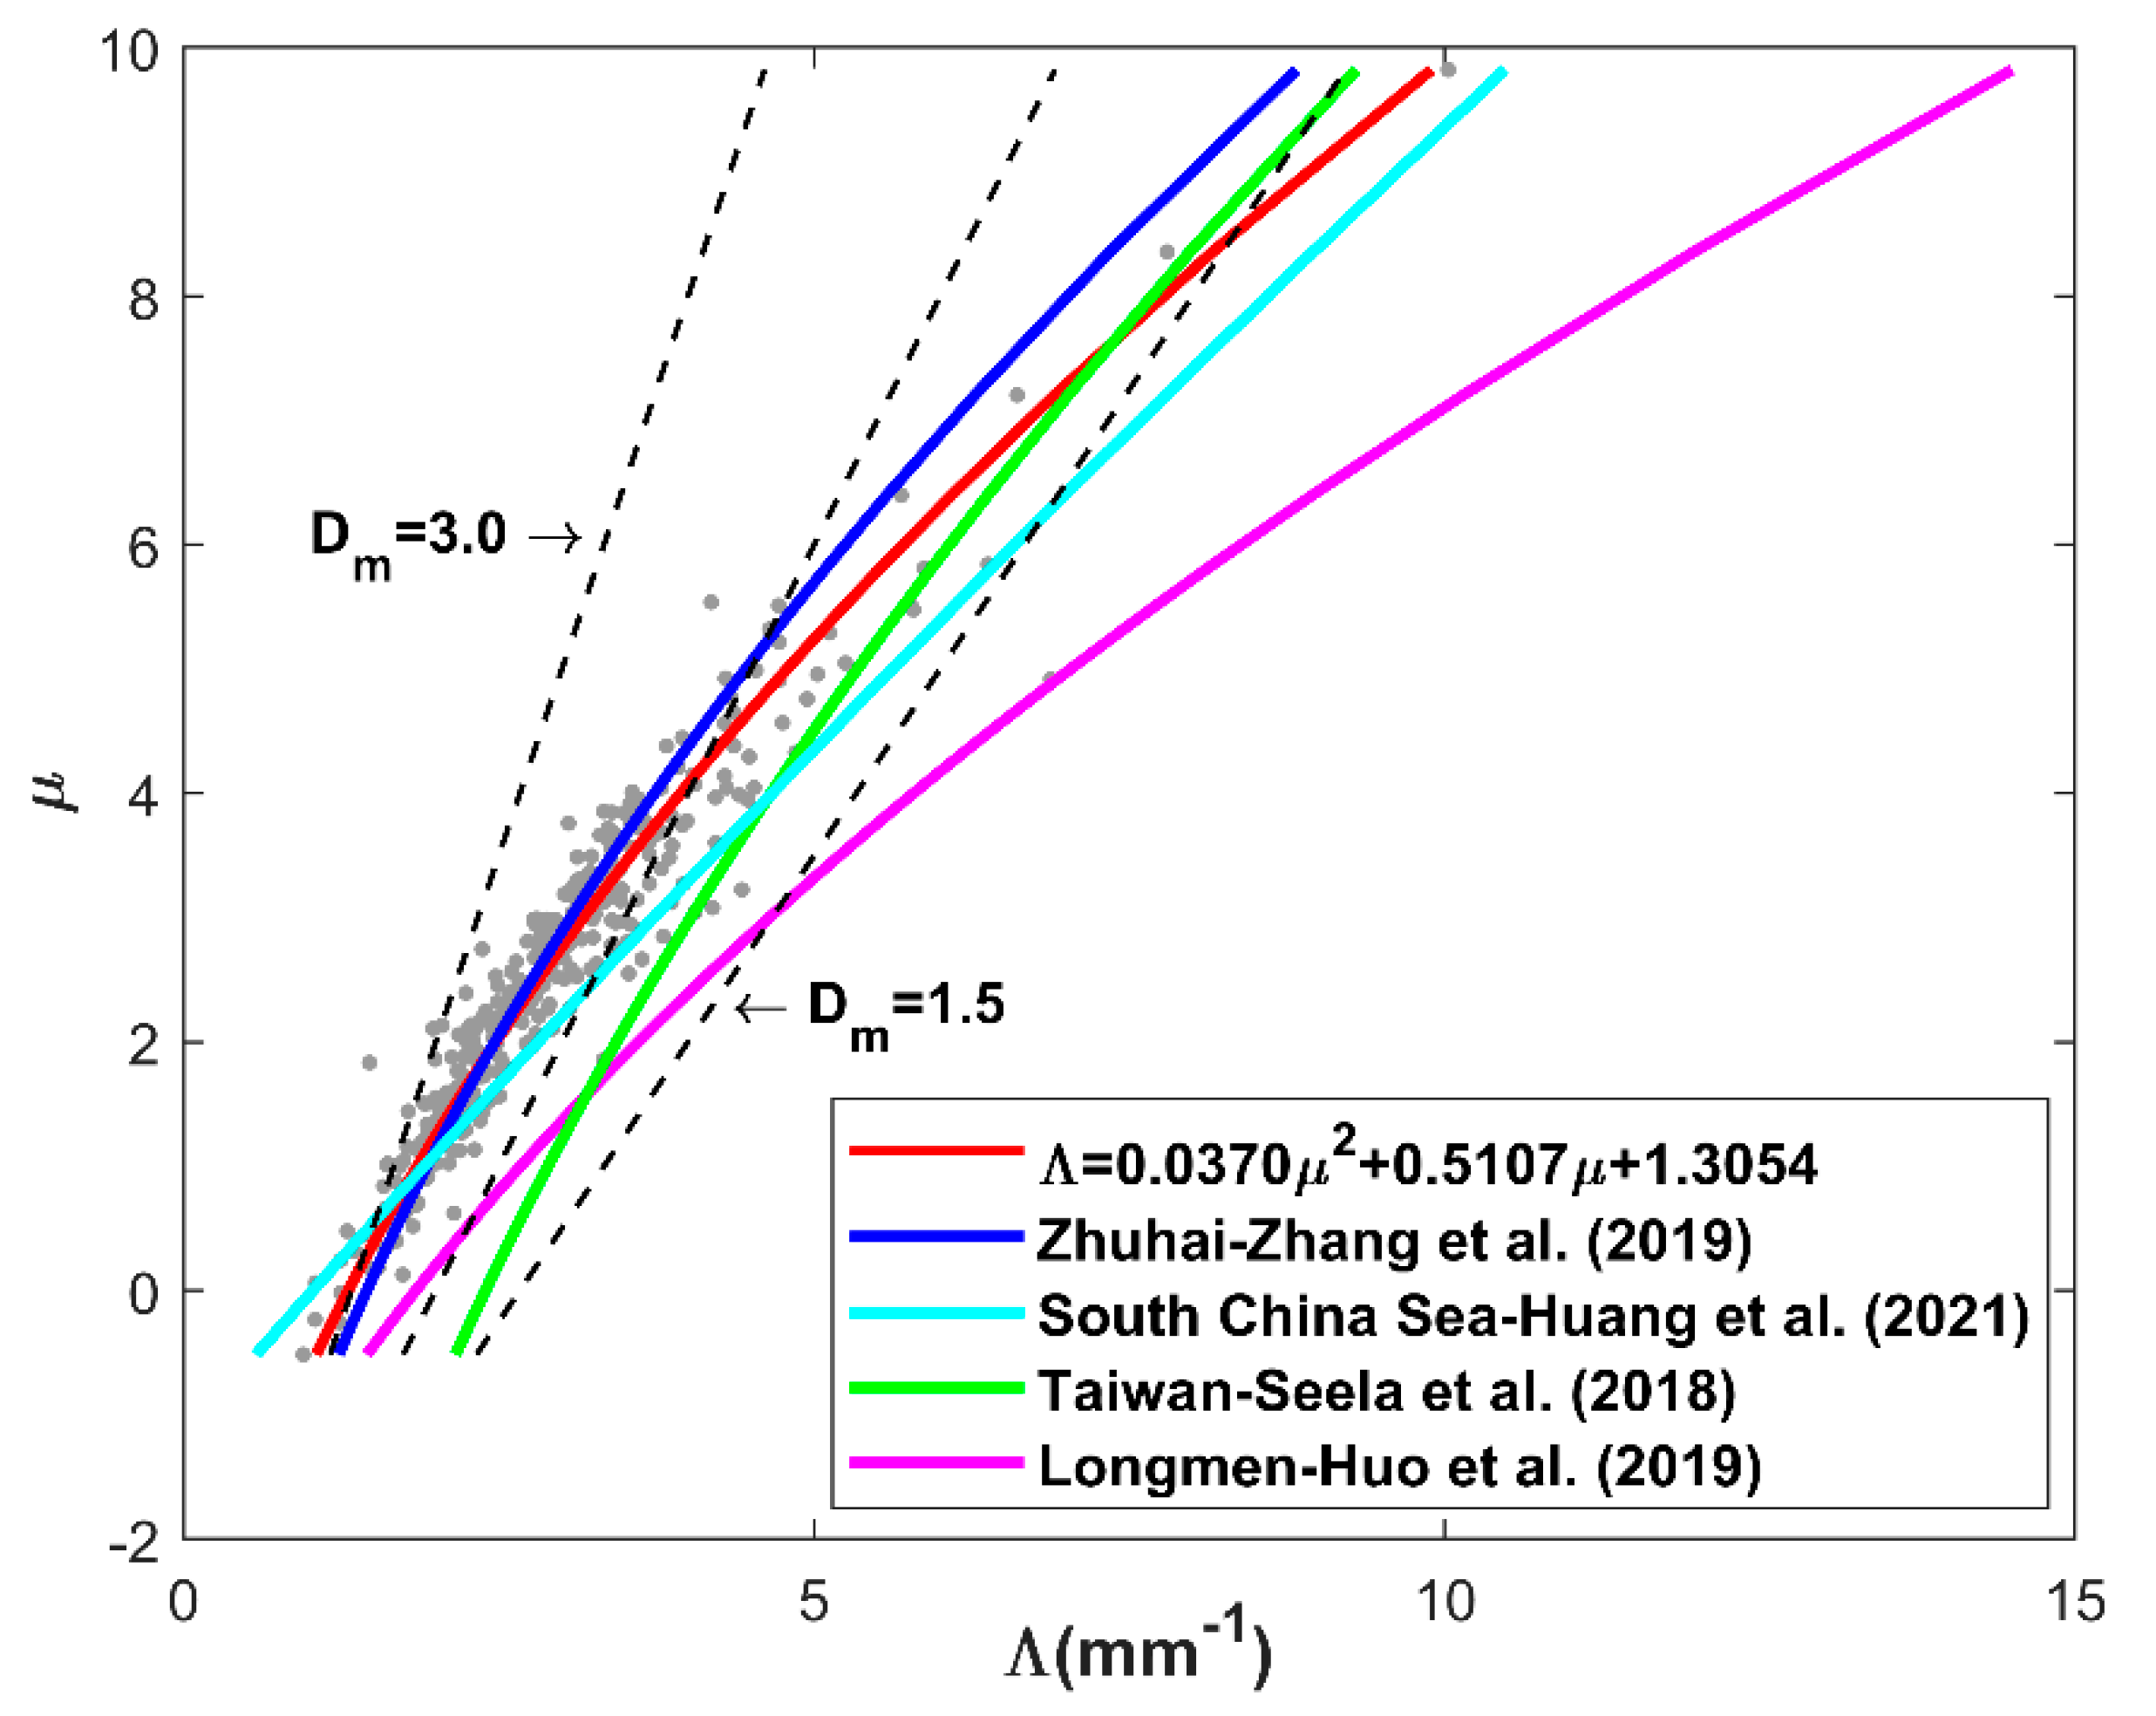
Figure 7.
Scatterplots of Z−R relationships for convective (gray circles) and stratiform rainfall (gray plus signs). The fitted power-law Z−R relationships for the convective, stratiform, and whole dataset are shown by the red, blue, and black solid lines. The relationship for the standard NEXRAD is depicted by the magenta lines. The inset diagram is an enlargement of the black rectangular region in the top right corner.

Table 1.
Integral rain parameters and gamma parameters of both rain types.
| Rain types | R | LWC | μ | Λ | |||
|---|---|---|---|---|---|---|---|
| Convective | 30.07 | 2.37 | 1.21 | 3.46 | 3.53 | 1.35 | 2.17 |
| Stratiform | 1.53 | 1.54 | 0.08 | 3.04 | 3.89 | 2.90 | 4.49 |
| Whole | 6.20 | 1.70 | 0.27 | 3.15 | 3.06 | 0.72 | 2.14 |
Table 2.
The Z-R relations for this study and different regions.
| Reference | Location | Climatic Regime | Disdrometer | Z–R Relation | |
|---|---|---|---|---|---|
| This study | Beibu Gulf, South China | Warm season (June–October 2020, March–May 2021) | Convective | OTT2 | Z=202.542 R1.553 |
| Stratiform | Z = 328.793 R1.363 | ||||
| Whole | Z = 308.136 R1.423 | ||||
| [30] | Longmen, South China | Summer | Convective | OTT1, VPR-CFMCW | Z = 144.0 R1.57 |
| Stratiform | Z = 453.0 R1.20 | ||||
| Whole | Z = 135.2 R1.58 | ||||
| [10] | North Taiwan, South China | Summer | Convective | JWD | Z = 237.88 R1.41 |
| Stratiform | Z = 276.13 R1.41 | ||||
| Whole | Z = 266.42 R1.38 | ||||
| [27] | Nanjing, East China | Summer | Convective | Two-dimensional video disdrometer | Z = 230.85 R1.34 |
| Stratiform | Z = 193.73 R1.54 | ||||
| Whole | Z = 232.44 R1.34 | ||||
| [22] | Beijing, North China | Warm season (April–October, 2017–2018) | Convective | OTT2 | Z = 733.55 R1.222 |
| Stratiform | Z = 247.19 R1.348 | ||||
| Whole | Z = 265.14 R1.399 | ||||
Publisher’s Note: MDPI stays neutral with regard to jurisdictional claims in published maps and institutional affiliations. |
© 2022 by the authors. Licensee MDPI, Basel, Switzerland. This article is an open access article distributed under the terms and conditions of the Creative Commons Attribution (CC BY) license (https://creativecommons.org/licenses/by/4.0/).
Share and Cite
MDPI and ACS Style
Li, X.; Chen, S.; Li, Z.; Huang, C.; Hu, J. Statistical Characteristics of Warm Season Raindrop Size Distribution in the Beibu Gulf, South China. Remote Sens. 2022, 14, 4752. https://doi.org/10.3390/rs14194752
AMA Style
Li X, Chen S, Li Z, Huang C, Hu J. Statistical Characteristics of Warm Season Raindrop Size Distribution in the Beibu Gulf, South China. Remote Sensing. 2022; 14(19):4752. https://doi.org/10.3390/rs14194752
Chicago/Turabian StyleLi, Xiaoyu, Sheng Chen, Zhi Li, Chaoying Huang, and Junjun Hu. 2022. "Statistical Characteristics of Warm Season Raindrop Size Distribution in the Beibu Gulf, South China" Remote Sensing 14, no. 19: 4752. https://doi.org/10.3390/rs14194752
Note that from the first issue of 2016, this journal uses article numbers instead of page numbers. See further details here.