
Comparison of Deep Neural Networks in Detecting Field Grapevine Diseases Using Transfer Learning
by
 , and
, and
Antonios Morellos
1,2,
Xanthoula Eirini Pantazi
1,2,* ,
,
Charalampos Paraskevas
1,2 and
and
Dimitrios Moshou
1,2 1
Laboratory of Agricultural Engineering, School of Agriculture, Aristotle University of Thessaloniki, 54124 Thessaloniki, Greece
2
Institute for Bio-Economy and Agri-Technology (IBO), Centre for Research and Technology Hellas, Thermi, 57001 Thessaloniki, Greece
*
Author to whom correspondence should be addressed.
Remote Sens. 2022, 14(18), 4648; https://doi.org/10.3390/rs14184648
Submission received: 19 August 2022
/
Revised: 10 September 2022
/
Accepted: 13 September 2022
/
Published: 17 September 2022
(This article belongs to the Section Remote Sensing in Agriculture and Vegetation)
Abstract
:Plants diseases constitute a substantial threat for farmers given the high economic and environmental impact of their treatment. Detecting possible pathogen threats in plants based on non-destructive remote sensing and computer vision methods offers an alternative to existing laboratory methods and leads to improved crop management. Vine is an important crop that is mainly affected by fungal diseases. In this study, photos from healthy leaves and leaves infected by a fungal disease of vine are used to create disease identification classifiers. The transfer learning technique was employed in this study and was used to train three different deep convolutional neural network (DCNN) approaches that were compared according to their classification accuracy, namely AlexNet, VGG-19, and Inception v3. The above-mentioned models were trained on the open-source PlantVillage dataset using two training approaches: feature extraction, where the weights of the base deep neural network model were frozen and only the ones on the newly added layers were updated, and fine tuning, where the weights of the base model were also updated during training. Then, the created models were validated on the PlantVillage dataset and retrained using a custom field-grown vine photo dataset. The results showed that the fine-tuning approach showed better validation and testing accuracy, for all DCNNs, compared to the feature extraction approach. As far as the results of DCNNs are concerned, the Inception v3 algorithm outperformed VGG-19 and AlexNet in almost all the cases, demonstrating a validation performance of 100% for the fine-tuned strategy on the PlantVillage dataset and an accuracy of 83.3% for the respective strategy on a custom vine disease use case dataset, while AlexNet achieved 87.5% validation and 66.7% accuracy for the respective scenarios. Regarding VGG-19, the validation performance reached 100%, with an accuracy of 76.7%.
1. Introduction
Plant diseases constitute a huge threat for field-grown crops and play a significant role in global produce loss (around 10% of the total production) [1,2]. There are two different parameters mainly responsible for plant stress presence depending on whether the infection is caused by a biotic parameter which corresponds to a living organism. In this case, the stress is called biotic, or the stress associated with an abiotic parameter is known as abiotic stress. Among the biotic stress, the most common pathogenic agents are fungi, viruses, and bacteria [3]. The most common way to deal with biotic plant stress is by applying chemical compounds to the plants. This, although proven to be very effective, can also negatively affect the environment and the total agricultural income, as it is a cost-effective method [4].
The above-mentioned fact, among others, has led to the adaptation of several precision agriculture (PA) techniques, which aim to optimize the use of agricultural inputs (such as pesticides, irrigation water, and fertilizers), increase agricultural productivity, and reduce the production loss caused by a disease [4,5]. For this reason, the use of remote and proximal sensing techniques, alongside robotics, computer vision, machine learning (ML) and deep learning (DL) techniques, Big Data technologies, and high-performance computing (HPC), is widely used in the agricultural sector. Such techniques, apart from detecting and identifying plant diseases, are also used for weed detection, crop quality assessment, yield prediction, species recognition, irrigation water, and soil management [4].
In this study, transfer learning and deep learning techniques are used to detect vine diseases. Vine is a plant with high economic impact and worldwide production [6]. The production of vines is mainly affected by fungal diseases, such as black rot, esca, powdery mildew, downy mildew, Botrytis (caused by Botrytis cinerea), and Isariopsis leaf spot. All of these diseases affect either the plants’ leaves or the crop that can subsequently cause serious or even severe yield loss or affect crop quality and quantity [7,8]. The diseases that will be addressed in this study are two fungal diseases that affect grapevine plants (namely Vitis vinifera), esca complex (caused by Phaeomoniella clamidospora and Phaeoacremonium aleophilum) [9,10], and powdery mildew (caused by Erysiphe necator).
Transfer learning (TL) is a machine learning technique in which pretrained networks, mostly with deep architectures, are used to tackle classification problems with a limited dataset [11]. By applying this technique, the original pretrained weights are stored. When new data are introduced to the network, they are partly updated. The whole idea behind this technique is that the knowledge of the deep neural network that was already gained during the original training of the models can be used to facilitate the training process of a new similar classification problem that does not belong to the same feature space and the same distribution [12].
This technique has been proven to be highly successful in plant disease classification problems, as validated by many related works on plant diseases conducted by Mohanty et al. [13], Wang et al. [14], Brahimi et al. [15], Ferentinos [16], Liu et al. [17], and Barbedo [18], amongst others. All of the above-mentioned works showed the very high performance of their proposed techniques for their classification problems, with a classification accuracy of above 80%.
Additionally, this technique also saves a lot of computational time, allowing it to be used in order to train a network from scratch with a very deep architecture, as well as many other classes trained with a huge number of training examples. There is a plethora of well-known pretrained algorithms in the published literature (e.g., AlexNet, GoogleNet, ResNet, the VGG family, and others). The difference between these deep learning models is attributed to the architecture of their layer. When applying the transfer learning (TL) technique, in most cases, only the parameters of the last (fully connected) layer need to be inferred from scratch. The rest of their architecture is used for the feature extraction of training examples.
This work aims to use transfer learning, alongside models trained into either ImageNet or the open-source PlantVillage dataset, in order to discriminate photos of healthy leaves from photos of leaves that were infected by a fungal disease, obtained in field conditions. The pretrained algorithms that were assessed for their performance in the identification of a plant as healthy or infected (with either esca or powdery mildew) are AlexNet, Inception v3, and VGG-19. Those deep learning models were chosen since they are regarded very valuable tools for the detection and classification of plant diseases [6,19,20,21,22].
The main contribution of this paper is associated with the use of existing pretrained DCNN models which undergo the fine-tuning process for the last few layers of their convolutional base architectures, and use the PlantVillage grapevine dataset for training, in order to create robust classifiers for grapevine disease identification. Fine-tuned models were compared to make a prediction on the respective models from the feature extraction approach. For Alexnet, the last 3 layers (out of 5) were fine-tuned; for VGG-19, the last 12 layers (out of 19) were fine-tuned; and for the Inception-v3 model, the last 12 layers (out of 19) were fine-tuned. The performance of the proposed models from both scenarios were also validated using custom photos from the Chatzivariti vineyard.
2. Materials and Methods
2.1. Field Data Acquition
The Chatzivaritis Estate consists of 18 hectares of organic vineyards in the region of Goumenissa, North Greece (latitude: 40°53′21.67″N, longitude: 22°28′37.66″E, and altitude: 190 m). The Chatzivaritis Estate focuses on the Greek varieties of Xinomavro, Negkoska, Roditis, Malagousia, Muscat, and Assyrtico, and also cultivates the Traminer, Sauvignon blanc, Merlot, Chardonnay, and Cabernet sauvignon in smaller fields. Figure 1 presents the three infected variety fields (Xinomavro, Negkoska, and Traminer) that are investigated in the current study. The soil type of these fields is medium-textured sand and clay.
Photos were obtained from parts of the Chatzivariti’s vineyard using a RGB camera sensor (Sony IMX686, 64 MP, Sony, Tokyo, Japan) during the time period from the 1st to the 16th of August 2021. The dataset consisted of Vitis vinifera plants sp. ‘Xinomavro’ and sp. ‘Negoska’. The selected photos were obtained by both healthy and plants infected by a fungal disease. Thus, there were three classification labels: healthy, infected with the Phaeomoniella Chlamydospora fungus (esca), and infected with the Erysiphe necator fungus that causes powdery mildew fungal disease.
The health status assessment for the Chatzivariti’s case plants was based on the visual inspection of the disease’s symptoms. Specifically, the foliar symptom of esca is an interveinal “striping”. These “stripes”, which primarily appear as dark red in red cultivars and yellow in white cultivars, go gradually dry and finally become necrotic. For the powdery mildew disease, the visual symptoms appear in the form of white light chlorotic and white spots on the foliage, as well as the fuzzy or “wooly” patches in both sides of the leaf.
2.2. Alexnet
AlexNet [23] was born out of the need to improve the results of the ImageNet challenge. This was one of the first deep convolutional neural networks (DCNNs) employed to achieve considerable accuracy on the 2012 ImageNet Large-Scale Visual Recognition Challenge (LSVRC-2012) with an accuracy of 84.7%, as compared to the second best with an accuracy of 73.8%. A brief architecture of AlexNet is shown in Figure 1. From this figure, it can be concluded that AlexNet consists of an input space, 5 convolutional layers for the feature extraction and a fully connected (FC) layer space (originally consisting of 3 FC layers) for the classification process. AlexNet uses the rectified linear unit (ReLU) as an alternative to the tanh function that was traditionally used in machine learning approaches, saving computational time and increasing the model efficiency.
2.3. VGG-19
VGG-19 [24] was the second pretrained model used for the health status classification of grapevine leaves. The VGG family models can be considered as a successor of the AlexNet but they were created by a different group, the visual geometry group at Oxford, shortened as VGG. It carries and uses some ideas from its predecessors and improves upon them, and also uses deep convolutional neural layers to improve accuracy. The number in the name VGG-19 represents the 19 layers that this model has. Figure 3 shows its architecture, consisting of 19 convolutions + ReLU layers (depicted in orange), 5 MaxPooling layers (depicted in red), and the fully connected layers (depicted in green) for the feature learning and the FC layers for classification. The VGG-19 architecture requirements are also shown in Table 2.
Although this architecture has been proven to be a very robust choice for image classification and has shown high prediction accuracy over the time, a disadvantage of the VGG-19 is that it is a network with high computational requirements, both in GPU and RAM, and needs the most time for training.
2.4. Inception V3
Finally, in comparison to VGG-19, Inception networks (GoogleNet/Inception v1) have been proven to be more computationally efficient, both in terms of the number of parameters generated by the network and the economic cost incurred (memory and other resources). Inception v3 mainly focuses on burning less computational power by modifying the previous Inception architectures [25]. The model itself is made up of symmetric and asymmetric building blocks, including convolutions, average pooling, max pooling, concatenations, dropouts, and fully connected layers. Batchnorm is used extensively throughout the model and applied to activation inputs. Loss is computed via Softmax. The model’s architecture is shown in Figure 4. This is a completely different approach from most of the well-known DCNNs that only deepen the neural networks by increasing the convolutional layer to enhance its performance. The Inception model uses different sizes of filters and maximum pooling to reduce the dimensions of the data, which consequently significantly reduces the computational time, while using high-quality features.
Inception v3 needs to resize the original images into 299 × 299 and divide the dataset into training and testing set (see Section 2.4). The proposed method architecture of Inception v3 is summarized in Table 3.
2.5. Training Scenarios
The above-mentioned DL models are all pre-trained on the ImageNet, a dataset that spans 1000 object classes and uses over 1 million images for the training and validation of the models and 100,000 images for the testing. The training weights that were created from their previous training with the ImageNet dataset is inherited in this work and is used as a transfer learning approach. More specifically, there are two main training scenarios that are evaluated in this study for all of the tested models. These training scenarios are associated with the choice of the most efficient training scheme (the scheme with the highest accuracy in the testing phase) that was used as the proposed method for disease identification.
For this reason, there were two training scenarios. The first one considers fine tuning of the models’ parameters using the data from the open PlantVillage dataset and updates all the models’ weights in the last few top layers of the base model (not just the classifier). This should happen on a very low learning rate to avoid overfitting. The other scenario considers the use of the models themselves as features extractors using the inherited weights from ImageNet. The latter scenario implies that, in the feature extraction strategy, only the weights of the newly added last layers in the last FC layer (the classifier) change during the training phase. The rest of the base models’ weights remain frozen. The difference between the two methods is that with the fine-tuning training approach, the weights of the models are updated using data from plant diseases. Thus, the health status classification process is expected to be more successful, as the DCNNs will already be experienced to distinguish between a healthy and an infected plant. A brief model diagram of the feature extraction and fine-tuning approach is depicted in Figure 5.
Another scenario scheme concerns the kind of classifier that can be used as a TL approach in the last layer of the deep neural architectures that are selected. The proposed architectures considered applying either a 3-layer neural network or a 4-layer neural network.
2.6. Hyperparameters Initialization
Another significant issue that is addressed in this work is the choice of the right hyperparameters that were used to train the models. Hyperparameters can drastically influence the effectiveness of the DCNN. Thus, there are several different runs with different hyperparameter values and different optimization algorithms which can be used in order to find the right approach that can be used in all examined DCNNs. The optimization algorithms that were tested were RMSprop [26], Adam [27], and the stochastic gradient descent (SGD) [28]. Apart from these, different batch sizes, dropout rates, and epoch number were tested (Table 4). For the learning rate, some custom values were tested as well as an automatic reduction method from the PyTorch library, known as the ReduceLRonPlateau. This automatic method was scheduled with an initial value of 5e-3, with a patience of 3 epochs and a decay of 0.5.
2.7. Models Training and Testing Data Division
For the training phase of the TL models, the open-source PlantVillage dataset (https://plantvillage.psu.edu/ (accessed on 30 November 2021)) was used. This dataset consists of over 50,000 images of healthy and diseased leaves from different plants. A significant advantage of this dataset is that it is consists of 58 disease and healthy situations for 25 different plants. The total number of diseases that exist in the PlantVillage dataset is 37, and thus the models will have 38 outputs (1 healthy status and 37 diseases). In this work, though, only part of the PlantVillage dataset was used for the training and testing, i.e., the photos from healthy and infected grapevine leaves. A total of 4253 photos were divided into four classes: healthy, esca infection, leaf blight spot (Isariopsis leaf spot) infection, and black rot infection. The only disadvantage of this dataset is that almost all the photos depict leaves separated by the plant.
Another custom dataset with photos from Chatzivariti’s winery vineyard was used in order to test the capability of the models that were trained on the PlantVillage dataset to be used for field conditions. This dataset was constituted by 154 photos, 49 of which depict plants with visible symptoms of the esca disease, in different intensities, 56 photos of which depict plants infected with powdery mildew, and 49 of which depict healthy plants.
Before the data analysis, photos that depict infected and healthy grapevine leaves were selected and isolated from the rest of the PlantVillage grapevine dataset, in order to be used for the model’s evaluation. The data selection for the testing phase concerned a total of 600 photos that make up the 4 classes (150 from the healthy status, 150 from leaves infected by black rot, 150 from the leaves infected by leaf blight spot (Isariopsis leaf spot), and 150 from the leaves infected by esca). The rest of the PlantVillage grapevine dataset (from now on, for brevity reasons, it will be just referred as the PlantVillage dataset) was used for the training of the models. This testing phase with the PlantVillage data was used in order to ascertain whether the classification algorithm succeeds to have a good accuracy or not in the same dataset distribution as the one that the training occurred. The PlantVillage dataset division in training/validation and test sets is also summarized in Table 5.
As far as the Chatzivariti’s case dataset is concerned, 80% of the data from each class of the dataset was used for the model training and validation (39 from esca, 45 from powdery mildew, and 39 from the healthy status), and the rest was used for the testing phase (model evaluation), as shown in Table 6.
As shown in Table 5, there was a uniform distribution between the data in the different classes of the PlantVillage dataset. For this reason, we selected a standard number (150 data from each class) for the testing phase, in order to gain a clearer picture of the classification process.
2.8. Evaluation Metrics
For the models’ evaluation, the accuracy metric was used, as shown in Equation 1, which is the ratio of the correct predictions over the sum of all predictions (correct and wrong). In the following equation, TN, TP, FN, and FP represent the true negative, true positive, false negative, and false positive values, in the models’ confusion matrix.
Although there is a lot of criticism around accuracy and how it may give misleading results depending on the training data distribution, in this paper, it was used alone as a metric as the class data distribution is balanced for all the classes that will be used for the training and testing of the models in all scenarios that were considered.
2.9. Software and Hardware Settings
The development of TL models was achieved under the PyTorch machine learning framework, and was written in the Python 3 computer language and run on GPU (2 × Nvidia RTX 2070 super, connected with a scalable link interface bridge). The first step was the introduction of the PlantVillage input data in the algorithm and their normalization and transformation according to the input shape needs of each network that was tested
3. Results and Discussion
3.1. Models Tuning and Initialisation
The first part of the proposed procedure concerns the creation of TL models that aim to recognize grapevine leaves diseases from the PlantVillage open-source database. There were two training approaches, namely a feature extraction and a fine-tuning approach. In the first approach, the pretrained weights were frozen and the whole training process was limited in updating the weights of the last FC layer (classifier). On the other hand, on the fine-tuning approach, the model training and weight updates were extended to a number of layers to the convolutional base model instead of just training the last of the FC layers.
Towards this direction, the first thing that had to be achieved was the hyperparameter tuning and selection, as described in Table 2. Hyperparameter testing was conducted in both classifier scenarios. The selection was achieved after testing the different values of the hyperparameters and considered the search for a “universal” training scheme for each one of the models. So, it was concluded that the best scheme for the training of the classifiers was the Adam optimization algorithm, with a batch size of 4, 20 epochs, and a dropout rate of 30%, combined with a callback for the learning rate in order to reduce itself during the training process when it reached a plateau, with respect to the training epochs (ReduceLRonPlateau).
3.2. Transfer Learning on the PlantVillage Dataset
Table 7 reports the accuracy results on the validation phase for the above-mentioned training scheme, for a three- and four-layer neural network in the last layer, and for each one of the three pretrained DCNNs (the last layer of the FC layer) that were selected. The values refer to the average of the classification process (average from all of the classes).
The next thing that needed to be examined and decided was the optimal neural network layout that took part in the classification process in the last layer of the three models. It should be noted that in this work only simple multi-layer perceptron (MLP) layouts were tested. Future research could use different classification networks, such as random forest or support vector machines (SVMs). The validation results from Table 3 show that, in general, the three-layer neural network classifier gives much better results, in comparison with the four-layer neural network classifier for almost all the training scenarios and pretrained DCNNs. The only exception is the validation accuracy of AlexNet when it is fine-tuned with the four-layer DCNN that performs slightly better. For this reason, the three-layer FC DCNN was selected as the best classifier architecture.
The performance in the validation phase of each one of the three DCNN that were used for the training per epoch of training is depicted in Figure 6, for both training using the fine-tuning scheme or the feature extraction.
From the results shown in Figure 6, it is apparent that after the fine tuning of the models with the PlantVillage dataset, the validation accuracy was higher in comparison with the respective models that were used as feature extractors and were not trained from scratch with the PlantVillage dataset.
Figure 6 also shows that Inception v3 algorithm outperformed AlexNet in both training scenarios. In fact, for the feature extraction scenario, AlexNet showed a validation accuracy of 74% on the 20th epoch (reached a plateau after the 16th epoch), while Inception v3 showed an accuracy of 94.8%. VGG-19 seems to have an accuracy that verges on the Inception v3 (88.2%). On the other hand, for the fine-tuning scenario, both Inception v3 and VGG-19 have a validation accuracy of 100% on the 20th training epoch, while AlexNet falls behind with 87.5%.
3.3. Transfer Learning on the Chatzivariti vineyard dataset
The second part of this work concerns the use the models that were created using the PlantVillage dataset for both training approaches in order to discriminate the healthy from infected status for photos obtained by vine plants in field-grown conditions (Chatzivariti’s winery vineyard). In other words, the models presented in Section 3.2 were validated, using a custom dataset of photos from the Chatzivariti vineyard. In order to achieve this purpose, these models were retrained by transfer learning, retaining all the weights from training approaches, while altering solely the weights in the classification layer (last of the FC layers). The whole procedure is also described in Figure 7.
Although this process is a feature extraction approach, the models that were fine-tuned and feature-extracted with the PlantVillage were used, but this time the feature extraction was applied to the Chatzivariti dataset.
The results of the validation phase for each of the models and training scenarios are shown in Table 8. The values refer to the average of the classification process (average from all of the classes).
The results from the Table 8 show a similar tendency as the one from the models’ validation in the previous case, where the models were trained on the PlantVillage dataset, with Inception v3 outperforming in both cases AlexNet and VGG-19 (except for the feature extraction case of Inception v3 and VGG-19 that, once again, showed an equal performance).
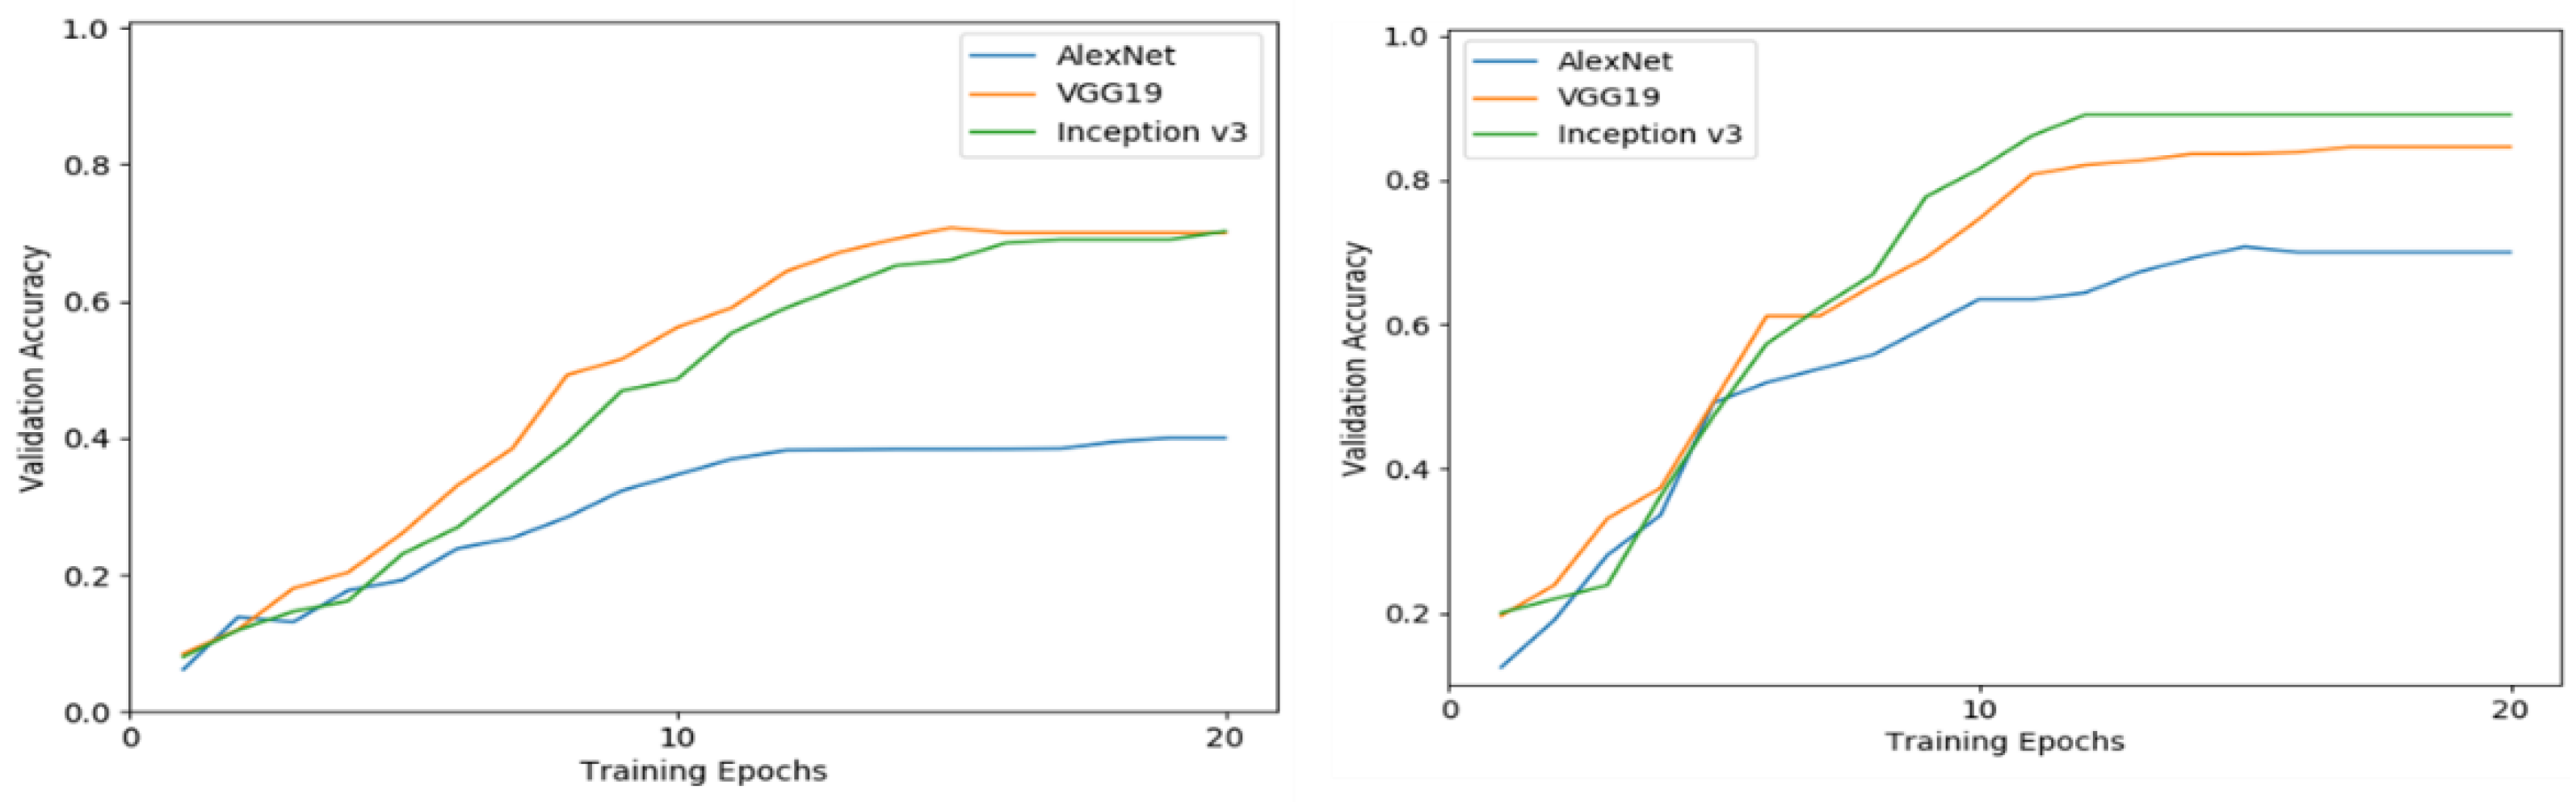
Figure 8 shows a graphics representation of the validation accuracy through the training epochs of the three models as they were trained using feature extraction or fine tuning for the scenario where the field-grown images were used for the models’ training and validation phase.
From a visual inspection of Figure 8, it can be concluded that the feature extraction strategy in this scenario has a significantly lower performance, in comparison with the fine-tuning training approach for each one of the three DCNNs that were examined. As far as the training process is concerned, the feature extraction training approach seems to have a much slower convergence, in comparison with the fine-tuning strategy. In fact, in the fine-tuning training strategy, the validation accuracy almost converges after the 12th epoch (with small fluctuations in the case of AlexNet), while in the feature extraction training approach, the convergence is achieved after the 15th epoch. An interesting point is that in the case of the feature extraction, the VGG-19 network demonstrates slightly better performance during the whole training phase, though after the 20th epoch, the same validation accuracy is achieved. On the other hand, the Inception v3 shows superior performance after the seventh epoch in the case of the fine-tuning training approach.
3.4. Model Testing
As mentioned in Section 2.5 after the model’s validation, a small part of the data from both datasets that were employed in this work (PlantVillage and manually taken photos) was used for the models’ evaluation in totally untrained data. In the following table (Table 9), the testing performance of the three proposed DCNNs is reported for the fine-tuning training approach, demonstrating the best performance for both datasets. The values show the average of the classification process (average from all of the classes).
The performance of the three models in the testing phase is also explicitly shown in Table 10 and Table 11 in the form of confusion matrices for both the PlantVillage dataset and the custom Chatzivariti’s case dataset.
As shown in Table 9, and further validated by Table 10 and Table 11, Inception v3 shows a better performance than VGG-19 and AlexNet, with VGG-19 being the second best model for the Chatzivariti use case dataset. For the PlantVillage dataset, both VGG-19 and Inception v3 demonstrated optimal accuracy (100%), while AlexNet also shows a great performance of 94.1%. From the results of Table 10 and Table 11, it can also be concluded that most of the classification errors for both dataset scenarios concern the classification of originally infected leaves as healthy.
Some results from the testing phase of the PlantVillage dataset are briefly shown in Table 12. For every label decided by the DCNNs, the confidence level as a percentage is also given. The confidence level in this study is generated by the probabilities of each example to belong to one of the classes, as given by the Softmax activation function, which is a variant of the sigmoid function, used for multiclass classification. The Softmax activation function is calculated in Equation (2).
where z is the neuron output in the last layer of the classifier, i is the number of neurons, and j is the number of the classes.
The confidence level is a metric, usually compared with some threshold to determine whether the predicted class label is accepted [29]. The confidence level is a performance evaluation metric, chosen to filter out false positives and ensure that a predicted class has a certain minimum score. Penalizing false positives may increase the level of robustness of the created models [30]. In other words, a confidence score with a threshold gives the minimum confidence score, above which the label is considered to be successfully classified.
Table 12 also demonstrates that all the DCNNs that were examined for the fine-tuning approach in the testing phase showed an almost excellent performance, with the exception of AlexNet, which still showed a very good performance. In most cases, for Inception v3 and VGG-19 models, the confidence level for the classification was over 90%. This did not occur in the occasion of the AlexNet.For the two best models (Inception v3 and VGG-19), there was no misclassified photo in the test dataset of PlantVillage.
The last part of this work involved testing the predictive ability of the trained networks via the fine-tuning strategy with the custom dataset from Chatzivariti’s winery vineyard. As previously noted, these photos refer to vine plants either healthy or infected with esca or powdery mildew fungus. Some results from the testing phase of the field-grown photo dataset are briefly shown in the following Table 13. For every label estimated by the DCNNs, the confidence level is also given as a percentage.
At this point, it should be noted that in the classification process, for both testing scenarios, regarding an example that was primarily classified as infected with any of the examined diseases, a threshold of 75% confidence level was set in order to classify infection. Any confidence level below 75% is considered to belong to the healthy class. This was decided because there is the possibility of a false disease detection in regions of the image with infected weeds in the background, or yellow spots caused by the solar irradiation or other disruptive reasons from the background. Accordingly, a confidence level of above 50% was accepted for an image that was primarily classified as healthy because of the much higher area that the leaves occupy and because of the lower possibility of green color occurrence, other than the one from the vine leaves, which are present in the background of the image.
From the results of Table 13, it is apparent that there is a high chance that the algorithm will successfully detect the infected parts of the plant’s leaves, even when it is tested on a whole plant and not just a leaf segment. In the whole dataset, there were very few instances that present a misclassification between healthy and infected plants. Two of them are reported in Table 13 (Examples #2 and #6).
3.5. General Discussion
The first part of this study focused on defining the optimal hyperparameters and the best multilayer perceptron (MLP) network layers architecture that was used as a classifier. The classifier with the four layers demonstrated a much lower performance in comparison with the three-layer one. The reason why this is happening is either because of some kind of overfitting which happens when the network has four layers or the fact that the Chatzivariti’s dataset did not have enough data for training and validation.
Besides the fact that the training time is much higher in the fine-tuning training approach, in both of our TL scenarios (for the PlantVillage-based dataset and for the Chatzivariti use case dataset), this training strategy seemed to offer significantly higher accuracy, in comparison with the feature extraction approach for all of the DCNN models that were examined. This is comparable with the findings of Espejo-Garcia et al. [31,32]. In their works, they trained two and three different DCNN architectures, respectively, on an open-source dataset: the plant seedling dataset (https://vision.eng.au.dk/plant-seedlings-dataset/ (accessed on 30 November 2021)) and the early crop weed dataset (https://github.com/AUAgroup/early-crop-weed (accessed on 30 November 2021)) for weed identification using a similar fine-tuning and feature extraction scheme that is used in this work. They found that the fine-tuned models exhibit a better performance in terms of accuracy and convergence time compared to the feature extraction ones.
Apart from the fact that the validation accuracy is higher in the fine-tuning approach, it also converges faster to the final validation value. Regarding the models that were trained using the fine-tuning approach, in both datasets, especially for the cases of Inception v3 and VGG-19, convergence was achieved even before the 10th epoch, as shown in Figure 8. It is important to be noted that the learning process starts from a much lower validation value in the case of the training scenario with the Chatzivaryti dataset. Indeed, a closer look shows that when the training was being performed with the PlantVillage dataset, the validation accuracy started at over 35% at the first epoch, while in the Chatzivaryti dataset, the respective values were under 20%, especially when using the feature extraction approach.
As far as the DCNNs models are concerned, the findings of this work show that there is a clear winner when it comes to models’ performance, both in terms of computational time and model accuracy. Indeed, Inception v3 was found to outperform both VGG-19 and AlexNet in most cases. The only times that Inception v3 had the same outcome as VGG-19 was at the end of fine-tuning training for the PlantVillage dataset and at the end of the feature extraction training approach for the Chatzivariti dataset. Inception v3 outperforms the rest of the DCNNs because of the inception module itself and the nature of the photos from the Chatzivariti dataset. VGG19 and AlexNet are models of a linear architecture, where the convolutions stack one over another, covering just one filter in each layer. In the Inception v3 network, the inception module can cover filters of multiple sizes (1 × 1, 3 × 3, 5 × 5) in parallel, in the same level of the network. This allows more information (bigger features or smaller ones) to be captured in the same layer.
Our VGG and AlexNet comparison contradicts the findings of the work that was conducted by Yuan et al. [33], who used a VGG network and AlexNet for crop disease identification and found validation performance with no significant difference between the two models that they used and in all of their training scenarios. Additionally, in a comparison between AlexNet and Inception v3, Verma and Singh [34] found that AlexNet (used as a feature extractor) outperformed tomato plants in the disease severity evaluation. On the other hand, in a different problem for handwriting digits, Aneja and Aneja [35] found that Inception v3 outperformed both AlexNet and VGG-19 networks, but AlexNet gave satisfactory results in the fastest time.
A comparison between the two main classification scenarios, namely the classification of the black rot, esca, and leaf blight spot disease from the PlantVillage dataset and the respective classification of esca and powdery mildew in the Chatzivariti dataset, showed that the validation accuracy of DCNNs for PlantVillage dataset classification is much higher (reaching 100%) than that for the Chatzivariti dataset. This occurred for two reasons. Firstly, it was much easier for the classification to be more precise in a scenario where all the photos come from the same distribution as the one that the models were trained on. The second reason is that the Chatzivariti dataset refers to pictures that were obtained in field-grown conditions; therefore, there is loud noise from the background environment and many photos were disturbed by the sunlight.
After their training, the models that were trained on the different datasets underwent the test phase with photos that were not included in the training process. The results of this phase follow the same pattern as in the training phase. Once again, the training scenario with the PlantVillage data outperformed the Chatzivariti data on the testing phase. More specifically, there was no misclassified photo from Inception v3 and VGG-19 models, while there were a few misclassified photos in case of AlexNet (such as the example #3 that was indicated in Table 12). This did not apply for the data from the Chatzivariti vineyard.
A closer look at the selected pictures of Table 13 that were misclassified as healthy while they were infected with the powdery mildew fungal disease show plants that are in the first stage of the infection (few scattered white spots on the leaf area). The algorithm may have found this classification task harder because the visual powdery mildew fungus symptoms at the early stages of infection appear in the form of several very small white spots that spread in the leaf area. Moreover, the infection at its early stage and has not caused intense yellowing and browning in the leaves; therefore, it is more difficult to be detected by the models. Indeed, it seems that most of the classification errors occurred between one of the infected classes and the healthy class, as shown in Table 10 and Table 11. Moreover, there is a photo that was misclassified as infected with powdery mildew, while it actually belongs to the healthy class (Table 13, example #6). This happened because other disturbing factors, such as the application of pesticides and fertilizers, interfered in some photos. In the specific photo, the scattered mild yellowing and white spots on the leaves caused after the application of a pesticide appeared to be similar to the symptoms of powdery mildew on the plant leaves.
4. Conclusions
In the present study, different photos showing the health status of vine leaves and plants are introduced to three deep convolutional neural networks to detect possible health issues on the leaves or plants. A non-destructive and timely disease detection approach is of high value for the prevention of the disease spread and the production loss that it implies. The selected networks were AlexNet, VGG-19, and Inception v3.
All of the DCNNs were demonstrated to be greatly efficient in detecting the diseases in the scenario that concerned the training with the PlantVillage dataset, scoring an average accuracy of over 95%. Inception v3 and VGG-19 seem to outperform AlexNet in this scenario. On the other hand, in the scenario where the custom dataset was used for the training of the classifier in the last layer of the FC layer, the validation results were also quite satisfactory, for the Inception v3 and VGG-19 networks, scoring an average validation accuracy of 80%. In this scenario, AlexNet also had a decent validation accuracy of 66.7%.
As was expected, testing the networks with a Chatzivariti dataset was proven to have a significantly lower performance, in comparison with the results from the PlantVillage dataset. Generally, the disturbing factors of the photos from the field-grown plants, such as intensive sunlight, the application of pesticides and fertilizers, weeds in the background, etc., cause the lower performance of the Chatzivariti photo dataset, in relation to the PlantVillage dataset. Finally, in both datasets, fine tuning seemed to outperform feature extraction as a training strategy, although it requires much more computational time.
The concluding remark on the best deep learning approach that would be selected is the Inception v3 network, under the fine-tuning training approach, using a three-layer neural network as a classifier in the last of the fully connected layers. Inception v3 was superior to VGG-19, as its accuracy reaches 100% faster than VGG-19 and it is also a much more efficient architecture (both in terms of time and GPU requirements) than VGG-19.
Author Contributions
Conceptualization, D.M. and X.E.P.; methodology, A.M., X.E.P. and D.M.; software, A.M., X.E.P. and D.M.; validation, A.M., X.E.P. and C.P.; formal analysis, A.M., C.P. and X.E.P.; data curation, A.M. and C.P.; investigation, X.E.P. (principal investigator), D.M. (principal investigator), and A.M.; recourses, D.M. and X.E.P.; writing—original draft preparation, A.M., X.E.P. and D.M.; writing—review and editing, all authors; visualization, A.M. and C.P.; supervision, D.M.; project administration, D.M.; funding acquisition, A.M., X.E.P. and D.M. All authors have read and agreed to the published version of the manuscript.
Funding
This research was co-financed by European Union’s Horizon 2020 under grant agreement No. INEA/CEF/ICT/A2018/1837816 GRAPEVINE and from the European Union’s Horizon 2020 research and innovation program under grant agreement No. 857125 ATLAS.
Conflicts of Interest
The authors declare no conflict of interest. The funders had no role in the design of the study; in the collection, analyses, or interpretation of data; in the writing of the manuscript; or in the decision to publish the results.
References
- Strange, R.N.; Scott, P.R. Plant disease: A threat to global food security. Annu. Rev. Phytopathol. 2005, 43, 83–116. [Google Scholar] [CrossRef] [PubMed]
- Golhani, K.; Balasundram, S.K.; Vadamalai, G.; Pradhan, B. A review of neural networks in plant disease detection using hyperspectral data. Inf. Process. Agric. 2018, 5, 354–371. [Google Scholar] [CrossRef]
- Gavhale, K.R.; Gawande, U. An overview of the research on plant leaves disease detection using image processing techniques. J. Comput. Eng. (IOSR-JCE) 2014, 16, 10–16. [Google Scholar] [CrossRef]
- Liakos, K.G.; Busato, P.; Moshou, D.; Pearson, S.; Bochtis, D. Machine learning in agriculture: A review. Sensors 2018, 18, 2674. [Google Scholar] [CrossRef]
- Mulla, D.J. Twenty five years of remote sensing in precision agriculture: Key advances and remaining knowledge gaps. Biosyst. Eng. 2013, 114, 358–371. [Google Scholar] [CrossRef]
- Aravind, K.R.; Raja, P.; Aniirudh, R.; Mukesh, K.V.; Ashiwin, R.; Vikas, G. Grape crop disease classification using transfer learning approach. In International Conference on ISMAC in Computational Vision and Bio-Engineering; Springer: Cham, Switzerland, 2018; pp. 1623–1633. [Google Scholar]
- Sosnowski, M.R.; Emmett, R.W.; Wilcox, W.F.; Wicks, T.J. Eradication of black rot (Guignardia bidwellii) from grapevines by drastic pruning. Plant Pathol. 2012, 61, 1093–1102. [Google Scholar] [CrossRef]
- Da Silva, C.M.; Schwan-Estrada, K.R.F.; Rios, C.M.F.D.; Batista, B.N.; Pascholati, S.F. Effect of culture filtrate of Curvularia inaequalis on disease control and productivity of grape cv. Isabel. Afr. J. Agric. Res. 2014, 9, 3001–3010. [Google Scholar]
- Graniti, A.; Mugnai, L.; Surico, G. Esca of Grapevine: A Disease Complex or a Complex of Diseases. Esca Grapevine Phytopathol. Mediterr. 2000, 1000–1005. [Google Scholar]
- Pacetti, A.; Moretti, S.; Pinto, C.; Compant, S.; Farine, S.; Bertsch, C.; Mugnai, L. Trunk surgery as a tool to reduce foliar symptoms in diseases of the esca complex and its influence on vine wood microbiota. J. Fungi 2021, 7, 521. [Google Scholar] [CrossRef]
- Bengio, Y. Deep learning of representations for unsupervised and transfer learning. In Proceedings of the ICML Workshop on Unsupervised and Transfer Learning. JMLR Workshop and Conference Proceedings, Bellevue, WA, USA, 2 July 2012; pp. 17–36. [Google Scholar]
- Pan, S.J.; Yang, Q. A survey on transfer learning. IEEE Trans. Knowl. Data Eng. 2009, 22, 1345–1359. [Google Scholar] [CrossRef]
- Mohanty, S.P.; Hughes, D.P.; Salathé, M. Using deep learning for image-based plant disease detection. Front. Plant Sci. 2016, 7, 1419. [Google Scholar] [CrossRef] [PubMed]
- Wang, G.; Sun, Y.; Wang, J. Automatic image-based plant disease severity estimation using deep learning. Comput. Intell. Neurosci. 2017, 2017, 2917536. [Google Scholar] [CrossRef] [PubMed] [Green Version]
- Brahimi, M.; Boukhalfa, K.; Moussaoui, A. Deep learning for tomato diseases: Classification and symptoms visualization. Appl. Artif. Intell. 2017, 31, 299–315. [Google Scholar] [CrossRef]
- Ferentinos, K.P. Deep learning models for plant disease detection and diagnosis. Comput. Electron. Agric. 2018, 145, 311–318. [Google Scholar] [CrossRef]
- Liu, B.; Zhang, Y.; He, D.; Li, Y. Identification of apple leaf diseases based on deep convolutional neural networks. Symmetry 2017, 10, 11. [Google Scholar] [CrossRef]
- Barbedo, J.G.A. Impact of dataset size and variety on the effectiveness of deep learning and transfer learning for plant disease classification. Comput. Electron. Agric. 2018, 153, 46–53. [Google Scholar] [CrossRef]
- Saleem, M.H.; Potgieter, J.; Arif, K.M. Plant disease detection and classification by deep learning. Plants 2019, 8, 468. [Google Scholar] [CrossRef]
- Ahmad, I.; Hamid, M.; Yousaf, S.; Shah, S.T.; Ahmad, M.O. Optimizing pretrained convolutional neural networks for tomato leaf disease detection. Complexity 2020, 2020. [Google Scholar] [CrossRef]
- Srivastava, S.; Kumar, P.; Mohd, N.; Singh, A.; Gill, F.S. A Novel Deep Learning Framework Approach for Sugarcane Disease Detection. SN Comput. Sci. 2020, 1, 87. [Google Scholar] [CrossRef]
- Sujatha, R.; Chatterjee, J.M.; Jhanjhi, N.Z.; Brohi, S.N. Performance of deep learning vs machine learning in plant leaf disease detection. Microprocess. Microsyst. 2021, 80, 103615. [Google Scholar] [CrossRef]
- Krizhevsky, A.; Sutskever, I.; Hinton, G.E. Imagenet classification with deep convolutional neural networks. Adv. Neural Inf. Process. Syst. 2012, 60, 84–90. [Google Scholar] [CrossRef]
- Simonyan, K.; Zisserman, A. Very deep convolutional networks for large-scale image recognition. arXiv 2014, arXiv:1409.1556. [Google Scholar]
- Szegedy, C.; Vanhoucke, V.; Ioffe, S.; Shlens, J.; Wojna, Z. Rethinking the inception architecture for computer vision. In Proceedings of the IEEE Conference on Computer Vision and Pattern Recognition, Las Vegas, NV, USA, 12 December 2016; pp. 2818–2826. [Google Scholar]
- Hinton, G.; Srivastava, N.; Swersky, K. Neural networks for machine learning lecture 6a overview of mini-batch gradient descent. Cited On 2012, 14, 2. [Google Scholar]
- Kingma, D.P.; Ba, J. Adam: A method for stochastic optimization. arXiv 2014, arXiv:1412.6980. [Google Scholar]
- Bottou, L. Stochastic gradient descent tricks. In Neural Networks: Tricks of the Trade; Springer: Berlin/Heidelberg, Germany, 2012; pp. 421–436. [Google Scholar]
- Liu, L.; Ouyang, W.; Wang, X.; Fieguth, P.; Chen, J.; Liu, X.; Pietikäinen, M. Deep learning for generic object detection: A survey. Int. J. Comput. Vis. 2020, 128, 261–318. [Google Scholar] [CrossRef] [Green Version]
- Wenkel, S.; Alhazmi, K.; Liiv, T.; Alrshoud, S.; Simon, M. Confidence score: The forgotten dimension of object detection performance evaluation. Sensors 2021, 21, 4350. [Google Scholar] [CrossRef]
- Espejo-Garcia, B.; Mylonas, N.; Athanasakos, L.; Fountas, S. Improving weeds identification with a repository of agricultural pre-trained deep neural networks. Comput. Electron. Agric. 2020, 175, 105593. [Google Scholar] [CrossRef]
- Espejo-Garcia, B.; Mylonas, N.; Athanasakos, L.; Fountas, S.; Vasilakoglou, I. Towards weeds identification assistance through transfer learning. Comput. Electron. Agric. 2020, 171, 105306. [Google Scholar] [CrossRef]
- Yuan, Y.; Fang, S.; Chen, L. Crop disease image classification based on transfer learning with dcnns. Comput. Electron. Agric. 2020, 171, 105306. [Google Scholar]
- Verma, S.; Chug, A.; Singh, A.P. Application of convolutional neural networks for evaluation of disease severity in tomato plant. J. Discret. Math. Sci. Cryptogr. 2020, 23, 273–282. [Google Scholar] [CrossRef]
- Aneja, N.; Aneja, S. Transfer learning using CNN for handwritten devanagari character recognition. In Proceedings of the 2019 1st International Conference on Advances in Information Technology (ICAIT), Chikmagalur, India, 25–27 July 2019; pp. 293–296. [Google Scholar]
Figure 1.
Chatzivariti’s vineyard showing the vineyards where the images of diseased vine leaf were obtained.
Figure 1.
Chatzivariti’s vineyard showing the vineyards where the images of diseased vine leaf were obtained.
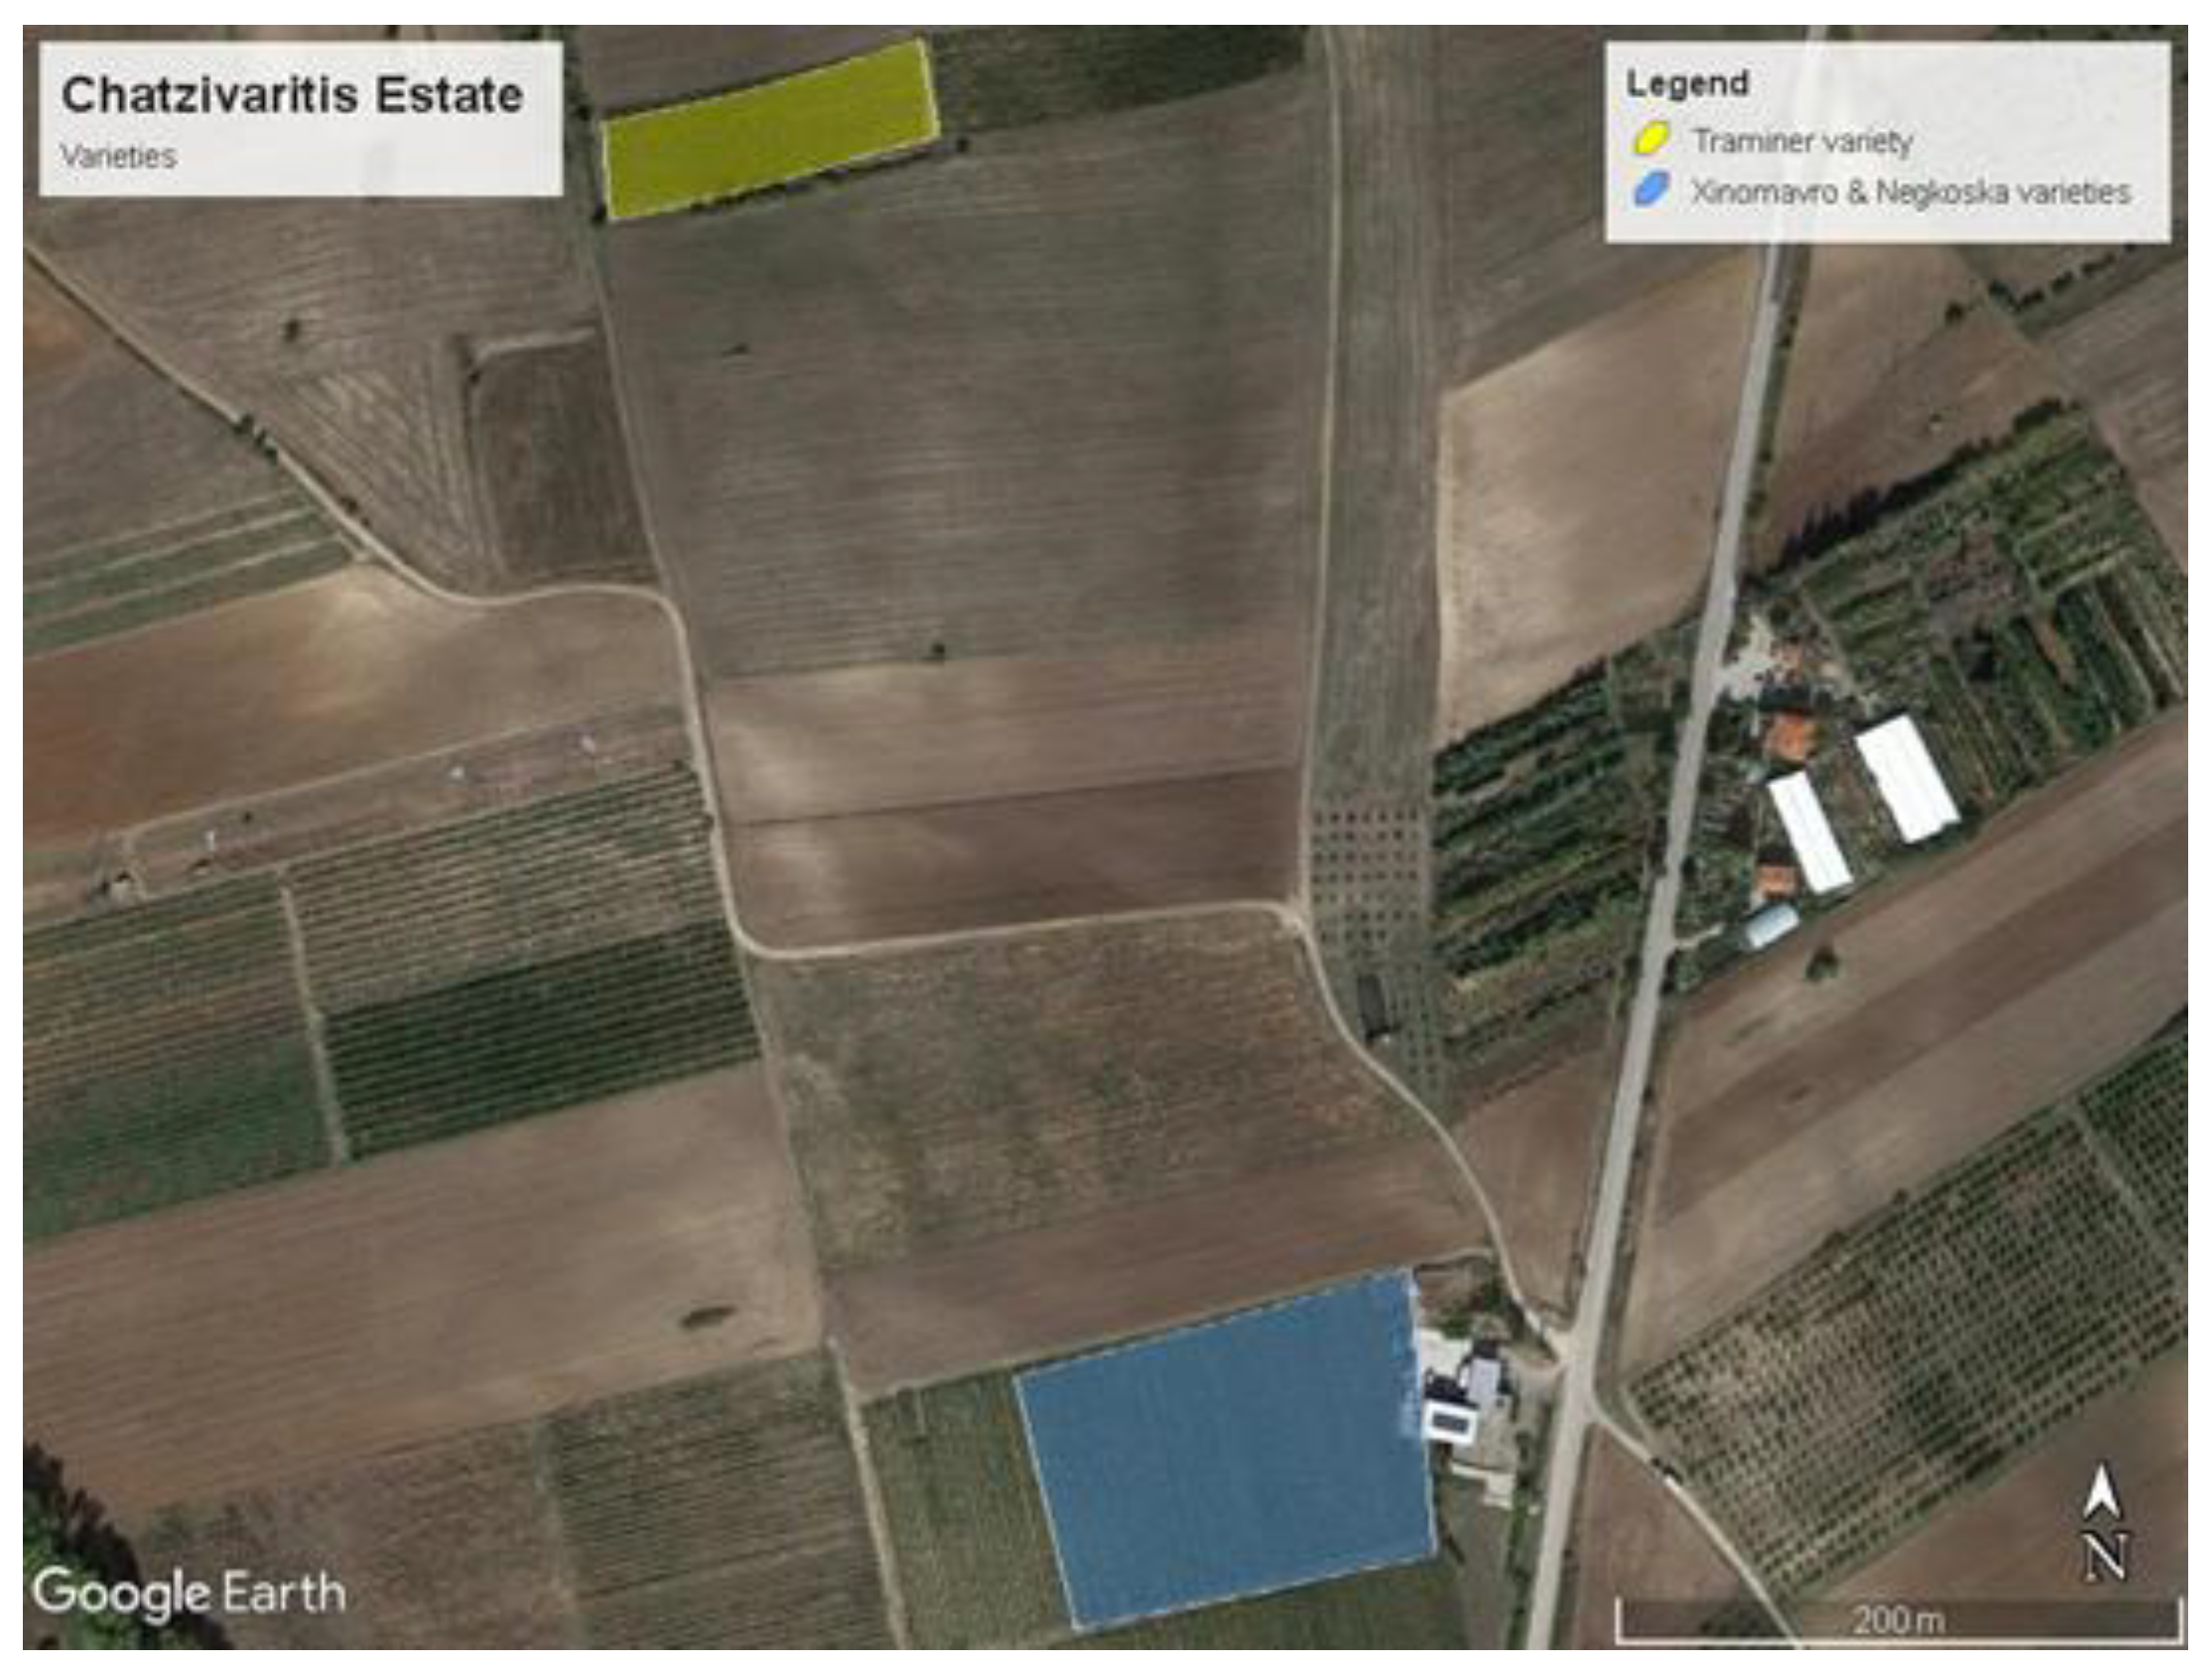
Figure 2.
AlexNet architecture. FC layers are depicted as a green cube, as they represent the classification algorithm that will be used.
Figure 2.
AlexNet architecture. FC layers are depicted as a green cube, as they represent the classification algorithm that will be used.
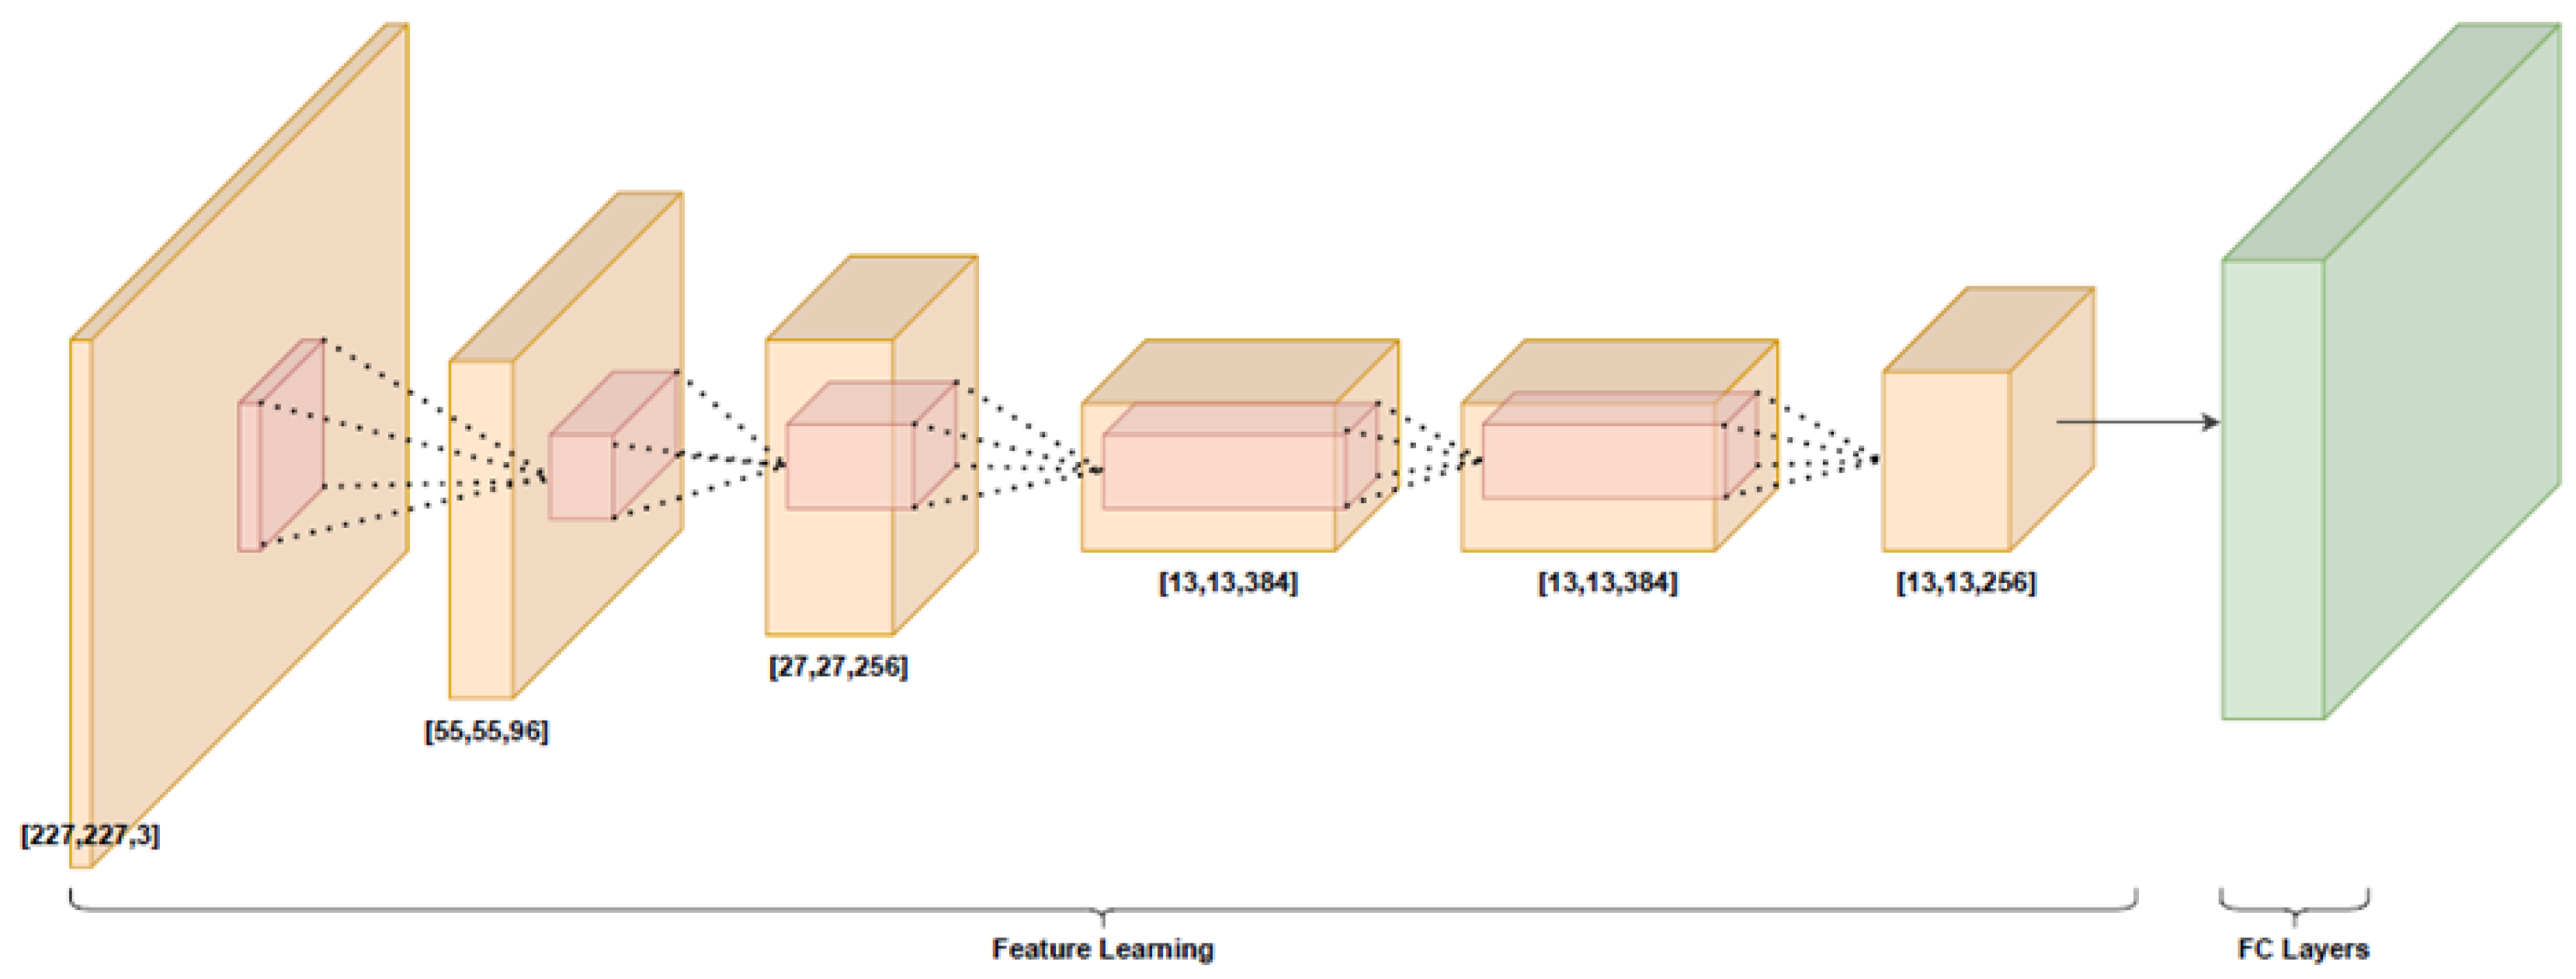
Figure 3.
VGG-19 architecture.
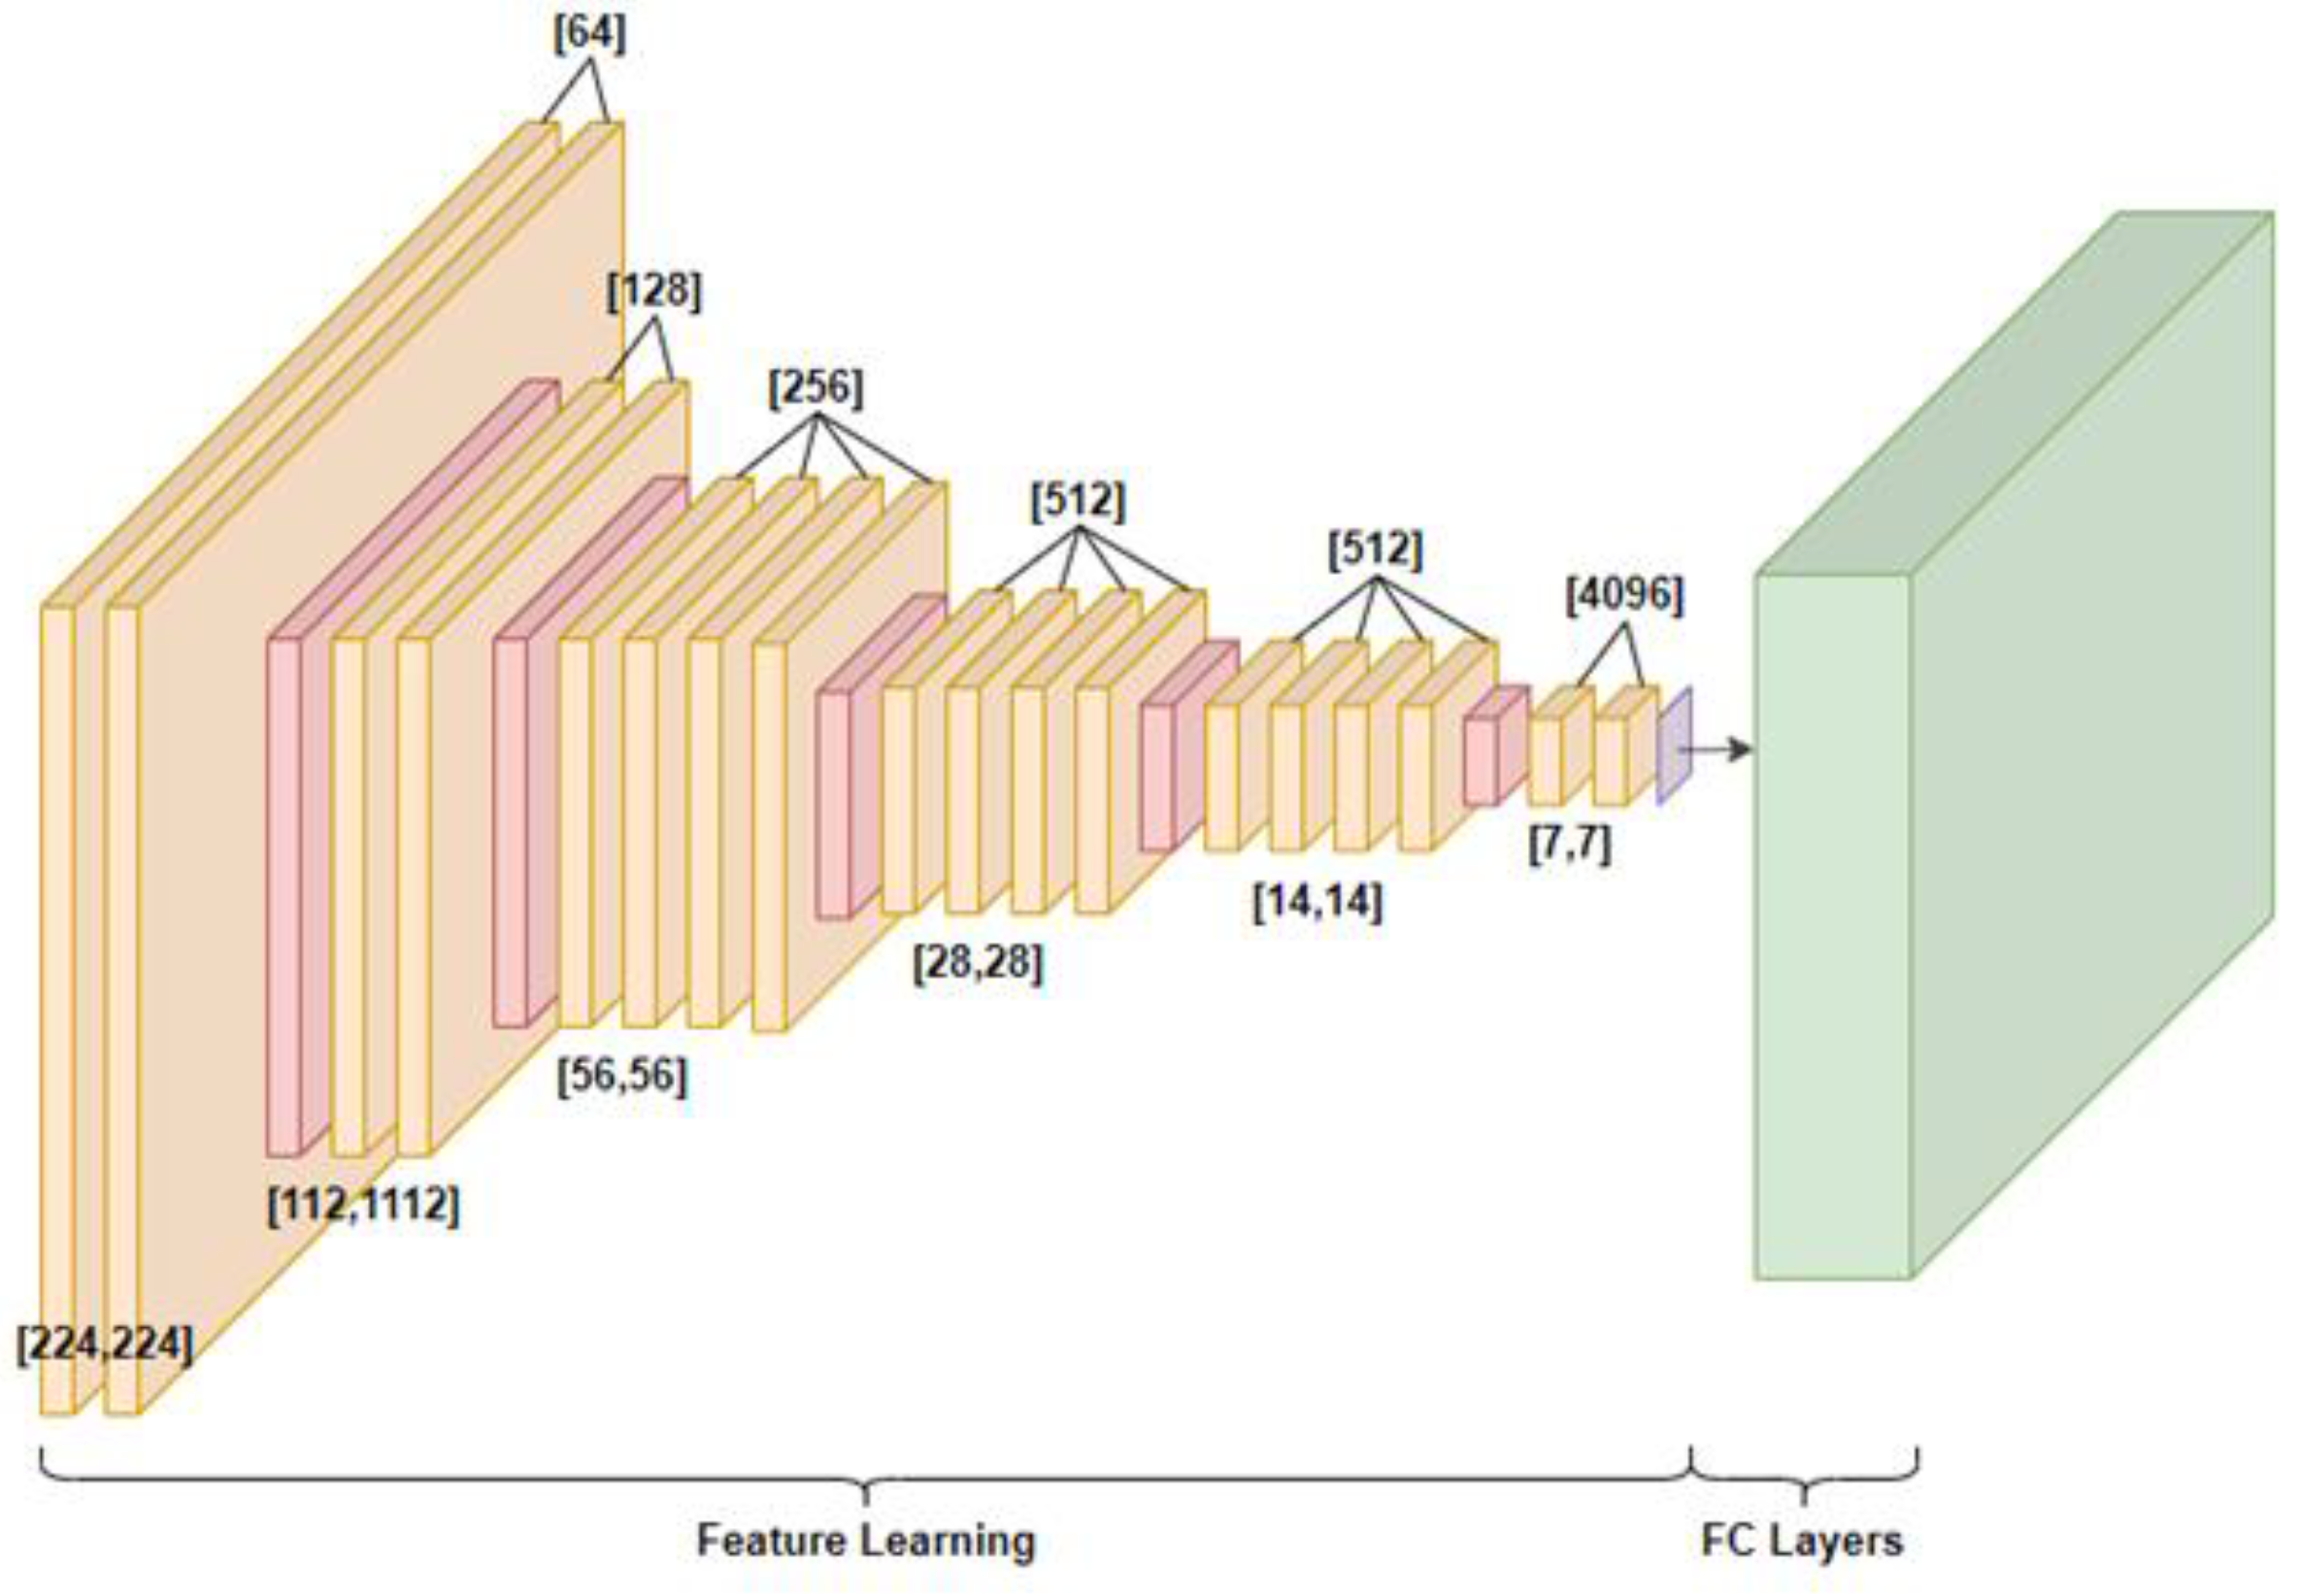
Figure 4.
Inception v3 architecture and working flow.
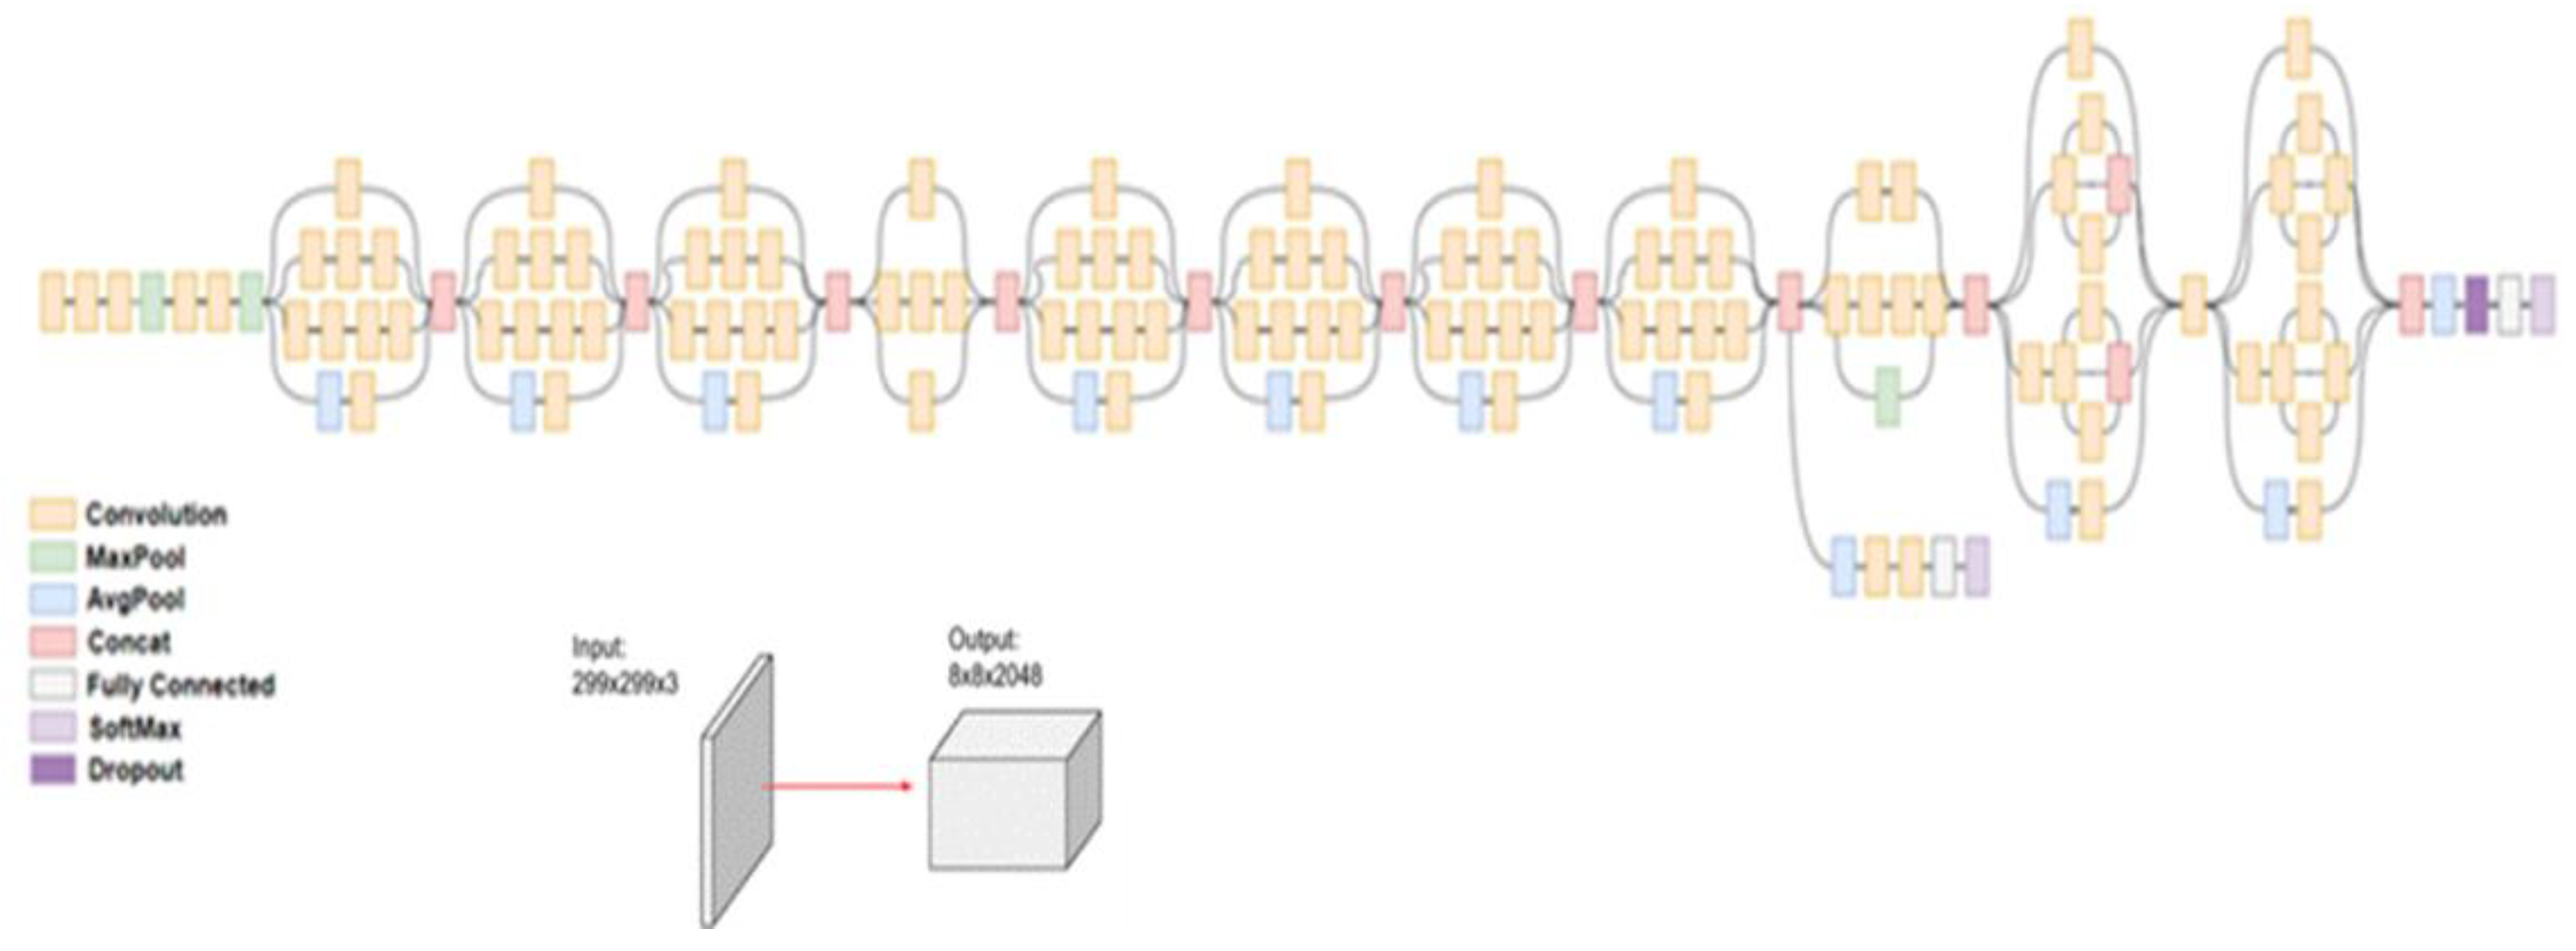
Figure 5.
Transfer learning feature extraction (left) and fine-tuning (right) training approaches diagram. In the feature extraction approach, the base model’s weights remain frozen and only the classifier is trained, while in the fine-tuning approach, training occurs in both of the last few layers of the base model (“Fine-Tuned convolutional base model” in the figure) and the classifier.
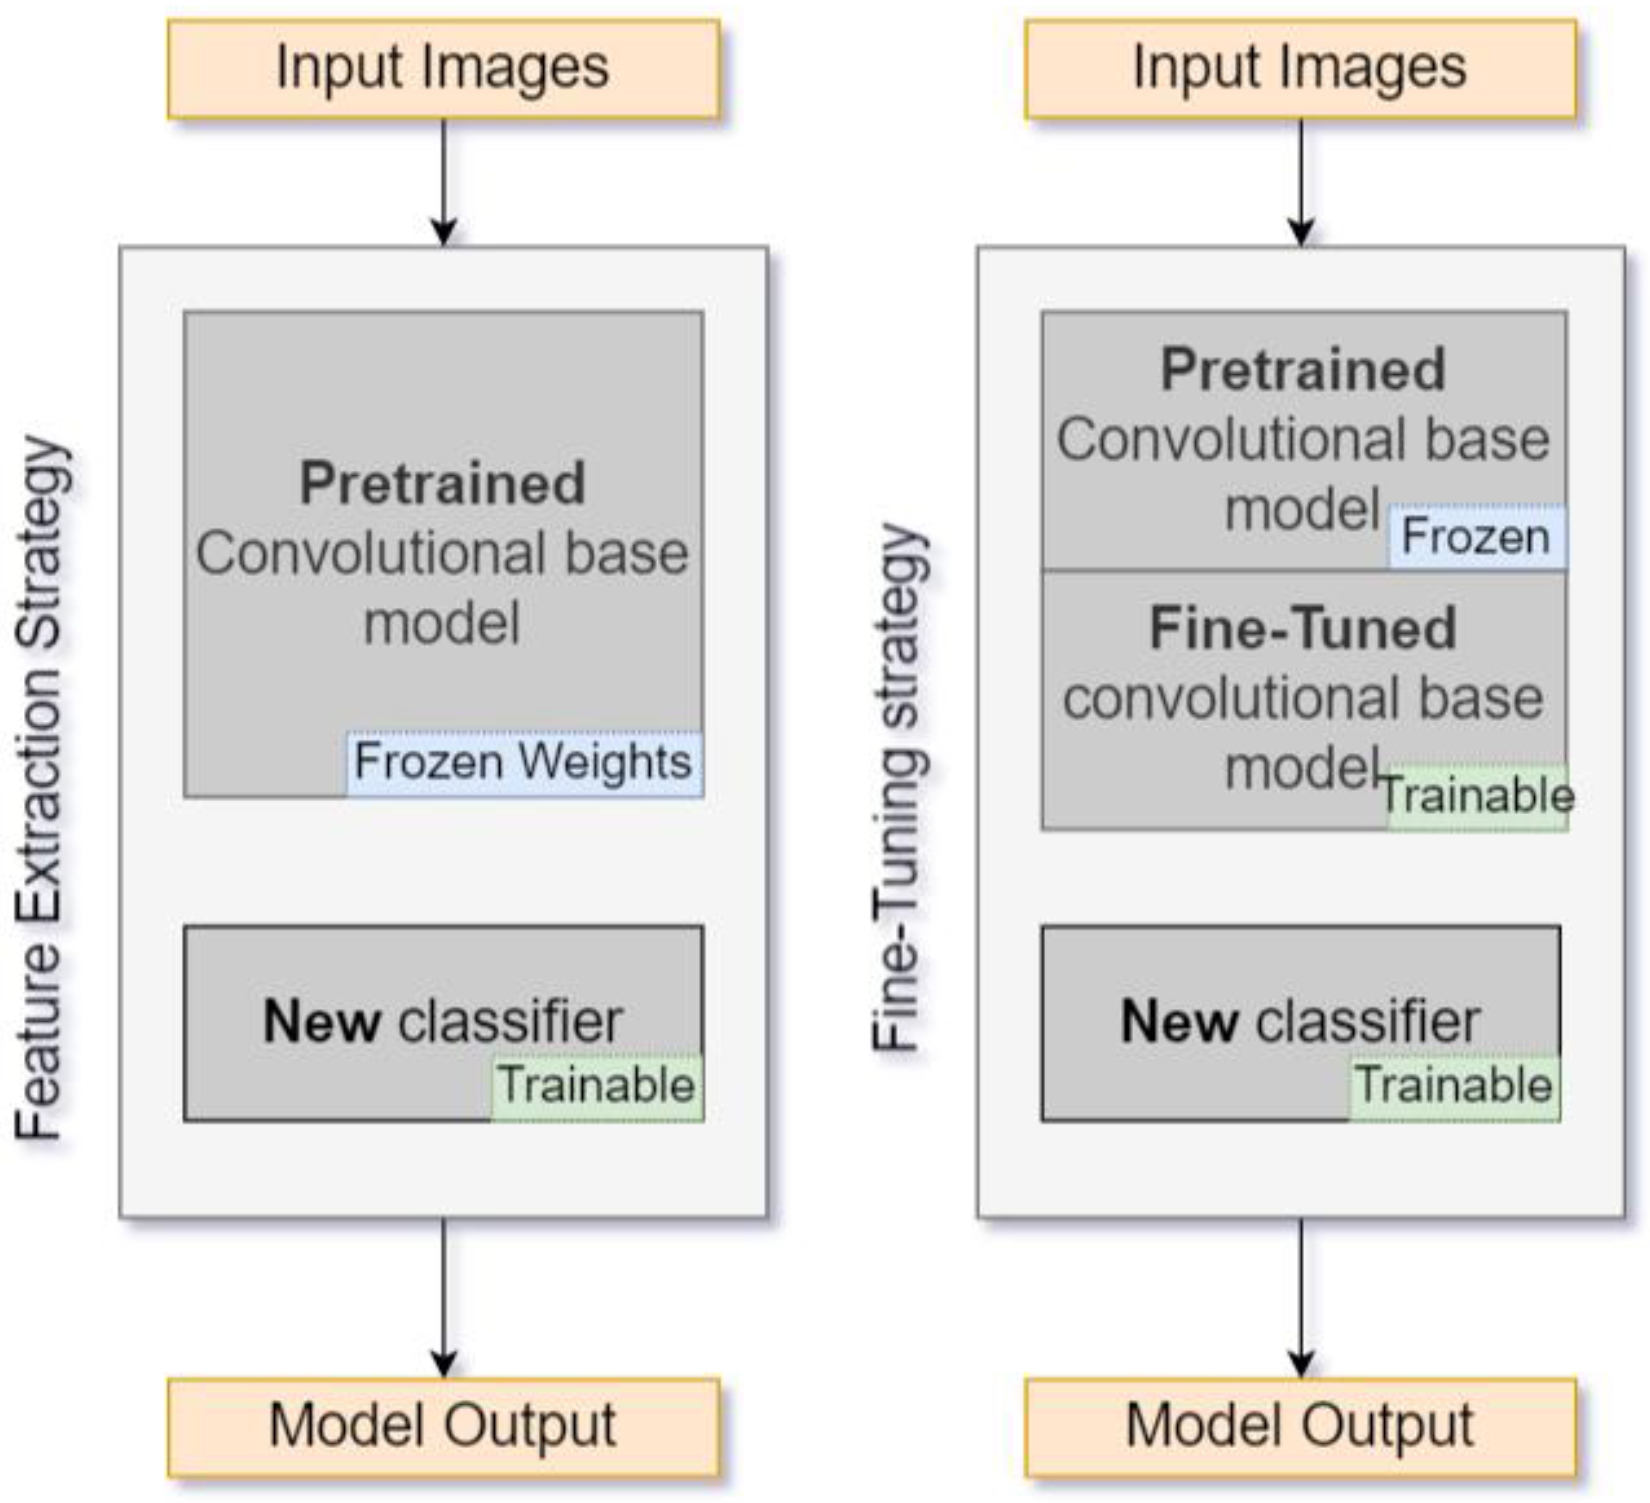
Figure 6.
Validation accuracy in the different training epochs for the three different proposed deep learning pretrained models. The figure on the left side shows the results for models created using the feature extraction strategy and the figure on the right shows the results for models created using the fine-tuning strategy, on the PlantVillage data.
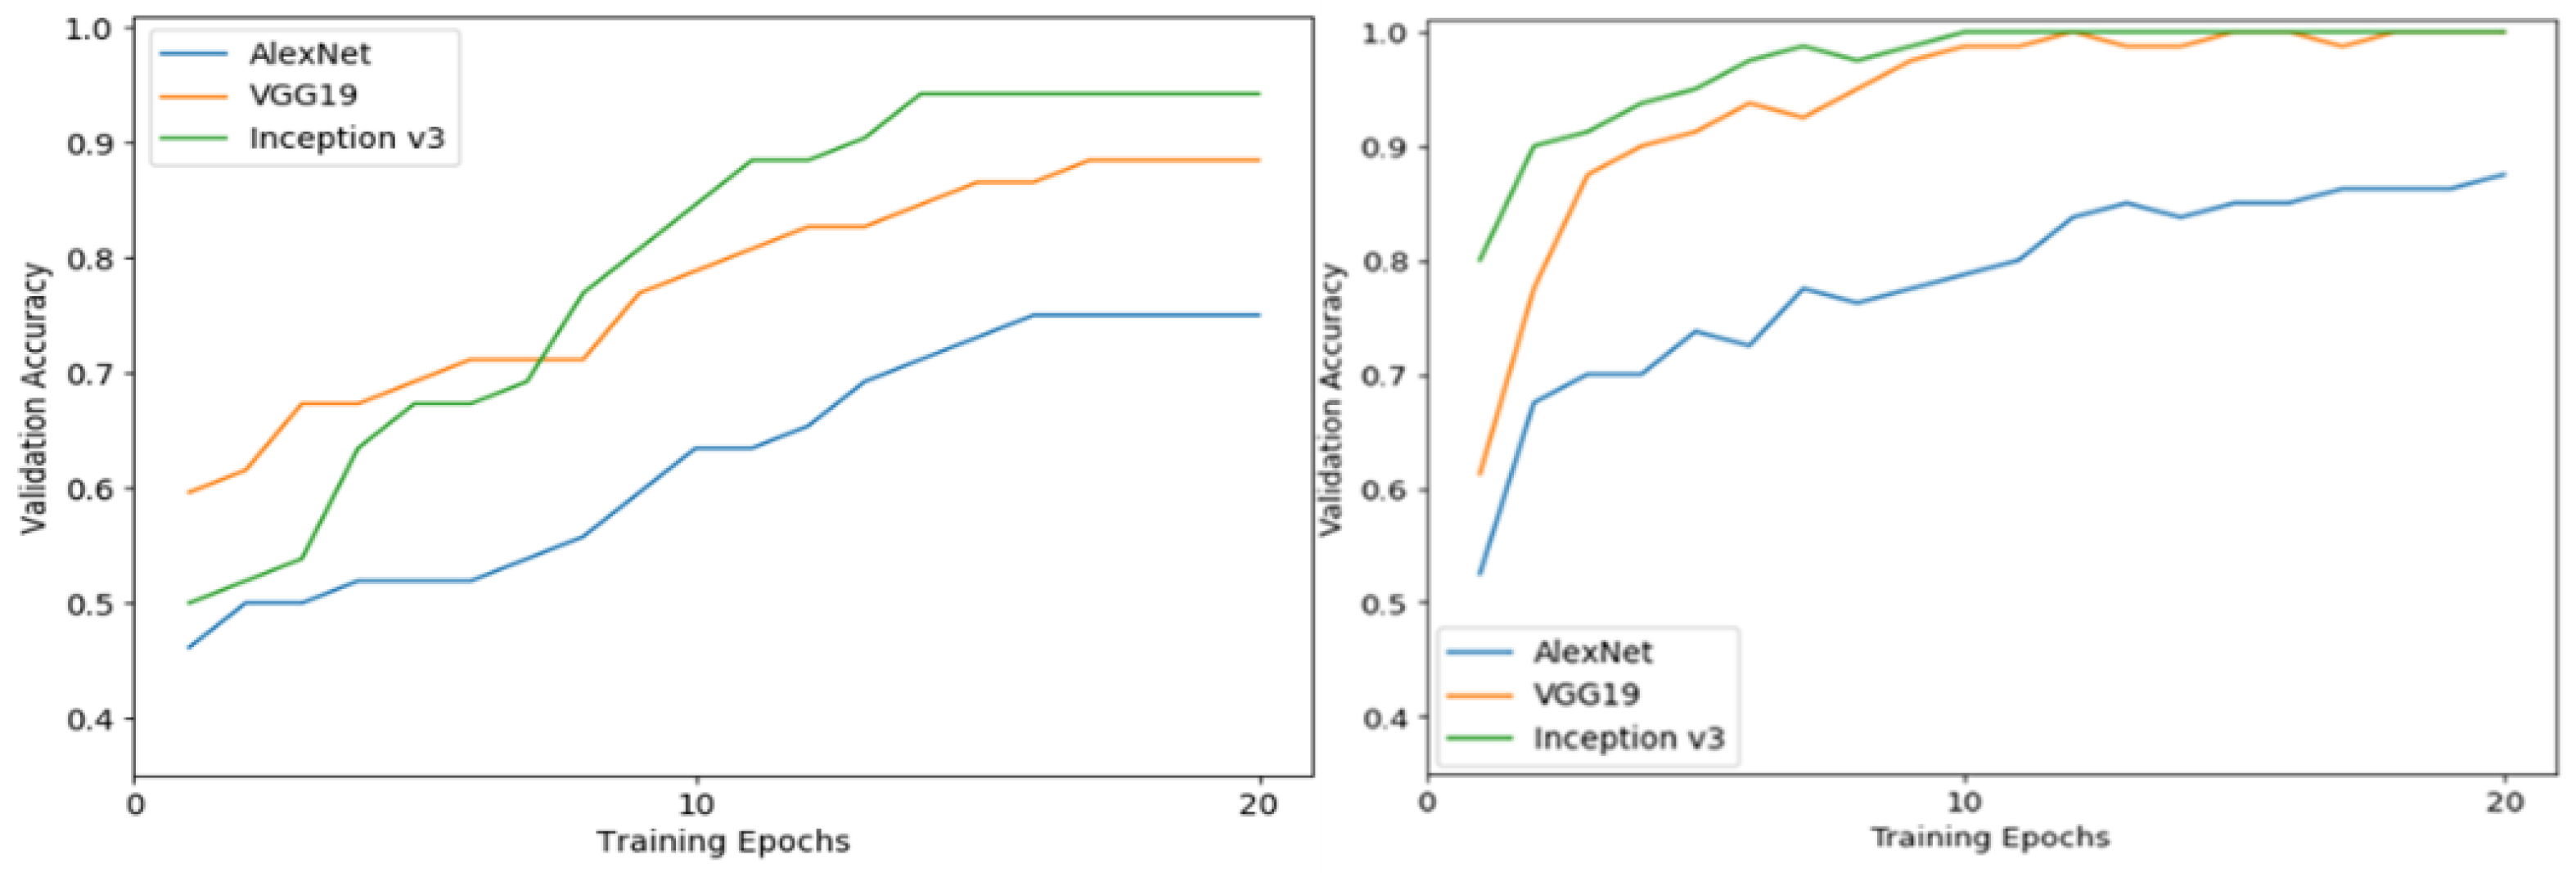
Figure 7.
Description of the two phases of the DCNN training. The first phase shows the initial training using the PlantVillage dataset for the creation of classifiers with the feature extraction and fine-tuning training approaches. The second phase shows the validation of the first phase using the data from Chatzivariti’s vineyard for the training of the classifiers.
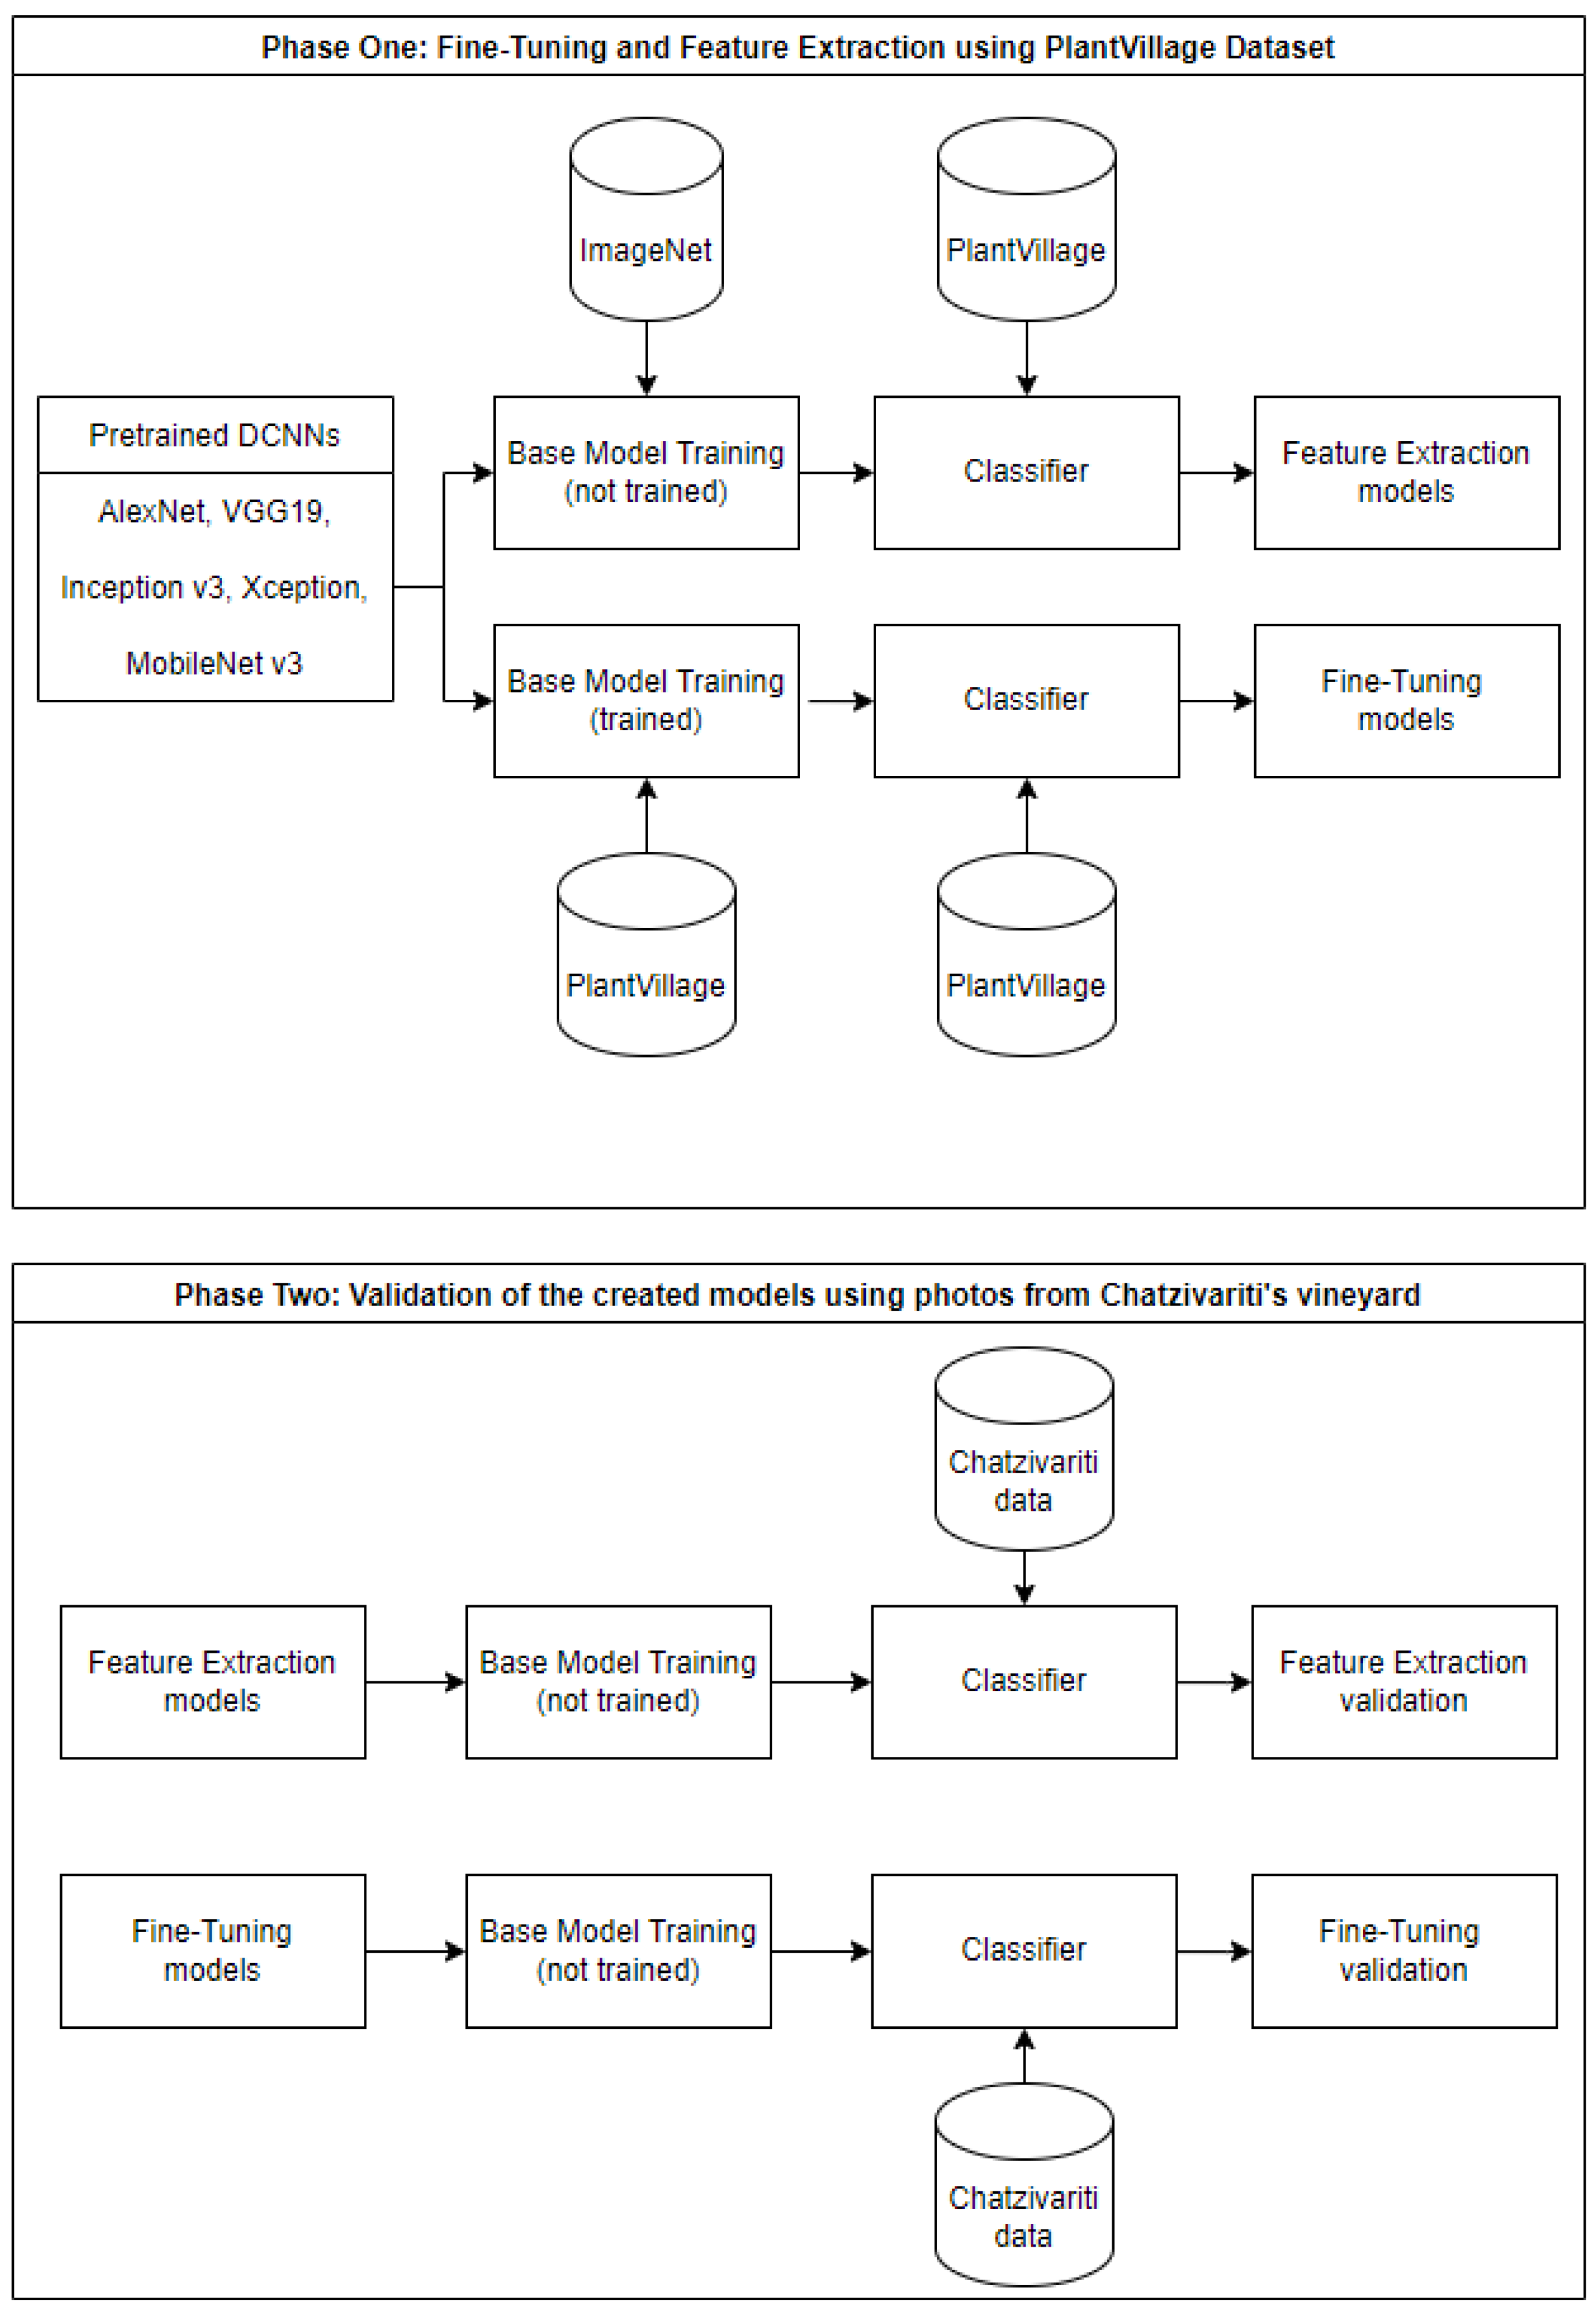
Figure 8.
Validation accuracy in the different training epochs for the three different proposed deep learning pretrained models. The figure on the left side shows the results for models created using the feature extraction training approach and the figure on the right shows the results for models created using the fine-tuning training approach on the custom data.

Table 1.
Summary of the AlexNet architecture in terms of input size requirements for every layer of the network.
Table 1.
Summary of the AlexNet architecture in terms of input size requirements for every layer of the network.
| Type | Input Size |
|---|---|
| input | 227 × 227 × 3 |
| conv | 55 × 55 × 96 |
| pool | 27 × 27 × 96 |
| conv | 27 × 27 × 256 |
| pool | 13 × 13 × 256 |
| 2 × conv | 13 × 13 × 384 |
| conv | 13 × 13 × 256 |
| pool | 1 × 1 × 256 |
| Fully connected layers | 1 × 1 × 4096 |
Table 2.
A summary of the VGG-19 architecture in terms of input size requirements for every layer of the network.
Table 2.
A summary of the VGG-19 architecture in terms of input size requirements for every layer of the network.
| Type | Input Size |
|---|---|
| input | 224 × 224 × 3 |
| 2 × conv | 224 × 224 × 64 |
| MaxPool | 112 × 112 × 64 |
| 2 × conv | 112 × 112 × 128 |
| MaxPool | 56 × 56 × 128 |
| 4 × conv | 56 × 56 × 256 |
| MaxPool | 28 × 28 × 256 |
| 4 × conv | 28 × 28 × 512 |
| MaxPool | 14 × 14 × 512 |
| 4 × conv | 14 × 14 × 512 |
| MaxPool | 7 × 7 × 512 |
| 2 × conv | 7 × 7 × 512 |
| 1 × conv | 7 × 7 × 4096 |
| Fully connected layer | 1 × 1 × 4096 |
| Fully connected layer | 1 × 1 × 4096 |
| Softmax | 1 × 1 × 1000 |
Table 3.
A summary of the Inception v3 architecture in terms of input size requirements for every layer of the network.
Table 3.
A summary of the Inception v3 architecture in terms of input size requirements for every layer of the network.
| Type | Input Size |
|---|---|
| conv | 299 × 299 × 3 |
| conv | 149 × 149 × 32 |
| conv padded | 147 × 147 × 32 |
| pool | 147 × 147 × 64 |
| conv | 73 × 73 × 64 |
| conv | 71 × 71 × 80 |
| conv | 35 × 35 × 192 |
| 3 × Inception | 35 × 35 × 288 |
| 5 × Inception | 17 × 17 × 768 |
| pool | 8 × 8 × 2048 |
| linear | 1 × 1 × 2048 |
| Softmax | 1 × 1 × 1000 |
| Fully connected layer | 1 × 1 × 38 |
| Fully connected layer | 1 × 1 × 38 |
| Fully connected layer | 1 × 1 × 38 |
Table 4.
Different parameter and hyperparameter value scenarios that were tested during the training of the selected models.
Table 4.
Different parameter and hyperparameter value scenarios that were tested during the training of the selected models.
| Hyperparameter/Parameter | Values Tested |
|---|---|
| Epoch number | 10, 20, 30 |
| Optimization algorithm | RMSprop, Adam, SGD |
| Learning rate | 0.1, 0.001, 0.0005, 0.0001, automatic LR reduction |
| Batch size | 2, 4, 8, 16, 25 |
| Dropout rate | 20%, 30% |
Table 5.
Data division into training and test set for the four grapevine classes of the PlantVillage dataset.
Table 5.
Data division into training and test set for the four grapevine classes of the PlantVillage dataset.
| Plant Village Data Division | ||
|---|---|---|
| Class | # of Training Data | # of Test Data |
| Healthy | 463 | 150 |
| Black rot | 1030 | 150 |
| Leaf blight spot | 926 | 150 |
| Esca | 1234 | 150 |
Table 6.
Data division into training and test set for the three classes of the Chatzivariti study case.
Table 6.
Data division into training and test set for the three classes of the Chatzivariti study case.
| Chatzivariti Data Division | ||
|---|---|---|
| Class | # of Training Data | # of Test Data |
| Healthy | 39 | 10 |
| Powdery mildew | 45 | 11 |
| Esca | 39 | 10 |
Table 7.
Validation accuracy results of the three proposed DCNNs, trained with the PlantVillage dataset images, on the 20th training epoch for a 3-layer and a 4-layer FC DNN.
Table 7.
Validation accuracy results of the three proposed DCNNs, trained with the PlantVillage dataset images, on the 20th training epoch for a 3-layer and a 4-layer FC DNN.
| 3-Layer Neural Network Validation Accuracy (%) | |||
|---|---|---|---|
| AlexNet | VGG-19 | Inception v3 | |
| Feature Extraction | 74.0 | 88.2 | 94.8 |
| Fine Tuning | 87.5 | 100 | 100 |
| 4-Layer Neural Network Validation Accuracy (%) | |||
| AlexNet | VGG-19 | Inception v3 | |
| Feature Extraction | 59.6 | 86.0 | 82.8 |
| Fine Tuning | 88.0 | 98.9 | 100 |
Table 8.
Validation accuracy results of the three proposed DCNNs, with custom vine plants images from Chatzivariti’s winery vineyard.
Table 8.
Validation accuracy results of the three proposed DCNNs, with custom vine plants images from Chatzivariti’s winery vineyard.
| Validation Accuracy (%) | |||
|---|---|---|---|
| AlexNet | VGG-19 | AlexNet | |
| Feature Extraction | 40.0 | 70.0 | 70 |
| Fine Tuning | 66.7 | 76.7 | 83.3 |
Table 9.
Testing results of AlexNet, VGG-19, and Inception v3, with the PlantVillage and the custom photo dataset for the fine-tuning approach.
Table 9.
Testing results of AlexNet, VGG-19, and Inception v3, with the PlantVillage and the custom photo dataset for the fine-tuning approach.
| Testing Accuracy (%) | |||
|---|---|---|---|
| AlexNet | VGG-19 | Inception v3 | |
| PlantVillage | 94.1 | 100 | 100 |
| Custom Photos | 65.2 | 74.2 | 83.9 |
Table 10.
Testing phase confusion matrix of the Chatzivariti’s case data for each one of the DCNN models that were examined. C1 represents the healthy class, C2 represents the powdery mildew infection, and C3 represents the esca infection.
Table 10.
Testing phase confusion matrix of the Chatzivariti’s case data for each one of the DCNN models that were examined. C1 represents the healthy class, C2 represents the powdery mildew infection, and C3 represents the esca infection.
| AlexNet | VGG-19 | Inception v3 | ||||||||||
|---|---|---|---|---|---|---|---|---|---|---|---|---|
| Model Output | Model Output | Model Output | ||||||||||
| C1 | C2 | C3 | C1 | C2 | C3 | C1 | C2 | C3 | ||||
| True Label | C1 | 6 | 4 | 0 | C1 | 8 | 0 | 0 | C1 | 9 | 1 | 0 |
| C2 | 4 | 6 | 0 | C2 | 3 | 7 | 0 | C2 | 2 | 8 | 0 | |
| C3 | 1 | 1 | 8 | C3 | 2 | 0 | 8 | C3 | 1 | 0 | 9 | |
Table 11.
Testing phase confusion matrix of the PlantVillage data for each one of the DCNN models that were examined. C1 represents the healthy class, C2 represents the black rot infection, C3 represents the leaf blight spot, and C4 represents the esca infection.
Table 11.
Testing phase confusion matrix of the PlantVillage data for each one of the DCNN models that were examined. C1 represents the healthy class, C2 represents the black rot infection, C3 represents the leaf blight spot, and C4 represents the esca infection.
| AlexNet | VGG-19 | Inception v3 | |||||||||||||
|---|---|---|---|---|---|---|---|---|---|---|---|---|---|---|---|
| Model Output | Model Output | Model Output | |||||||||||||
| C1 | C2 | C3 | C4 | C1 | C2 | C3 | C4 | C1 | C2 | C3 | C4 | ||||
| True Label | C1 | 147 | 2 | 1 | 0 | C1 | 150 | 0 | 0 | 0 | C1 | 150 | 0 | 0 | 0 |
| C2 | 11 | 132 | 6 | 1 | C2 | 0 | 150 | 0 | 0 | C2 | 0 | 150 | 0 | 0 | |
| C3 | 8 | 2 | 140 | 0 | C3 | 0 | 0 | 150 | 0 | C3 | 0 | 0 | 150 | 0 | |
| C4 | 1 | 3 | 0 | 146 | C4 | 0 | 0 | 0 | 150 | C4 | 0 | 0 | 0 | 150 | |
Table 12.
AlexNet, Inception v3, and VGG-19 trained with fine tuning and a 3-layer neural network in the last FC layer. Model evaluation (testing phase) gives an example of untrained images from the training distribution (PlantVillage data).
Table 12.
AlexNet, Inception v3, and VGG-19 trained with fine tuning and a 3-layer neural network in the last FC layer. Model evaluation (testing phase) gives an example of untrained images from the training distribution (PlantVillage data).
| Ex. # | AlexNet | Inception v3 | VGG-19 | True Label | Original Image |
|---|---|---|---|---|---|
| 1 | Black Rot (100) * | Black Rot (100) | Black Rot (100) | Black Rot |  |
| 2 | Black Rot (89.1) | Black Rot (100) | Black Rot (100) | Black Rot |  |
| 3 | Healthy (59) | Black Rot (83.9) | Black Rot (81.8) | Black Rot |  |
| 4 | Blight Spot (100) | Blight Spot (100) | Blight Spot (100) | Blight Spot |  |
| 5 | Black Rot (77.2) | Blight Spot (91.8) | Blight Spot (91) | Blight Spot |  |
| 6 | Esca (76.2) | Esca (98.9) | Esca (98.1) | Esca |  |
| 7 | Esca (98) | Esca (100) | Esca (100) | Esca |  |
| 8 | Esca (89.3) | Esca (100) | Esca (100) | Esca |  |
| 9 | Healthy (97.3) | Healthy (100) | Healthy (100) | Healthy |  |
| 10 | Healthy (100) | Healthy (100) | Healthy (100) | Healthy | 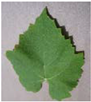 |
* The parentheses under the DCNN label prediction refers to the confidence level of the model prediction (%).
Table 13.
AlexNet, Inception v3, and VGG-19 trained with fine-tuning and a three-layer neural network in the last FC layer. Model evaluation (testing phase) gives examples of untrained images from Chatzivariti’s vineyard dataset.
Table 13.
AlexNet, Inception v3, and VGG-19 trained with fine-tuning and a three-layer neural network in the last FC layer. Model evaluation (testing phase) gives examples of untrained images from Chatzivariti’s vineyard dataset.
| Ex. # | AlexNet | Inception v3 | VGG-19 | True Label | Original Image |
|---|---|---|---|---|---|
| 1 | Esca (98.1) * | Esca (100) | Esca (100) | Esca |  |
| 2 | Healthy (77.3) | Healthy (81) | Healthy (82.1) | Powdery Mildew | 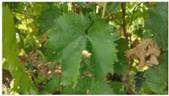 |
| 3 | Powdery Mildew (91.9) | Powdery Mildew (97.7) | Powdery Mildew (94.1) | Powdery Mildew | 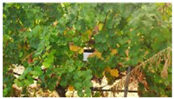 |
| 4 | Esca (93.2) | Esca (95.7) | Powdery Mildew (88.6) | Powdery Mildew | 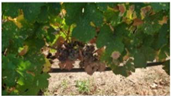 |
| 5 | Healthy (73.8) | Healthy (80.2) | Healthy (70.9) | Powdery Mildew | 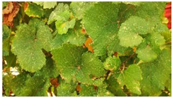 |
| 6 | Powdery Miledew (86.7) | Powdery Mildew (96.7) | Powdery Mildew (94.2) | Healthy | 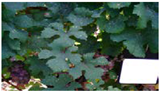 |
| 7 | Healthy (96.7) | Healthy (98.1) | Healthy (98.4) | Healthy |  |
| 8 | Healthy (90) | Healthy (95.4) | Healthy (93.3) | Healthy |  |
* The parentheses under the DCNN label prediction refers to the confidence level of the model prediction (%).
Publisher’s Note: MDPI stays neutral with regard to jurisdictional claims in published maps and institutional affiliations. |
© 2022 by the authors. Licensee MDPI, Basel, Switzerland. This article is an open access article distributed under the terms and conditions of the Creative Commons Attribution (CC BY) license (https://creativecommons.org/licenses/by/4.0/).
Share and Cite
MDPI and ACS Style
Morellos, A.; Pantazi, X.E.; Paraskevas, C.; Moshou, D. Comparison of Deep Neural Networks in Detecting Field Grapevine Diseases Using Transfer Learning. Remote Sens. 2022, 14, 4648. https://doi.org/10.3390/rs14184648
AMA Style
Morellos A, Pantazi XE, Paraskevas C, Moshou D. Comparison of Deep Neural Networks in Detecting Field Grapevine Diseases Using Transfer Learning. Remote Sensing. 2022; 14(18):4648. https://doi.org/10.3390/rs14184648
Chicago/Turabian StyleMorellos, Antonios, Xanthoula Eirini Pantazi, Charalampos Paraskevas, and Dimitrios Moshou. 2022. "Comparison of Deep Neural Networks in Detecting Field Grapevine Diseases Using Transfer Learning" Remote Sensing 14, no. 18: 4648. https://doi.org/10.3390/rs14184648
Note that from the first issue of 2016, this journal uses article numbers instead of page numbers. See further details here.