
Extraction of Saline Soil Distributions Using Different Salinity Indices and Deep Neural Networks

1
Key Laboratory of Geographical Processes and Ecological Security in Changbai Mountains, Ministry of Education, School of Geographical Sciences, Northeast Normal University, Changchun 130024, China
2
Department of Plant Sciences, University of Tennessee, Knoxville, TN 37996, USA
3
Northeast Institute of Geography and Agroecology, Chinese Academy of Sciences, Changchun 130102, China
*
Author to whom correspondence should be addressed.
†
Co-first author: The two authors have the same contribution to this article, so they are listed as the co-first author.
Remote Sens. 2022, 14(18), 4647; https://doi.org/10.3390/rs14184647
Submission received: 30 July 2022
/
Revised: 5 September 2022
/
Accepted: 6 September 2022
/
Published: 17 September 2022
Abstract
:Soil salinization has become one of the major environmental problems threatening food security. The identification and knowledge of the spatial distributions of soil salinization are key in addressing this problem. This study assumes that a good saline land identification effect can be obtained with the help of deep learning methods. Therefore, this study used the OLI sensor data from the Landsat-8, based on the U2-Network, and proposes a method to extract saline land from remote sensing images. The study also adds different salinity indices (SI, SI1, and SI2) to explore its impact on classification accuracy. Through our method, accurate saline soil distribution information were obtained, and several verification indicators (the Intersection-over-Union (IoU), recall, precision, and F1-score) were all measured above 0.8. In addition, compared with the multi-spectral training results, the classification accuracy increased after adding a specific salinity index, and most of the accuracy indices increased by about 2% (the IoU increased by 3.70%, recall increased by 1.50%, precision increased by 2.81%, and F1-score increased by 2.13%). In addition, we also included a case study based on our methodology to analyze the distribution characteristics and changes of saline soil in the Zhenlai area of Northeast China from 2016 to 2020. We found that the area of saline land in the Zhenlai area has reduced, which shows that the extraction method proposed in this study is feasible. Overall, this paper indicates that deep learning-based methods can efficiently extract the salinity of soil and enhance the mapping of its spatial distribution. The study has the broad impact of supplementing satellite imagery for salinity modeling and helping to guide agricultural land management practices for northeastern China and other salinized regions.
1. Introduction
Saline lands are a major land degradation threat, with significant impacts on soil fertility, stability, and biodiversity [1]. Due to the obvious processes of soil moisture evaporation and salt deposition in arid and semi-arid regions, soil salinization is prone to occur in these climate regions [2]. Soil salinization reduces soil fertility, which in turn affects global food security [3,4]. The main reasons include two aspects. Firstly, excessive soil alkalinity can adversely alter soil permeability [5], increase the probability of being disturbed by water or wind [6], and decompose more soil organic matter [7]. Secondly, extreme soil salinity inhibits soil material cycling processes (such as nitrogen cycling) and soil microbial activities (such as respiration, decomposition, etc.) [7,8]. Furthermore, saline soils inhibit the process by which vegetation absorbs and releases water through salt ions (transpiration) [9]. This is one of the causes of soil desertification [10].
The Songnen Plain covers an area of about 17.0 × 10⁶ ha in the central part of northeastern China, which is surrounded by the Changbai Mountain (east), Xiaoxing’an mountain range (north) and Daxing’an mountain range (west). The Songnen Plain eco-system is very fragile, and many environmental hazards such as soil alkalinization, flood, and drought disasters occur. Soil salinization is the most significant disaster. The climate of the region is classified as the transition of sub-humid and semi-arid, which is favorable for the growth of food crops and grasses. Therefore, it is the transitional zone of agriculture and grazing [11]. Excessive clearing and grazing lead to reduced grassland and soil compaction, which leads to increased evaporation and runoff, reducing water infiltration into the soil [12]. This has allowed the saline groundwater to rise and, together with an increased erosion of the surface soil, has resulted in an increased salinity of the surface soils [13]. Now, the Songnen plain has become one of the three largest soda saline areas in the world.
Remote sensing has unique advantages in saline soil detection applications, making it widely used in saline soil monitoring [14]. Remote sensing uses electromagnetic waves of different wavelengths reflected by objects to obtain information on the Earth’s surface [15]. Because salinized soil has an impact on the growth of vegetation, using remote sensing technology to monitor the growth status of vegetation can indirectly help scientists understand the degree of soil salinization in the region [16,17]. Low reflectance in the visible region and high reflectance in the near-infrared region are spectral features of healthy vegetation [18]. This is because healthy vegetation has a specific leaf cell structure and active photosynthesis [19], and changes occur in the spectrum reflected by the vegetation when under salinity stress [20]. Therefore, some studies have used various vegetation indices to evaluate the relationship between soil salinity and vegetation reflectance [14].
Deep learning has demonstrated its potential in the detection and protection of natural resources [21,22]. This method does not rely on consistent spectral signatures or rule-based algorithms and has been proven to be capable of outperforming classical remote sensing techniques [23]. Deep learning is an end-to-end inductive learning process between the input phase end and output phase end, where learning is a process of the automagical retrieval of the best results, and all parameters are jointly learned instead of being staged to reduce the need for human prior knowledge dependence. Furthermore, deep learning is based on hierarchical learning, which leads to the extraction of high-level features from low-level features. As a result, the process builds increasingly accurate and realistic outputs [24,25], with successes in image segmentation and classification. Traditional segmentation methods in remote sensing include linear regression, support vector machines, and random forest analyses. Compared with deep learning methods, these methods require pure domain knowledge and extensive manual tuning to implement [26,27].
Data-driven approaches such as deep learning methods have been explored for salinity study applications in recent years [28,29,30]. At present, the method to improve the efficiency of image segmentation is mainly by modifying the neural network structure to achieve the goal [31,32]. Common methods include changing the backbone, changing the network level, and introducing an attention mechanism [33]. These methods have greatly improved the segmentation accuracy, but a gap between deep learning and the applications in soil salinity is in finding the proper remote sensing indices to better model the salinity content. Therefore, this study aimed to explore the deep learning methods for the extraction of saline soils by introducing salinity indices into the deep learning networks.
The study established a convolutional neural network (CNN)-based saline land extraction algorithm for Landsat-8 images. This was made possible by the U2-Net [34] model’s strong learning ability, which can establish nonlinear relationships well and achieve good results in the field of image segmentation. The U2-Net model features a simple structure and lightweight network that has the capability of leveraging a small amount of data to achieve accurate results. Therefore, the integration of U2-Net was expected to improve saline soil mapping, allowing for higher efficiency and accuracy. Two specific questions needed to be answered by this study: Firstly, what are the contributions of different salinity indices as input variables to the extraction of saline land information? Secondly, will the combination of salinity indices and the deep learning method further improve the segmentation accuracy of saline land information extraction?
2. Materials and Methods
2.1. Study Area
The study area is Zhenlai county, which is located in the western part of the Songnen Plain in northeastern China (Figure 1). The region has a typically semi-arid monsoon climate, with more precipitation in the east compared with the west, and more evaporation in the west compared with the east [35,36]. In addition, the groundwater table in this area is high; drainage is poor, and the soil is prone to salinization [37]. Na2CO3, NaHCO3, and NaCl are the main components of saline soil [38]. This type of composition makes it difficult for saline soil to disappear naturally, which further hinders water infiltration and salt exchange, forming a vicious circle [39]. In addition to natural factors, human activities are also one of the main reasons for the soil salinization in this area, as this area is the main grain-producing area in China [40].
2.2. Data Description
2.2.1. Satellite Data
Primary satellite data is from Landsat-8. The data were downloaded from the Geospatial Data Cloud [41], and the product level was L1TP (Level 1 Precision Terrain), that is, the downloaded data has undergone terrain and geometric corrections. After downloading the data, we performed a radiometric calibration and atmospheric correction of the remote sensing images and then trimmed the effects to a size that could be processed by a computer. This study used images of 7 bands ranging from band 1 to band 7: band 1 (0.43–0.45 µm), band 2 (0.45–0.51 µm), band 3 (0.53–0.59 µm), band 4 (0.64–0.67 µm), band 5 (0.85–0.88 µm), band 6 (1.57–1.65 µm), and band 7 (2.11–2.29 µm); they had a spatial resolution of 30 m. The study area covered two Landsat-8 scenes, with their metadata shown in Table 1. The reason for choosing this specific time period was that the snow and ice in the Songnen Plain had completely melted, and most of the vegetation and crops had not yet germinated, resulting in a clean soil condition for the identification of the saline land. Additionally, we collected images with relatively low cloud cover whenever possible to prevent clouds from obscuring the ground.
2.2.2. Experimental Software and Hardware Environment
The data processing and model implementation were conducted in AI Studio, an online environment, and we used a 4-core CPU, 32 GB RAM, and Tesla V100 GPU (32 GB memory) using Python 3.7.0. Besides, we used the ArcMap 10.3 software for data labeling.
2.2.3. Soil Sampling
For soil sampling, three soil samples were collected with a 5 cm diameter cutting ring near each sampling point for a total of 159 samples. Then we numbered the samples and fully dried them in the laboratory. Taking 3.3 g of each of the three samples from the same sampling site to form a 10 g sample, then configure the soil suspension according to the water-soil ratio of 1:5 and measure its electrical Conductivity (EC) in dS/m value with a conductivity meter (model: Rex DDS-307A). The purpose of adding EC is to correctly identify the location of the saline land so that the correct training material can be made.
2.3. Data Preparation
2.3.1. Salinity Index and Training Label
Various indices can be formed by performing calculations (such as addition, subtraction, multiplication, division, etc.) using the information sources in different bands of the sensor (such as Landsat-8 OLI: band 2, blue; band 3, green; band 4, red; band 5, NIR, etc.). The goal of extracting regions of interest (such as water bodies, vegetation, buildings, woodland, snow, etc.) from remote sensing images can be achieved using different indices. Many salinity indicators have also been developed in soil salinity research, mainly for evaluating the relationship between soil salinity and surface reflectance [39]. The commonly used salinity indices are listed in Table 2. The salinity indices used in this project include SI, SI1, SI2, and SI3. These salinity indicators have previously performed well in saline land identification [42,43].
With one of the overarching goals of the study being to explore the contributions of salinity indices on network accuracy, the baseline of the methodology was therefore to obtain an index-based salinity information calculation approach. Through investigation of the literature, we selected the salinity index 3 (SI3) to achieve this goal due to its high correlation coefficient between the salinity coefficient and measured electrical conductivity in the Songnen Plain [48] (SI3 correlation coefficient: 0.41). Combined with the calculation results of SI3 and the EC value measured on the ground, the spatial distribution of saline land in the area corresponding to the training set data was drawn. This serves as a label to provide prior information for subsequent training. There are two types of content: saline soil and background. The calculation results of different salinity indices are shown in Figure 2. The dataset labels are shown in Figure 3.
2.3.2. Training Dataset Processing
The acquired Landsat-8 remote sensing images have been pre-processed with radiometric calibration, atmospheric correction (Fast line-of-sight atmospheric analysis of spectral hypercubes, FLAASH) [49], and mosaicking. The processed remote sensing image and the marked annotation file were cropped into 512 × 12 × 7 image blocks and 512 × 512 × 1 marked blocks, respectively. During the cropping process, a sliding window cropping [50] strategy was adopted to maintain a fixed image overlap ratio (0.2). The images and labels were then divided according to the training set and the test set at a ratio of 7:3. After the processing, the training set contained 903 images and the test set contained 387 images, for a total of 1290 images.
2.4. Methods
2.4.1. Experimental Design
We used the U2-Net network to segment the multispectral Landsat-8 remote sensing image and extract the saline soil area. We calculated the salinity indices with Landsat-8 multispectral data, then added different salinity indices and combinations of salinity indices to the multispectral image as input data to the network for image segmentation, and then used the indicators to evaluate the network split effect. The band and index combinations that were used in this experiment are shown in Table 3. The overall experimental design and data process are shown in Figure 4.
2.4.2. U2-Net
U2-Net is a two-level nested U-structure architecture originally developed for salient object detection [34]; in this study, we used the model to identify saline land from remote sensing imagery. There are many remote sensing image classification-related works based on this method, such as olive canopy extraction [51], building outline extraction [52,53], etc. In addition, this method has many applications in the field of medical image recognition [54,55]. This method has been proven to achieve good results in a variety of scenarios. We chose the U2-Net model over other neural networks because of its ability to integrate several contextual information extraction strategies into the network design process, including multi-level feature fusions, encoder-decoder structures, residual connections, U-shaped networks [32], multi-scale feature extractions, etc. Furthermore, the U2-Net is a superior network because of its power when extracting features at different scales. In addition, a critical advantage of U2-Net is its capability of not significantly increasing the memory and computational cost as the network goes deeper. The entire network can be described as a residual U-block (RSU) (Figure 5), which consists of an encoder and a decoder. Among them, 6 down-sampling processes form the encoder, 5 up-sampling processes form the decoder, and the sampling process is also formed based on the RSU (Figure 6a), thus forming a nested U-shaped Internet. The RSU is the core unit of the network, as its role is to extract features at different stages and scales for network learning. RSU-L signifies that the encoder has L layers in the RSU, where L is an integer. The residual network involved in the network can be expressed as:
As shown in Figure 6b, the result F(X) obtained after convolving the feature map X, U-block is shorted by U, and the output of the residual network is labeled . The network uses a residual network to combine the local contextual features (F(X)) and multi-scale features (U(F(X))).
2.4.3. Training Process
The training set requires data normalization and standardization to fit into the network. The ‘batch_size’ set for the training network was 16. The reason for choosing 16 was to make full use of computing resources without exceeding the memory limit. The optimizer selected Adam processing, and the learning rate varied with batches according to the law of the cosine function.
2.4.4. Metric Assessment
This study used several common evaluation metrics to assess the performance of the model. The specific evaluation indicators were the recall rate, precision rate, and F1-score (Equation (2) and (4)). The recall (R) shows the proportion of saline soils correctly identified by the test set. The precision (P) shows the proportion of saline soils correctly identified by model testing. The F1-score is an overall accuracy evaluation metric based on recall and precision.
We also calculated the point of intersection (IoU) to assess the accuracy of the saline land polygon (Equation (5)). The IoU is the ratio of the area of the saline land polygons of the test set to those predicted by the U2-Net model. By convention, when the IoU value is larger than 0.5, it indicates a reliable modeling result [56,57].
In this study, true positive (TP) in this study was defined as the number of saline lands that were correctly classified as saline; false negative (FN) was defined as the number of saline soils that were incorrectly identified as background. In this study, false positive (FP) was defined as the number of backgrounds that were misidentified as saline. was used for the ground-truthed saline land range in the test set, and the saline land predicted by the model was marked as . The region shared by and was represented by the intersection operation, and the merged region of and was represented by the union operation.
3. Results
3.1. Multi-Band Experiments
This section demonstrates the effectiveness of the method proposed in this study. It consists of two parts. The first part uses a variety of evaluation indices to illustrate the effectiveness of the method, and the second part illustrates the effectiveness and practicability of the method by analyzing the distribution of saline land in the Zhenlai area over the past five years.
The results show that the proposed U2-Net-based extraction method for saline soil is feasible. In the measurement of the overall accuracy of classification, among the experimental subjects with multi-bands as the input, the overall average IoU reached 0.8664, indicating that the recall and precision both exceeded 0.9, reaching 0.9040 and 0.9385, respectively. The F1-score valued above 0.9190 indicates that the accuracy of the study reached a good level from different perspectives.
We inputted the multispectral images of the Zhenlai area each year from 2016 to 2020 into the trained model to obtain the distribution of saline land in the Zhenlai area in each year (Figure 7). Observing the distribution in the past five years, we observed that the saline area is widely distributed in the study area. In terms of the distribution characteristics, the distribution of saline areas is uneven. The spatially clustered saline areas are mostly distributed in the central and northwest regions. The southwestern region of the study area has a small distribution area and a fine distribution.
The salinization degree was represented by the ratio of the saline land patch area to the total area of Zhenlai in the saline land distribution map each year, and we drew the change map of the saline land ratio over the past five years (Figure 8). The proportion dropped the fastest from 2016 to 2017 and increased in 2020, but its proportion is still lower than it was in 2016. The shrinking pattern can be observed near 46°N, 123°E. The distribution areas of saline land in the southwestern region of the study area have also decreased. Although there has been an increase in the central region, the increase is small, and the distribution is more scattered.
3.2. Adding Salinity Index Experiments
One of the objectives of the study was to add salinity indices and their combinations to multi-bands as inputs to test their effects on the segmentation results. The results are shown in Table 4 and Table 5. In the overall accuracy, all of the IoU scores are higher than 0.86. The recall, precision, and F1-scores are all greater than 0.9, indicating satisfactory classification results. For the saline class only, the IoU is around 0.75, which is higher than 0.5. The recall results are all greater than 0.82, the precision results are around 0.9, and the F1-score value is around 0.86. The results show that different salinity indices and combinations can be used as input data to achieve good segmentation results [56,57].
3.3. Comparison between the Two Groups of Inputs
Whether using multi-bands as inputs or adding different salinity indices to the model, good segmentation results were achieved. Table 4 and Table 5 show that the classification accuracy obtained by the experimental group with different salinity indices and combinations as input is better than that of the multi-band group. In the experiment of salinity index and combination, the best effect was obtained by using the combination of salinity index SI2. In the overall accuracy evaluation, all evaluation indicators were higher than the multi-band experimental group, of which the IoU increased by 1.74%, recall increased by 0.75%, precision increased by 1.81%, and F1-score increased by 1.27%. When only looking at the identification accuracy of saline land, the improvement is greater than the overall accuracy, of which the IoU increased by 3.70%, recall increased by 1.50%, precision increased by 2.81%, and F1-score increased by 2.13%. The intuitive differences brought about by different salinity indices are shown in Figure 9, and the related accuracy evaluation is shown in Figure 10.
When examining only the group with the added salinity index, the overall accuracy is best in the multi-band + SI2 group (IoU: 0.8777; recall: 0.9135; precision: 0.9509; and F1-score: 0.9318), and all of the evaluation metrics in this group achieved higher accuracy than other groups with a salinity index. The group with the lowest accuracy was multi-band + SI, SI1, SI2 (IoU: 0.8624; recall: 0.9066; precision: 0.9337; and F1-score: 0.9200). For the remaining two groups, multi-band + SI1 and multi-band + SI and SI1, the accuracy evaluation achieved inconstant results. Generally, we found that the result of adding one salinity index was better than adding two salinity indices, and better than adding three salinity indices. The results of separate observations of saline land divisions also yielded similar results (Figure 11).
3.4. The Effect of Salinity Index on the Experimental Process
The experimental results show that salinity can also affect the learning process. As shown in Figure 12a, for recall, there was an upward trend with the increase of batches in general, with the most significant rise in batches ranging 0–5000. The fastest rising combination was multi-bands with SI and SI1, and the slowest rising was multi-bands with SI1, both of which showed that increasing the specific salinity index can improve the model results in the early training stage. When the batches number reaches about 15,000, the multi-bands with SI2 combination reached a local maximum value, and when the training process reached about 20,000 batches, the multi-bands with SI2 and multi-bands with SI, SI1, and SI2 combinations showed a relatively large drop, and a local minimum value occurred, after which they continued to rise. The results of the multi-bands rose relatively smoothly as compared with the other groups. Figure 12b shows that the precision rose slowly, and the change was relatively stable. The multi-bands with SI2 combination achieved stabilized results at around 10,000 batches, and the multi-bands with SI1 combination dropped significantly around 20,000 batches, and then rose again. As shown in Figure 12c, the changing pattern of mIoU is similar to that of the recall, except that at around 20,000 batches, the multi-bands with SI1 combination also showed a sharp decrease and then an increase. For the change of loss, as shown in Figure 12d, it conforms to the law of gradient descent of general deep learning models, that is, it converges rapidly at the beginning, and then the convergence speed slows down. In this experiment, the curves of each experimental group had different degrees of jitter after 15,000 iterations. In comparison, the amplitude of the multi-bands group was the most severe, while the jitter of the muti-bands with SI2 was the most gentle. The amplitude of adding a salinity index was smaller than that of the multi-bands group. It can be seen in Figure 12d that adding a specific salinity index can stabilize the loss convergence process to some extent.
4. Discussion
4.1. Expertise and Labor Savings
The deep learning framework used in this study was U2-Net, which has many advantages. In the application of saline land identification, limited image data can be obtained at different scales, which saves a lot of labor costs and can achieve good results; this is beneficial. At the same time, since receptive fields of different sizes are mixed into the residual U-block (RSU) proposed by this method, more information on saline land and surrounding areas can be obtained at different scales, which may be beneficial to reduce the amount of land (such as cloud, light-colored buildings, etc.) that may be wrongly classified into saline land, and may be beneficial in obtaining a good classification effect of saline land. Furthermore, compared with the SOD (salient object detection) models built upon the existing backbones, the U2-Net framework is purely built on the proposed RSU blocks, which makes it possible to be trained from scratch and configured to have different model sizes according to the target environment constraints [34]. This means that training the model does not require high-level equipment, and good results can be obtained without pre-training.
4.2. The Effect of Salinity Index on Experimental Results
The influence of the salinity index on the segmentation results can be explained by the fact that the integration of the salinity index can be deemed as new image information. In the same case, adding the source of information increases the available predictor variables, which could benefit the prediction model. The addition of the salinity index can highlight the distribution information of the saline land from the background. To a certain extent, the addition of the salinity index is equivalent to a pre-processing of the image, so that the deep learning model can apply the learning focus more effectively to saline land applications, which would achieve the effect of improving some accuracy indicators.
The experimental results show that the application of different salinity indices had different effects on the results, which is consistent with the study conducted by Allbed et al. [14]. In their study, the authors noted that adding SI1 or SI2 to the model yielded higher accuracy (recall, precision, and F1-score) as compared with the results of multi-bands on their own, and adding SI1 to the model underperformed the SI2 model.
We can also see that a further increase in the salinity index did not improve the accuracy of the final saline land segmentation. The possible reason for this result is that the salinity index was calculated based on the seven multi-spectral bands. These indices inevitably display some information redundancy when compared with the original bands, leading to an overfitting of the training model. However, the U2-net model as a superior data mining approach has the power to max out the information from the original bands, therefore yielding similar results as compared with the salinity indices. Although the conclusions of this study are limited to the salinity indices and combinations involved in this study, more experiments are needed to verify whether other salinity indices and combinations conform to this law.
Finally, it should be noted that a plausible explanation for the difference in performance between the different experimental groups in this study is the use of different salinity indices, not simply because of the number of input image channels. Experimental groups with the same number of channels and different salinity indices exhibited different accuracies.
4.3. Distribution Changes of Saline Land in the Zhenlai Area
In the previous part, we used the newly proposed method to draw the distribution map of saline land in the Zhenlai area from 2016 to 2020. We found that the proportion of saline land area overall showed a downward trend. This section discusses this phenomenon.
As mentioned above, the natural characteristics of the Zhenlai area make it easy for saline land to form [35,36], and the over-exploitation of humans aggravates the occurrence of this phenomenon [37]. To reduce the impact of saline land on agricultural production, Zhenlai adopted various measures to achieve the goal of reducing the area of saline land, among which the most important method is to control saline land through paddy fields [58]. By building water conservancy facilities [59], using river water to change soil moisture infiltration, reducing soil salinity, and forming artificial wetlands suitable for rice cultivation, Zhenlai has achieved the goal of converting saline-alkali land into arable land. On the other hand, the main food crop was changed from corn to rice, and rice varieties that were suitable for local artificial wetland cultivation were developed [60], thereby further increasing food production. These measures make Zhenlai one of the important grain-producing areas in China.
Although Zhenlai has made great efforts and accomplished great achievements in the treatment of saline land, environmental treatment is not achieved overnight, and it is also common for repeated treatment to be required, where as shown in Figure 8, the proportion increased in 2020. Even so, the distribution of saline land in 2020 was more dispersed than in 2019. In future research, the method used in this paper can be used on larger spatial scales and longer time scales to obtain more obvious changes in the distribution of saline land.
5. Conclusions
This study used a U2-Net-based extraction method to analyze the distribution of saline soils, and various input different salinity indices and combinations were mixed into the model to explore their impact on the segmentation effect. The following results were drawn:
- (1)
- The U2-Net is an efficient model for saline soil extraction applications. Good results were achieved whether we used the input of mixed bands or the combined input network with different salinity indices.
- (2)
- Using the salinity index as an additional input to the multi-bands affected the image segmentation accuracy. Selecting different salinity indices yielded different effects on the results, and SI2 was proven to be the most useful salinity index for the saline soil extraction application.
- (3)
- The superposition of the salinity index does not necessarily yield better accuracy. Hypothetically, stacking more salinity indices allows for more information to be input for training, which theoretically would produce better results. However, the results from this study did not support this hypothesis. On the contrary, superimposing excessive salinity indices could reduce the accuracy of the classification.
- (4)
- The study also concluded the validity of our methodology for saline land identification through a case study. Specifically, the soil salinization in the Zhenlai area was alleviated over recent years. Our methodology will help to expand our understanding of saline land and the salinity index of deep learning frameworks.
The main application scenario of this method is the identification of large-scale saline land with public domain remote sensing images (e.g., Landsat images). In the future, the method can further improve the saline land extraction accuracy by transforming the neural network structure. In addition, the training of this method is based on the remote sensing data of the same resolution and the same source. Future studies can further explore whether the remote sensing data of different resolutions and different sources have an influence on the identification effect of saline land.
Author Contributions
Conceptualization, Y.H. and Q.G.; methodology, Q.G., Y.H. and Y.X.; software, Q.G.; validation, Q.G., Y.H. and H.G.; formal analysis, Q.G. and Y.H.; investigation, Q.G. and H.G; resources, Q.G., Y.H. and X.L.; data curation, Q.G. and H.G.; writing—original draft preparation, Q.G. and Y.H.; writing—review and editing, Y.H. and Y.X.; visualization, Y.H., Q.G. and Y.X.; funding acquisition, Y.H.; supervision, Y.H.; project administration, Y.H. All authors have read and agreed to the published version of the manuscript.
Funding
This work was supported by the Project of Jilin Province Science and Technology Development Plan (Grant No. 20210101101JC); the Foundation of the Education Department of Jilin Province (Grant No. JJKH20211288KJ); the National Key R&D Program of China (Grant No. 2018YFC1801203); and the National Natural Science Foundation of China (Grant No. 41301364).
Data Availability Statement
The data used to support the findings of this study are available from the corresponding author upon request.
Acknowledgments
All authors thank the anonymous reviewers for their helpful suggestions.
Conflicts of Interest
We assert that this work was not influenced by known competing financial interests or known personal relationships.
References
- Hassani, A.; Azapagic, A.; Shokri, N. Predicting long-term dynamics of soil salinity and sodicity on a global scale. Proc. Natl. Acad. Sci. USA 2020, 117, 33017–33027. [Google Scholar] [CrossRef] [PubMed]
- Hasanuzzaman, M.; Nahar, K.; Fujita, M. Plant response to salt stress and role of exogenous protectants to mitigate salt-induced damages. In Ecophysiology and Responses of Plants under Salt Stress; Springer: Berlin/Heidelberg, Germany, 2013; pp. 25–87. [Google Scholar]
- Song, K.-S.; Zhang, B.; Zhao, Y.-S. Polarized Reflectance Characteristics of Some Soils. Sci. Geogr. Sin. 2004, 24, 357–363. [Google Scholar]
- Hassani, A.; Azapagic, A.; D’Odorico, P.; Keshmiri, A.; Shokri, N. Desiccation crisis of saline lakes: A new decision-support framework for building resilience to climate change. Sci. Total Environ. 2020, 703, 134718. [Google Scholar] [CrossRef] [PubMed]
- Wong, V.N.; Greene, R.; Dalal, R.C.; Murphy, B.W. Soil carbon dynamics in saline and sodic soils: A review. Soil Use Manag. 2010, 26, 2–11. [Google Scholar] [CrossRef]
- De la Paix, M.; Lanhai, L.; Xi, C.; Varenyam, A.; Nyongesah, M.; Habiyaremye, G. Physicochemical properties of saline soils and aeolian dust. Land Degrad. Dev. 2013, 24, 539–547. [Google Scholar] [CrossRef]
- Singh, K. Microbial and enzyme activities of saline and sodic soils. Land Degrad. Dev. 2016, 27, 706–718. [Google Scholar] [CrossRef]
- Rath, K.M.; Rousk, J. Salt effects on the soil microbial decomposer community and their role in organic carbon cycling: A review. Soil Biol. Biochem. 2015, 81, 108–123. [Google Scholar] [CrossRef]
- Parihar, P.; Singh, S.; Singh, R.; Singh, V.P.; Prasad, S.M. Effect of salinity stress on plants and its tolerance strategies: A review. Environ. Sci. Pollut. Res. 2015, 22, 4056–4075. [Google Scholar] [CrossRef]
- Perri, S.; Suweis, S.; Holmes, A.; Marpu, P.R.; Entekhabi, D.; Molini, A. River basin salinization as a form of aridity. Proc. Natl. Acad. Sci. USA 2020, 117, 17635–17642. [Google Scholar] [CrossRef]
- Zhao, Y.; Wang, S.; Li, Y.; Liu, J.; Zhuo, Y.; Chen, H.; Wang, J.; Xu, L.; Sun, Z. Extensive reclamation of saline-sodic soils with flue gas desulfurization gypsum on the Songnen Plain, Northeast China. Geoderma 2018, 321, 52–60. [Google Scholar] [CrossRef]
- Ren, J.; Chen, Q.; Ma, D.; Xie, R.; Zhu, H.; Zang, S. Study on a fast EC measurement method of soda saline-alkali soil based on wavelet decomposition texture feature. Catena 2021, 203, 105272. [Google Scholar] [CrossRef]
- Liu, S.; Kang, Y. Changes of soil microbial characteristics in saline-sodic soils under drip irrigation. J. Soil Sci. Plant Nutr. 2014, 14, 139–150. [Google Scholar] [CrossRef]
- Allbed, A.; Kumar, L.; Aldakheel, Y.Y. Assessing soil salinity using soil salinity and vegetation indices derived from IKONOS high-spatial resolution imageries: Applications in a date palm dominated region. Geoderma 2014, 230, 1–8. [Google Scholar] [CrossRef]
- Khorram, S.; Koch, F.H.; van der Wiele, C.F.; Nelson, S.A. Remote Sensing; Springer Science & Business Media: Berlin, Germany, 2012. [Google Scholar]
- Metternicht, G.; Zinck, A. Remote Sensing of Soil Salinization: Impact on Land Management; CRC Press: Boca Raton, FL, USA, 2008. [Google Scholar]
- Zhang, T.-T.; Zeng, S.-L.; Gao, Y.; Ouyang, Z.-T.; Li, B.; Fang, C.-M.; Zhao, B. Using hyperspectral vegetation indices as a proxy to monitor soil salinity. Ecol. Indic. 2011, 11, 1552–1562. [Google Scholar] [CrossRef]
- Xu, Y.; Shrestha, V.; Piasecki, C.; Wolfe, B.; Hamilton, L.; Millwood, R.J.; Mazarei, M.; Stewart, C.N. Sustainability Trait Modeling of Field-Grown Switchgrass (Panicum virgatum) Using UAV-Based Imagery. Plants 2021, 10, 2726. [Google Scholar] [CrossRef]
- Kumar, L.; Schmidt, K.; Dury, S.; Skidmore, A. Imaging spectrometry and vegetation science. In Imaging Spectrometry; Springer: Berlin/Heidelberg, Germany, 2002; pp. 111–155. [Google Scholar]
- Elmetwalli, A.M.H.; Tyler, A.N.; Hunter, P.D.; Salt, C.A. Detecting and distinguishing moisture-and salinity-induced stress in wheat and maize through in situ spectroradiometry measurements. Remote Sens. Lett. 2012, 3, 363–372. [Google Scholar] [CrossRef]
- Waldner, F.; Diakogiannis, F.I. Deep learning on edge: Extracting field boundaries from satellite images with a convolutional neural network. Remote Sens. Environ. 2020, 245, 111741. [Google Scholar] [CrossRef]
- Hu, Q.; Woldt, W.; Neale, C.; Zhou, Y.; Drahota, J.; Varner, D.; Bishop, A.; LaGrange, T.; Zhang, L.; Tang, Z. Utilizing unsupervised learning, multi-view imaging, and CNN-based attention facilitates cost-effective wetland mapping. Remote Sens. Environ. 2021, 267, 112757. [Google Scholar] [CrossRef]
- Kattenborn, T.; Eichel, J.; Fassnacht, F.E. Convolutional Neural Networks enable efficient, accurate and fine-grained segmentation of plant species and communities from high-resolution UAV imagery. Sci. Rep. 2019, 9, 17656. [Google Scholar] [CrossRef]
- Bengio, Y.; Courville, A.; Vincent, P. Representation learning: A review and new perspectives. IEEE Trans. Pattern Anal. Mach. Intell. 2013, 35, 1798–1828. [Google Scholar] [CrossRef]
- LeCun, Y.; Bengio, Y.; Hinton, G. Deep learning. Nature 2015, 521, 436–444. [Google Scholar] [CrossRef] [PubMed]
- Huang, C.; Peng, Y.; Lang, M.; Yeo, I.-Y.; McCarty, G. Wetland inundation mapping and change monitoring using Landsat and airborne LiDAR data. Remote Sens. Environ. 2014, 141, 231–242. [Google Scholar] [CrossRef]
- Góraj, M.; Wróblewski, C.; Ciężkowski, W.; Jóźwiak, J.; Chormański, J. Free water table area monitoring on wetlands using satellite and UAV orthophotomaps-Kampinos National Park case study. Meteorol. Hydrol. Water Manag. Res. Oper. Appl. 2019, 7, 23–30. [Google Scholar] [CrossRef]
- Garajeh, M.K.; Malakyar, F.; Weng, Q.; Feizizadeh, B.; Blaschke, T.; Lakes, T. An automated deep learning convolutional neural network algorithm applied for soil salinity distribution mapping in Lake Urmia, Iran. Sci. Total Environ. 2021, 778, 146253. [Google Scholar] [CrossRef] [PubMed]
- Zeng, W.; Zhang, D.; Fang, Y.; Wu, J.; Huang, J. Comparison of partial least square regression, support vector machine, and deep-learning techniques for estimating soil salinity from hyperspectral data. J. Appl. Remote Sens. 2018, 12, 022204. [Google Scholar] [CrossRef]
- Sahour, H.; Gholami, V.; Vazifedan, M. A comparative analysis of statistical and machine learning techniques for mapping the spatial distribution of groundwater salinity in a coastal aquifer. J. Hydrol. 2020, 591, 125321. [Google Scholar] [CrossRef]
- Minaee, S.; Boykov, Y.Y.; Porikli, F.; Plaza, A.J.; Kehtarnavaz, N.; Terzopoulos, D. Image segmentation using deep learning: A survey. IEEE Trans. Pattern Anal. Mach. Intell. 2021, 44, 3523–3542. [Google Scholar] [CrossRef]
- Ronneberger, O.; Fischer, P.; Brox, T. U-net: Convolutional networks for biomedical image segmentation. In Proceedings of the International Conference on Medical image computing and computer-assisted intervention, Munich, Germany, 5–9 October 2015; pp. 234–241. [Google Scholar]
- Niu, Z.; Zhong, G.; Yu, H. A review on the attention mechanism of deep learning. Neurocomputing 2021, 452, 48–62. [Google Scholar] [CrossRef]
- Qin, X.; Zhang, Z.; Huang, C.; Dehghan, M.; Zaiane, O.R.; Jagersand, M. U2-Net: Going deeper with nested U-structure for salient object detection. Pattern Recognit. 2020, 106, 107404. [Google Scholar] [CrossRef]
- Wang, Z.; Song, K.; Zhang, B.; Liu, D.; Ren, C.; Luo, L.; Yang, T.; Huang, N.; Hu, L.; Yang, H. Shrinkage and fragmentation of grasslands in the West Songnen Plain, China. Agric. Ecosyst. Environ. 2009, 129, 315–324. [Google Scholar] [CrossRef]
- He, J.; Gao, C.; Lin, Q.; Zhang, S.; Zhao, W.; Lu, X.; Wang, G. Temporal and spatial changes in black carbon sedimentary processes in wetlands of Songnen Plain, Northeast of China. PLoS ONE 2015, 10, e0140834. [Google Scholar]
- Ren, J.; Li, X.; Zhao, K. Quantitative analysis of relationships between crack characteristics and properties of soda-saline soils in Songnen Plain, China. Chin. Geogr. Sci. 2015, 25, 591–601. [Google Scholar] [CrossRef]
- Liu, Q.; Cui, B.; Yang, Z. Dynamics of the soil water and solute in the sodic saline soil in the Songnen Plain, China. Environ. Earth Sci. 2009, 59, 837–845. [Google Scholar] [CrossRef]
- Yang, X.; Yu, Y. Estimating soil salinity under various moisture conditions: An experimental study. IEEE Trans. Geosci. Remote Sens. 2017, 55, 2525–2533. [Google Scholar] [CrossRef]
- Gao, J.; Liu, Y. Determination of land degradation causes in Tongyu County, Northeast China via land cover change detection. Int. J. Appl. Earth Obs. Geoinf. 2010, 12, 9–16. [Google Scholar] [CrossRef]
- Chinese Academy of Sciences. Geospatial Data Cloud. Available online: http://www.gscloud.cn (accessed on 28 July 2022).
- Allbed, A.; Kumar, L. Soil salinity mapping and monitoring in arid and semi-arid regions using remote sensing technology: A review. Adv. Remote Sens. 2013, 2013. [Google Scholar] [CrossRef]
- Daliakopoulos, I.; Tsanis, I.; Koutroulis, A.; Kourgialas, N.; Varouchakis, A.; Karatzas, G.; Ritsema, C. The threat of soil salinity: A European scale review. Sci. Total Environ. 2016, 573, 727–739. [Google Scholar] [CrossRef]
- Tripathi, N.; Rai, B.K.; Dwivedi, P. Spatial modeling of soil alkalinity in GIS environment using IRS data. In Proceedings of the 18th Asian conference on remote sensing, Kualalampur, Malaysia, 20–25 October 1997; pp. 81–86. [Google Scholar]
- Khan, N.M.; Rastoskuev, V.V.; Sato, Y.; Shiozawa, S. Assessment of hydrosaline land degradation by using a simple approach of remote sensing indicators. Agric. Water Manag. 2005, 77, 96–109. [Google Scholar] [CrossRef]
- Douaoui, A.E.K.; Nicolas, H.; Walter, C. Detecting salinity hazards within a semiarid context by means of combining soil and remote-sensing data. Geoderma 2006, 134, 217–230. [Google Scholar] [CrossRef]
- Khan, S.; Abbas, A. Using remote sensing techniques for appraisal of irrigated soil salinity. In International Congress on Modelling and Simulation (MODSIM 2007); Modelling and Simulation Society of Australia and New Zealand: Christchurch, New Zealand, 2007; pp. 2632–2638. [Google Scholar]
- Yishan, S. Remote Sensing Retrieval of Electrical Conductivity of Saline Soil in West Jilin Province and Research on Temporal Variation in Thirty Years; University of Chinese Academy of Sciences (Northeast Institute of Geography and Agroecology): Changchun, China, 2020. [Google Scholar]
- Lhissou, R.; El Harti, A.; Maimouni, S.; Adiri, Z. Assessment of the image-based atmospheric correction of multispectral satellite images for geological mapping in arid and semi-arid regions. Remote Sens. Appl. Soc. Environ. 2020, 20, 100420. [Google Scholar]
- Papandreou, G.; Kokkinos, I.; Savalle, P.-A. Modeling local and global deformations in deep learning: Epitomic convolution, multiple instance learning, and sliding window detection. In Proceedings of the IEEE conference on computer vision and pattern recognition, Boston, MA, USA, 7–12 June 2015; pp. 390–399. [Google Scholar]
- Ye, Z.; Wei, J.; Lin, Y.; Guo, Q.; Zhang, J.; Zhang, H.; Deng, H.; Yang, K. Extraction of Olive Crown Based on UAV Visible Images and the U2-Net Deep Learning Model. Remote Sens. 2022, 14, 1523. [Google Scholar] [CrossRef]
- Wei, X.; Li, X.; Liu, W.; Zhang, L.; Cheng, D.; Ji, H.; Zhang, W.; Yuan, K. Building outline extraction directly using the u2-net semantic segmentation model from high-resolution aerial images and a comparison study. Remote Sens. 2021, 13, 3187. [Google Scholar] [CrossRef]
- Zhou, D.; Wang, G.; He, G.; Yin, R.; Long, T.; Zhang, Z.; Chen, S.; Luo, B. A Large-Scale Mapping Scheme for Urban Building From Gaofen-2 Images Using Deep Learning and Hierarchical Approach. IEEE J. Sel. Top. Appl. Earth Obs. Remote Sens. 2021, 14, 11530–11545. [Google Scholar] [CrossRef]
- Cheng, R.; Crouzier, M.; Hug, F.; Tucker, K.; Juneau, P.; McCreedy, E.; Gandler, W.; McAuliffe, M.J.; Sheehan, F.T. Automatic quadriceps and patellae segmentation of MRI with cascaded U2-Net and SASSNet deep learning model. Med. Phys. 2022, 49, 443–460. [Google Scholar] [CrossRef]
- Liu, T.; Lu, Y.; Zhang, Y.; Hu, J.; Gao, C. A bone segmentation method based on Multi-scale features fuse U2Net and improved dice loss in CT image process. Biomed. Signal Processing Control 2022, 77, 103813. [Google Scholar] [CrossRef]
- Pleșoianu, A.-I.; Stupariu, M.-S.; Șandric, I.; Pătru-Stupariu, I.; Drăguț, L. Individual Tree-Crown Detection and Species Classification in Very High-Resolution Remote Sensing Imagery Using a Deep Learning Ensemble Model. Remote Sens. 2020, 12, 2426. [Google Scholar] [CrossRef]
- Wu, D.; Johansen, K.; Phinn, S.; Robson, A.; Tu, Y.-H. Inter-comparison of remote sensing platforms for height estimation of mango and avocado tree crowns. Int. J. Appl. Earth Obs. Geoinf. 2020, 89, 102091. [Google Scholar] [CrossRef]
- Wang, J.; Yang, Y. Ecological effects and pattern optimization of the development and utilization of saline-alkali land in western Jilin Province: Taking Zhenlai County, Baicheng City, Jilin Province as an example. Resour. Dev. Mark. 2021, 37, 532–538. [Google Scholar]
- Ji, M.; Sun, H. The change of marsh landscape pattern in Zhenlai county during 1980 to 2018 and the effects due to human disturbance. J. ZheJiang Univ. 2021, 48, 760–770. [Google Scholar]
- Wang, N.; Zang, J.; Guo, X.; Wang, H.; Huang, N.; Zhao, C.; Zhao, X.; Liu, J. Role of rice cultivation on fluorine distribution behavior in soda saline-alkali land. Sci. Total Environ. 2022, 835, 155543. [Google Scholar] [CrossRef]
Figure 1.
A schematic diagram of the location of the Zhenlai county, including the location of Zhenlai county in the Songnen Plain (b) and the location of the Songnen Plain in China (a). (c) is the remote sensing image map of the Zhenlai county. The sensor used is OLI from the Landsat-8 platform, which includes three bands: R (red), G (green), and B (blue). The corresponding relationship between these three bands and the OLI band is R (Band4), G (Band3), and B (Band2). The green areas in (b) are the sampling locations for EC.

Figure 2.
The effects of different salinity indices. Different salinity indices yielded different effects in the study area, and different effects produced different images for the model training.
Figure 2.
The effects of different salinity indices. Different salinity indices yielded different effects in the study area, and different effects produced different images for the model training.
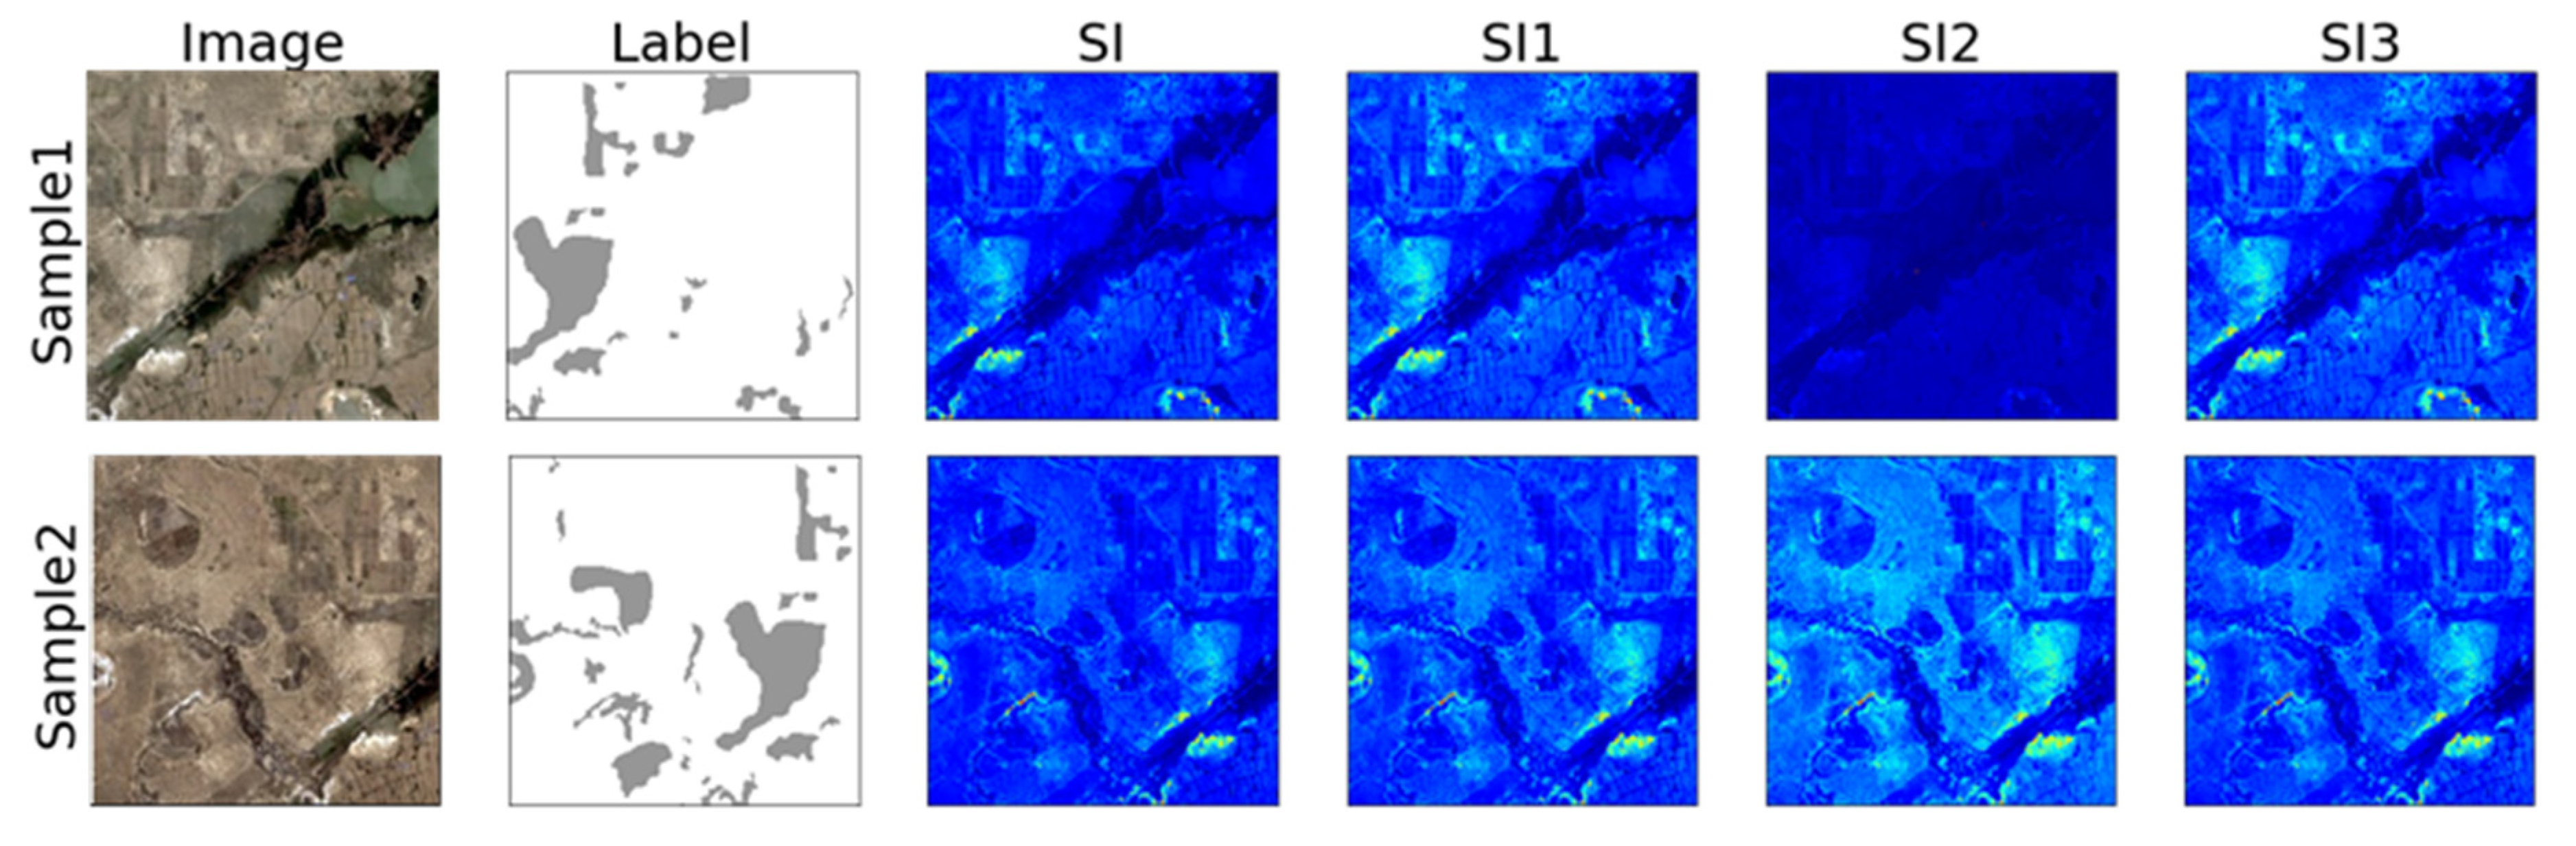
Figure 3.
The dataset label plot. The black part represents non-saline land, and the white part represents saline land.
Figure 3.
The dataset label plot. The black part represents non-saline land, and the white part represents saline land.
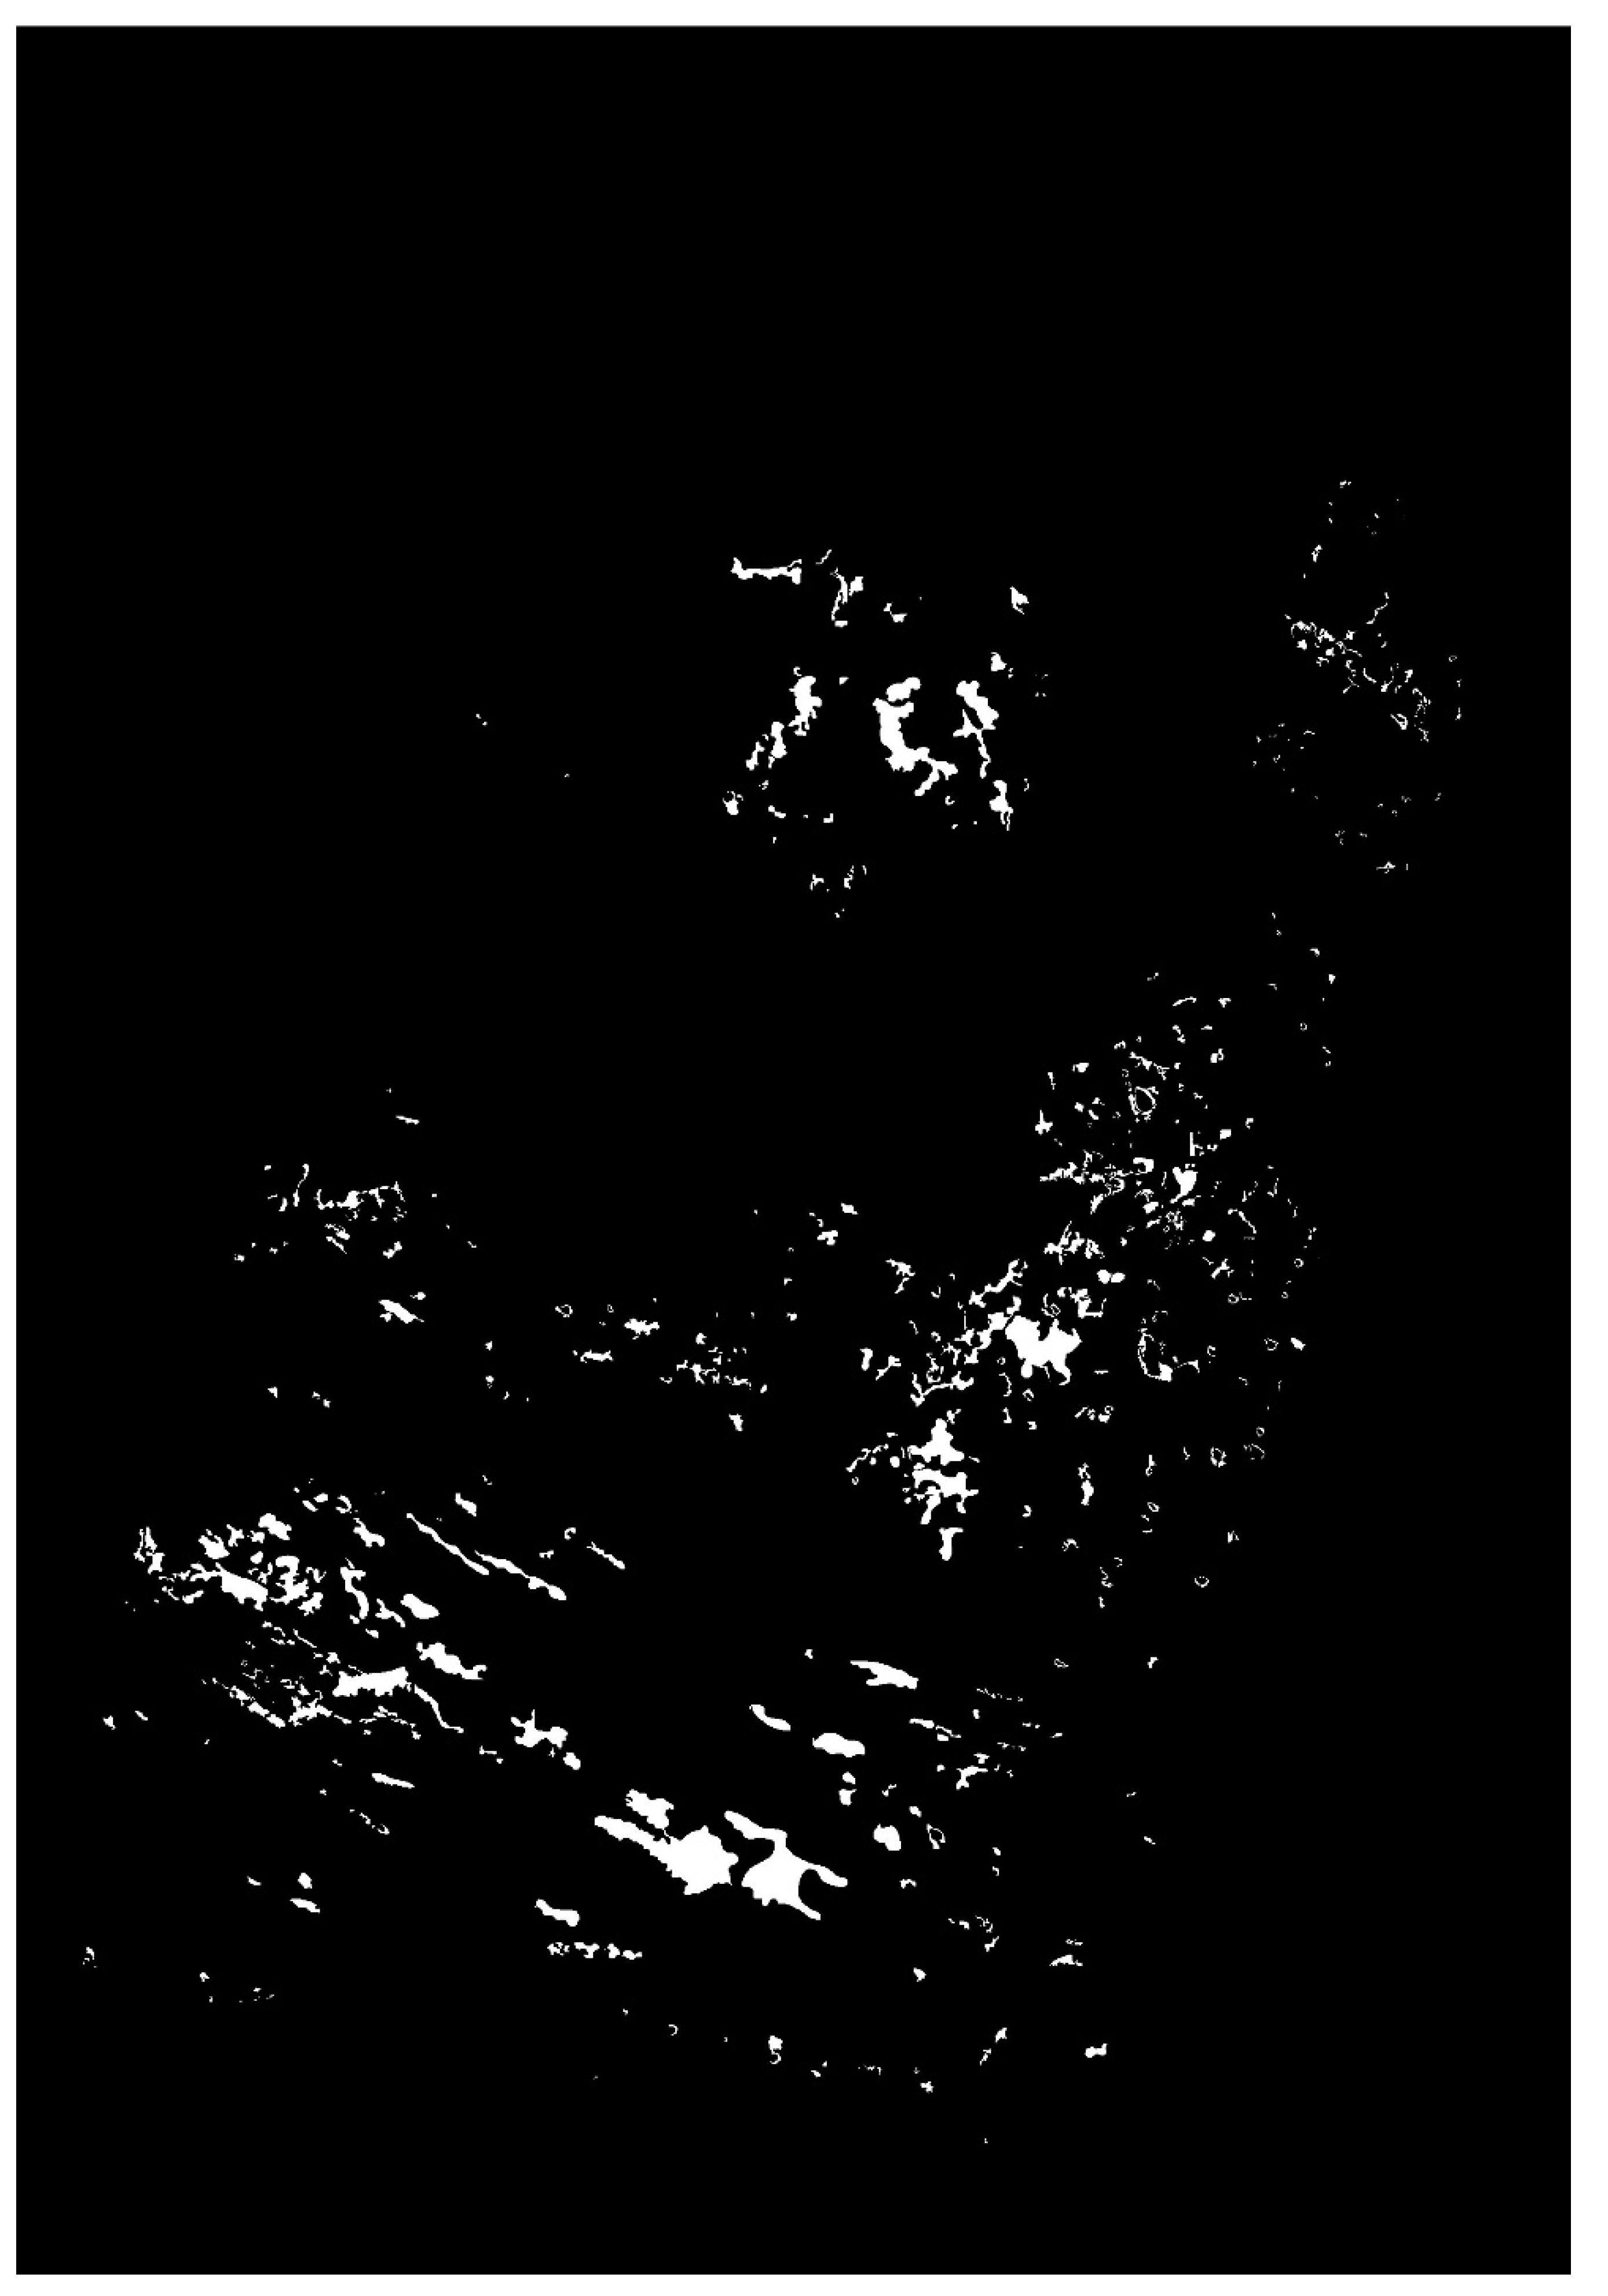
Figure 4.
The experimental flow chart for the experimental data (dashed box) and overall pipeline involved in the current research.
Figure 4.
The experimental flow chart for the experimental data (dashed box) and overall pipeline involved in the current research.
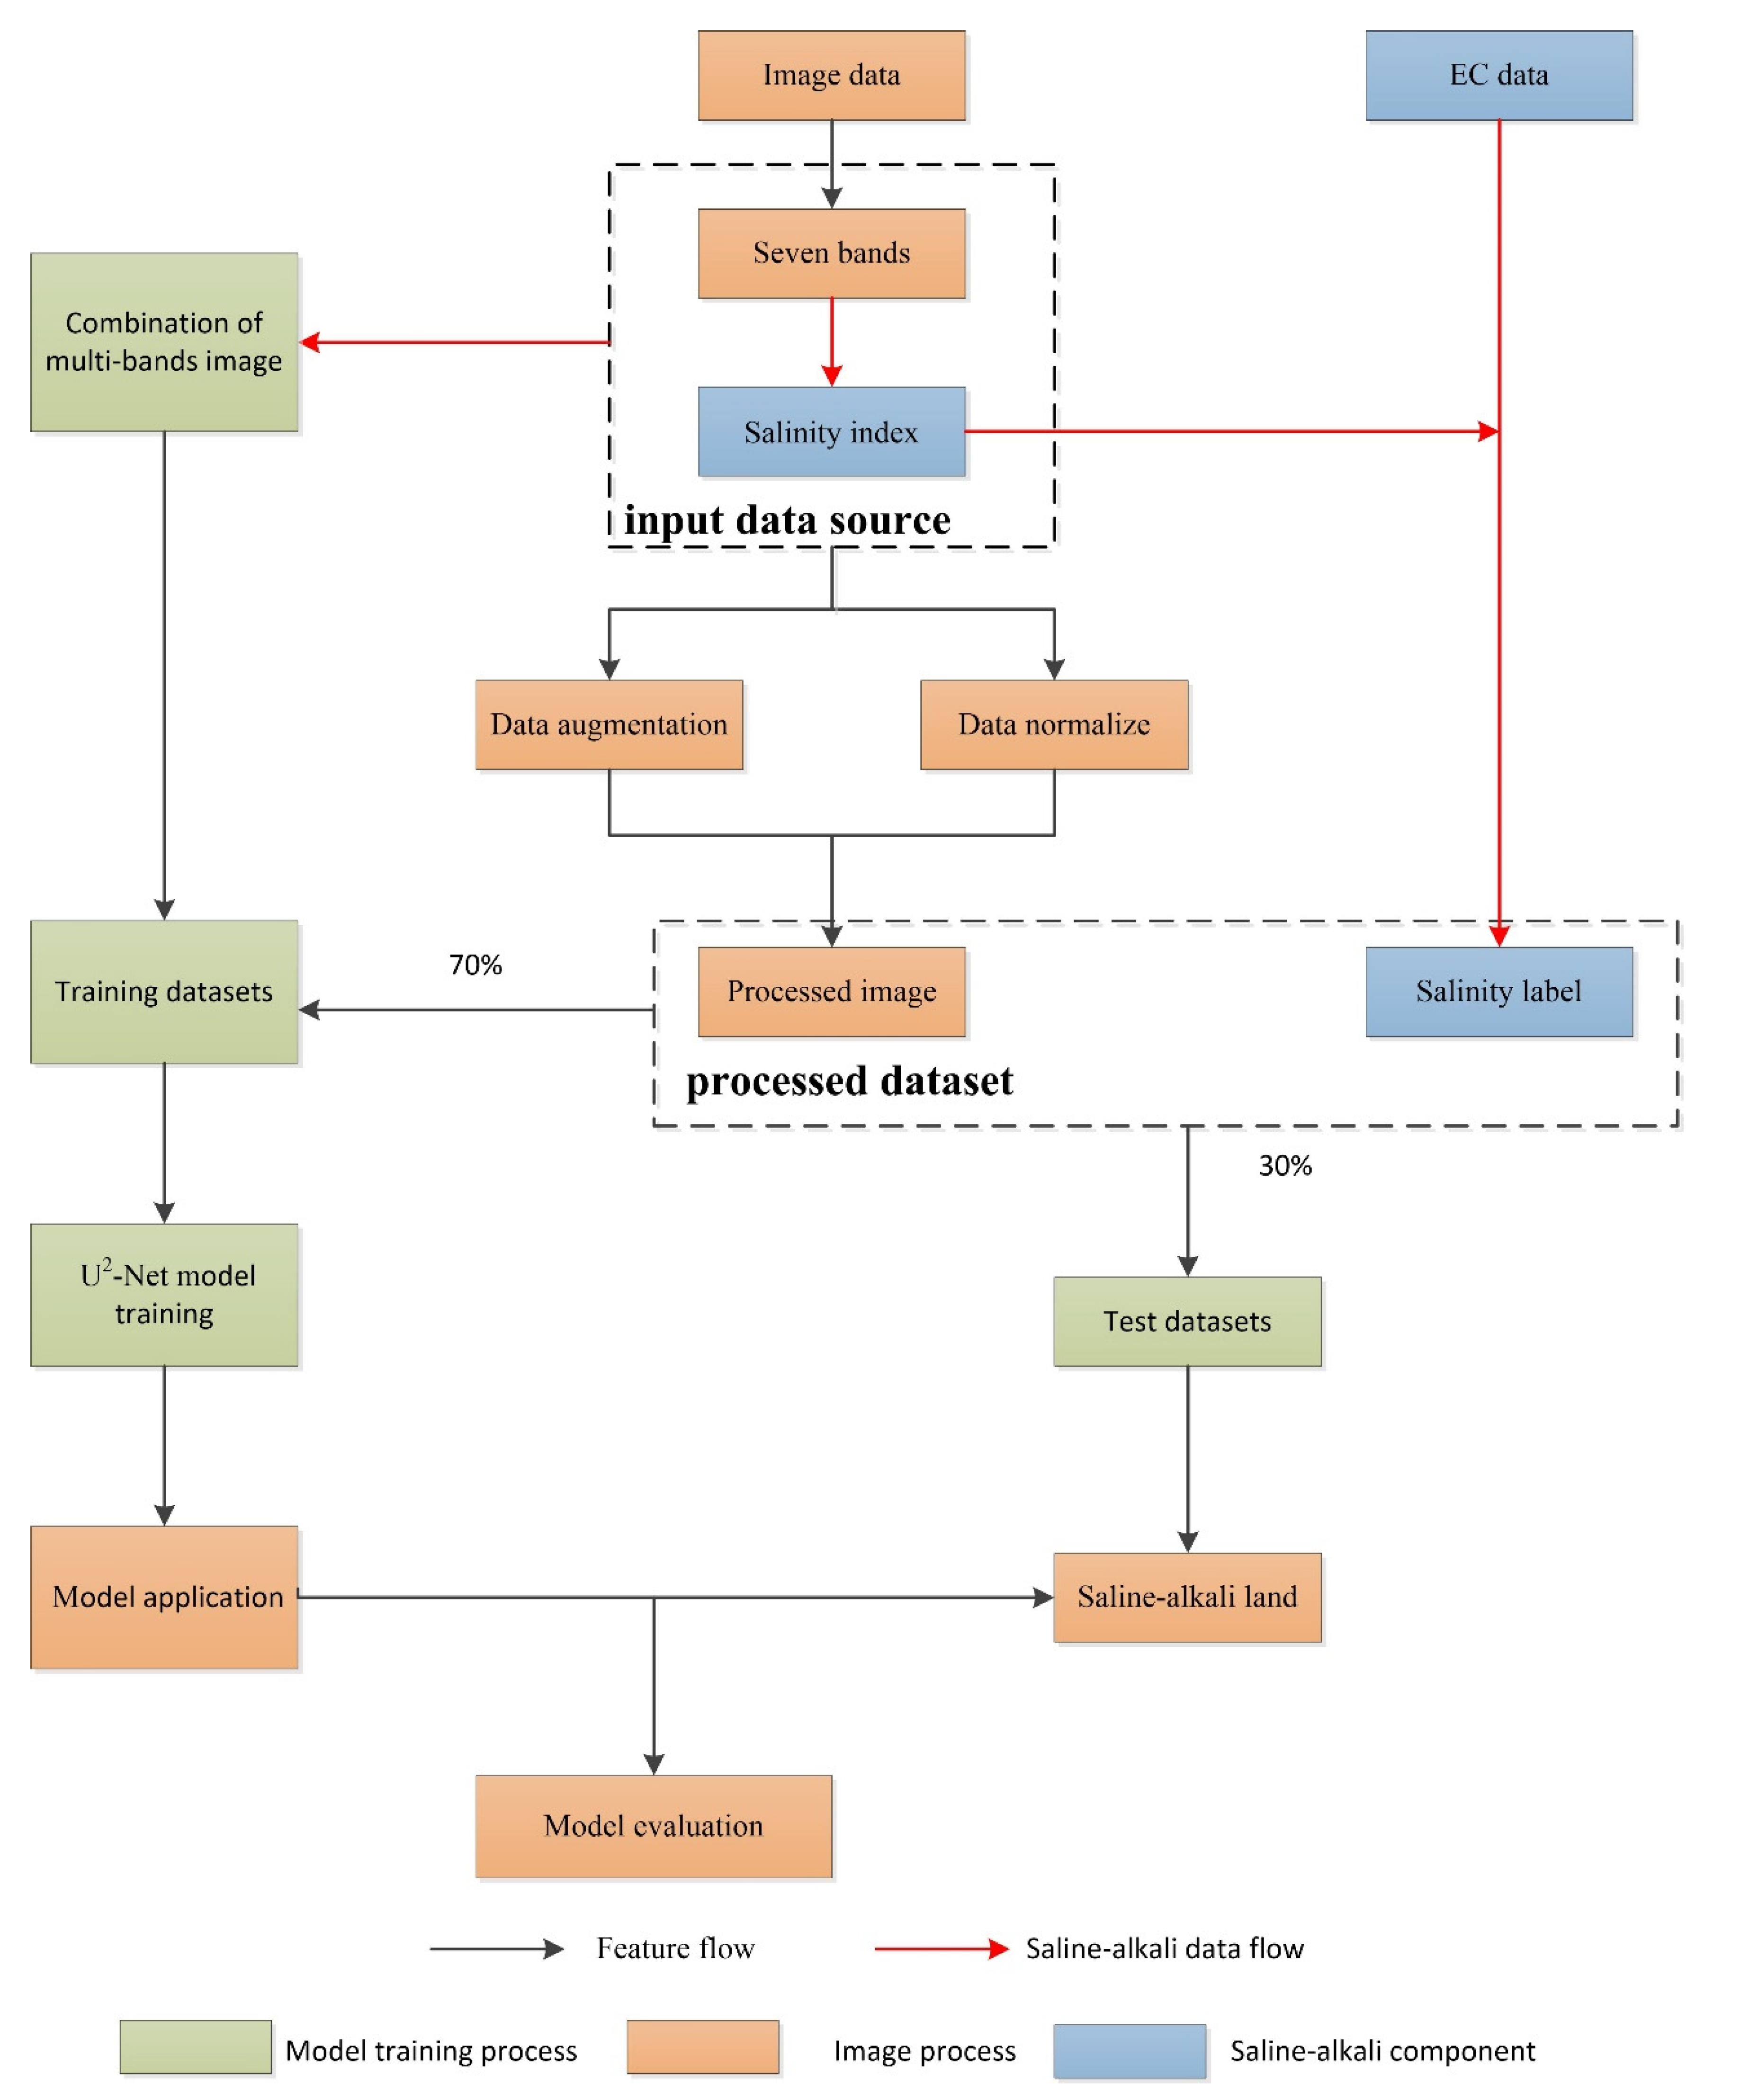
Figure 5.
The Structure of the U2-Net model. The connection between the input and the output (soil salinity extraction map) are RSUs designed in 5 stages. The F at the end of the procedure name (such as RSU-4F) means that the procedure does not involve upsampling and downsampling.
Figure 5.
The Structure of the U2-Net model. The connection between the input and the output (soil salinity extraction map) are RSUs designed in 5 stages. The F at the end of the procedure name (such as RSU-4F) means that the procedure does not involve upsampling and downsampling.
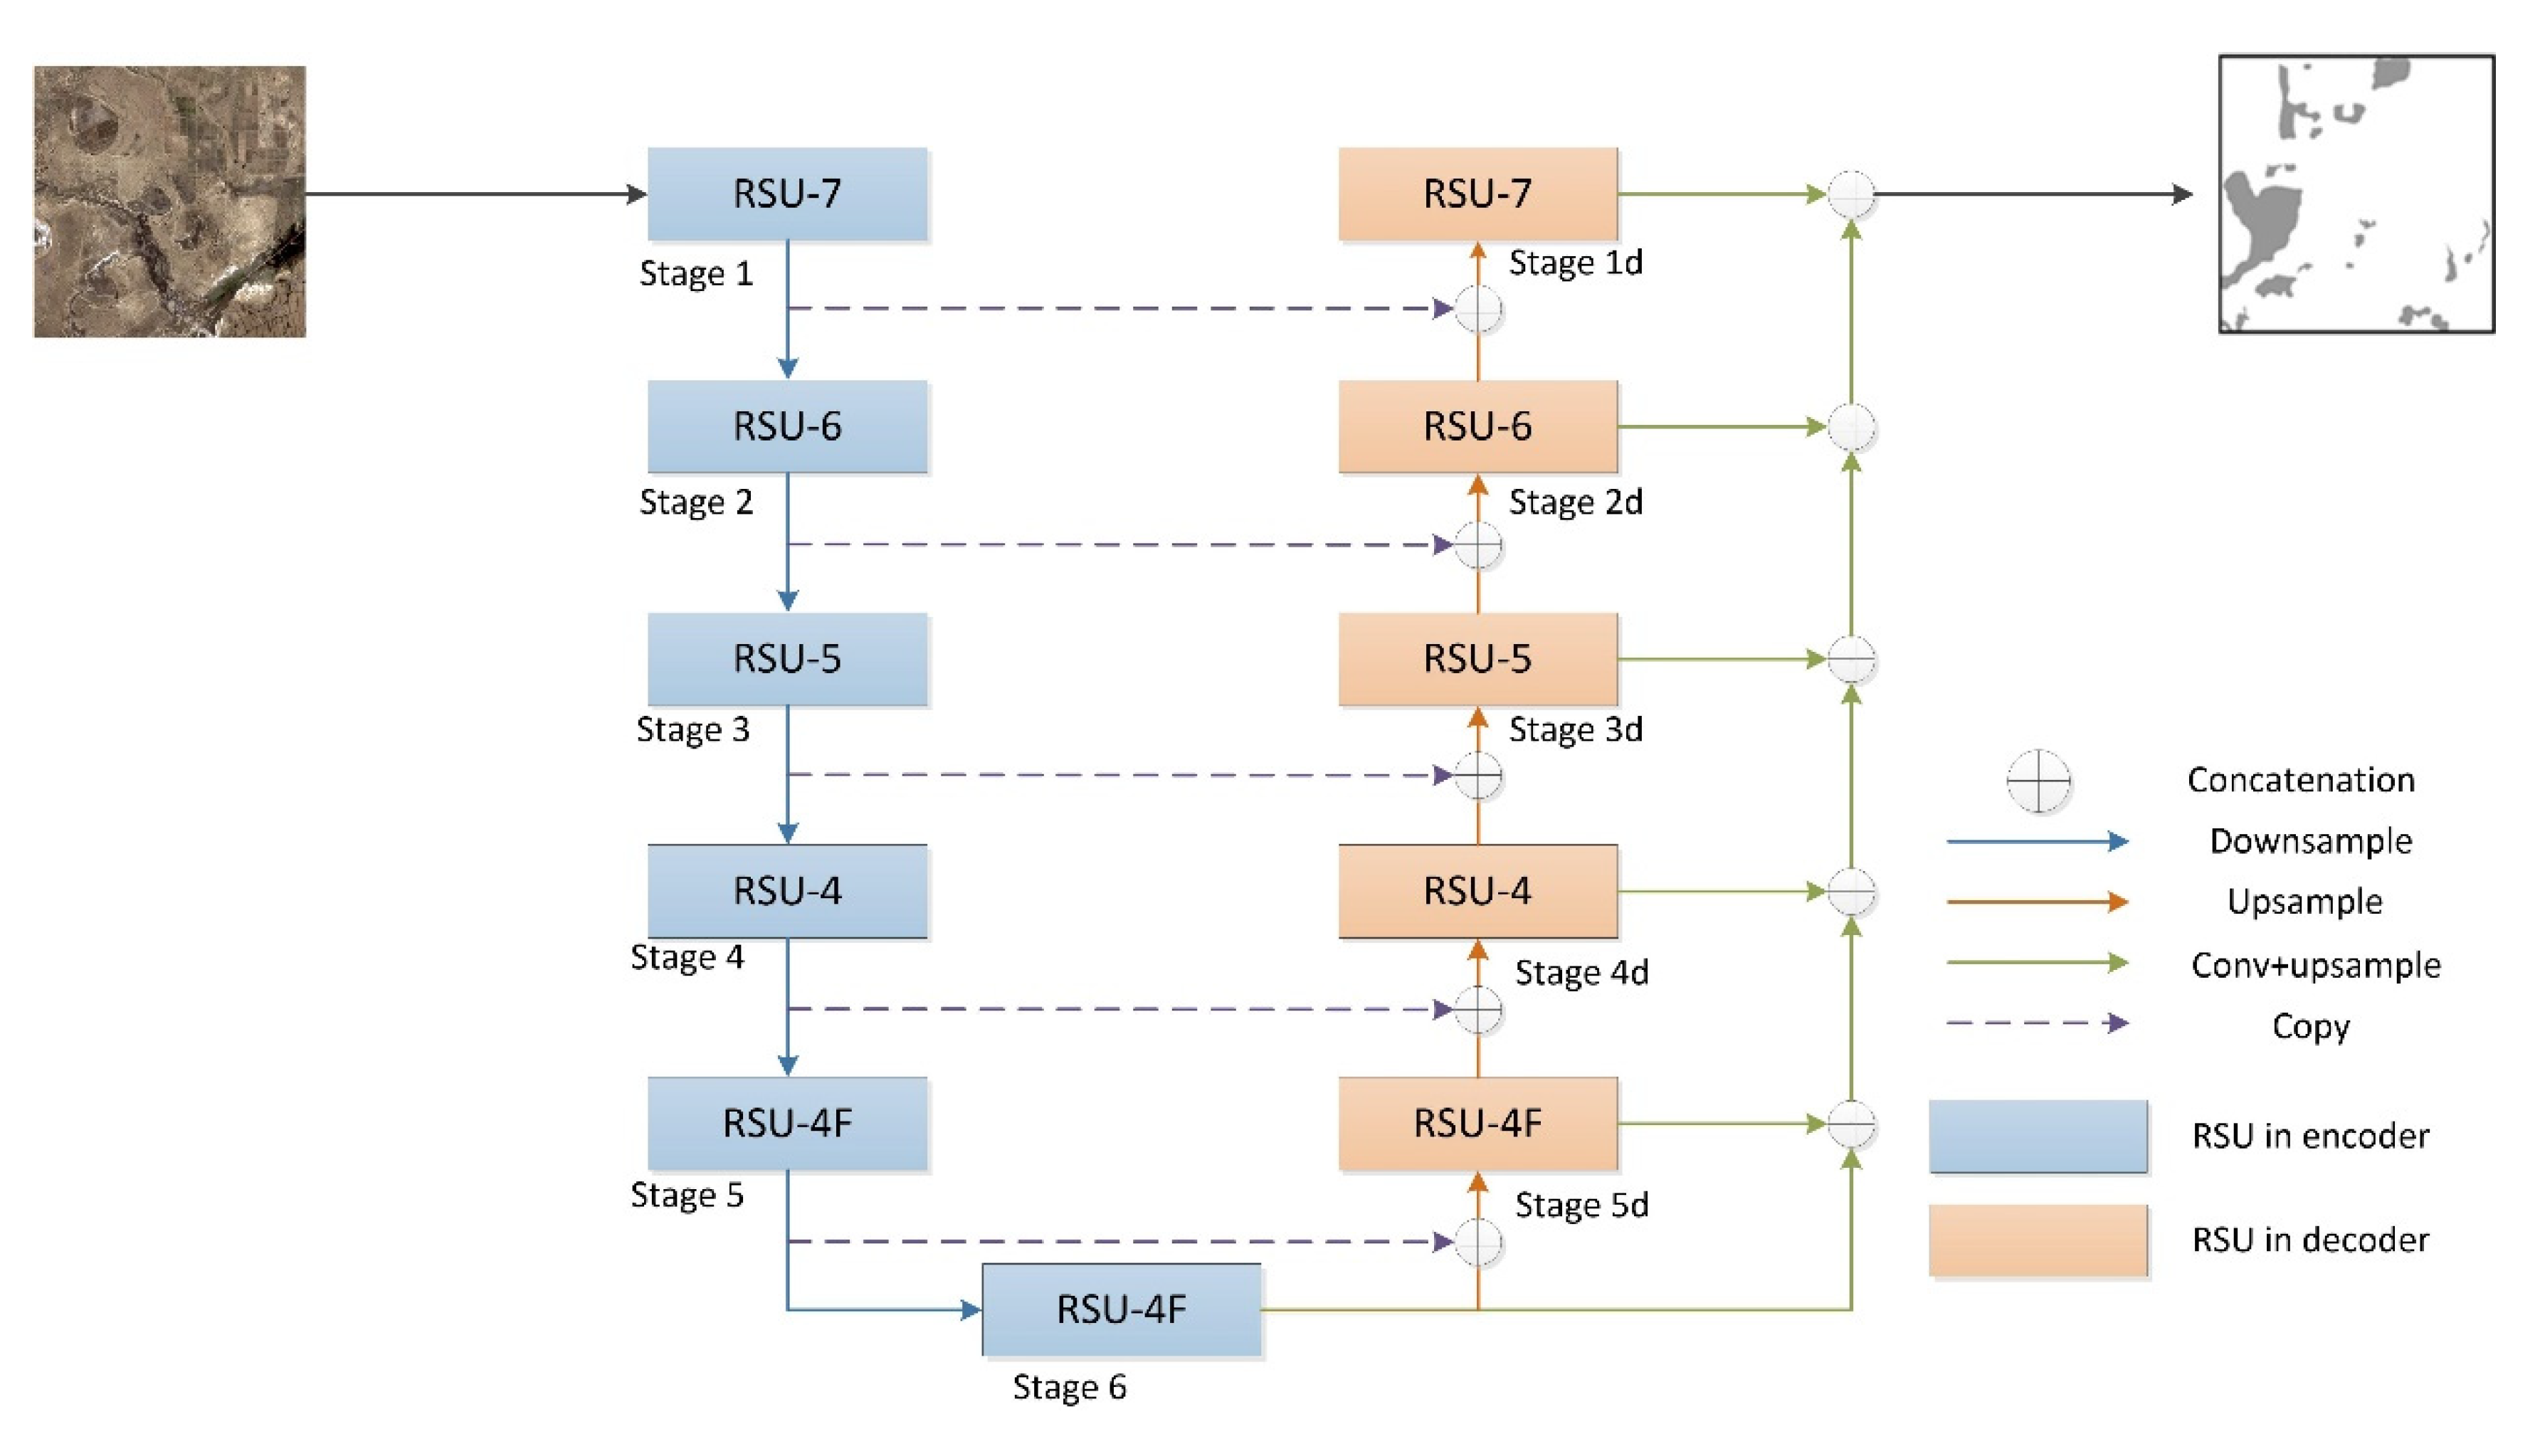
Figure 6.
The Structure of the RSU and the residual connection in the RSU. (a) The Structure of the RSU. (b) Residual connection in the RSU. L is the number of layers in the encoder, Cin and Cout denote the input and output channels, respectively, M denotes the number of channels in the internal layers, H denotes the height of the image, and W denotes the width of the image for the RSU.
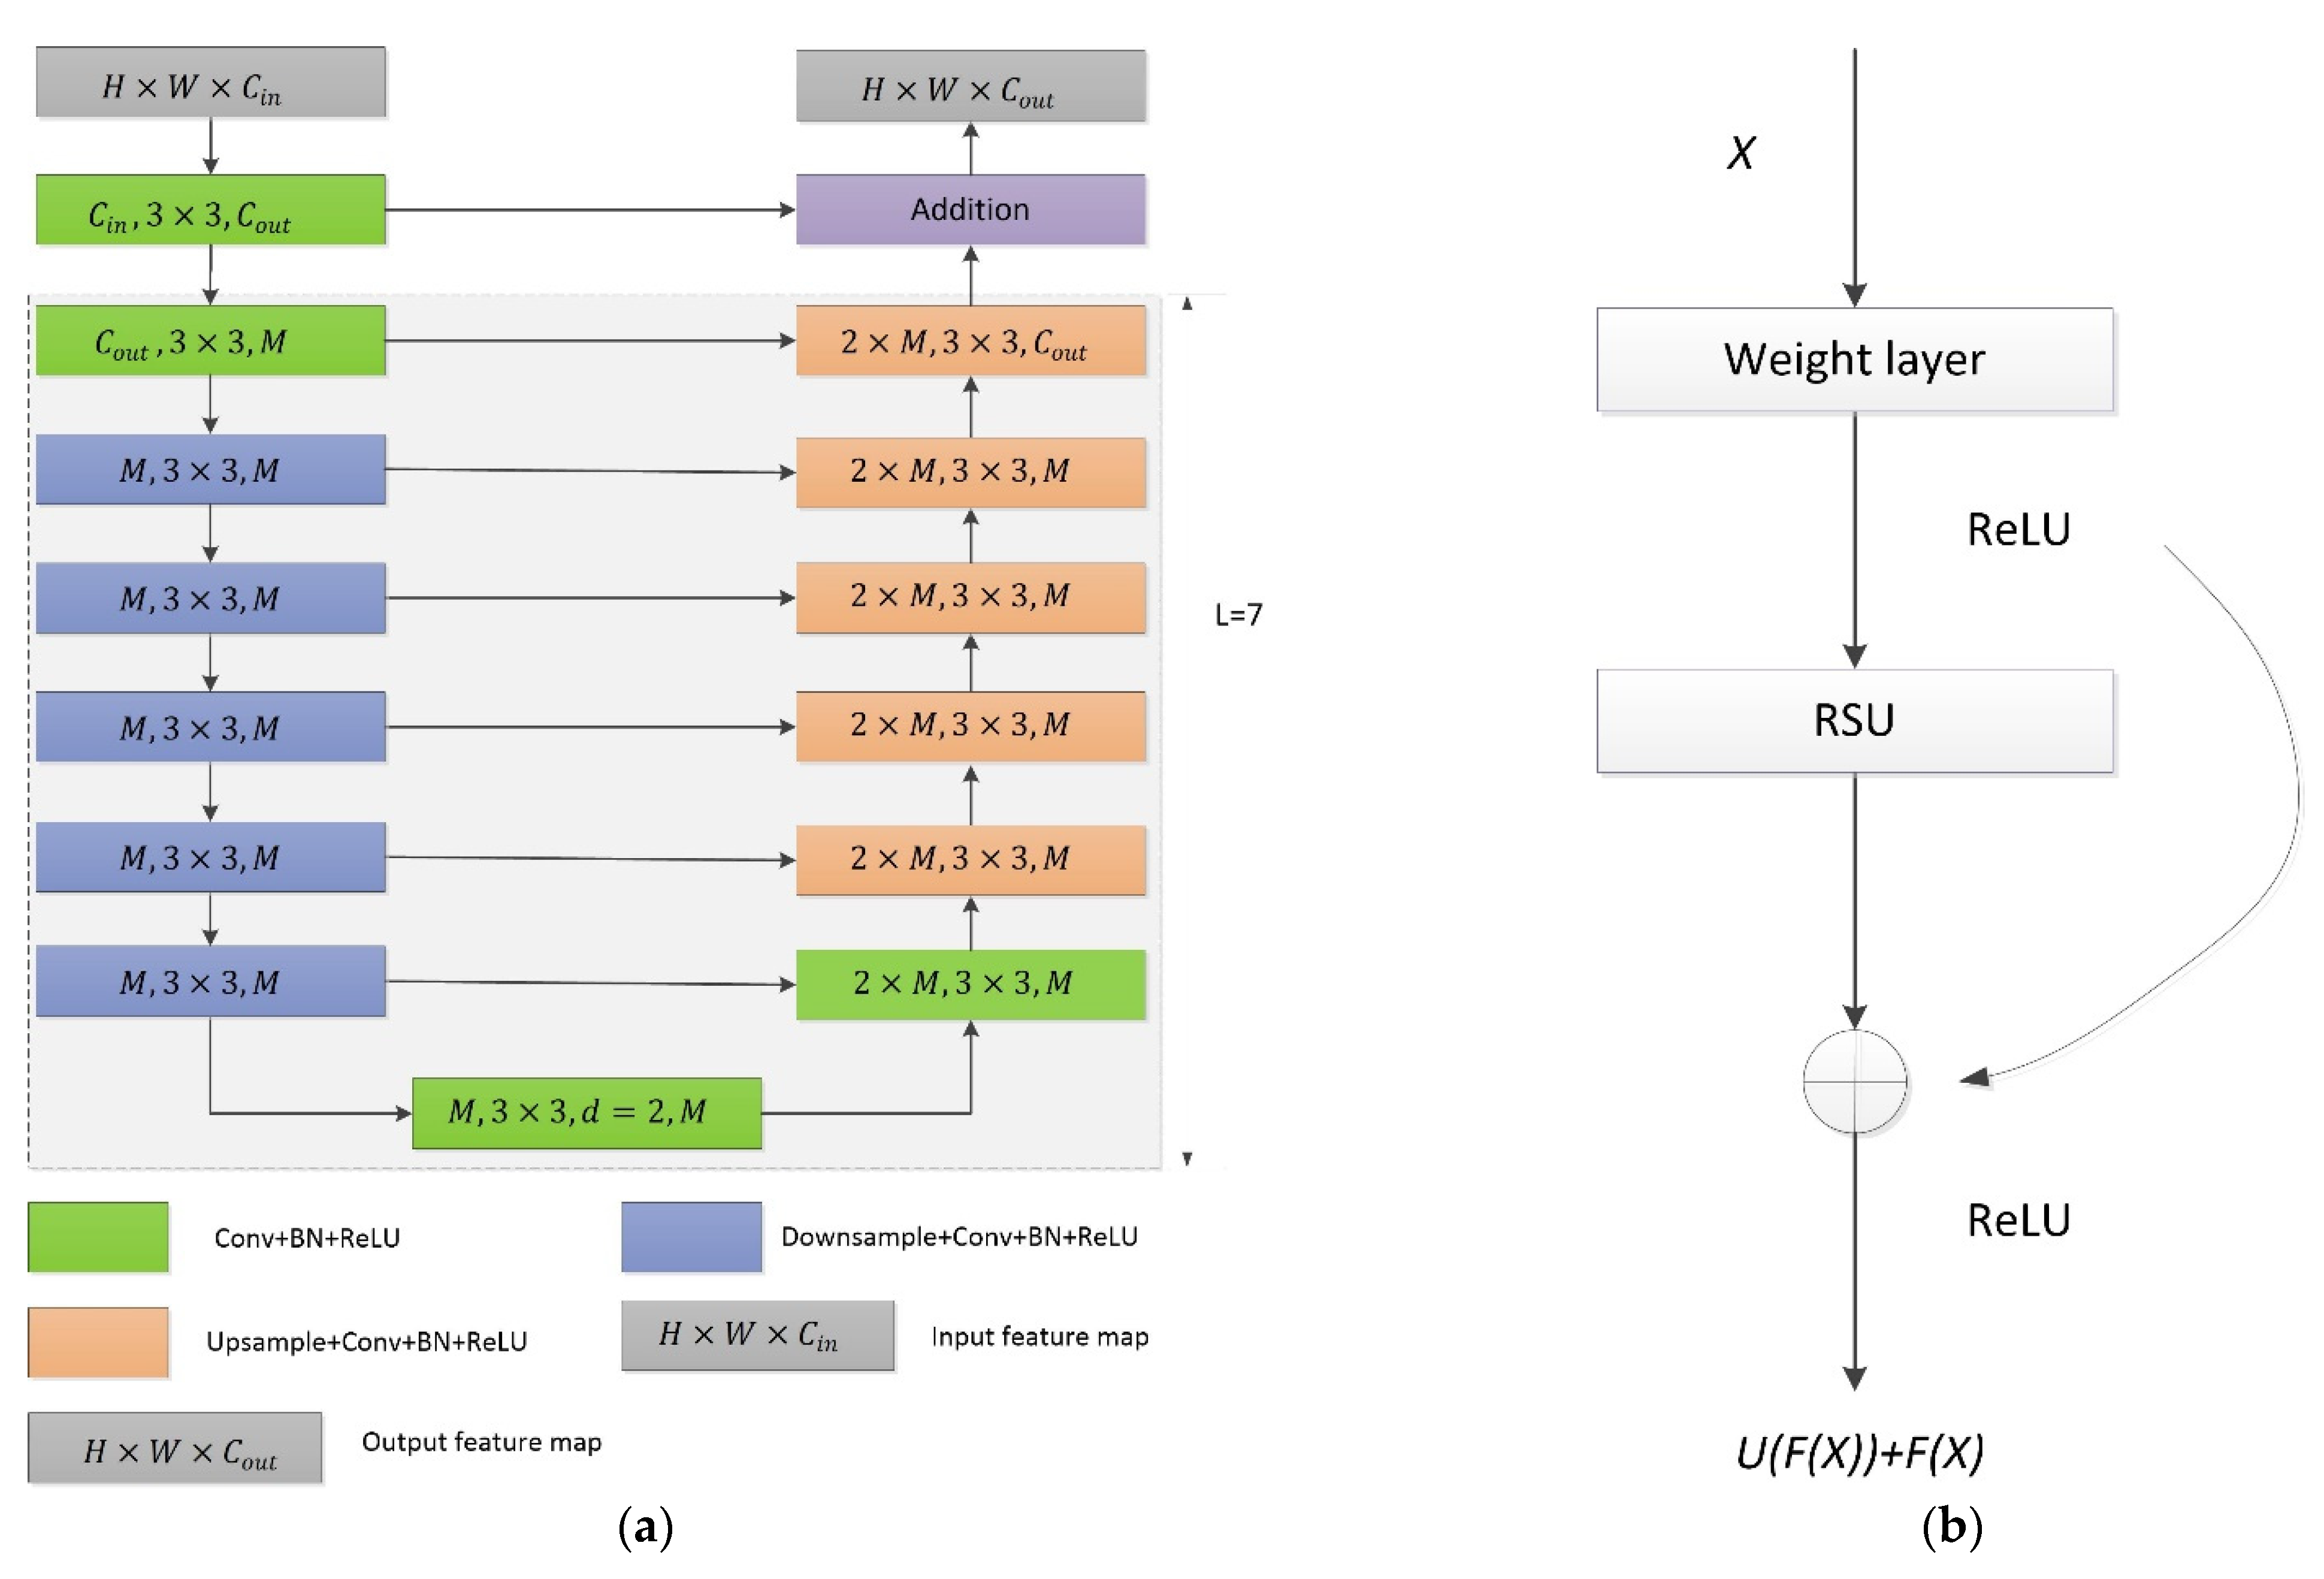
Figure 7.
These maps show the distribution of saline soil in the Zhenlai area during a five-year span between 2016 and 2020. The white color represents the saline soil area and the black color represents the non-saline soil area. (a) 2016; (b) 2017; (c) 2018; (d) 2019; (e) 2020.
Figure 7.
These maps show the distribution of saline soil in the Zhenlai area during a five-year span between 2016 and 2020. The white color represents the saline soil area and the black color represents the non-saline soil area. (a) 2016; (b) 2017; (c) 2018; (d) 2019; (e) 2020.
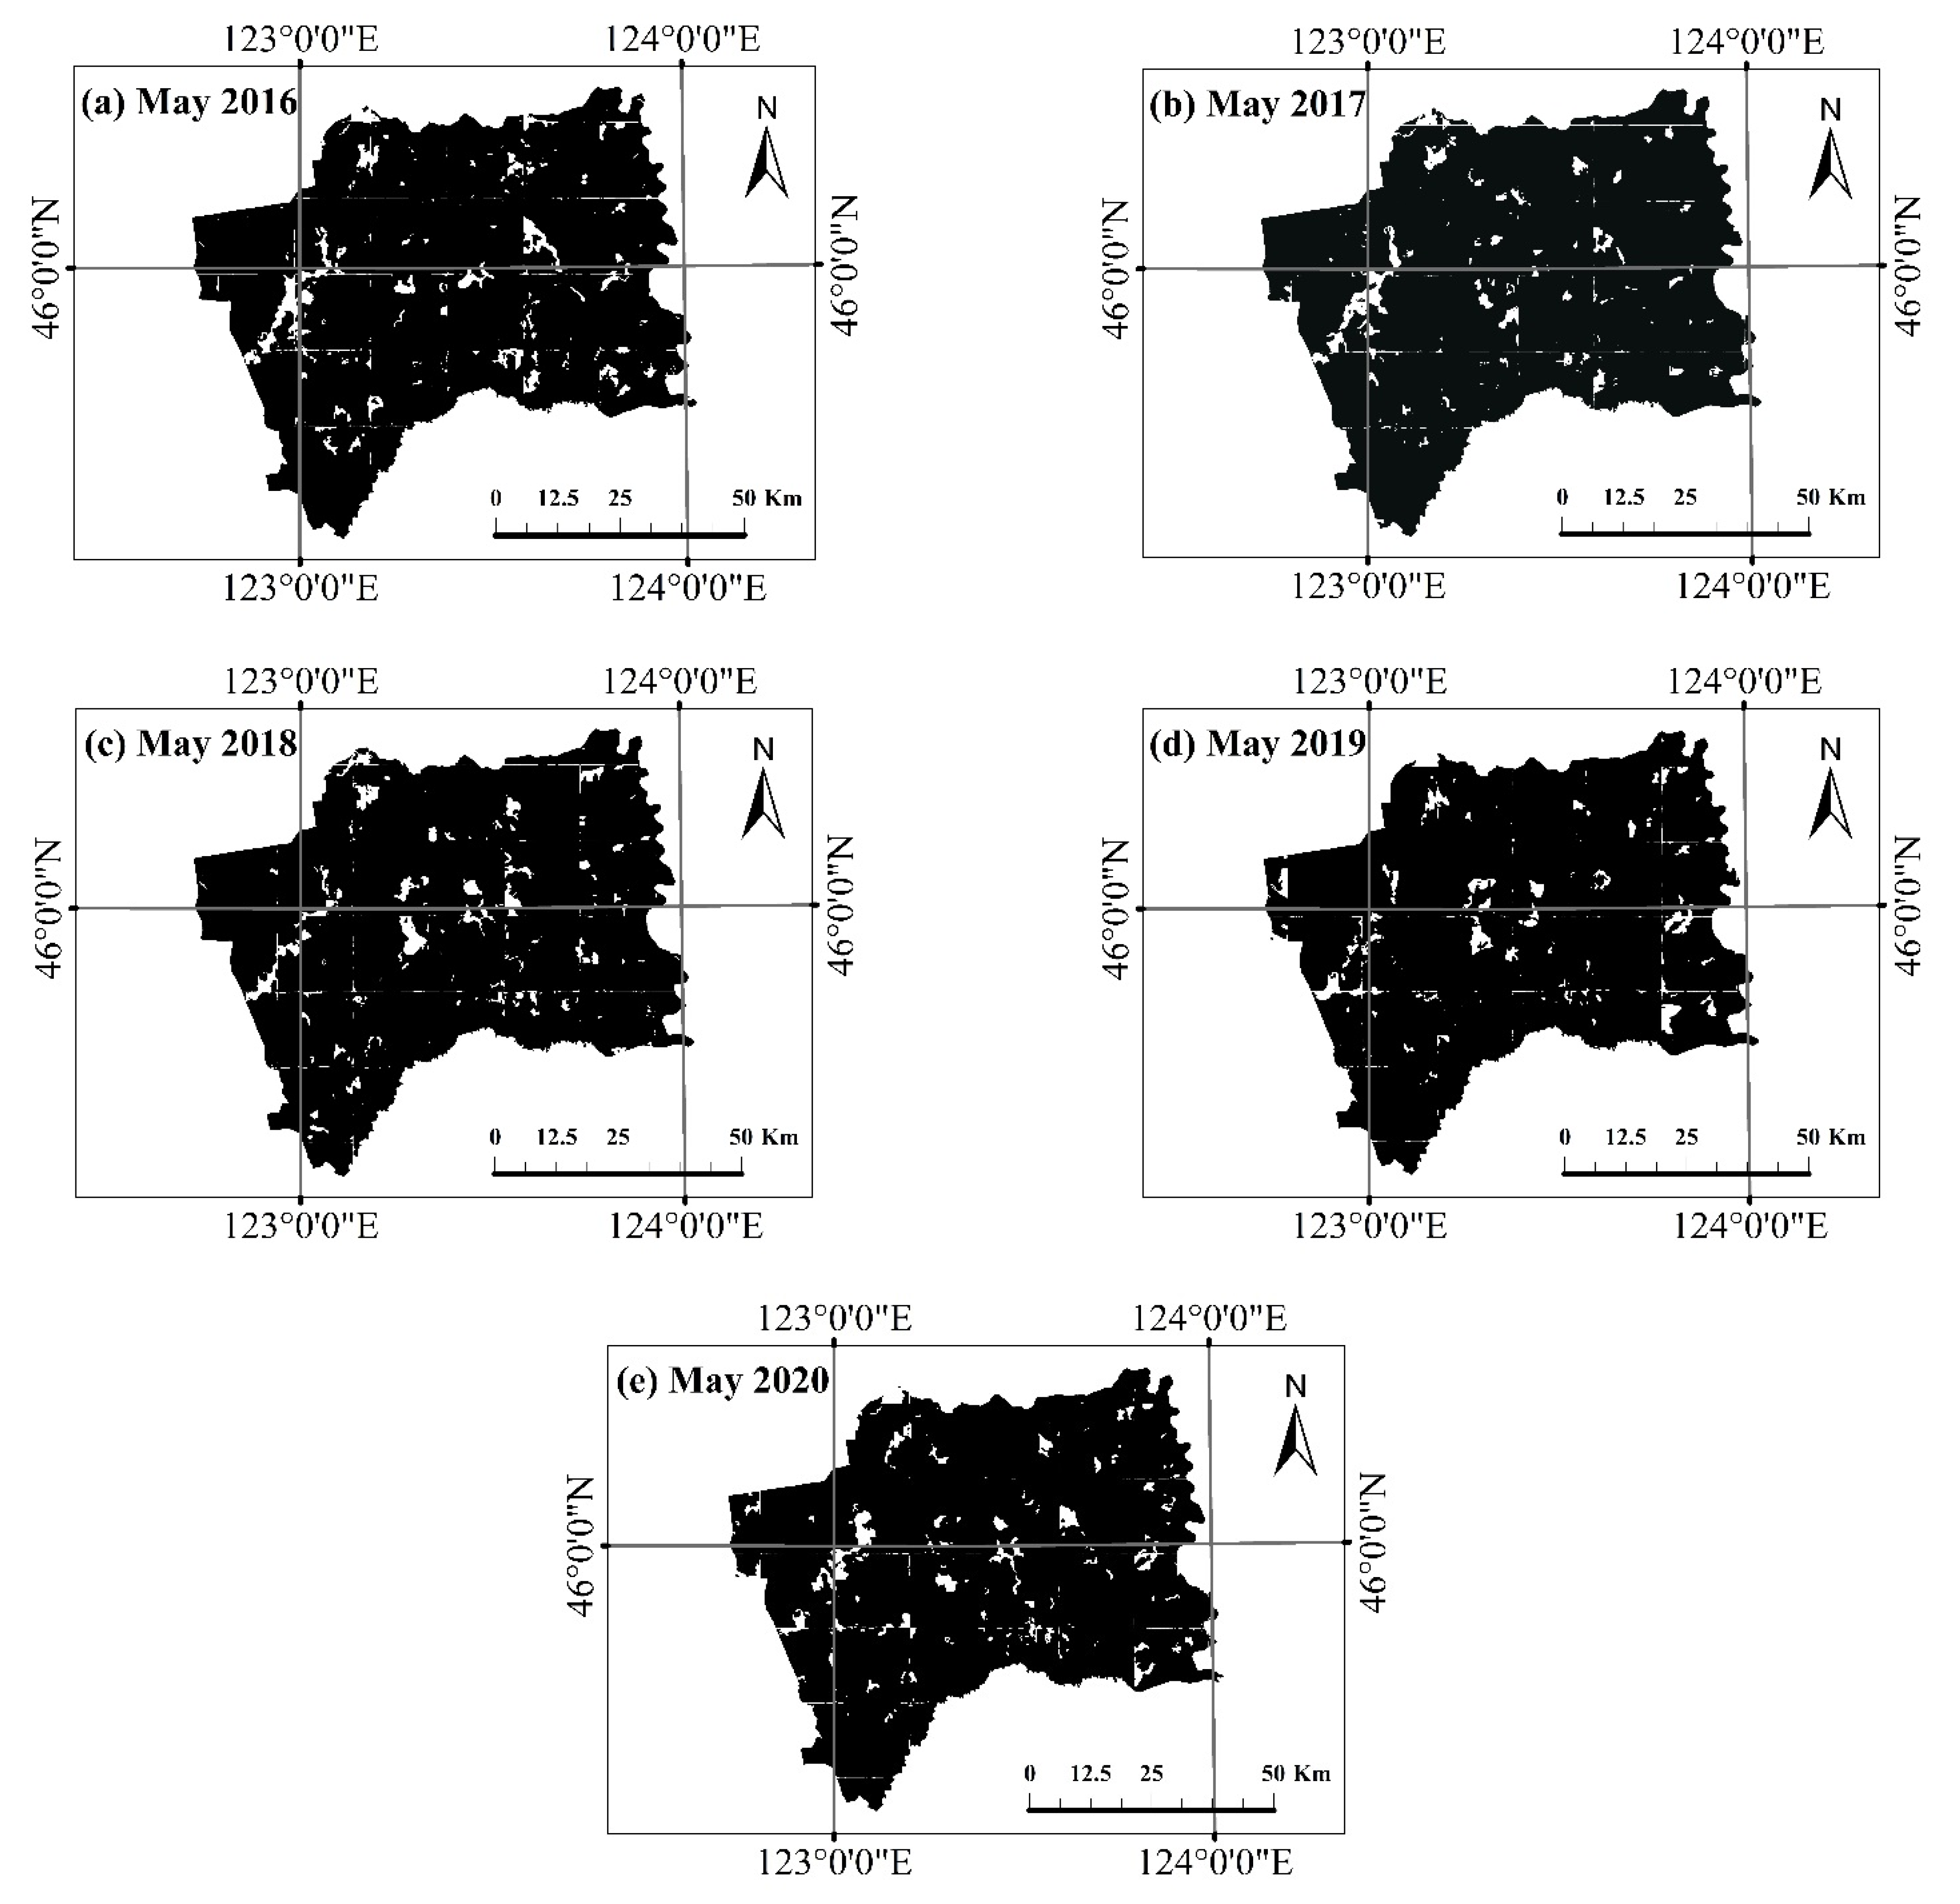
Figure 8.
The proportion of saline land in the Zhenlai area from 2016 to 2020.
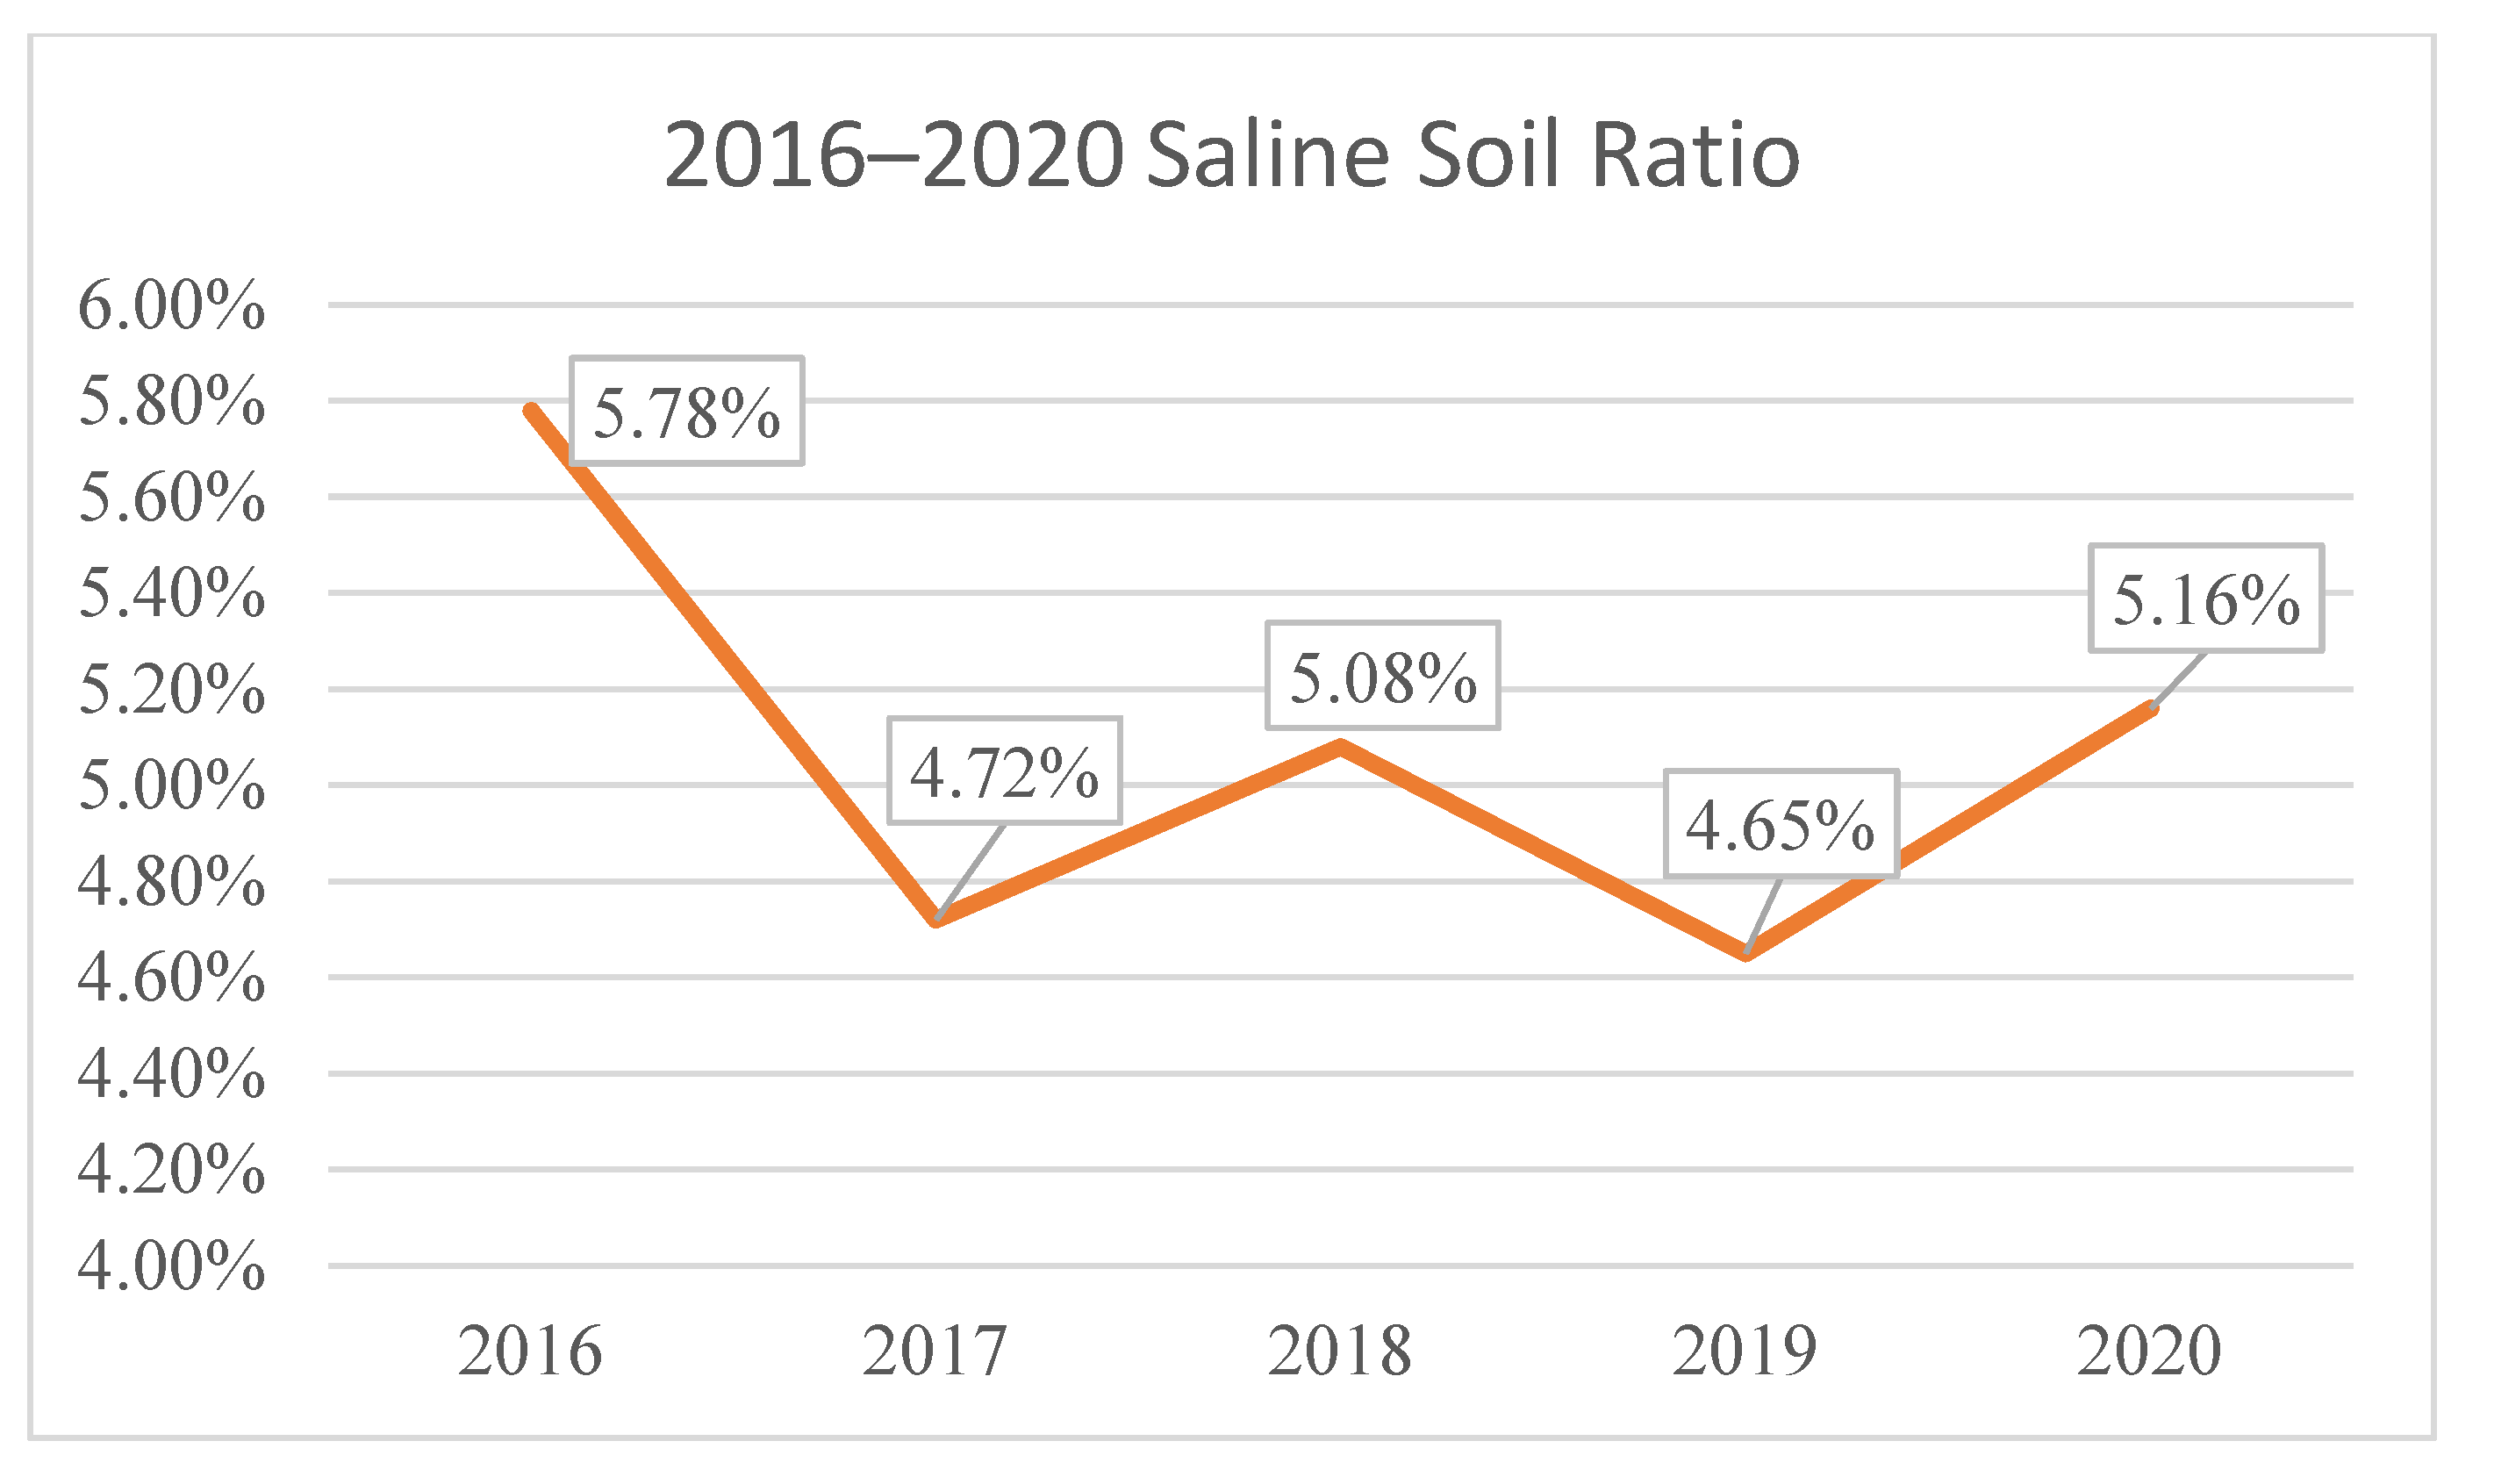
Figure 9.
The example results of the study area. The figure shows images, labels, and prediction results for different inputs for each example. The gray spots represent saline land, and the blank area represents non-saline land. The label is derived from the tag information described in the previous section, that is, the result obtained after cropping Figure 2.
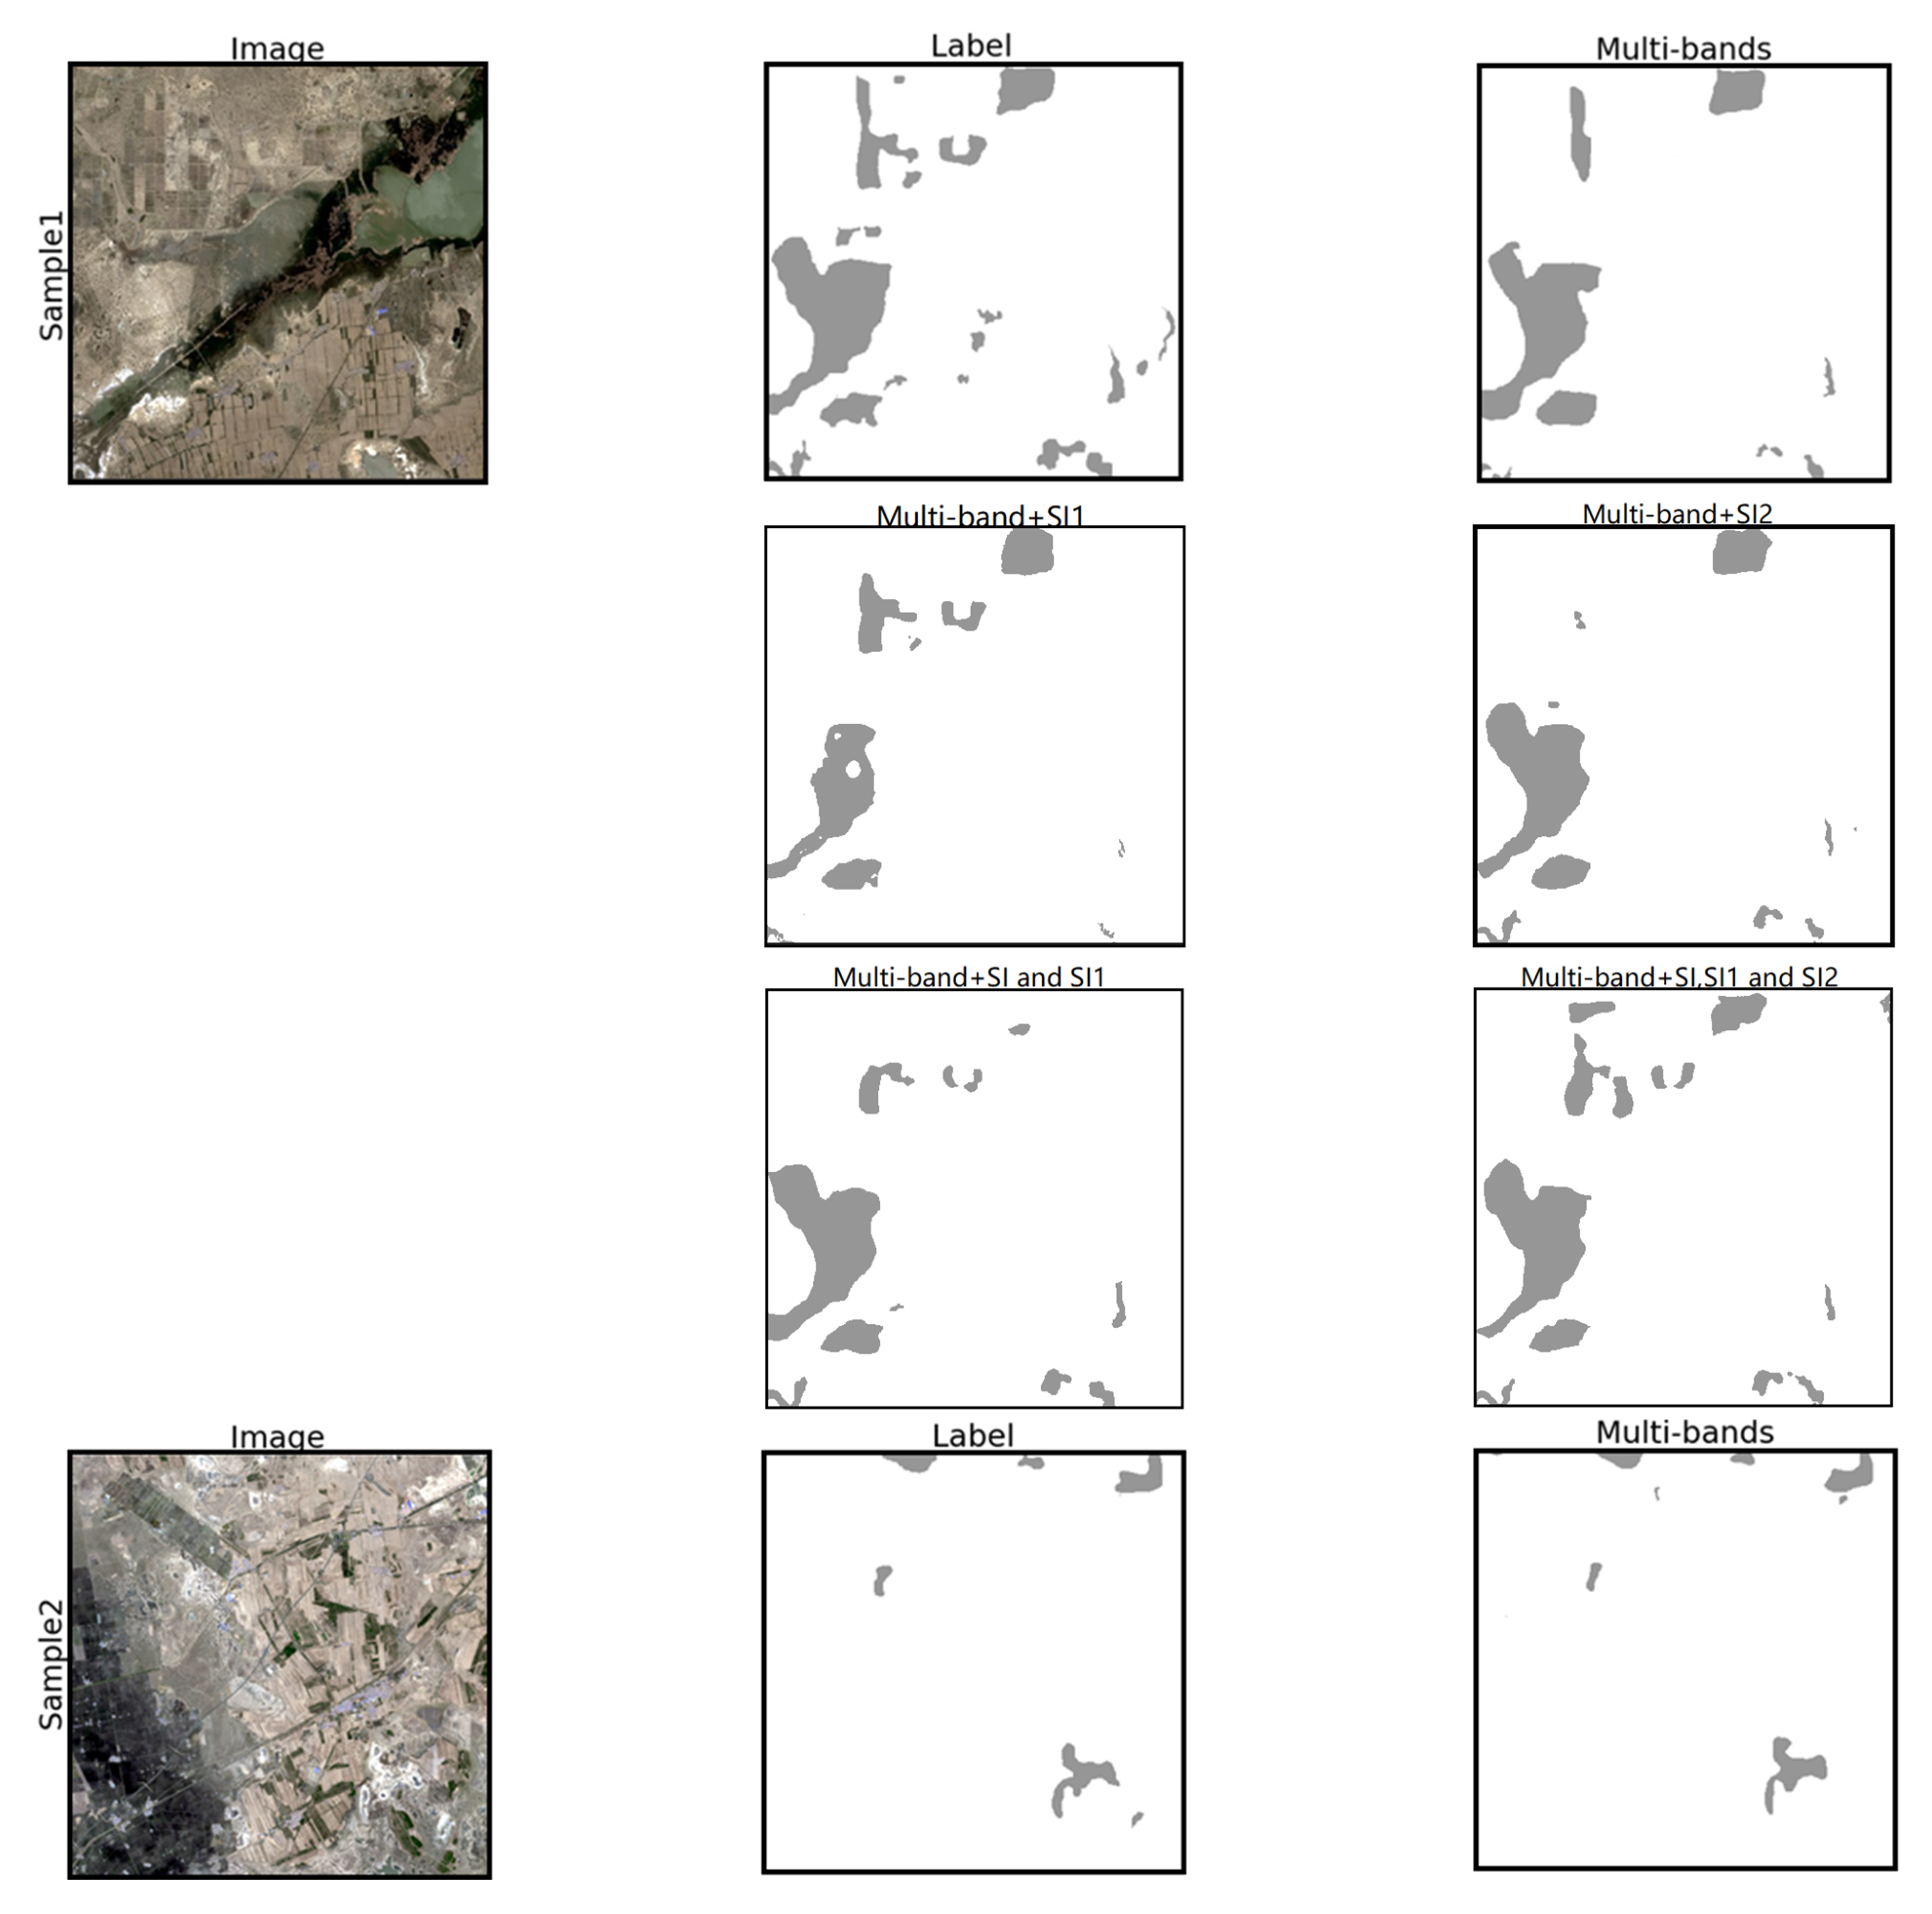

Figure 10.
Comparison of the overall accuracy for different inputs.
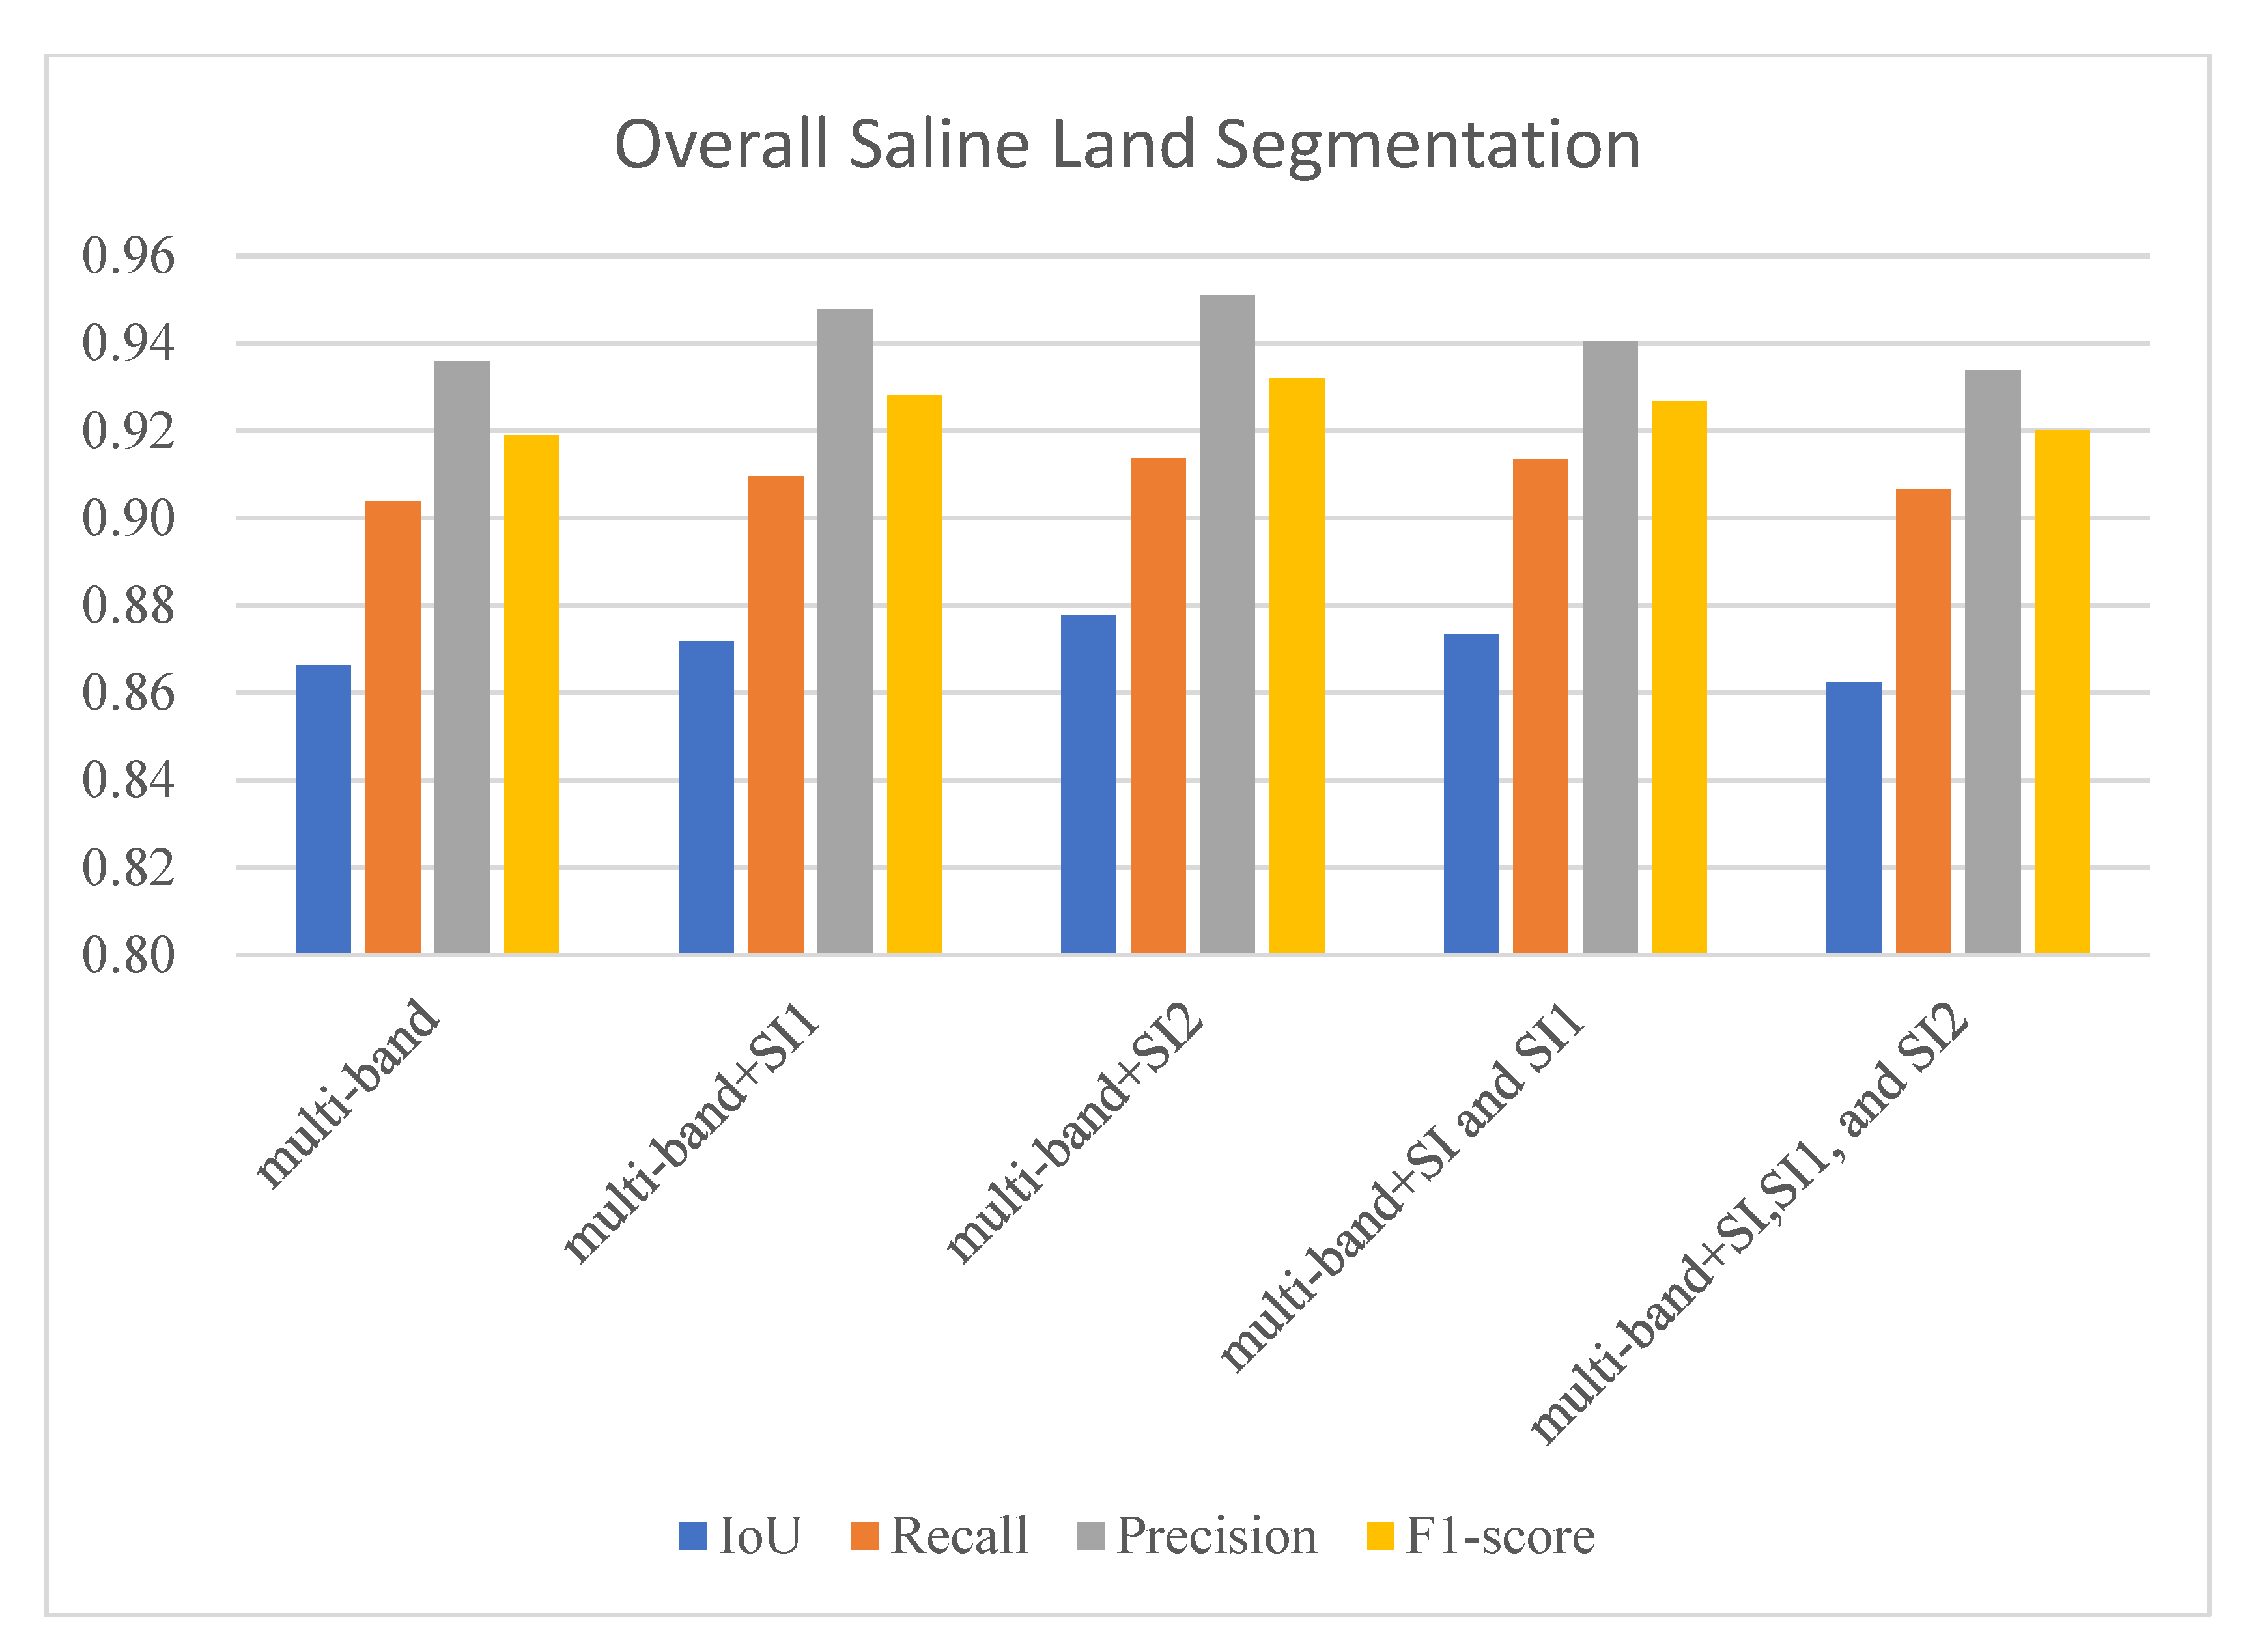
Figure 11.
Comparison of the saline land accuracy for different inputs.
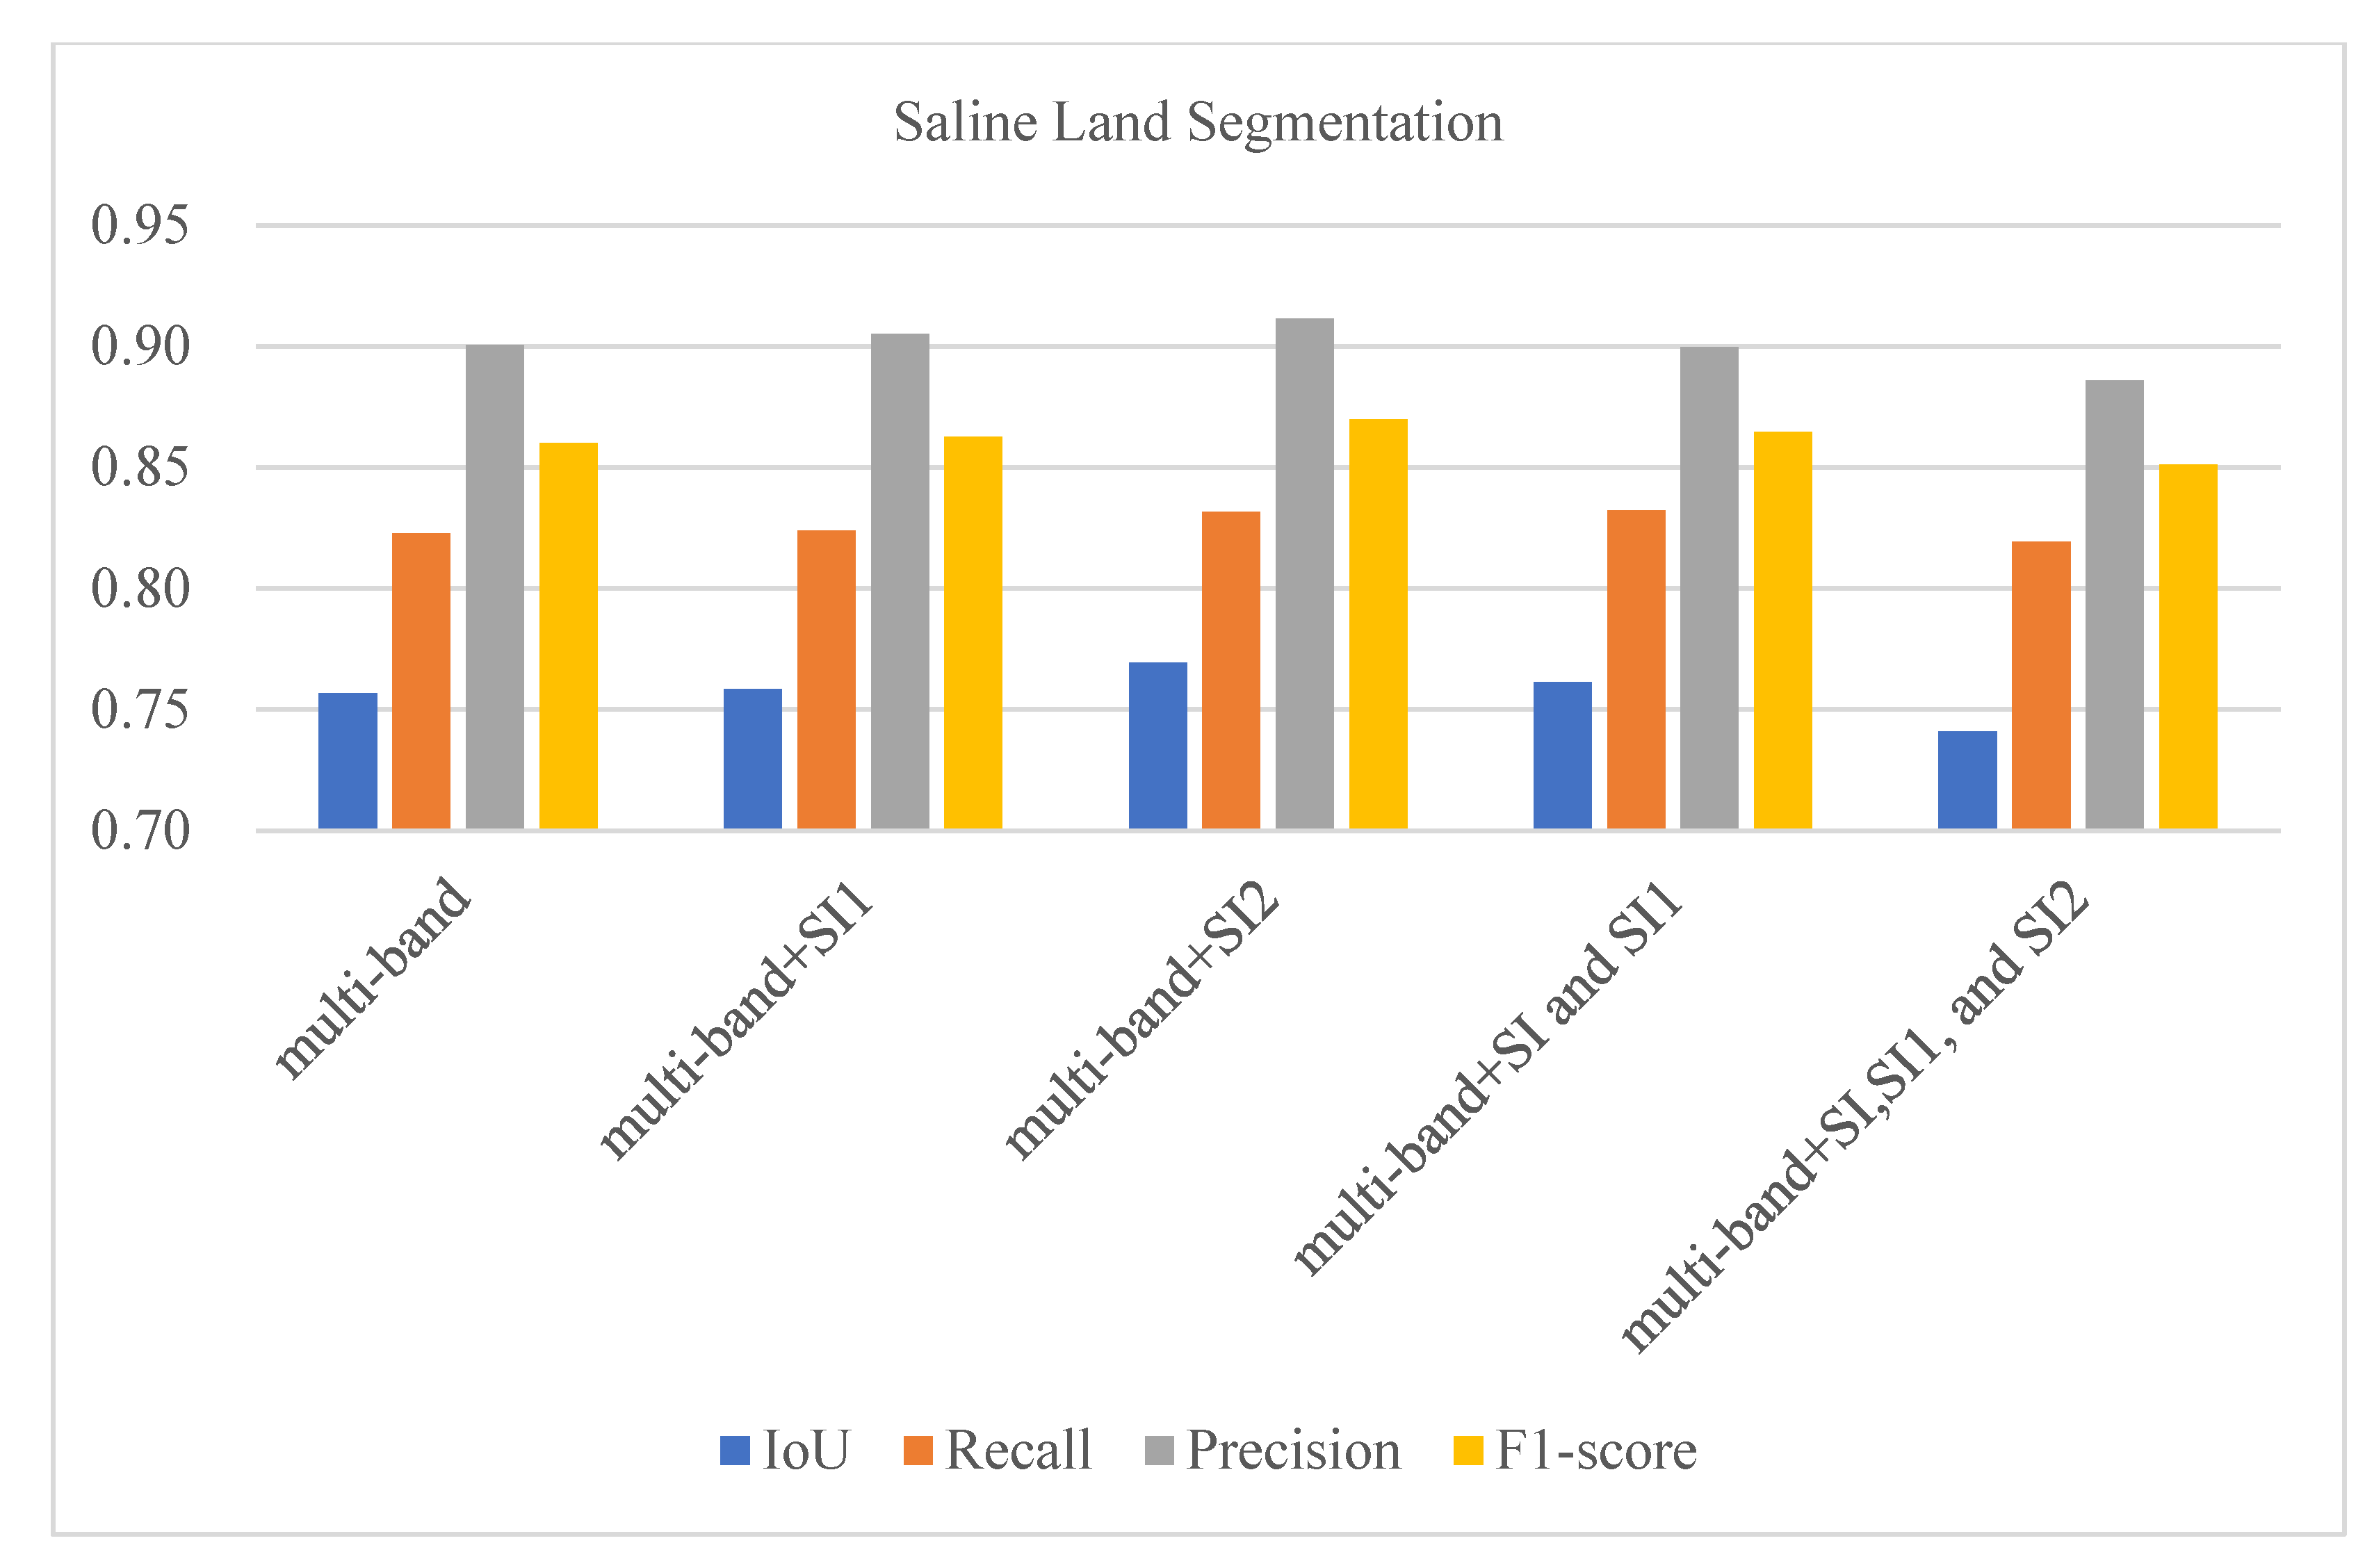
Figure 12.
Variation of different accuracy indices with training batches under different input conditions. The x-axes of the four graphs is the training batch, and the y-axes is the corresponding index. The pictures (a–d) respectively represent the trends of Recall, Precision, mIoU and loss with the change of training batches.


Table 1.
The details of the two Landsat-8 scenes.
| Scene 1 | Scene 2 | |
|---|---|---|
| Dated | LC81200282020147LGN00 | LC81200292020147LGN00 |
| Satellite | LANDSAT-8 | LANDSAT-8 |
| Sensor | OLI_TIRS | OLI_TIRS |
| Station ID | LGN | LGN |
| Path | 120 | 120 |
| Row | 28 | 29 |
| Data Date | 2020/5/26 0:00 | 2020/5/26 0:00 |
| Cloud Cover | 0.78 | 0.47 |
| Sun Elevation | 61.24469445 | 62.1965969 |
| Sun Azimuth | 143.8131482 | 141.4781073 |
| Product ID | 411 | 411 |
| Earth-Sun Distance | 150 million km | 150 million km |
Table 2.
Some common soil salinity indices.
| Index | Formulation | Reference |
|---|---|---|
| Salinity Index (SI-T) | R/NIR × 100 | [44] |
| Normalized Differential Salinity Index (NDSI) | (R-NIR)/(R + NIR) | [45] |
| Salinity Index (SI) | [45] | |
| Salinity Index1 (SI1) | [45] | |
| Salinity Index2 (SI2) | [46] | |
| Salinity Index3 (SI3) | [46] | |
| Salinity Index (S1) | B/R | [46] |
| Salinity Index (S2) | (B-R)/(B+R) | [47] |
| Salinity Index (S3) | (G×R)/B | [47] |
B: Blue band; G: Green band; R: Red band; NIR: Near-infrared band.
Table 3.
Combinations of different bands used for the training set.
| Combination | Bands Description | Image Layers |
|---|---|---|
| Muti-bands | Coastal, Blue, Green, Red, NIR, SWIR1, SWIR2 | 7 |
| Muti-bands + SI1 | Coastal, Blue, Green, Red, NIR, SWIR1, SWIR2, SI1 | 8 |
| Muti-bands + SI2 | Coastal, Blue, Green, Red, NIR, SWIR1, SWIR2, SI2 | 8 |
| Muti-bands + SI&SI1 | Coastal, Blue, Green, Red, NIR, SWIR1, SWIR2, SI, SI1 | 9 |
| Muti-bands + SI&SI1&SI2 | Coastal, Blue, Green, Red, NIR, SWIR1, SWIR2, SI, SI1, SI2 | 10 |
Table 4.
Overall accuracy for the different inputs.
| Combinations | Num of Bands | IoU | Recall | Precision | F1-Score |
|---|---|---|---|---|---|
| Multi-band | 7 | 0.8664 | 0.9040 | 0.9358 | 0.9190 |
| Multi-band + SI1 | 8 | 0.8718 | 0.9095 | 0.9476 | 0.9282 |
| Multi-band + SI2 | 8 | 0.8777 | 0.9135 | 0.9509 | 0.9318 |
| Multi-band + SI and SI1 | 9 | 0.8733 | 0.9134 | 0.9405 | 0.9268 |
| Multi-band + SI, SI1, and SI2 | 10 | 0.8624 | 0.9066 | 0.9337 | 0.9200 |
Table 5.
The classification of saline land and background. The first row of each item is the background result, the second row is the saline soil result.
Table 5.
The classification of saline land and background. The first row of each item is the background result, the second row is the saline soil result.
| Combinations | Num of Bands | IoU | Recall | Precision | F1-Score |
|---|---|---|---|---|---|
| Multi-band | 7 | 0.9762 | 0.9850 | 0.9711 | 0.9780 |
| 0.7566 | 0.8229 | 0.9004 | 0.8599 | ||
| Multi-band + SI1 | 8 | 0.9852 | 0.9951 | 0.9900 | 0.9925 |
| 0.7584 | 0.8239 | 0.9051 | 0.8626 | ||
| Multi-band + SI2 | 8 | 0.9860 | 0.9954 | 0.9954 | 0.9954 |
| 0.7694 | 0.8317 | 0.9113 | 0.8697 | ||
| Multi-band + SI andSI1 | 9 | 0.9853 | 0.9947 | 0.9905 | 0.9926 |
| 0.7613 | 0.8321 | 0.8995 | 0.8645 | ||
| Multi-band + SI, SI1, and SI2 | 10 | 0.9839 | 0.9940 | 0.9898 | 0.9919 |
| 0.7409 | 0.8192 | 0.8857 | 0.8512 |
Publisher’s Note: MDPI stays neutral with regard to jurisdictional claims in published maps and institutional affiliations. |
© 2022 by the authors. Licensee MDPI, Basel, Switzerland. This article is an open access article distributed under the terms and conditions of the Creative Commons Attribution (CC BY) license (https://creativecommons.org/licenses/by/4.0/).
Share and Cite
MDPI and ACS Style
Gu, Q.; Han, Y.; Xu, Y.; Ge, H.; Li, X. Extraction of Saline Soil Distributions Using Different Salinity Indices and Deep Neural Networks. Remote Sens. 2022, 14, 4647. https://doi.org/10.3390/rs14184647
AMA Style
Gu Q, Han Y, Xu Y, Ge H, Li X. Extraction of Saline Soil Distributions Using Different Salinity Indices and Deep Neural Networks. Remote Sensing. 2022; 14(18):4647. https://doi.org/10.3390/rs14184647
Chicago/Turabian StyleGu, Qianyi, Yang Han, Yaping Xu, Huitian Ge, and Xiaojie Li. 2022. "Extraction of Saline Soil Distributions Using Different Salinity Indices and Deep Neural Networks" Remote Sensing 14, no. 18: 4647. https://doi.org/10.3390/rs14184647
Note that from the first issue of 2016, this journal uses article numbers instead of page numbers. See further details here.