
Geomorphological Mapping and Erosion of Abandoned Tailings in the Hiendelaencina Mining District (Spain) from Aerial Imagery and LiDAR Data
 , , , and
Abstract
:
1. Introduction
2. Materials and Methods
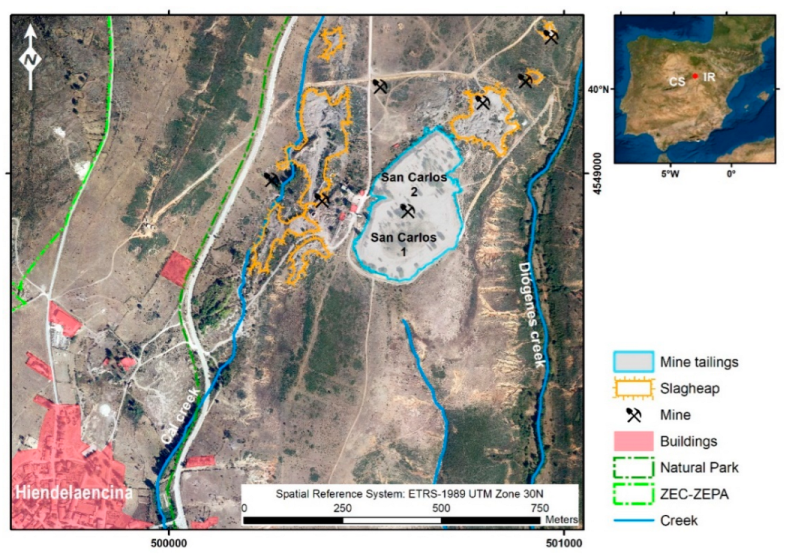
2.1. Study Area
2.2. Time Evolution and Geomorphological Mapping of Mine Tailings
2.3. Volume, Loss–Gain and Erosion Rate of Sludge and Toxic Element Mobilization
3. Results
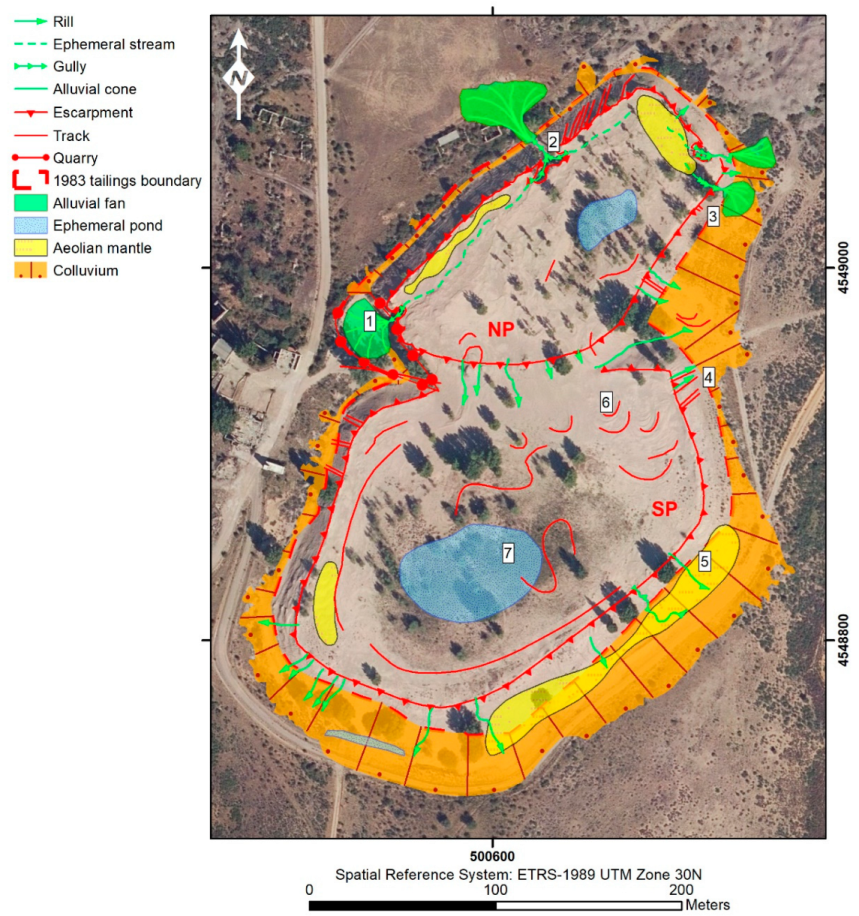
3.1. Geomorphological Mapping of Mine Tailings
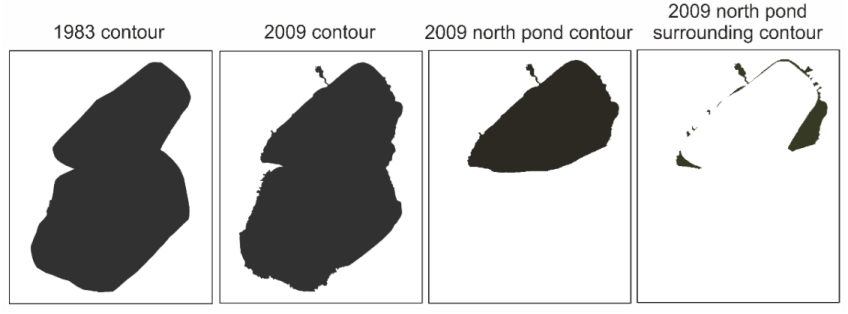
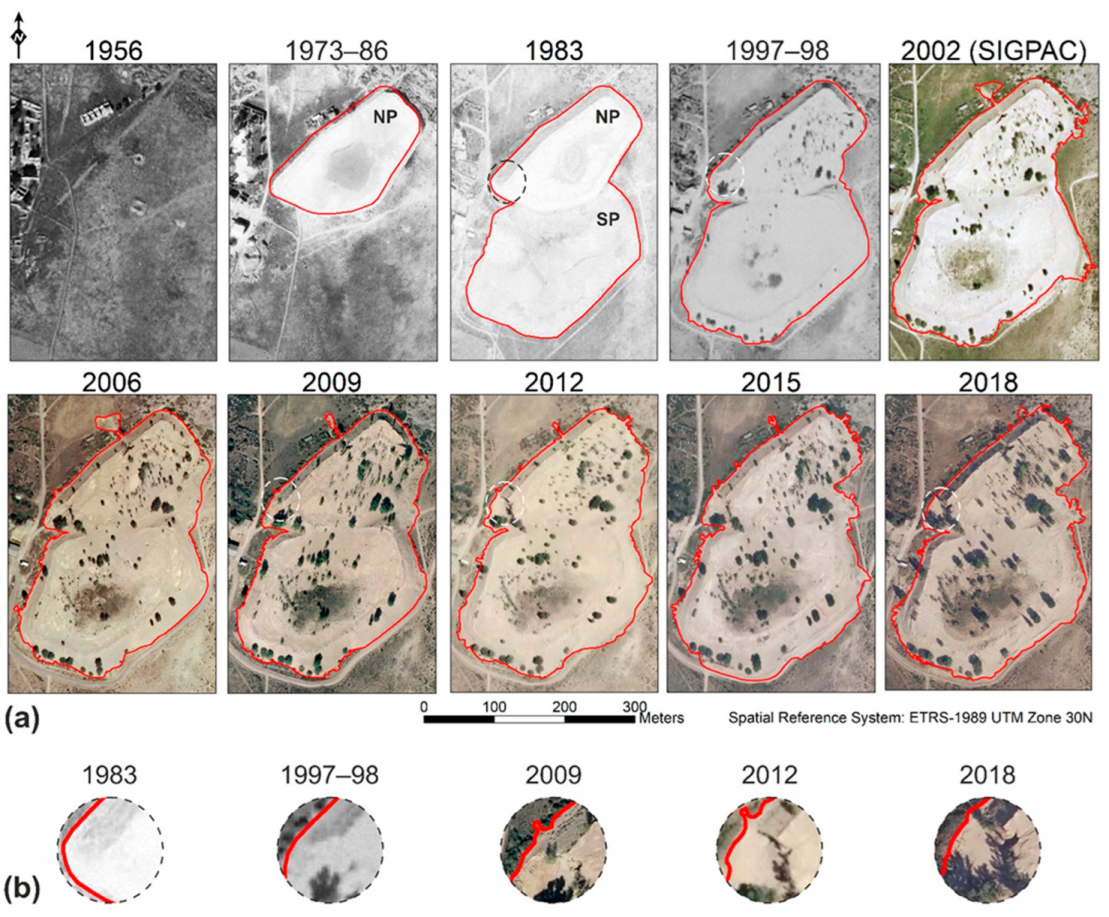
3.2. Formation and Evolution of Mine Tailings
3.3. Volume, Loss–Gain and Erosion Rate of Sludge
3.4. Toxic Elements Mobilized into the Environment
4. Discussion
5. Conclusions
Author Contributions
Funding
Data Availability Statement
Acknowledgments
Conflicts of Interest
References
- Robles-Arenas, V.M.; Rodríguez, R.; García, C.; Manteca, J.I.; Candela, L. Sulphide–mining impacts in the physical environment: Sierra de Cartagena–La Unión (SE Spain) case study. Environ. Geol. 2006, 51, 47–64. [Google Scholar] [CrossRef]
- Rodríguez, R.; Gómez de las Heras, J. Los residuos de la industria extractiva en España. Distribución geográfica y problemática ambiental asociada. In Los Residuos Minero-Metalúrgicos en el Medio Ambiente; Rodríguez, R., García-Cortés, A., Eds.; Instituto Geológico y Minero de España: Madrid, Spain, 2006; Volume 11, pp. 3–25. ISBN 84-7840-655-5. [Google Scholar]
- Meza-Figueroa, D.; Maier, R.M.; De la O-Villanueva, M.; Gómez-Alvarez, A.; Moreno-Zazaueta, A.; Rivera, J.; Campillo, A.; Grandlic, C.J.; Anaya, R.; Palafox-Reyes, J. The impact of unconfined mine tailings in residential areas from a mining town in a semi-arid enviromen: Nacozari, Sonora, Mexico. Chemosphere 2009, 77, 140–147. [Google Scholar] [CrossRef] [PubMed]
- Boussen, S.; Sebei, A.; Soubrand-Colin, M.; Bril, H.; Chaabani, F.; Abdeljaouad, S. Mobilization of lead–zinc rich particles from mine tailings in northern Tunisia by aeolian and run–off processes. Bull. Soc. Geol. Fr. 2010, 181, 459–471. [Google Scholar] [CrossRef]
- Sims, D.B.; Hooda, P.S.; Gillmore, G.K. Mining activities and associated environmental impacts in arid climates: A literature review. Environ. Pollut. 2013, 2, 22–43. [Google Scholar] [CrossRef]
- Martín-Crespo, T.; Gómez-Ortiz, D.; Martín-Velázquez, S.; Esbrí, J.M.; De Ignacio-San José, C.; Sánchez-García, M.J.; Montoya-Montes, I.; Martín-González, F. Abandoned mine tailings in cultural itineraries: Don Quixote Route (Spain). Eng. Geol. 2015, 197, 82–93. [Google Scholar] [CrossRef]
- Doumas, P.; Munoz, M.; Banni, M.; Becerra, S.; Bruneel, O.; Casiot, C.; Cleyet-Marel, J.-C.; Gardon, J.; Noack, Y.; Sappin-Didier, V. Polymetallic pollution from abandoned mines in Mediterranean regions: A multidisciplinary approach to environmental risks. Reg. Environ. Change 2018, 18, 677–692. [Google Scholar] [CrossRef]
- Martínez-López, S.; Martínez-Sánchez, M.J.; Pérez-Sirvent, C. Do old mining areas represent an environmental problem and health risk? A critical discussion through a particular case. Minerals 2021, 11, 594. [Google Scholar] [CrossRef]
- García, C.; Riberón-Zaldívar, A.B.; Carménate, J.A.; Rodríguez, R. Buenas prácticas y aplicación de medidas correctoras en áreas afectadas por actividades minero–metalúrgicas. In Los Residuos Minero-Metalúrgicos en el Medio Ambiente; Rodríguez, R., García-Cortés, A., Eds.; Instituto Geológico y Minero de España: Madrid, Spain, 2006; Volume 11, pp. 555–587. ISBN 84-7840-655-5. [Google Scholar]
- Martín Duque, J.F.; Zapico, I.; Oyarzun, R.; López García, J.A.; Cubas, P. A descriptive and quantitative approach regarding erosión and development of landforms on abandoned mine tailings: New insights and enviromental implications from SE Spain. Geomorphology 2015, 239, 1–16. [Google Scholar] [CrossRef]
- Sánchez-Donoso, R.; Martín-Duque, J.F.; Crespo, E.; Higueras, P.L. Tailing’s geomorphology of the San Quintín mining site (Spain). Environ. Earth Sci. 2019, 78, 166. [Google Scholar] [CrossRef]
- Tarolli, P.; Sofia, G. Human topographic signatures and derived geomorphic processes across landscapes. Geomorphology 2016, 255, 140–161. [Google Scholar] [CrossRef] [Green Version]
- Poesen, J.; Nachtergaele, J.; Verstraeten, G.; Valentin, C. Gully erosion and environmental change: Importance and research needs. Catena 2003, 50, 91–133. [Google Scholar] [CrossRef]
- Peter, K.D.; d’Oleire-Oltmanns, S.; Ries, J.B.; Marzolff, I.; Ait Hssaine, A. Soil erosion in gully catchments affected by land-levelling measures in the Souss Basin, Morocco, analysed by rainfall simulation and UAV remote sensing data. Catena 2014, 113, 24–40. [Google Scholar] [CrossRef]
- Stöcker, C.; Eltner, A.; Karrasch, P. Measuring gullies by synergetic application of UAV and close range photogrammetry—A case study from Andalusia, Spain. Catena 2015, 132, 1–11. [Google Scholar] [CrossRef]
- Moudry, V.; Gdulova, K.; Fogl, M.; Klapště, P.; Urban, R.; Komarek, J.; Moudra, L.; Štroner, M.; Bartak, V.; Solsky, M. Comparison of leaf-off and leaf-on combined UAV imagery and airborne LiDAR for assessment of a post-mining site terrain and vegetation structure: Prospects for monitoring hazards and restoration success. Appl. Geogr. 2019, 104, 32–41. [Google Scholar] [CrossRef]
- Frankl, A.; Stal, C.; Abraha, A.; Nyssen, J.; Rieke-Zapp, D.; DeWulf, A.; Poesen, J. Detailed recording of gully morphology in 3D through image-based modelling. Catena 2015, 127, 92–101. [Google Scholar] [CrossRef]
- Emel, J.; Plisinski, J.; Rogan, J. Monitoring geomorphic and hydrologic change at mine sites using satellite imagery: The Geita Gold Mine in Tanzania. Appl. Geogr. 2014, 54, 243–249. [Google Scholar] [CrossRef]
- Martín-Moreno, C.; Martín Duque, J.F.; Nicolau Ibarra, J.M.; Hernando Rodríguez, N.; Sanz Santos, M.A.; Sánchez Castillo, L. Effects of topography and surface soil cover on erosion for mining reclamation: The experimental spoil heap at El Machorro mine (Central Spain). Land Degrad. Develop. 2016, 27, 145–159. [Google Scholar] [CrossRef]
- Park, S.; Choi, Y. Applications of Unmanned Aerial Vehicles in Mining from Exploration to Reclamation: A Review. Minerals 2020, 10, 663. [Google Scholar] [CrossRef]
- Trabucchi, M.; Puente, C.; Comin, F.A.; Olague, G.; Smith, S.V. Mapping erosion risk at the basin scale in a Mediterranean environment with opencast coal mines to target restoration actions. Reg. Environ. Change 2012, 12, 675–687. [Google Scholar] [CrossRef]
- Hambali, R.; Wahyuni, S. The potential for land erosion due to primary tin mining in Bangka Island. IOP Conf. Ser. Earth Environ. Sci. 2021, 926, 012072. [Google Scholar] [CrossRef]
- Martín-Crespo, T.; Martín-Velázquez, S.; Gómez-Ortiz, D.; De Ignacio-San José, C.; Lillo-Ramos, J. A geochemical and geophysical characterization of sulfide mine ponds at the Iberian Pyrite Belt (Spain). Water Air Soil Poll. 2011, 217, 387–405. [Google Scholar] [CrossRef]
- Montoya-Montes, I.; Cano-Bermejo, L.; Sánchez-García, M.J.; de Ignacio-San José, C.; Martín-Velázquez, S.; Gómez-Ortiz, D.; Martín-Crespo, T.; Martín-González, F. Formación de cuerpos dunares a partir de lodos mineros mina de San Quintín (Ciudad Real, España). Geotemas 2012, 13, 1487–1490. [Google Scholar]
- López Gómez, A. El distrito minero de Hiendelaencina (Guadalajara). Cuad. Geogr. 1969, 6, 211–250. [Google Scholar]
- Calvo, M.; Sevillano, E. Hiendelaencina, Spain. Miner. Rec. 1992, 23, 241–249. [Google Scholar]
- Martínez Frías, J. The Hiendelaencina mining district (Guadalajara, Spain). Miner. Depos. 1992, 27, 206–212. [Google Scholar] [CrossRef]
- Arlandi Rodríguez, M.; Calvo Rebollar, M.; López Ramos, F.; Maturana Campos, S.; Sainz de Baranda Graf, B. Hiendelaencina, el filón rico. Bocamina Rev. Miner. Yacim. Esp. 1995, 1, 4–28. [Google Scholar]
- Instituto Geológico y Minero de España (IGME). Inventario Nacional de Depósitos de Lodos. 2002. Available online: https://info.igme.es/balsas/ (accessed on 25 May 2021).
- Instituto Geográfico Nacional (IGN). Centro Nacional de Información Geográfica. 2021. Available online: https://www.cnig.es (accessed on 24 May 2021).
- Junta de Comunidades de Castilla la Mancha (JCCM). Centro Cartográfico de Castilla-La Mancha. 2021. Available online: https://castillalamancha.maps.arcgis.com/ (accessed on 24 May 2021).
- Concha, A.; Oyarzun, R.; Lunar, R.; Sierra, J.; Doblas, M.; Lillo, J. The Hiendelaencina epithermal silver–base metal district, Central Spain: Tectonic and mineralizing processes. Miner. Depos. 1992, 27, 83–89. [Google Scholar] [CrossRef]
- De Pablo, M.A.; de Pablo, J.C.; Paniego, M.J. Proyecto de recuperación del entorno de la mina de plata San Carlos (Hiendelaencina, Guadalajara). Metall 2013, 20, 53–64. [Google Scholar]
- Chías, P.; Abad, T. Hiendelaencina: Imagen y construcción del territorio y del paisaje a través de la cartografía histórica. In Minas de Plata de Hiendelaencina. Territorio, Patrimonio y Paisaje; Rosas, Á.L., Ed.; Universidad de Alcalá de Henares: Alcalá de Henares, Spain, 2014; pp. 55–75. [Google Scholar]
- Gobierno de Castilla la Mancha. ZEC–ZEPA Sierra de Ayllón ES0000104–ES0000488. Red Natura 2000. 2020. Available online: https://www.castillalamancha.es/gobierno/agrimedambydesrur/estructura/dgapfyen/rednatura2000/liczepaES0000164-ES0000488 (accessed on 24 May 2021).
- Chazarra, A.; Flórez, E.; Peraza, B.; Tohá, T.; Lorenzo, B.; Criado, E.; Moreno, J.V.; Romero, R.; Botey, R. Mapas Climáticos de España (1981–2010) y Eto (1996–2016); Ministerio para la Transición Ecológica—Agencia Estatal de Meteorología: Madrid, Spain, 2018. [Google Scholar]
- Agencia Española de Meteorología (AEMET). Open Access Meteorological Data. 2010. Available online: http://www.aemet.es/es/datos_abiertos/AEMET_OpenData (accessed on 1 June 2021).
- Weather Spark. El Clima Promedio en Hiendelaencina, España. 2021. Available online: https://es.weatherspark.com/y/37079/Clima-promedio-en-Hiendelaencina-Espa%C3%B1a-durante-todo-el-a%C3%B1o (accessed on 14 June 2021).
- Instituto Geográfico Nacional (IGN). Mapa Topográfico del Municipio de Hiendelaencina 1:25,000; Instituto Geográfico Nacional: Madrid, Spain, 1954. [Google Scholar]
- Pryimak, V. Caracterización Geoquímica de la Balsa de Lodos de la Mina de Hiendelaencina (Guadalajara). Bachelor’s Thesis, Universidad Rey Juan Carlos, Madrid, Spain, 2021. [Google Scholar]
- Mansson, E. Investigation of Particle Sizes, Beach Profiles and Compounds in Tailings Dams. Master’s Thesis, Lund University, Lund, Sweden, 2014. [Google Scholar]
- Quille, M.E.; O’Kelly, B.C. Geotechnical properties of zinc/lead mine tailings from Tara Mines, Ireland. In Proceedings of the ASCE GeoShanghai, Shanghai, China, 3–5 June 2010; Volume 204, pp. 111–117. [Google Scholar]
- Mhlongo, S.E.; Makatu, F.L.; Malaza, N.K.; Ramalata, A.T. Evaluation of copper tailings from the abandoned Messina Mine for possible reuse in recreational projects, South Africa. J. Degrad. Min. Lands Manag. 2022, 9, 3359–3366. [Google Scholar] [CrossRef]
- Rodríguez-Santalla, I.; Gomez-Ortiz, D.; Martín-Crespo, T.; Sánchez, M.J.; Montoya-Montes, I.; Martín-Velázquez, S.; Barrio, F.; Serra, J.; Ramírez-Cuesta, J.M.; Gracia, F.J. Study and Evolution of the Dune Field of La Banya Spit in Ebro Delta (Spain) Using LiDAR Data and GPR. Remote Sens. 2021, 13, 802. [Google Scholar] [CrossRef]
- Benito, G.; Benito-Calvo, A.; Gallart, F.; Martín-Vide, J.P.; Regües, D.; Bladé, E. Hydrological and geomorphological criteria to evaluate the dispersion risk of waste sludge generated by the Aznalcollar mine spill (SW Spain). Environ. Geol. 2001, 40, 417–428. [Google Scholar] [CrossRef]
- Sanz, M.A.; Martín-Duque, J.F.; Martín-Moreno, C.; Lucía, A.; Nicolau, J.M.; Pedraza, J.; Sánchez, L.; Ruiz, R.; García, A. Silica sand slope gullying and mining in Central Spain: Erosion processes and geomorphic reclamation of contour mining. In Geo–Environment and Landscape Evolution III; Mander, U., Brebbia, C.A., Martin-Duque, J.F., Eds.; WIT PRESS: Boston, MA, USA, 2008; pp. 4–14. ISBN 978-1-84564-117-7. [Google Scholar]
- De Vos, W.; Viaene, W. Geochemical study of soils and metallogenetic implications at Hiendelaencina, Guadalajara, Spain. Miner. Depos. 1980, 15, 87–89. [Google Scholar] [CrossRef]
- Alonso, E.E.; Gens, A. Aznalcóllar dam failure. Part 2: Stability conditions and failure mechanism. Géotechnique 2006, 56, 185–201. [Google Scholar] [CrossRef]
- Ojelede, M.E.; Annegarn, H.J.; Kneen, M.A. Evaluation of aeolian emissions from gold mine tailings on the Witwatersrand. Aeolian Res. 2011, 3, 477–486. [Google Scholar] [CrossRef]
- Wong, M.H. Ecological restoration of mine degraded soils, with emphasis on metal contaminated soils. Chemosphere 2003, 50, 775–780. [Google Scholar] [CrossRef]
- Conesa, H.M.; Faz, A.; Arnaldos, R. Heavy metal accumulation and tolerance in plants from mine tailings of the semiarid Cartagena–La Unión mining district (SE Spain). Sci. Total Environ. 2006, 366, 1–11. [Google Scholar] [CrossRef]
- Moreno-de las Heras, M.; Merino-Martín, L.; Nicolau, J.M. Effect of vegetation cover on the hydrology of reclimed mining soils under Mediterranean-Continental climate. Catena 2009, 77, 39–47. [Google Scholar] [CrossRef]
- Howard, E.J.; Loch, R.J. Acceptable erosion rates for mine waste landform rehabilitation modelling in the Pilbara, Western Australia. In Mine Closure; Fourie, A.B., Tibbett, M., Eds.; Australian Centre for Geomechanics: Perth, WA, Australia, 2019; pp. 1545–1559. ISBN 978-0-9876389-3-9. [Google Scholar]
- Bhanbhro, R. Mechanical Properties of Tailings: Basic Description of a Tailings Material from Sweden. Licentiate Thesis, Luleå University of Technology, Luleå, Sweden, 2014. Available online: https://www.researchgate.net/publication/265296679_Mechanical_Properties_of_Tailings_Basic_Description_of_a_Tailings_Material_from_Sweden (accessed on 1 June 2021).
- Martín-Crespo, T.; Gómez Ortiz, D.; Martín Velázquez, S.; Martínez Pagán, P.; De Ignacio, C.; Lillo, J.; Faz, A. Geoenvironmental characterization of unstable abandoned mine tailings combining geophysical and geochemical methods (Cartagena–La Union district, Spain). Eng. Geol. 2018, 232, 135–146. [Google Scholar] [CrossRef]
- Martín-Crespo, T.; Gómez-Ortiz, D.; Martín-Velázquez, S.; Martínez-Pagán, P.; de Ignacio-San José, C.; Lillo, J.; Faz, A. Abandoned mine tailings afecting riverbed sediments in the Cartagena—La Union district, mediterranean coastal area (Spain). Remote Sens. 2020, 12, 2042. [Google Scholar] [CrossRef]
- Peña-Ortega, M.; Del Rio-Salas, R.; Valencia-Sauceda, J.; Mendívil-Quijada, H.; Minjarez-Osorio, C.; Molina-Freaner, F.; De la O-Villanueva, M.; Moreno-Rodríguez, V. Enviromental assessment and historic erosion calculation of abandoned mine tailings from a semi-arid zone of northwestern Mexico: Insights from geochemistry and unmanned aerial vehicles. Environ. Sci. Pollut. Res. 2019, 26, 26203–26215. [Google Scholar] [CrossRef]


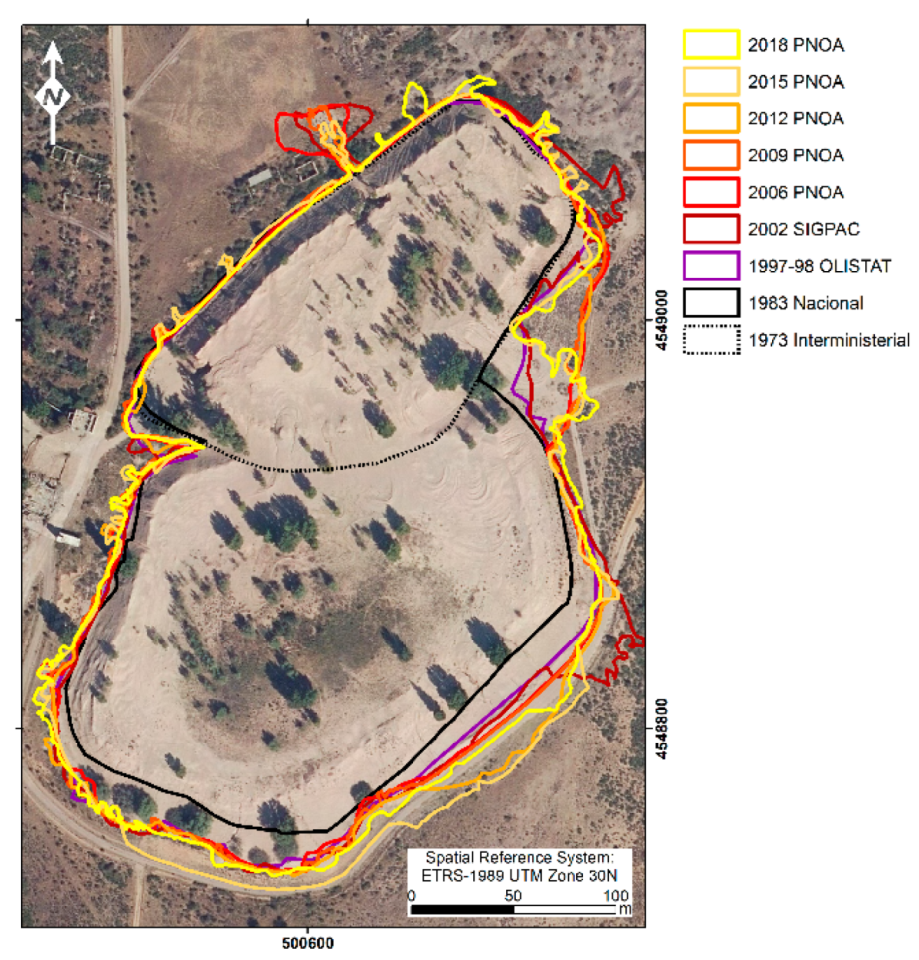
| Flight Name | Frame Date | Scale | Pixel Size (GSD; m) | Original Frame Format |
|---|---|---|---|---|
| AMS 1945–1946. Ministry of Defense | 20 July 1946 | 1:43,200 | - | Analog |
| AMS 1956–1957. Ministry of Defense | 8 October 1956 | 1:32,000 | 50–100 | Analog |
| Interministerial 1973–1986 | 1973–1986 | 1:18,000 | 27–45 | Analog |
| National 1980–1986 | 1983 | 1:30,000 | 45–75 | Analog |
| Olive oil OLISTAT 1997–1998 | October 1997, February 1998 | 1:40,000 | 100 | Analog |
| SIGPAC 1997–2003 | 24 September 2002 | 1:15,000 1:30,000 | 25–50 | Analog |
| Quinquennial 1998–2003. IGN | 2002 | 1:40,000 | 100 | Analog |
| PNOA 2006 | 11 August 2006 | 1:30,000 | 45 | Analog |
| PNOA 2009 | 26 September 2009 | 1:20,000 | 22 | Digital |
| PNOA 2012 | 09 July 2012 | 1:30,000 | 45 | Digital |
| PNOA 2015 | 28 June 2015 | 1:30,000 | 45 | Digital |
| PNOA 2018 | 22 September 2018 | 1:25,000 | 34 | Digital |
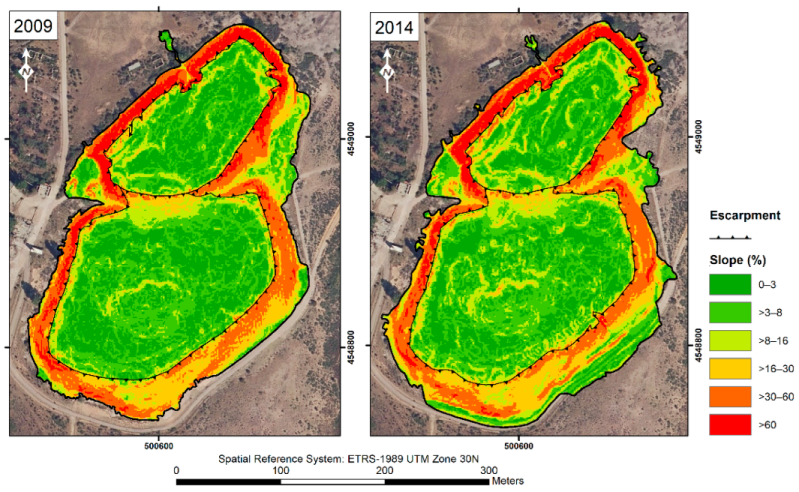
| Mine Pond | 2009 Contour | 1983 Contour | Surrounding Area | |||
|---|---|---|---|---|---|---|
| Volume | Area | Volume | Area | Volume | Area | |
| North | 293,732 ± 108 | 25,475 | 279,862 ± 89 | 22,126 | 13,869 ± 19 | 3349 |
| South | 338,850 ± 765 | 42,593 | 319,078 ± 746 | 35,806 | 19,772 ± 1334 | 6787 |
| North + South | 632,582 ± 657 | 68,068 | 598,940 ± 657 | 57,932 | 33,642 ± 1315 | 10,136 |
| 1973–1986 | 1983 | 1997–1998 | 2002 SIGPAC | 2006 | 2009 | 2012 | 2015 | 2018 | |
|---|---|---|---|---|---|---|---|---|---|
| Area | 22,776 | 57,932 | 64,566 | 68,054 | 68,209 | 68,068 | 69,538 | 70,988 | 68,671 |
| Mine Pond | 2009–2014 Contour | 1983 Contour | Surrounding Area | ||||
|---|---|---|---|---|---|---|---|
| Volume | Area | Volume | Area | Volume | Area | ||
| Loss | North | −5902 ± 75 | 20,087 | −5812 ± 78 | 19,005 | −89 ± 3 | 1082 |
| South | −6923 ± 33 | 30,929 | −5424 ± 39 | 25,715 | −1498 ± 61 | 5214 | |
| North + South | −12,825 ± 112 | 51,016 | −11,237 ± 105 | 44,720 | −1588 ± 22 | 6296 | |
| Gain | North | 1519 ± 26 | 6470 | 1076 ± 32 | 4001 | 442 ± 17 | 2469 |
| South | 2457 ± 190 | 14,923 | 1029 ± 190 | 8997 | 1427 ± 191 | 5926 | |
| North + South | 3976 ± 189 | 21,393 | 2106 ± 189 | 12,998 | 1870 ± 191 | 8395 | |
| Balance | North + South | −8849 ± 135 | - | −9130 ± 117 | - | 281 ± 74 | - |
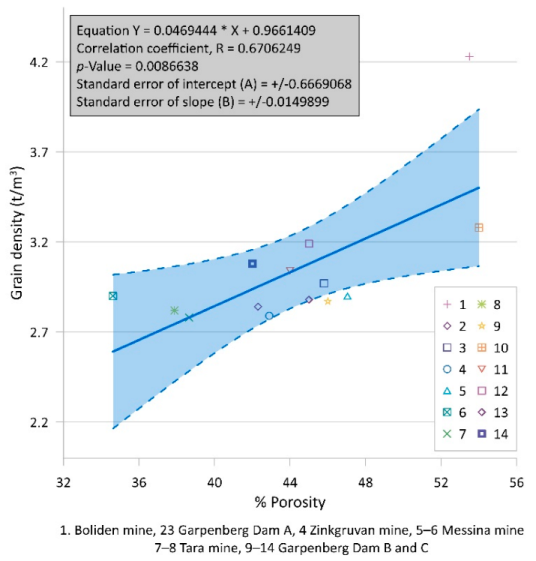
| Pond | Grain Density (t/m3) | Dry Density (t/m3) | Mass (t) | Element Amount (t) | ||||||||
|---|---|---|---|---|---|---|---|---|---|---|---|---|
| Ag | As | Cr | Cu | Ni | Pb | Sb | Zn | Σ | ||||
| North | 2.87 | 1.706 ± 0.053 | 7477 ± 404 | 0.1 ± 0.01 | 0.9 ± 0.05 | 0.4 ± 0.02 | 0.1 ± 0.01 | 0.1 ± 0.01 | 1.3 ± 0.07 | 0.2 ± 0.01 | 1.2 ± 0.06 | 4.2 ± 0.2 |
| South | 2.92 | 1.705 ± 0.039 | 7615 ± 553 | 0.1 ± 0.01 | 1.8 ± 0.11 | 0.3 ± 0.02 | 0.2 ± 0.01 | 0.1 ± 0.01 | 1.7 ± 0.1 | 0.3 ± 0.02 | 1.7 ± 0.1 | 6.1 ± 0.4 |
Publisher’s Note: MDPI stays neutral with regard to jurisdictional claims in published maps and institutional affiliations. |
© 2022 by the authors. Licensee MDPI, Basel, Switzerland. This article is an open access article distributed under the terms and conditions of the Creative Commons Attribution (CC BY) license (https://creativecommons.org/licenses/by/4.0/).
Share and Cite
Martín-Velázquez, S.; Rodríguez-Santalla, I.; Ropero-Szymañska, N.; Gomez-Ortiz, D.; Martín-Crespo, T.; de Ignacio-San José, C. Geomorphological Mapping and Erosion of Abandoned Tailings in the Hiendelaencina Mining District (Spain) from Aerial Imagery and LiDAR Data. Remote Sens. 2022, 14, 4617. https://doi.org/10.3390/rs14184617
Martín-Velázquez S, Rodríguez-Santalla I, Ropero-Szymañska N, Gomez-Ortiz D, Martín-Crespo T, de Ignacio-San José C. Geomorphological Mapping and Erosion of Abandoned Tailings in the Hiendelaencina Mining District (Spain) from Aerial Imagery and LiDAR Data. Remote Sensing. 2022; 14(18):4617. https://doi.org/10.3390/rs14184617
Chicago/Turabian StyleMartín-Velázquez, Silvia, Inmaculada Rodríguez-Santalla, Nikoletta Ropero-Szymañska, David Gomez-Ortiz, Tomás Martín-Crespo, and Cristina de Ignacio-San José. 2022. "Geomorphological Mapping and Erosion of Abandoned Tailings in the Hiendelaencina Mining District (Spain) from Aerial Imagery and LiDAR Data" Remote Sensing 14, no. 18: 4617. https://doi.org/10.3390/rs14184617