Article

Assessment of the Combined Risk of Drought and High-Temperature Heat Wave Events in the North China Plain during Summer

1
School of Geography and Tourism, Qufu Normal University, Rizhao 276826, China
2
Institute of Yellow River Ecology, Qufu Normal University, Rizhao 276826, China
*
Author to whom correspondence should be addressed.
Remote Sens. 2022, 14(18), 4588; https://doi.org/10.3390/rs14184588
Submission received: 22 August 2022 / Revised: 9 September 2022 / Accepted: 13 September 2022 / Published: 14 September 2022

Abstract

:
Drought-induced risk has attracted the attention of many scholars, but the risk of combined events caused by drought and high-temperature heat waves still needs further study. Based on MODIS products and meteorological data, the spatiotemporal variation characteristics of summer drought and high-temperature heat waves in the North China Plain from 2000 to 2018 were analyzed by the standardized precipitation evapotranspiration index (SPEI), crop water stress index (CWSI) and high-temperature threshold, and their combined-events risk was evaluated. The results showed that (1) from 2000 to 2018, summer drought in the North China Plain became more severe. Especially in Henan, Anhui and Jiangsu Provinces, drought increased significantly. (2) From 2000 to 2018, the frequency and intensity of high-temperature heat wave events in the North China Plain gradually increased at rates of 0.28 times/10 year and 1.6 °C/10 year, respectively. (3) The slightly high risk and high risk caused by summer drought were mainly distributed in Hebei Province and Tianjin Municipality in the north, and the risk change was characterized by a decrease in the north and an increase in the south. (4) The combined-events risk of summer drought and high-temperature heat waves did not increase significantly, with an increase rate of approximately 0.01/10 year. Among them, the increase rate of combined-events risk in Henan Province was the largest (0.14/10 year), followed by the obvious increase in northern Anhui, Jiangsu and southern Shandong, while the risk in Beijing showed a decreasing trend. The research results have scientific guiding significance for formulating disaster prevention and reduction strategies.

1. Introduction

In the context of global warming, drought severely threatens the sustainability of the economy and society [1]. The yearly global economic loss caused by drought is approximately 6–8 billion dollars, which is far higher than that of other natural disasters [2]. China is a large agricultural country, and drought is the main constraint factor affecting the agricultural economy [3]. Meanwhile, the intensity and frequency of extreme weather events in China are gradually increasing [4,5]. High-temperature heat wave events seriously threaten human health and social development [6]. When extreme climate events and extreme weather events occur at the same time, their impact and harm are greater than those of a single extreme weather or climate event, further threatening economic and social development. Recent studies have shown that drought and high-temperature heat waves have synergistic effects [7,8,9]. Therefore, it is of great scientific significance to carry out research on the combined risk of drought and high-temperature heat wave synergetic disasters.
At present, nearly 100 indices have been developed to characterize drought regimes [10], and the results of drought monitoring are not the same with different drought indices. According to different observation methods, the drought index can be divided into two categories: station observation and remote sensing monitoring indices. The calculation process of the drought index based on meteorological station data is relatively simple, and the data are easy to obtain; hence, this process is typically used for drought monitoring research and practical application. Of the indices available, the site-based SPEI index is a relatively mature theoretical system. Since 2015, it has been applied by many scholars to drought research in North China [11,12,13,14], and its drought recognition and reliability have been confirmed. At the same time, remote sensing technology offers wide coverage, strong real-time and high earth observation and recognition ability. Therefore, the remote sensing drought index has high temporal and spatial resolution and can quantitatively characterize planar droughts. In particular, the crop water stress index (CWSI) proposed by Jackson et al. [15] is based on the principle of heat balance, and therefore can reflect the soil moisture of certain vegetation, thus obtaining crop water shortage information [16,17,18]. Moreover, taking SPEI and soil relative humidity as inspection indicators, compared the drought monitoring capabilities of CWSI, drought severity index (DSI), normalized vegetation water index (NVSWI) and temperature vegetation drought index (TVDI), and found that CWSI performed better in the North China Plain [19]. Many studies have shown that the monitoring ability of different drought indices can vary significantly [20]. Therefore, to avoid the impact of a single drought index on the research results, this paper combines the site-based SPEI and remote sensing index CWSI to reveal the drought characteristics and risk of the North China Plain.
Hazard risk refers to the risk of disaster-causing factors and is used to characterize the risk or severity of disaster events. Generally, the risk of drought-causing factors depends on the intensity and frequency of drought occurrence [21]. Taking Ji’an City as an example, Xie [22] constructed an agricultural drought risk assessment system by using SPEI and various evaluation factors and performed a risk grade classification; Li et al. [23] improved the relative humidity index, combined several topographic factors and economic indicators, constructed the corresponding index model, and quantitatively evaluated the drought risk of Shanxi Province; Wang et al. [24] assessed drought hazard by using the MCI (meteorological drought composite index); Abdolreza et al. [25] mapped the drought risk map of Iran using risk quantification, vulnerability assessment and risk element identification. There are many studies on the risk of drought, but the synergistic risk of drought and other extreme weather events needs further study.
A high-temperature heat wave is an abnormal weather phenomenon comprising a continuous high temperature over a certain period of time that has various types of impact on human production and life [7]. High temperature that exceeds the tolerance limit of the human body may cause a variety of diseases and even threaten lives [26]. High-temperature heat waves also negatively impact crop growth and production, resulting in high-temperature forced ripening and other phenomena. What is important is that high temperature often forms a positive feedback effect with drought [7]; that is, frequent occurrences of high-temperature weather affect precipitation, accelerate evapotranspiration of soil water, further aggravate the severity of drought [27] and further enhance the risk of drought. Therefore, in this study, a combined-events risk index of drought and heat waves was constructed; it revealed the spatiotemporal variation characteristics of this type of risk, thereby providing a reference for the emergency management of regional drought and heat events while promoting the sustainable development of regional society and agriculture. Taking the combined events of drought and high temperature as an example, many studies have used various drought indexes and different definitions of high-temperature heat wave events to construct various composite indexes of drought and high temperature to evaluate changes in the severity of compound dry and hot extremes in the world or various regions [28,29,30,31,32,33]. This paper analyzed the combined risk of drought and high-temperature heat waves in summer in the North China Plain, constructed the combined risk index of drought and high-temperature heat waves and used two drought indexes to monitor drought, which can achieve the purpose of more effective research. It revealed the spatiotemporal variation characteristics of this type of risk, thereby providing a reference for the emergency management of regional drought and heat events while promoting the sustainable development of regional society and agriculture.

2. Data and Methods

2.1. Study Area

The North China Plain is located between 30°59′–41°4′N and 112°15′–122°40′E in eastern China (Figure 1). It is adjacent to the Bohai Sea and Yellow Sea in the East, Taihang Mountain and Loess Plateau in the west, Yanshan mountain range, Inner Mongolia Plateau and Northeast Plain in the North, and Dabie Mountain and Middle-lower Yangtze Plain in the South. The North China Plain covers an area of approximately 3 × 10⁵ km2. The region is dominated by plains, with Shandong hills in the east, an altitude from 0 to 2283 m and an average altitude of 111 m. The highest point in the middle is Mount Tai. The North China Plain has a temperate monsoon climate, with annual precipitation ranging from approximately 466–1420 mm. The annual seasonal precipitation varies greatly and is concentrated in July and August in summer. The annual average temperature ranges from 6 to 17 °C.

2.2. Data Sources

The evapotranspiration products provided by MODIS sensor were used to calculate the CWSI. Among them, 500 m from 2000 to 2014 (http://www.ntsg.umt.edu/project/mod16 (accessed on 15 July 2021)); 8 d resolution and 0.05° from 2015 to 2018 (https://ladsweb.modaps.eosdis.nasa.gov/search/ (accessed on 15 July 2021)); and 30 d resolution of evapotranspiration (ET) and potential evapotranspiration (PET) data originated from MOD16A2 sensor of the National Aeronautics and Space Administration (NASA). The MODIS data used in the study area are the h26v04, h26v05, h27v04, h27v05 and h28v05 images. Through ArcGIS and MRT, data splicing, projection transformation, resampling and clipping were realized. The spatial resolution was unified as 1 km, and the temporal resolution was unified as 1 month. 90 m elevation data comes from SRTM 90 m DEM Digital Elevation Database (https://srtm.csi.cgiar.org/ (accessed on 20 July 2021)).
The China Meteorological Administration takes the soil relative humidity of 0–20 cm depth as the agricultural drought classification standard [16]. Based on the availability of data, the 0–50 cm soil relative humidity data of 41 agrometeorological observation stations in the North China Plain from 2000 to 2013 were selected and synthesized from ten days to one month. The meteorological data included the monthly temperature and precipitation data of 62 meteorological stations from 2000 to 2018. Soil relative humidity data and meteorological data were obtained from the China Meteorological Data Service Center (http://data.cma.cn/data/ (accessed on 23 July 2021)).

2.3. Methodology

2.3.1. Crop Water Stress Index (CWSI)

The crop water stress index method is based on the energy balance, taking into full consideration the vegetation coverage of the underlying surface and meteorological factors such as ground wind speed and water vapor pressure [21]. The calculation formula of CWSI is:
C W S I = 1 E T P E T
In this formulation, ET and PET represent actual evapotranspiration and potential evapotranspiration, respectively. The CWSI is between 0 and 1. The larger the value is, the drier the climate is.
Referring to the agricultural drought grade standard for soil relative humidity classification adopted by the National Meteorological Administration of China and relevant documents [34,35,36], according to the linear relationship between CWSI and soil relative humidity, the month with CWSI > 0.76 was recorded as drought month.

2.3.2. Standardized Precipitation Evapotranspiration Index (SPEI)

The principle of the standardized precipitation evapotranspiration index is to normalize the cumulative probability value of the difference sequence between precipitation and potential evapotranspiration. The algorithm is similar to SPI (Standardized precipitation index). Specific calculation steps are available in relevant documents [37,38,39]; the months with SPEI < −1.0 are recorded as drought months.
The SPEI has scales such as 1, 3, 6, 12, 24 and 36 months. Periods of twelve months and longer reflect hydrological drought, and periods of 1, 3 and 6 months reflect meteorological and agricultural drought. To compare the effects of short-term drought reflected by the SPEI, the correlation analysis between the SPEI at the 1-, 3- and 6-month scales and shallow soil relative humidity (10 cm, 20 cm and 50 cm) was adopted (Table 1).

2.3.3. Identification of High-Temperature Heat Wave Events

In this paper, the standard given by the China Meteorological Administration [40] is adopted; that is, 35 °C is taken as the threshold for judging high-temperature heat waves. If the daily maximum temperature exceeds the threshold for 3 days or more, it is regarded as a high-temperature heat wave event. This standard is simple and clear, taking into account the environmental and climatic characteristics of China, and is also applicable to the North China Plain. Heat wave intensity is the cumulative sum of the D-value between the daily maximum temperature and 35 °C in a high-temperature heat wave event; heat wave frequency refers to the total number of heat wave events in the corresponding period.

2.3.4. Drought-Induced Risk Index

Drought-induced risk takes drought frequency and intensity as parameters:
R S P E I = F s × S s
R C W S I = F c × S c
R i = a × R C W S I + b × R S P E I
where R C W S I and R S P E I represent the drought-induced risk based on the CWSI and SPEI, respectively; R i indicates the common drought-induced risk based on the CWSI and SPEI; and F s , S s , F c and S c represent the frequency and intensity of drought month occurrence based on the SPEI and CWSI, respectively. a, b represents the weight coefficients of the SPEI and CWSI. a and b are calculated as follows:
As seen from Table 1, the SPEI (R = 0.64) and CWSI (R = −0.61) at the 3-month scale had the greatest correlation with the 10 cm soil relative humidity, so their correlation coefficients were selected for correction.
a = r S P E I r S P E I + r C W S I
b = r C W S I r S P E I + r C W S I
where a represents the risk weight based on the SPEI and b represents the risk weight based on the CWSI. r S P E I represents the correlation coefficient between the SPEI and 10 cm soil relative humidity at the 3-month scale, and r C W S I represents the correlation coefficient between the CWSI and 10 cm soil relative humidity. According to the above formula, a = 0.51, b = 0.49.

2.3.5. Combined-Events Risk Index of Drought and High-Temperature Heat Waves

In this formulation, R n e w represents the new combined-events risk index based on the CWSI, SPEI and high-temperature heat wave. F H and S H represent the frequency and intensity of high-temperature heat waves when summer drought occurs. High-temperature heat wave frequency refers to the number of high-temperature heat wave events within a certain period of time, and high-temperature heat wave intensity refers to the cumulative sum of the D-value between the daily maximum temperature and the high-temperature threshold (35 °C) in all high-temperature heat wave events within a certain period of time [41].
R n e w = R i + F H × S H

2.3.6. Other Methods

For the change in drought, high-temperature heat wave events and risk, the Sen trend was used to analyze the change trend; the Mann–Kendall method was used to test the significance of the change trend. For the algorithm of change trend and significance test of time series, refer to the article of Gocic et al. [42].

3. Results and Analysis

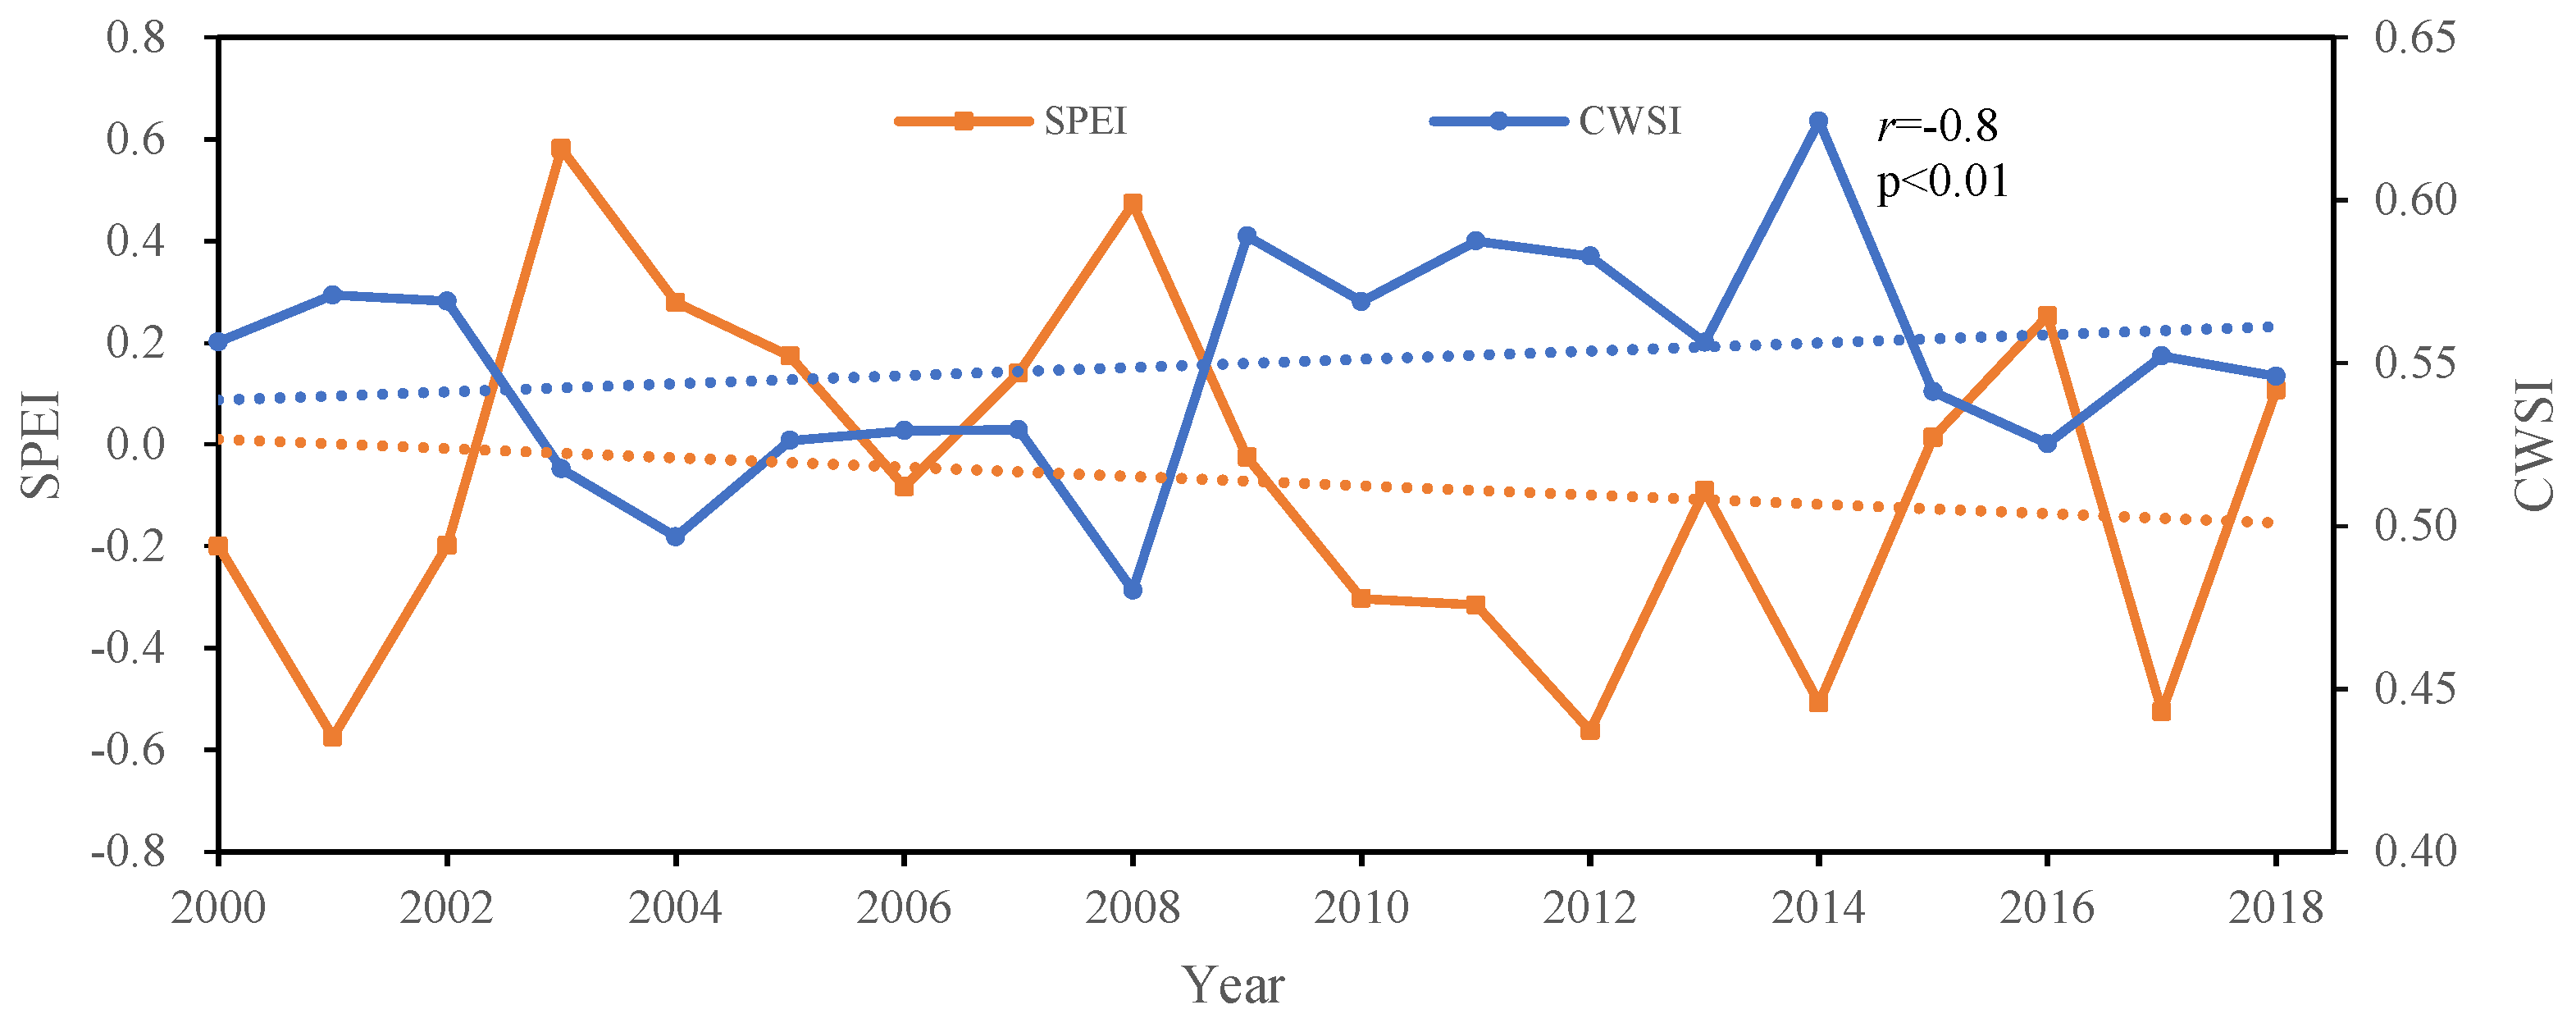
3.1. Drought Variation Characteristics Based on the SPEI and CWSI

From 2000 to 2018, the SPEI of the North China Plain in summer showed an insignificant decreasing trend, indicating an increase in the degree of drought (Figure 2). Drought mainly occurred after 2010. The summers of 2012, 2014 and 2017 were dry, and the summer of 2001 was relatively dry. The summers of 2003 (SPEI = 0.58) and 2008 (SPEI = 0.47) were relatively humid. The CWSI showed a nonsignificant increasing trend, which also indicated that drought gradually increased. The average annual CWSI in summer was 0.55, of which the CWSI in 2014 was the largest, 0.62, and the CWSI in 2008 was the smallest, 0.48. Although the results of drought monitoring by the SPEI and CWSI were different, the correlation between them was very significant (R = −0.8, p < 0.01).
In the summer of 2000–2018, parts of Henan, Shandong and Anhui Provinces in the west and south of the North China Plain became dry, and the SPEI of Henan cities, Rizhao of Shandong Province, Bozhou and Suzhou of Anhui Province and Lianyungang of Jiangsu Province showed a significant decreasing trend (p < 0.05). However, the SPEI of Hefei and Chuzhou in Anhui Province, Dongying and Binzhou in Shandong Province and Beijing in the north increased significantly (p < 0.05) and became obviously wet (Figure 3a).
Based on the CWSI, the south of the study area was relatively humid (Figure 3b), the north was relatively dry and the northwest was the most prominent in the middle and south of Hebei. In addition, the CWSI in Henan Province in the west and Anhui and Jiangsu Provinces in the southeast of the study area increased significantly (p < 0.05) and became dry, while the CWSI in Hebei and Shandong Provinces in the northeast showed a significant decreasing trend.
It can be seen that the SPEI and CWSI have certain differences in the spatial variation of drought monitoring. Therefore, using two drought indices can effectively avoid the limitation of a single index in drought monitoring.

3.2. Temporal and Spatial Variation Characteristics of High-Temperature Heat Waves

In the summer of 2000–2018, the frequency (Figure 4a) and intensity (Figure 4b) of high-temperature heat waves in the North China Plain showed a trend of no significant increase, with rates of 0.28 times/10 year and 1.6 °C /10 year, respectively. The average frequency of the high-temperature heat waves was 1.25 times/year, and the average heat wave intensity was 9.62 °C /year. The summer of 2008 saw the lowest frequency and intensity of heat wave events. The frequency of heat wave events was the highest in 2018, with 2.36 times in the study area, and the intensity (14.65 °C) was also higher than that in most years.
In the summer of 2000–2018, the frequency of high-temperature heat wave events in the North China Plain was higher in the west than in the east and higher in the south than in the north (Figure 5a), and the increase in the west was obvious (Figure 5c). Among the 62 meteorological stations, the frequency of high-temperature heats waves at Zhengzhou, Xinxiang, Heze and Dangshan stations increased significantly (p < 0.05), while the frequency of heat waves at Shijiazhuang station showed a significant decreasing trend.
The intensity of high-temperature heat wave events was relatively large in the south (Figure 5b), and the increased areas were concentrated in Henan, Shandong and other places in the west and south (Figure 5d). Among them, the growth rate of Zhengzhou was 1.56 °C /year, and that of Xinxiang was also more than 0.8 °C /year; both these growth rates were significant (p < 0.05).

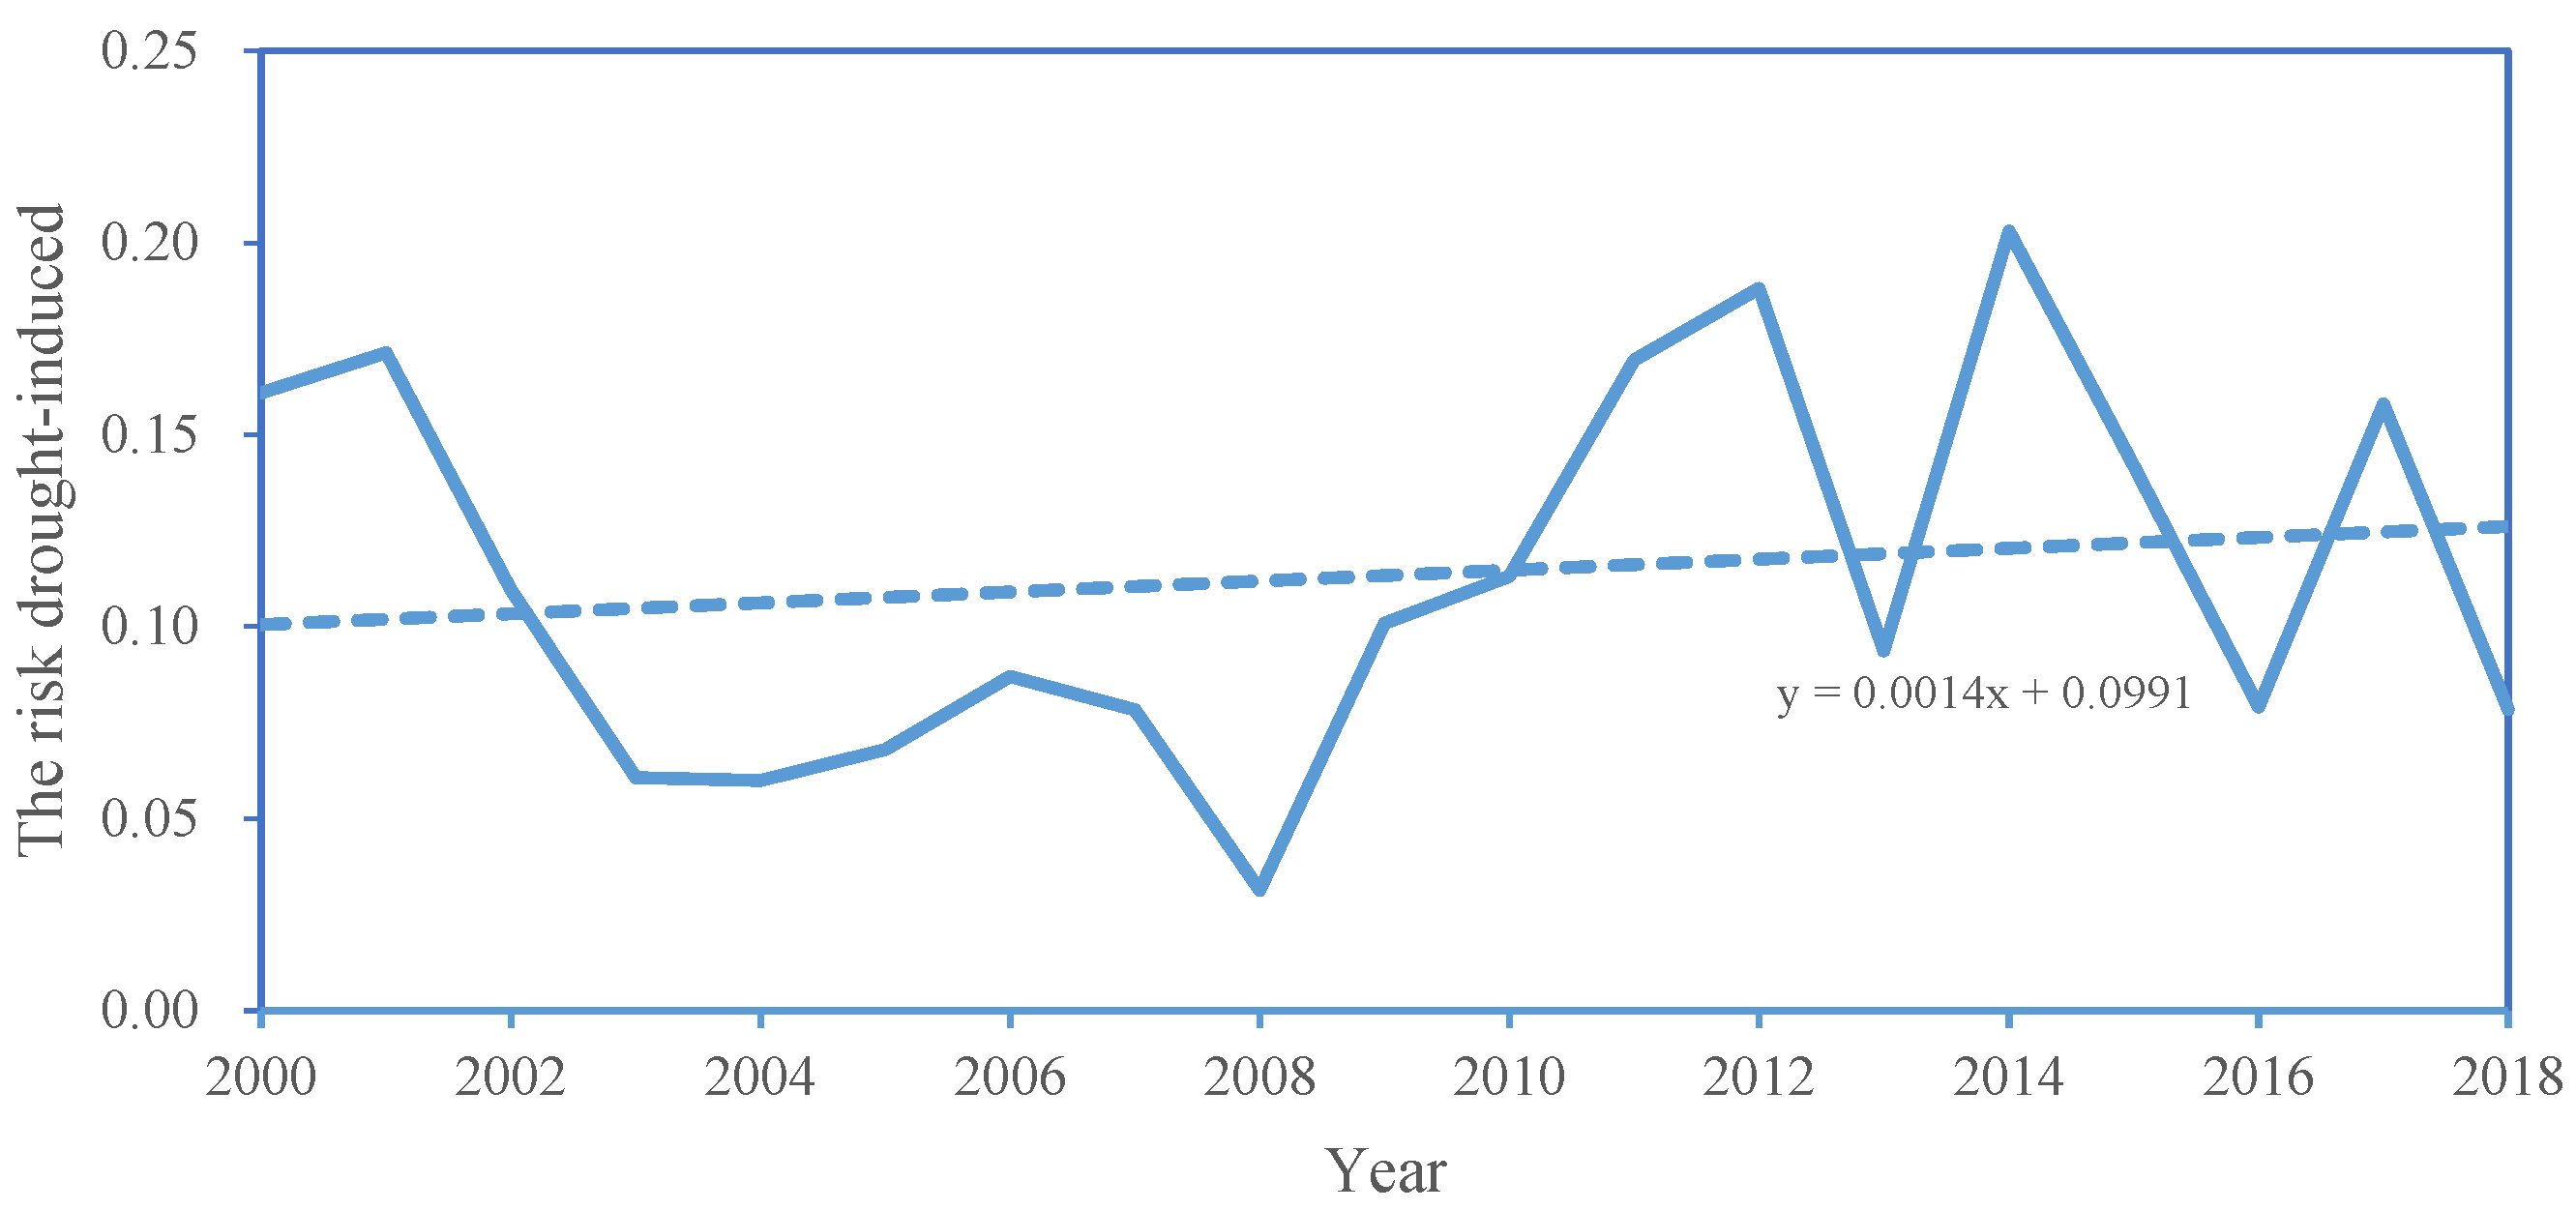
3.3. Spatial and Temporal Variation Characteristics of Drought-Induced Risk

In summer, the drought-induced risk in the North China Plain was generally low (Figure 6), with an average of 0.11 for many years. The risk in 2008 was the lowest, at only 0.03; and the risk in 2014 was the highest, at 0.20. From 2000 to 2018, the drought-induced risk showed an insignificant increasing trend (0.01/10 year), of which the decreasing trend (−0.14/10 year) was obvious from 2000 to 2008, but showed an increasing trend (0.03/10 year) from 2008 to 2018, with obvious fluctuations.
The changes in SPEI and CWSI both indicated that the drought in the North China Plain is gradually increasing, which was different from the situation in the other three seasons. The drought intensity in North China Plain was the highest in spring, but it weakened insignificantly; the drought intensity in autumn was also large, and it also gradually increased, with a rapid increase rate; the drought intensity in winter was low, but its increase rate was the fastest. In contrast, the increase rate of drought in summer was smaller. The drought-induced risk in summer were mainly low and slightly low (Figure 7a). The area proportion of low risk is 37.23%; the area proportion of slightly low risk accounts for 24%; medium risk accounts for 21.03%; and slightly high risk and high risk account for a relatively small proportion, which are 15.64% and 2.1%, respectively. However, the risk change was characterized by a decrease in the north and an increase in the south. There were increasing trends in southern Shandong, eastern Henan and northern Anhui and Jiangsu Provinces (Figure 7b). The significantly increasing risks were in Xuchang, Pingdingshan and Zhoukou in Henan Province and Suzhou and Bozhou in Anhui Province, while the decreasing risks were concentrated in Beijing.

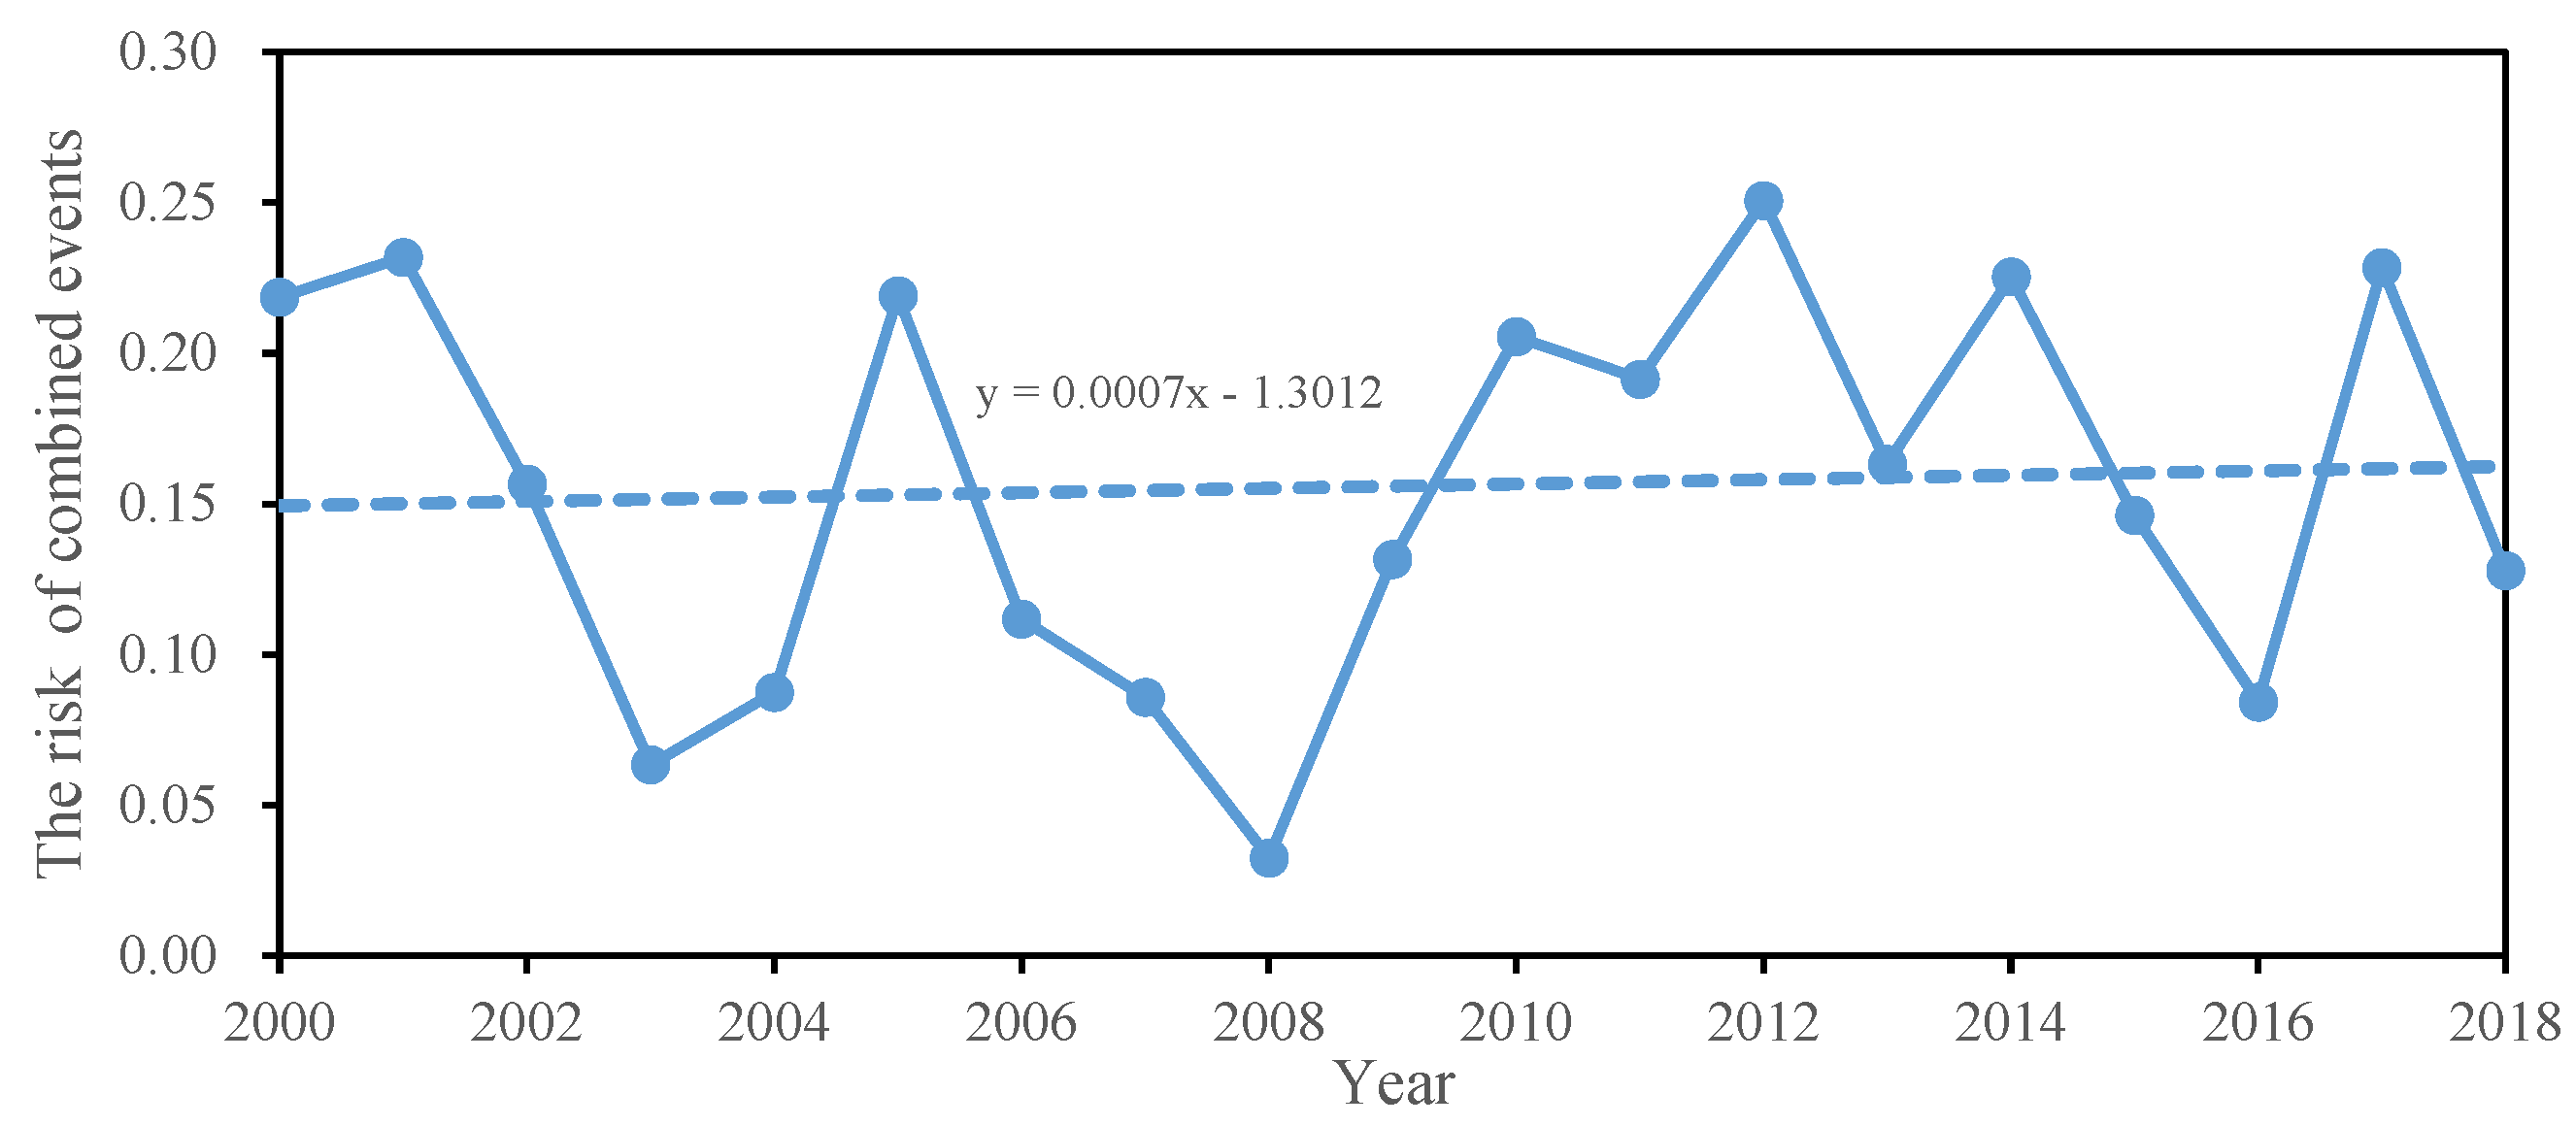
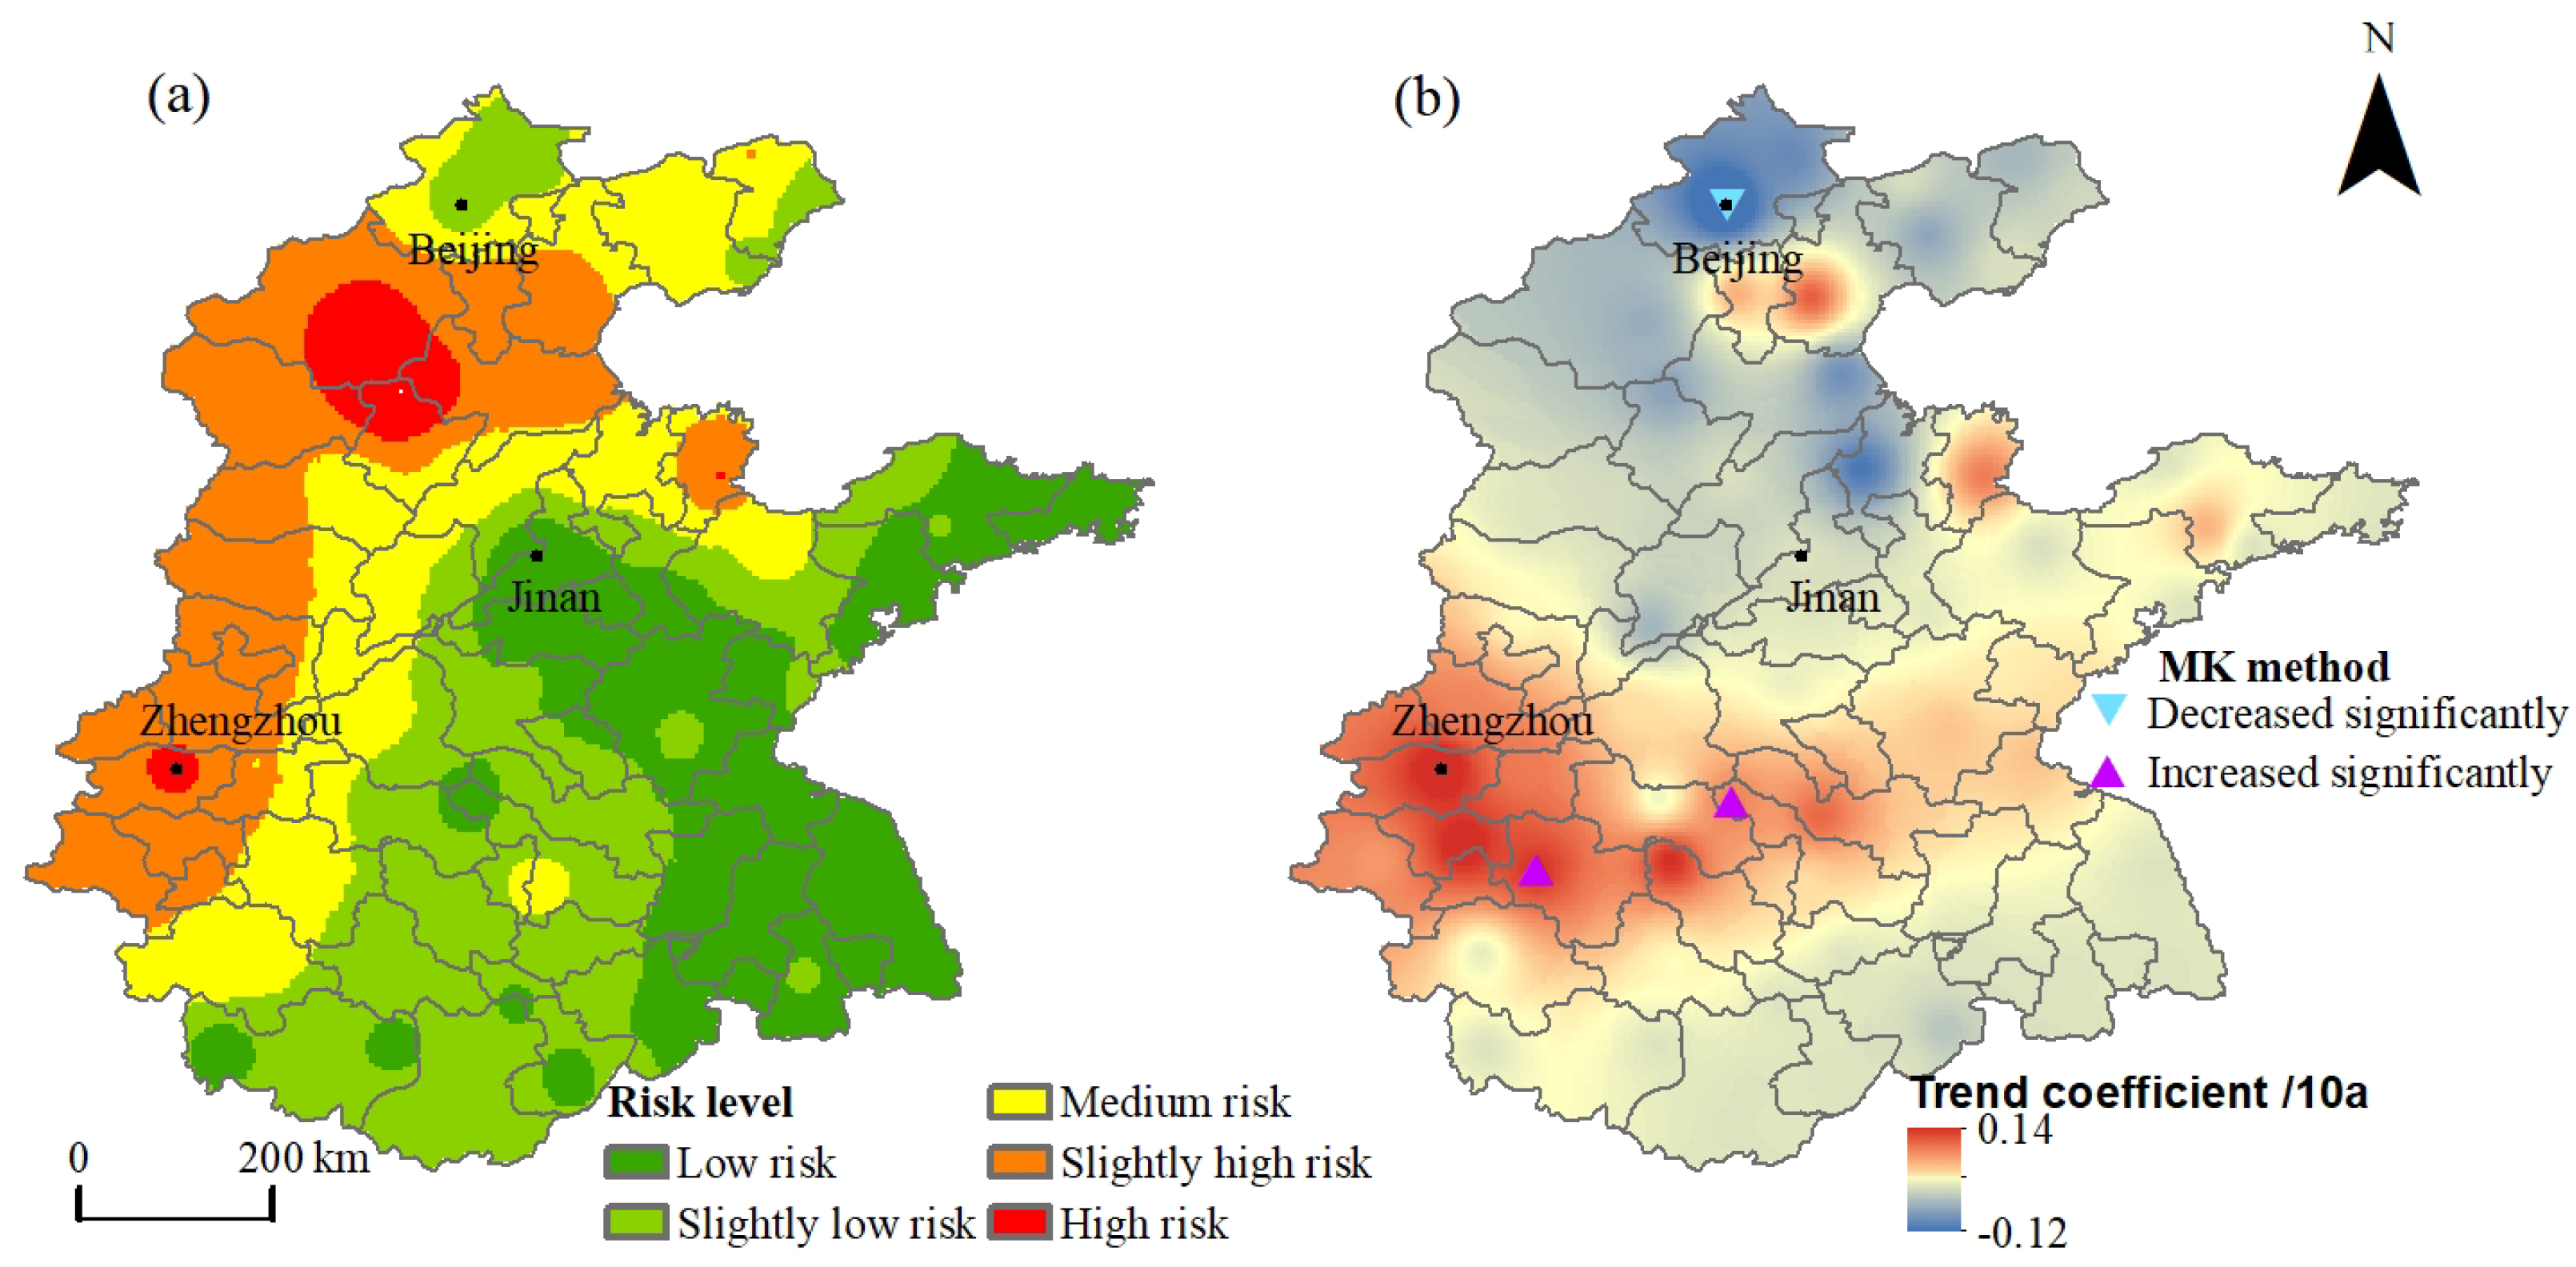
3.4. Spatiotemporal Variation in Combined-Events Risk of Drought and High-Temperature Heat Waves

Hao et al. [28] used a standardization procedure to calculate the Standardized Dry and Hot Index (SDHI), and showed a significant temporal increase in the average severity of the hottest month in northeastern China. Wu et al. [31] used the drought index as SPI of 3-month and 6-month time scales, and hot days are defined as days with a maximum temperature higher than the 90th percentile of the daily maximum temperature. Finally, a decrease in compound extremes was found in Central China. While this paper used the intensity and frequency of drought and high-temperature heat waves to measure the combined risk of them, it revealed an overall insignificant increasing trend in the North China Plain in summer, with an increasing rate of approximately 0.01/10 year (Figure 8). The average value of the risk in the study area was 0.16. The risk in 2003 and 2008 was the lowest, at 0.06 and 0.03, respectively. The highest risk was 0.25 in 2012. The other years fluctuated in an alternating manner, with increase–decrease–increase.
The variation trend of the combined-events risk of drought and high-temperature heat waves was basically consistent with that of drought, which indicated that when drought and high-temperature heat waves occur simultaneously, the threat of drought plays a leading role in the combined events. However, the impact of high-temperature heat waves should not be ignored. For example, the North China Plain experienced large threats of drought, ranked by severity, in the summers of 2014, 2012, and 2001. However, after considering the high-temperature heat wave events, the combined-events risk in 2012 was the highest, followed by 2001 and 2014. For example, the drought-induced risk in the summer of 2005 was low (0.07), but the frequency and intensity of high-temperature heat waves in this period were high, so the combined-events risk of drought and high-temperature heat waves was high.
In terms of spatial distribution, the risk difference of combined events in the North China Plain was obvious, and the risk gradually decreased from northwest to southeast (Figure 9a). The high risk was mainly distributed in the central part of Hebei Province, accounting for about 3% (Figure 10a). The slightly high risk was distributed in the middle, South, North and East of Hebei and Henan Provinces, accounting for about 22%. The eastern part of Hebei Province, the border cities in the west and north of Shandong Province and most areas of Zhoukou and Zhumadian in the southeast of Henan Province were at medium risk. The area with medium risk accounts for 21% of the total area. In addition to the small proportion of high risk, the areas of other levels are not much different.
In terms of spatial variation, the combined-events risk caused by drought and high-temperature heat waves was consistent with the drought-induced risk. High-value areas with increased risk were distributed in the southwest, while the decreasing areas were all in the North. The combined-events risk of drought and high-temperature heat waves in Henan cities in the southwestern North China Plain increased (Figure 9b), and the maximum rate was 0.14/10 year. This is because, in the past 19 years, the changes of SPEI and CWSI both indicated that the drought in Henan Province increased significantly, and the frequency and intensity of high-temperature heat waves in this area also increased. In addition, the risks in Anhui, Northern Jiangsu and Southern Shandong were significantly increased, while the risk in the northern region represented by Beijing showed a decreasing trend. This is because the drought in Beijing has weakened significantly, while the high-temperature heat wave events have not changed significantly. Among the many meteorological stations (Figure 10b), 29.51% of them showed an increasing trend of combined risk, and the meteorological stations with significantly increased risk accounted for 1.63%; 29.51% of the meteorological stations showed a decreasing trend in the risk of combined events, and 3.28% showed a significant decrease; however, 40.98% of the meteorological stations had no obvious change.
Compared with the change area of drought-induced events, the increased area of combined events was slightly smaller and more concentrated in eastern Henan Province and Northern Anhui Province. The reduced area was larger and more widely distributed in most areas in northern Shandong Province. Compared with the variation range of drought-induced events risk (−0.08–0.09/year), the variation range of combined events was larger, which was (−0.12–0.14)/year.

4. Discussion

Hao et al. [28] developed a standardization procedure to calculate the standardized temperature index (STI) and SPEI, and showed a significant temporal increase in the average severity of the hottest month in Northeastern China. Wu et al. [31] used the drought index as SPI of 3-month and 6-month time scales, and hot days are defined as days with a maximum temperature higher than the 90th percentile of the daily maximum temperature. Finally, a decrease in compound extremes was found in Central China. While this paper used the intensity and frequency of drought and high-temperature heat waves to measure the combined risk of them, it revealed an overall insignificant increasing trend in the North China Plain in summer.
Both the SPEI and CWSI in the summer of 2014 indicated that the drought intensity in this period was relatively high, and the drought-induced risk was the highest. However, the frequency and intensity of high-temperature heat waves in the same period were relatively low, so the combined-events risk of drought and high-temperature heat waves was not the highest. The drought-induced risk in the summer of 2012 was higher, second only to that in 2014. However, the high-temperature heat wave events in this period were stronger than those in most years, resulting in the highest risk of combined events caused of drought and high-temperature heat waves. In the summer of 2013, the frequency and intensity of high-temperature heat waves were the highest, but the high-temperature heat wave events were mostly concentrated in the non-dry months in summer, so the combined effect of drought and high-temperature was weak, and the risk was low. It can be seen that a single drought or high-temperature event cannot completely determine the level of combined-events risk. When both are intense and concurrent, a higher risk results. However, most of the previous studies focused on a single drought or high-temperature heat wave event, often ignoring the synergistic effect of drought and high temperature. Therefore, it is necessary to carry out a study on the risk of combined events.
The drought-induced risk in the west and southwest of the North China Plain was slightly low or medium. When considering the high-temperature heat wave, the combined-events risk level increased. The cities in Henan Province changed from medium-risk to high-risk or slightly high-risk, and the slightly low-risk areas changed to medium-risk. This may be related to the topography of the west; it is adjacent to the Taihang Mountains, far away from the sea, less affected by the monsoon, with a higher average temperature and prone to high temperatures and heat wave events. Therefore, the combined-events risk of drought and high-temperature heat waves is higher. Compared with the reduced risk of drought induction, the combined-events risk in the north has a larger area because its northern latitude is relatively high, its average temperature is low and it is close to the sea, and therefore greatly affected by the summer monsoon; the cooling effect is obvious, thus inhibiting the occurrence of high-temperature heat wave events.
The combined-events risk of drought and high-temperature heat waves in the North China Plain is related to large-scale circulation [43]. The El Niño phenomenon strengthens the anticyclone in the Western Pacific and subtropical anticyclone, thus providing favorable conditions for the occurrence and maintenance of heat waves [44]. In addition, there is extensive air subsidence, frequent high temperatures and little precipitation in the control area of the Western Pacific subtropical ridge; these factors all lead to drought and high-temperature heat waves [45]. The high risk of combined events in Zhengzhou is due to the prevailing downdraft influenced by the long-term ridge of high pressure, the relatively dry air that inhibits the formation of clouds and fog and the amount of direct sun that reaches the ground; these factors all lead to radiant heating; thus, the intensity of drought is relatively large, and the high-temperature heat wave event is strong.

5. Conclusions

(1) The variation trends of the CWSI and SPEI showed that the drought in the North China Plain became more severe in summer. Spatially, there was a significant increasing trend of drought in Henan, Anhui and Jiangsu Provinces. In summer, the SPEI of Henan, Rizhao of Shandong Province, Bozhou and Suzhou of Anhui Province, and Lianyungang of Jiangsu Province decreased significantly (p < 0.05). The CWSI increased significantly in Henan, Anhui and Jiangsu Provinces (p < 0.05) but decreased significantly in Hebei and Shandong Provinces in the Northeast (p < 0.05). (2) The frequency (1.25 times/year) and intensity (9.62 °C /year) of summer high-temperature heat wave events in the North China Plain showed a gradually increasing trend, with growth rates of 0.28 times/10 year and 1.6 °C/10 year, respectively. The frequency of high-temperature heat wave events was higher in the West than in the East and higher in the South than in the North. The intensity of high-temperature heat wave events in the west was significantly increased. The increase in heat wave intensity was concentrated in Henan, Shandong and other places in the West and South, and the intensity of high-temperature heat waves in Zhengzhou and Xinxiang increased significantly (p < 0.05). (3) The slightly high and high drought-induced risk in summer were mainly distributed in Hebei Province and Tianjin in the North, and the change of risk decreased in the North and increased in the South, in Southern Shandong, Eastern Henan and Northern Anhui and Jiangsu. Among them, the risk in Xuchang, Pingdingshan and Zhoukou in Henan Province and Suzhou and Bozhou in Anhui Province increased significantly (p < 0.05), while the risk in Beijing decreased significantly.

Author Contributions

Conceptualization, B.L.; data curation, T.W. and Y.Z.; formal analysis, T.W.; funding acquisition, B.L.; investigation, T.W.; methodology, T.W. and L.L.; project administration, B.L.; resources, B.L.; software, Y.Z.; visualization, T.W.; supervision, B.L., L.L. and Y.C.; validation, T.W. and Y.C.; writing—original draft preparation, T.W. and Y.Z.; writing—review and editing, B.L., L.L. and Y.C. All authors have read and agreed to the published version of the manuscript.

Funding

This research was funded by Shandong Provincial Natural Science Foundation [ZR2021YQ28, ZR2020MD117].

Data Availability Statement

No new data were created or analyzed in this study. Data sharing is not applicable to this article.

Conflicts of Interest

The authors declare no conflict of interest.

References

  1. Wang, J.S.; Li, Y.H.; Wang, R.Y.; Feng, J.Y.; Zhao, Y.X. Preliminary Analysis on the Demand and Review of Progress in the Field of Meteorological Drought Research. J. Arid. Meteorol. 2012, 30, 497–508. [Google Scholar]
  2. Yao, Y.B.; Zhang, Q.; Li, Y.H.; Wang, Y.; Wang, J.S. Drought Risk Assessment Technological Progresses and Problems. Resour. Sci. 2013, 35, 1884–1897. [Google Scholar]
  3. Xu, J.W.; Ju, H.; Liu, Q.; Yang, J.Y. Variation of Drought and Regional Response to Climate Change in Huang-Huai-Hai Plain. Acta Ecol. Sin. 2014, 34, 460–470. [Google Scholar]
  4. Ma, Z.G.; Hua, L.J.; Ren, X.B. The Extreme Dry/Wet Events in Northern China During Recent 100 Years. Acta Geogr. Sin. 2003, 58, 69–74. [Google Scholar]
  5. Zhang, X.Z.; Zheng, J.Y.; Hao, Z.X. Climate Change Assessments for the Main Economic Zones of China During Recent Decades. Prog. Geogr. 2020, 39, 1609–1618. [Google Scholar] [CrossRef]
  6. Baldwin, J.W.; Dessy, J.B.; Vecchi, G.; Oppenheimer, M. Temporally Compound Heat Wave Events and Global Warming: An Emerging Hazard. Earth’s Future 2019, 7, 411–427. [Google Scholar] [CrossRef]
  7. Sun, Y.J.; Liu, X.F.; Ren, Z.Y.; Duan, Y.F. Spatiotemporal Changes of Droughts and Heatwaves on the Loess Plateau During 1960–2016. Prog. Geogr. 2020, 39, 591–601. [Google Scholar] [CrossRef]
  8. Wang, C.; Li, Z.; Chen, Y.; Li, Y.; Liu, X.G.; Hou, Y.F.; Wang, X.C.; Kulaixi, Z.; Sun, F. Increased Compound Droughts and Heatwaves in A Double Pack in Central Asia. Remote. Sens. 2022, 14, 2959. [Google Scholar] [CrossRef]
  9. Shi, Z.T.; Jia, G.S.; Zhou, Y.Y.; Xu, X.Y.; Jiang, Y. Amplified Intensity and Duration of Heatwaves by Concurrent Droughts in China. Atmos. Res. 2021, 261, 105743. [Google Scholar] [CrossRef]
  10. Heim, J.; Richard, R. A Review of Twentieth-Century Drought Indices Used in the United States. Bull. Am. Meteorol. Soc. 2002, 83, 1149–1165. [Google Scholar] [CrossRef]
  11. Ma, S.Q.; Zhang, B.; Zhang, J.Q.; Pan, Z.H.; Wu, Q.H.; Huang, H.; Yang, M. Applicability Analysis of Standardized Precipitation Evapotranspiration Index in North China Plain. Chin. J. Agric. Resour. Reg. Plan. 2020, 41, 235–245. [Google Scholar]
  12. Yang, X.Y.; Li, D.L. Temporal and Spatial Evolution Characteristics of Strong Drought Events in North and Northeast China. Arid. Land Geogr. 2019, 42, 810–821. [Google Scholar]
  13. Wei, X.Y.; Hu, Q.; Ma, X.Q.; Zheng, S.R.; Tang, X.N.; Zhang, Y.Y.; Pan, X.B.; He, Q.J. Temporal-Spatial Variation Characteristics of Drought in Summer Maize Growing Season in North China Plain Based on SPEI. J. Arid. Meteorol. 2018, 36, 554–560. [Google Scholar]
  14. Yang, S.Y.; Meng, D.; Li, X.J.; Wu, X.L. Multi-Scale Responses of Vegetation Changes Relative to the SPEI Meteorological Drought Index in North China in 2001–2014. Acta Ecol. Sin. 2018, 38, 1028–1039. [Google Scholar]
  15. Jackson, R.D.; Idso, S.B.; Reginato, R.J.; Pinter, P.J. Canopy Temperature as A Crop Water Stress Indicator. Water Resour. Res. 1981, 17, 1133–1138. [Google Scholar] [CrossRef]
  16. Wang, Z.; Wang, F.; Zhang, Y. Spatio-temporal Distribution Characteristics and Influencing Factors of Drought in Anhui Province Based on CWSI. J. Nat. Resour. 2018, 33, 853–866. [Google Scholar]
  17. Wang, Y.J.; Wang, S.D.; Zeng, H.J.; Cai, M.Y.; Song, W.L. Drought Characteristic in the Weihe River Basin Based on Water Shortage Index of Crops. Arid. Zone Res. 2014, 31, 118–124. [Google Scholar]
  18. Yu, Y. Comparison of Drought Monitoring and Study on Spatial and Temporal Characteristics of Drought in Guanzhong Area Based on CWSI and TVDI; Shaanxi Normal University: Shaanxi, China, 2015; pp. 1–69. [Google Scholar]
  19. Wu, T.X.; Li, B.F.; Guo, H.; Wang, Y.Q.; Zhu, Y.B.; Lian, L.S. Analysis of Drought Variation Characteristics in North China Plain Based on Optimized Remote Sensing Drought Index. Acta Ecol. Sin. 2021, 43, 1–14. [Google Scholar] [CrossRef]
  20. Liu, X.F.; Fu, B.J. Drought Impacts on Crop Yield: Progress, Challenges and Prospect. Acta Geogr. Sin. 2021, 76, 2632–2646. [Google Scholar]
  21. Li, H.Y.; Zhang, X.Y.; Wang, J.; Zheng, G.F.; Wang, S.Y. Analysis of Drought Disasters-Causing Factors in Ningxia Based on CI Index. Plateau Meteorol. 2014, 33, 995–1001. [Google Scholar]
  22. Xie, G.D. Agricultural Drought Risk Assessment and Regionalization in Ji’an City; Nanchang University: Nanchang, China, 2020; pp. 1–101. [Google Scholar]
  23. Li, N.; Huo, Z.G.; Qian, J.X.; Zhou, X.Y.; Shi, Y.X. Risk Analysis and Zoning of Drought Disaster in Shanxi. Chin. J. Agric. Resour. Reg. Plan. 2021, 42, 100–107. [Google Scholar]
  24. Wang, X.L.; Zhang, C.Y.; Hou, X.Y. Spatial-Temporal Characteristics and Hazard Risks of Meteorological Drought in Circum-Bohai-Sea region from 1961 to 2017. Acta Ecol. Sin. 2019, 39, 4647–4659. [Google Scholar]
  25. Ansari, A.A.; Aghighi, H.; Lopez-Baeza, E. Drought Risk Evaluation in Iran by Using Geospatial Technologies. Remote. Sens. 2022, 14, 3096. [Google Scholar] [CrossRef]
  26. He, S.F.; Dai, E.F.; Ge, Q.S.; Wu, S.H.; Li, M.Q. Pre-estimation of Spatiotemporal Pattern of Extreme Heat Hazard in China. J. Nat. Disasters 2010, 19, 91–97. [Google Scholar]
  27. Deng, Z.Y.; Wen, X.H.; Huang, T.; Zhang, H.; Xi, L.Z.; Xu, J.F.; Dong, A.X. Relationship and Difference Between Drought and High Temperature Heat Waves. Plateau Meteorol. 2009, 28, 702–709. [Google Scholar]
  28. Hao, Z.C.; Hao, F.H.; Singh, V.P.; Zhang, X. Changes in the Severity of Compound Drought and Hot Extremes over Global Landareas. Environ. Res. Lett. 2018, 13, 124022. [Google Scholar] [CrossRef]
  29. Miralles, D.G.; Gentine, P.; Seneviratne, S.I.; Teuling, A.J. Land–atmospheric Feedbacks during Droughts and Heatwaves: State of the Science and Current Challenges. Ann. N. Y. Acad. Sci. 2019, 1436, 19–35. [Google Scholar] [CrossRef]
  30. Sutanto, S.G.; Sutanto, C.; Napoli, C.D.; Andrea, M.D. Heatwaves, Droughts, and Fires: Exploring Compound and Cascading Dry Hazards at the Pan-European Scale. Environ. Int. 2020, 134, 105276. [Google Scholar] [CrossRef]
  31. Tavakol, A.; Rahmani, V.; Harrington, J. Probability of Compound Climate Extremes in a Changing Climate: A Copula-based Study of Hot, Dry, and Windy Events in the Central United States. Environ. Res. Lett. 2020, 15, 104058. [Google Scholar] [CrossRef]
  32. Weber, T.; Bowyer, P.; Rechid, D.; Pfeifer, S.; Raffaele, F.; Remedio, A.R.; Teichmann, C.; Jacob, D. Analysis of Compound Climate Extremes and Exposed Population in Africa under Two Different Emission Scenarios. Earth’s Future 2020, 8, 1–19. [Google Scholar] [CrossRef]
  33. Wu, X.Y.; Hao, Z.C.; Hao, F.H.; Li, C.; Zhang, X. Spatial and Temporal Variations of Compound Droughts and Hot Extremes in China. Atmosphere 2019, 10, 95. [Google Scholar] [CrossRef]
  34. Vicente-Serrano, S.M.; Beguería, S.; López-Moreno, J.I. A Multiscalar Drought Index Sensitive to Global Warming: The Standardized Precipitation Evapotranspiration Index. J. Clim. 2010, 23, 1696–1718. [Google Scholar] [CrossRef]
  35. Wang, C.Z.; Mao, L.X.; Lv, H.Q.; Chen, J.; Yu, Z.R. Remote Sensing Monitoring of Regional Drought Based on Crop Water Shortage Index; Chinese Meteorological Society: Guangzhou, China, 2007; pp. 1183–1192. [Google Scholar]
  36. Ma, Z.C.; Sun, P.; Zhang, Q.; Hu, Y.Q.; Jiang, W. Characterization and Evaluation of MODIS-Derived Crop Water Stress Index (CWSI) for Monitoring Drought from 2001 to 2017 over Inner Mongolia. Sustainability 2021, 13, 916. [Google Scholar] [CrossRef]
  37. Zhang, Y.J.; Wang, C.Y.; Zhang, J.Q. Analysis of the Spatial and Temporal Characteristics of Drought in the North China Plain Based on Standardized Precipitation Evapotranspiration Index. Acta Ecol. Sin. 2015, 35, 7097–7107. [Google Scholar]
  38. Zhou, D.; Zhang, B.; Luo, J.; Zhang, C.L.; An, M.L.; Wang, D. SPEI-Based Intensity Characteristics and Cause Analysis of Drought in North China During Recent 50 Years. J. Nat. Disasters 2014, 23, 192–202. [Google Scholar]
  39. Li, W.G.; Hou, M.T.; Chen, H.L.; Chen, X.M. Study on Drought Trend in South China Based on Standardized Precipitation Evapotranspiration Index. J. Nat. Disasters 2012, 21, 84–90. [Google Scholar]
  40. Xu, J.F.; Deng, Z.Y.; Chen, M. A Summary of Studying on Characteristics of High Temperature and Heat Wave Damage in China. J. Arid. Meteorol. 2009, 27, 163–167. [Google Scholar]
  41. Wang, W.; Hu, Y.J.; Xu, C.Y. Spatial-Temporal Variations of Heat Waves in the Huaihe River Basin from 1961 to 2018. Sci. Geogr. Sin. 2021, 41, 911–921. [Google Scholar]
  42. Gocic, M.; Trajkovic, S. Analysis of Changes in Meteorological Variables Using Mann-Kendall and Sen’s Slope Estimator Statistical Tests in Serbia. Glob. Planet. Chang. 2013, 100, 172–182. [Google Scholar] [CrossRef]
  43. Bian, Y.J.; Sun, P.; Zhang, Q.; Luo, M.; Liu, R.L. Amplify of Non-Stationary Drought to Heatwave Duration and Intensity in Eastern China: Spatiotemporal Pattern and Causes. J. Hydrol. 2022, 612, 128154. [Google Scholar] [CrossRef]
  44. Luo, M.; Ngar-Cheung, L. Amplifying Effect of ENSO on Heat Waves in China. Clim. Dyn. 2019, 52, 3277–3289. [Google Scholar] [CrossRef]
  45. Liu, Q.; Zhou, T.J.; Mao, H.T.; Fu, C.B. Decadal Variations in the Relationship between the Western Pacific Subtropical High and Summer Heat Waves in East China. J. Clim. 2019, 32, 1627–1640. [Google Scholar] [CrossRef]
Figure 1. Location and station distribution of the North China Plain (elevation data comes from SRTM 90 m DEM Digital Elevation Database).
Remotesensing 14 04588 g001
Figure 2. Temporal changes in the SPEI (3-month scale) and CWSI in the North China Plain from 2000 to 2018 (r represents the correlation between SPEI and CWSI, and p is used to evaluate the significance of the correlation described above).
Remotesensing 14 04588 g002
Figure 3. Spatial changes in the SPEI (a) and CWSI (b) in summer on the North China Plain from 2000 to 2018.
Remotesensing 14 04588 g003
Figure 4. Temporal changes in the frequency (a) and intensity (b) of high-temperature heat waves in summer from 2000 to 2018.
Remotesensing 14 04588 g004
Figure 5. Changes in spatial distribution (a,b) and change trends (c,d) of the frequency and intensity of high-temperature heat waves on the North China Plain in summer from 2000 to 2018.
Remotesensing 14 04588 g005
Figure 6. Change trend of drought-induced risk on the North China Plain in summer from 2000 to 2018.
Remotesensing 14 04588 g006
Figure 7. Distribution (a) and spatial change (b) of drought-induced risk on the North China Plain in summer from 2000 to 2018.
Remotesensing 14 04588 g007
Figure 8. Temporal variation in the combined-events risk of drought and high-temperature heat waves on the North China Plain in summer from 2000 to 2018.
Remotesensing 14 04588 g008
Figure 9. Distribution (a) and change (b) of combined-events risk of drought and high-temperature heat waves in the North China Plain in summer from 2000 to 2018.
Remotesensing 14 04588 g009
Figure 10. Proportion chart of different risk levels of combined-events risk (a) and increased and decreased risk (b).
Remotesensing 14 04588 g010
Table 1. The correlation (r) between soil relative humidity at different depths (10 cm, 20 cm, 50 cm) and SPEI (1, 3, 6 months) and CWSI.
rSPEI-1SPEI-3SPEI-6CWSI
10 cm0.590.640.48−0.61
20 cm0.480.590.45−0.55
50 cm0.300.490.43−0.51
Publisher’s Note: MDPI stays neutral with regard to jurisdictional claims in published maps and institutional affiliations.

