


Climatology of Dust Aerosols over the Jianghan Plain Revealed with Space-Borne Instruments and MERRA-2 Reanalysis Data during 2006–2021

1
School of Electronic Information, Wuhan University, Wuhan 430072, China
2
School of Remote Sensing and Information Engineering, Wuhan University, Wuhan 430072, China
3
State Observatory for Atmospheric Remote Sensing, Wuhan 430072, China
*
Author to whom correspondence should be addressed.
†
These authors contributed equally to this work.
Remote Sens. 2022, 14(17), 4414; https://doi.org/10.3390/rs14174414
Submission received: 23 July 2022
/
Revised: 18 August 2022
/
Accepted: 2 September 2022
/
Published: 5 September 2022
(This article belongs to the Special Issue Remote Sensing of Aerosol, Cloud and Their Interactions)
Abstract
:In recent years, climate change and the intervention of anthropogenic activities have altered the seasonal features of Asian dust storms. This may also cause seasonal variations (including dust occurrence frequency and optical/microphysical properties) in dust aerosols transported to downstream regions. The Jianghan Plain is dramatically influenced by multiple dust sources due to its geographical location in central China. In this study, we focused on the climatology of dust aerosols over the Jianghan Plain based on the 15-year (2006–2021) continuous space-borne observations of the Cloud-Aerosol Lidar with Orthogonal Polarization (CALIOP) as well as Modern-Era Retrospective Analysis for Research and Applications version 2 (MERRA-2) reanalysis data. A typical dust event that intrudes the Jianghan Plain was studied in detail. According to the statistical results, dust aerosols frequently intrude into the Jianghan Plain in spring and winter, with occurrence frequencies (under cloud free condition hereafter) exceeding 0.70 and higher altitudes of 4–6 km. The dust occurrence frequency declined to approximately 0.40 in autumn and nearly zero in summer, while the dust plumes were generally located at lower altitudes of 1–3 km. The dust plumes observed in the Jianghan Plain were simultaneously linked to the Taklimakan Desert and Gobi Desert in spring and mainly originated from the Taklimakan Desert in winter and autumn. The dust particles were mainly distributed below 4-km altitude, with the largest dust extinction coefficients and dust mass concentrations in spring. In all seasons, the particle depolarization ratios are 0.1–0.2 below 4-km altitude, suggesting a possible mix with local anthropogenic aerosols. The mean dust column mass concentrations in spring showed an evident declining trend from 210 µg m−2 in 2006 to 100 µg m−2 in 2021 in the Jianghan Plain, attributed to the reduced dust activity in the source regions of Asian dust.
1. Introduction
Dust is one of the major aerosol types in the atmosphere and plays a crucial role in the climate system. Airborne dust aerosols directly scatter and absorb solar radiation, resulting in the alteration of the Earth’s radiation budget (direct effect) [1,2]. Dust particles can also serve as cloud condensation nuclei (CCN) and ice nucleating particles (INP) to initiate cloud formation and further interact with clouds, which is known as the indirect effect [3,4,5,6]. Additionally, their absorbing property causes the heating of the atmosphere and thus accelerates the evaporation of clouds; this process is the so-called semidirect effect [7].
It is estimated that approximately 1000–2150 Tg dust aerosols are emitted into the atmosphere annually [8]. The majority of dust aerosols spread in the atmosphere of the northern hemisphere, forming a dust belt linking the west coast of North Africa, the Arabian Peninsula, and central and southern Asia [9,10]. The source region of Asian dust, primarily encompassing the Taklimakan and Gobi deserts, is considered one of the most important dust contributors and accounts for approximately 40% of the total dust emissions to the atmosphere [11]. The dust storms in East Asia usually show a distinct seasonal variation. Spring is the most active season for dust storms owing to the low cover of vegetation and favorable meteorological conditions triggered by frequent Mongolian cyclones, while dust storms are rare in summer because the summer monsoon over the Jianghan Plain region is always easterly and southeasterly and thus inhibits the southeastward transport of dust particles from northwest China. However, climate change and the intervention of anthropogenic activities may alter the seasonal features of Asian dust storms, including not only the dust occurrence frequency, but also the intensity, optical and microphysical properties, and vertical distribution of dust plumes and dust particles [12,13]. Therefore, it is of great importance to revisit the climatology of dust aerosols in this area, especially for the past one or two decades.
The Jianghan Plain is located in central China (around the latitude of 30°N, the longitude of 113°E) 2000 km from the Taklimakan and Gobi deserts. Long-range transported dust plumes frequently intrude the Jianghan Plain in spring and winter every year [14]. Some of their optical and microphysical properties were found to be changed, due to the combined influences of the dense water vapor resources from surrounding rivers and lakes and local particle pollution [3,4]. In addition, the westerlies of the northern hemisphere are divided into northern and southern branches by the natural barrier of the Tibetan Plateau and converge at the location of the Jianghan Plain. The dust aerosols can be brought from northwest China (Taklimakan and Gobi deserts) and south Asia (Thar desert) simultaneously. Wang et al. reported a transport mechanism of dust aerosols over South Asia to the Tibetan Plateau under typical circulation conditions [15]. They found that the downward energy transport of the upper-level jet stream causes the low-level jet stream, resulting in the south-north secondary circulation along with an intensive updraft that further elevates the dust particles from the Thar Desert to a much higher altitude, which may further influence the weather and climate of downstream areas [16]. The differences in seasonal variations and characteristics of dust, which are potentially impacted by multiple dust sources, may change the cloud properties and precipitation above the Jianghan Plain; however, relevant statistical studies are still scarce, and attention to the dust plumes over this region is insufficient [17], since previous studies mainly focus on the regions north of 30°N latitude over mainland China [18]. Therefore, it is necessary to conduct a comprehensive investigation of long-term observations of dust aerosols on the Jianghan Plain, especially their vertical distributions, which could trigger ice formation of mixed-phase and cirrus clouds due to the strong temperature sensitivity of dust particles to be activated as ice-nucleating particles (INPs) [3,4,6].
The space-borne lidar carried on the Cloud-Aerosol Lidar and Infrared Pathfinder Satellite Observation (CALIPSO) satellite that was launched in 2006 provides a unique opportunity to investigate the climatology of dust aerosols regionally and globally, owing to the successful operations since then [19]. Together with other observation instruments and data (e.g., surface environment monitoring data, space-borne passive remote sensing, and reanalysis data), a comprehensive picture of dust aerosols over the Jianghan Plain can be drawn. In this study, we focused on the dust aerosols over the Jianghan Plain observed over the past 15 years (from 2006–2021) to correspond with the operation period of CALIPSO. We first briefly introduce the instruments, data, and methodology employed. Then, a typical case study is given followed by the 15-year statistics of dust occurrence frequency and vertical-resolved physical properties of dust particles. In the last section, a summary and conclusions are presented.
2. Data and Methodology
2.1. Study Area
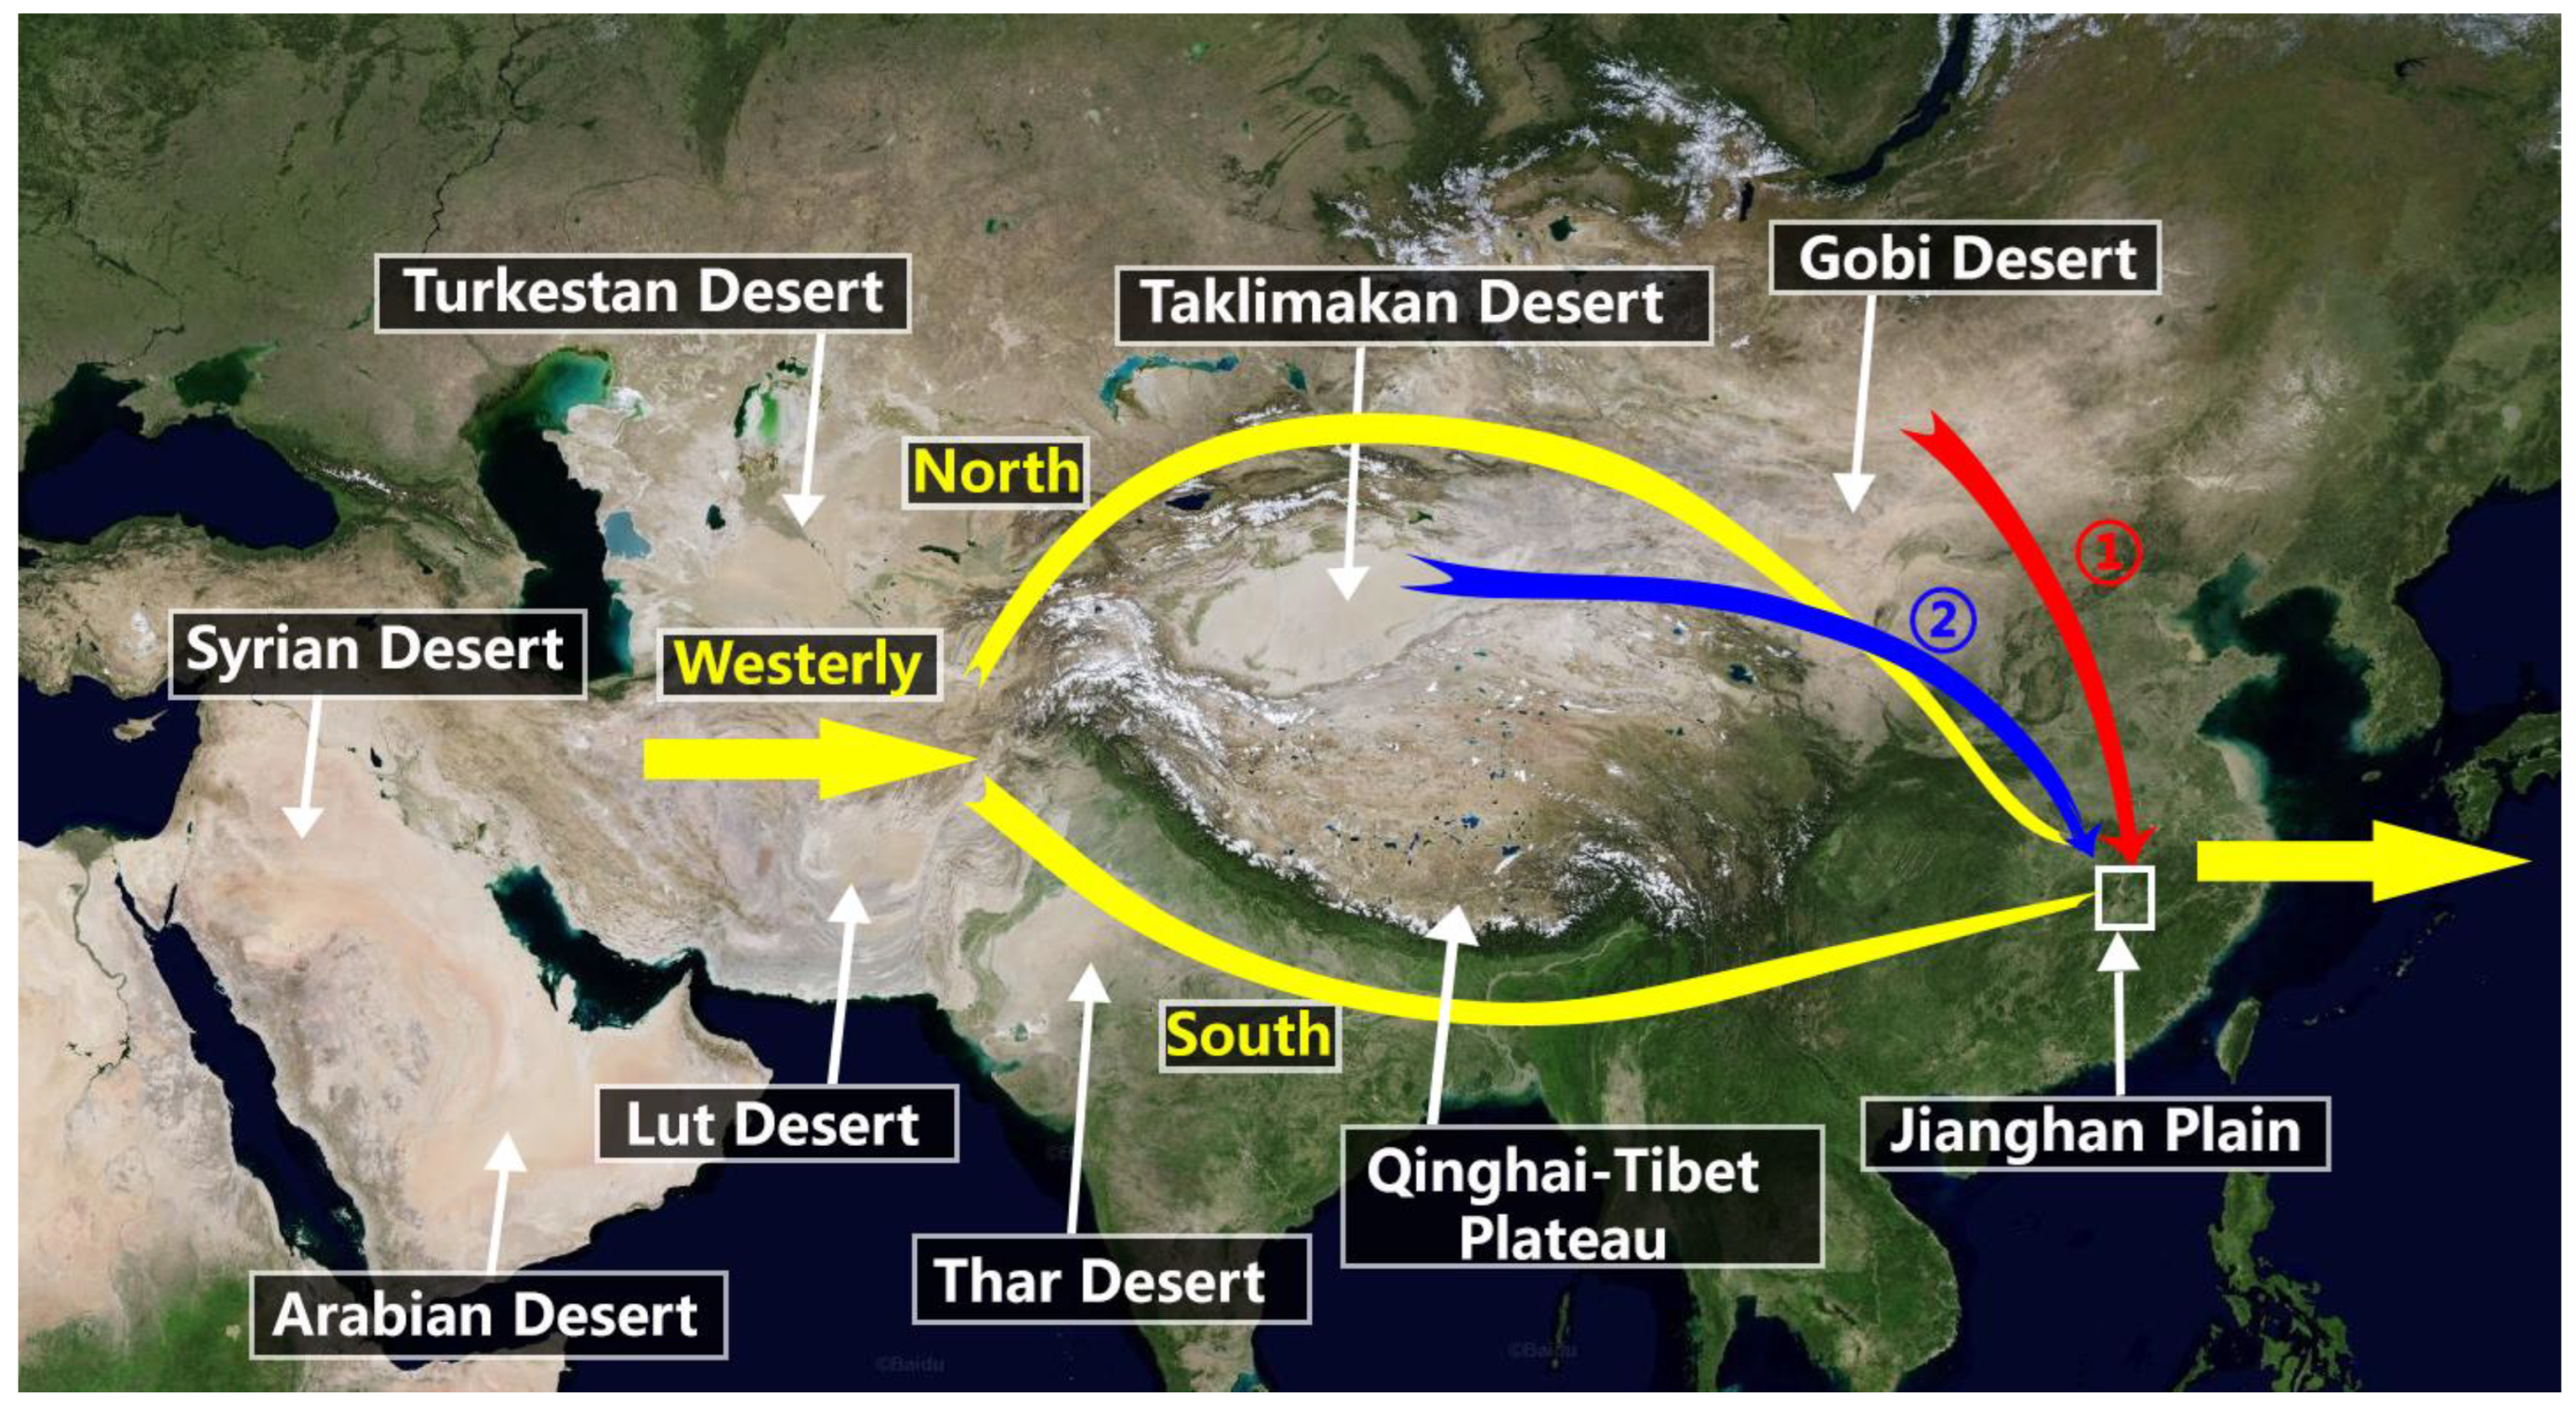
The Jianghan Plain, has an area of 46,000 square kilometers and an average elevation of 27 m above sea level, is one of the lowest plains in China, lying between 29°26′–31°37′ N and 111°14′–114°36′ E as seen in Figure 1. Potential dust sources that contribute to the plain are the Taklimakan and Gobi deserts over northwest China (Figure 1). The prevailing westerly is divided into two branches, i.e., the southern and northern branches, by the Qinghai-Tibet Plateau, and then converges at a latitude of approximately 30°N, which is the Jianghan Plain. These two branches possibly carry dust particles from different dust sources to the Jianghan Plain. Dust from the Taklimakan region can be transported eastward to North Korea, South Korea, and Japan, and even across the Pacific Ocean to North America driven by prevailing westerly winds [20,21].
Water vapor supply is abundant in the Jianghan Plain, which is favorable for cloud formation. Dust particles transported to the Jianghan Plain play a crucial role in cloud glaciation (either for mixed-phase clouds or for cirrus clouds) by acting as ice-nucleating particles [3,4,5,6,17,22,23]. The ice-nucleating activity of dust particles is closely related to their vertical distribution (i.e., corresponding to temperature for heterogeneous nucleation) as well as their optical and microphysical properties. For example, the dust extinction coefficient determines the number concentration of dust INPs [24,25]; particle depolarization ratio indicates the level of aging process, which may influence the onset temperature of dust-related ice formation [26]. Based on ground-based polarization lidar observations in this region during 2010–2012 [14], local emissions of anthropogenic aerosols may cause an external mix with dust particles, which can also alter the observed optical and microphysical properties of dust aerosols. However, the emissions of anthropogenic aerosols have undergone a significant decline over the past ten years as observed in Wuhan (a mega city in Jianghan Plain); thus, their impact on dust optical and microphysical properties as well as ice-nucleating activity may also vary year by year [27,28]. This possible influence on ice formation in clouds will further alter the precipitation feature over this region. In addition, it is also of great interest to determine the response of dust occurrence frequency over the Jianghan Plain to the general decreasing tendency of dust outbreaks in Asian dust sources over the past decade [29]. Therefore, it is necessary to conduct a comprehensive investigation of long-term observations of dust aerosols on the Jianghan Plain.
2.2. CALIOP Space-Borne Lidar
The Cloud-Aerosol Lidar with Orthogonal Polarization (CALIOP) instrument is a collaborative NASA and CNES project, which is carried on the Cloud-Aerosol Lidar and Infrared Pathfinder Satellite Observation (CALIPSO) launched in 2006. CALIOP measures the total and polarized components of backscattered light and provides height-resolved information on the detailed vertical structure of the atmosphere [30]. The nearest CALIOP orbits pass close to the Jianghan Plain at approximately 0200 local time (LT) and 1400 LT.
The CALIOP level-2 product at version 4.20 and version 4.21 divide the detected layers into characterized features, which are named clear air, cloud, aerosol, stratospheric, surface, subsurface, totally attenuated, or invalid feature types [31]. The classification algorithm is based on the linear volume depolarization ratio and the attenuated backscatter signal along the satellite footprint to classify the feature types into aerosol subtypes, named clean marine, dust, clean continental, polluted continental, polluted dust, and smoke [32,33].
CALIOP level-2 Vertical Feature Mask (VFM) and 5-km Aerosol Profile (5 km-APro) products were used to identify dust aerosols. The VFM product was originally sampled with a horizontal resolution of 333 m and a vertical resolution of 30 m, and the 5 km-APro resampled product had a horizontal resolution of 5 km and a vertical resolution of 30 m. In this study, 911 nighttime CALIPSO trajectories passing over the Jianghan Plain from June 2006 to March 2021 were used to characterize the vertical distribution of dust optical and microphysical properties. The detailed descriptions of data retrievals can be found in He et al. [4,5]
2.3. MERRA-2 Aerosol Reanalysis Data
Modern-Era Retrospective Analysis for Research and Applications version 2 (MERRA-2) is a long-term atmospheric reanalysis since 1980 produced by combining NASA’s Goddard Earth Observing System Model, Version 5 (GEOS-5) with a 3D variational data assimilation (3D-Var) algorithm to assimilate large-scale atmospheric datasets [34,35]. In this study, the MERRA-2 monthly dust column mass concentration at a horizontal resolution of 0.5° × 0.625° from tavgM_2d_aer_Nx was used to study the long-term variation in the Jianghan Plain. In addition, atmospheric composition (2D) maps provided by the MERRA-2 visualization tool were used to obtain the distributions of the dust column mass concentration and dust mass flux every 12 h in a case study.
2.4. Method of Dust Case Selection
The dust occurrence frequency (DOF, which is considered under cloud-free condition hereafter) is used for the selection of dust cases, as defined by Liu et al. [36]:
is the number of dust profiles in which dust and polluted dust were identified at each segment of 15 consecutive profiles of the CALIPSO vertical feature mask (VFM). is the number of profiles without the presence of one or more identified cloud layers. [37].
In addition, the Cloud-Aerosol-Discrimination (CAD) algorithm is used to classify the cloud or aerosol layers. CAD algorithm provides a score that represents the confidence level for the classification [38]. The higher the absolute value of the CAD score, the more reliable the feature classification. In this study, a CAD score of >70 was used to classify clouds and <−70 was used to classify dust aerosols [39]. In addition, only nighttime profiles were used to obtain a better signal-to-noise ratio [40].
2.5. Retrieval of Dust Optical Properties
The mass concentration of dust can be derived from the dust extinction coefficient using the POLIPHON method [24], as seen in Figure 2. The particle depolarization ratio (PDR) can be given by:
The particle backscatter coefficient can be separated into a dust component and a non-dust component :
Thus, Equation (2) can be rearranged as:
The formula is valid under the condition that . = 0 is set if , while is set if [24]. PDR values of 30–35% are typical for dust particles from Asian deserts [24,41,42]. Therefore, the characteristic particle depolarization ratio for the dust component is set to = 0.31, and that for the non-dust component is set to = 0.05 [43].
The extinction coefficients of the dust component can be obtained as follows [44]:
is the lidar ratio of dust, which has been extensively measured worldwide. The typical value is 45 ± 10 sr in the Asian region [45,46,47,48]. In this study, we set = 45 sr.
Finally, the mass concentration of dust () is given by:
where is the dust particle density, with [49]. is the dust volume concentration, which is defined as:
where is the extinction-to-volume conversion factor. It can be estimated by the Aerosol Robotic Network (AERONET) in a long-term measurement database of Asian dust [50]. is different in each area, and Mm was obtained for the Jianghan Plain [34]. is the extinction coefficient of dust as a function of height z.
We calculated , and at each vertical bin if dust was identified. Then, its seasonal and annual statistics can be calculated based on the long-term measurements by CALIPSO from June 2006 to March 2021.
3. Results
3.1. Seasonal Variation
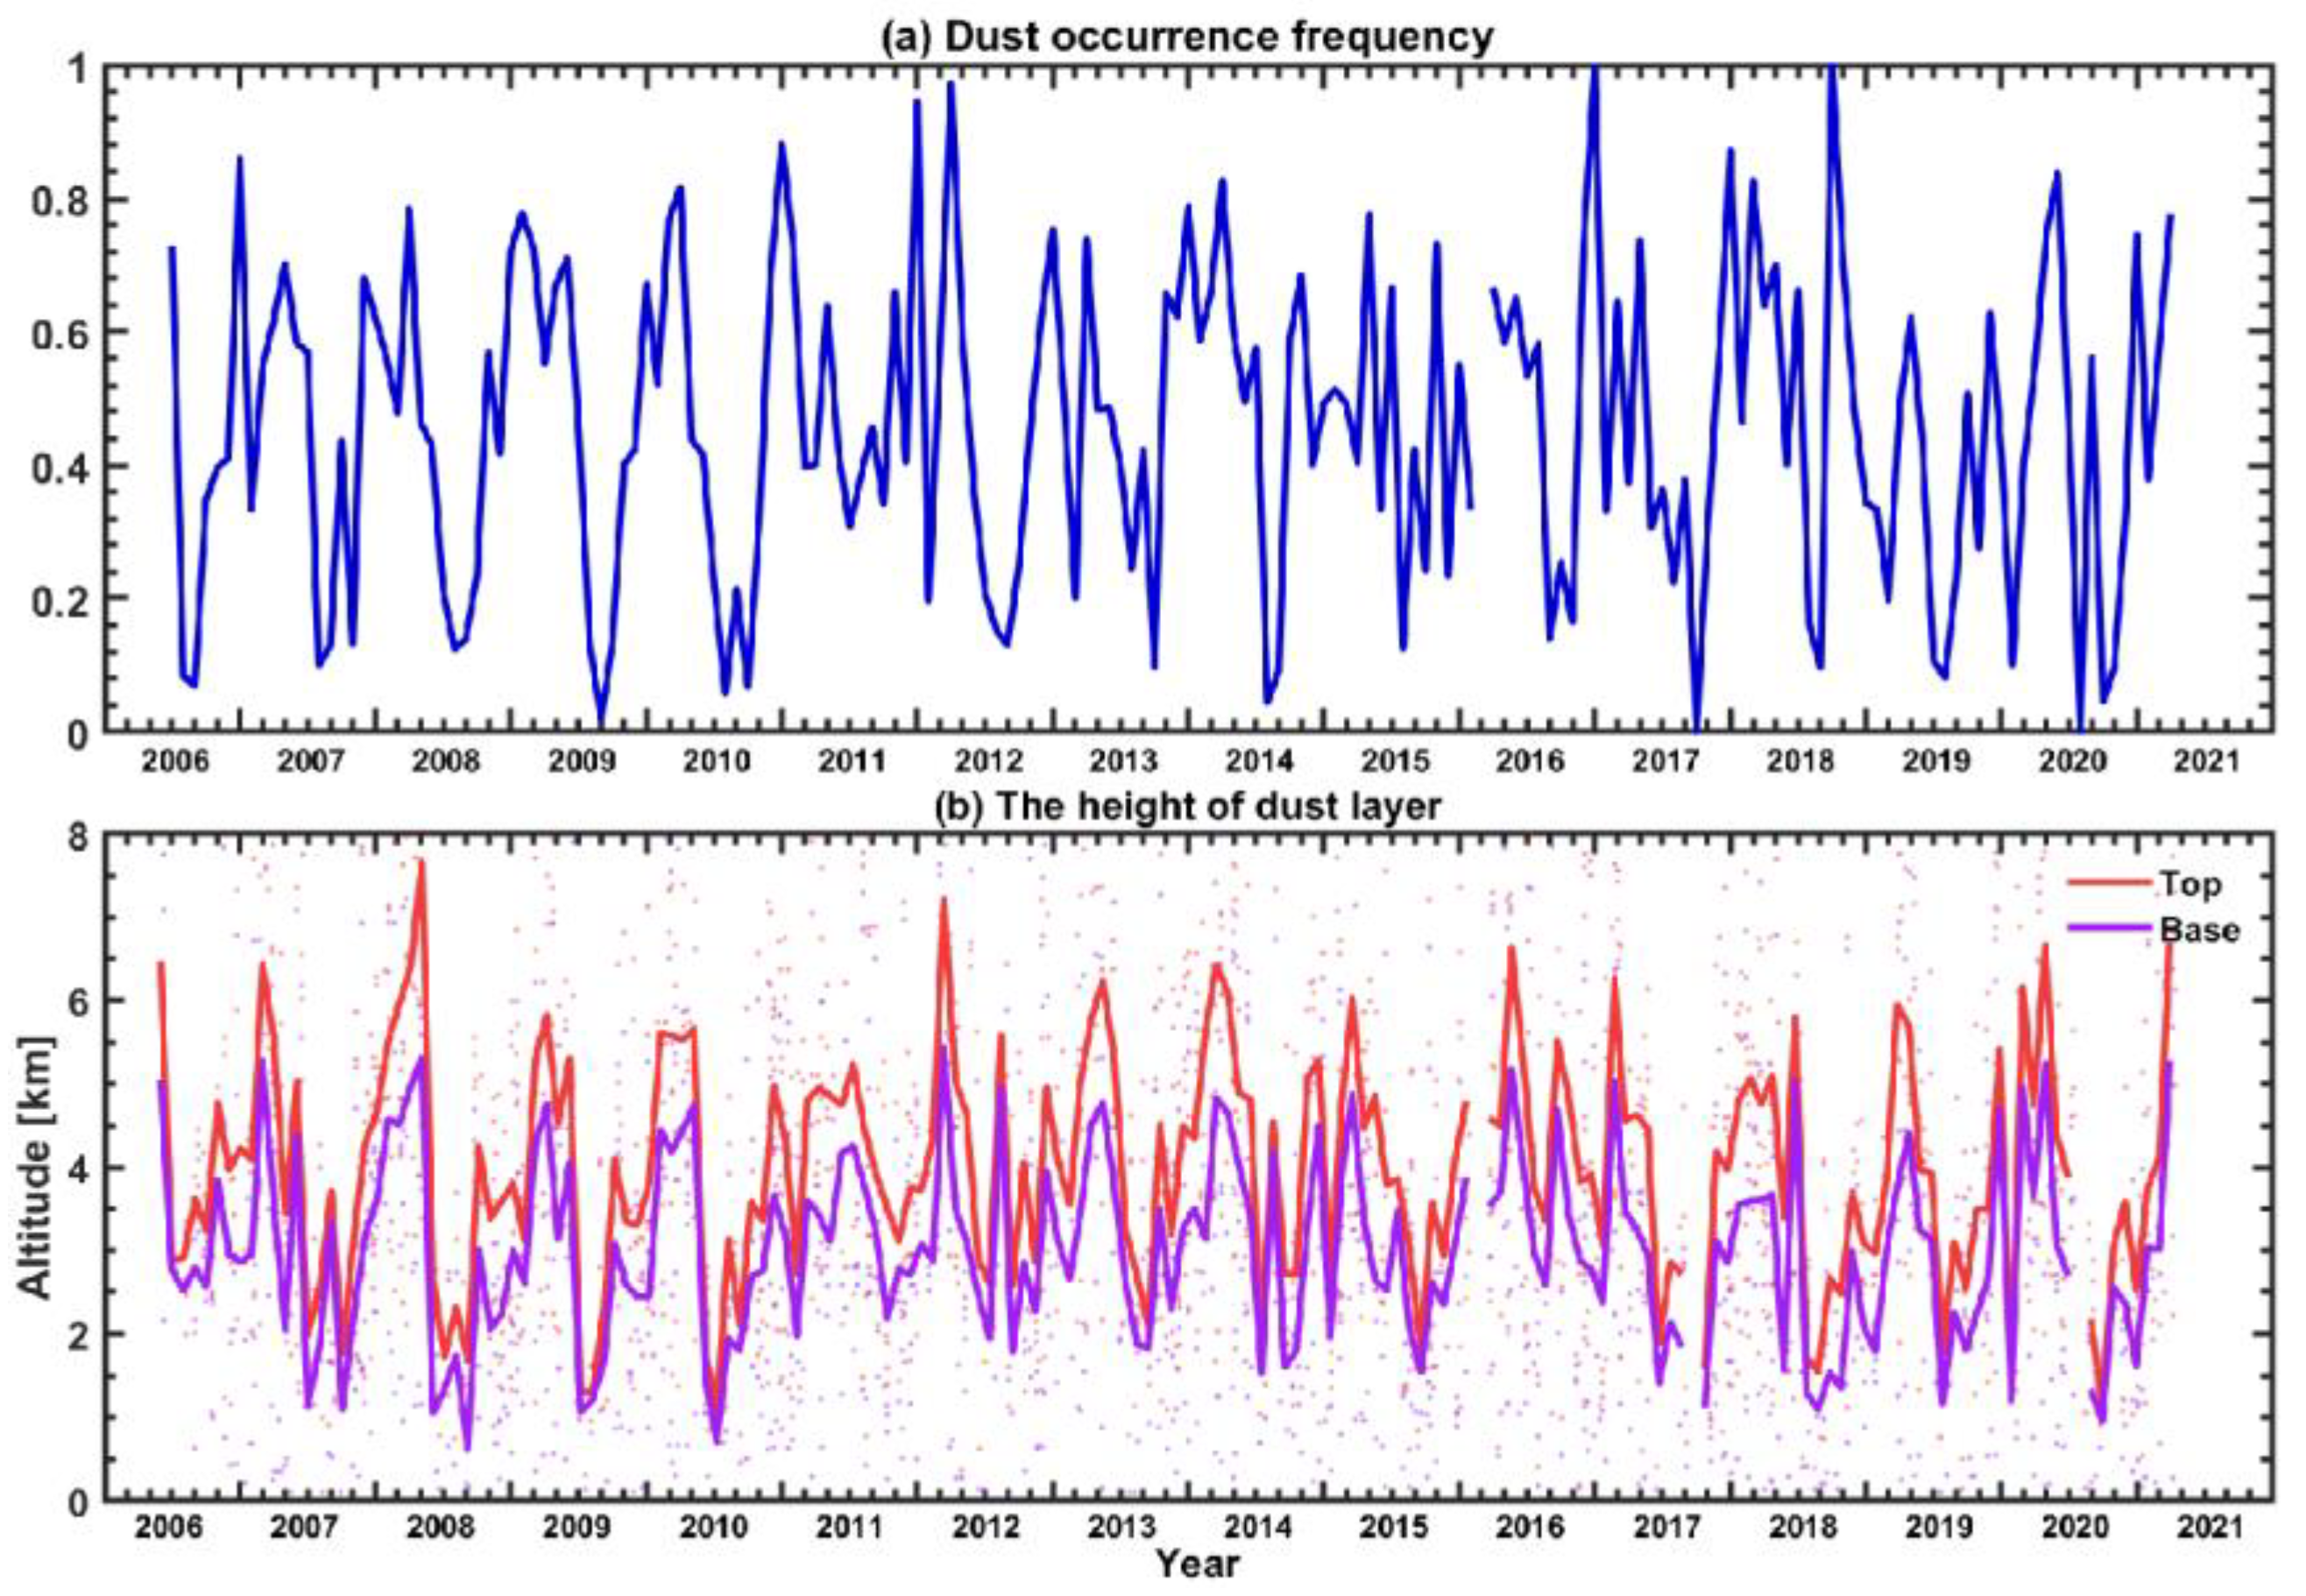
Figure 3a shows the dust occurrence frequencies over the Jianghan Plain from June 2006 to March 2021. Evident seasonal variations in dust occurrence frequency can be observed. Dust aerosols frequently intrude into the Jianghan Plain in spring and winter, with occurrence frequencies exceeding 0.70, while the dust occurrence frequency declines to approximately 0.40 in autumn. In summer, dust plumes rarely occur over the Jianghan Plain (the minima of the curves shown in Figure 3a). This seasonal variation is almost consistent with the observations by He and Yi [14], in which the dust occurrence frequencies over Wuhan (located in the eastern Jianghan Plain) were observed to be 0.68 in winter and 0.73 in spring. Additionally, the vertical distributions of dust layers also have strong seasonal patterns as seen in Figure 3b. The dust layers in spring and winter tend to arrive at 4.0–6.0 km with larger geometrical layer thicknesses (usually >1.0 km) while those in summer and autumn generally arrive at 1.0–3.0 km and the thicknesses were <0.5 km.
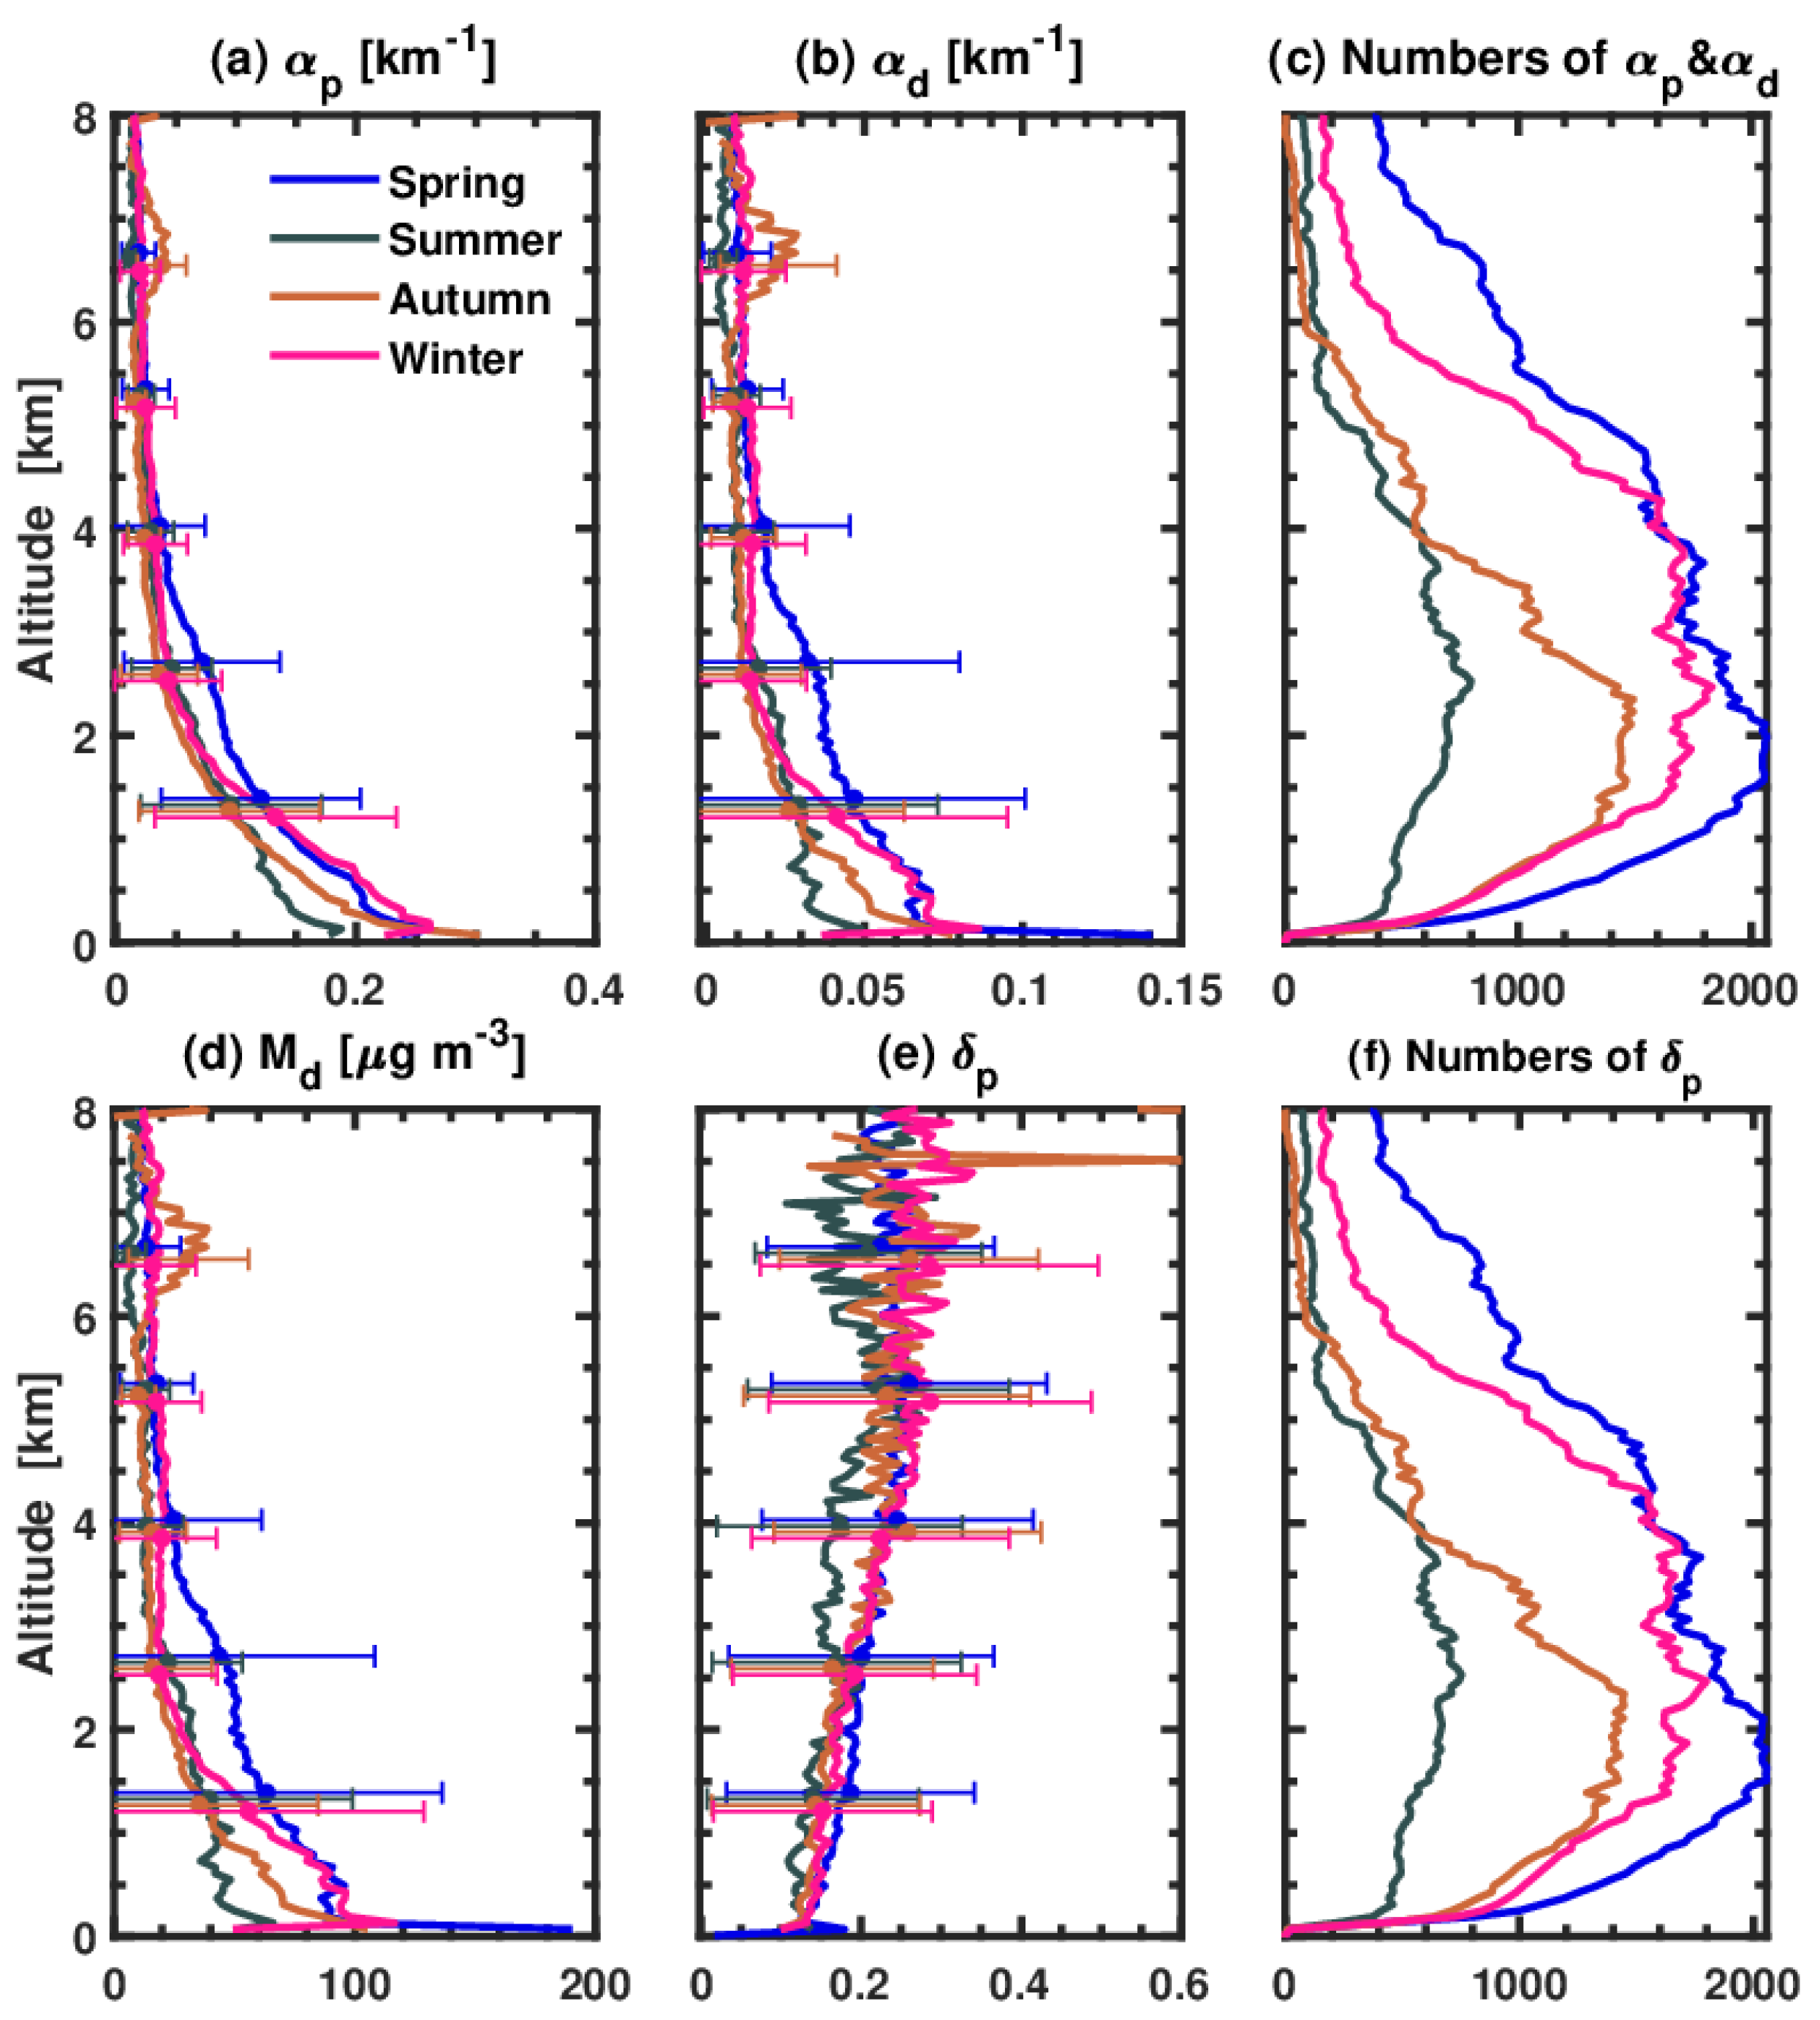
To investigate the vertical distribution of the optical properties of dust layers, the seasonal-average aerosol extinction coefficient , dust extinction coefficient , dust mass concentration , and particle depolarization ratio were analyzed with the POLIPHON method using the CALIOP level-2 aerosol profile product, as shown in Figure 4. All dust layers were distinguished at each altitude window where dust was observed. Finally, we calculated the data point number and the averaged value of , , and at each vertical bin. The mean aerosol (dust + non-dust) extinction coefficient in spring was 0.20 km−1 and the mean dust extinction coefficient in spring was 0.07 km−1 at 0.5–1.0 km, which is the largest in all seasons. However, the aerosol extinction and dust extinction coefficients near the surface are larger in winter (0.25 km−1 and 0.08 km−1, respectively) than in spring (0.23 km−1 and 0.07 km−1, respectively). In summer, and decrease to 0.12 km−1 and 0.03 km−1 at 0.5–1.0 km, respectively. At 4.0–8.0 km, and become very small (0.03 km−1 and 0.01 km−1, respectively) in spring, summer, and winter, except for an abnormally larger value ( and reaching 0.04 km−1 and 0.02 km−1) at 7.0 km in autumn. However, the number of dust cases observed is very small (<50, see Figure 4c). Therefore, a few extreme cases may lead to and reaching 0.04 km−1 and 0.02 km−1, respectively.
For the particle depolarization ratio, there are no distinct seasonal differences. is slightly larger in spring and smaller in summer. In addition, the particle depolarization ratio increased with altitude in general, which is 0.15 near the surface and increases to 0.25 at altitudes of 6.0–8.0 km. The particle depolarization ratios were approximately 0.3, indicating the dominance of pure coarse dust particles in this dust layer [51]. Although a great number of coarse dust particles may have been removed during transport, a few coarse dust particles remaining in the aloft dust plume can still induce this large particle depolarization ratio (~0.3) [24,52]. is approximately 0.39 for coarse-mode dust particles and 0.2 for fine-mode dust particles [51]. However, is 0.25 at 6.0–8.0 km over the Jianghan Plain, reflecting the possible mixing of dust particles with other spherical aerosols or the partial sedimentation of coarse-mode dust particles. A smaller reflects the mixing of dust particles with abundant local anthropogenic aerosols [53]. Mixing can also play a role in reducing the particle depolarization ratio [54]. is smaller than 0.2 at 0–4.0 km, indicating the mixture of dust particles and anthropogenic aerosols over the Jianghan Plain. He and Yi stated that in winter, many anthropogenic aerosols can mix with transported dust plumes over Wuhan (a mega city located in the eastern Jianghan Plain) and chemical processes may take place in this process, resulting in a reduction in the particle depolarization ratio [14].
To determine the long-term variations in dust column mass concentrations over the Jianghan Plain, the seasonally averaged dust column mass concentration from June 2006 to March 2021 was investigated, as shown in Figure 5. The dust column mass concentration in spring dramatically declined from 210 mg m−2 in 2006 to 100 mg m−2 in 2021. The declining rate for spring is −5.97 mg m−2 year−1 according to linear regression with a p-value of 1.9 × 10⁻⁵, indicating the statistical significance of the declining trend. In contrast, there were no significant changes in summer, autumn, and winter. The reduction of dust in spring can be explained through dust source variation as seen in Figure 5. Dust originated from TD and GD in spring, which showed a decreasing dust activity trend. An et al., observed that the number and intensity of dust events in spring showed a decreasing trend in East Asia during 2007–2016, mainly attributed to the decline in surface wind speeds [55]. An et al., also observed that the overall average annual variation in the surface dust concentration over the main dust source regions in East Asia (TD and GD) had decreased. Li et al., found that TD dust displayed no significant trends in the frequency of occurrence, and GD dust exhibited a decreasing trend [15]. The reduction in dust activity over desert sources reduces the amount of dust transported to the Jianghan Plain in spring, leading to decreased dust column mass concentrations.
In addition, the reduction in dust aerosols is also closely associated with increases in vegetation cover, precipitation, and volumetric soil water in the dust source areas [56]. Previous studies have shown that warmer surface air temperatures in winter are favorable for weak dust events in spring [57]. More precipitation and higher soil moisture in spring further inhibit dust activity [37]. Moreover, the increased precipitation and soil moisture both contribute to the increase in local vegetation, leading to a decrease in dust activities. Large-scale land-use management activities are also beneficial for enriching vegetation cover, therefore decreasing dust events [58].
3.2. Dust Event on 21–24 March 2018
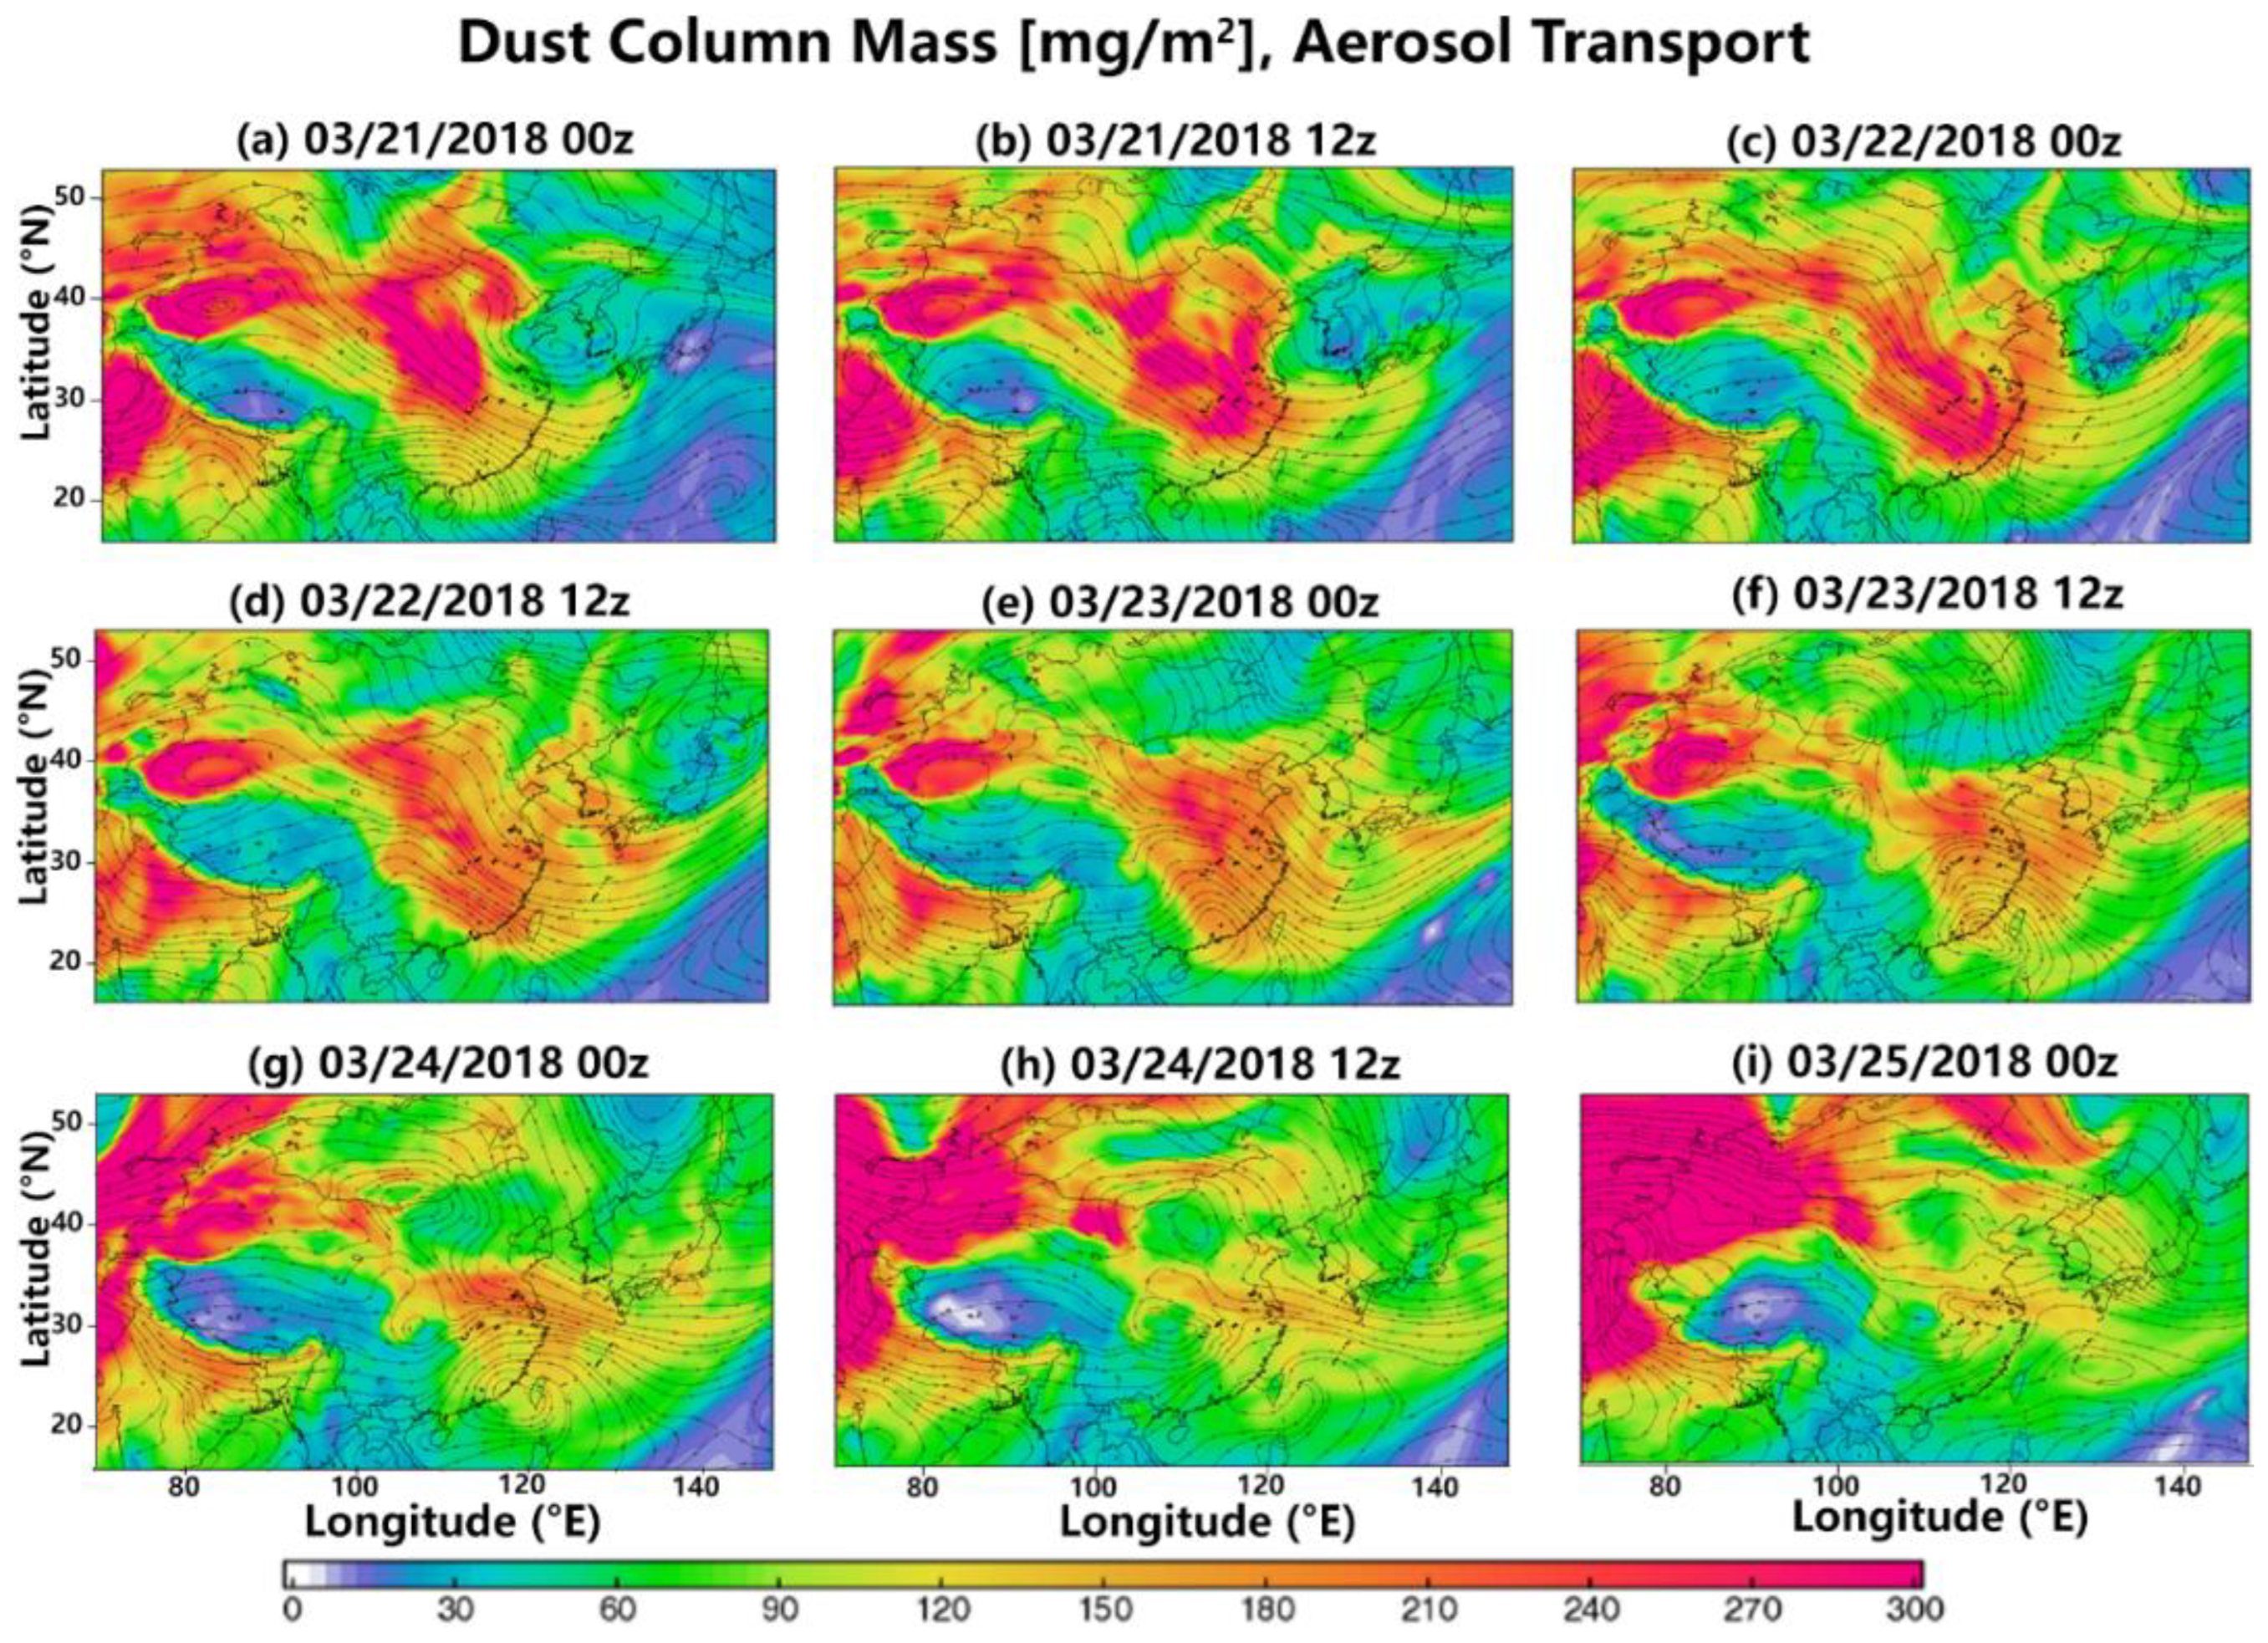
A severe Asian dust event on 21–24 March 2018 was analyzed. To reveal the transport of this dust event, the MERRA-2 dust column mass concentration in East Asia was examined as seen in Figure 6. An enhanced dust column mass concentration (>210 mg m−2) was observed in central and northern China at 0000 UTC on 21 March. At 1200 UTC on 21 March, the enhanced dust column mass concentration occurred in the Jianghan Plain (Figure 6b). Then, the enhanced dust column concentration mass occurred in eastward areas such as Korea on 22 March. Additionally, the enhanced dust column mass concentration began to decrease (180–210 mg m−2) on 22 March. Finally, the dust column mass concentration decreased to approximately 120 mg m−2 over the Jianghan Plain at 1200 UTC on 24 March, indicating the end of this dust event.
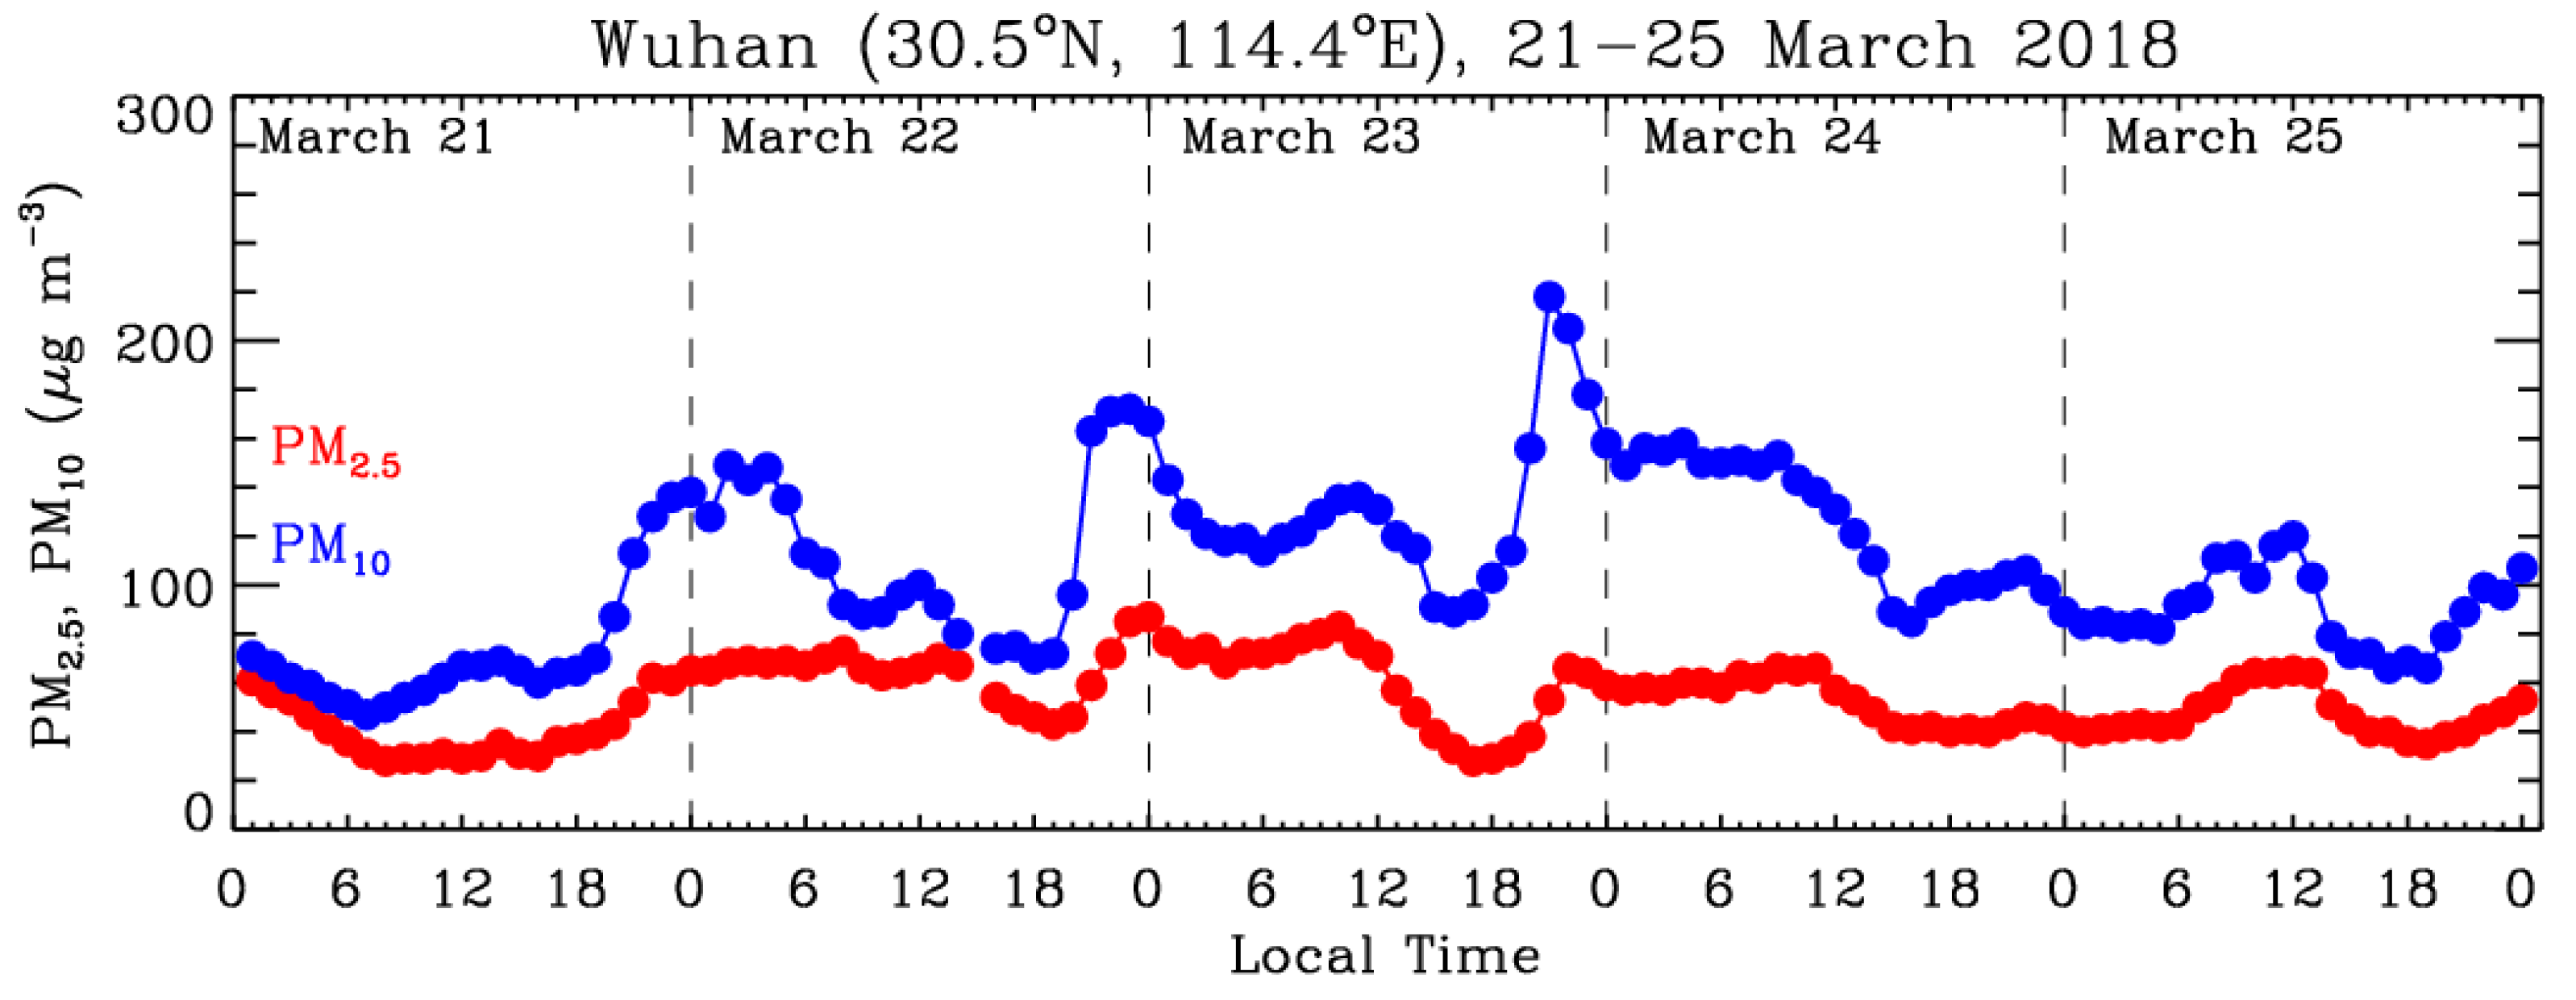
The influence of the dust storm on surface air quality is depicted in Figure 7 which shows the PM10 concentration measurements over the cities in China during 21–25 March 2018. PM10 can be considered an indication of dust presence near the surface. Until 12 LT on 21 March, no significant enhancement of PM10 concentration (<100 µg m−3) was observed. The dust plumes were transported aloft, and the dust particles had not yet undergone noteworthy sedimentation. Therefore, the PM10 concentration was lower than 100 µg m−3 close to the surface. One day later (at 00 LT on 22 March), the PM10 concentration increased to 150–250 µg m−3 in numerous cities located between latitudes of 30°N and 40°N in China, indicating the arrival of dust plumes. The air quality worsened during the following days. On 23 and 24 March, the PM10 concentration reached its peak at many observation sites from south to north China, with a maximum level exceeding >500 µg m−3. The PM10 concentration in most regions gradually decreased to <150 µg m−3 on 25 March, suggesting the removal of dust particles. In addition, hourly PM10 and PM2.5 concentration measurements over Wuhan (a mega city in the Jianghan Plain) during this dust event, as shown in Figure 8. The PM10 concentration began to increase after 1800 LT on 21 March and reached 220 µg m−3 on 23 March, indicating that dust plumes intruded into the planetary boundary layer of Wuhan.
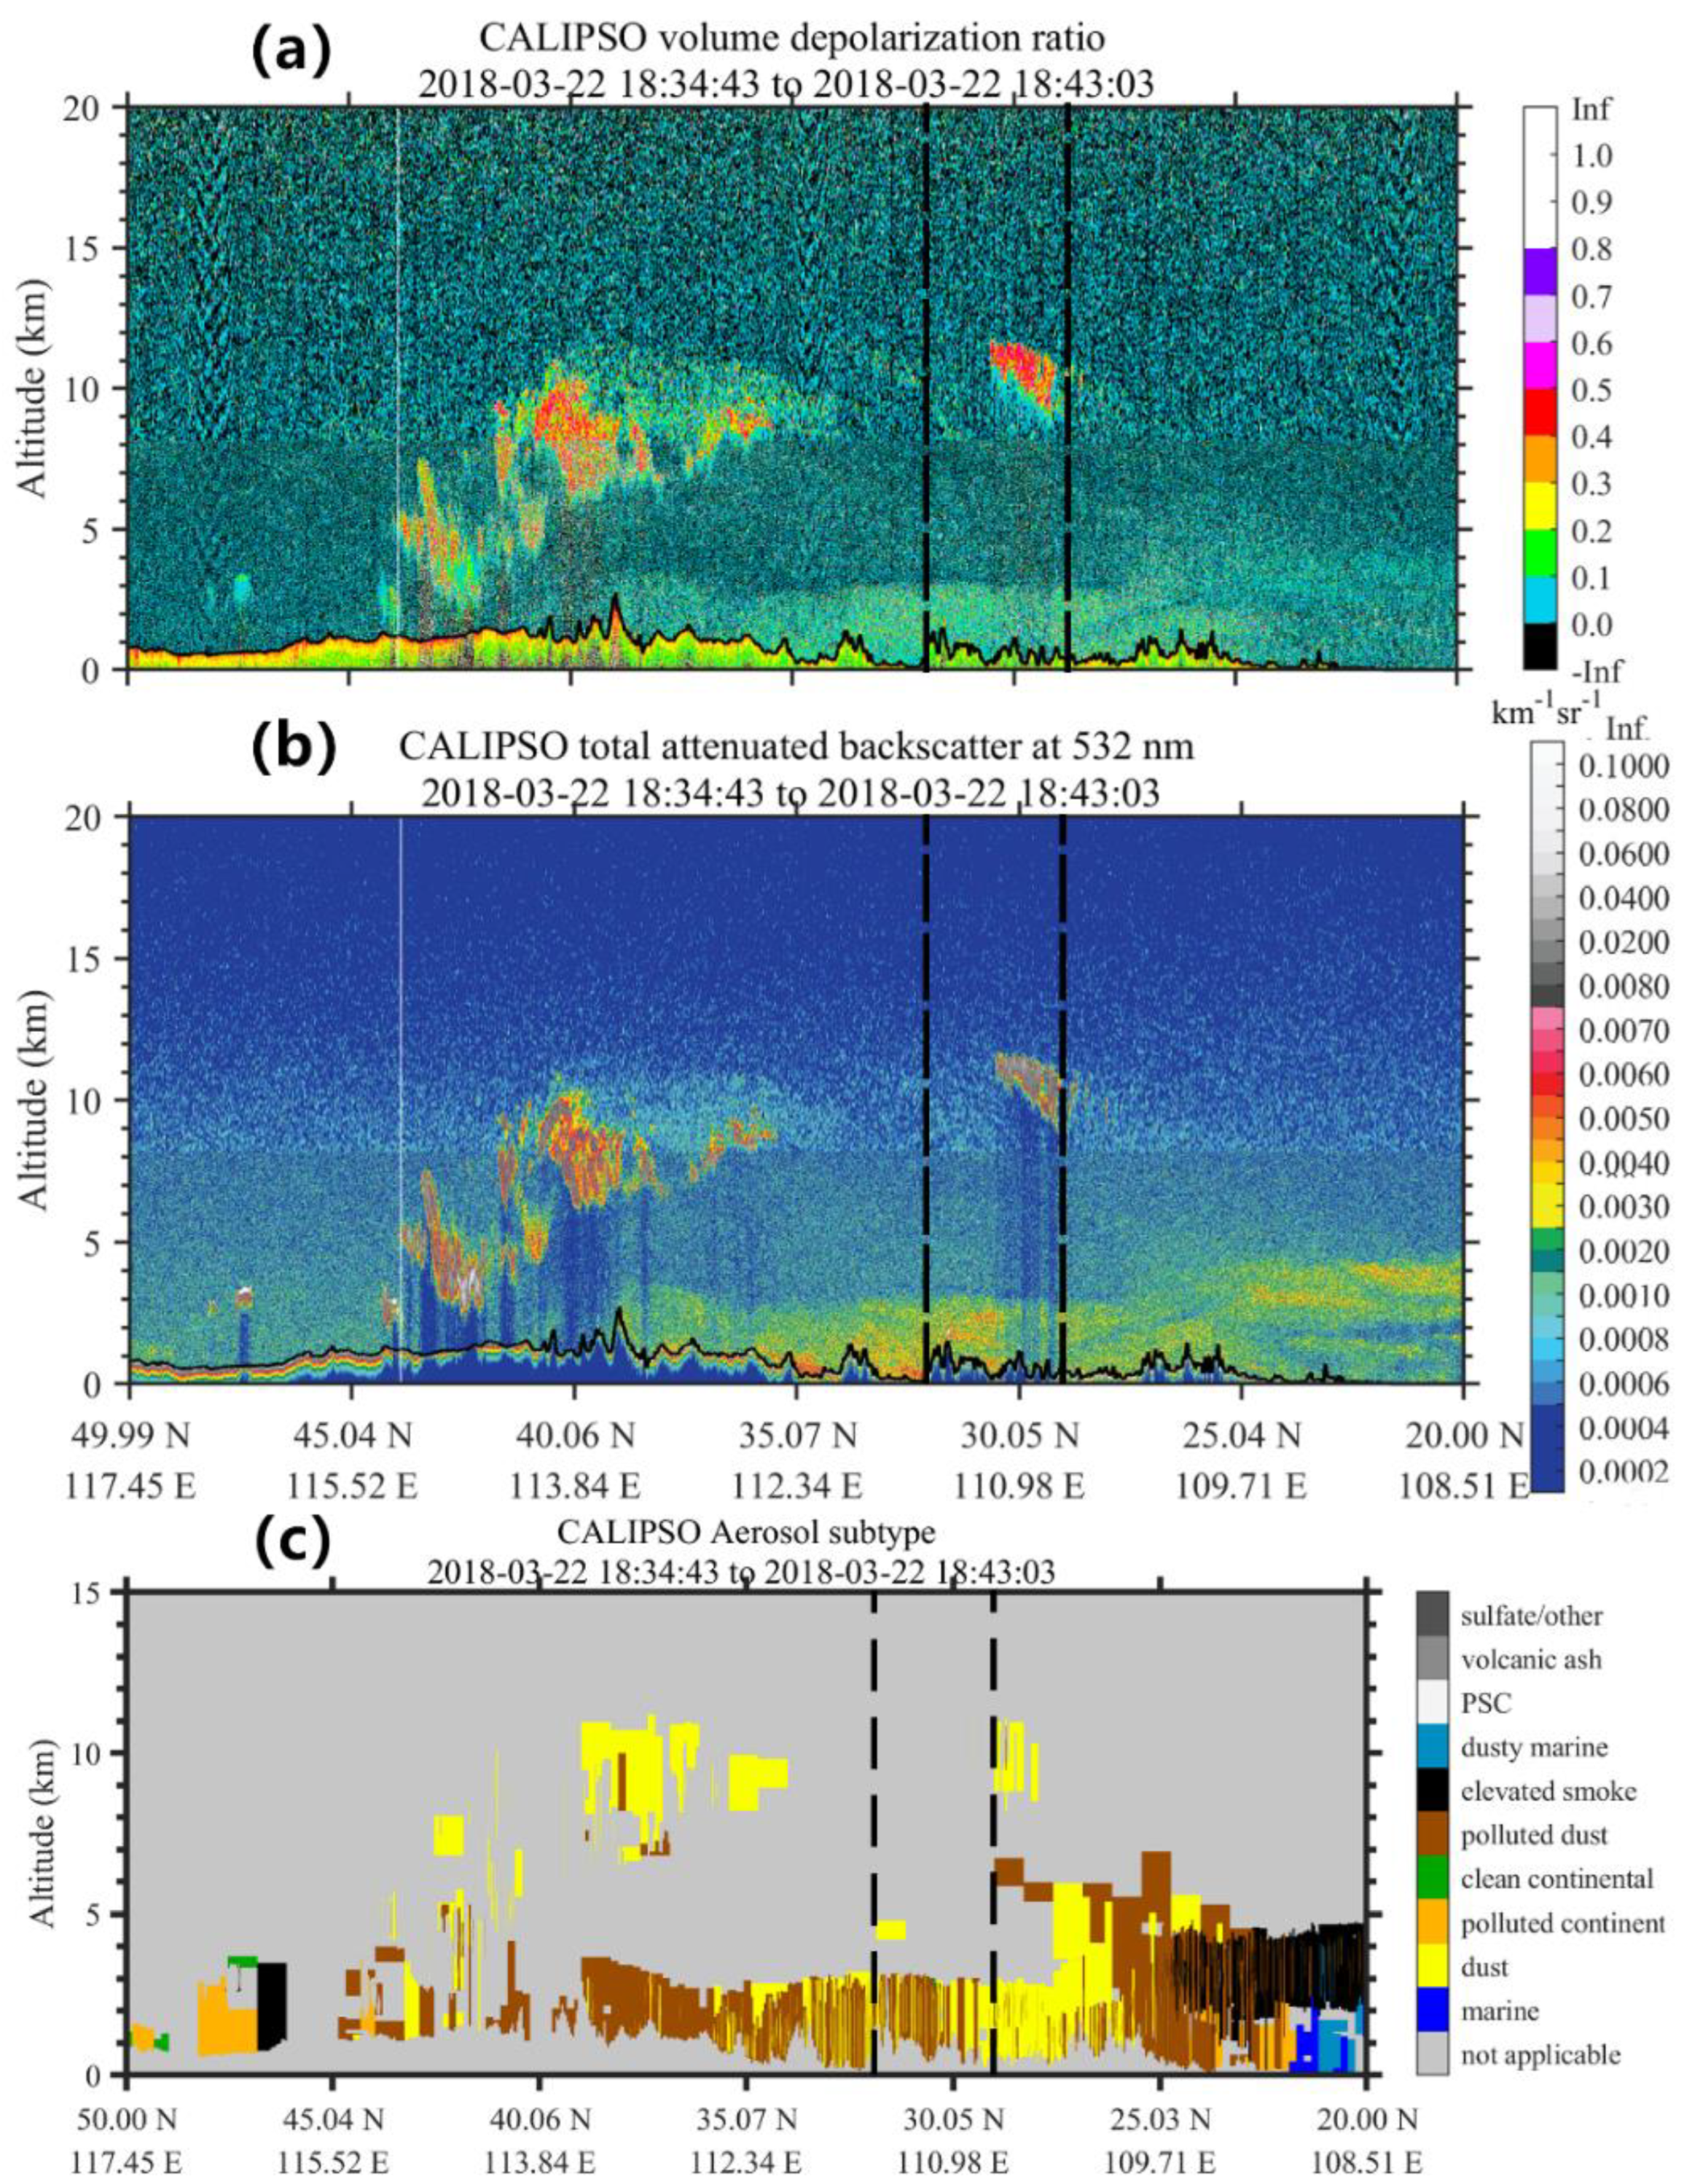
CALIOP level-2 aerosol subtypes are beneficial for determining the spatial distribution of dust plumes for this dust event. The CALIOP level-2 aerosol subtypes from the CALIPSO orbits passing over the Jianghan Plain with a latitudinal range of 20°N to 50°N were examined, as seen in Figure 9, which help to further reveal the vertical distribution of the dust plumes. ‘Dust’ and ‘polluted dust’ were the dominant aerosol types on 21, 22, and 24 March. On 21 March, dust occurred at the latitude of around 30°N (latitude of the Jianghan Plain) with purer dust particles. On 22 March, polluted dust widely occurred at approximately 30°N at 0–3.0 km. Dust aerosols were decreased over the Jianghan Plain on 24 March. It should be noted that some dust-containing layers probably failed to be detected, because of the presence of thick clouds. According to Vaillant et al. [59], some aerosol layers near clouds could be misclassified by the CALIOP CAD algorithm as cloud layers. For example, dust aerosols may be inferred as clouds at latitudes of 29–30°N and 40–45°N (shown in Figure 10).
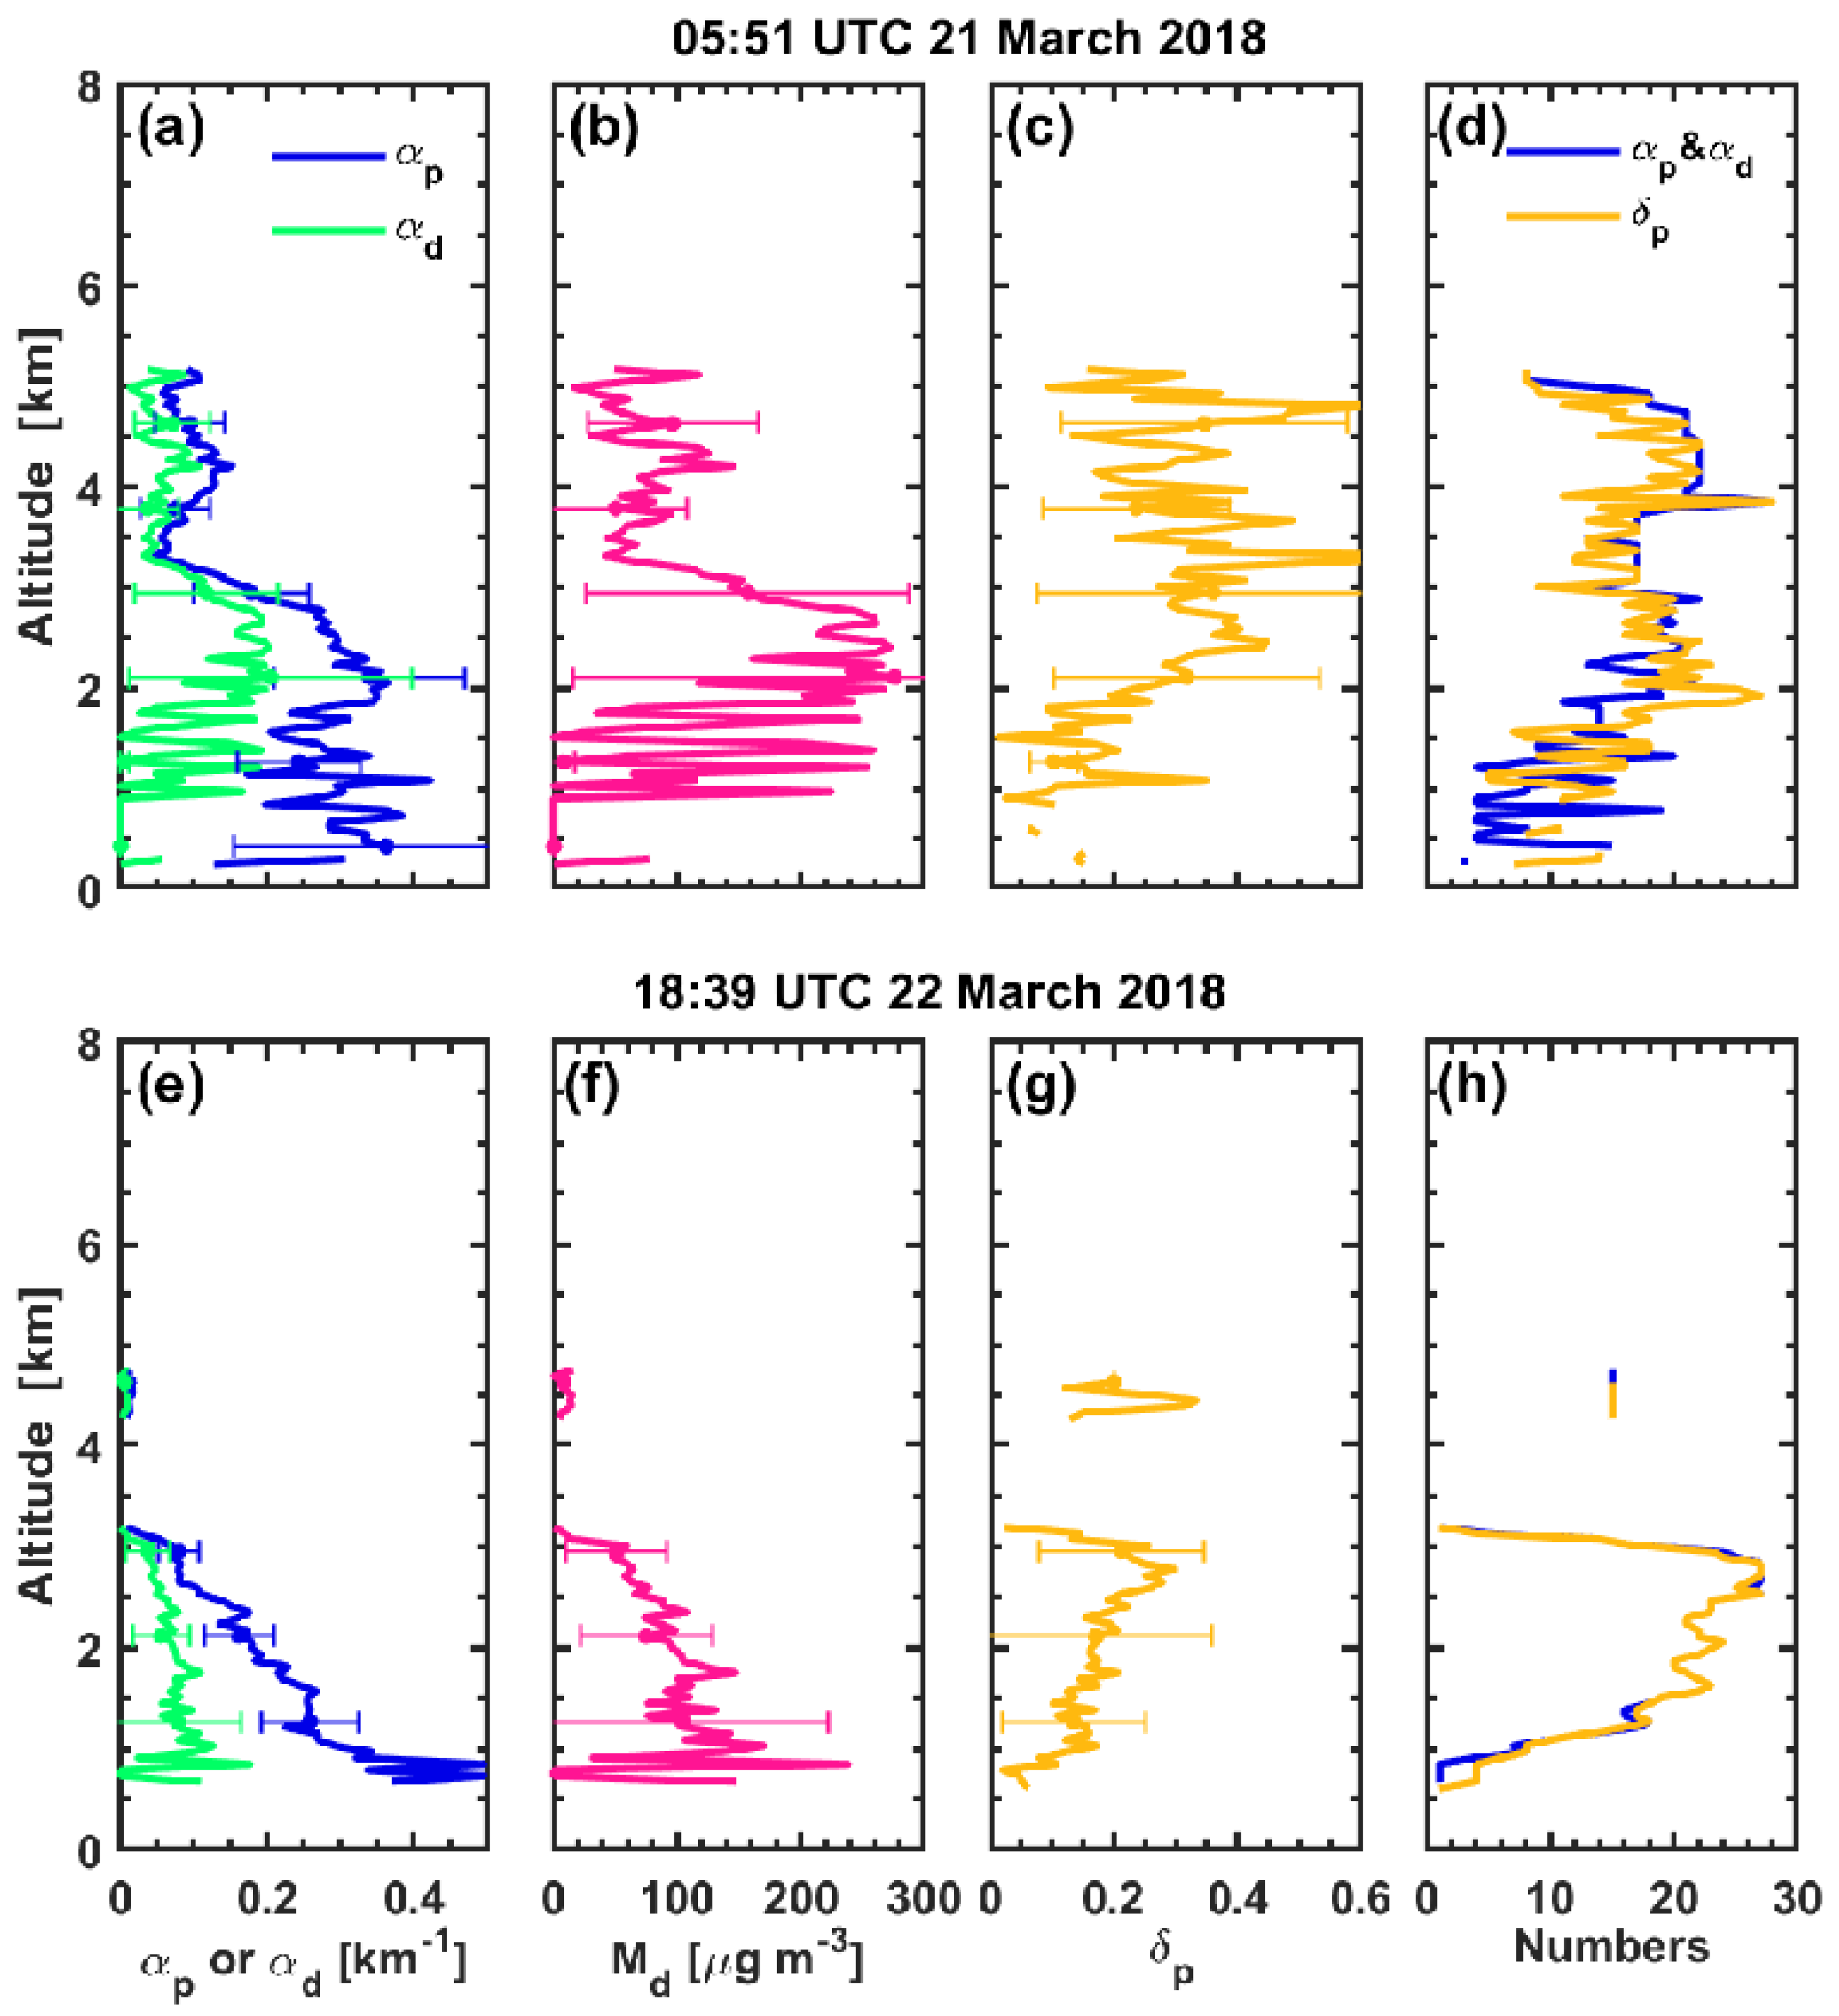
At 0551 UTC on 21 March, the dust layer seemed to sediment at altitudes of 1.0–3.0 km with a dust extinction coefficient of 0.15 km−1. The dust mass concentration reached 250 µg m−3 at 2.0–3.0 km, as estimated by the POLIPHON method (see Figure 11b). The particle depolarization ratio values below 2.0 km were 0.10–0.20, which indicates that the dust particles mixed with local aerosols [53,60]. Mixture with aerosols during transport in the lower troposphere may also reduce the particle depolarization ratio [54]. Another weaker dust loading layer was located at altitudes of 3.5–5.0 km, with dust extinction coefficients of 0.07 km−1 and particle depolarization ratios of 0.25–0.40, indicating that this layer mainly consists of pure dust particles. Compared with 21 March, dust aerosols on 22 March seemed to sediment to altitudes of 1.0–2.5 km with a dust extinction coefficient of 0.10 km−1. It seems that dust particles decreased. The dust mass concentration decreased to 100 µg m−3 at 1.0–2.5 km. The particle depolarization ratio values were 0.10–0.20 below 2.0 km, and 0.20–0.30 at 2.0–3.0 km, indicating that the mixture between dust particles and local aerosols increased at 2.0–3.0 km.
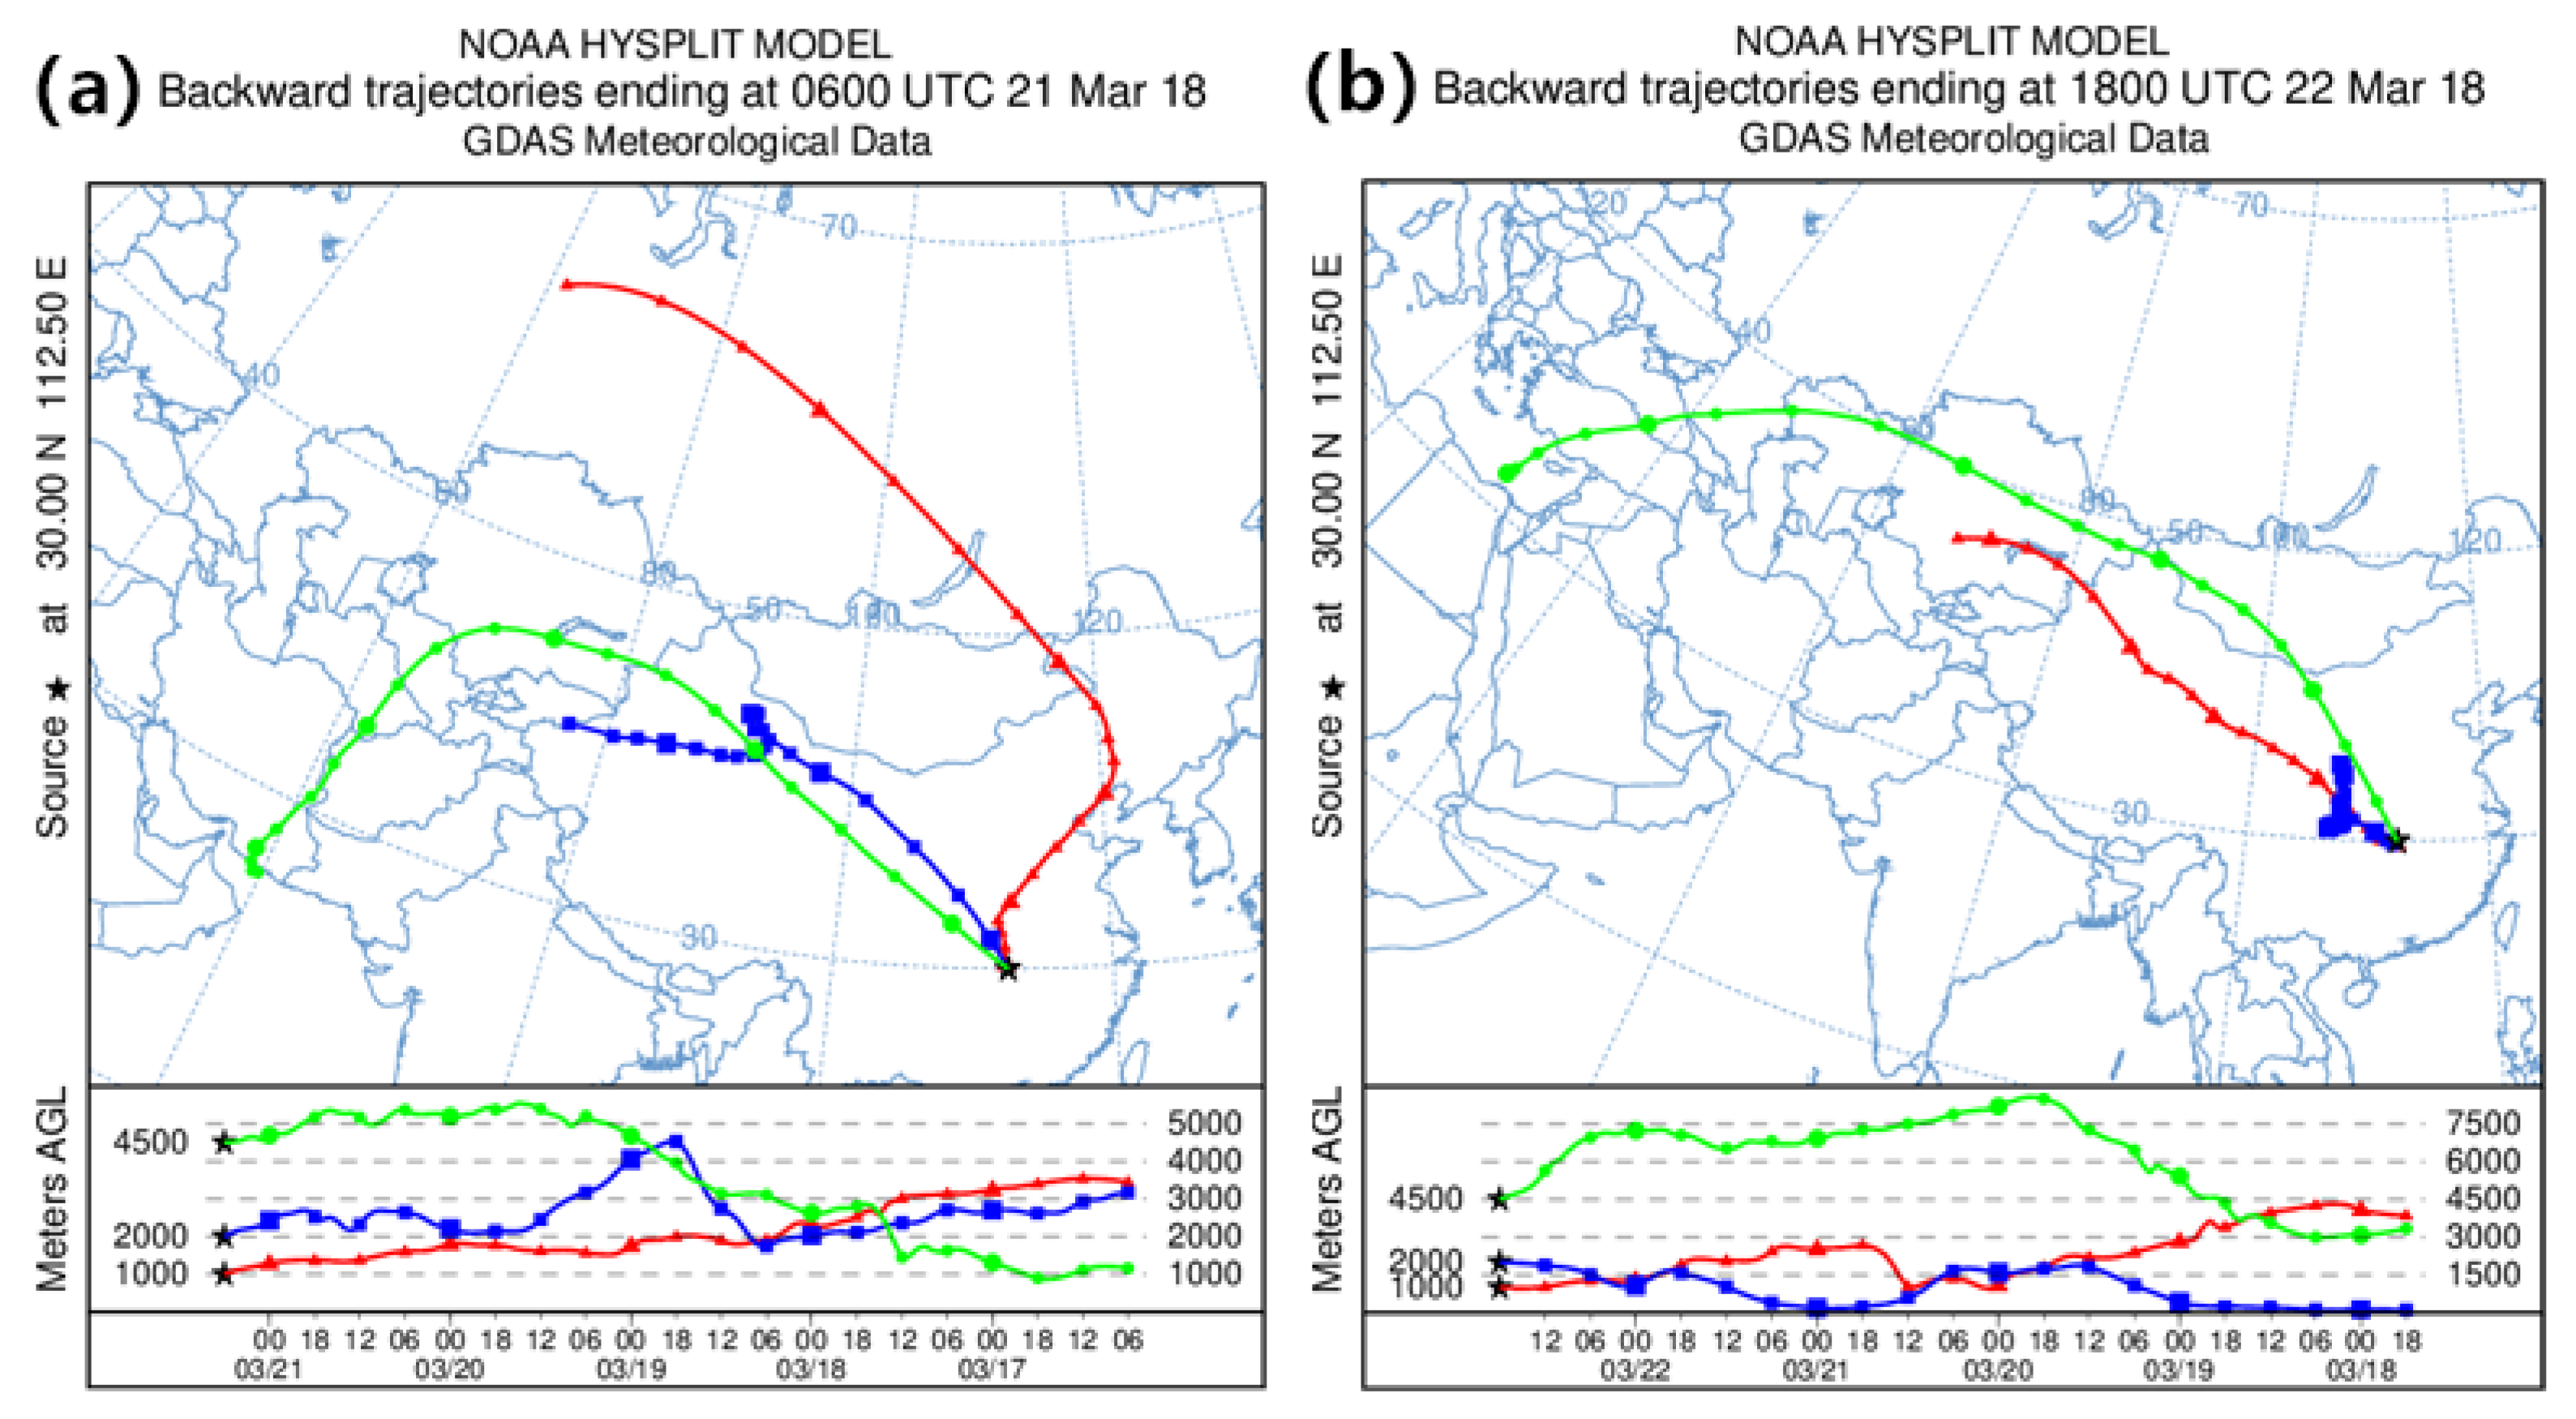
To determine the sources of this dust over the Jianghan Plain, the HYSPLIT model was used to simulate the backward trajectories of the dust plumes detected by CALIOP (see Figure 12). The air masses on 21 March at the different heights originated in three regions. The air mass at 1.0 km came from the Gobi regions. The air mass at 2 km was from the Taklimakan regions before its appearance over the Jianghan Plain. The highest layer at 4.5 km was traced back to the Middle East, converged with the air mass from the Taklimakan regions, and transported to the Jianghan Plain. The air masses on 22 March at 1.0 km can be traced back to the Taklimakan regions. The air mass at 4.5 km also came from the Middle East.
4. Discussions
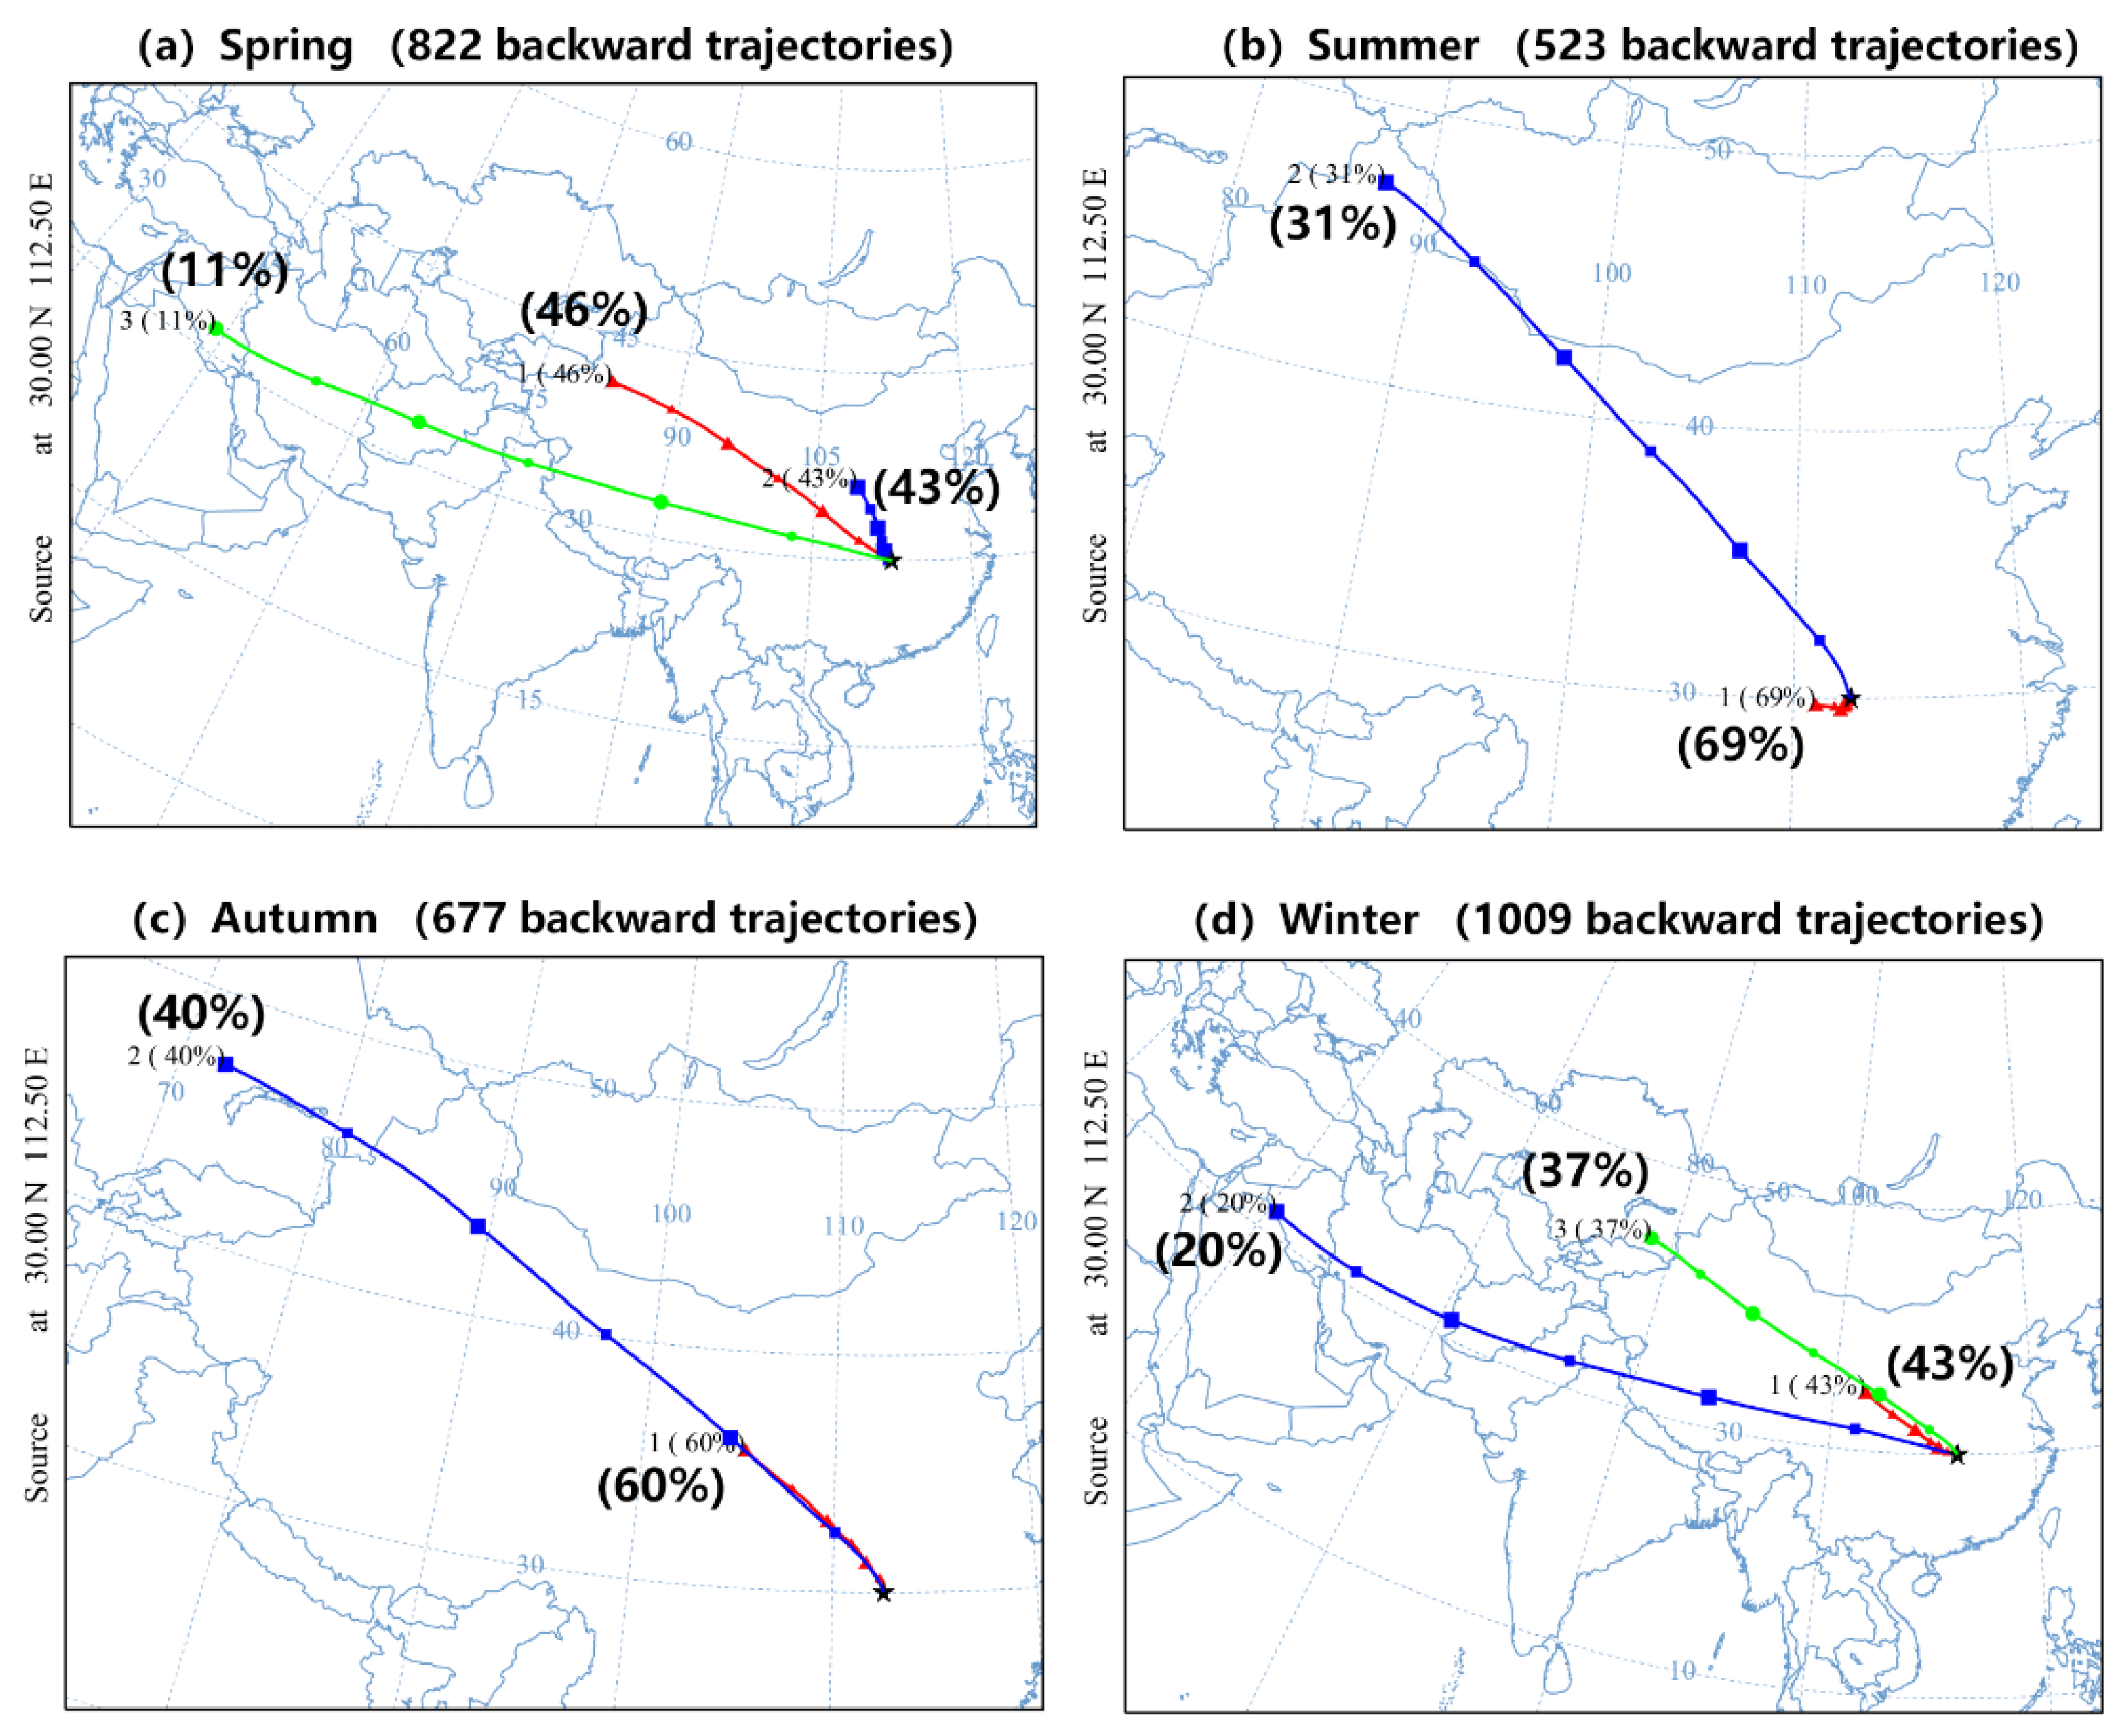
To further reveal the occurrence frequencies and heights of the dust plumes, clusters of dust layer backward trajectories were calculated to examine the sources and long-range transport pathways, as shown in Figure 13. The Hybrid Single-Particle Lagrangian Integrated Trajectory (HYSPLIT) model was used to track the backward trajectory starting from a fixed location (30°N, 112.5°E, the center of Jianghan Plain) at the arriving dust altitudes. In spring, the air mass trajectories cluster mainly originates from northwest China, including the Gobi Desert (GD) and the Taklimakan Desert (TD); there is also an air mass trajectory cluster from the Arabian Desert (AD). However, the possibility of AD dust transport to the Jianghan Plain should be validated further. In winter, the contributions of GD and TD dust decrease compared with those in spring. Therefore, the different contributions of dust sources should be responsible for the distinct seasonal variations in dust occurrence frequencies and vertical distributions over the Jianghan Plain.
The dust over Jianghan Plain mainly comes from the GD and TD, so its seasonal pattern of dust features should be linked to that of the GD and TD. Liu et al. reported seasonal dust activities in the major dust sources of East Asia [36]. They found that in the Gobi region, spring is the most active season for the outbreak of dust storms; dust activities over TD also reach a maximum in spring and a minimum in winter. High dust occurrence frequencies appear in spring and summer in the Indian Subcontinent. Ge et al. observed that events of dust entrainment and lofting are the most frequent and active during spring and summer over the Tarim Basin (i.e., where TD is located), explaining the frequent occurrences of dust in spring there [62]. Moreover, dust aerosols generated in the Taklimakan and Gobi areas can be carried eastward by prevailing westerlies and pass over China, North and South Korea, Japan, and the central North Pacific [20,21,63], which is more common in spring, as reported by Liu et al. [36]. The seasonal variations in dust occurrence frequency in the GD and TD substantially coincide with our observations of their downstream area on the Jianghan Plain.
In addition, the seasonal pattern of dust vertical distribution over the Jianghan Plain can also be attributed to the contribution of different dust sources in different seasons. Hu et al. found that dust plumes can pass over the Qinghai-Tibet Plateau with a column mass of 10 mg m−2 at 6.0–9.0 km and 5 mg m−2 at 9.0–12.0 km [64], which can subsequently move to downstream areas. This proves that a small portion of dust particles may occasionally undergo topographic uplift caused by the Qinghai-Tibet Plateau. Considering that dust plumes from the Middle East can hardly be transported eastward due to Shamal winds [65,66,67], the west-east trajectory clusters indicate that dust plumes from the Middle East may occasionally be transported to central and east China in winter (see Figure 13). In summer, the air flows under the control of the subtropical high leading to a drop in dust particles while moving from northwest to southeast. The seasonal variations in the vertical distribution of dust substantially coincide with our observations.
5. Conclusions
In this study, we evaluated the dust occurrence frequency and altitude distribution from the observations by CALIOP, dust column mass concentration from MERRA-2 reanalysis data, and trajectory clusters from the HYSPLIT model over the Jianghan Plain (29–32°N, 111–114.5°E) from June 2006 to March 2021. Evident seasonal variation patterns can be summarized by ‘strong in spring and winter, weak in summer and autumn’. The dust occurrence frequency (under cloud-free conditions) could reach up to 0.7 in spring and winter, and less than 0.4 in summer and autumn. The dust layers in spring were generally higher and thicker than those in the other seasons. In the period from 2006–2021, the dust column mass concentration substantially decreased in spring because the amount of dust originating from the Gobi reduced with the weaker wind, richer vegetation cover, and the enhancement of precipitation. This could be corroborated by the dust contribution in different seasons.
Additionally, we studied a representative Asian dust event in China on 21–24 March 2018 with the dust column mass concentrations from MERRA-2 reanalysis data, surface PM10 and PM2.5 concentrations from environmental monitoring data, aerosol subtype data and aerosol profiles from CALIOP space-borne lidar, which included the horizontal distribution, transport path, dissipation, and influence on surface air quality at a large horizontal scale. On 21 March, the dust plumes were found to be transported southward to northern and central China. A part of the dust plume arrived in the Jianghan Plain on 21 March, while the rest moved eastward to downstream areas, such as Korea. Therefore, a large area of mainland China suffered from severe air quality during 21–24 March due to long-range transported dust. Moreover, the influences of this dust event on the Jianghan Plain were studied in detail. The CALIOP observations were used to obtain the respective vertical profiles of the particle extinction coefficient, particle backscatter coefficient, particle depolarization ratio, and aerosol mass concentration over the Jianghan Plain on 21 and 22 March. These parameters were divided into the respective contributions from dust and non-dust components with the POLIPHON method. On 21 March, the dust plume showed a double-layer vertical structure over the search area and each layer came from different sources. The bottom layer concentrated a large proportion of dust particles but mixed with local anthropogenic aerosols, while the upper layer mainly concentrated much lower dust mass concentrations but contained pure dust particles. On 22 March, only the dust layer at altitudes of 1.0–3.0 km can be observed.
Owing to the long-term observation datasets from CALIOP, a primary picture of dust aerosols over the Jianghan Plain is drawn in this study. In this study, we mainly focus on dust occurrence frequency, vertical distribution, optical properties, and dust column mass. However, there is still much effort needed to thoroughly understand the characteristics of dust aerosols intruding into the Jianghan Plain area and their associated impacts on the regional environment, cloud process, and climate system. In the future, we will attempt to further link the seasonal variations in dust occurrence frequency, optical properties, and concentration with different origins [15]. In addition, we found a potential transport pathway of dust plumes from the southern slope of the Qinghai-Tibet Plateau, which, however, should be verified further based on observations and simulations [64]. Additionally, long-term dust-cloud interactions in this region should be studied based on the combined observation of CALIOP and CloudSat, since dust particles can be considered a type of effective ice nucleating particle [6,68].
Author Contributions
C.L. analyzed the data and wrote the manuscript. Z.Y. participated in the scientific discussions, analyzed the data, and reviewed and proofread the manuscript. Y.H. conceived the research, wrote the manuscript, and acquired the research funding. L.W. participated in the scientific discussions, reviewed and proofread the manuscript, and acquired the research funding. All authors have read and agreed to the published version of the manuscript.
Funding
This work was supported by the National Natural Science Foundation of China (Grants Nos. 42005101 and 62105248) and the Hubei Provincial Natural Science Foundation of China (2020CFB229).
Acknowledgments
The authors acknowledge the China National Environmental Monitoring Center (CNEMC) for the hourly PM10 data (http://www.cnemc.cn, accessed on 22 July 2022), the NASA Langley Atmospheric Science Data Center (ASDC) for the CALIOP data product (https://subset.larc.nasa.gov/calipso/login.php, accessed on 22 July 2022), the Global Modeling and Assimilation Office (GMAO) for the MERRA-2 reanalysis data (https://fluid.nccs.nasa.gov/reanalysis/chem2d_merra2, accessed on 22 July 2022), and the NOAA Air Resources Laboratory (ARL) for HYSPLIT model (https://ready.arl.noaa.gov/HYSPLIT_traj.php, accessed on 22 July 2022).
Conflicts of Interest
The authors declare no conflict of interest.
References
- Huang, J.; Fu, Q.; Su, J.; Tang, Q.; Minnis, P.; Hu, Y.; Yi, Y.; Zhao, Q. Taklimakan dust aerosol radiative heating derived from CALIPSO observations using the Fu-Liou radiation model with CERES constraints. Atmos. Chem. Phys. 2009, 9, 4011–4021. [Google Scholar] [CrossRef]
- Wang, T.; Han, Y.; Huang, J.; Sun, M.; Jian, B.; Huang, Z.; Yan, H. Climatology of dust-forced radiative heating over the Tibetan Plateau and its surroundings. J. Geophys. Res. Atmos. 2020, 125, e2020JD032942. [Google Scholar] [CrossRef]
- He, Y.; Yi, F.; Yi, Y.; Liu, F.; Zhang, Y. Heterogeneous Nucleation of Midlevel Cloud Layer Influenced by Transported Asian Dust Over Wuhan (30.5°N, 114.4°E), China. J. Geophys. Res. Atmos. 2021, 126, e2020JD033394. [Google Scholar] [CrossRef]
- He, Y.; Zhang, Y.; Liu, F.; Yin, Z.; Yi, Y.; Zhan, Y.; Yi, F. Retrievals of dust-related particle mass and ice-nucleating particle concentration profiles with ground-based polarization lidar and sun photometer over a megacity in central China. Atmos. Meas. Tech. 2021, 14, 5939–5954. [Google Scholar] [CrossRef]
- He, Y.; Yi, F.; Liu, F.; Yin, Z.; Zhou, J. Ice Nucleation of Cirrus Clouds Related to the Transported Dust Layer Observed by Ground-Based Lidars over Wuhan, China. Adv. Atmos. Sci. 2022, in press. [CrossRef]
- Yin, Z.; Yi, F.; He, Y.; Liu, F.; Yu, C.; Zhang, Y. Asian dust impacts on heterogeneous ice formation at Wuhan based on polarization lidar measurements. Atmos. Environ. 2021, 246, 118166. [Google Scholar] [CrossRef]
- Huang, J.; Lin, B.; Minnis, P.; Wang, T.; Wang, X.; Hu, Y.; Yi, Y.; Ayers, J.K. Satellite-based assessment of possible dust aerosols semi-direct effect on cloud water path over East Asia. Geophys. Res. Lett. 2006, 33, L19802. [Google Scholar] [CrossRef]
- Zender, C.; Miller, R.; Tegen, I. Quantifying mineral dust mass budgets: Terminology, constraints, and current estimates. Eos Trans. AGU 2004, 85, 509–512. [Google Scholar] [CrossRef]
- Althausen, D.; Abdullaev, S.; Hofer, J. Scientists share results of dust belt research. Eos 2019, 100. [Google Scholar] [CrossRef]
- Zhang, X.; Baklanov, A.; Werner, E.; Ke, G.; Tong, D.; Benedett, A.; Frassoni, A.; Waldhauserová, P.D.; Flemming, J.; Vitart, F.; et al. WMO Airborne Dust Bulletin; No. 5; WMO: Geneva, Switzerland, 2021; Available online: https://library.wmo.int/doc_num.php?explnum_id=10732 (accessed on 22 July 2022).
- Kok, J.F.; Adebiyi, A.A.; Albani, S.; Balkanski, Y.; Checa-Garcia, R.; Chin, M.; Colarco, P.R.; Hamilton, D.S.; Huang, Y.; Ito, A.; et al. Contribution of the world’s main dust source regions to the global cycle of desert dust. Atom. Chem. Phys. 2021, 21, 8169–8193. [Google Scholar] [CrossRef]
- Li, J.; Hao, X.; Liao, H.; Yue, X.; Li, H.; Long, X.; Li, N. Predominant type of dust storms that influences air quality over northern China and future projections. Earth’s Future 2022, 10, e2022EF002649. [Google Scholar] [CrossRef]
- Wang, L.; Mačak, M.B.; Stanič, S.; Bergant, K.; Gregorič, A.; Drinovec, L.; Močnik, G.; Yin, Z.; Yi, Y.; Müller, D.; et al. Investigation of Aerosol Types and Vertical Distributions Using Polarization Raman Lidar over Vipava Valley. Remote Sens. 2022, 14, 3482. [Google Scholar] [CrossRef]
- He, Y.; Yi, F. Dust Aerosols Detected Using a Ground-Based Polarization Lidar and CALIPSO over Wuhan (30.5°N, 114.4°E), China. Adv. Meteorol. 2015, 2015, 536762. [Google Scholar] [CrossRef]
- Han, Y.; Wang, T.; Tang, J.; Wang, C.; Jian, B.; Huang, Z.; Huang, J. New insights into the Asian dust cycle derived from CALIPSO lidar measurements. Remote Sens. Environ. 2022, 272, 112906. [Google Scholar] [CrossRef]
- Wang, T.; Tang, J.; Sun, M.; Liu, X.; Huang, Y.; Huang, J.; Han, Y.; Cheng, Y.; Huang, Z.; Li, J. Identifying a transport mechanism of dust aerosols over South Asia to the Tibetan Plateau: A case study. Sci. Total Environ. 2021, 758, 143714. [Google Scholar] [CrossRef]
- Tao, M.; Gui, L.; Li, R.; Wang, L.; Liang, S.; Li, Q.; Yu, C.; Chen, L. Tracking prevailing dust aerosol over the air pollution in central China with integrated satellite and ground observations. Atmos. Environ. 2021, 253, 118369. [Google Scholar] [CrossRef]
- Gui, K.; Yao, W.; Che, H.; An, L.; Zheng, Y.; Li, L.; Zhao, H.; Zhang, L.; Zhong, J.; Wang, Y.; et al. Record-breaking dust loading during two mega dust storm events over northern China in March 2021: Aerosol optical and radiative properties and meteorological drivers. Atmos. Chem. Phys. 2022, 22, 7905–7932. [Google Scholar] [CrossRef]
- Winker, D.; Hunt, W.H.; McGill, M.J. Initial performance assessment of CALIOP. Geophys. Res. Lett. 2007, 34, L19803. [Google Scholar] [CrossRef]
- Iwasaka, Y.; Minoura, H.; Nagaya, K. The transport and spacial scale of Asian dust-storm clouds: A case study of the dust-storm event of April 1979. Tellus B 1983, 35B, 189–196. [Google Scholar] [CrossRef]
- Uematsu, M.; Duce, R.A.; Prospero, J.M.; Chen, L.; Merrill, J.T.; McDonald, R.L. Transport of mineral aerosol from Asia Over the North Pacific Ocean. J. Geophys. Res. 1983, 88, 5343–5352. [Google Scholar] [CrossRef]
- He, Y.; Yin, Z.; Liu, F.; Yi, F. Technical note: Identification of two ice-nucleating regimes for dust-related cirrus clouds based on the relationship between number concentrations of ice-nucleating particles and ice crystals. Atmos. Chem. Phys. Discuss. 2022. in review. [Google Scholar] [CrossRef]
- Wang, W.; Yi, F.; Liu, F.; Zhang, Y.; Yu, C.; Yin, Z. Characteristics and seasonal variations of cirrus clouds from polarization lidar observations at a 30°N plain site. Remote Sens. 2020, 12, 3998. [Google Scholar] [CrossRef]
- Mamouri, R.E.; Ansmann, A. Fine and coarse dust separation with polarization lidar. Atmos. Meas. Tech. 2014, 7, 3717–3735. [Google Scholar] [CrossRef]
- Mamouri, R.E.; Ansmann, A. Estimated desert-dust ice nuclei profiles from polarization lidar: Methodology and case studies. Atmos. Chem. Phys. 2015, 15, 3463–3477. [Google Scholar] [CrossRef]
- Sugimoto, N.; Nishizawa, T.; Shimizu, A.; Matsui, I.; Kobayashi, H. Detection of internally mixed Asian dust with air pollution aerosols using a polarization optical particle counter and a polarization-sensitive two-wavelength lidar. J. Quant. Spectrosc. RA 2015, 150, 107–113. [Google Scholar] [CrossRef]
- Yin, Z.; Yi, F.; Liu, F.; He, Y.; Zhang, Y.; Yu, C.; Zhang, Y. Long-term variations of aerosol optical properties over Wuhan with polarization lidar. Atmos. Environ. 2021, 259, 118508. [Google Scholar] [CrossRef]
- Gui, K.; Che, H.; Li, L.; Zheng, Y.; Zhang, L.; Zhao, H.; Zhong, J.; Yao, W.; Liang, Y.; Wang, Y.; et al. The significant contribution of small-sized and spherical aerosol particles to the decreasing trend in total aerosol optical depth over land from 2003 to 2018. Engineering, 2022; in press. [Google Scholar] [CrossRef]
- Yao, W.; Gui, K.; Wang, Y.; Che, H.; Zhang, X. Identifying the dominant local factors of 2000–2019 changes in dust loading over East Asia. Sci. Total Environ. 2021, 777, 146064. [Google Scholar] [CrossRef]
- Winker, D.M.; Vaughan, M.A.; Omar, A.; Hu, Y.; Powell, K.A.; Liu, Z.; Hunt, W.H.; Young, S.A. Overview of the CALIPSO mission and CALIOP data processing algorithms. J. Atmos. Ocean. Tech. 2009, 26, 2310–2323. [Google Scholar] [CrossRef]
- Vaughan, M.A.; Powell, K.A.; Kuehn, R.E.; Young, S.A.; Winker, D.M.; Hostetler, C.A.; Hunt, W.H.; Liu, Z.; McGill, M.J.; Getzewich, B.J. Fully automated detection of cloud and aerosol layers in the CALIPSO Lidar measurements. J. Atmos. Ocean. Tech. 2009, 26, 2034–2050. [Google Scholar] [CrossRef]
- Omar, A.H.; Winker, D.M.; Kittaka, C.; Vaughan, M.A.; Liu, Z.; Hu, Y.; Trepte, C.R.; Rogers, R.R.; Ferrare, R.A.; Lee, K.P.; et al. The CALIPSO automated aerosol classification and Lidar ratio selection algorithm. J. Atmos. Ocean. Tech. 2009, 26, 1994–2014. [Google Scholar] [CrossRef]
- Vaughan, M.; Young, S.; Winker, D.; Powell, K.; Omar, A.; Liu, Z.; Hu, Y.; Hostetler, C. Fully automated analysis of space-based lidar data: An overview of the CALIPSO retrieval algorithms and data products. In Laser Radar Techniques for Atmospheric Sensing; SPIE: Bellingham, DC, USA, 2004; Volume 5575. [Google Scholar] [CrossRef]
- He, Y.; Yi, F.; Yin, Z.; Liu, F.; Yang, Y.; Zhou, J. Mega Asian dust event over China on 27–31 March 2021 observed with space-borne instruments and ground-based polarization lidar. Atmos. Environ. 2022, 285, 119238. [Google Scholar] [CrossRef]
- Li, L.; Derimian, Y.; Chen, C.; Zhang, X.; Che, H.; Schuster, G.; Fuertes, D.; Litvinov, P.; Lapyonok, T.; Lopatin, A.; et al. Climatology of aerosol component concentrations derived from multi-angular polarimetric POLDER-3 observations using GRASP algorithm. Earth Syst. Sci. Data 2022, 14, 3439–3469. [Google Scholar] [CrossRef]
- Liu, D.; Wang, Z.; Liu, Z.; Winker, D.; Trepte, C. A height resolved global view of dust aerosols from the first year CALIPSO LIDAR measurements. J. Geophys. Res. 2008, 113, D16214. [Google Scholar] [CrossRef]
- Liu, J.; Wu, D.; Wang, T.; Ji, M.; Wang, X. Interannual variability of dust height and the dynamics of its formation over East Asia. Sci. Total Environ. 2020, 751, 142288. [Google Scholar] [CrossRef] [PubMed]
- Liu, Z.; Vaughan, M.A.; Winker, D.M.; Hostetler, C.A.; Poole, L.R.; Hlavka, D.; Hart, W.; McGill, M. Use of Probability Distribution Functions for Discriminating Between Cloud and Aerosol in Lidar Backscatter Data. J. Geophys. Res. 2004, 109, D15202. [Google Scholar] [CrossRef]
- Liu, Z.; Kuehn, R.; Vaughan, M.; Winker, D.; Omar, A.; Trepte, C.; Hu, Y.; Hostetler, C. The CALIPSO cloud and aerosol discrimination: Version 3 algorithm and test results. In Proceedings of the 25th International Laser Radar Conference, St. Petersburg, Russia, 5–9 July 2010; pp. 155–158. [Google Scholar]
- Powell, K.; Hostetler, C.; Vaughan, M.; Lee, K.; Trepte, C.; Rogers, R.; Winker, D.; Liu, Z.; Kuehn, R.; Hunt, W.; et al. CALIPSO Lidar Calibration Algorithms. Part I: Nighttime 532-nm Parallel Channel and 532-nm Perpendicular Channel. J. Atmos. Ocean. Tech. 2008, 26, 2015–2033. [Google Scholar] [CrossRef]
- Shimizu, A.; Sugimoto, N.; Matsui, I.; Arao, K.; Uno, I.; Murayama, T.; Kagawa, N.; Aoki, K.; Uchiyama, A.; Yamazaki, A. Continuous observations of Asian dust and other aerosols by polarization lidars in China and Japan during ACE-Asia. J. Geophys. Res. 2004, 109, D19S17. [Google Scholar] [CrossRef]
- Sugimoto, N.; Uno, I.; Nishikawa, M.; Shimizu, A.; Matsui, I.; Dong, X.; Chen, Y.; Quan, H. Record heavy Asian dust in Beijing in 2002: Observations and model analysis of recent events. Geophys. Res. Lett. 2003, 30, 1640. [Google Scholar] [CrossRef]
- Sakai, T.; Nagai, T.; Zaizen, Y.; Mano, Y. Backscattering linear depolarization ratio measurements of mineral, sea-salt, and ammonium sulfate particles simulated in a laboratory chamber. Appl. Opt. 2010, 49, 4441–4449. [Google Scholar] [CrossRef]
- Lakshmi, N.B.; Nair, V.S.; Suresh Babu, S. Vertical structure of aerosols and mineral dust over the Bay of Bengal from multisatellite observations. J. Geophys. Res. Atmos. 2017, 122, 12845–12861. [Google Scholar] [CrossRef]
- Anderson, T.; Doherty, S.; Ahlquist, N.; Howell, S.; Clarke, A.; McNaughton, C. Variability of aerosol optical properties derived from in situ aircraft measurements during ACE-Asia. J. Geophys. Res. 2003, 108, 8647. [Google Scholar] [CrossRef]
- Hu, Q.; Wang, H.; Goloub, P.; Li, Z.; Veselovskii, I.; Podvin, T.; Li, K.; Korenskiy, M. The characterization of Taklamakan dust properties using a multiwavelength Raman polarization lidar in Kashi, China. Atmos. Chem. Phys. 2020, 20, 13817–13834. [Google Scholar] [CrossRef]
- Müller, D.; Ansmann, A.; Mattis, I.; Tesche, M.; Wandinger, U.; Althausen, D.; Pisani, G. Aerosol-type-dependent lidar ratios observed with Raman lidar. J. Geophys. Res. Atmos. 2007, 112, D16202. [Google Scholar] [CrossRef]
- Peng, L.; Yi, F.; Liu, F.; Yin, Z.; He, Y. Optical properties of aerosol and cloud particles measured by a single-line-extracted pure rotational Raman lidar. Opt. Express 2021, 29, 21947–21964. [Google Scholar] [CrossRef]
- Wagner, F.; Bortoli, D.; Pereira, S.; Costa, M.J.; Silva, A.M.; Weinzierl, B.; Esselborn, M.; Petzold, A.; Rasp, K.; Heinold, B.; et al. Properties of dust aerosol particles transported to Portugal from the Sahara desert. Tellus B 2009, 61, 297–306. [Google Scholar] [CrossRef]
- Holben, B.N.; Eck, T.F.; Slutsker, I.; Tanré, D.; Buis, J.P.; Setzer, A.; Vermote, E.; Reagan, J.A.; Kaufman, Y.J.; Nakajima, T.; et al. AERONET—A Federated Instrument Network and Data Archive for Aerosol Characterization. Remote Sens. Environ. 1998, 66, 1–16. [Google Scholar] [CrossRef]
- Mamouri, R.E.; Ansmann, A. Potential of polarization/Raman lidar to separate fine dust, coarse dust, maritime, and anthropogenic aerosol profiles. Atmos. Meas. Tech. 2017, 10, 3403–3427. [Google Scholar] [CrossRef]
- Yu, H.; Yang, Y.; Wang, H.; Tan, Q.; Chin, M.; Levy, R.C.; Remer, L.A.; Smith, S.J.; Yuan, T.; Shi, Y. Interannual variability and trends of combustion aerosol and dust in major continental outflows revealed by MODIS retrievals and CAM5 simulations during 2003–2017. Atmos. Chem. Phys. 2020, 20, 139–161. [Google Scholar] [CrossRef] [Green Version]
- Guo, J.; Chen, X.; Su, T.; Liu, L.; Zheng, Y.; Chen, D.; Li, J.; Xu, H.; Lv, Y.; He, B.; et al. The Climatology of Lower Tropospheric Temperature Inversions in China from Radiosonde Measurements: Roles of Black Carbon, Local Meteorology, and Large-Scale Subsidence. J. Clim. 2020, 33, 9327–9350. [Google Scholar] [CrossRef]
- Ma, Q.; Liu, Y.; Liu, C.; Ma, J.; He, H. A case study of Asian dust storm particles: Chemical composition, reactivity to SO2 and hygroscopic properties. J. Environ. Sci. 2012, 24, 62–71. [Google Scholar] [CrossRef]
- An, L.; Che, H.; Xue, M.; Zhang, T.; Wang, H.; Wang, Y.; Zhou, C.; Zhao, H.; Gui, K.; Zheng, Y.; et al. Temporal and spatial variations in sand and dust storm events in East Asia from 2007 to 2016: Relationships with surface conditions and climate change. Sci. Total Environ. 2018, 633, 452–462. [Google Scholar] [CrossRef]
- Gui, K.; Che, H.; Zheng, Y.; Zhao, H.; Yao, W.; Li, L.; Zhang, L.; Wang, H.; Wang, Y.; Zhang, X. Three-dimensional climatology, trends, and meteorological drivers of global and regional tropospheric type-dependent aerosols: Insights from 13 years (2007–2019) of CALIOP observations. Atmos. Chem. Phys. 2021, 21, 15309–15336. [Google Scholar] [CrossRef]
- Ji, L.; Fan, K. Climate prediction of dust weather frequency over northern China based on sea-ice cover and vegetation variability. Clim. Dyn. 2019, 53, 687–705. [Google Scholar] [CrossRef]
- Chen, C.; Park, T.; Wang, X.; Piao, S.; Xu, B.; Chaturvedi, R.K.; Fuchs, R.; Brovkin, V.; Ciais, P.; Fensholt, R.; et al. China and India lead in greening of the world through land-use management. Nat. Sustain. 2019, 2, 122–129. [Google Scholar] [CrossRef] [PubMed]
- Vaillant de Guélis, T.; Ancellet, G.; Garnier, A.C.; Labonnote, L.; Pelon, J.; Vaughan, M.A.; Liu, Z.; Winker, D.M. Assessing the benefits of Imaging Infrared Radiometer observations for the CALIOP version 4 cloud and aerosol discrimination algorithm. Atmos. Meas. Tech. 2022, 15, 1931–1956. [Google Scholar] [CrossRef]
- Huang, K.; Zhuang, G.; Li, J.; Wang, Q.; Sun, Y.; Lin, Y.; Fu, J.S. Mixing of Asian dust with pollution aerosol and the transformation of aerosol components during the dust storm over China in spring 2007. J. Geophys. Res. 2010, 115, D00K13. [Google Scholar] [CrossRef]
- Draxler, R.; Rolph, G. HYSPLIT (Hybrid Single-Particle Lagrangian Integrated Trajectory) Model; Air Resources Laboratory, NOAA: Silver Spring, MD, USA, 2003. Available online: http://www.arl.noaa.gov/ready/hysplit4.html (accessed on 22 July 2022).
- Ge, J.M.; Huang, J.P.; Xu, C.P.; Qi, Y.L.; Liu, H.Y. Characteristics of Taklimakan dust emission and distribution: A satellite and reanalysis field perspective. J. Geophys. Res. Atmos. 2014, 119, 11772–11783. [Google Scholar] [CrossRef]
- Chun, Y.; Boo, K.O.; Kim, J.; Park, S.-U.; Lee, M. Synopsis, transport, and physical characteristics of Asian dust in Korea. J. Geophys. Res. 2001, 106, 18461–18469. [Google Scholar] [CrossRef] [Green Version]
- Hu, Z.; Huang, J.; Zhao, C.; Jin, Q.; Ma, Y.; Yang, B. Modeling dust sources, transport, and radiative effects at different altitudes over the Tibetan Plateau. Atmos. Chem. Phys. 2020, 20, 1507–1529. [Google Scholar] [CrossRef]
- Yu, Y.; Notaro, M.; Kalashnikova, O.; Garay, M. Climatology of summer Shamal wind in the Middle East. J. Geophys. Res. Atmos. 2016, 121, 289–305. [Google Scholar] [CrossRef]
- Rashki, A.; Kaskaoutis, D.; Mofidi, A.; Minvielle, F.; Chiapello, I.; Legrand, M.; Dumka, U.; Francois, F. Effects of Monsoon, Shamal and Levar winds on dust accumulation over the Arabian Sea during summer—The July 2016 case. Aeol. Res. 2019, 36, 27–44. [Google Scholar] [CrossRef]
- Hamzeh, N.; Karami, S.; Kaskaoutis, D.; Tegen, I.; Moradi, M.; Opp, C. Atmospheric dynamics and numerical simulations of six frontal dust storms in the Middle East region. Atmosphere 2021, 12, 125. [Google Scholar] [CrossRef]
- Huang, Z.; Nee, J.B.; Chiang, C.W.; Zhang, S.; Jin, H.; Wang, W.; Zhou, T. Real-time observations of dust-cloud interactions based on polarization and Raman lidar measurements. Remote Sens. 2018, 10, 1017. [Google Scholar] [CrossRef] [Green Version]
Figure 1.
Geographical location of the Jianghan Plain, surrounding dust sources, and the main dust transport path to the Jianghan Plain (①, ②). The westerly is divided into the southern and northern branches over the Qinghai-Tibet Plateau and converges at approximately 30°N after crossing the plateau (yellow arrow). The topographic map comes from ArcGIS (https://www.arcgis.com/index.html, accessed on 22 July 2022).

Figure 2.
Flowchart of the dust extinction coefficient and the mass concentration of dust using the POLIPHON method.
Figure 2.
Flowchart of the dust extinction coefficient and the mass concentration of dust using the POLIPHON method.
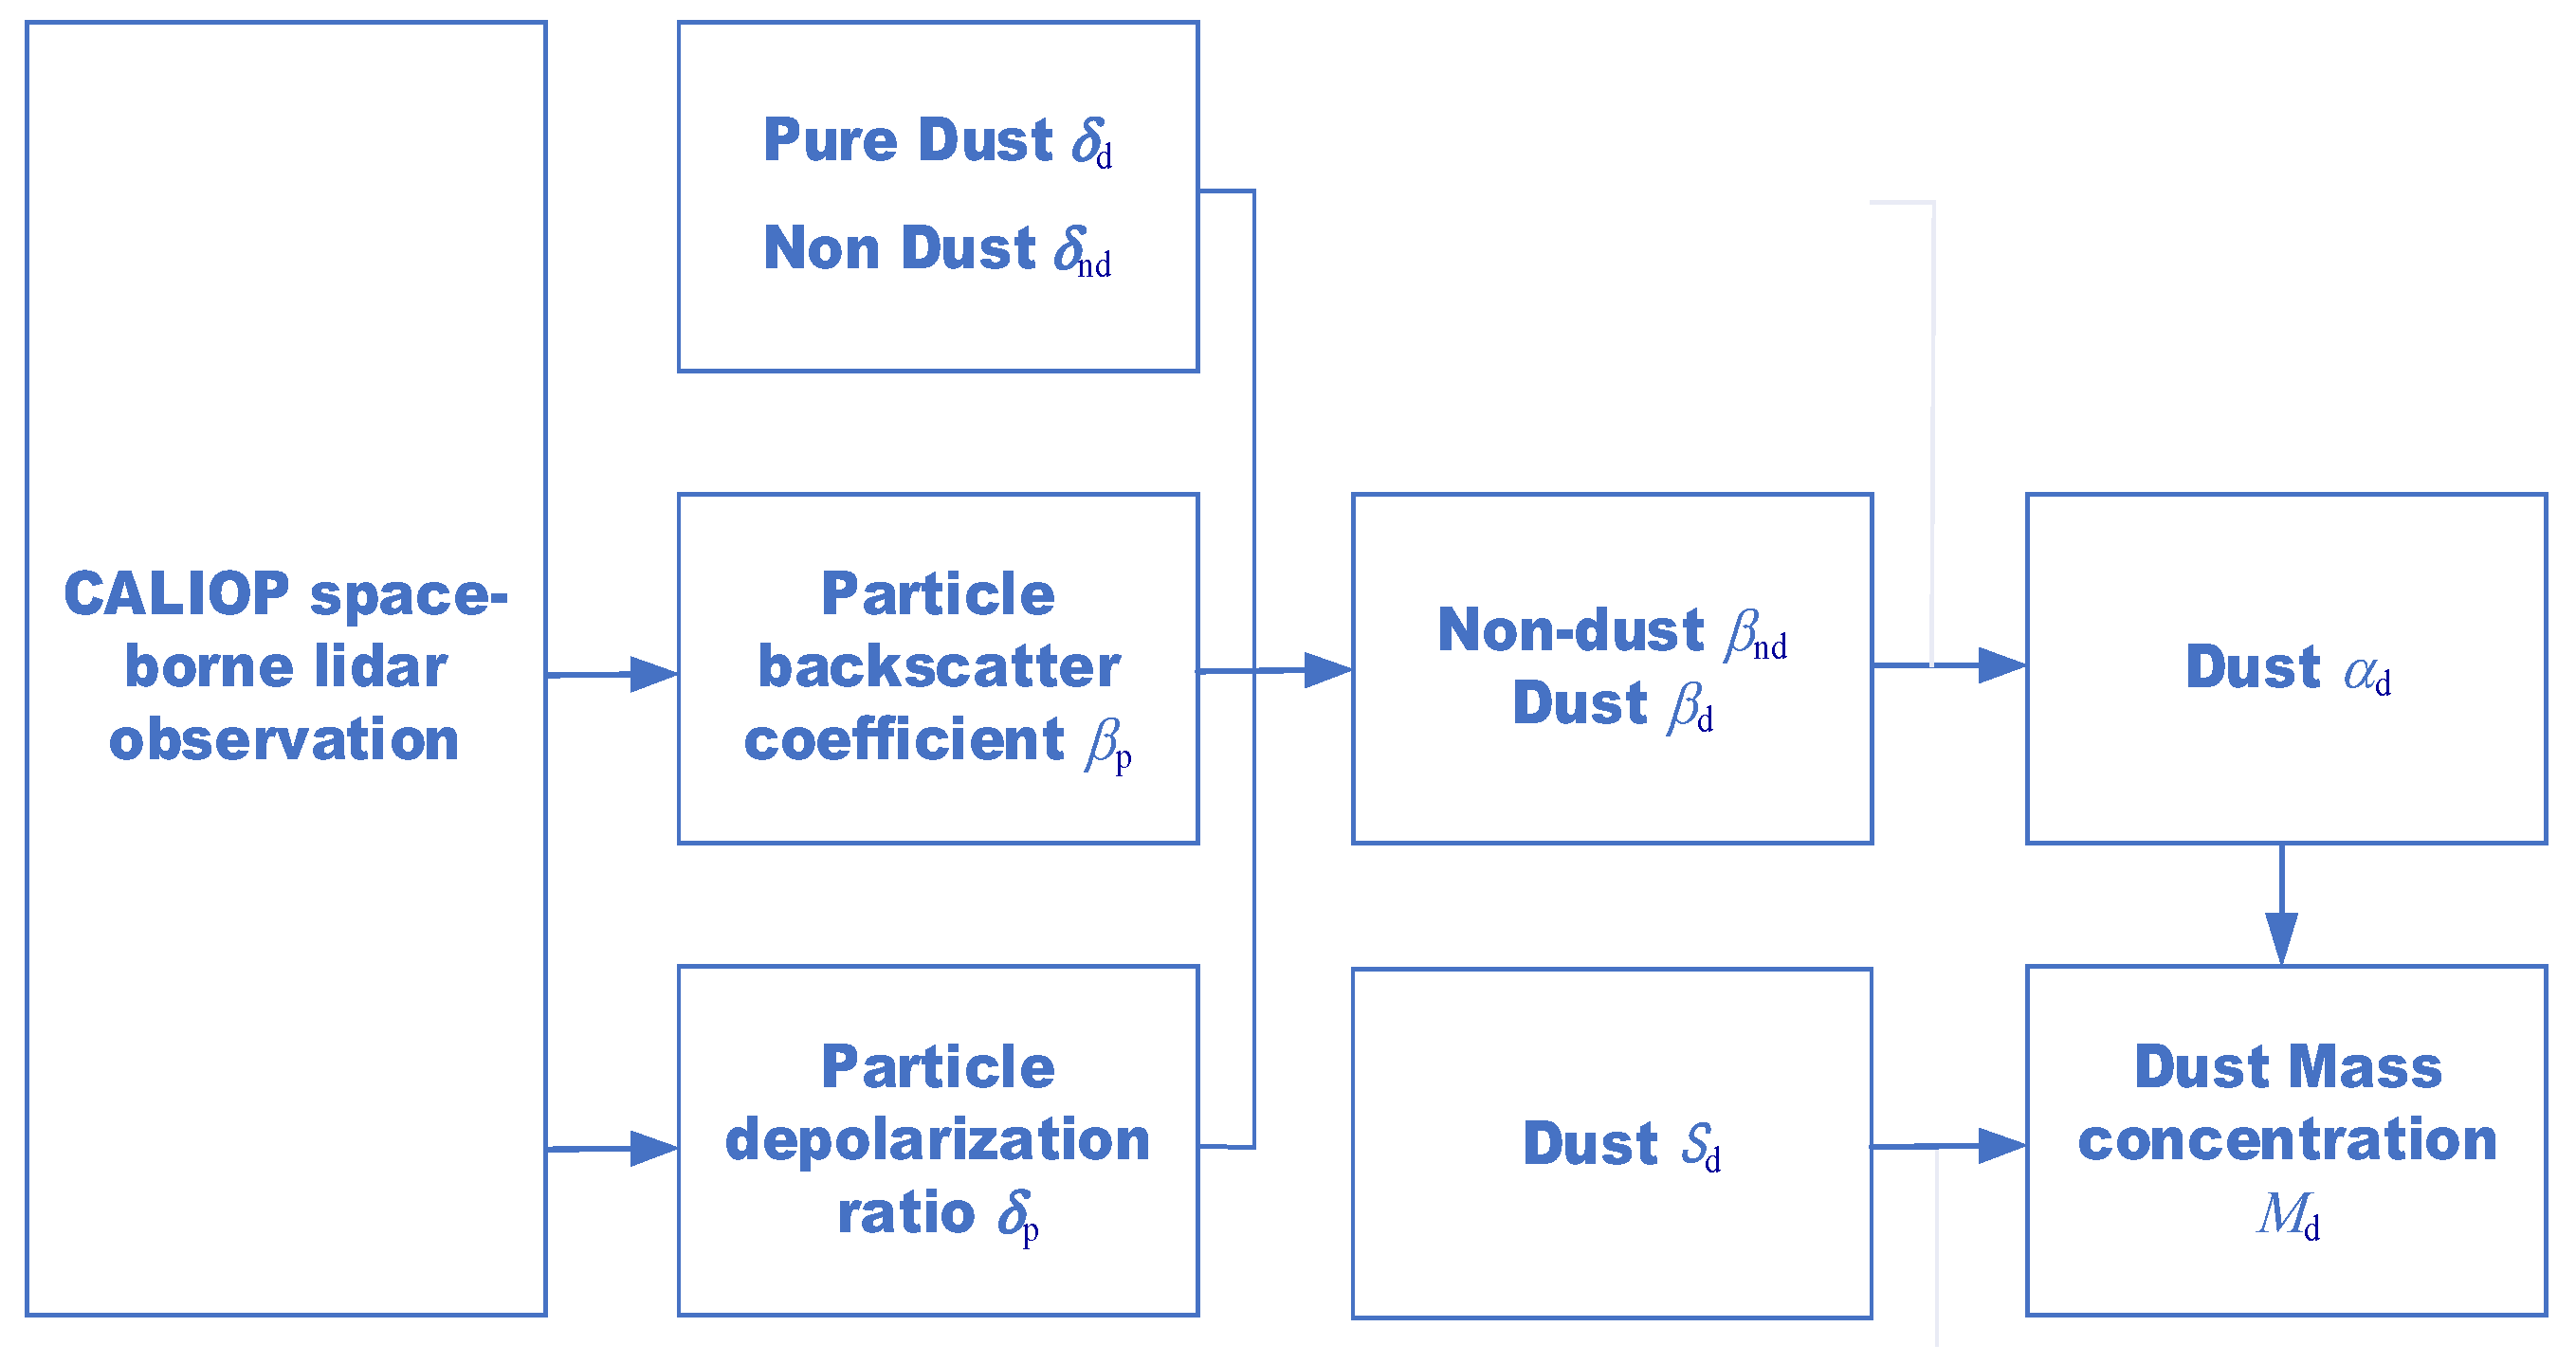
Figure 3.
Monthly-averaged dust occurrence frequency (a), and the averaging top and base heights of the dust layers (b) over the Jianghan Plain from June 2006 to March 2021 obtained from nighttime CALIOP level-2 Vertical Feature Mask data. The solid lines in (b) denote the monthly averaged altitudes; each point in (b) denotes the height for each dust layer. No valid data are available in February 2016 and July 2020.

Figure 4.
Seasonally averaged (a) extinction coefficient , (b) dust extinction coefficient , (d) dust mass concentration , (e) particle depolarization ratio , and the number of (c) , and (f) , observed by CALIOP over the Jianghan Plain (29°–32°N, 111°–114.5°E) from June 2006 to March 2021. These are calculated by the annual average with altitude, which is the layer that contains dust. Horizontal lines denote the standard deviation of each variable.

Figure 5.
Dust column mass concentration of MERRA-2 tavgM_2d_aer_Nx monthly data over the Jianghan Plain from 2006 to 2021. The different colors indicate in spring, summer, autumn, and winter. The straight lines are the linear fits of the corresponding data points. The slopes for each season are given accordingly.
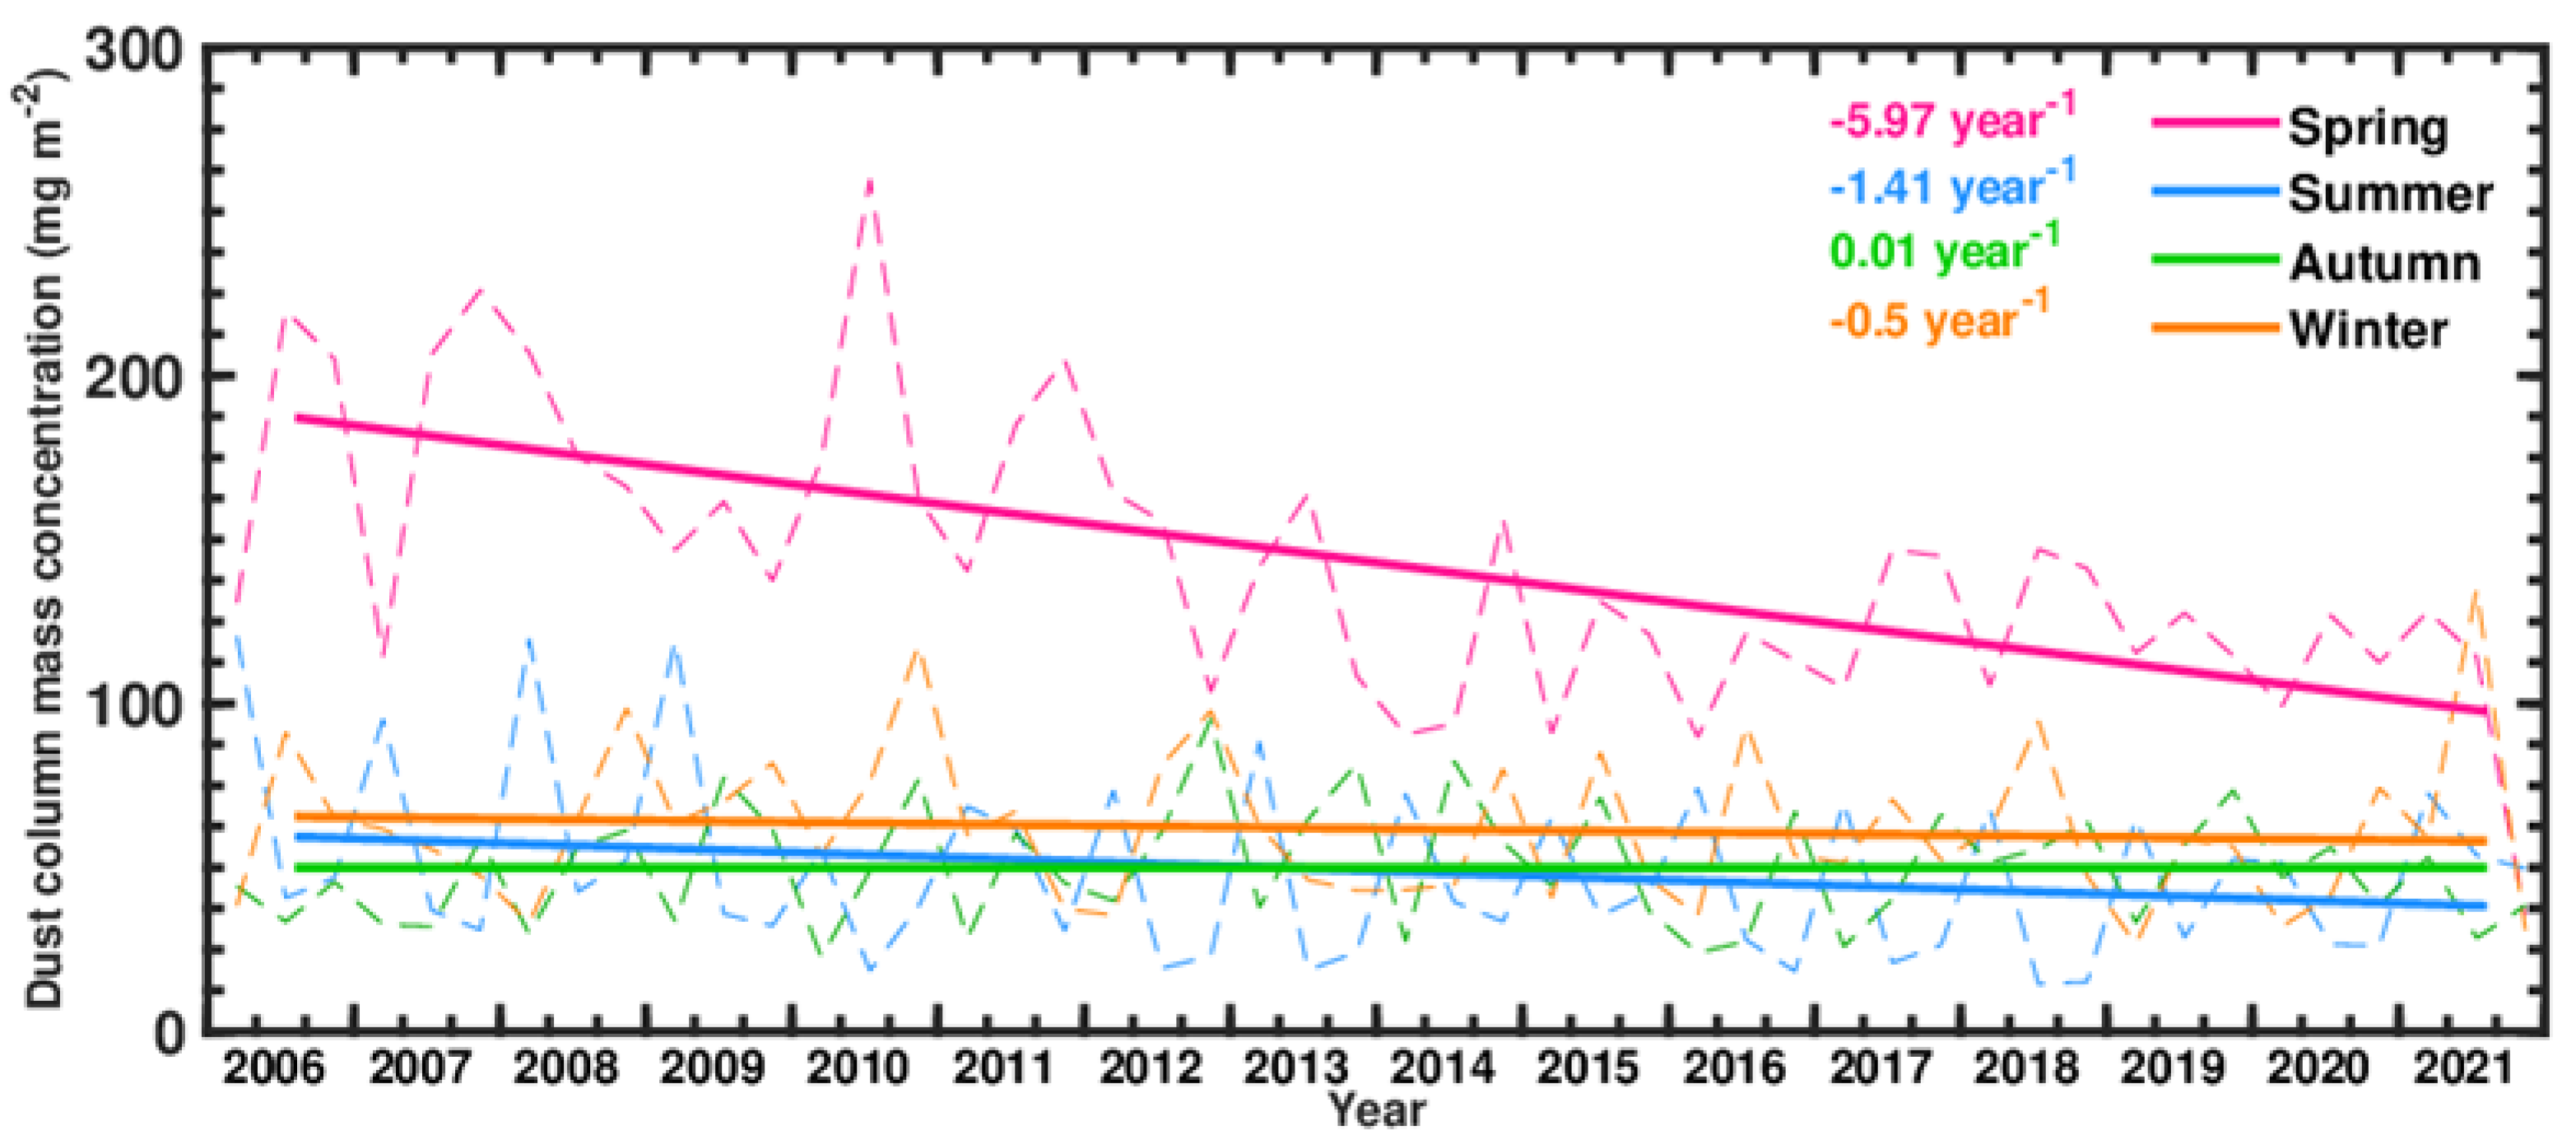
Figure 6.
Evolution of the MERRA-2 dust column mass concentration during 21–25 March 2018. These data represent the dust aerosols loading within the entire atmospheric column. Data come from atmospheric composition (2D) maps provided by the MERRA-2 Visualization tool with an interval of 12 h (https://gmao.gsfc.nasa.gov/reanalysis/MERRA-2/data_access/, accessed on 22 July 2022). The two- sectors on the maps denote the horizontal dust mass flux.

Figure 7.
Evolution of surface-observed PM10 concentrations over mainland China from 21 March to 25 March 2018. The location of the Jianghan Plain is marked by black rectangles.
Figure 7.
Evolution of surface-observed PM10 concentrations over mainland China from 21 March to 25 March 2018. The location of the Jianghan Plain is marked by black rectangles.
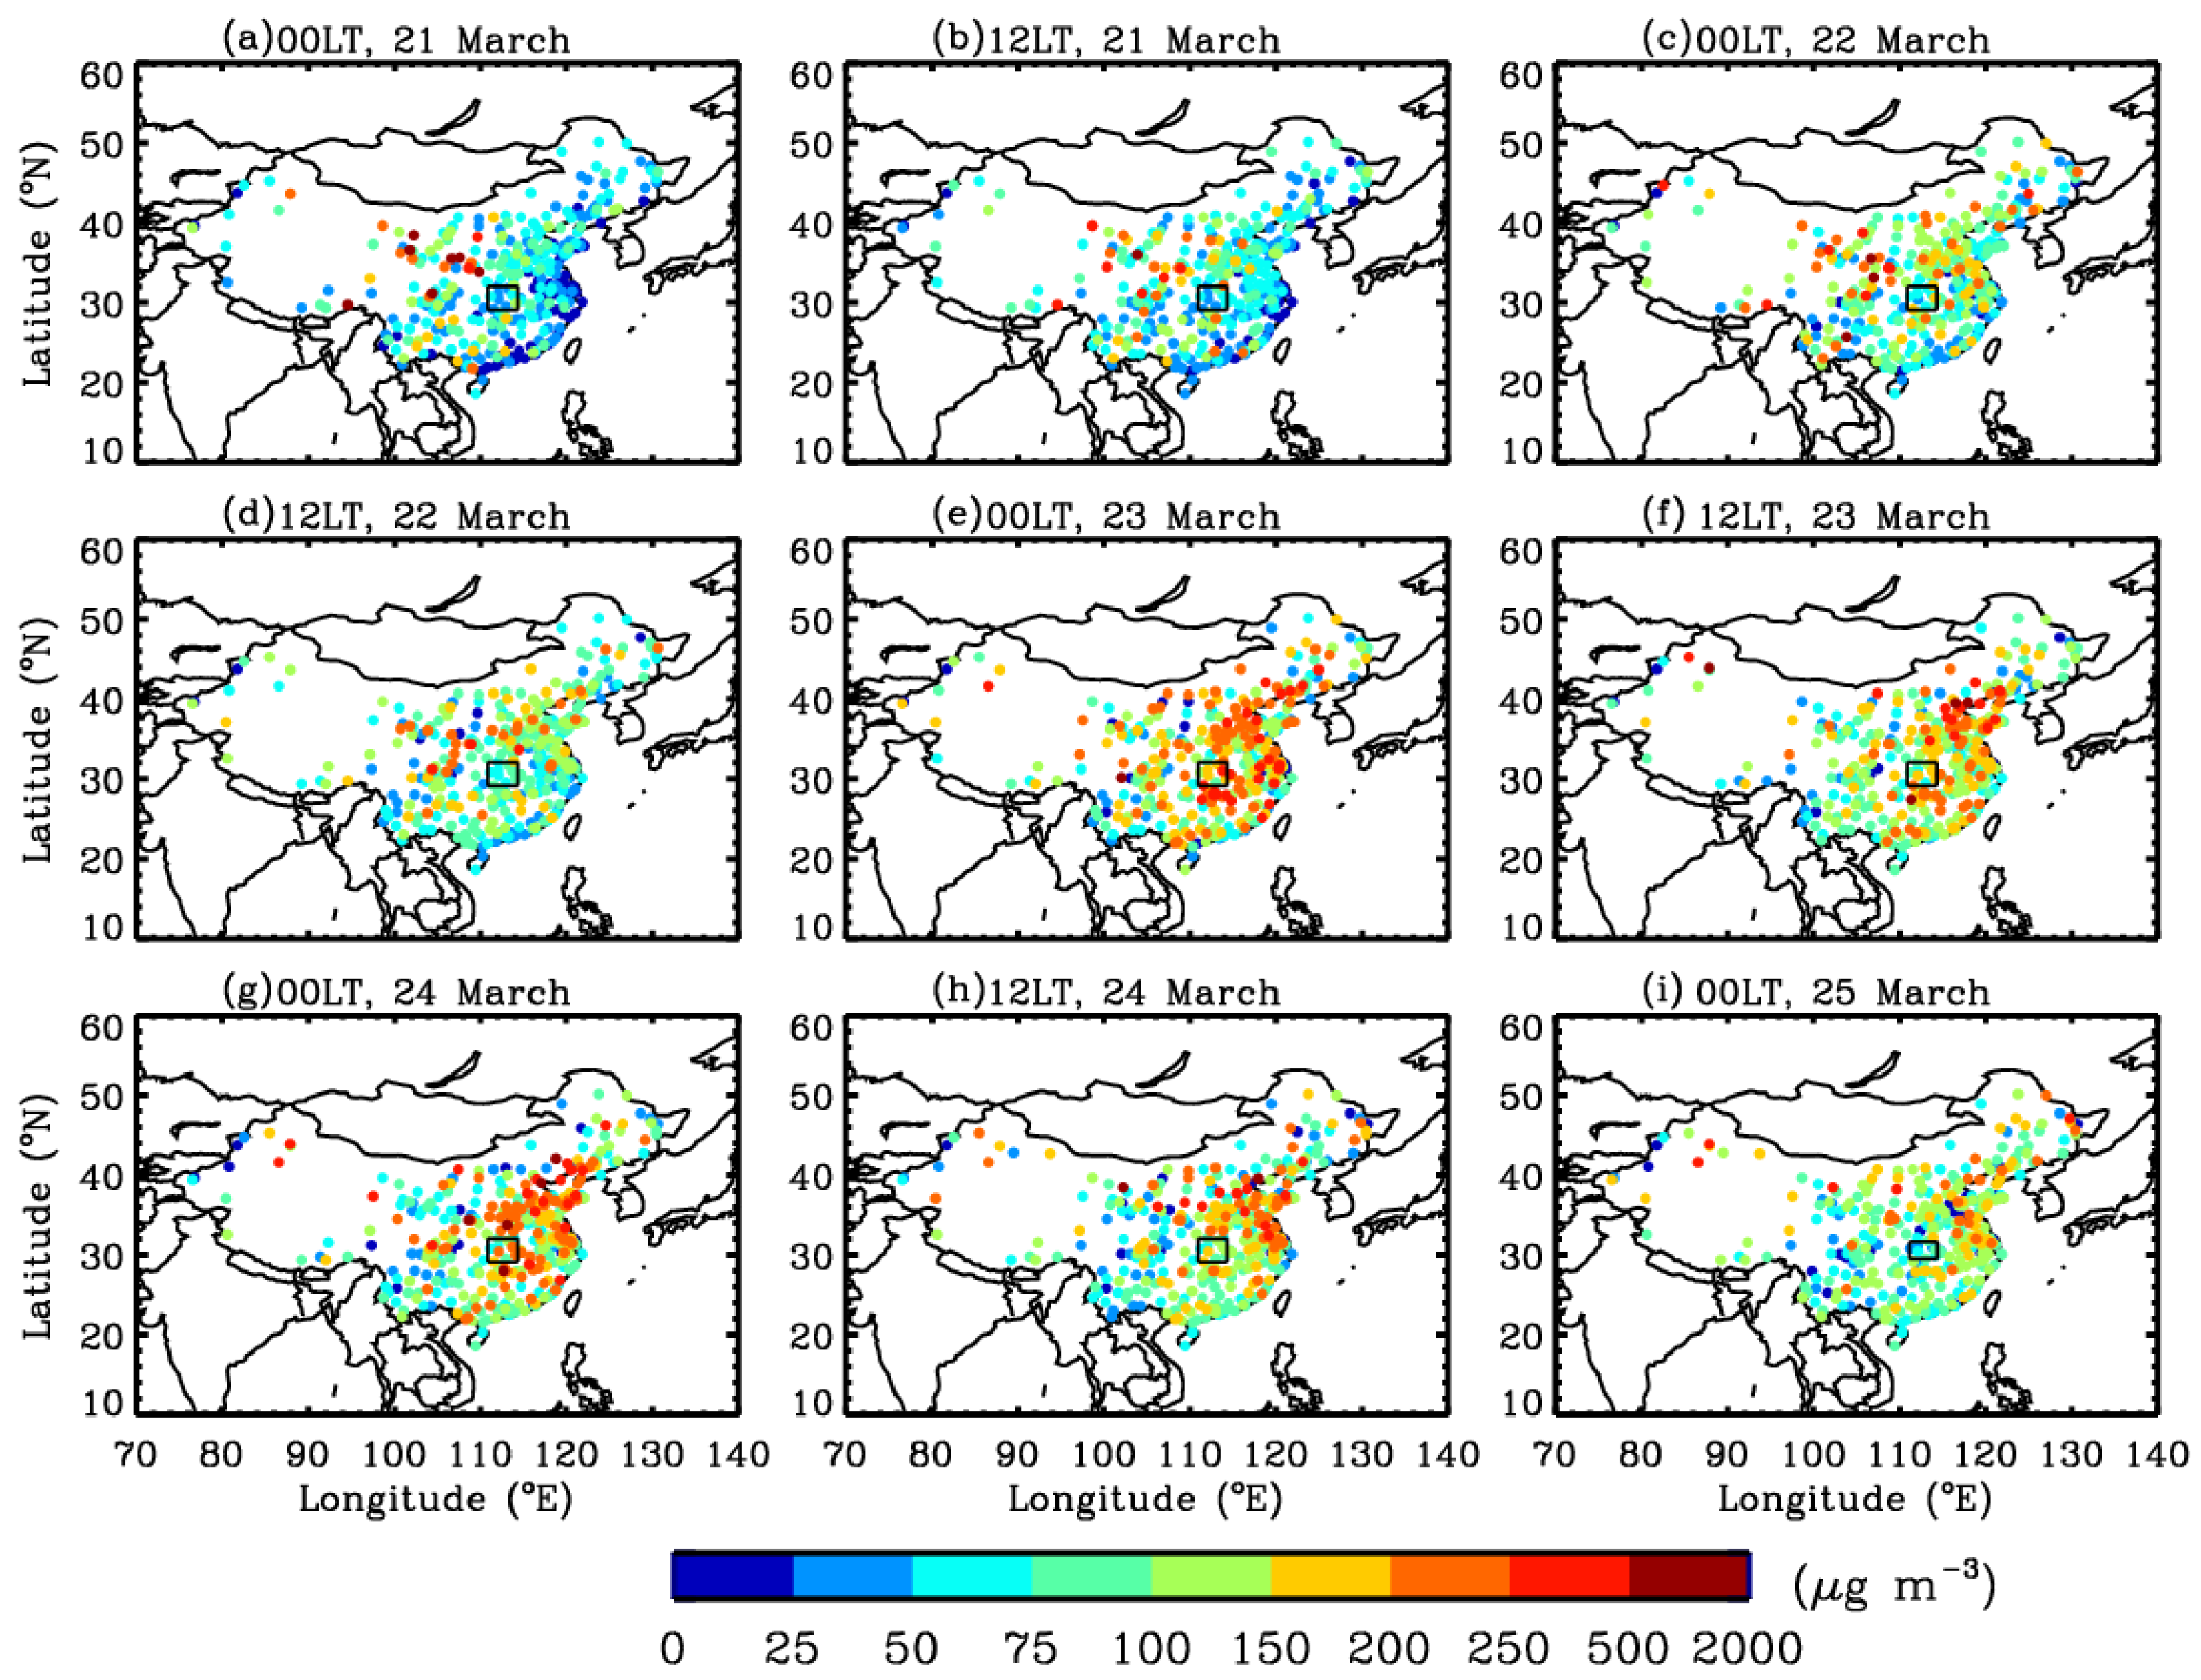
Figure 8.
Evolution of surface-observed PM10 and PM2.5 concentrations over Wuhan (a mega city in the Jianghan Plain) from 21 March to 25 March 2018.
Figure 8.
Evolution of surface-observed PM10 and PM2.5 concentrations over Wuhan (a mega city in the Jianghan Plain) from 21 March to 25 March 2018.

Figure 9.
Vertical distributions of aerosol subtypes derived from the CALIOP level-2 aerosol product Vertical Feature Mask (VFM) on 21, 22, and 24 March 2018 (a–c). The corresponding satellite trajectories for (a–c) are presented in (d).
Figure 9.
Vertical distributions of aerosol subtypes derived from the CALIOP level-2 aerosol product Vertical Feature Mask (VFM) on 21, 22, and 24 March 2018 (a–c). The corresponding satellite trajectories for (a–c) are presented in (d).
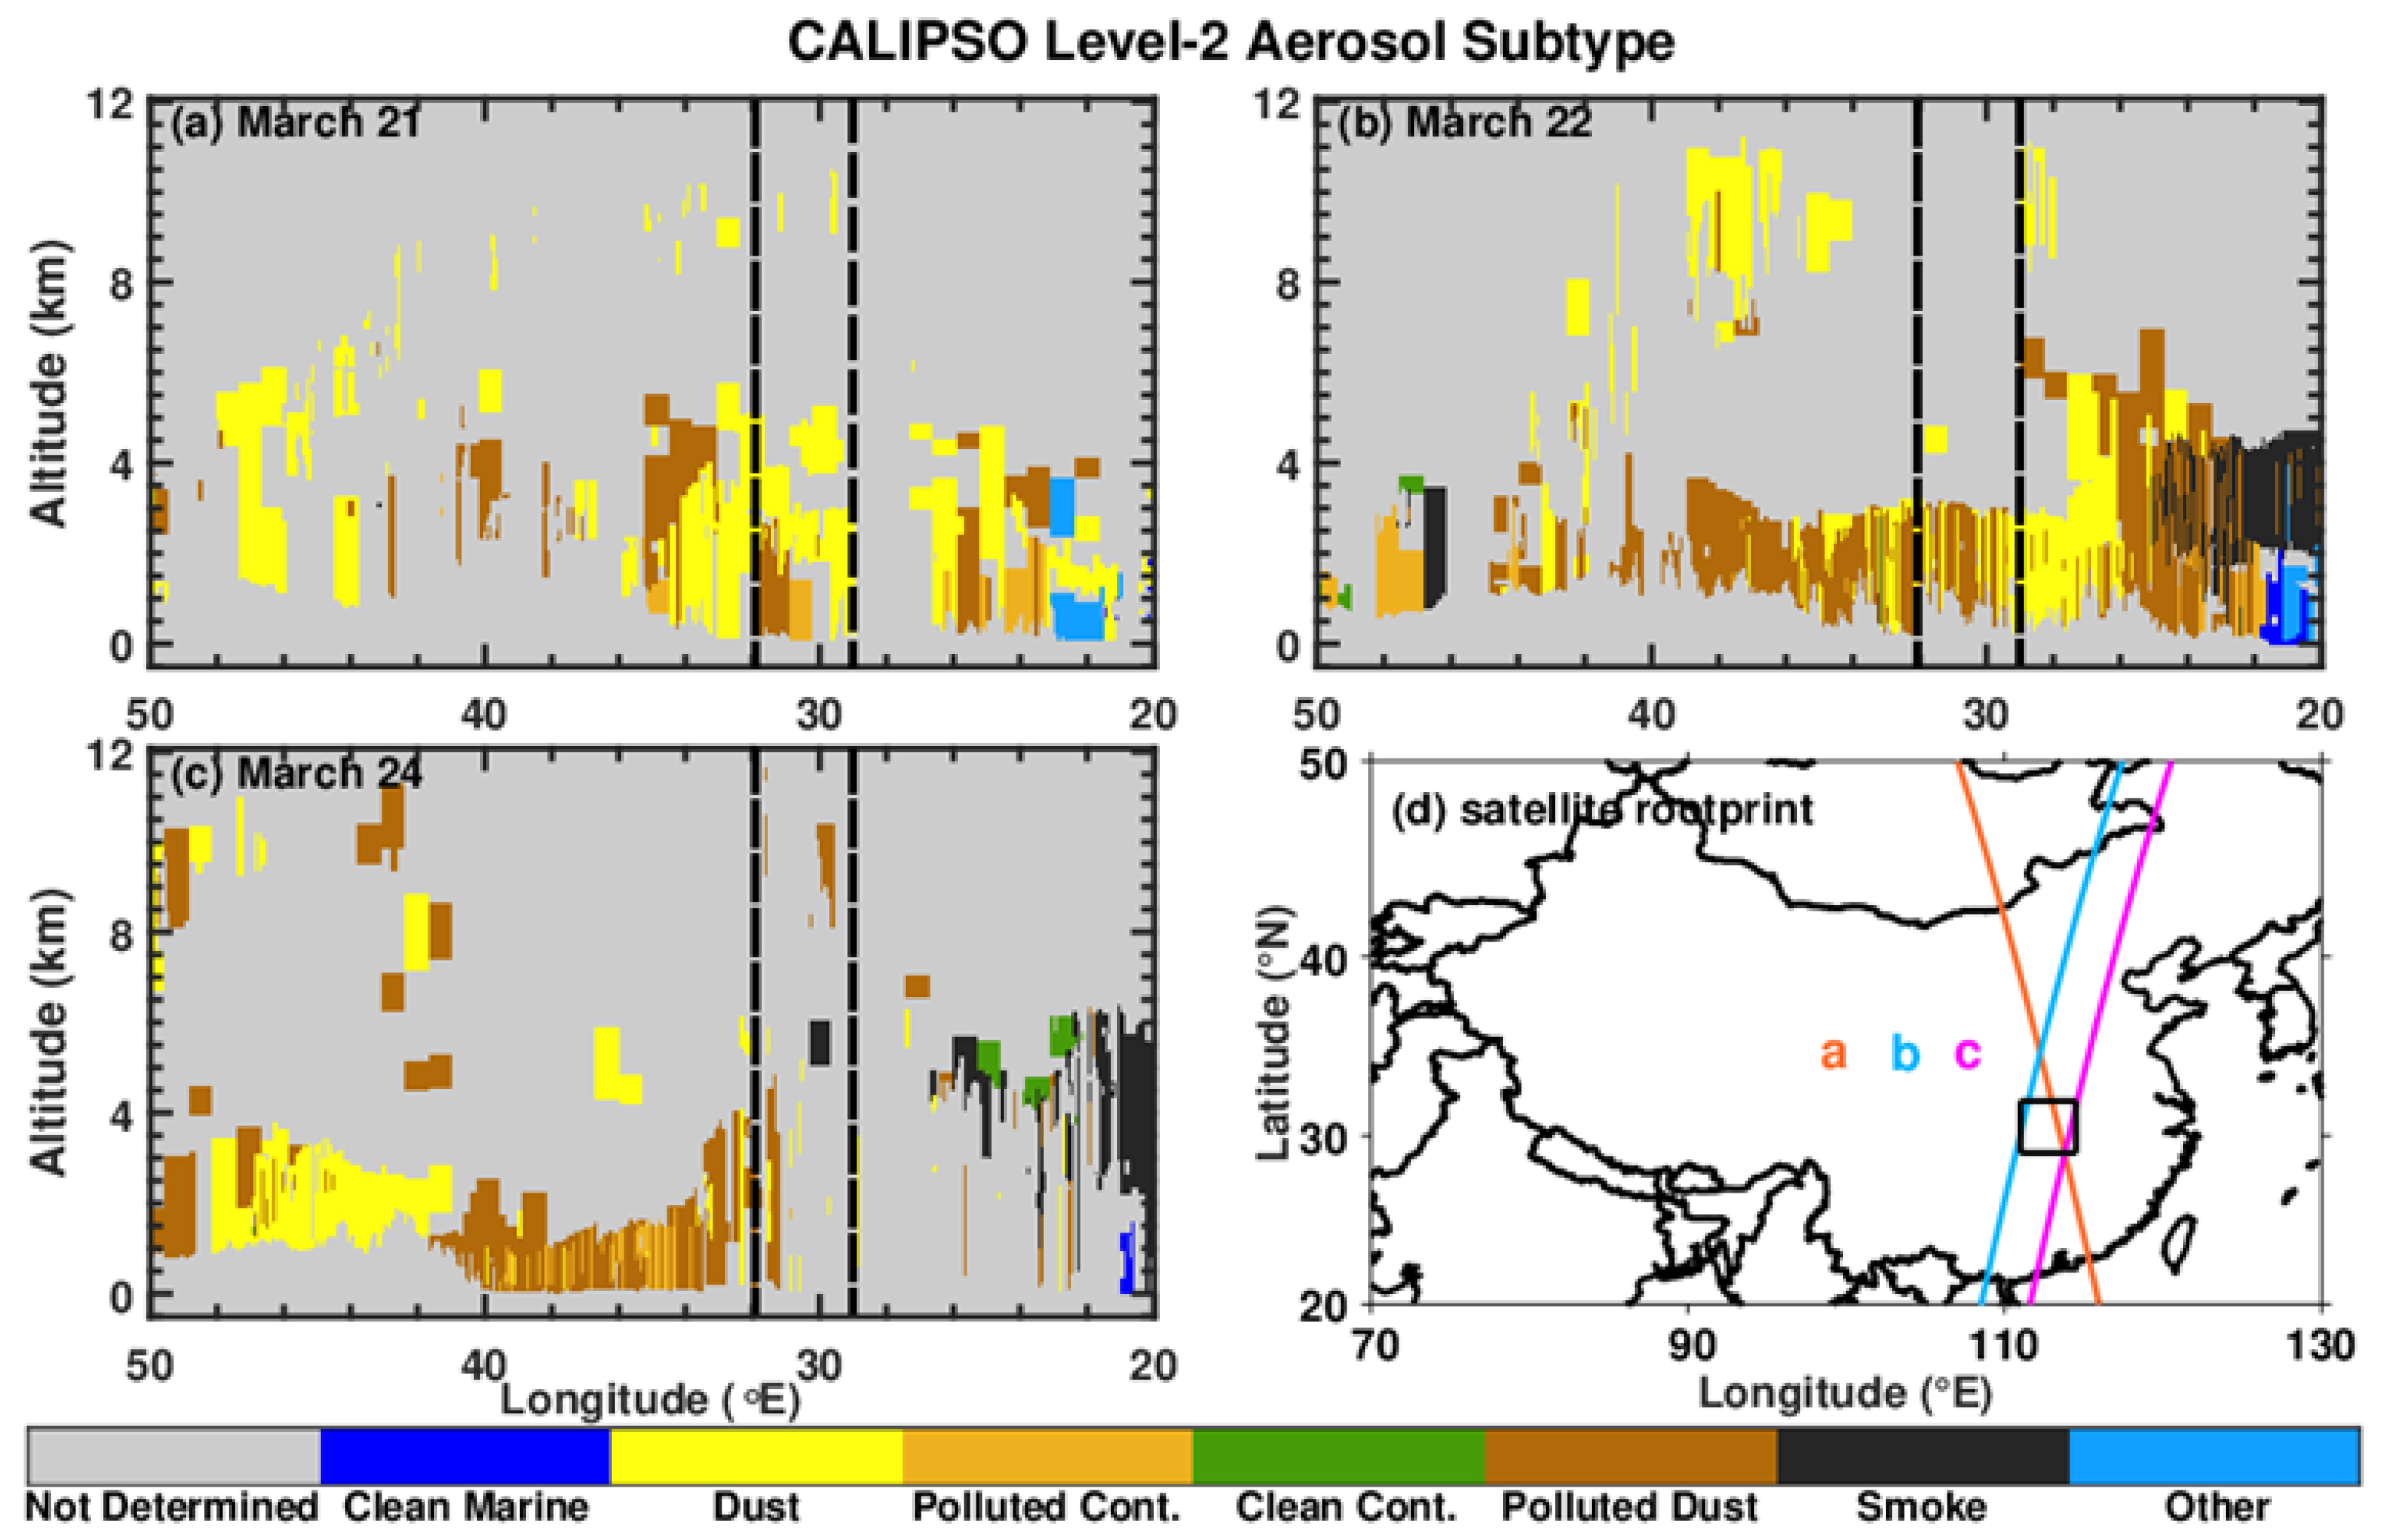
Figure 10.
CALIOP level-1B 532-nm total attenuated backscatter data (a), CALIOP level-1B 532-nm volume depolarization ratio (b), and level-2 vertical feature mask (c) on 22 March 2018. The orbit crosses the research area from 18:34:43 to 18:43:03 UTC.
Figure 10.
CALIOP level-1B 532-nm total attenuated backscatter data (a), CALIOP level-1B 532-nm volume depolarization ratio (b), and level-2 vertical feature mask (c) on 22 March 2018. The orbit crosses the research area from 18:34:43 to 18:43:03 UTC.

Figure 11.
Profiles of dust and total particle (dust + non-dust) extinction coefficients (a), dust mass concentrations (b), and particle depolarization ratios (c) observed by CALIOP over the Jianghan Plain (29.0°–32.0°N, 113.0°–113.7°E) from 05:51:46 to 05:52:35 UTC on 21 March. (d) shows the number of data points in each vertical bin for calculating the averaging , , , and . (e–h) are the same but over another part of the Jianghan Plain (30.0°–32.0°N, 111.0°–111.5°E) from 18:39:44 to 18:40:15 UTC on 22 March. The error bars represent the standard deviations. The aerosol profile on 24 March has little valid data so it is not shown.

Figure 12.
Five-day backward trajectories arrived in the Jianghan Plain at altitudes of 1.0, 2.0, and 4.5 km (in red, blue, and green) at 06:00 UTC on 21 March 2018 (a) and 18:00 UTC on 22 March 2018 (b). Tracing altitudes are determined by the altitudes of dust layers from CALIOP level-2 vertical feature mask products. Calculations are performed with the HYSPLIT model [61].

Figure 13.
Clusters of dust reaching the center of the Jianghan Plain (30°N, 112.5°E) in (a) spring, (b) summer, (c) autumn, and (d) winter, from June 2006 to March 2021 as calculated by the HYSPLIT model. All backward trajectories of the dust layers observed by CALIOP were considered.
Figure 13.
Clusters of dust reaching the center of the Jianghan Plain (30°N, 112.5°E) in (a) spring, (b) summer, (c) autumn, and (d) winter, from June 2006 to March 2021 as calculated by the HYSPLIT model. All backward trajectories of the dust layers observed by CALIOP were considered.
Publisher’s Note: MDPI stays neutral with regard to jurisdictional claims in published maps and institutional affiliations. |
© 2022 by the authors. Licensee MDPI, Basel, Switzerland. This article is an open access article distributed under the terms and conditions of the Creative Commons Attribution (CC BY) license (https://creativecommons.org/licenses/by/4.0/).
Share and Cite
MDPI and ACS Style
Liu, C.; Yin, Z.; He, Y.; Wang, L. Climatology of Dust Aerosols over the Jianghan Plain Revealed with Space-Borne Instruments and MERRA-2 Reanalysis Data during 2006–2021. Remote Sens. 2022, 14, 4414. https://doi.org/10.3390/rs14174414
AMA Style
Liu C, Yin Z, He Y, Wang L. Climatology of Dust Aerosols over the Jianghan Plain Revealed with Space-Borne Instruments and MERRA-2 Reanalysis Data during 2006–2021. Remote Sensing. 2022; 14(17):4414. https://doi.org/10.3390/rs14174414
Chicago/Turabian StyleLiu, Chuan, Zhenping Yin, Yun He, and Longlong Wang. 2022. "Climatology of Dust Aerosols over the Jianghan Plain Revealed with Space-Borne Instruments and MERRA-2 Reanalysis Data during 2006–2021" Remote Sensing 14, no. 17: 4414. https://doi.org/10.3390/rs14174414
Note that from the first issue of 2016, this journal uses article numbers instead of page numbers. See further details here.