
Automated Detection of Retrogressive Thaw Slumps in the High Arctic Using High-Resolution Satellite Imagery

 , ,
, ,
Abstract
:1. Introduction

| Reference | Description | Morphology/Morphometry | Prevalence |
|---|---|---|---|
| [31] | A slope failure mechanism characterized by the melting of groundice, and downslope sliding and flowing of the resulting debris. Retrogressive thaw slumps consist of a steep headwall that retreats in a retrogressive fashion due to thawing and that slides down the face of the headwall and flows away. | A steep headwall that retreats in a retrogressive fashion. Debris flow formed by the mixture of thawed sediment and meltwater | Slumps are common in ice-rich glaciolacustrine sediments and fine-grained diamictons. |
| [33] | Active geomorphological features in permafrost terrain. They consist of steep ice-rich headwall and a mudflow of a gentle gradient. | Banks of northern rivers | |
| [55] | A type of backwasting thermokarst common along arctic coasts characterized by massive ground ice. | ||
| [56] | Comprise a steep headwall and footslope of lower gradient. Thawing turns ice-rich permafrost into a mud slurry that falls to the base of the exposure to form the scar area. | ||
| [35] | Consists of a headwall of exposed ground ice and a foot slope of viscous, thawed sediments | Several hectares in size | |
| [57] | Dynamic thermokarst features in ice-rich permafrost terrain. | Along the shorelines of lakes and rivers, coastlines and hillslopes | |
| [13] | Horseshoe or cusp-shaped mass wasting features consisting of an ablating headwall of ice-rich permafrost that feeds downslope flows of fluidized sediment. | Headwall | |
| [58] | Thermokarst landforms resulting from the thawing of ice-rich permafrost. Triggering mechanisms including lateral stream erosion and active layer detachments are responsible for RTSs. | ||
| [34] | Typical landforms related to processes of rapidly thawing and degrading hillslope permafrost. Occurred due to mass-wasting processes. | Typically have a small size (<10 ha, with a few exceptions reaching up to ~1 km2), as well as a wide range of appearances and dynamics | Regions with massive amounts of buried ice, as preserved in the moraines of former glaciations or regions with thick syngenetic ice-wedges in yedoma permafrost or icy epigenetic permafrost |
| [47] | RTS are abrupt permafrost disturbances that result from slope failure after thawing of ice-rich permafrost. Fluvial processes, thermo-erosion or mass wasting following heavy precipitation events and the exposure of ice-rich permafrost | RTSs vary in size, ranging from under 0.15 ha to mega slumps of 52 ha and more | Ice-rich yedoma regions or formerly glaciated areas that still contain permafrost-preserved buried glacial ice |
| Reference | Study Area | Data | Mode | Resolution | Analysis | Comment |
|---|---|---|---|---|---|---|
| [59] | Dome Wallis wellsite, King Christian Island, Chevron Parker river, wellsite, Banks Island in Canada | Aerial photographs | Optical | - | general discussion about terrain disturbances | |
| [60] | Russian Arctic region | Field observations and aerial imagery | Optical | - | Manual image interpretation | related to ground ice and relief evolution |
| [61] | Fosheim peninsula, Ellesmere Island, NWT in Canada | SPOT Panchromatic | Optical | 10 m | Manual comparison. Image enhancement using histogram stretching, | 16 sites |
| [62] | Eureka, Ellesmere Island, Nunavut in Canada | Topographic maps. Aerial photographs and field measurements | Optical | - | Area of 1887 km2 | |
| [55] | Herschel island, Yukon territory; Mackenzie delta region, NWT, in Canada | RADARSAT-1, SAR, SPOT | Optical | 5–10 m | collection of abstracts | |
| [55] | Herschel Island in Canada | IKONOS satellite imagery | Optical | 1 m | Differential global positioning system surveys and stereo-photogrammetric methods | Data from 1952, 1970, 2004 |
| [63] | Herschel Island in Canada | IKONOS satellite imagery | Optical | 2 m DEM | Photogrammetric processing | Data from 1952, 1970, 2000 |
| [64] | Mackenzie delta region, NWT, in Canada | Aerial imagery | Optical | 1:40,000 1:54,000 1:30,000 | Manual | Area of 3739 km2 |
| [65] | Mayo, central Yukon in Canada | Aerial imagery and ground surveys | Optical | - | - | Three thaw slumps |
| [56] | tundra uplands east of the Mackenzie Delta in Canada | Aerial imagery and ground surveys | Optical | - | Area of 3370 km2 | |
| [66] | Kavik Plateau; Richardson Mountains NWT in Canada | Aerial imagery | Optical | - | Manual | Data from 1950–2004 |
| [67] | Herschel Island in Canada | TerraSAR-X, RADARSAT-2 and ALOS-PALSAR | Microwave | Automated | Area of 108 km2 Years 2007–2011 | |
| [57] | Richardson Mountains, NWT, in Canada | Landsat TM/ETM imagery | Optical | 30 m | Automated; Tasseled Cap brightness, wetness and greenness indices | Area pf 18,000 km2 Data from 1985–2011 |
| [68] | Fosheim Peninsula of northern Ellesmere Island in Canada | SPOT imagery | Optical | 10 m | Manual | |
| [23] | Peel Plateau, northwestern NWT in Canada | SPOT imagery | Optical | 10 m | Manual (least one trained observer and one expert reviewer) | 1,274,625 km2 Data from 2005–2010 |
| [69] | Richardson Mountains and Peel Plateau region, NWT in Canada | Landsat TM/ETM imagery | Optical | 30 m | Automated; Tasseled Cap (TC) trend analysis | Data from 1990–2010 |
| [70] | Yukon Coast in Canada | high-resolution satellite imagery (?); Aerial imagery; LiDAR | Optical, LiDAR | Data from 1952–1972 and 1972–2011 | ||
| [71] | Yukon Coastal Plain in Canada; Bykovsky Peninsula in Russia | TanDEM-X | Microwave | 30 cm vertical | Area of 238 km Data from 2011 | |
| [72] | The Stony Creek and Vittrekwa River watersheds of the Peel Plateau in Canada | Samples collected by on-foot and helicopter | Area of 3000 km2 | |||
| [28] | Noatak valley in Alaska | Aerial imagery | Optical | 4–7 cm | digital photogrammetry | Area of 2900 km2 |
| [13] | Eureka Sound Lowlands, Ellesmere and Axel Heiberg Islands in Canada | Worldview-1, Worldview-2, Worldview-3, Arctic DEM | Optical | 1 m | Manual | 30-year record from 1989 to2018 of field observation; 2011–2018 of field/VHSR mapping |
| [73] | Qinghai-Tibet Plateau. China | Gaofen-1. WorldView-1, SPOT-5 satellite imagery | Optical | 2.0 m, 0.5 m, 2.5 m | manual interpretation | Data from 2008 to 2017 |
| [25] | NWT, Canada | TanDEM-X | Microwave | Data from 2011 | ||
| [58] | Tibetan Plateau, China | PlanetScope imagery | Optical | 3 m | Automated; Siamese neural network | Data from 2017–2018 |
| [74] | Tibetan Plateau, China | PlanetScope imagery | Optical | 3 m | Automated; Deep learning CNNs (DeepLabV3+) | Area of 5200 km2 Data from year 2018 |
| [75] | Ymala, Gydan, Taymyr, Chukotka in Russia; Noalak in Alaska; Peel, Tuktoyaktuk, Banks, Elsmere in Canada | TanDEM-X | Microwave | Area of 220,000 km2 Data from 2010–2017 | ||
| [25] | NWT, Canada | TanDEM-X | Microwave | Data from 2011–2017 | ||
| [29] | Mackenzie River Delta and on Banks Island in Canada | TanDEM-X | Microwave | |||
| [48] | Tibetan Plateau, China | PlanetScope imagery | Optical | 3 m | Deep learning CNNs (DeepLabV3+) | |
| [34] | Lena River, Horton Delta, Herschel Island, Kolguev Island, Tuktoyaktuk Peninsula, Banks Island in Canada | PlanetScope imagery, ArcticDEM and multi-temporal Landsat Tasseled Cap Trend data | Optical | 3 m optical and 2 m ArcticDEM | automated; (UNet, UNet++, DeepLabv3) | Area of 100 km2 |
| [48] | Beiluhe region, Tibetan plateau in China | Cubesat imagery | Optical | 3 m | siamese neural network | |
| [47] | High latitudes of Siberia in Russia, | Landsat and Sentinel-2 images: time series; Rapideye, Planetscope imagery | Optical | 30 m, 5 m, 3 m | LandTrendr algorithm | Area of 8.1 × 10⁶ km2 Data from 2001–2019 |
2. Methods
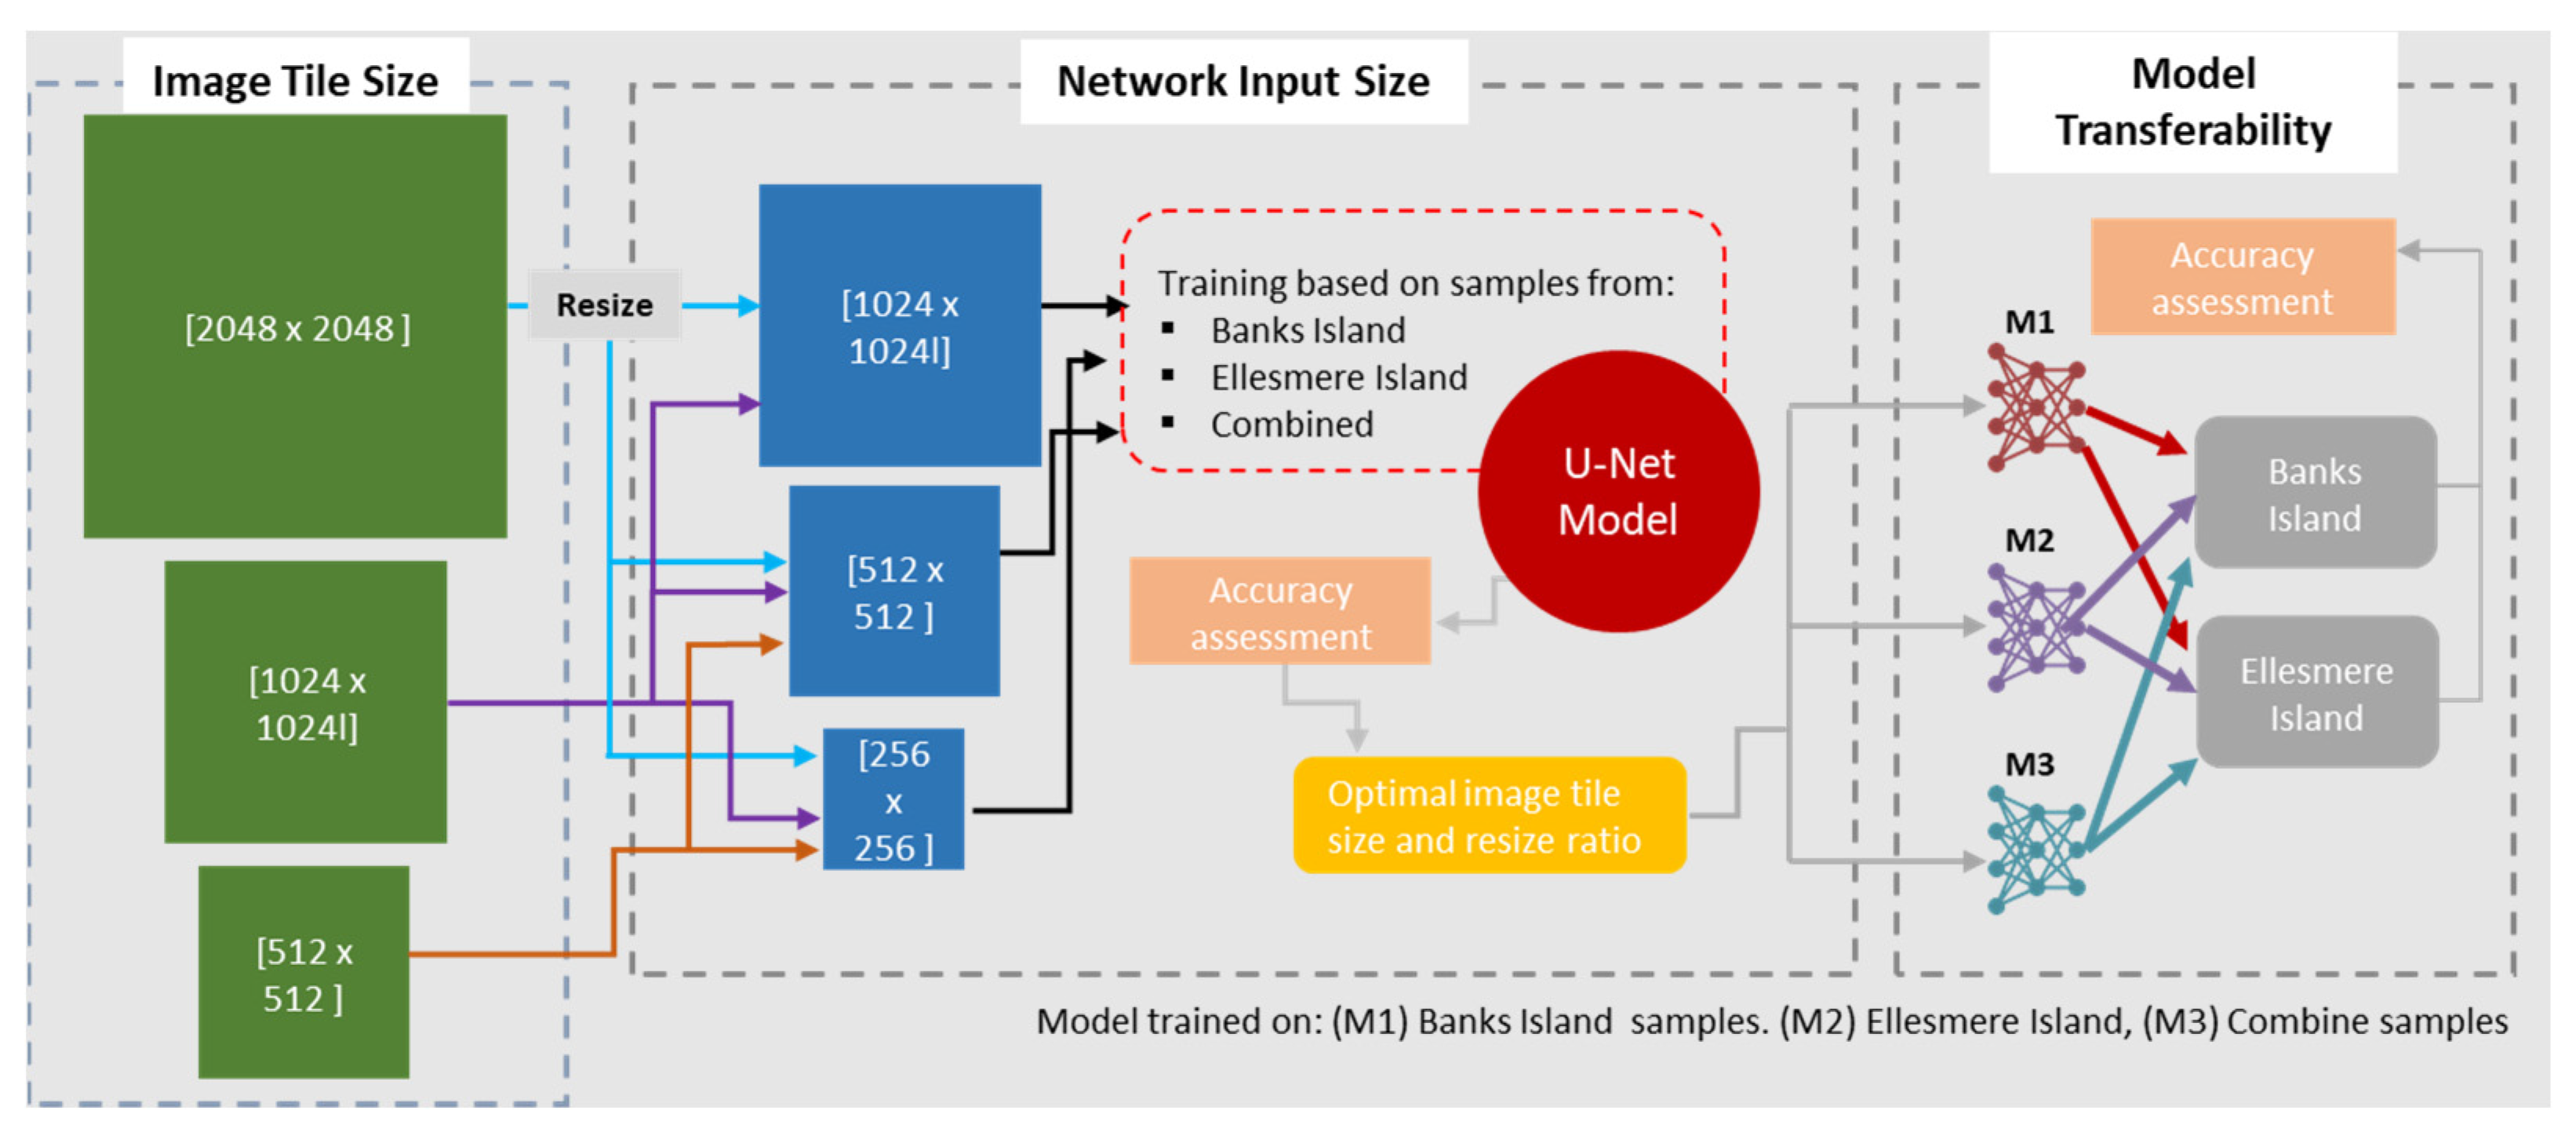
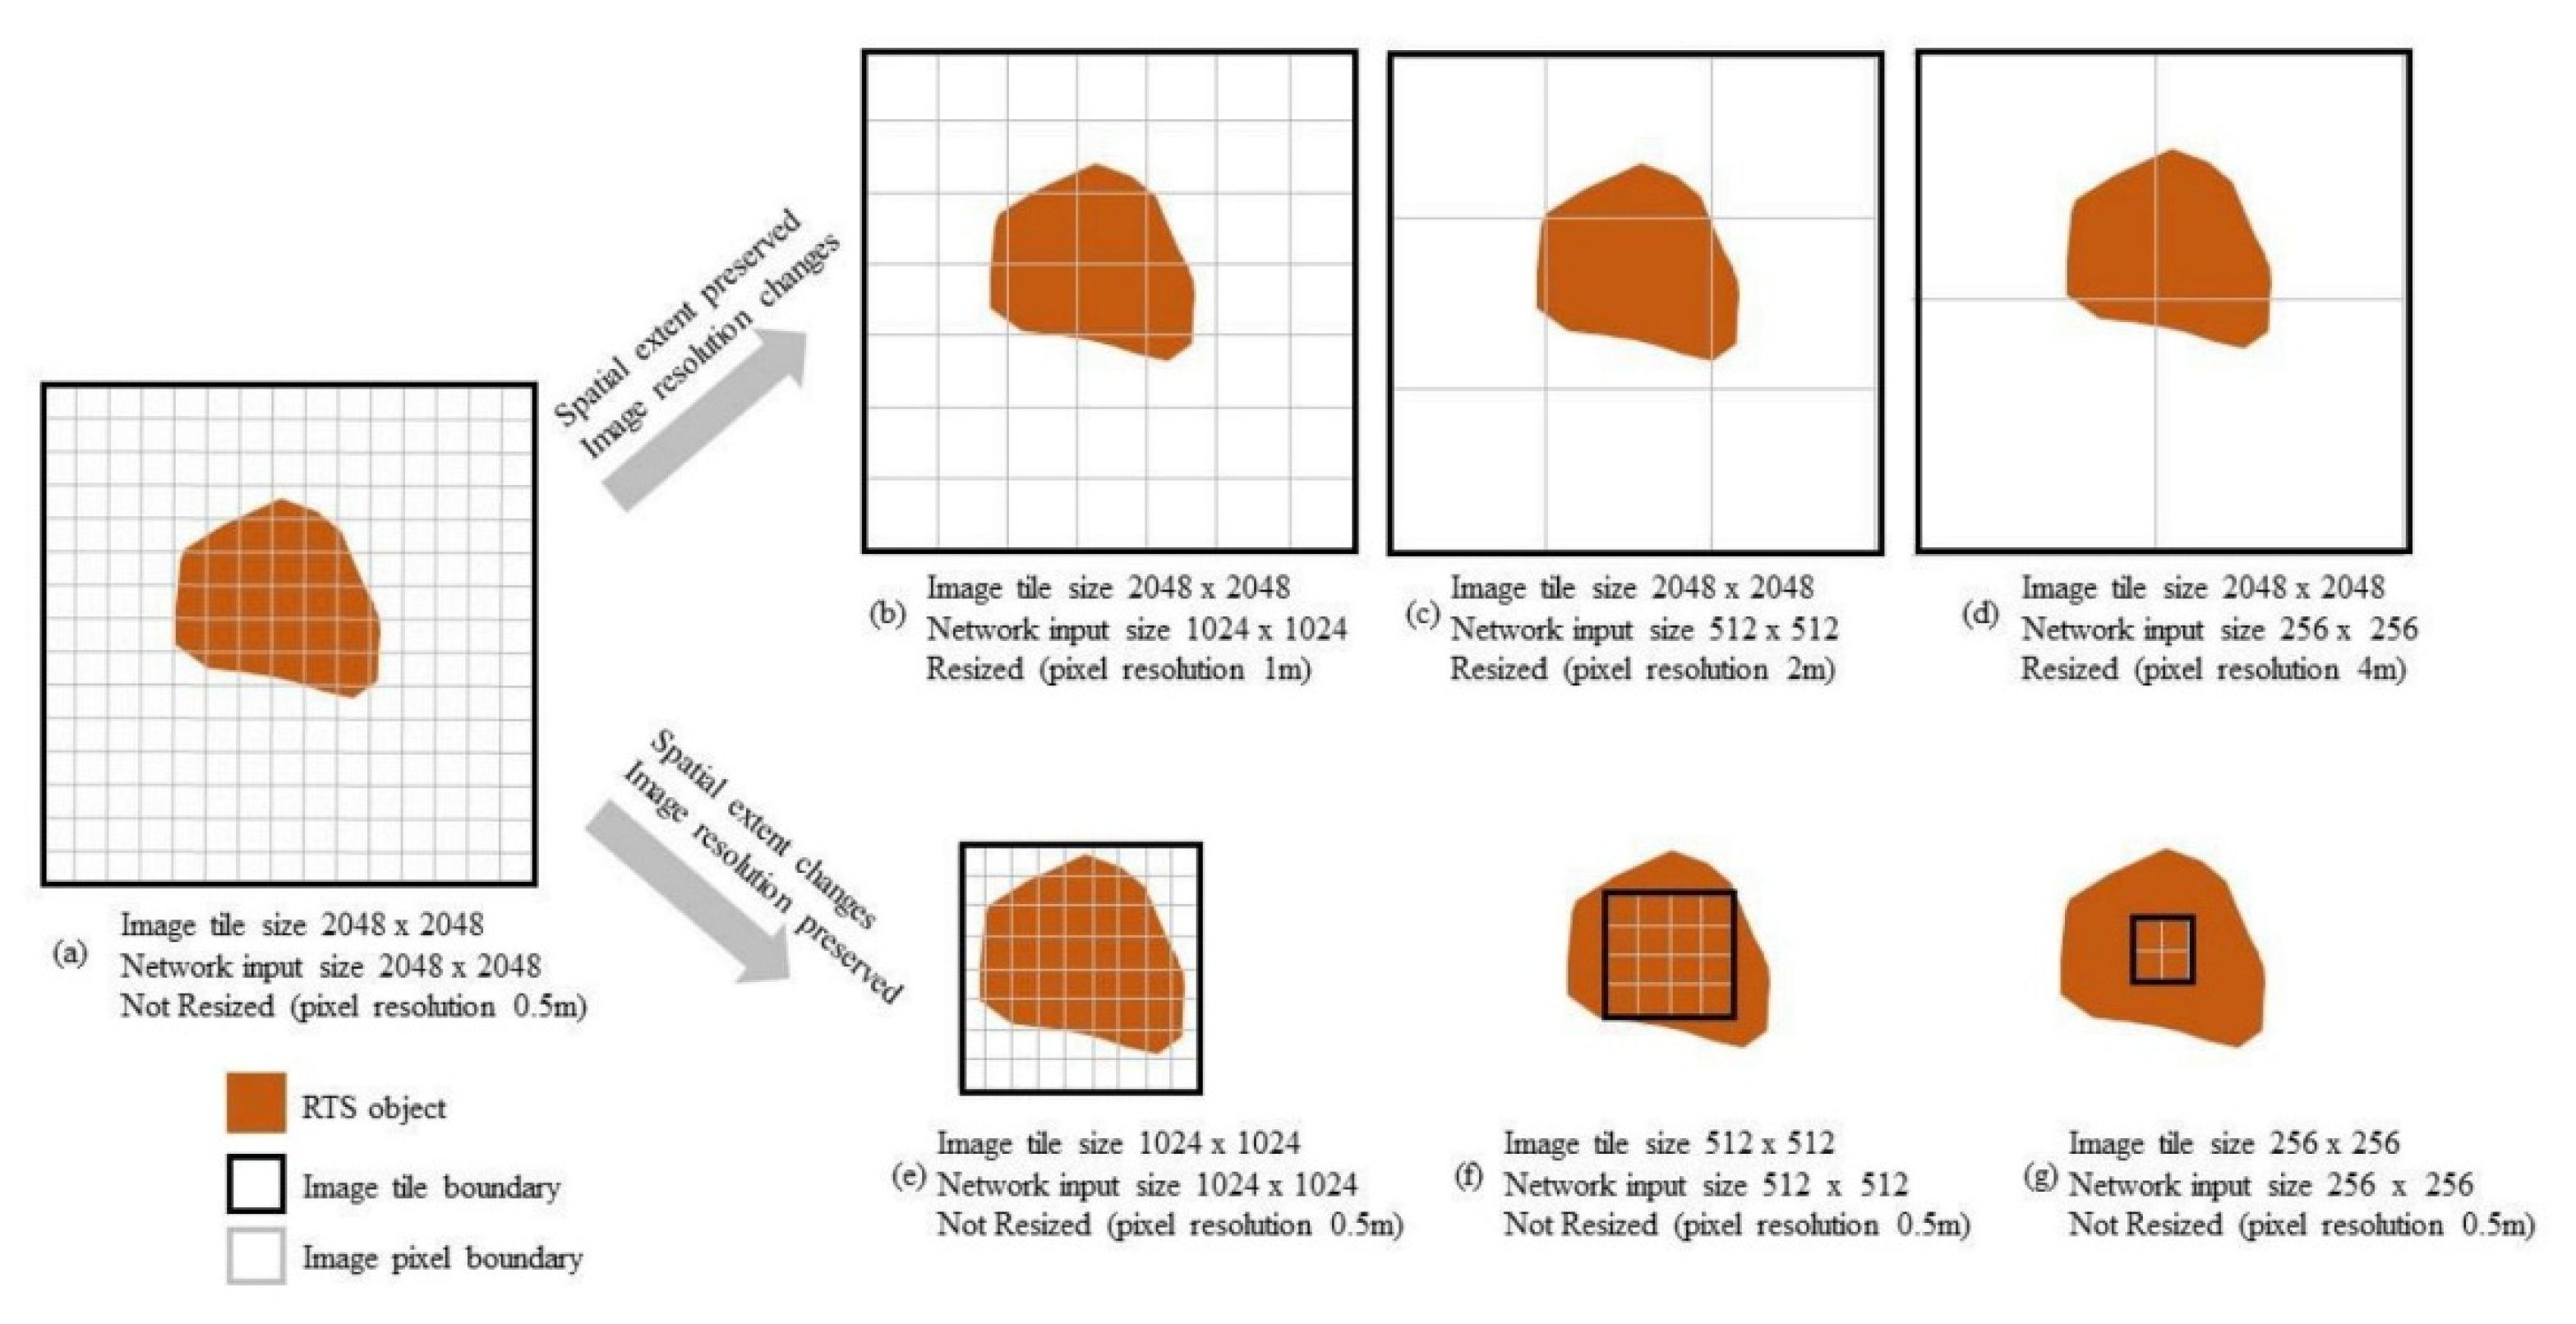
2.1. Study Area and Image Data
2.2. Training Data Production
2.3. Retrogressive Thaw Slump Modelling Framework
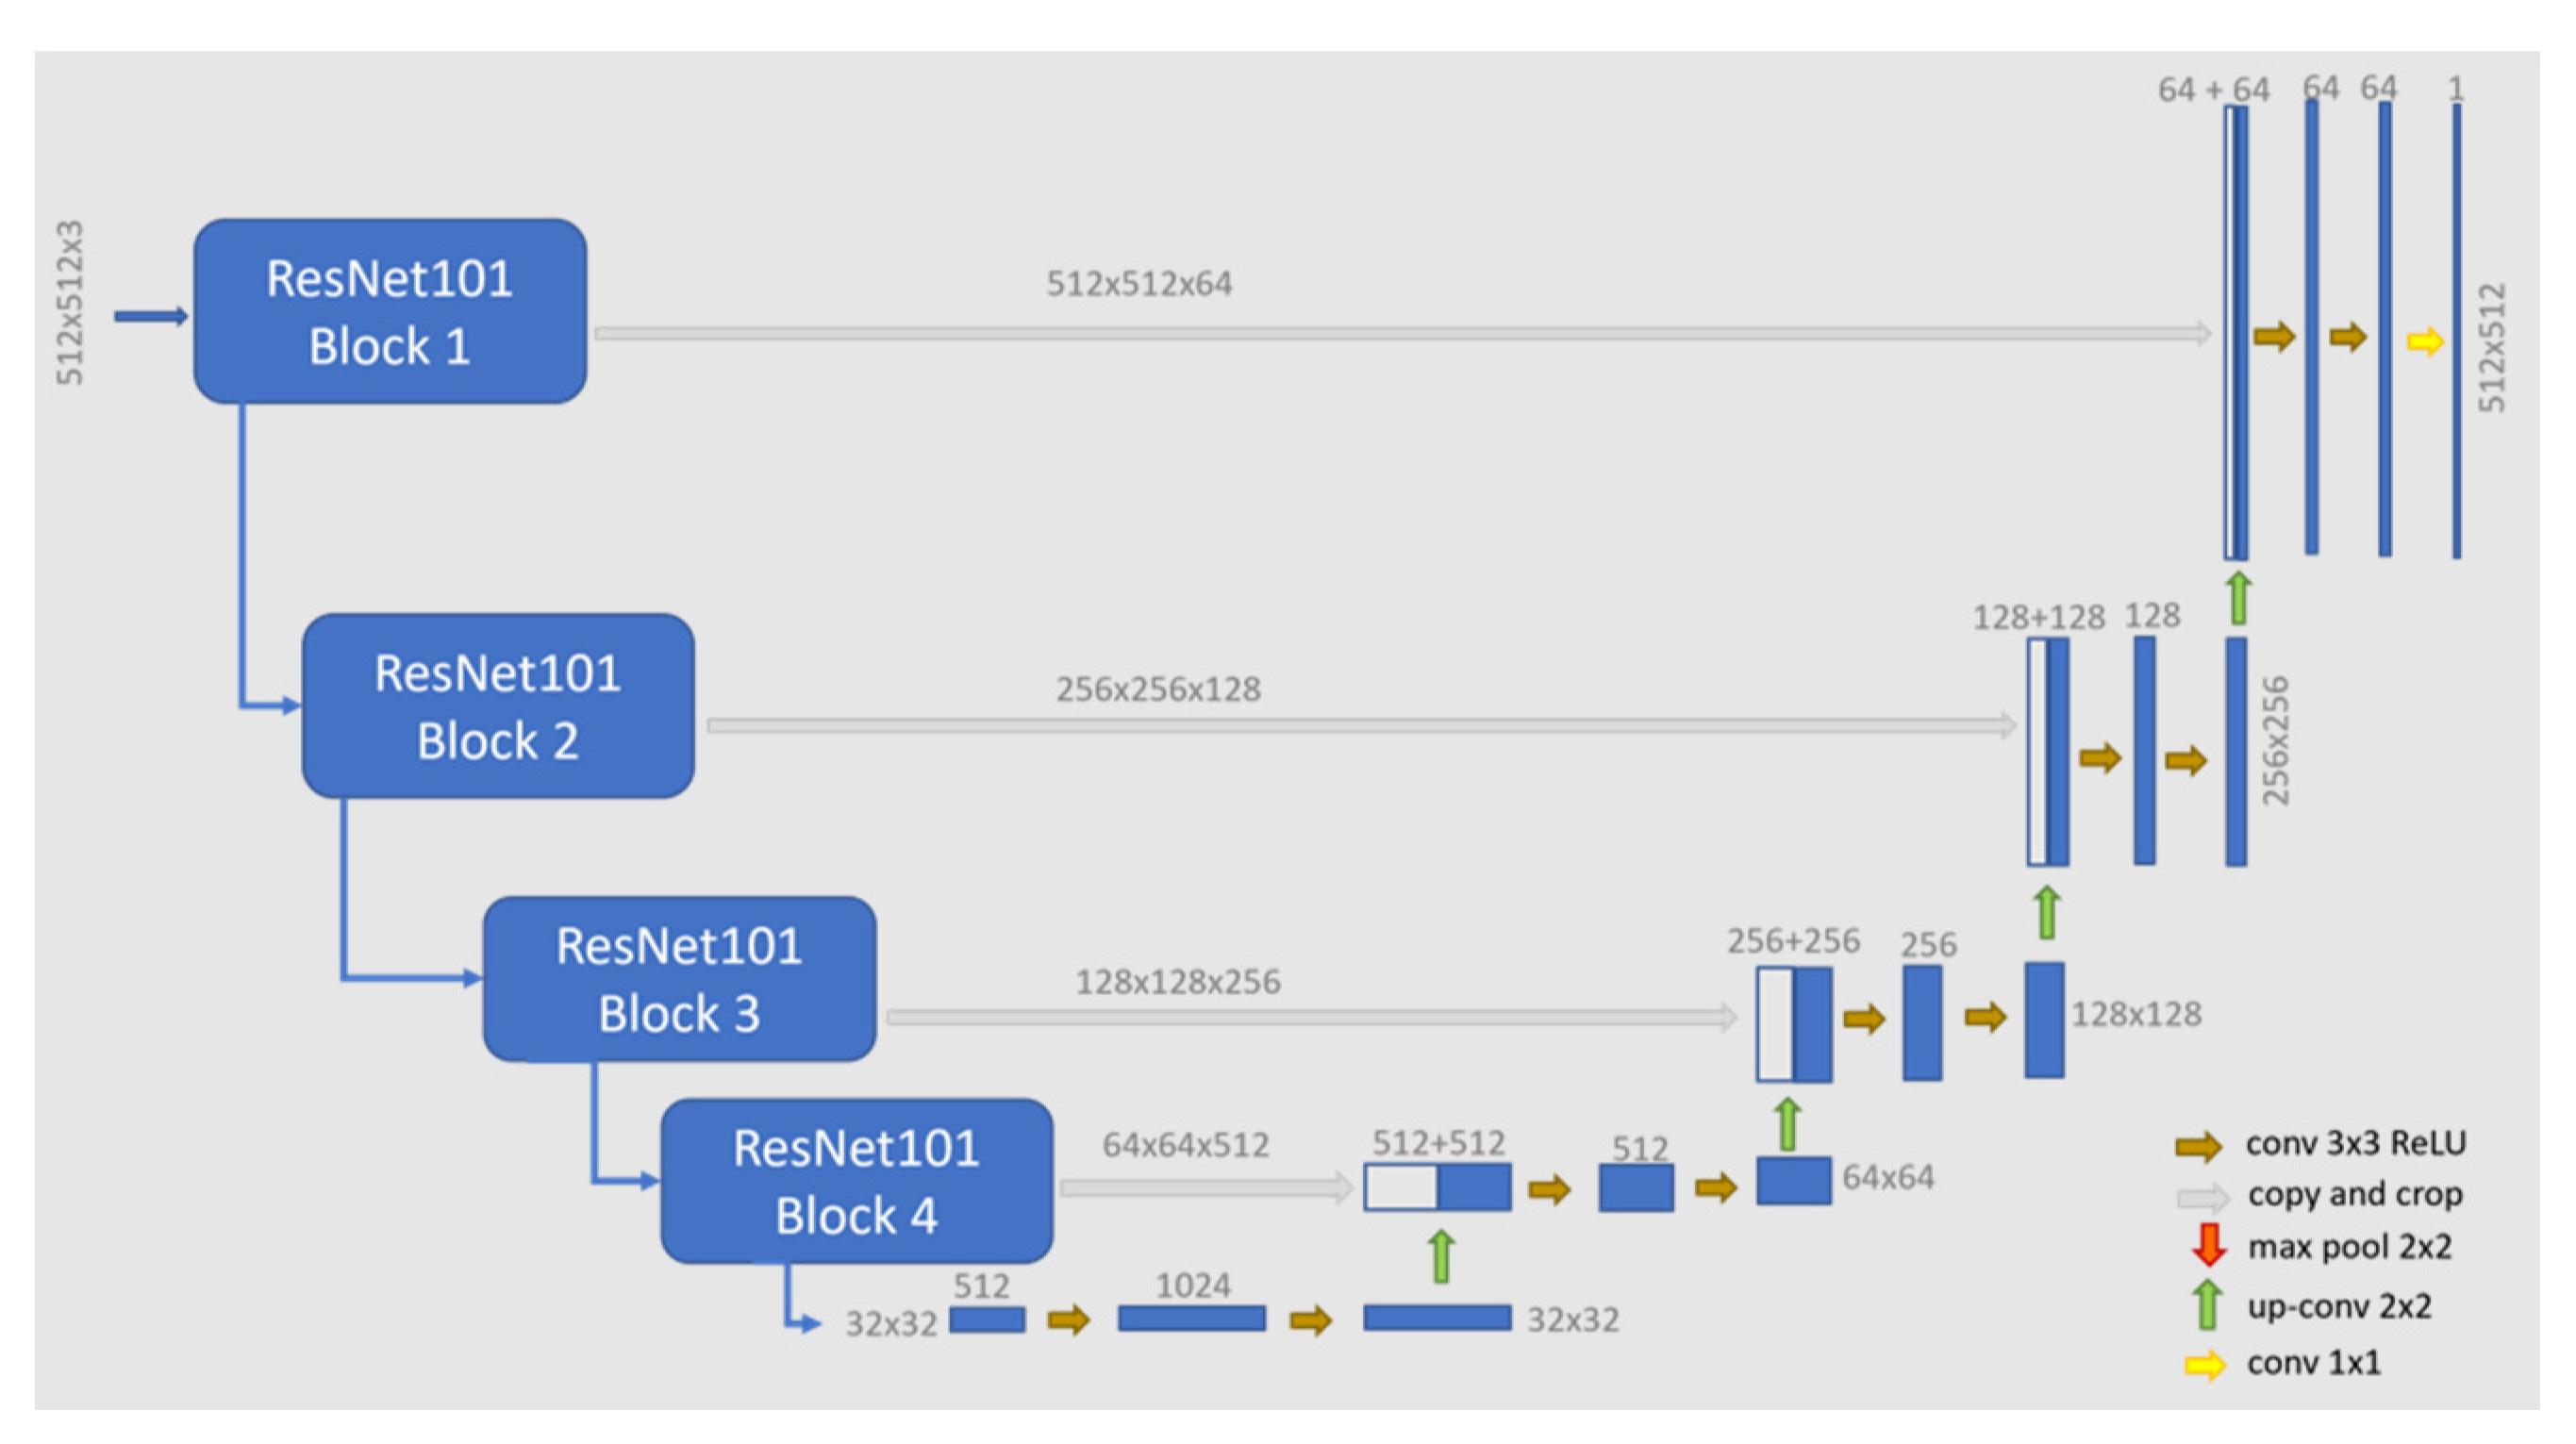
2.4. Deep Learning Convolutional Neural Net Architecture
2.5. Model Training and Accuracy Assessment
2.6. Model Interoperability Analysis Using Haralick Textures
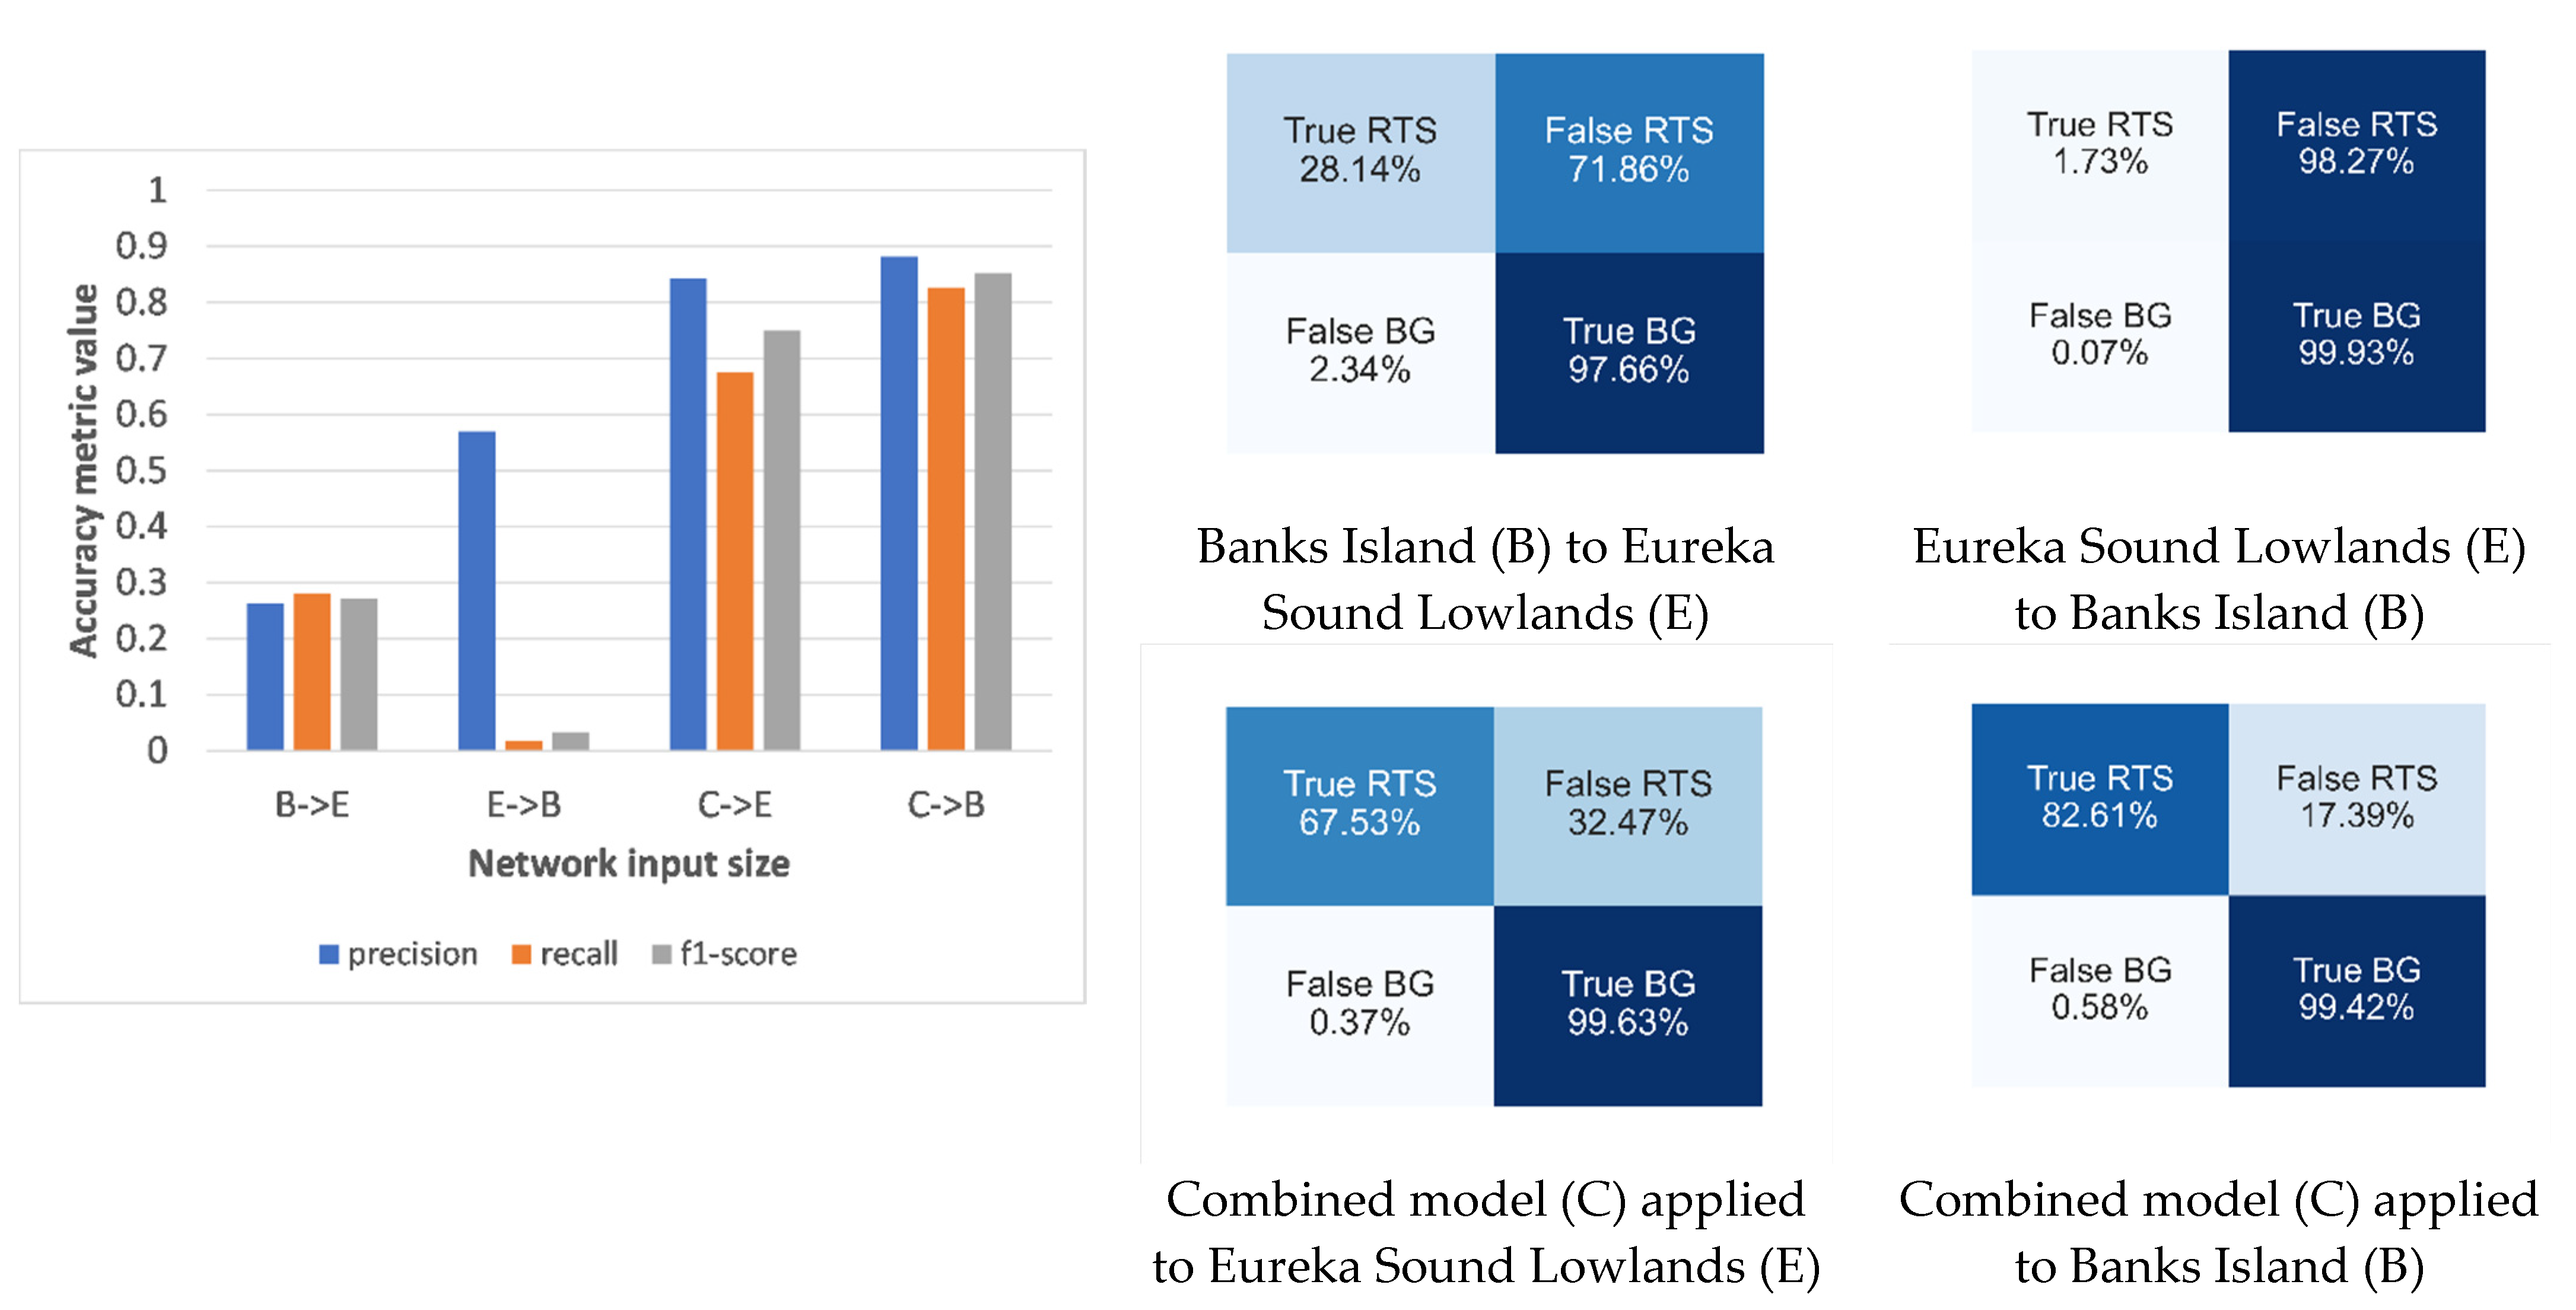
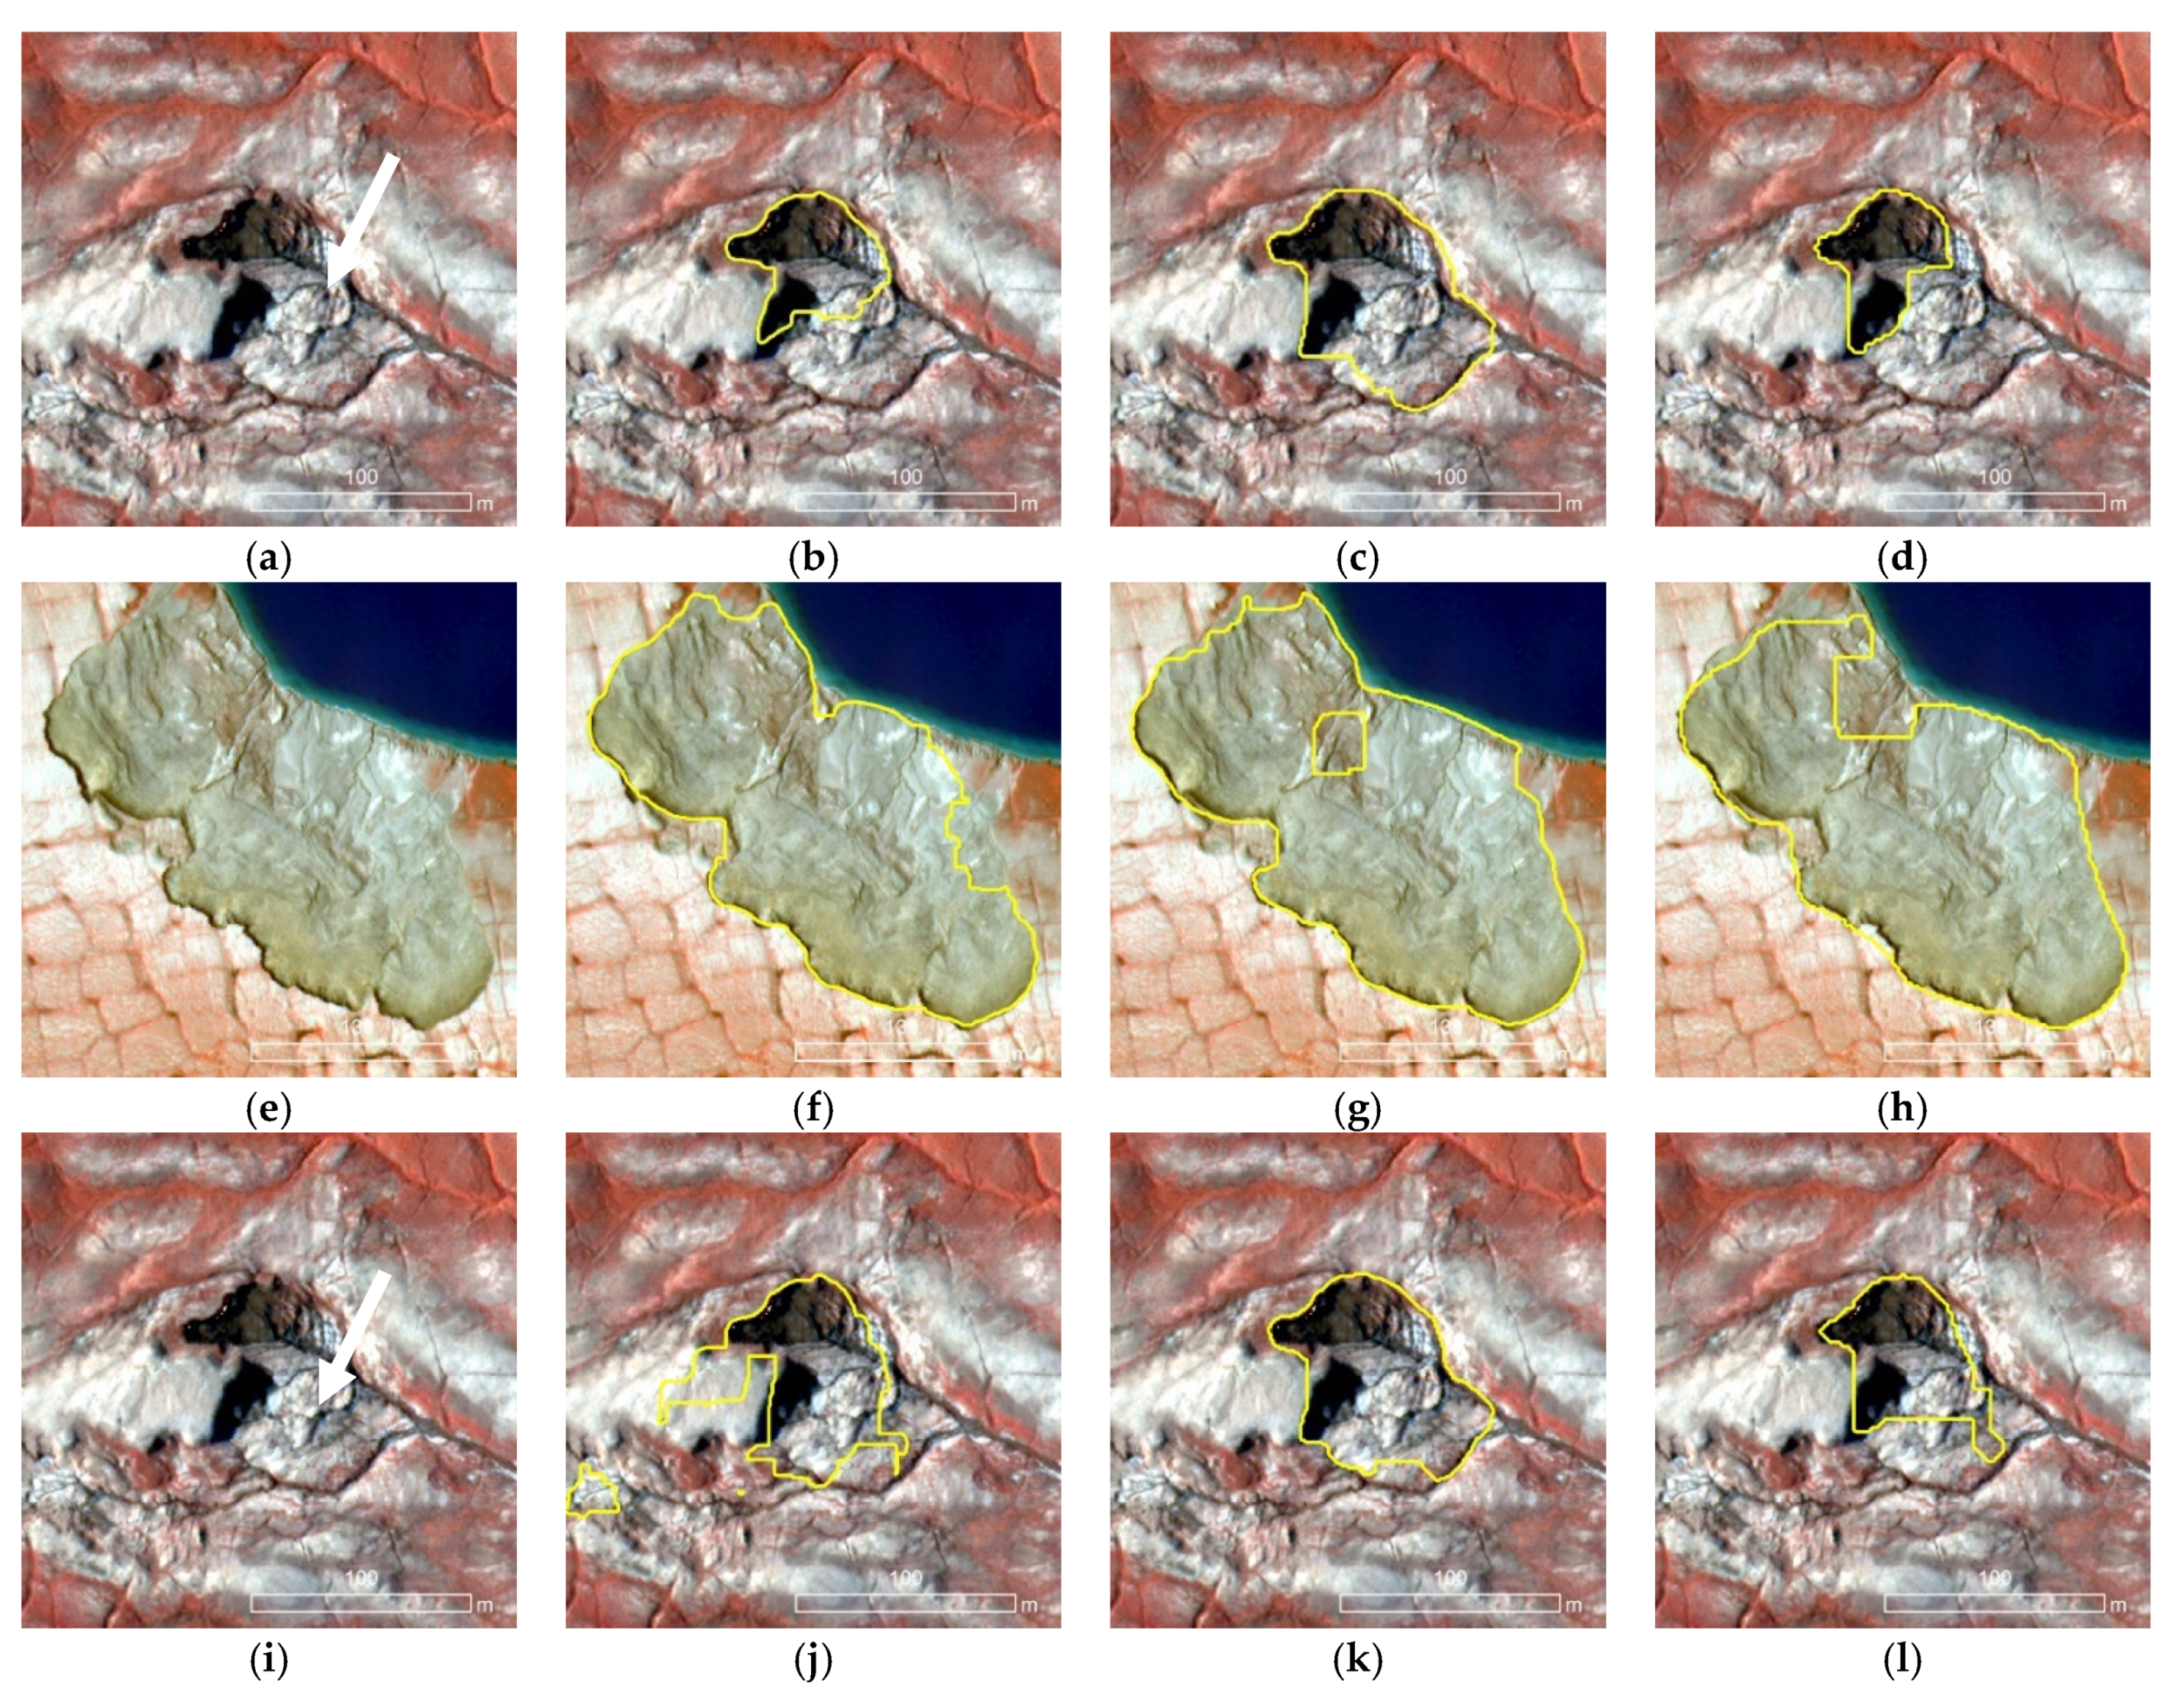
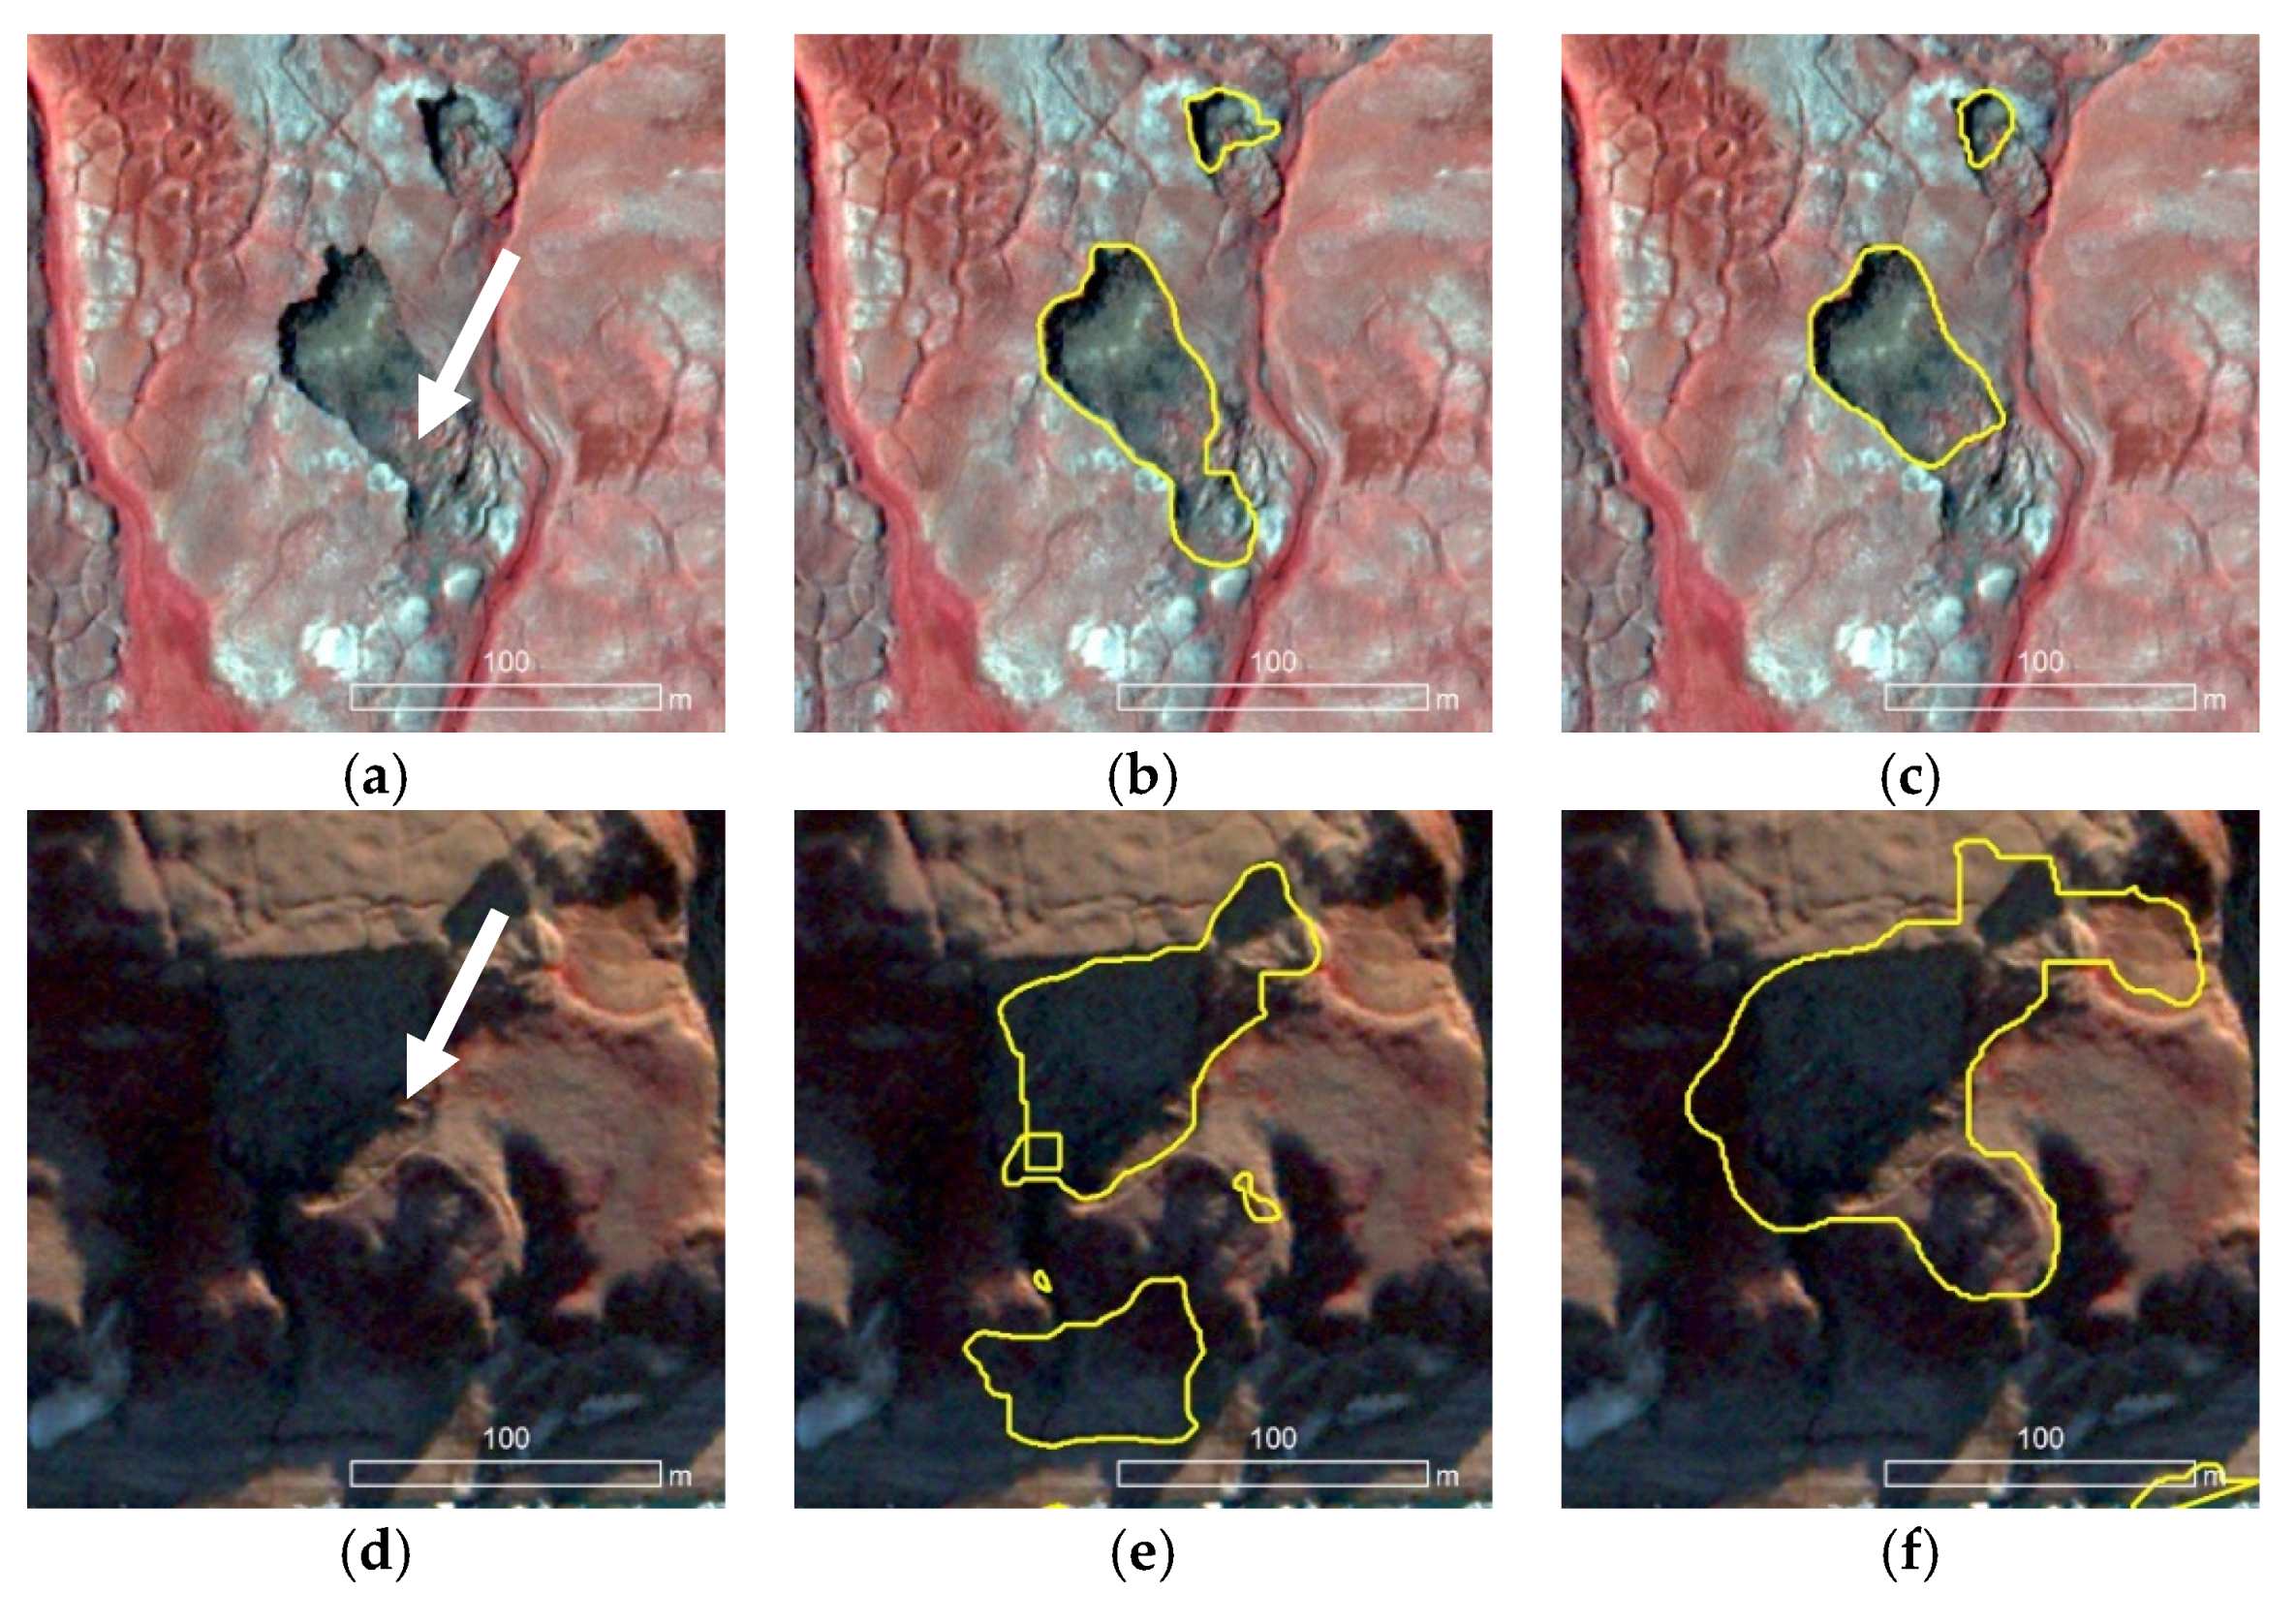
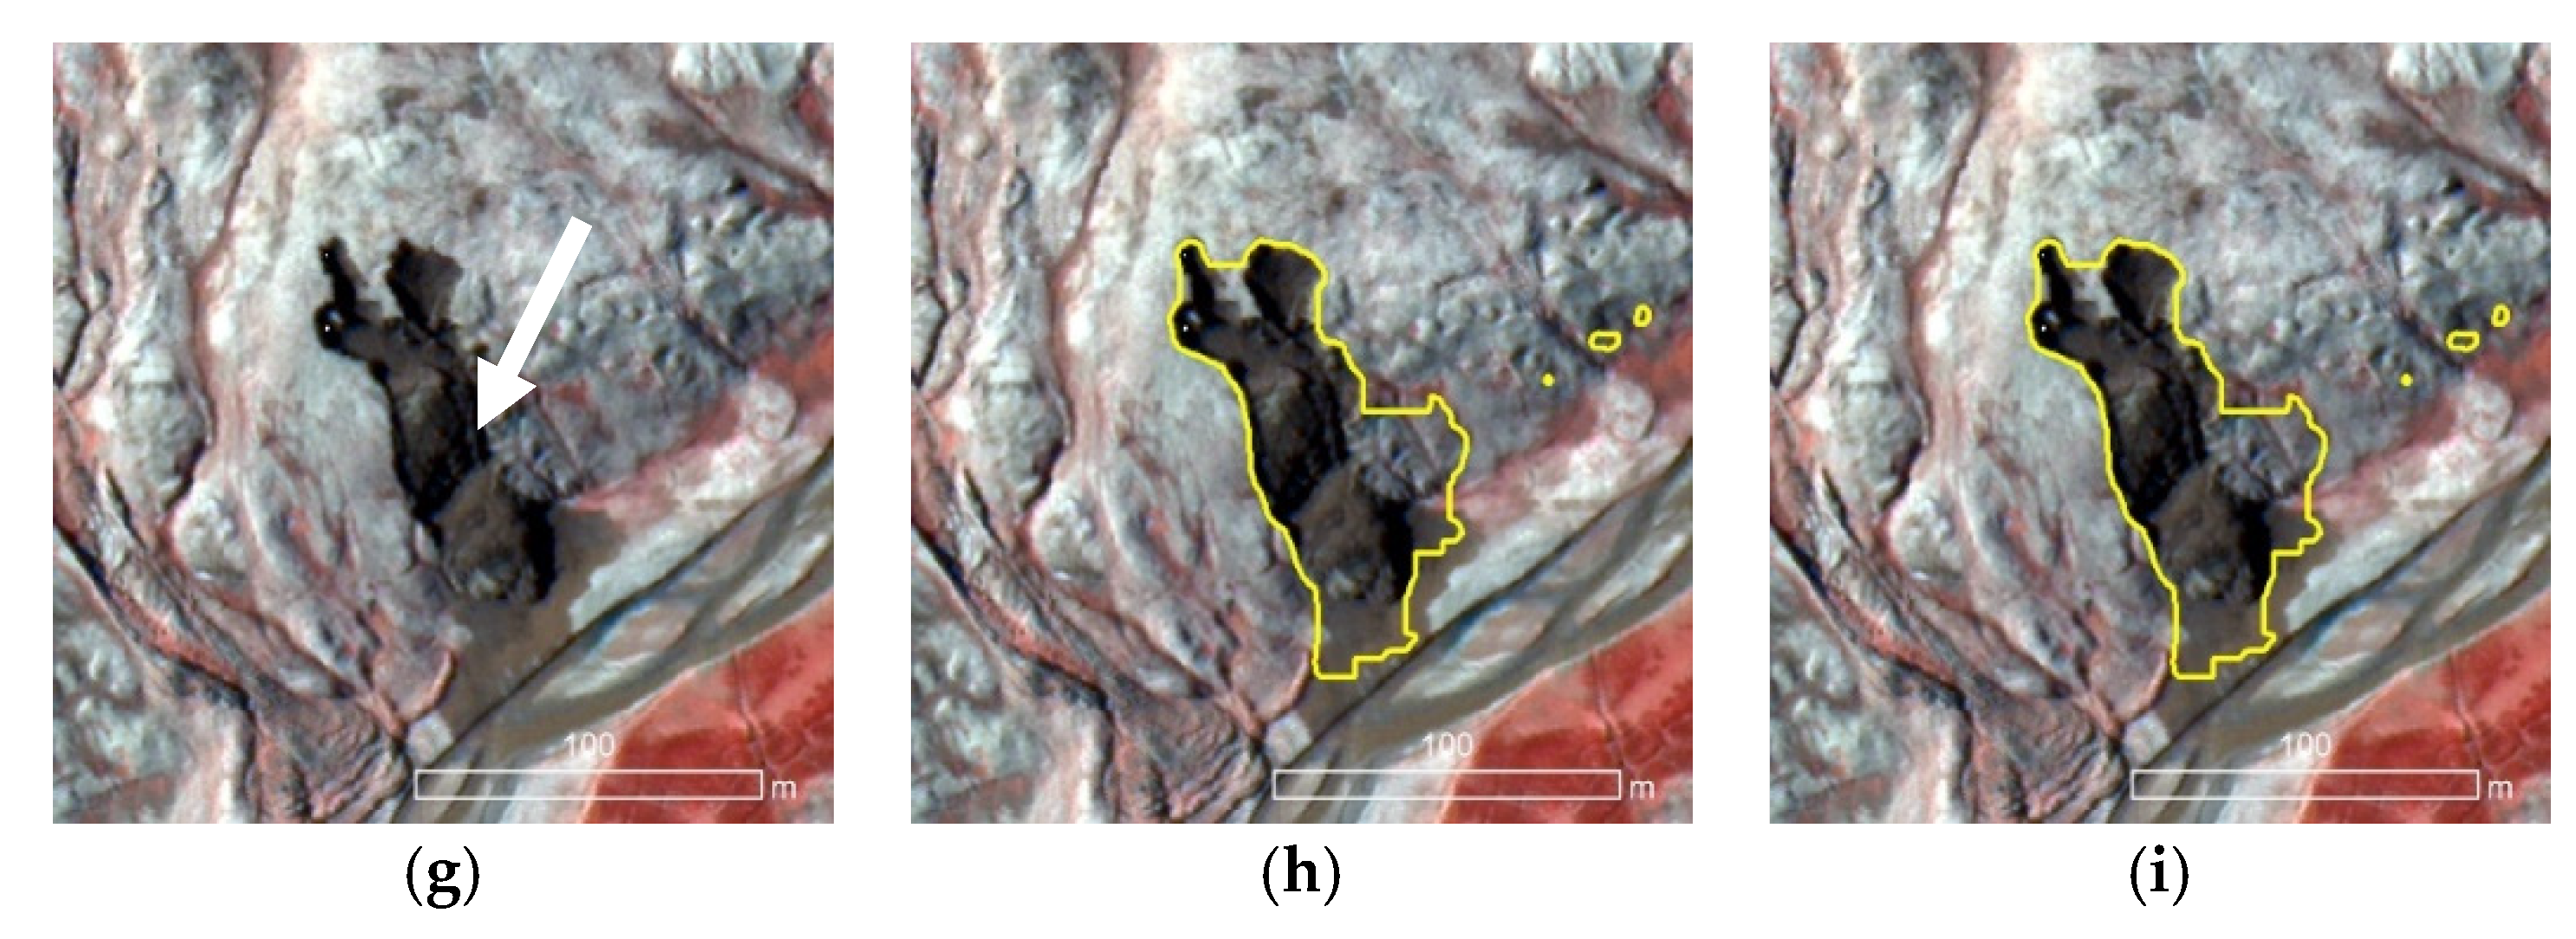
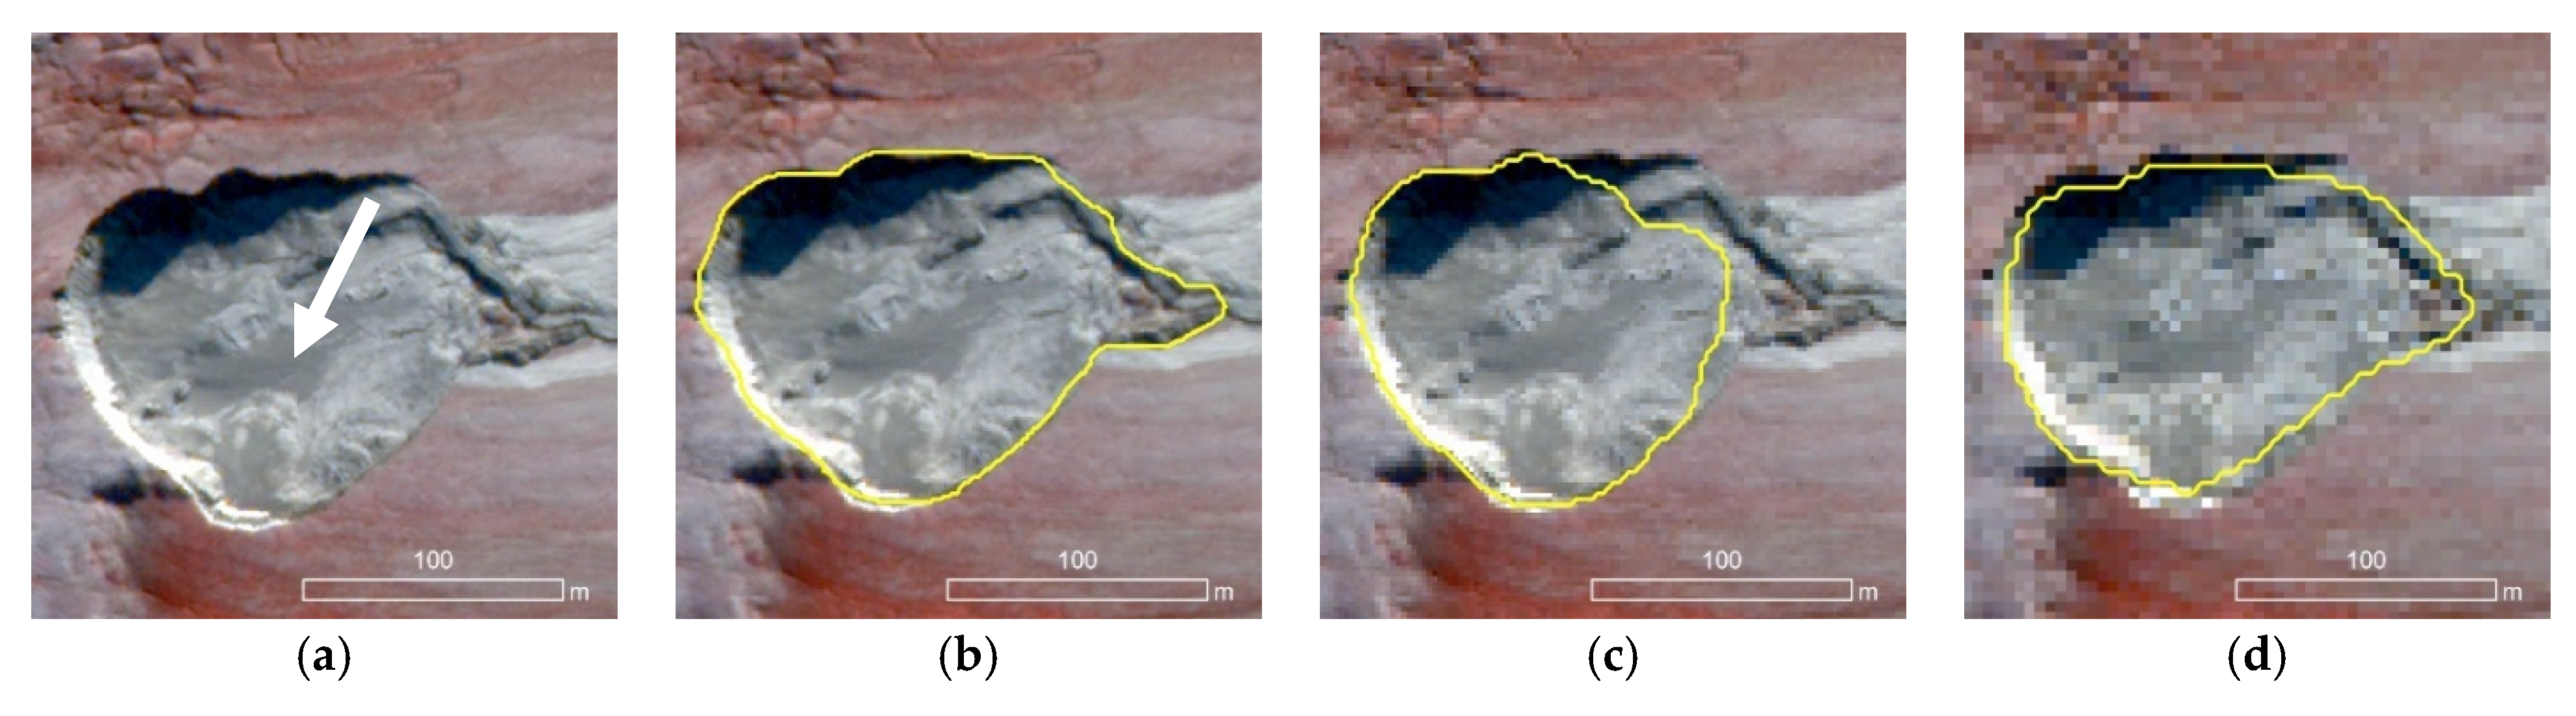
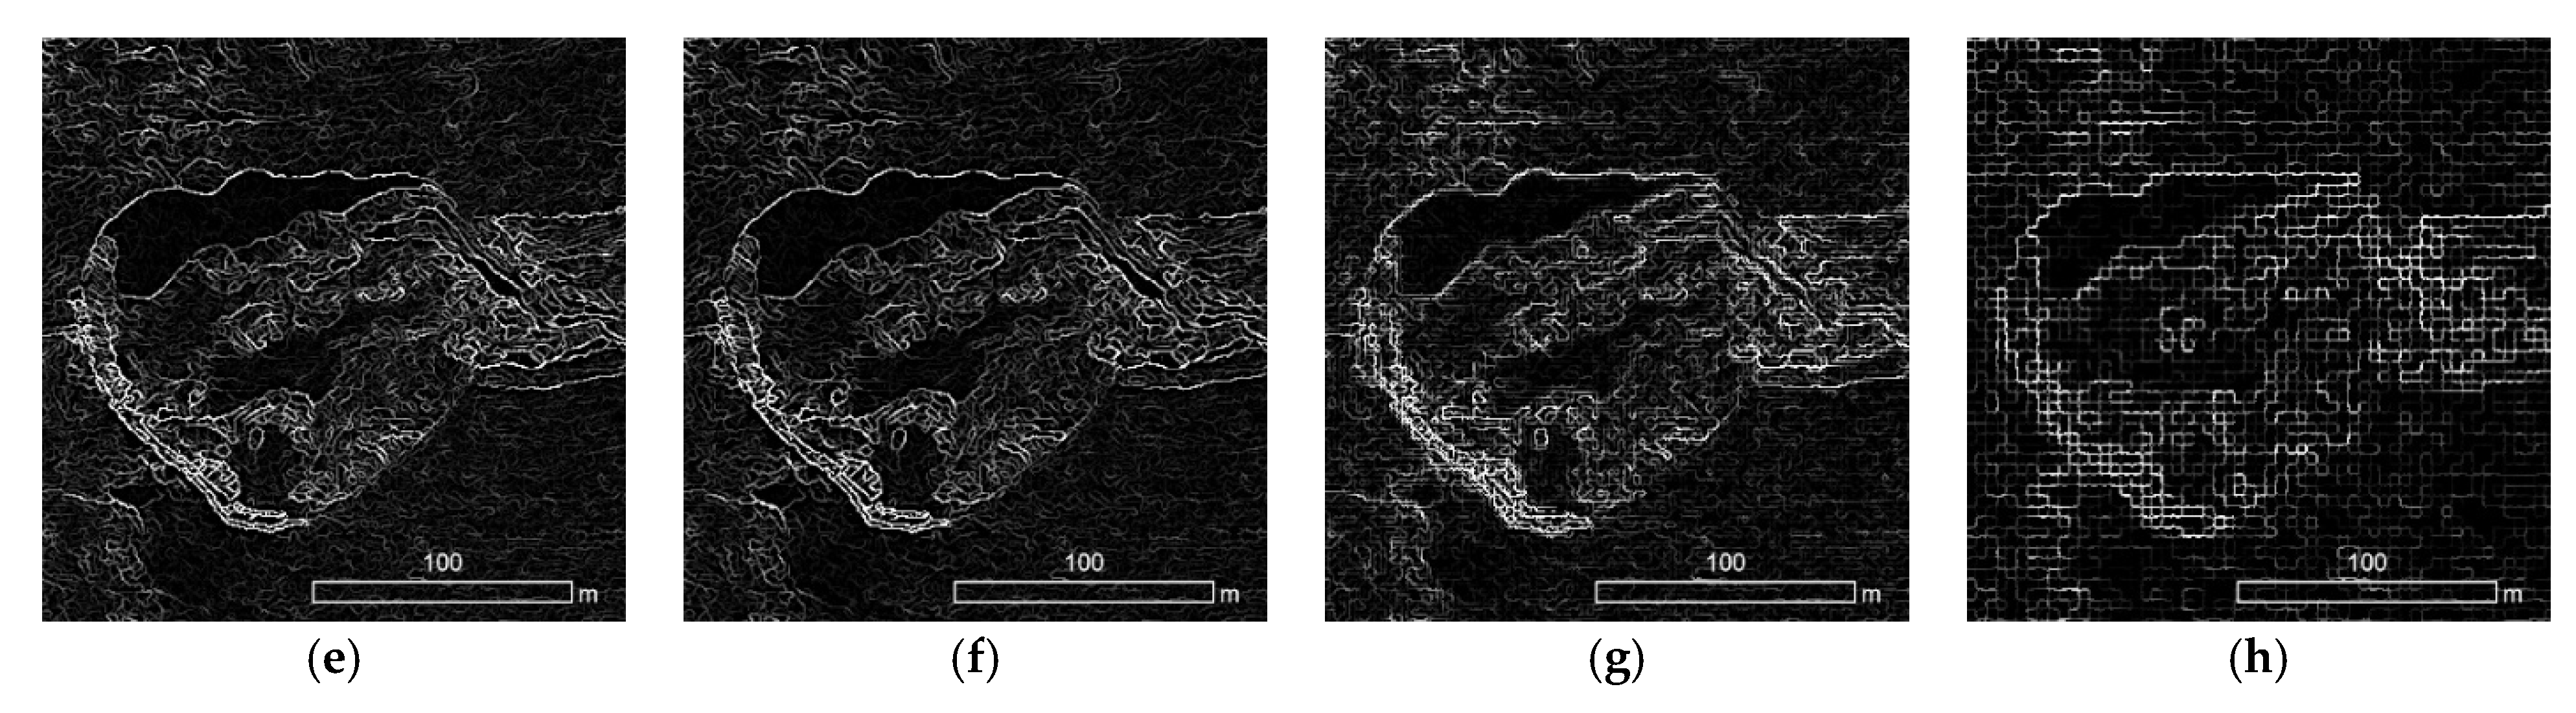
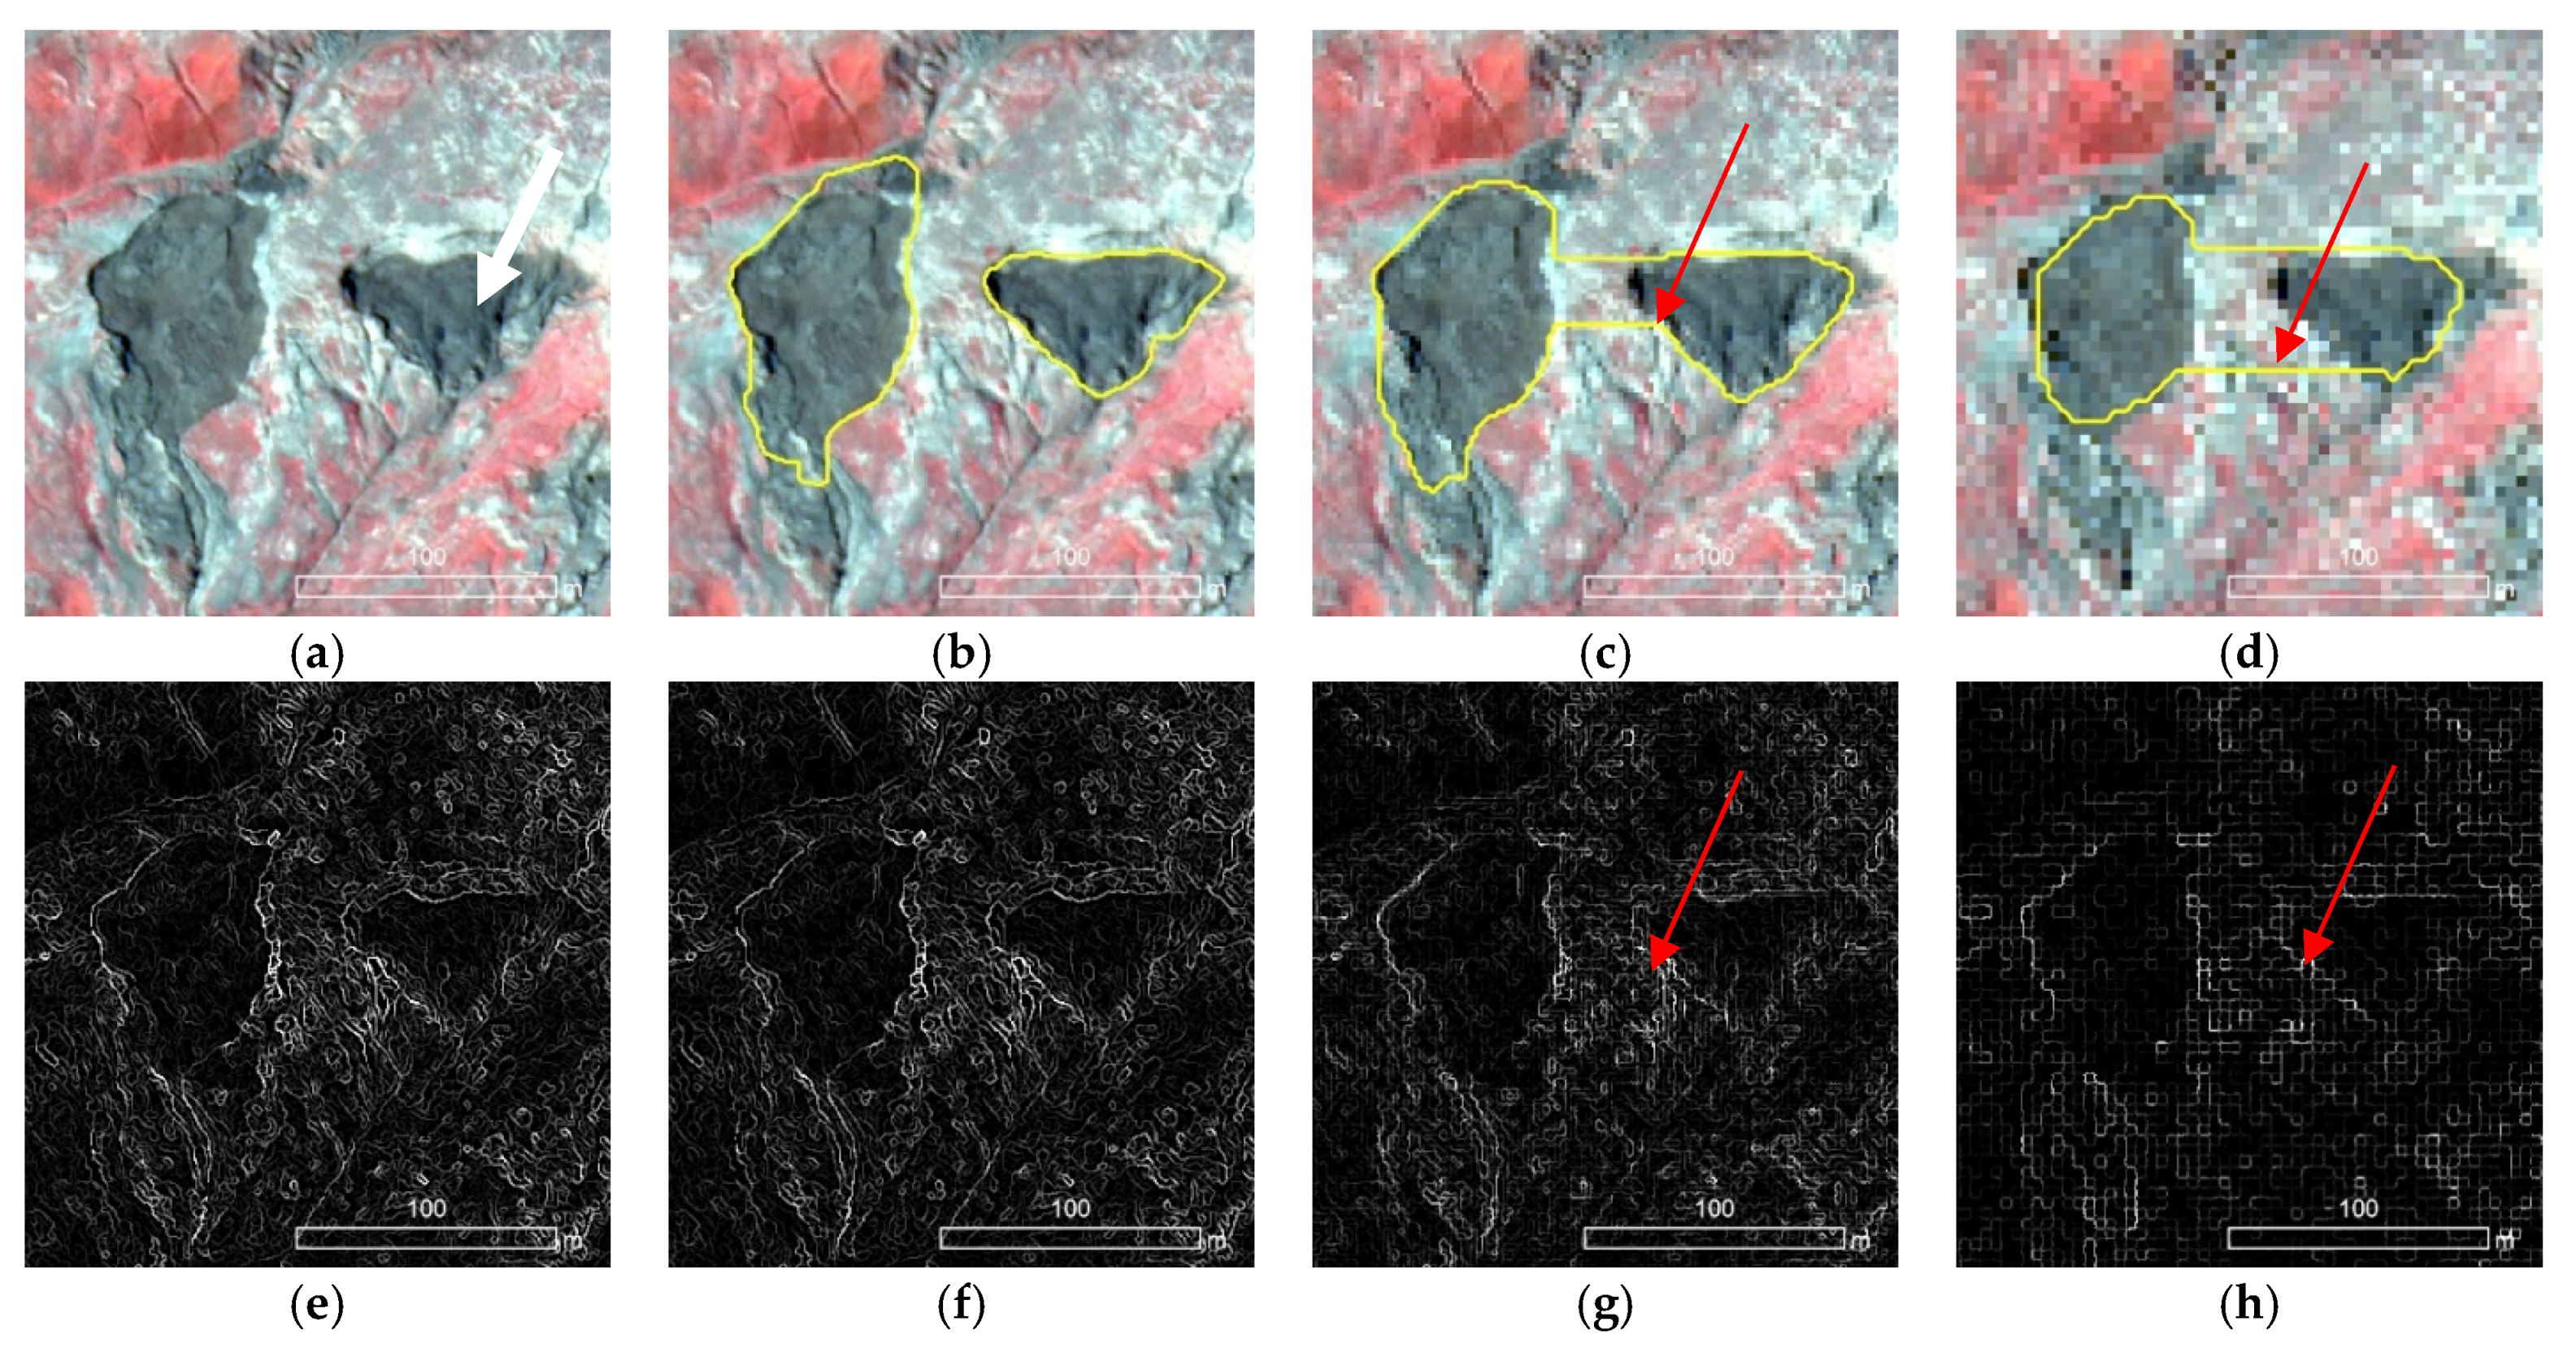
3. Results
4. Discussion
5. Conclusions
Author Contributions
Funding
Conflicts of Interest
References
- Black, R.F.; Muller, S.W. Permafrost or Permanently Frozen Ground and Related Engineering Problems. Geogr. Rev. 1948, 38, 686. [Google Scholar] [CrossRef]
- Brown, J.; Ferrians, O.J.J.; Heginbottom, J.A.; Melnikov, E.S. Circum-Arctic map of permafrost and ground-ice conditions. In Circum-Pacific Map Series CP-45, Scale 1:10,000,000, 1 Sheet; USGS in Cooperation with the Circum-Pacific Council for Energy and Mineral Resources: Washington, DC, USA, 1997; Available online: https://www.researchgate.net/publication/303677186_CircumArctic_map_of_permafrost_and_groundce_conditions_Washington_DC_US_Geological_Survey_in_Cooperation_with_the_CircumPacific_Council_for_Energy_and_Mineral_Resources_Circum-Pacific_Map_Series_C (accessed on 4 January 2022).
- Zhang, H.; Zhang, J.; Zhang, Z.; Chen, J.; You, Y. A consolidation model for estimating the settlement of warm permafrost. Comput. Geotech. 2016, 76, 43–50. [Google Scholar] [CrossRef]
- Melvin, A.M.; Larsen, P.; Boehlert, B.; Neumann, J.E.; Chinowsky, P.; Espinet, X.; Martinich, J.; Baumann, M.S.; Rennels, L.; Bothner, A.; et al. Climate change damages to Alaska public infrastructure and the economics of proactive adaptation. Proc. Natl. Acad. Sci. USA 2017, 114, E122–E131. [Google Scholar] [CrossRef] [PubMed] [Green Version]
- Hjort, J.; Streletskiy, D.; Doré, G.; Wu, Q.; Bjella, K.; Luoto, M. Impacts of permafrost degradation on infrastructure. Nat. Rev. Earth Environ. 2022, 3, 24–38. [Google Scholar] [CrossRef]
- Smith, S.L.; O’Neill, H.B.; Isaksen, K.; Noetzli, J.; Romanovsky, V.E. The changing thermal state of permafrost. Nat. Rev. Earth Environ. 2022, 3, 10–23. [Google Scholar] [CrossRef]
- Abbott, B.W.; Jones, J.B.; Godsey, S.E.; Larouche, J.R.; Bowden, W.B. Patterns and persistence of hydrologic carbon and nutrient export from collapsing upland permafrost. Biogeosciences 2015, 12, 3725–3740. [Google Scholar] [CrossRef] [Green Version]
- Coch, C.; Lamoureux, S.F.; Knoblauch, C.; Eischeid, I.; Fritz, M.; Obu, J.; Lantuit, H.; Lamoureux, S.; Eischeid, I.; Fritz, M. Summer rainfall dissolved organic carbon, solute, and sediment fluxes in a small Arctic coastal catchment on Herschel Island (Yukon Territory, Canada). Arctic Sci. 2018, 4, 750–780. [Google Scholar] [CrossRef] [Green Version]
- Levenstein, B.; Lento, J.; Culp, J. Effects of prolonged sedimentation from permafrost degradation on macroinvertebrate drift in Arctic streams. Limnol. Oceanogr. 2021, 66, S157–S168. [Google Scholar] [CrossRef]
- Tanski, G.; Wagner, D.; Knoblauch, C.; Fritz, M.; Sachs, T.; Lantuit, H. Rapid CO2 Release from Eroding Permafrost in Seawater. Geophys. Res. Lett. 2019, 46, 11244–11252. [Google Scholar] [CrossRef] [Green Version]
- Farquharson, L.M.; Romanovsky, V.E.; Cable, W.L.; Walker, D.A.; Kokelj, S.V.; Nicolsky, D. Climate change drives widespread and rapid thermokarst development in very cold permafrost in the Canadian High Arctic. Geophys. Res. Lett. 2019, 46, 6681–6689. [Google Scholar] [CrossRef] [Green Version]
- Lewkowicz, A.G.; Way, R.G. Extremes of summer climate trigger thousands of thermokarst landslides in a High Arctic environment. Nat. Commun. 2019, 10, 1329. [Google Scholar] [CrossRef] [PubMed] [Green Version]
- Jones, M.K.W.; Pollard, W.H.; Jones, B.M. Rapid initialization of retrogressive thaw slumps in the Canadian high Arctic and their response to climate and terrain factors. Environ. Res. Lett. 2019, 14, 55006. [Google Scholar] [CrossRef]
- Schuur, E.A.G.; Mack, M.C. Ecological response to permafrost thaw and consequences for local and global ecosystem services. Annu. Rev. Ecol. Evol. Syst. 2018, 49, 279–301. [Google Scholar] [CrossRef]
- Liljedahl, A.K.; Boike, J.; Daanen, R.P.; Fedorov, A.N.; Frost, G.V.; Grosse, G.; Hinzman, L.D.; Iijma, Y.; Jorgenson, J.C.; Matveyeva, N.; et al. Pan-Arctic ice-wedge degradation in warming permafrost and its influence on tundra hydrology. Nat. Geosci. 2016, 9, 312–318. [Google Scholar] [CrossRef]
- Lafrenière, M.J.; Lamoureux, S.F. Effects of changing permafrost conditions on hydrological processes and fluvial fluxes. Earth-Sci. Rev. 2019, 191, 212–223. [Google Scholar] [CrossRef]
- Turetsky, M.R.; Abbott, B.W.; Jones, M.C.; Anthony, K.W.; Olefeldt, D.; Schuur, E.A.G.; Grosse, G.; Kuhry, P.; Hugelius, G.; Koven, C.; et al. Carbon release through abrupt permafrost thaw. Nat. Geosci. 2020, 13, 138–143. [Google Scholar]
- Ramage, J.; Jungsberg, L.; Wang, S.; Westermann, S.; Lantuit, H.; Heleniak, T. Population living on permafrost in the Arctic. Popul. Environ. 2021, 43, 22–38. [Google Scholar] [CrossRef]
- Bartsch, A.; Pointner, G.; Nitze, I.; Efimova, A.; Jakober, D.; Ley, S.; Högström, E.; Grosse, G.; Schweitzer, P. Expanding infrastructure and growing anthropogenic impacts along Arctic coasts. Environ. Res. Lett. 2021, 16, 115013. [Google Scholar] [CrossRef]
- Jorgenson, M.T.; Shur, Y.L.; Pullman, E.R. Abrupt increase in permafrost degradation in Arctic Alaska. Geophys. Res. Lett. 2006, 33. [Google Scholar] [CrossRef]
- Nitze, I.; Grosse, G.; Jones, B.M.; Romanovsky, V.E.; Boike, J. Author Correction: Remote sensing quantifies widespread abundance of permafrost region disturbances across the Arctic and Subarctic. Nat. Commun. 2019, 10, 472. [Google Scholar] [CrossRef]
- Nitze, I.; Cooley, S.W.; Duguay, C.R.; Jones, B.M.; Grosse, G. The catastrophic thermokarst lake drainage events of 2018 in northwestern Alaska: Fast-forward into the future. Cryosphere 2020, 14, 4279–4297. [Google Scholar] [CrossRef]
- Kokelj, S.V.; Tunnicliffe, J.; Lacelle, D.; Lantz, T.C.; Chin, K.S.; Fraser, R. Increased precipitation drives mega slump development and destabilization of ice-rich permafrost terrain, northwestern Canada. Glob. Planet. Chang. 2015, 129, 56–68. [Google Scholar] [CrossRef] [Green Version]
- Swanson, D.K. Permafrost thaw-related slope failures in Alaska’s Arctic National Parks, c. 1980–2019. Permafr. Periglac. Process. 2021, 32, 392–406. [Google Scholar] [CrossRef]
- Bernhard, P.; Zwieback, S.; Leinss, S.; Hajnsek, I. Mapping Retrogressive Thaw Slumps Using Single-Pass TanDEM-X Observations. IEEE J. Sel. Top. Appl. Earth Obs. Remote Sens. 2020, 13, 3263–3280. [Google Scholar] [CrossRef]
- Mackay, J.R. Segregated epigenetic ice and slumps in permafrost, Mackenzie Delta area, NWT. Geogr. Bull. 1966, 8, 59–80. [Google Scholar]
- Malone, L.; Lacelle, D.; Kokelj, S.; Clark, I.D. Impacts of hillslope thaw slumps on the geochemistry of permafrost catchments (Stony Creek watershed, NWT, Canada). Chem. Geol. 2013, 356, 38–49. [Google Scholar] [CrossRef]
- Swanson, D.K.; Nolan, M. Growth of retrogressive thaw slumps in the Noatak Valley, Alaska, 2010–2016, measured by airborne photogrammetry. Remote Sens. 2018, 10, 983. [Google Scholar] [CrossRef] [Green Version]
- Bernhard, P.; Zwieback, S.; Leinss, S.; Hajnsek, I. Detection of retrogressive thaw slumps using TanDEM-X observations: Possibilities and limitations. In Proceedings of the EUSAR 2021, 13th European Conference on Synthetic Aperture Radar, Online, 29 March–1 April 2021; pp. 1–6. [Google Scholar]
- Huebner, D.C.; Bret-Harte, M.S. Microsite conditions in retrogressive thaw slumps may facilitate increased seedling recruitment in the Alaskan Low Arctic. Ecol. Evol. 2019, 9, 1880–1897. [Google Scholar] [CrossRef] [Green Version]
- Harris, S.A.; French, H.M.; Heginbottom, J.A.; Johnston, G.H.; Ladanyi, B.; Sego, D.C.; Van Everdingen, R.O. Glossary of Permafrost and Related Ground-ice Terms. Associate Committee on Geotechnical Research: Ottawa, ON, Canada, 1988; Volume 27. [Google Scholar]
- De Valentina, K. A Geomorphic Investigation of Retrogressive Thaw Slumps and Active Layer Slides on Herschel Island, Yukon Territory. Master’s Thesis, McGill University, Montreal, QC, Canada, 1990. Available online: https://escholarship.mcgill.ca/concern/theses/qj72p8351 (accessed on 10 January 2022).
- Burn, C.R.; Friele, P.A. Geomorphology, vegetation succession, soil characteristics and permafrost in retrogressive thaw slumps near Mayo, Yukon Territory. Arctic 1989, 42, 31–40. [Google Scholar] [CrossRef]
- Nitze, I.; Heidler, K.; Barth, S.; Grosse, G. Developing and Testing a Deep Learning Approach for Mapping Retrogressive Thaw Slumps. Remote Sens. 2021, 13, 4294. [Google Scholar] [CrossRef]
- Lantz, T.C.; Kokelj, S.V.; Gergel, S.E.; Henry, G.H.R. Relative impacts of disturbance and temperature: Persistent changes in microenvironment and vegetation in retrogressive thaw slumps. Glob. Chang. Biol. 2009, 15, 1664–1675. [Google Scholar] [CrossRef]
- Ramage, J.L.; Irrgang, A.M.; Morgenstern, A.; Lantuit, H. Increasing coastal slump activity impacts the release of sediment and organic carbon into the Arctic Ocean. Biogeosciences 2018, 15, 1483–1495. [Google Scholar] [CrossRef] [Green Version]
- Kokelj, S.V.; Lantz, T.C.; Tunnicliffe, J.; Segal, R.; Lacelle, D. Climate-driven thaw of permafrost preserved glacial landscapes, northwestern Canada. Geology 2017, 45, 371–374. [Google Scholar] [CrossRef] [Green Version]
- Bowden, W.B.; Larouche, J.R.; Pearce, A.R.; Crosby, B.T.; Krieger, K.; Flinn, M.B.; Kampman, J.; Gooseff, M.N.; Godsey, S.E.; Jones, J.B.; et al. An integrated assessment of the influences of upland thermal-erosional features on landscape structure and function in the foothills of the Brooks Range, Alaska. In Proceedings of the Tenth International Conference on Permafrost, Salekhard, Russia, 25–29 June 2012; pp. 61–66. [Google Scholar]
- Segal, R.A.; Lantz, T.C.; Kokelj, S.V. Acceleration of thaw slump activity in glaciated landscapes of the Western Canadian Arctic. Environ. Res. Lett. 2016, 11, 34025. [Google Scholar] [CrossRef]
- Costard, F.; Dupeyrat, L.; Séjourné, A.; Bouchard, F.; Fedorov, A.; Saint-Bézar, B. Retrogressive Thaw Slumps on Ice-Rich Permafrost under Degradation: Results from a Large-Scale Laboratory Simulation. Geophys. Res. Lett. 2021, 48, e2020GL091070. [Google Scholar] [CrossRef]
- Cray, H.A.; Pollard, W.H. Use of stabilized thaw slumps by Arctic birds and mammals: Evidence from Herschel Island, Yukon. Can. Field-Nat. 2018, 132, 279–284. [Google Scholar] [CrossRef] [Green Version]
- Littlefair, C.A.; Tank, S.E.; Kokelj, S.V. Retrogressive thaw slumps temper dissolved organic carbon delivery to streams of the Peel Plateau, NWT, Canada. Biogeosciences 2017, 14, 5487–5505. [Google Scholar] [CrossRef] [Green Version]
- Mesquita, P.S.; Wrona, F.J.; Prowse, T.D. Effects of retrogressive permafrost thaw slumping on sediment chemistry and submerged macrophytes in Arctic tundra lakes. Freshw. Biol. 2010, 55, 2347–2358. [Google Scholar] [CrossRef]
- Witharana, C.; Bhuiyan, M.A.E.; Liljedahl, A.K.; Kanevskiy, M.; Jorgenson, T.; Jones, B.M.; Ward Jones, M.K. An Object-Based Approach for Mapping Tundra Ice-Wedge Polygon Troughs from Very High Spatial Resolution Optical Satellite Imagery. Remote Sens. 2021, 13, 558. [Google Scholar] [CrossRef]
- Grosse, G.; Jones, B. Remote sensing leads to better understanding of polar regions. Eos 2018, 99. [Google Scholar] [CrossRef]
- Turner, K.W.; Pearce, M.D.; Hughes, D.D. Detailed Characterization and Monitoring of a Retrogressive Thaw Slump from Remotely Piloted Aircraft Systems and Identifying Associated Influence on Carbon and Nitrogen Export. Remote Sens. 2021, 13, 171. [Google Scholar] [CrossRef]
- Runge, A.; Nitze, I.; Grosse, G. Remote sensing annual dynamics of rapid permafrost thaw disturbances with LandTrendr. Remote Sens. Environ. 2022, 268, 112752. [Google Scholar] [CrossRef]
- Huang, L.; Liu, L.; Luo, J.; Lin, Z.; Niu, F. Automatically quantifying evolution of retrogressive thaw slumps in Beiluhe (Tibetan Plateau) from multi-temporal CubeSat images. Int. J. Appl. Earth Obs. Geoinf. 2021, 102, 102399. [Google Scholar] [CrossRef]
- Witharana, C.; Bhuiyan, M.A.E.; Liljedahl, A.K. Big Imagery and High Performance Computing as Resources to Understand Changing Arctic Polygonal Tundra. Int. Arch. Photogramm. Remote Sens. Spat. Inf. Sci. 2020, XLIV-M-2-2020, 2020. [Google Scholar] [CrossRef]
- Udawalpola, M.R.; Hasan, A.; Liljedahl, A.; Soliman, A.; Terstriep, J.; Witharana, C. An Optimal GeoAI Workflow for Pan-Arctic Permafrost Feature Detection from High-Resolution Satellite Imagery. Photogramm. Eng. Remote Sens. 2022, 88, 181–188. [Google Scholar] [CrossRef]
- Udawalpola, M.; Hasan, A.; Liljedahl, A.K.; Soliman, A.; Witharana, C. Operational-Scale Geoai for Pan-Arctic Permafrost Feature Detection from High-Resolution Satellite Imagery. Int. Arch. Photogramm. Remote Sens. Spat. Inf. Sci. 2021, 44, 175–180. [Google Scholar] [CrossRef]
- Bhuiyan, M.A.E.; Witharana, C.; Liljedahl, A.K. Use of Very High Spatial Resolution Commercial Satellite Imagery and Deep Learning to Automatically Map Ice-Wedge Polygons across Tundra Vegetation Types. J. Imaging 2020, 6, 137. [Google Scholar] [CrossRef]
- Hay, G.J.; Castilla, G. Geographic Object-Based Image Analysis (GEOBIA): A new name for a new discipline. In Object-Based Image Analysis; Springer: Berlin/Heidelberg, Germany, 2008; pp. 75–89. [Google Scholar]
- Lang, S.; Kienberger, S.; Tiede, D.; Hagenlocher, M.; Pernkopf, L. Geons—Domain-specific regionalization of space. Cartogr. Geogr. Inf. Sci. 2014, 41, 214–226. [Google Scholar] [CrossRef] [Green Version]
- Lantuit, H.; Pollard, W.H. Temporal stereophotogrammetric analysis of retrogressive thaw slumps on Herschel Island, Yukon Territory. Nat. Hazards Earth Syst. Sci. 2005, 5, 413–423. [Google Scholar] [CrossRef] [Green Version]
- Kokelj, S.V.; Lantz, T.C.; Kanigan, J.; Smith, S.L.; Coutts, R. Origin and polycyclic behaviour of tundra thaw slumps, Mackenzie Delta region, Northwest Territories, Canada. Permafr. Periglac. Process. 2009, 20, 173–184. [Google Scholar] [CrossRef]
- Brooker, A.; Fraser, R.H.; Olthof, I.; Kokelj, S.V.; Lacelle, D. Mapping the activity and evolution of retrogressive thaw slumps by tasselled cap trend analysis of a Landsat satellite image stack. Permafr. Periglac. Process. 2014, 25, 243–256. [Google Scholar] [CrossRef]
- Huang, X.; Zhang, J.; Storozum, M.; Liu, S.; Gill, J.L.; Xiang, L.; Ren, X.; Wang, J.; Qiang, M.; Chen, F. Long-term herbivore population dynamics in the northeastern Qinghai-Tibetan Plateau and its implications for early human impacts. Rev. Palaeobot. Palynol. 2020, 275, 104171. [Google Scholar] [CrossRef]
- Dwyer, L. A Study of Permafrost Terrain Disturbances, Arctic Canada; University of Ottawa: Ottawa, ON, Canada, 1981. [Google Scholar]
- Romanenko, F.A. Ground ice and relief evolution on the Islands and Coasts of the Russian Arctic. In Proceedings of the Permfrost—Seventh International Conference, Yellowknife, NT, Canada, 23–27 June 1998; pp. 955–959. [Google Scholar]
- Lewkowicz, A.G.; Duguay, C.R. Detection of permafrost features using SPOT panchromatic imagery, Fosheim Peninsula, Ellesmere Island, NWT. Can. J. Remote Sens. 1999, 25, 34–44. [Google Scholar] [CrossRef]
- Couture, N.J. Sensitivity of Permafrost Terrain in a High Arctic Polar Desert: An Evaluation of Response to Disturbance Near Eureka, Ellesmere Island, Nunavut. Master’s Thesis, McGill University, Montreal, QC, Canada, 2000. [Google Scholar]
- Lantuit, H.; Pollard, W.H. Fifty years of coastal erosion and retrogressive thaw slump activity on Herschel Island, southern Beaufort Sea, Yukon Territory, Canada. Geomorphology 2008, 95, 84–102. [Google Scholar] [CrossRef]
- Lantz, T.C.; Kokelj, S.V. Increasing rates of retrogressive thaw slump activity in the Mackenzie Delta region, NWT, Canada. Geophys. Res. Lett. 2008, 35, 1–5. [Google Scholar] [CrossRef]
- Burn, C.R.; Zhang, Y. Permafrost and climate change at Herschel Island (Qikiqtaruq), Yukon Territory, Canada. J. Geophys. Res. Earth Surf. 2009, 114, 1–16. [Google Scholar] [CrossRef] [Green Version]
- Lacelle, D.; Bjornson, J.; Lauriol, B. Climatic and geomorphic factors affecting contemporary (1950–2004) activity of retrogressive thaw slumps on the Aklavik plateau, Richardson mountains, NWT, Canada. Permafr. Periglac. Process. 2010, 21, 1–15. [Google Scholar] [CrossRef]
- Short, N.; Brisco, B.; Couture, N.; Pollard, W.; Murnaghan, K.; Budkewitsch, P. A comparison of TerraSAR-X, RADARSAT-2 and ALOS-PALSAR interferometry for monitoring permafrost environments, case study from Herschel Island, Canada. Remote Sens. Environ. 2011, 115, 3491–3506. [Google Scholar] [CrossRef]
- Lewkowicz, A.; Miceli, C.; Duguay, M.; Bevington, A. Electrical Resistivity Tomography (ERT) as an essential tool to investigate sites in discontinuous permafrost. Univ. Ottawa. EUCOP 2014, 33, 138–144. [Google Scholar]
- Lacelle, D.; Brooker, A.; Fraser, R.H.; Kokelj, S.V. Distribution and growth of thaw slumps in the Richardson Mountains—Peel Plateau region, northwestern Canada. Geomorphology 2015, 235, 40–51. [Google Scholar] [CrossRef]
- Ramage, J.L.; Irrgang, A.M.; Herzschuh, U.; Morgenstern, A.; Couture, N.; Lantuit, H. Terrain controls on the occurrence of coastal retrogressive thaw slumps along the Yukon Coast, Canada. J. Geophys. Res. Earth Surf. 2017, 122, 1619–1634. [Google Scholar] [CrossRef]
- Zwieback, S.; Kokelj, S.V.; Günther, F.; Boike, J.; Grosse, G.; Hajnsek, I. Sub-seasonal thaw slump mass wasting is not consistently energy limited at the landscape scale. Cryosphere 2018, 12, 549–564. [Google Scholar] [CrossRef] [Green Version]
- St. Pierre, K.A.; Zolkos, S.; Shakil, S.; Tank, S.E.; St. Louis, V.L.; Kokelj, S.V. Unprecedented increases in total and methyl mercury concentrations downstream of retrogressive thaw slumps in the western Canadian Arctic. Environ. Sci. Technol. 2018, 52, 14099–14109. [Google Scholar] [CrossRef] [PubMed]
- Luo, J.; Niu, F.; Lin, Z.; Liu, M.; Yin, G. Recent acceleration of thaw slumping in permafrost terrain of Qinghai-Tibet Plateau: An example from the Beiluhe Region. Geomorphology 2019, 341, 79–85. [Google Scholar] [CrossRef]
- Huang, L.; Luo, J.; Lin, Z.; Niu, F.; Liu, L. Using deep learning to map retrogressive thaw slumps in the Beiluhe region (Tibetan Plateau) from CubeSat images. Remote Sens. Environ. 2020, 237, 111534. [Google Scholar] [CrossRef]
- Bernhard, P.; Zwieback, S.; Bergner, N.; Hajnsek, I. Assessing volumetric change distributions and scaling relations of retrogressive thaw slumps across the Arctic. Cryosphere 2022, 16, 1–15. [Google Scholar] [CrossRef]
- Pollard, W.; Ward, M.; Becker, M. The Eureka Sound lowlands: An ice-rich permafrost landscape in transition. In Proceedings of the GeoQuebec, Montreal, QC, Canada, 20 September 2015; p. 402. [Google Scholar]
- Heginbottom, J.A. Canada-Permafrost. Ci.nii.ac.jp. Available online: https://ci.nii.ac.jp/naid/10019265252/ (accessed on 2 February 2022).
- Fraser, R.H.; Kokelj, S.V.; Lantz, T.C.; McFarlane-Winchester, M.; Olthof, I.; Lacelle, D. Climate Sensitivity of High Arctic Permafrost Terrain Demonstrated by Widespread Ice-Wedge Thermokarst on Banks Island. Remote Sens. 2018, 10, 954. [Google Scholar] [CrossRef] [Green Version]
- Lewkowicz, A.G. Dynamics of active-layer detachment failures, Fosheim Peninsula, Ellesmere Island, Nunavut, Canada. Permafr. Periglac. Process. 2007, 18, 89–103. [Google Scholar] [CrossRef]
- Ronneberger, O.; Fischer, P.; Brox, T. U-net: Convolutional networks for biomedical image segmentation. In Proceedings of the International Conference on Medical Image Computing and Computer-Assisted Intervention, Munich, Germany, 5–9 October 2015; pp. 234–241. [Google Scholar]
- Chen, L.C.; Papandreou, G.; Kokkinos, I.; Murphy, K.; Yuille, A.L. DeepLab: Semantic Image Segmentation with Deep Convolutional Nets, Atrous Convolution, and Fully Connected CRFs. IEEE Trans. Pattern Anal. Mach. Intell. 2018, 40, 834–848. [Google Scholar] [CrossRef] [Green Version]
- Badrinarayanan, V.; Kendall, A.; Cipolla, R. Segnet: A deep convolutional encoder-decoder architecture for image segmentation. IEEE Trans. Pattern Anal. Mach. Intell. 2017, 39, 2481–2495. [Google Scholar] [CrossRef]
- Lin, G.; Milan, A.; Shen, C.; Reid, I. RefineNet: Multi-path refinement networks for high-resolution semantic segmentation. In Proceedings of the Proceedings-30th IEEE Conference on Computer Vision and Pattern Recognition, Honolulu, Hawaii, 21–26 July 2017; Volume 2017, pp. 5168–5177. [Google Scholar] [CrossRef] [Green Version]
- He, K.; Gkioxari, G.; Dollár, P.; Girshick, R. Mask R-CNN. IEEE Trans. Pattern Anal. Mach. Intell. 2020, 42, 386–397. [Google Scholar] [CrossRef] [PubMed]
- Drozdzal, M.; Vorontsov, E.; Chartrand, G.; Kadoury, S.; Pal, C. The importance of skip connections in biomedical image segmentation. In Lecture Notes in Computer Science (Including Subseries Lecture Notes in Artificial Intelligence and Lecture Notes in Bioinformatics); Springer: Cham, Switzerland, 2016; Volume 10008, pp. 179–187. [Google Scholar] [CrossRef] [Green Version]
- He, K.; Zhang, X.; Ren, S.; Sun, J. Deep Residual Learning for Image Recognition. In Proceedings of the IEEE Conference on Computer Vision and Pattern Recognition, Las Vegas, NV, USA, 27 June –30 June 2016; Volume 2016, pp. 770–778. [Google Scholar] [CrossRef]
- Kingma, D.P.; Ba, J. Adam: A method for stochastic optimization. 3rd International Conference on Learning Representations, ICLR 2015—Conference Track Proceedings. arXiv 2014, arXiv:1412.6980. [Google Scholar]
- Sudre, C.H.; Li, W.; Vercauteren, T.; Ourselin, S.; Jorge Cardoso, M. Generalised dice overlap as a deep learning loss function for highly unbalanced segmentations. In Deep Learning in Medical Image Analysis and Multimodal Learning for Clinical Decision Support; Springer: Cham, Switzerland, 2017; pp. 240–248. [Google Scholar] [CrossRef] [Green Version]
- Brynolfsson, P.; Nilsson, D.; Torheim, T.; Asklund, T.; Karlsson, C.T.; Trygg, J.; Nyholm, T.; Garpebring, A. Haralick texture features from apparent diffusion coefficient (ADC) MRI images depend on imaging and pre-processing parameters. Sci. Rep. 2017, 7, 4041. [Google Scholar] [CrossRef] [Green Version]
- Haralick, R.M.; Shanmugam, K.S.; Bosley, R. Land Use Classification Using Texture Information in Erts-a Mss Imagery; EROS Data Center: Sioux Falls, SD, USA, 1973. [Google Scholar]
- Wang, F. Factor Analysis. In International Encyclopedia of Human Geography; Elsevier: Amsterdam, The Netherlands, 2009; pp. 1–7. [Google Scholar] [CrossRef]
- Witharana, C.; Bhuiyan, M.A.E.; Liljedahl, A.K.; Kanevskiy, M.; Epstein, H.E.; Jones, B.M.; Ward Jones, M.K. Understanding the synergies of deep learning and data fusion of multispectral and panchromatic high resolution commercial satellite imagery for automated ice-wedge polygon detection. ISPRS J. Photogramm. Remote Sens. 2020, 170, 174–191. [Google Scholar] [CrossRef]
- Evans, I.S. Geomorphometry and landform mapping: What is a landform? Geomorphology 2012, 137, 94–106. [Google Scholar] [CrossRef]
- Dragut, L.; Blaschke, T. Automated classification of landform elements using object-based image analysis. Geomorphology 2006, 81, 330–344. [Google Scholar] [CrossRef]
- Hay, G.J.; Dubé, P.; Bouchard, A.; Marceau, D.J. A scale-space primer for exploring and quantifying complex landscapes. Ecol. Model. 2002, 153, 27–49. [Google Scholar] [CrossRef]
- Soliman, A.; Terstriep, J. Keras Spatial Extending deep learning frameworks for preprocessing and on-the-fly augmentation of geospatial data. In Proceedings of the 3rd ACM SIGSPATIAL International Workshop on AI for Geographic Knowledge Discovery; Association for Computing Machinery, Inc.: Chicago, IL, USA, 2019; pp. 69–76. [Google Scholar] [CrossRef]
- Blaschke, T.; Hay, G.J.; Kelly, M.; Lang, S.; Hofmann, P.; Addink, E.; Feitosa, R.Q.; der Meer, F.; der Werff, H.; Van Coillie, F. Geographic object-based image analysis—Towards a new paradigm. ISPRS J. Photogramm. Remote Sens. 2014, 87, 180–191. [Google Scholar] [CrossRef] [Green Version]
- Ismail, A.; Ahmad, S.A.; Soh, A.C.; Hassan, K.; Harith, H.H. Improving convolutional neural network (CNN) architecture (miniVGGNet) with batch normalization and learning rate decay factor for image classification. Int. J. Integr. Eng. 2019, 11, 51–59. [Google Scholar] [CrossRef]
- Smith, L.N. A disciplined approach to neural network hyper-parameters: Part 1—Learning rate, batch size, momentum, and weight decay. arXiv 2018, arXiv:1803.09820. [Google Scholar]
- Hoffer, E.; Hubara, I.; Soudry, D. Train longer, generalize better: Closing the generalization gap in large batch training of neural networks. In Advances in Neural Information Processing Systems; NeurIPS: La Jolla, CA, USA, 2017; Volume 2017, pp. 1732–1742. [Google Scholar]
- Bengio, Y. Practical recommendations for gradient-based training of deep architectures. In Neural Networks: Tricks of the Trade; Springer: Berlin/Heidelberg, Germany, 2012; Volume 7700 LECTU, pp. 437–478. [Google Scholar] [CrossRef] [Green Version]


| Study Area | Image Acquisition Years | # of Images | Sensor | Spatial Resolution (m) | Spectral Bands | Radiometric Depth |
|---|---|---|---|---|---|---|
| Banks Island | 2010–2015 | 12 | WV02 | 0.5 | Blue, Green, Red, Near-infrared | 16 bit |
| ESL | 2011–2020 | 14 |
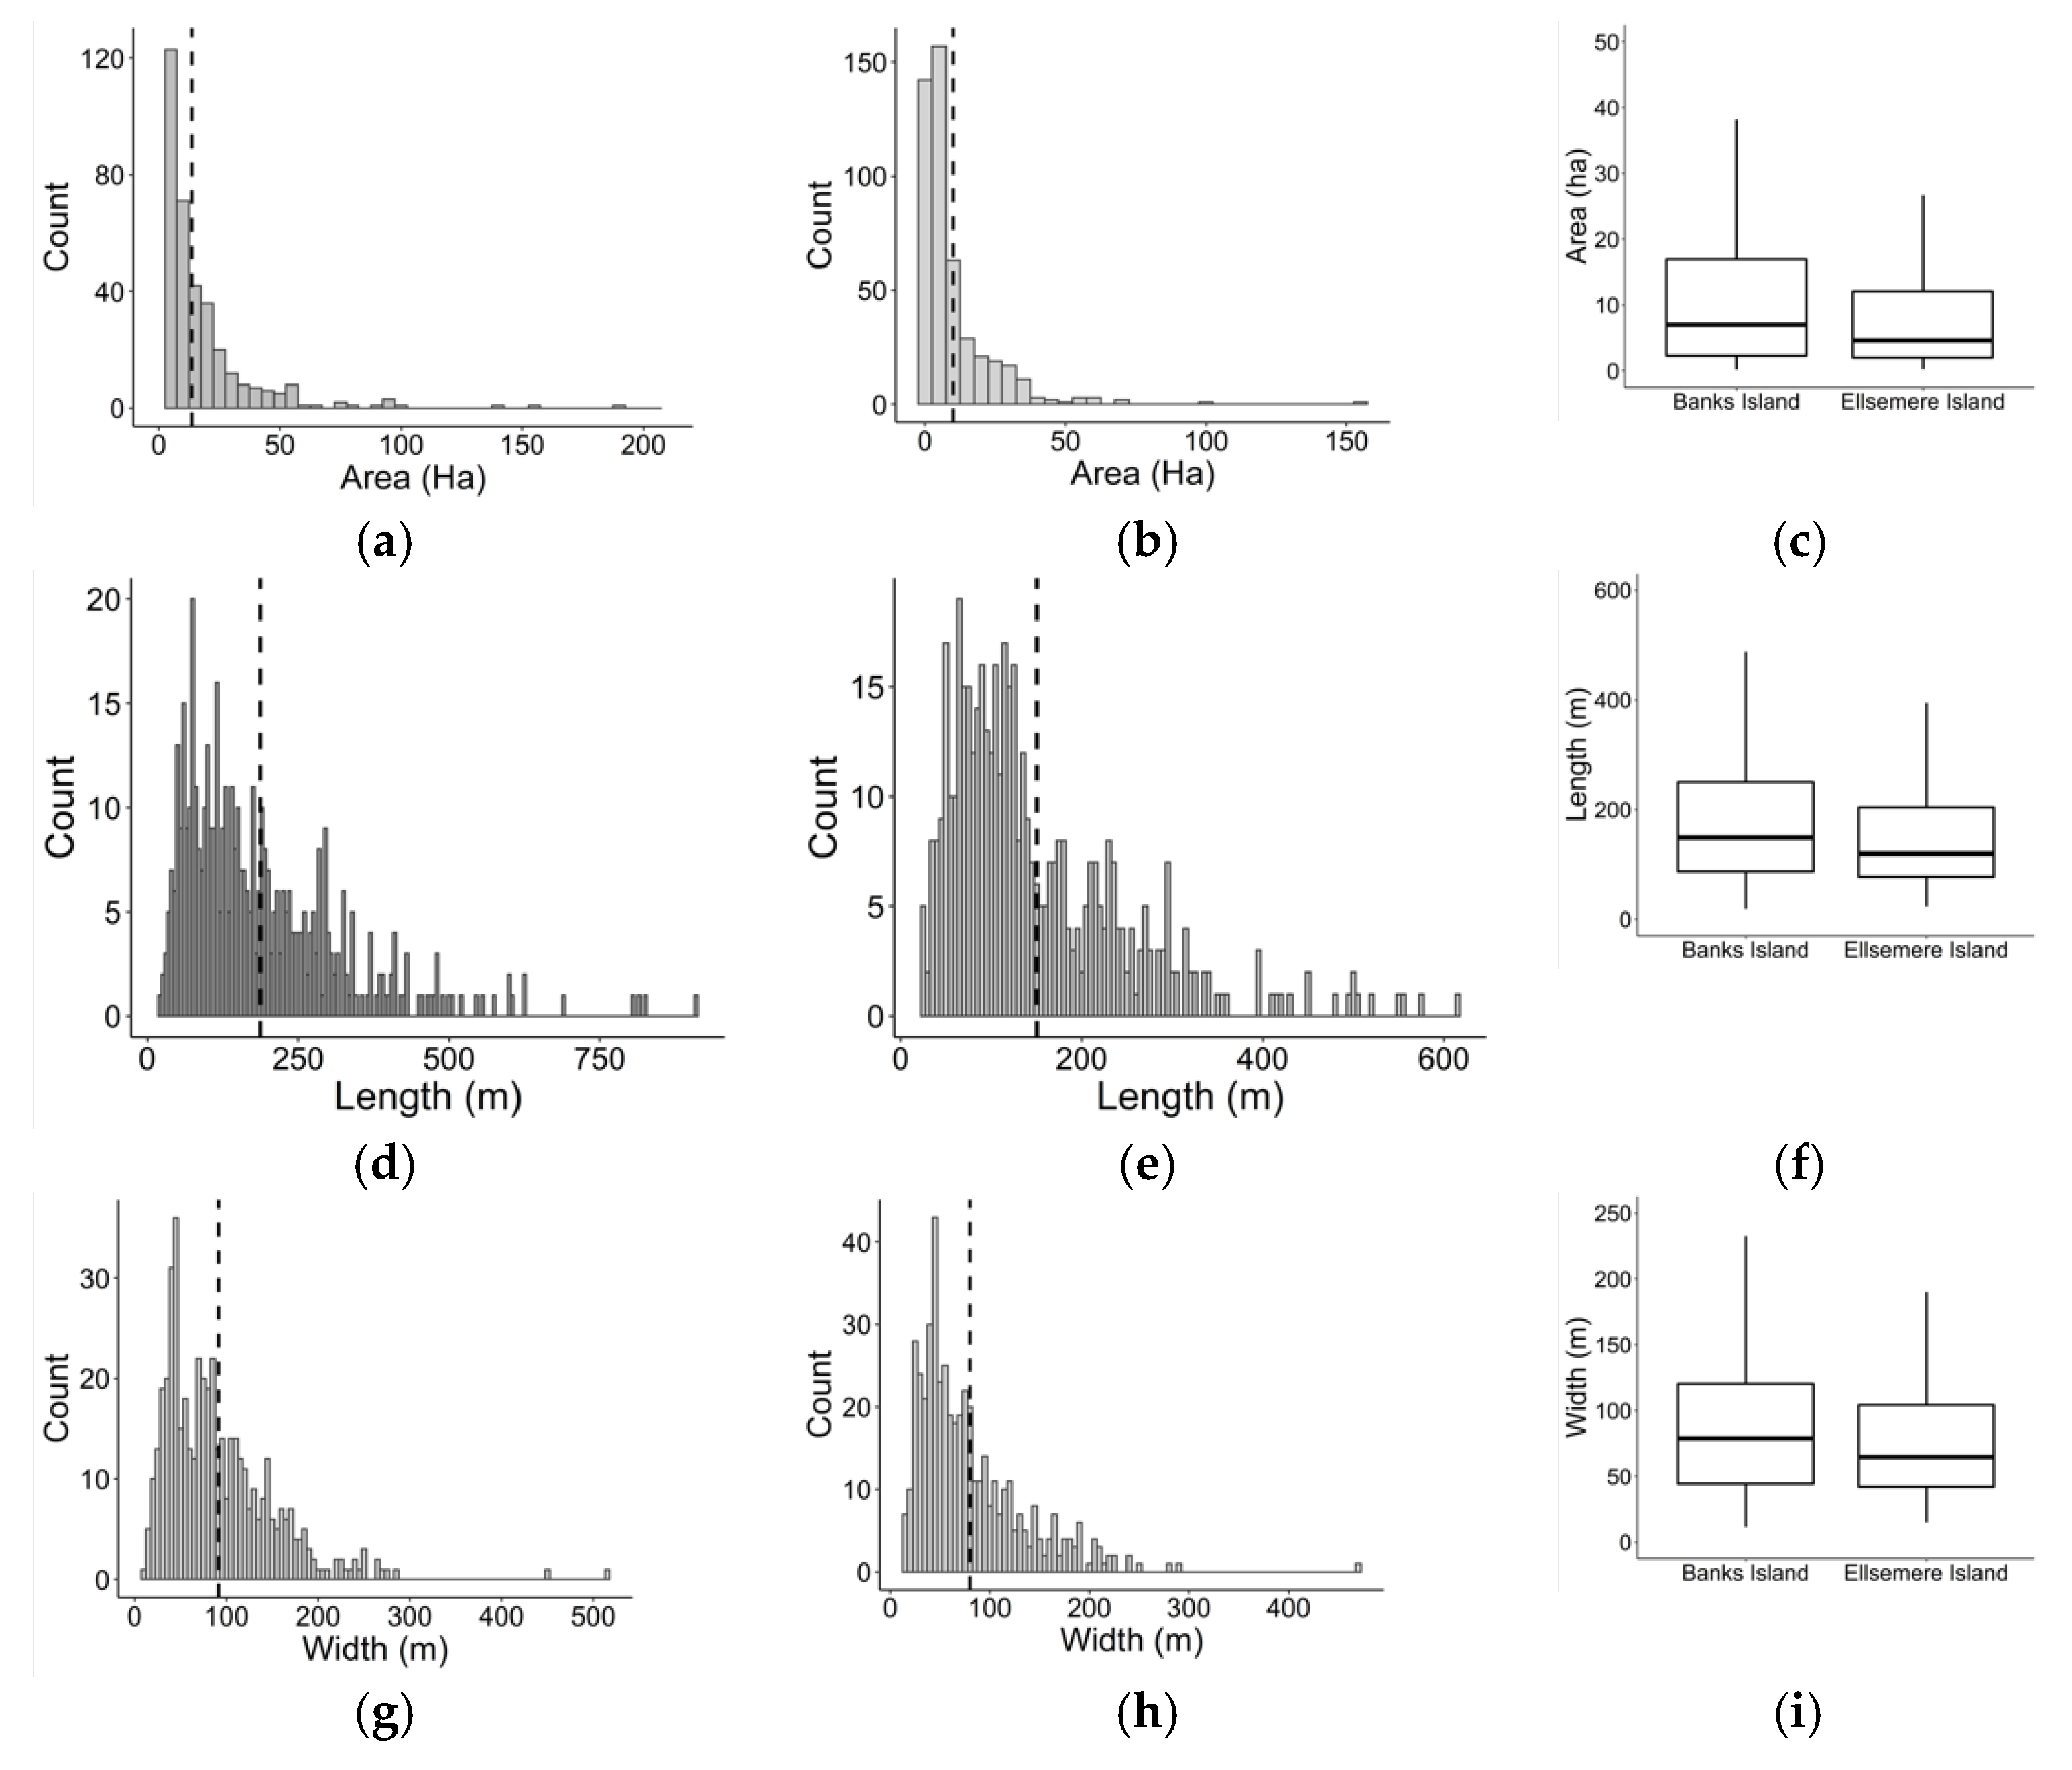
| Study Area | No. of Samples | Mean Area (ha) | Mean Length Major Axis (m) | Mean Width of Minor Axis (m) |
|---|---|---|---|---|
| Banks Island | 475 | 13.7 | 187.3 | 91.1 |
| ESL | 475 | 9.9 | 150.6 | 79.9 |
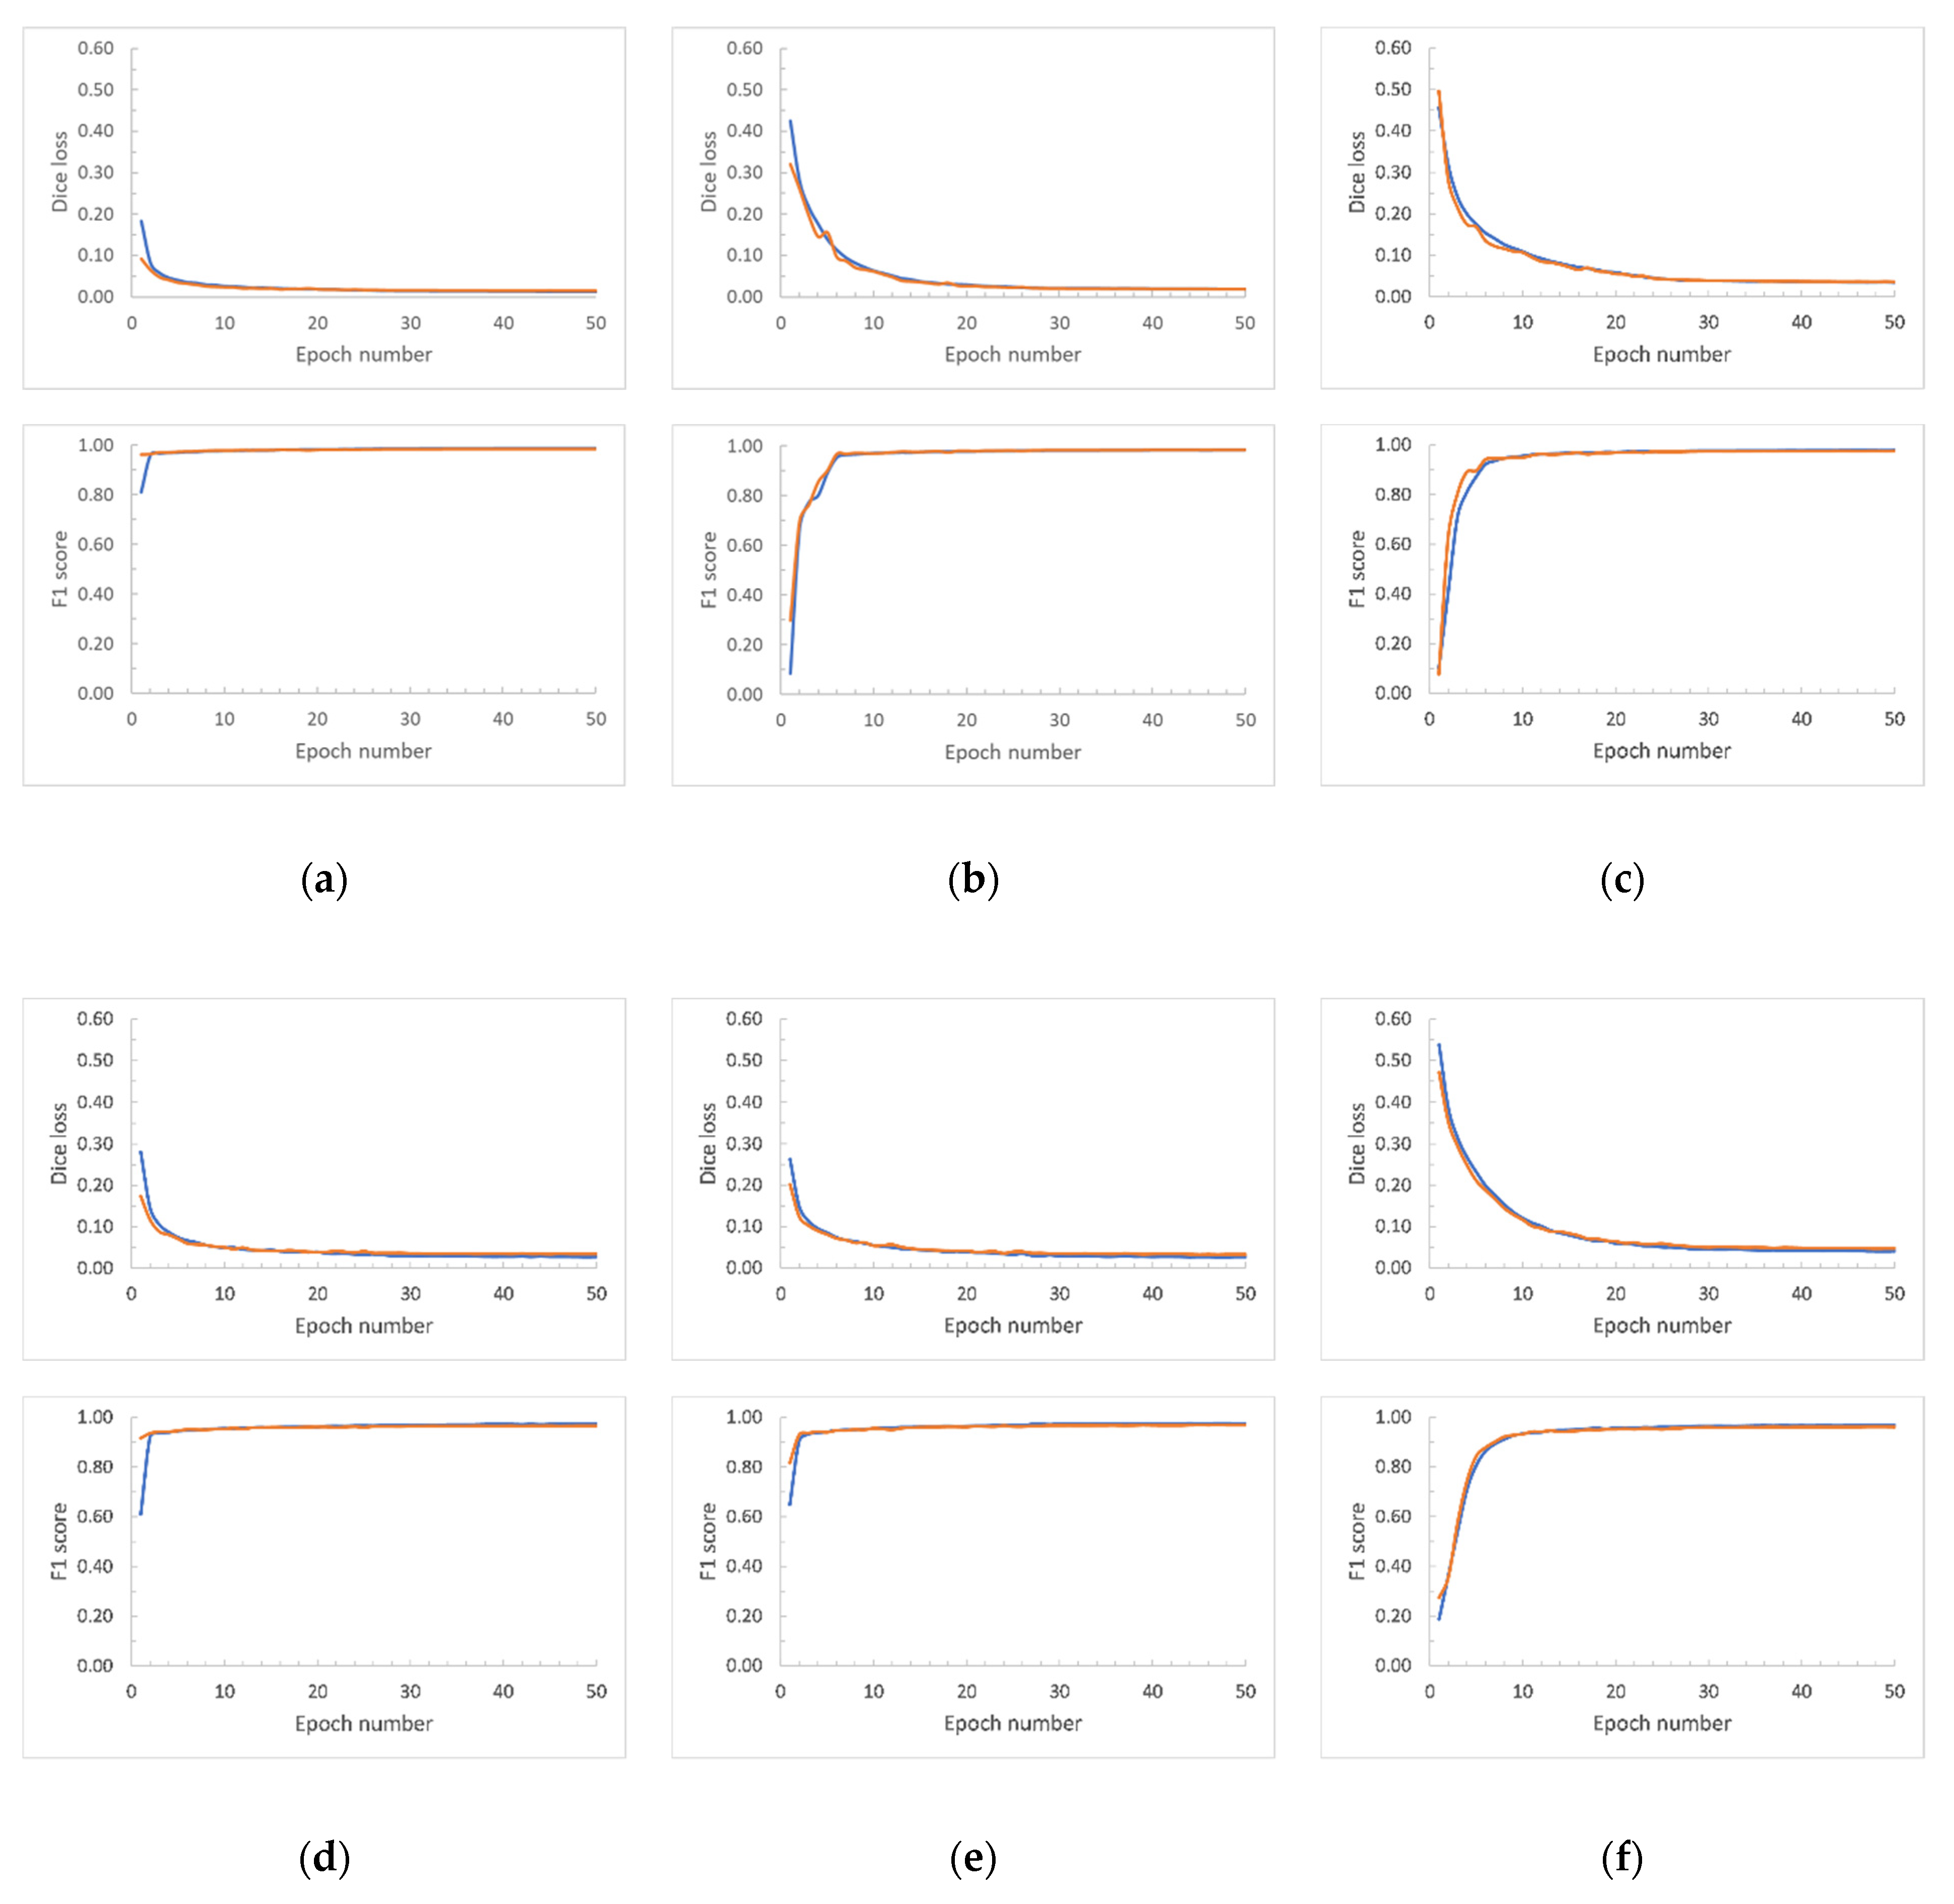
| Training Scenario | U-Net Input Size | Number of Samples | # of Epochs | Mini Batch Size | Learning Rate |
|---|---|---|---|---|---|
| Banks Island | 256 × 256 | 475 | 50 | 16 | 10−4 for epochs 1 to 25 and 10−5 from epoch 26 to 50. |
| Bank Island | 512 × 512 | 475 | 50 | 8 | |
| Banks Island | 1024 × 1024 | 475 | 50 | 4 | |
| ESL | 256 × 256 | 475 | 50 | 16 | |
| ESL | 512 × 512 | 475 | 50 | 8 | |
| ESL | 1024 × 1024 | 475 | 50 | 4 | |
| Combined samples | 256 × 256 | 950 | 50 | 16 | |
| Combined samples | 512 × 512 | 950 | 50 | 8 | |
| Combined samples | 1024 × 1024 | 950 | 50 | 4 |
| Area | Length | Width | Length to Width Ratio | |
|---|---|---|---|---|
| p-value | 0.0053 | 0.0009 | 0.0000 | 0.0001 |
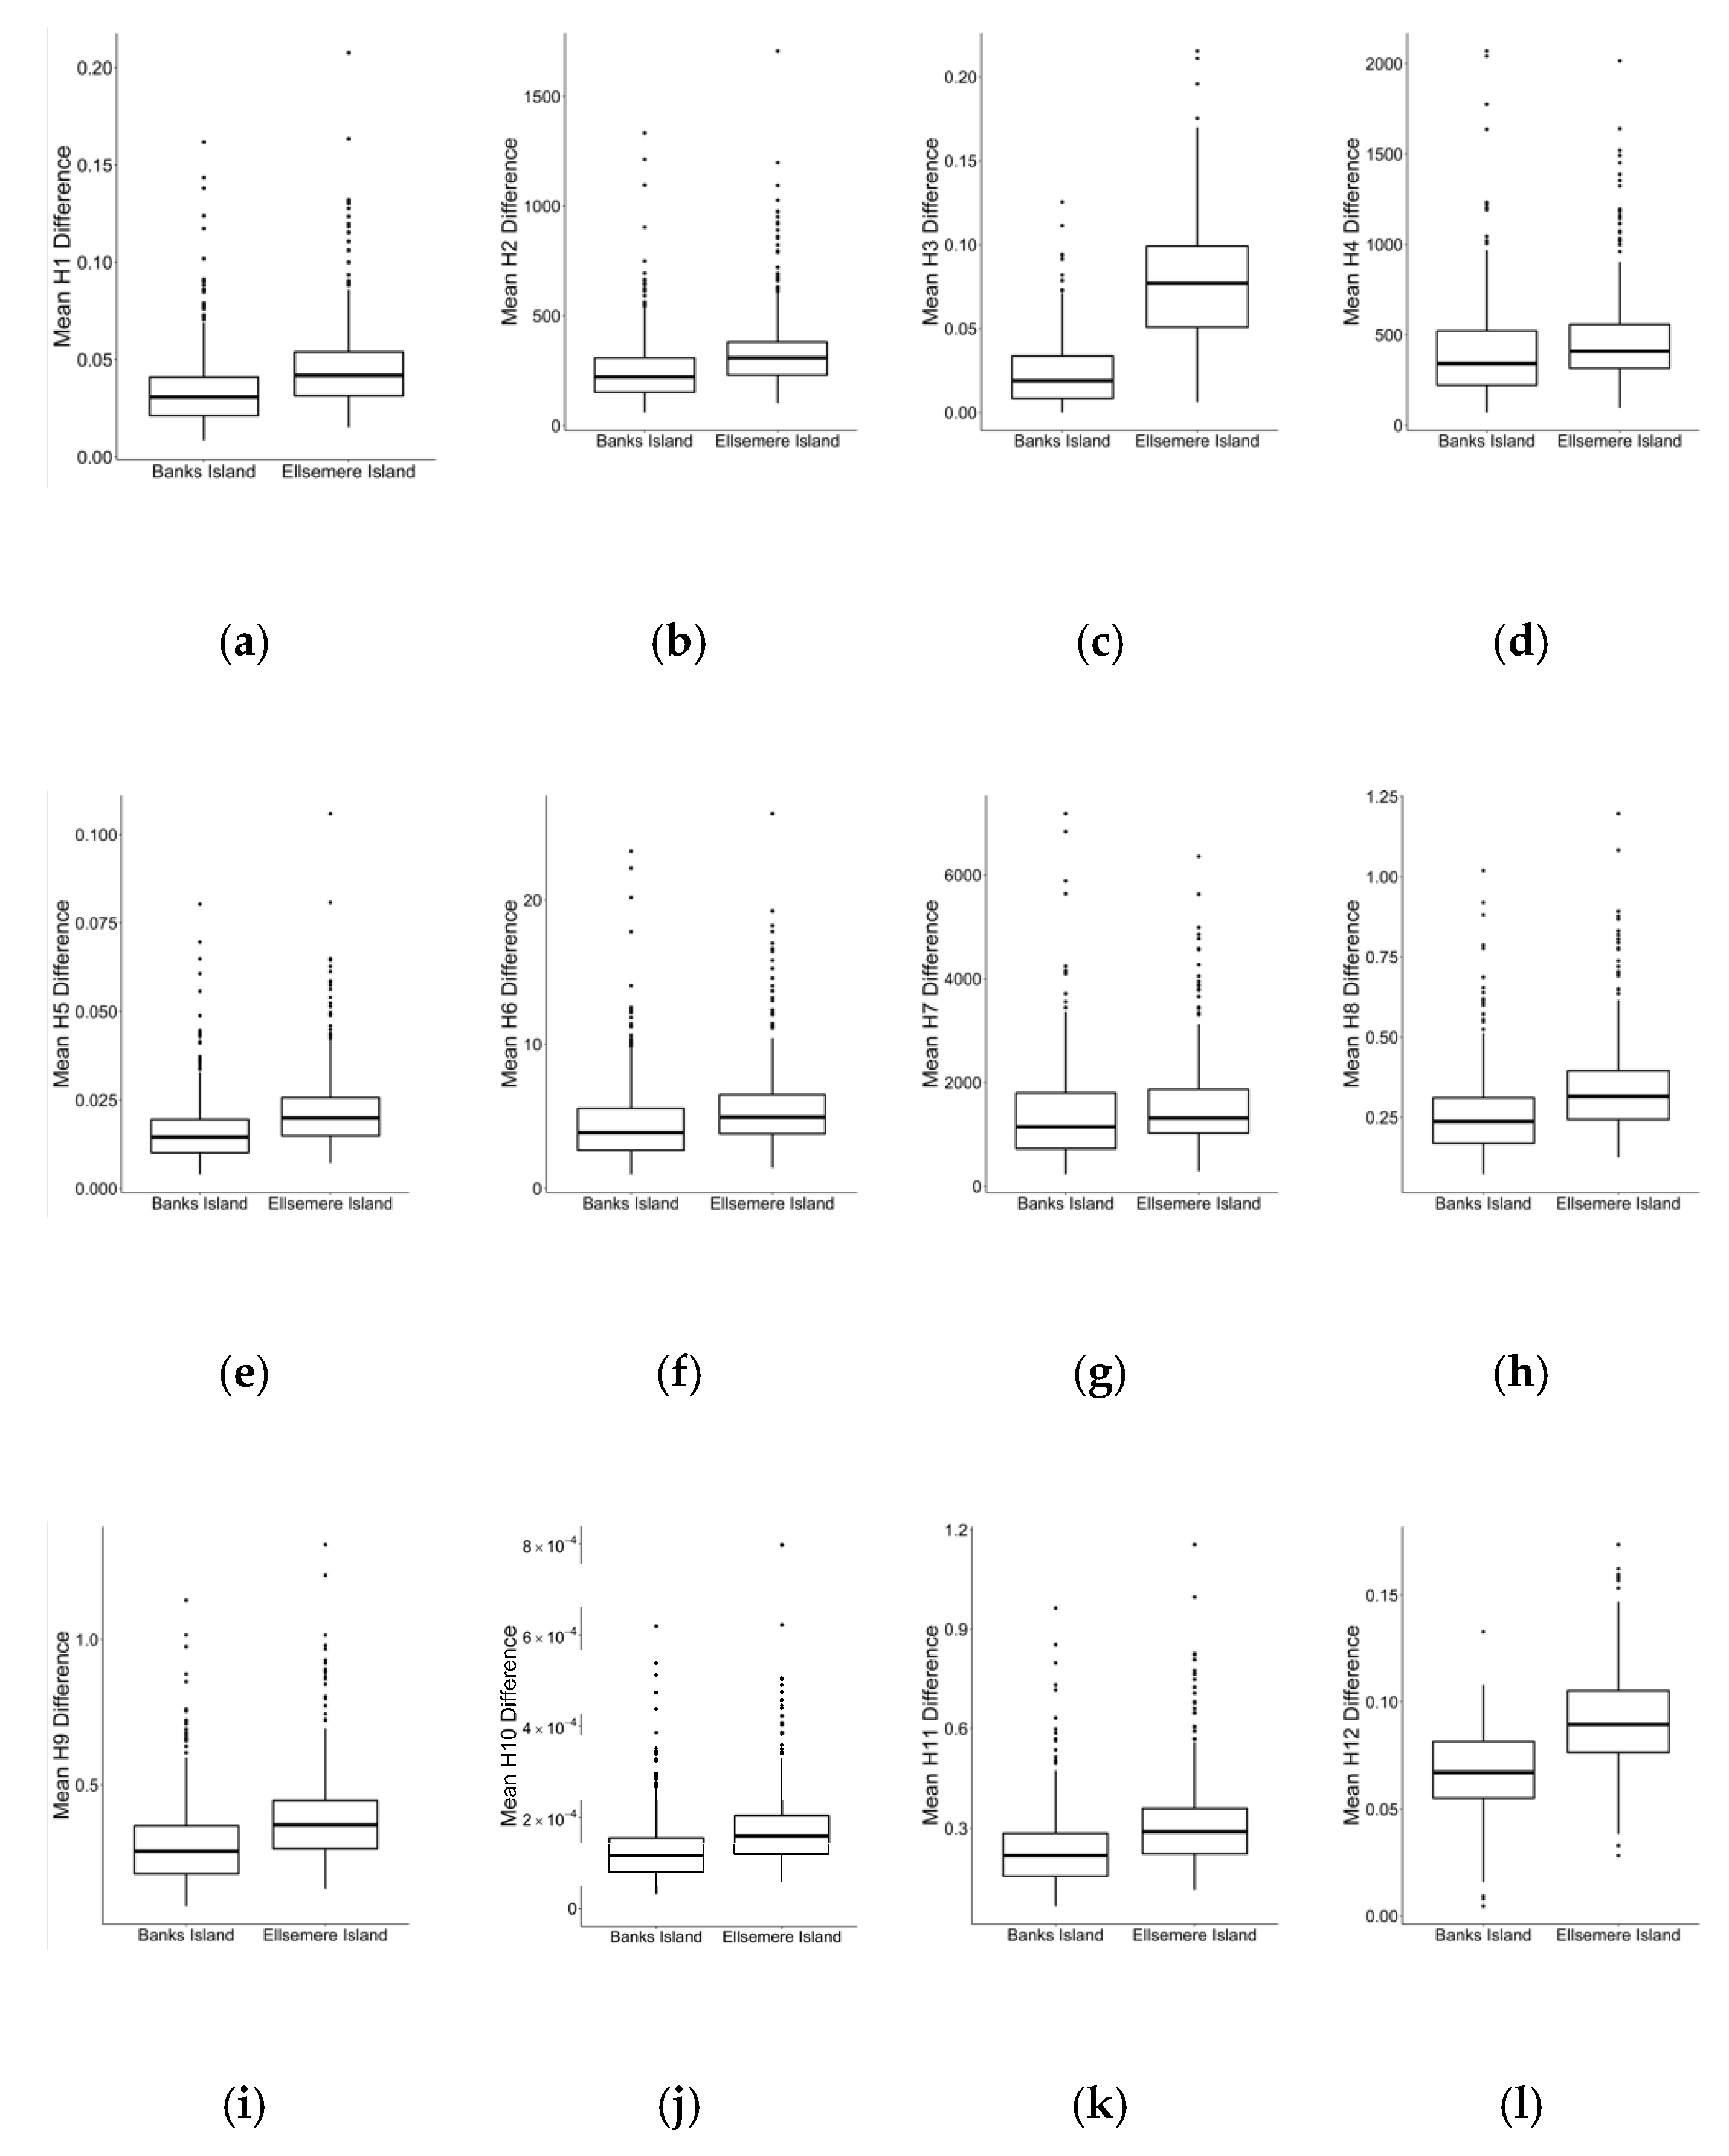
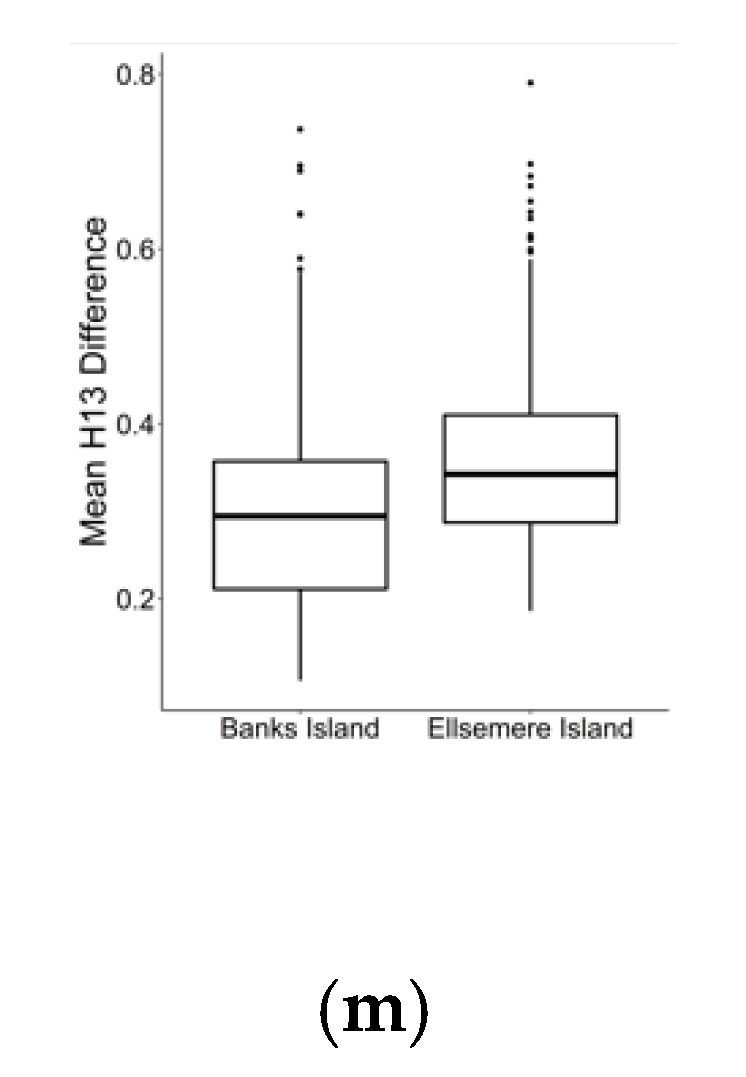
| H1 | H2 | H3 | H4 | H5 | H6 | H7 | H8 | H9 | H10 | H11 | H12 | H13 | |
|---|---|---|---|---|---|---|---|---|---|---|---|---|---|
| p-value | 0.0000 | 0.0000 | 0.0000 | 0.0000 | 0.0000 | 0.0000 | 0.0000 | 0.0000 | 0.0000 | 0.0000 | 0.0000 | 0.0000 | 0.0000 |
Publisher’s Note: MDPI stays neutral with regard to jurisdictional claims in published maps and institutional affiliations. |
© 2022 by the authors. Licensee MDPI, Basel, Switzerland. This article is an open access article distributed under the terms and conditions of the Creative Commons Attribution (CC BY) license (https://creativecommons.org/licenses/by/4.0/).
Share and Cite
Witharana, C.; Udawalpola, M.R.; Liljedahl, A.K.; Jones, M.K.W.; Jones, B.M.; Hasan, A.; Joshi, D.; Manos, E. Automated Detection of Retrogressive Thaw Slumps in the High Arctic Using High-Resolution Satellite Imagery. Remote Sens. 2022, 14, 4132. https://doi.org/10.3390/rs14174132
Witharana C, Udawalpola MR, Liljedahl AK, Jones MKW, Jones BM, Hasan A, Joshi D, Manos E. Automated Detection of Retrogressive Thaw Slumps in the High Arctic Using High-Resolution Satellite Imagery. Remote Sensing. 2022; 14(17):4132. https://doi.org/10.3390/rs14174132
Chicago/Turabian StyleWitharana, Chandi, Mahendra R. Udawalpola, Anna K. Liljedahl, Melissa K. Ward Jones, Benjamin M. Jones, Amit Hasan, Durga Joshi, and Elias Manos. 2022. "Automated Detection of Retrogressive Thaw Slumps in the High Arctic Using High-Resolution Satellite Imagery" Remote Sensing 14, no. 17: 4132. https://doi.org/10.3390/rs14174132