1. Introduction
Outcrops are bodies of rock that have been exposed to the surface due to earth’s natural events or anthropological activities. The oil and gas industry has long been benefited from outcrops as analogues for subsurface reservoirs, i.e., with similar characteristics to structures where oil and gas are actually found [
1]. These benefits are related to the continuous, easily accessible and high-quality quantitative data that well exposed analogue outcrops can offer, in contrast to labor intensive traditional subsurface data acquisition methods [
2,
3]. Literature has shown that most of the real reservoir’s characteristics can be properly extracted using analogous outcrops [
4].
One convenient assessing method that has been attracting more and more attention is the representation through digital outcrop models (DOMs). The generation of DOMs (i.e., 3D polygonal meshes of outcrops with photo-realistic texture) has become more frequent and accurate with the advancement of survey and processing techniques. Building DOMs usually starts by collecting a set of photographic frames in a controlled fashion via aerial platforms such as unmanned aerial vehicles (UAV) [
5,
6]. The acquisition is performed under a previously defined fly plan, which guaranties the necessary overlap between consecutive frames for further producing the 3D model. The procedure involves photogrammetry principles and computer vision algorithms [
7] and is widely employed, since it is a cheap, rapid and effective technique [
8,
9,
10].
A particular limitation faced by reconstructing outcrops using photogrammetry principles is that the collection of frames must properly observe the outcrop from all perspectives. However, many outcrops present steep walls, including many small subvertical structures (vertical angles smaller than 0°), which prevents observing the outcrop structures from sufficient perspectives. Moreover, approaching with a UAV or flying at low altitudes to increase the number of perspectives may result in collisions or other accidents that can damage the equipment. In most cases, the user must complement the dataset with terrestrial approaches, where a digital camera is handled manually along the entire lower portion of the outcrop. However, handling the digital camera without any pre-defined planning can potentially result in images with varied scales and possible gaps, which will dramatically impact the final model, and in some cases, can only be noticed after the field survey has ended.
Spheric panoramic images (SPIs) can circumvent the above-mentioned problem by automatically acquiring full sets of images able to feed reconstruction models from the bottom perspective. an SPI (also known as a 360° image) can provide a wide field of view of the object of interest and its surroundings in a single capture, avoiding many photo acquisitions [
11]. Some studies also report that using SPIs for 3D modeling allowed important time saving by avoiding unnecessary reworking [
12,
13,
14,
15,
16,
17,
18]. In this work, we propose using SPIs along with UAV data for digital outcrop models in a hybrid fashion. The integration is accomplished by a region based optimization strategy that selects the best point source to compose the final model. While a UAV is able to capture data from the aerial perspective, SPI data are able to properly visualize base features acquired from the ground perspective. The integrated product thus combines the advantages of both methods in a complementary fashion, circumventing the each system’s limitations.
Previous studies have solidly demonstrated the effectiveness of SPI data for 3D reconstruction purposes in approaches similar to the one discussed in the present work. We have found that the GoPro Fusion camera is the model most frequently used in scientific papers. One study [
14] used the GoPro Fusion camera onboard a UAV in addition to a common frame camera for 3D reconstruction of a castle for cultural heritage documentation. The integration of both sensors was justified by the authors to reconstruct, in a single flight, both horizontal and vertical features of the building, which usually requires more than one flight plan with different camera angle configurations for proper modeling. The accuracy reported for the 3D model was calculated using artificial targets that were surveyed with global navigation satellite system (GNSS) receiver equipment. They achieved an
RMSE of 5.42 cm. Ref. [
19] conducted a terrestrial survey with a GoPro Fusion camera to generate a 3D model of trees in an orange crop. The camera was properly calibrated in a controlled room with coded targets to estimate internal parameters and lens distortion. The mean error computed using checkpoints collected with GNSS equipment was 3.8 cm. The authors concluded that this technique succeeded in achieving the goal of accurately retrieving geometrical attributes from orange fruits and trees and that omnidirectional cameras are a good alternative due to the smaller number of images needed to build a 3D model.
Other works have used a variety of camera brands and models for SPI acquisition. The research using omnidirectional cameras for spherical panoramas for the first time deserves attention [
15], which was a pioneering advancement on the study of spherical photogrammetry [
20]. The camera employed in that case was a Panono 360º, composed of 36 camera sensors, which resulted in an equirectangular image with over 130 megapixel resolution. The authors took a total of 14 panoramas and built a dense point cloud, resulting in 1.5 billion points. The accuracy assessment performed on the generated point cloud resulted in a 3D mean error of 8 cm, which was considered too coarse and raised the need for post-processing. Yet, the conclusion was optimistic, suggesting that the methodology would require improvement but that it could be used properly to document cultural heritage. Ref. [
13] used a Xiaomi Mijia Mi Sphere 360 camera and performed several evaluations using the generated dense point cloud and orthophotos of different locations, carrying out the processing on two commercial software platforms (Agisoft Metashape and Pix4Dmapper). One of the evaluations concerned the accuracy, which was addressed by using checkpoints collected with a Total Station, reaching a 3D
RMSE of approximately 1.2 cm for the worst processing scenario. The dense point cloud was compared against a 3D laser scanner point cloud to assess the geometry of the generated product resulting from the spherical panoramas, obtaining a discrepancy of about 0.5 cm. The authors reported results similar to traditional photogrammetric projects with traditional cameras (within 0.5 and 1.5 pixel accuracy). However, they mentioned that the resolution of the products was usually 4 to 6 times worse when using an omnidirectional camera, given the wider field of view covered compared to traditional cameras.
In the next sections, we introduce, test and discuss the proposed integration technique based simultaneously on UAV and SPI data for 3D outcrop modeling. In order to confirm the initial assumptions, we performed validation tests on the SPI output, and calculated appropriate metrics according to a UAV-adjusted output used as reference. Based on the previous results, we then performed refinement of SPI data with tools designed to recognize and remove occasional outliers. With both point-cloud-corrected and properly adjusted data, we implemented our optimized approach to automatically re-build the point cloud according to the point source presenting the best performance.
2. Materials and Methods
2.1. Study Area
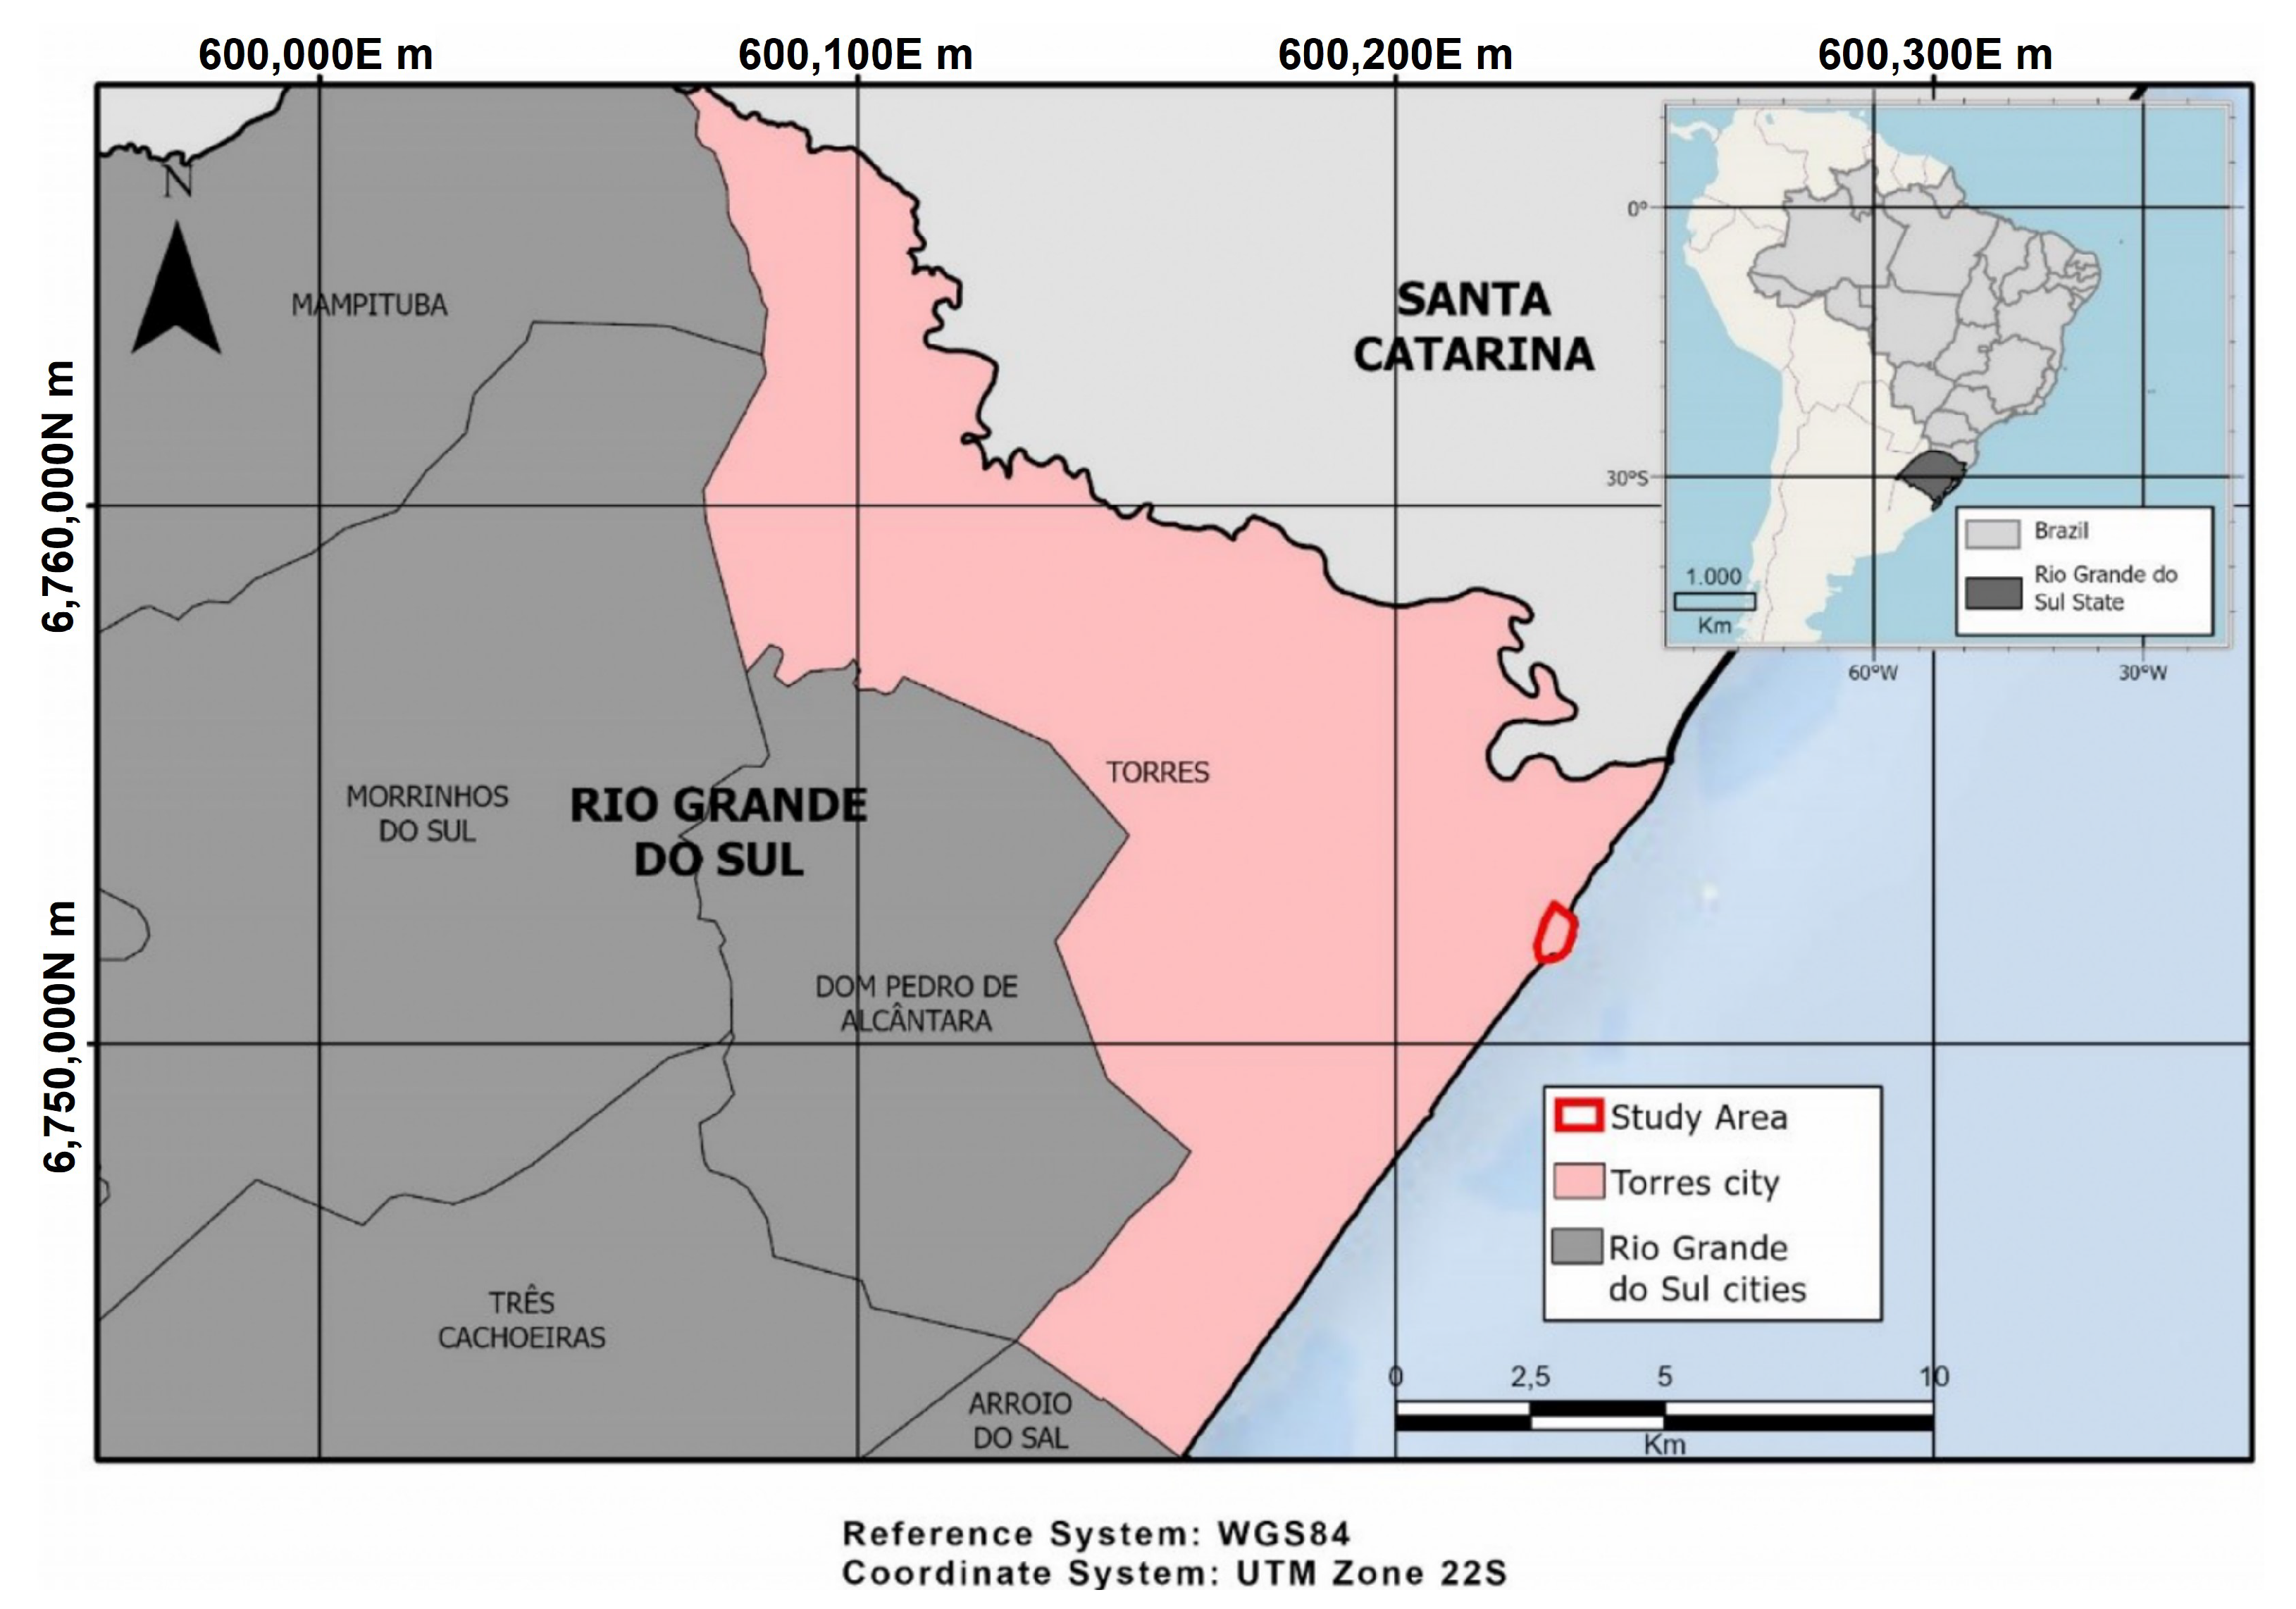
The outcrop selected for testing our approach is located on Brazil’s southern coast, and the acquisitions were performed between 12 December and 14 December 2019. The area is in José Lutzenberger State Park, also known as Parque Estadual da Guarita, in the city of Torres, RS, Brazil (
Figure 1). Outcrops of the Paraná basin are exposed in the form of discontinuous cliffs and show excellent exposed contact between the Botucatu Formation—eolian sandstones—and the Serra Geral Formation—basalts. The outcrops shows a relatively thick layer of basalts with minor patches of sand-grade sediments from a major volcanic flood event that overlaid the sandstone package with a discordance surface [
21].
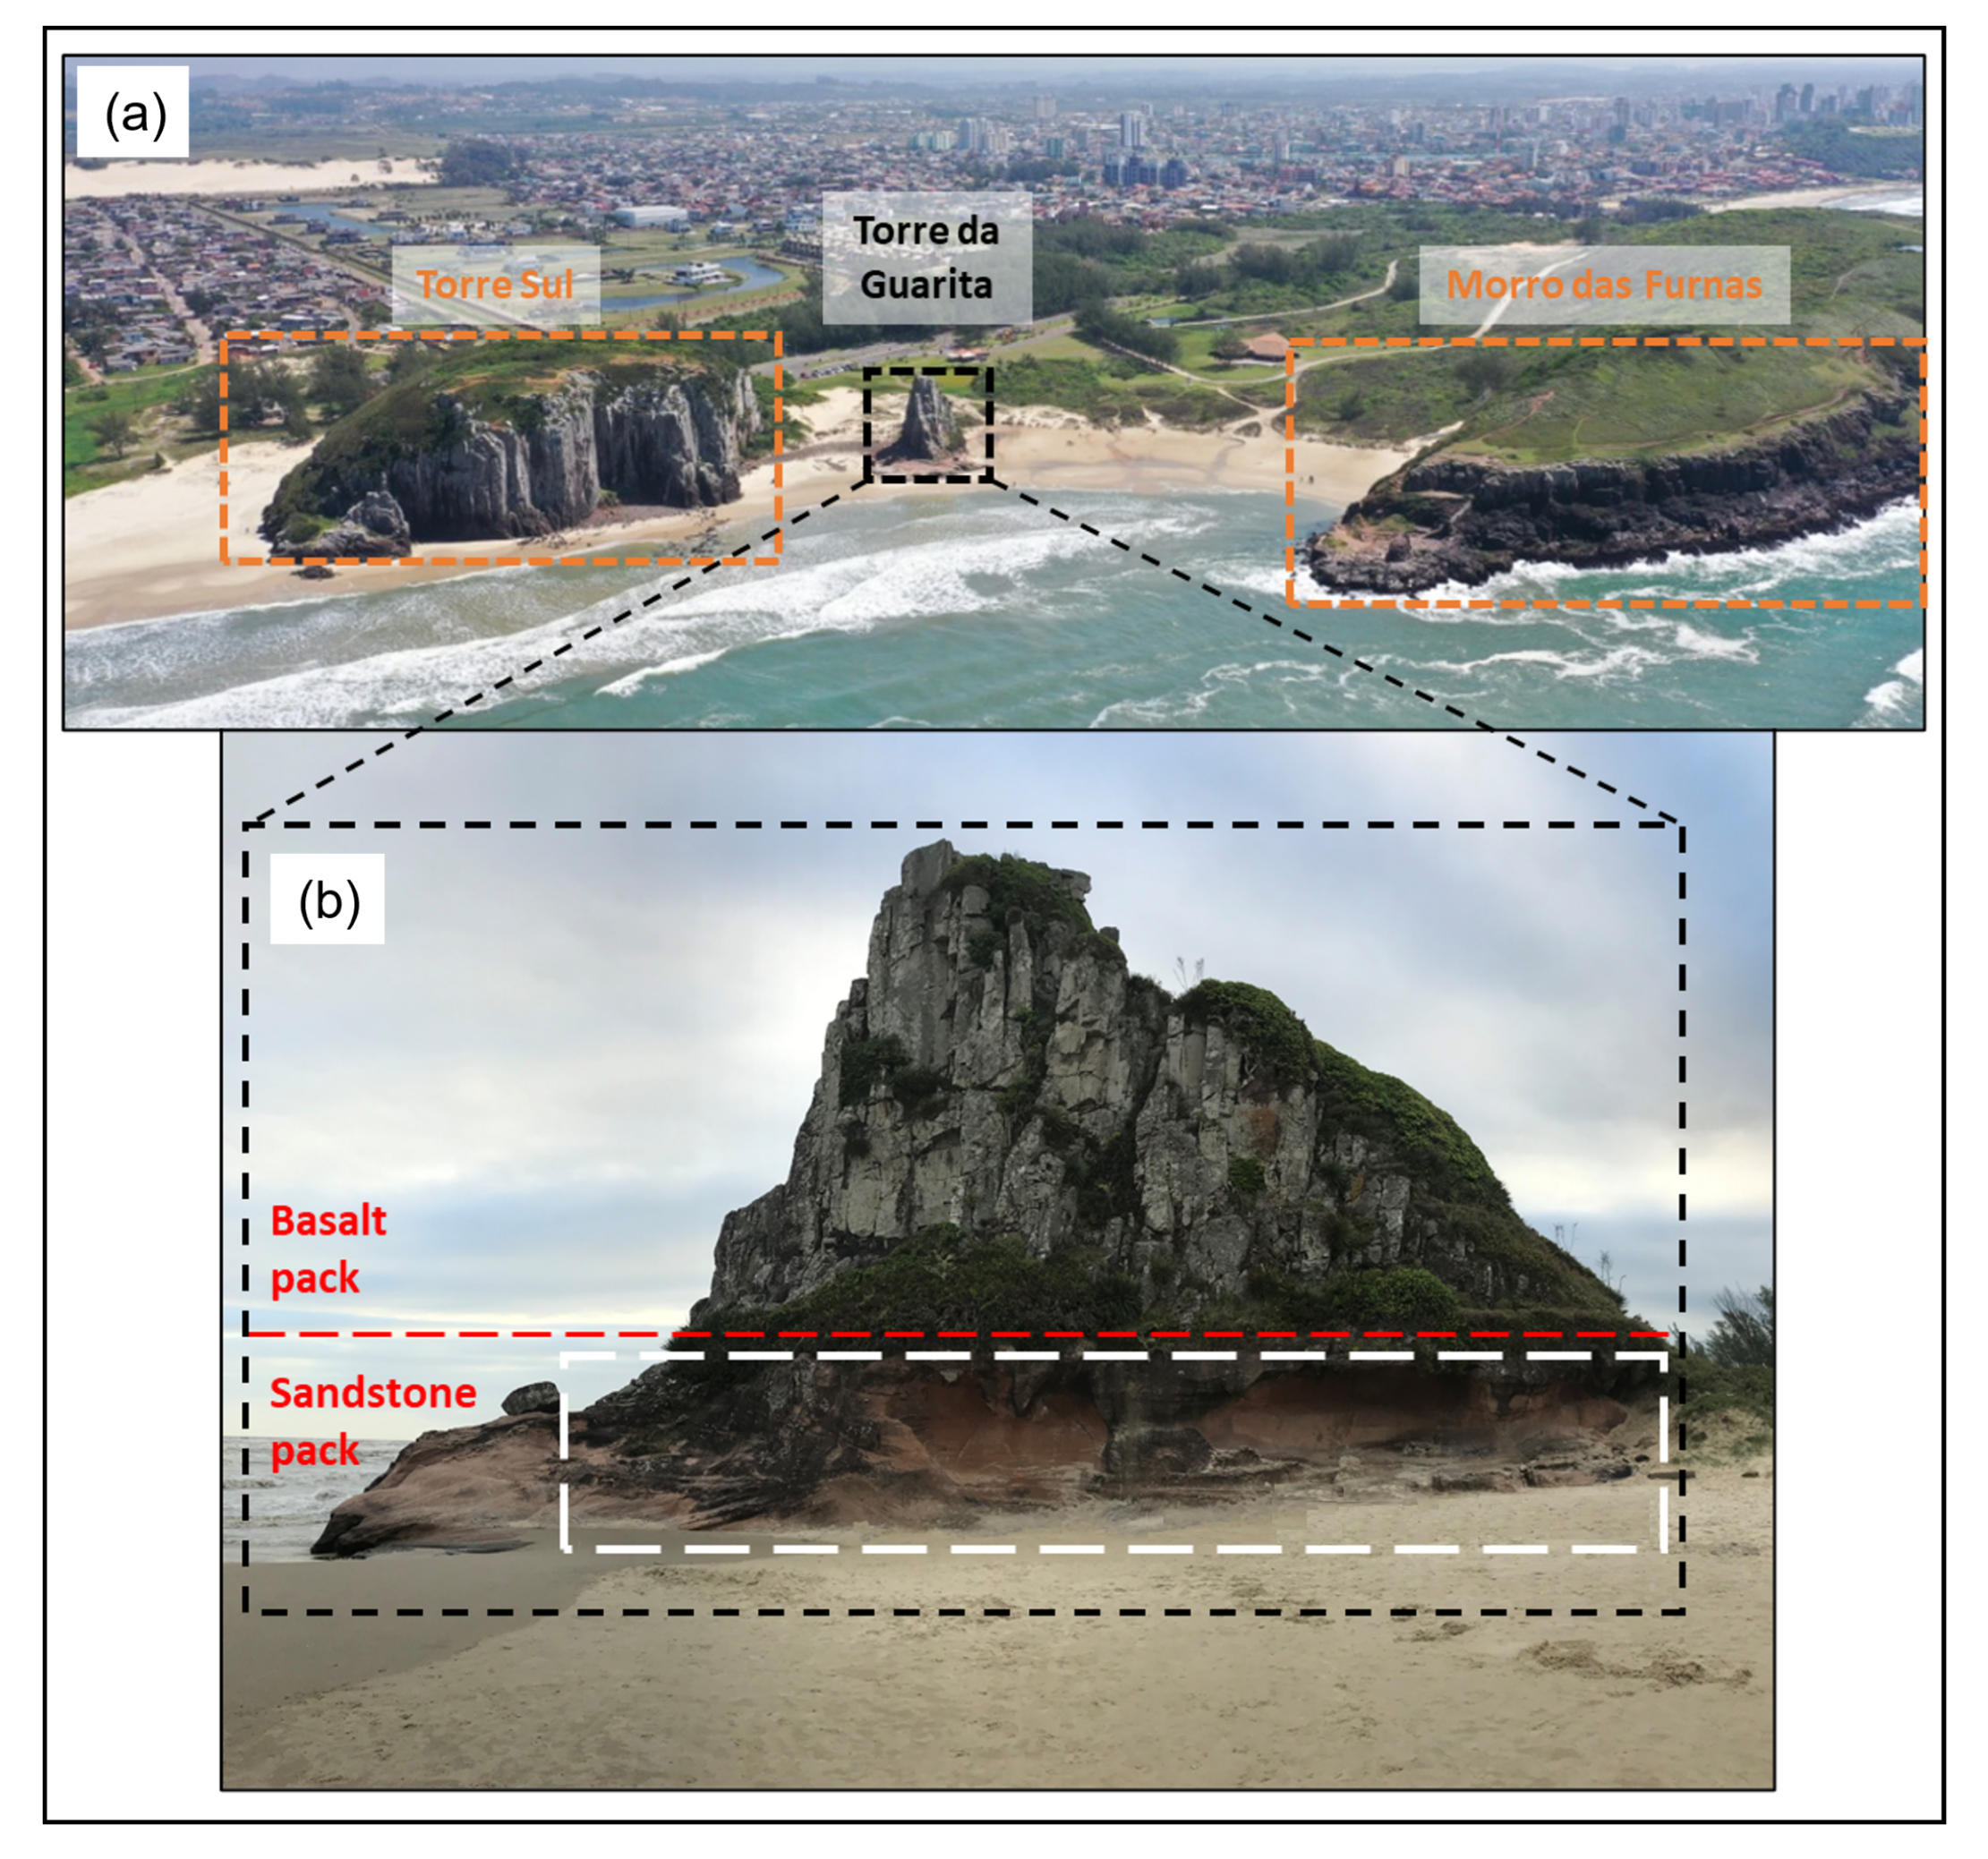
The rock exposure is divided into three major outcrops (
Figure 2). The southern one is known as Torre Sul, and is followed by a smaller outcrop to the north named Torre da Guarita and a large one named Morro das Furnas. The rocky wall selected for testing the proposed integration method was restricted to a portion of Torre da Guarita outcrop, more specifically the base of its NE face, which has easy terrestrial access by the beach and shows a good exposure of Botucatu’s sandstones, as detailed in
Figure 2. The outcrop is approximately 30 m in height from its base to its peak and 47 m in length.
2.2. Spherical Panoramic Images (SPIs)
It is opportune to start establishing the basic characteristics of SPI acquisition and the relationship with traditional photogrametry. SPIs are photographic products that can provide large views of a scene through their wide fields of view, allowing regional contextualization of the object of interest from a single image. They are produced after a group of two or more overlapping photos taken from a unique point of view are submitted to a stitching algorithm, which merges the photos, smoothing the overlapping regions. The stitching procedure usually saves considerable processing time during model reconstruction and also compensates in real time for scale differences and overlapping adjustment of the collection of SPI frames, ensuring complete covering of a given target at uniform resolution.
Among the different types of panoramic images, the spherical panorama is the most complete in terms of field of view, because it covers 360 degrees horizontally and 180 degrees vertically (a semi-sphere), allowing the representation an entire scene [
22]. The spherical panorama can be represented in a 2D image using the equirectangular projection, which is a type of cartographic projection that preserves lengths measured on horizontal lines of the image (parallels). This projection is usually employed in photogrammetric applications because it allows simple correlations between the pixel coordinates on a 2D image (cartesian coordinates) and on the points of the 3D sphere (polar coordinates). The photogrammetric description for spherical panoramas can be found in [
11,
23].
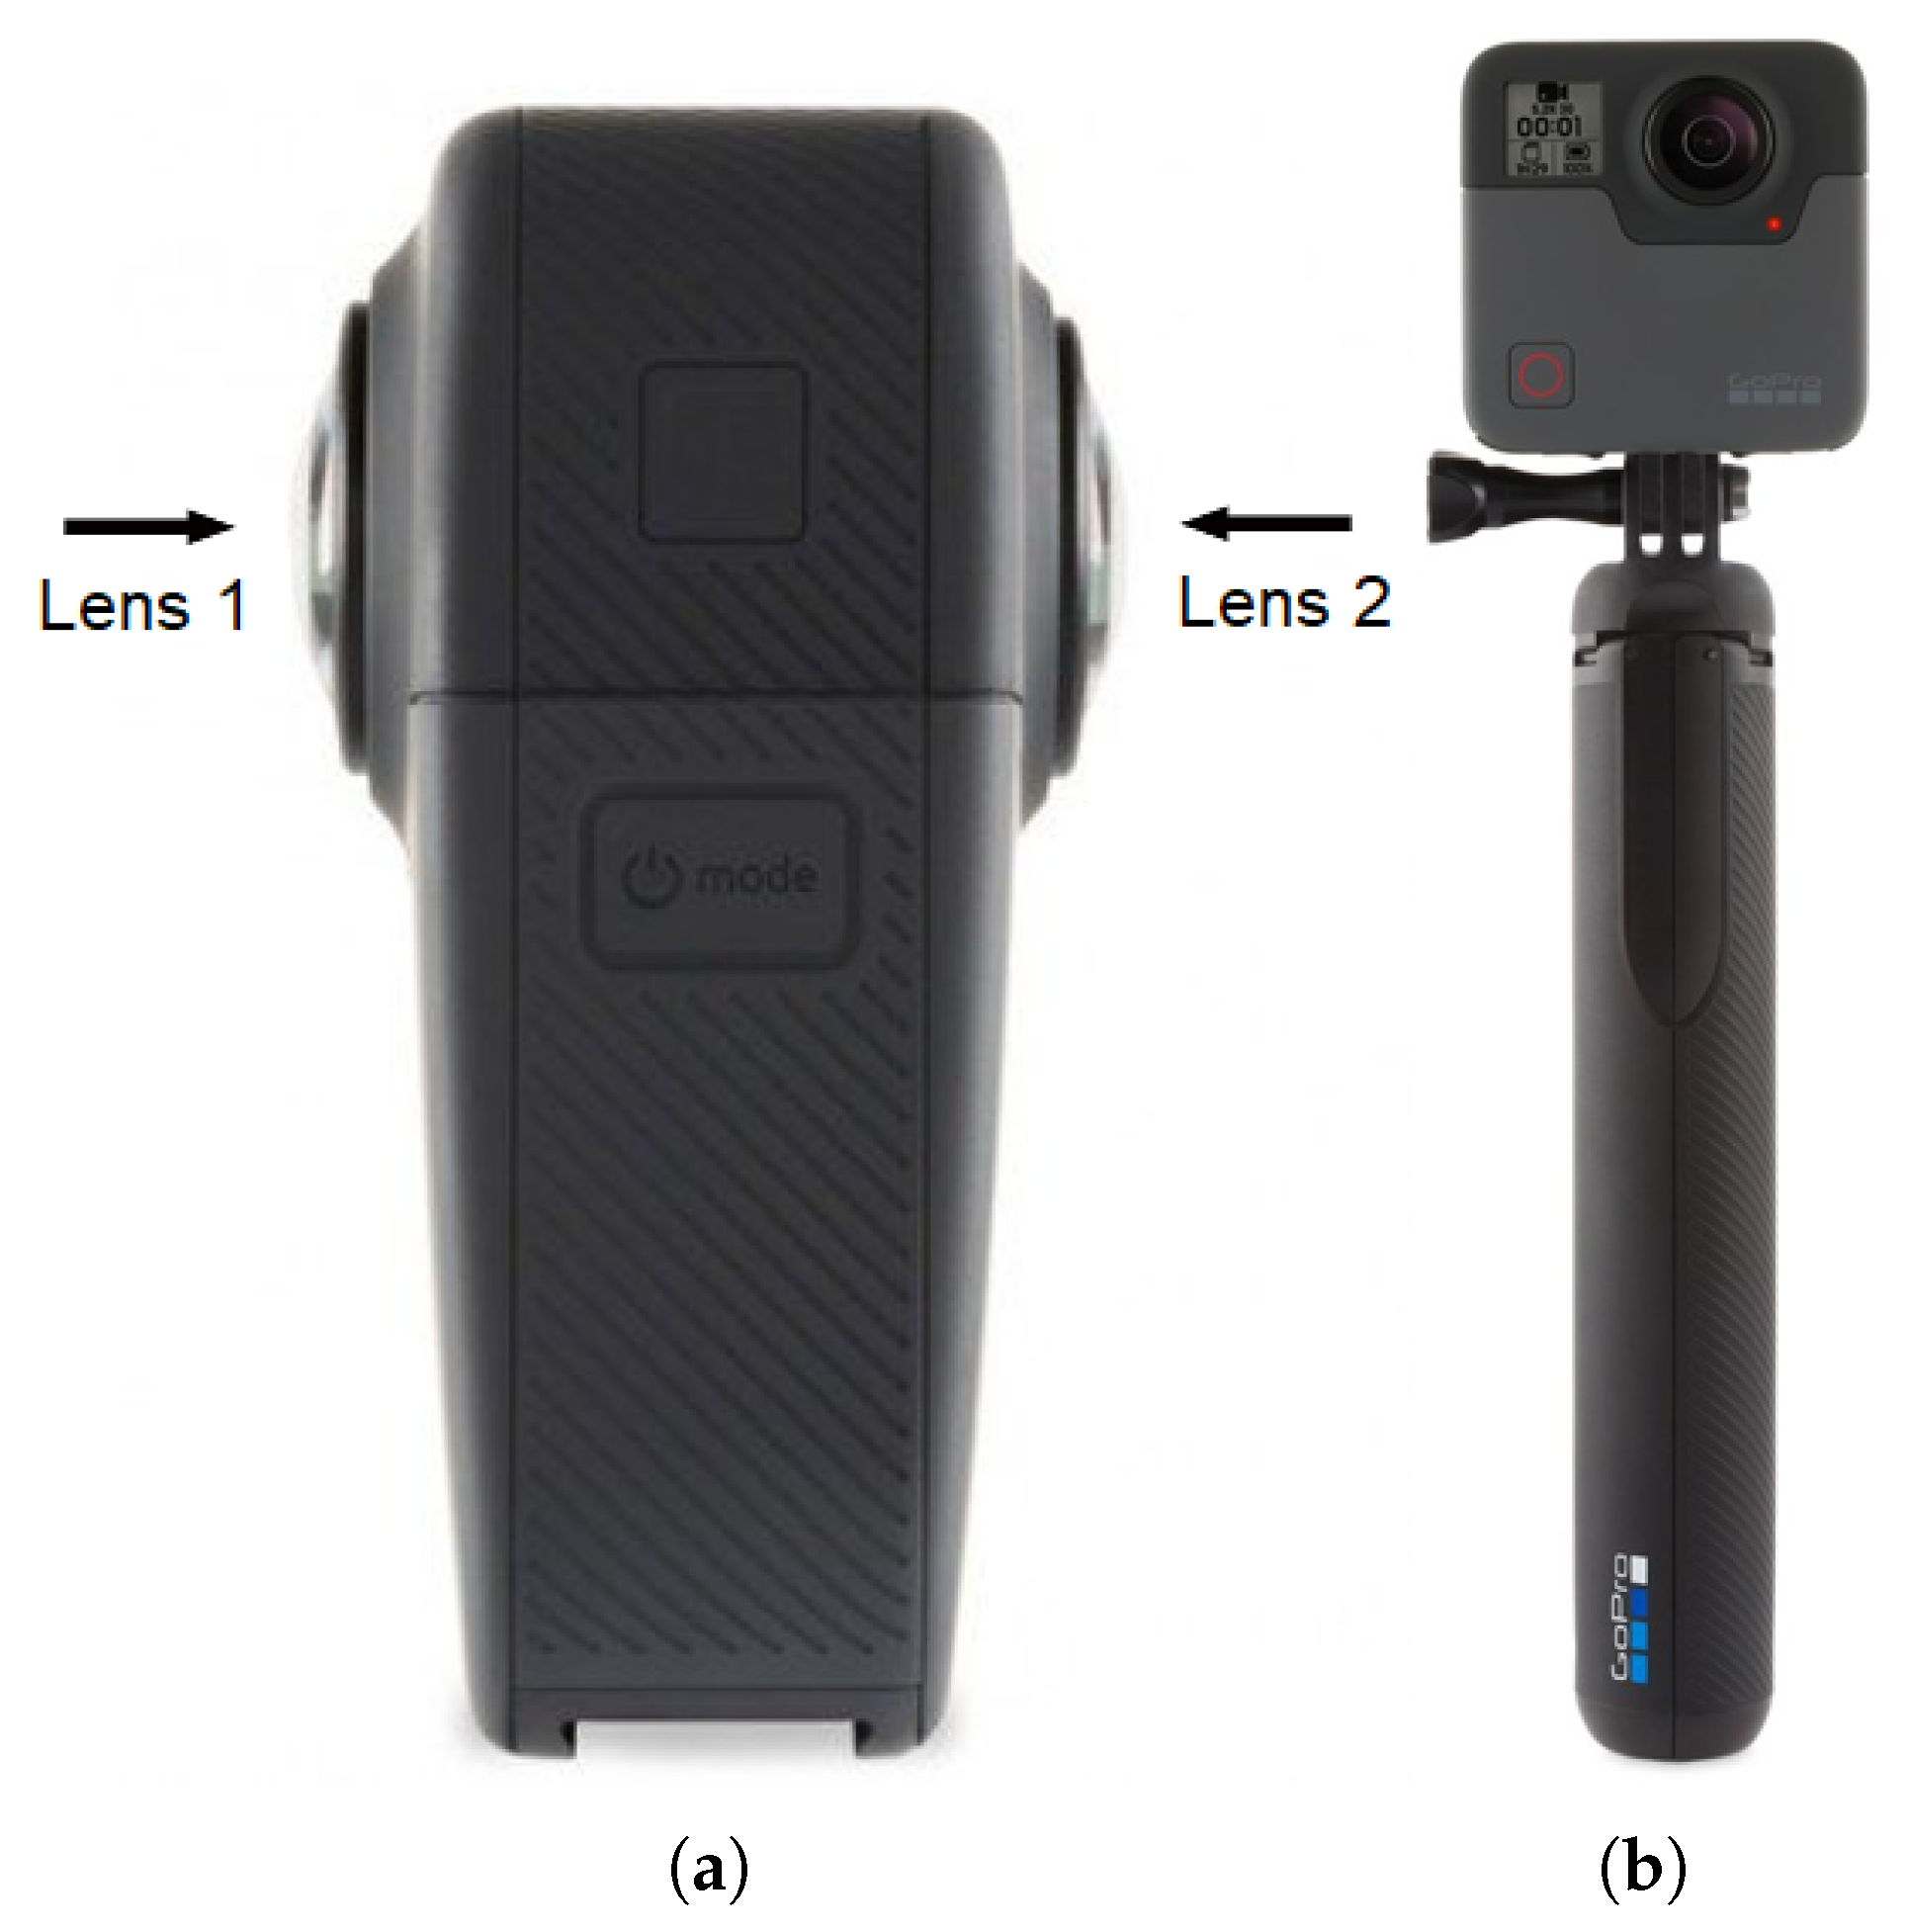
Omnidirectional cameras are a convenient way to generate SPIs, since they have more than one lens, usually of the fisheye type [
24], facing different vision angles and capturing all the images simultaneously. The images can then be stitched together, generating a full spherical panorama in a single shot, reducing considerably the image capture time and complexity [
15]. The GoPro Fusion camera mentioned earlier is an example (
Figure 3). It has two embedded lenses: one at the front and the another at the back of the instrument, providing a full spherical image.
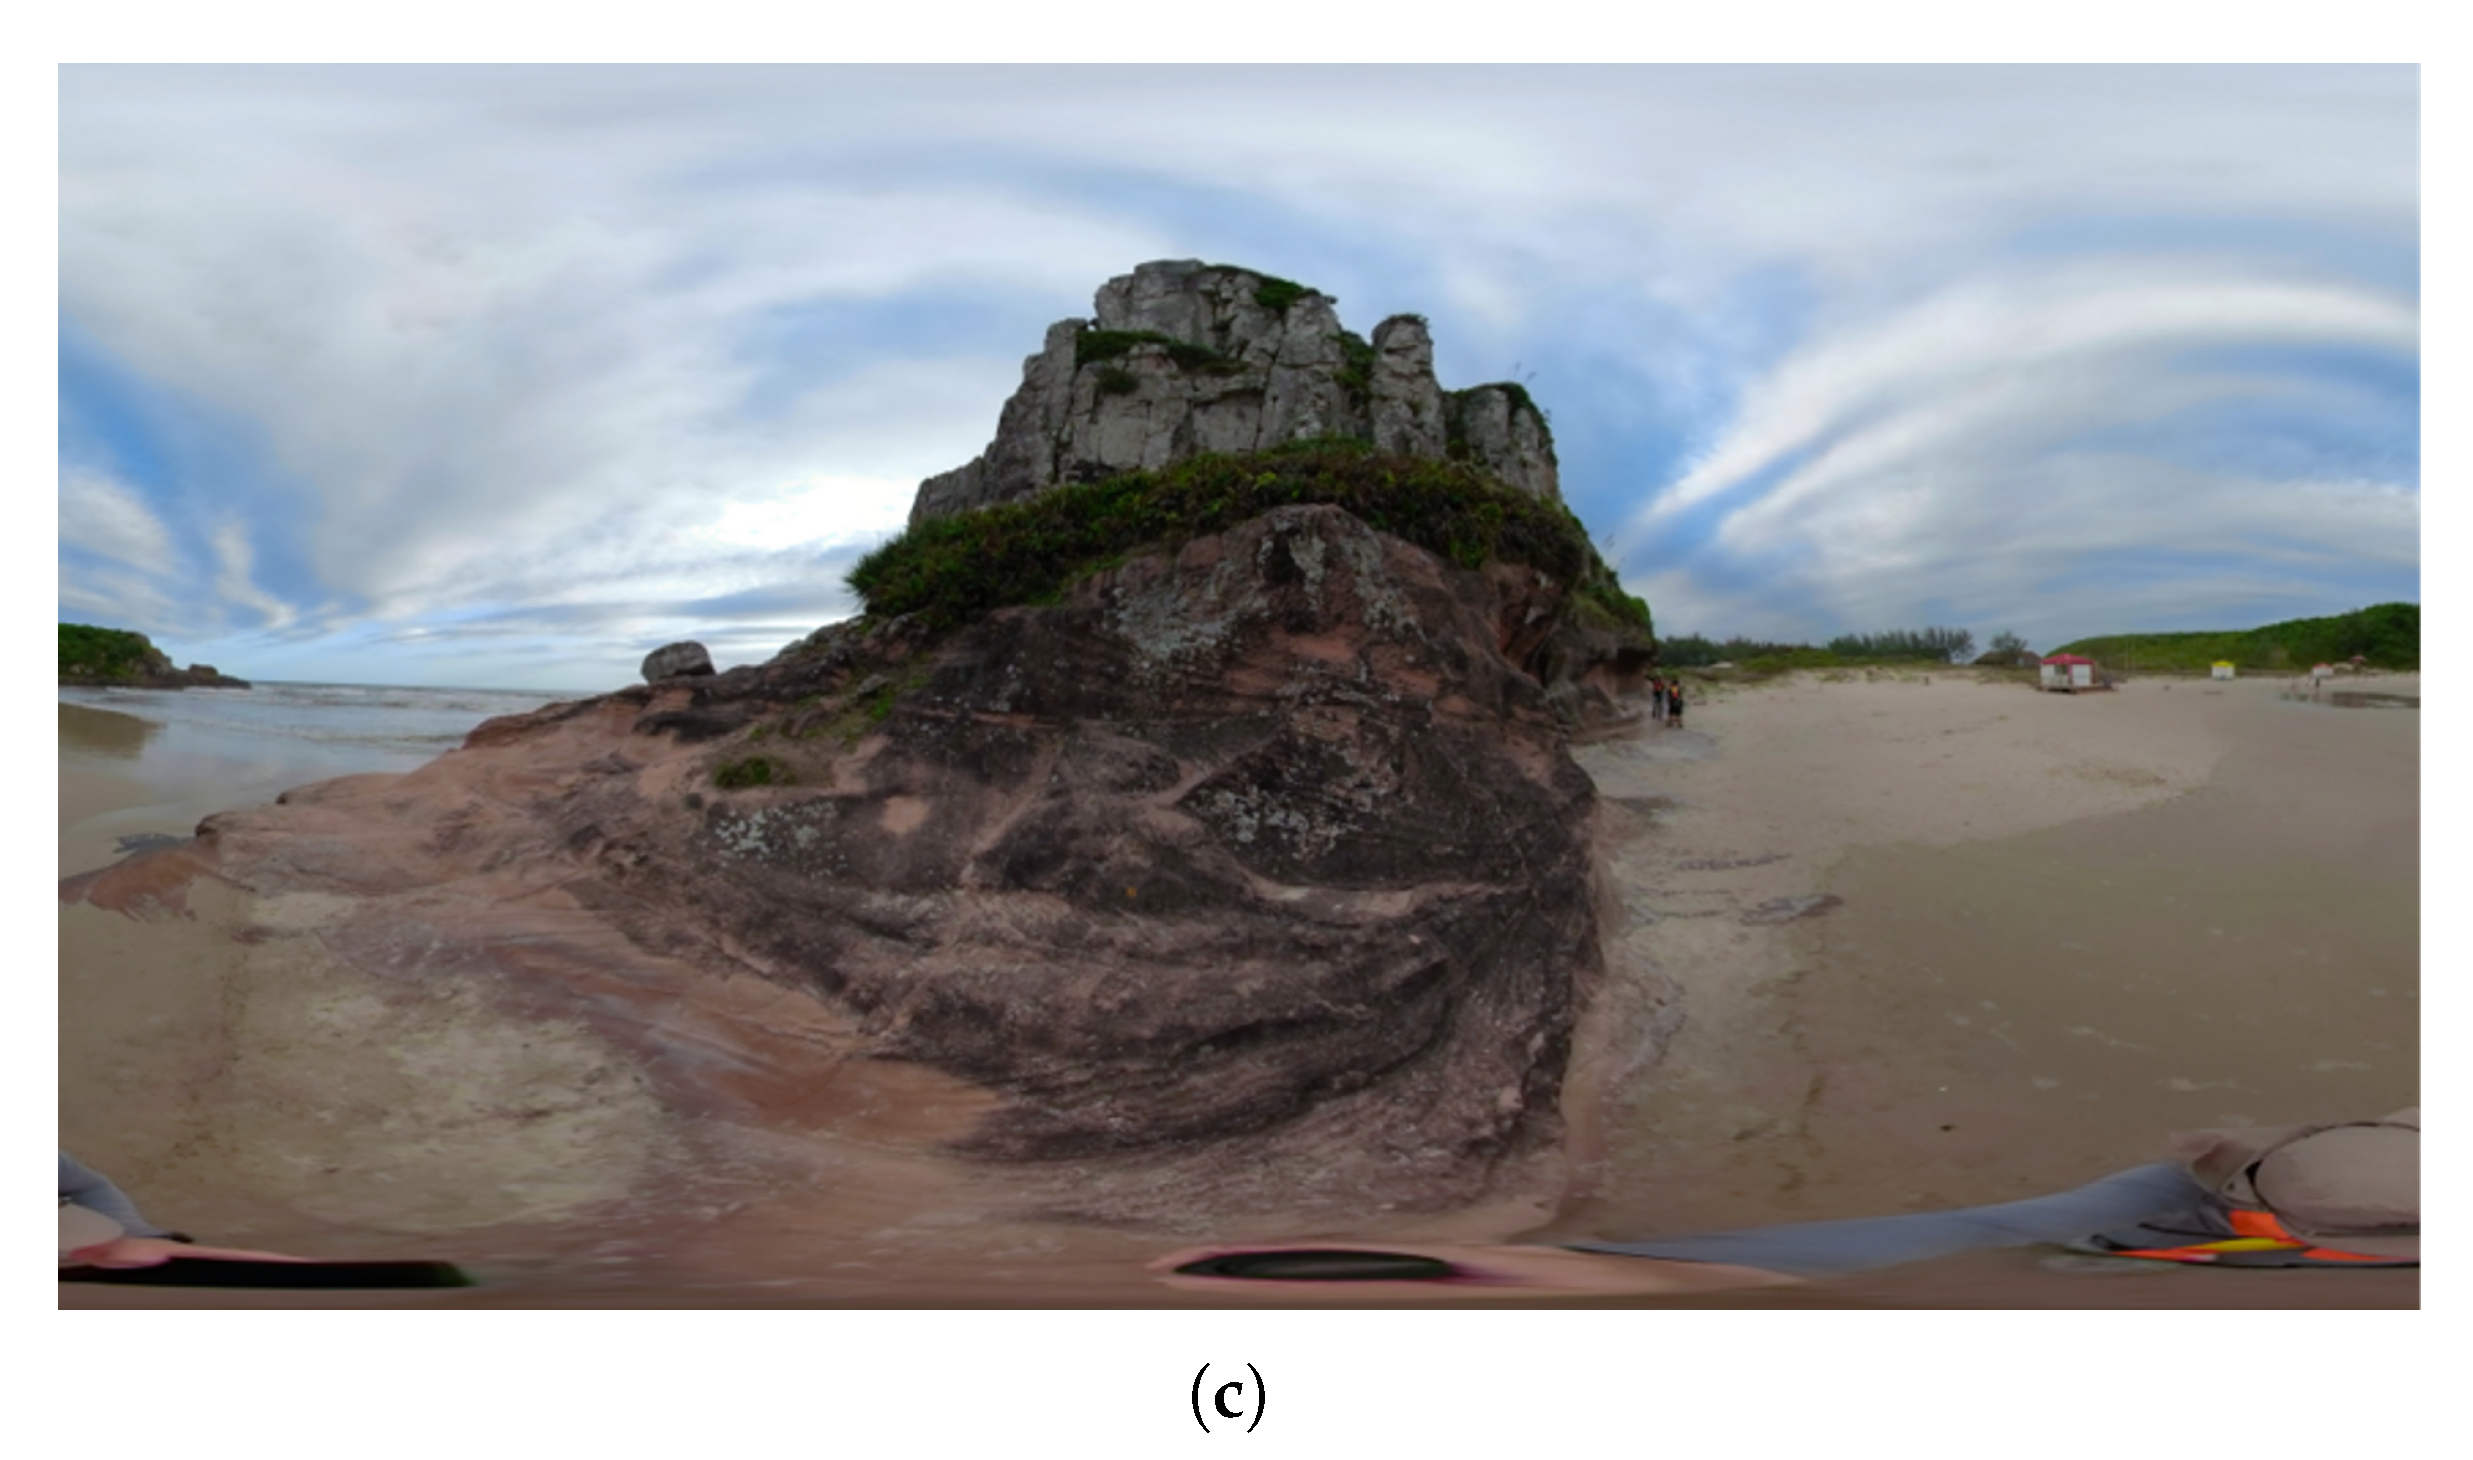
In
Figure 4, examples of perspectives for front and back are showed for the Torre da Guarita outcrop captured by the principal lenses of a GoPro Fusion camera, as well as the equirectangular result by internally merging them. In order to reconstruct a 3D point cloud, the same system is able to systematically capture recursive perspectives to cover all outcrop faces just following a pre-defined pathway.
2.3. UAV Survey
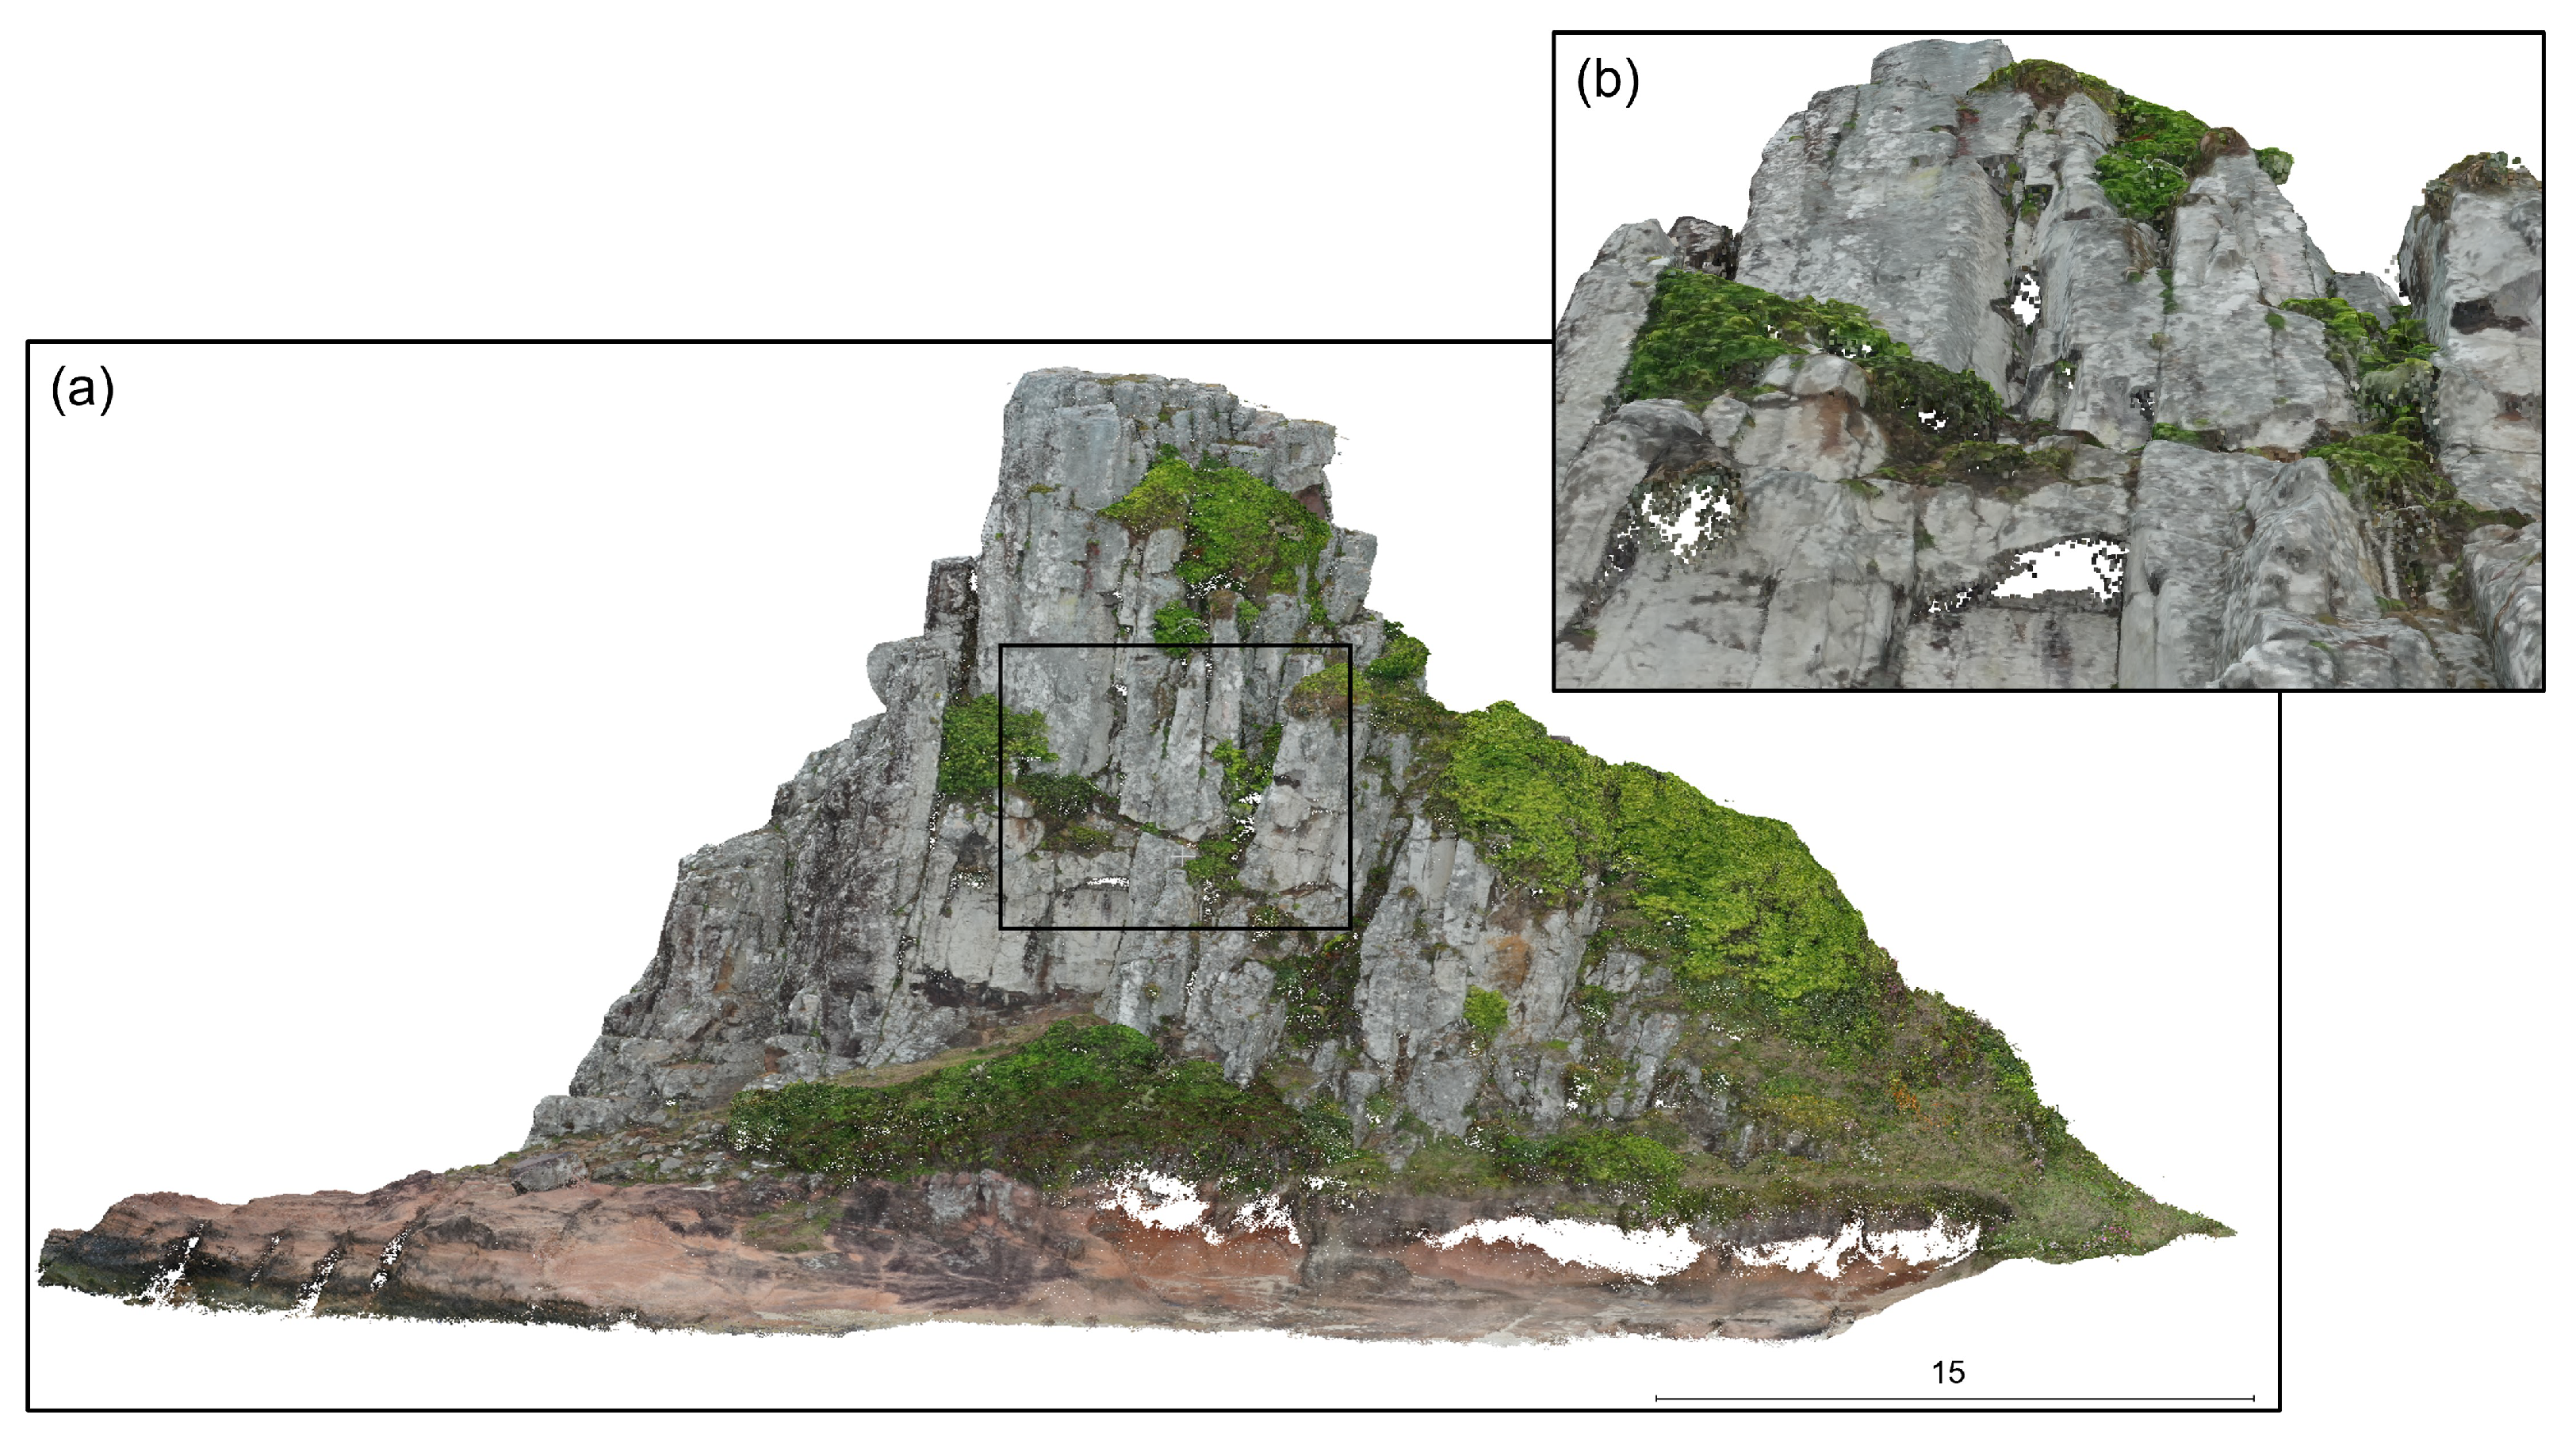
A DJI Mavic 2 Pro UAV was used to perform the aerial image coverage. Given the conical shaped structure of the outcrop, a circular flight around its boundaries of about 5 to 10 m away proved to be sufficient to acquire all the necessary images, resulting in a total of 280 photos, which were later processed in the Agisoft Metashape version 1.6.2 photogrammetric software. This processing resulted in the dense point cloud illustrated in
Figure 5. Although we spent our best efforts to acquire the entire outcrop using the traditional UAV survey, there were many parts not covered due to occlusion caused by subvertical structures (white regions).
2.4. SPI Survey and Processing
The SPI survey was conducted with the GoPro camera presented in
Figure 3. The sensor embedded in the camera is a CMOS 1/2.3
with a nominal focal length of 3 mm and a pixel resolution of 9.3 Mp. The product delivered after both captured images are stitched together is an equirectangular image of 16.6 Mp, approximately.
The camera was manually held above the operator’s head at a height of about 2.6 m from the ground, which was the result of the operator standing with its arm fully extended upwards (2.1 m) plus the extendable grip of 0.5 m that comes with the equipment (also fully extended). While capturing the images, the camera was positioned in such a way that its optical axis was perpendicular to the outcrop. The GoPro mobile application fully controls the camera via wireless connection while streaming the field of view to an external monitor. Thus, no specific planning was needed excepting the walking path along the object, where the images were arbitrarily collected approximately 1 m away from each other.
A total of 18 fisheye pairs were captured. All the acquisition process took less than 10 min from initializing the camera to capturing the last photo. The post-processing phase, which included stitching both fisheye images to generate the equirectangular output, was performed in laboratory with the software GoPro Studio.
The processing of the equirectangular collection using Agisoft Metashape software was performed by selecting the spherical camera model in the Camera Calibration settings. The camera models provided by the software were algorithms designed for different types of cameras that are responsible for transforming the point coordinates of the camera’s projection into the image’s pixel coordinate and vice versa, allowing the estimation of the camera’s position for 3D geometry reconstruction.
2.5. Point Cloud Adjustment and Quality Assessment
As usual, unwanted noise from both SPI and UAV raw point clouds is frequent and has to be eliminated. The Statistical Outlier Removal (SOR) tool of the software was applied to eliminate outliers that could bias the statistical analyses. This tool calculates the average distance of a point to its k-neighbors. Then, points that are not included in the average plus a value of standard deviation (defined by the user) are removed from the point cloud.
After this mandatory step, the next action is intended to geometrically integrate both sets of points for further analysis. This process was performed using the software’s registration tool by picking homologous features (matching points) between UAV and SPI point clouds. We assumed that, where the UAV survey could properly acquire data, the point cloud was adequately generated. Thus, this data were used for quality assessment in areas also covered by SPI imaging (overlapping).
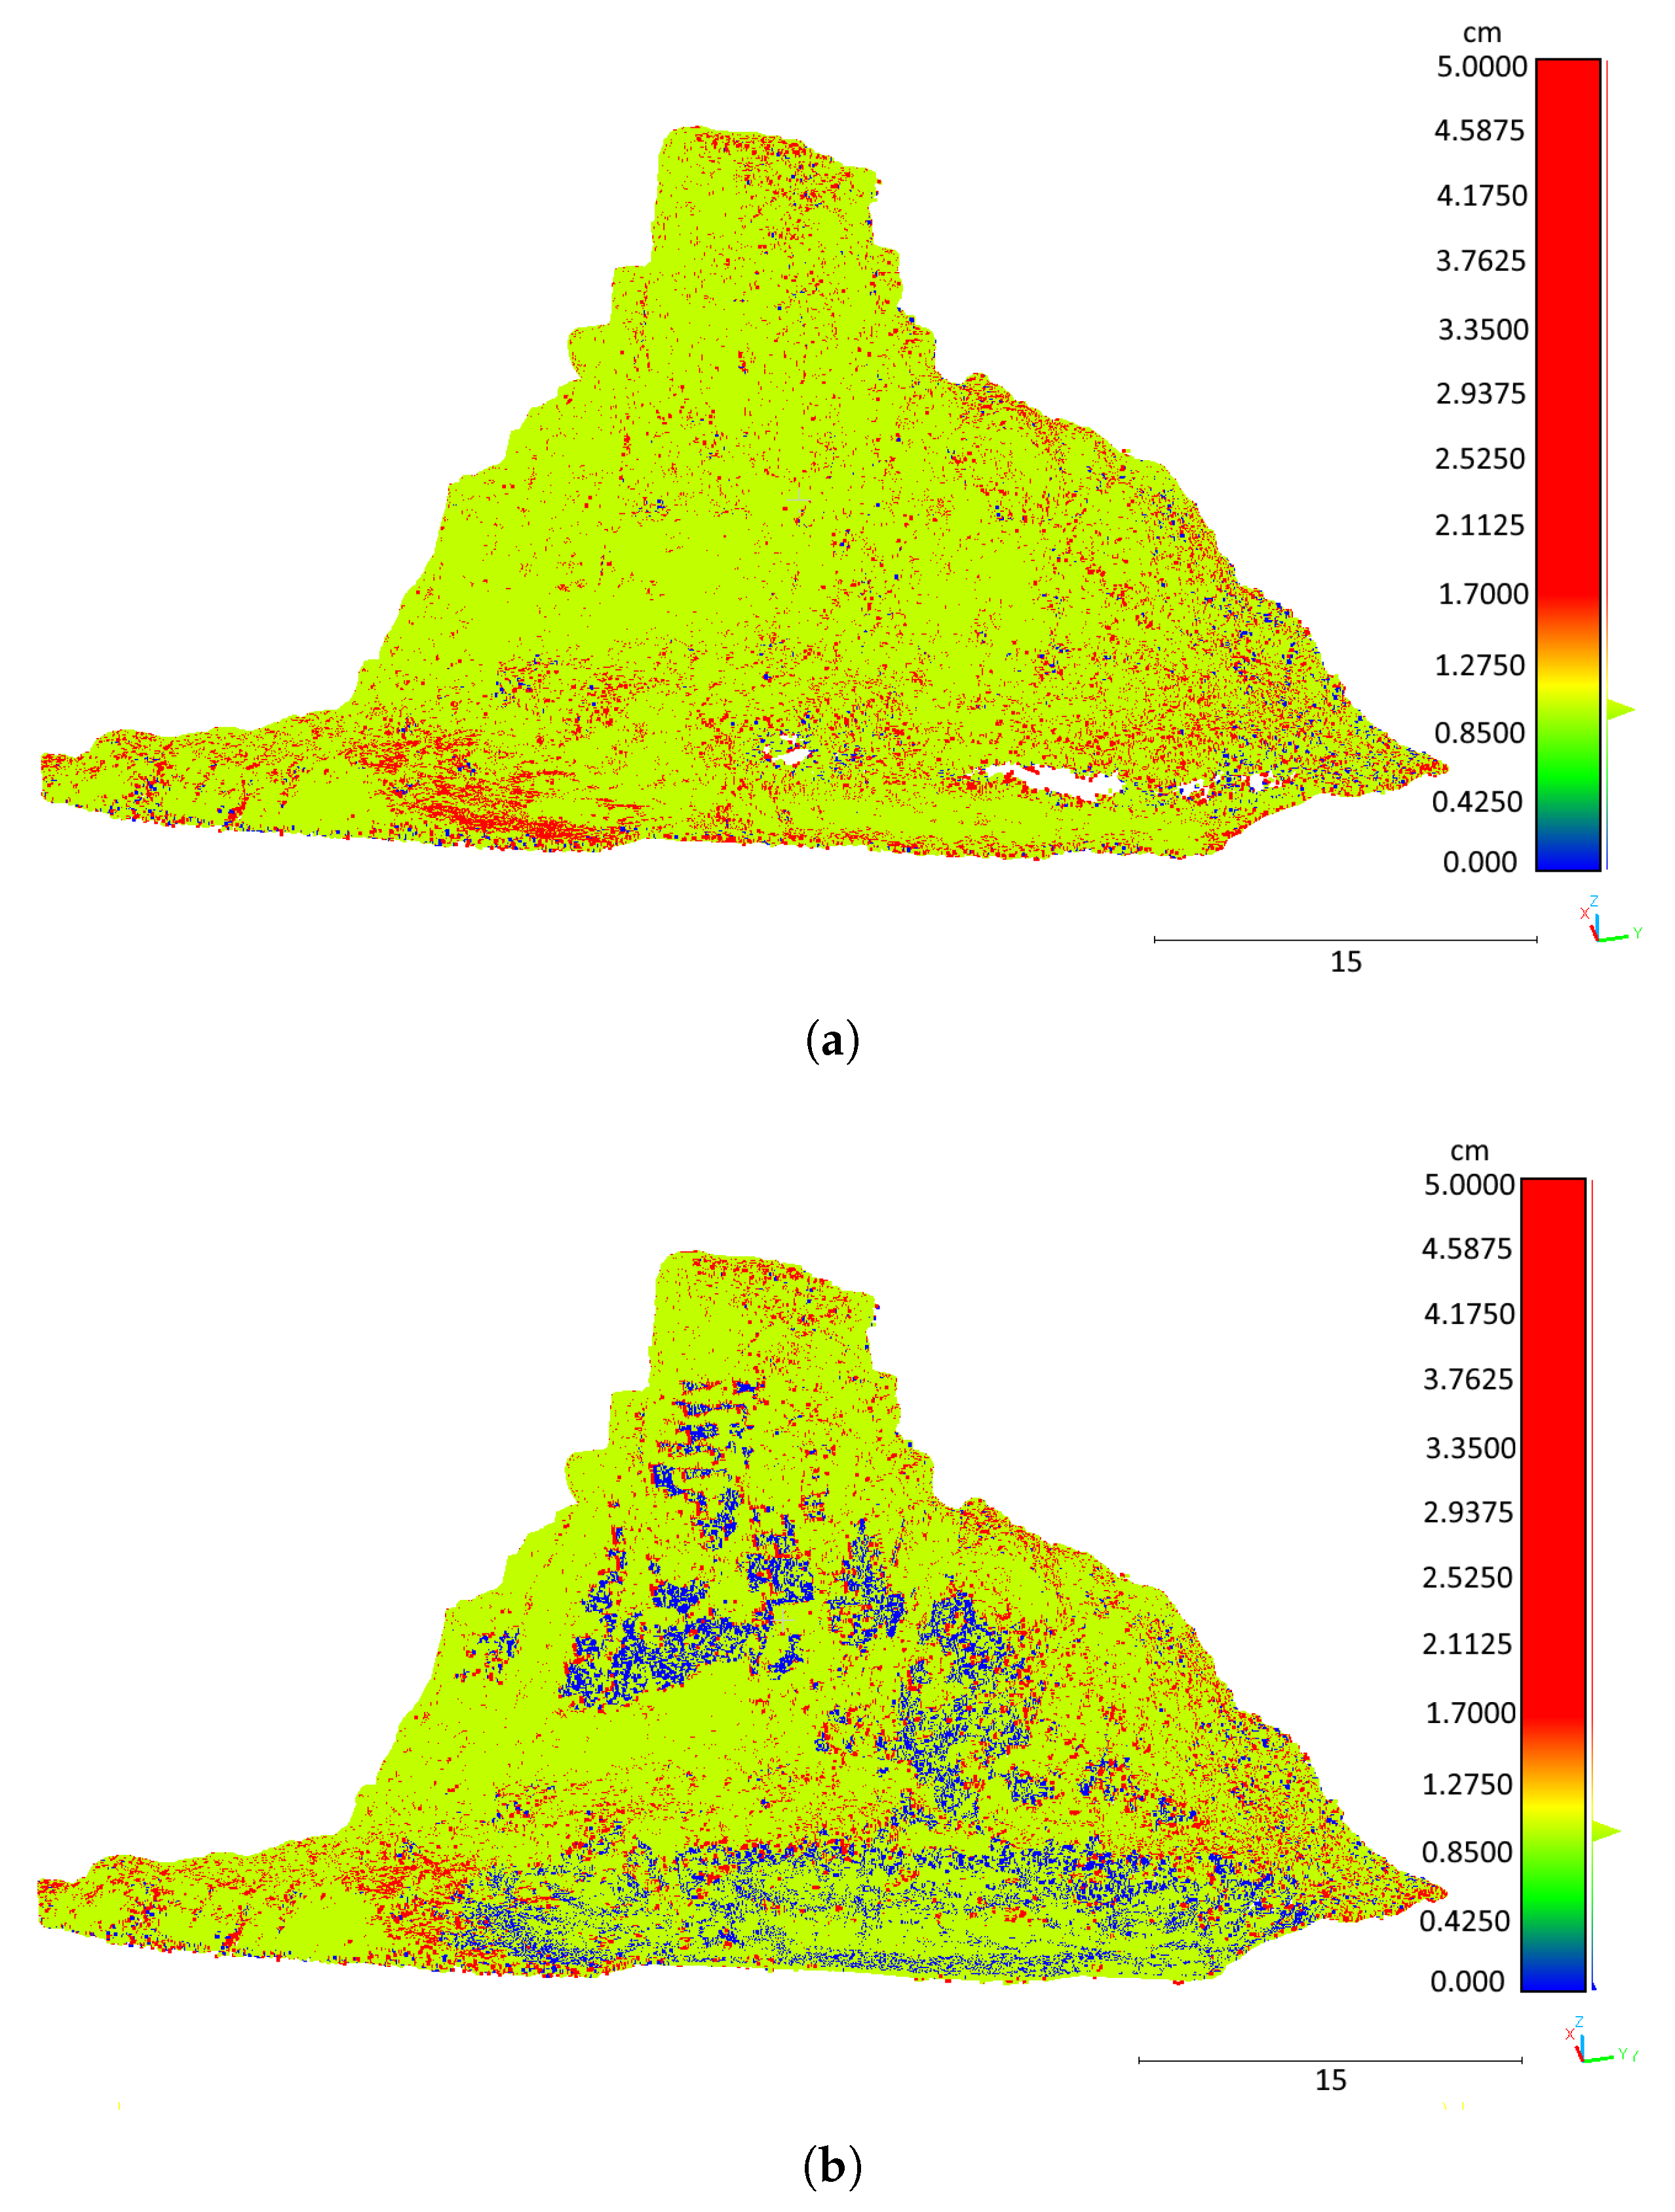
With SPI and UAV-derived DOMs geometrically aligned, the Cloud-to-Mesh (C2M) tool in CloudCompare v.2.10 software is used to compute the absolute distance (i.e., Euclidean distance) between every single point of the SPI point cloud and the UAV mesh surface. To allow a visualization of the results calculated by this tool, a scalar field (SF) is generated and can be applied over the point cloud. The SF is a type of value representation based on a color gradient which, in this case, express the calculated distance by C2M for every point of the point cloud.
To improve reliability, a robust statistical analysis [
25] was conducted to better interpret the discrepancy values calculated for each point of the generated point clouds against the UAV reference mesh, after running C2M algorithm. This method detects outliers and takes into account the skewness of the data, which are weakly symmetrical and far from ideal when working with real world scenarios. Moreover, the asymmetry of a univariate continuous distribution such as the point clouds in outcrops is strongly affected by the presence of one or more outliers. The formula is based on the standard boxplot [
26] but weighted by using the Medcouple (
MC) index, which measures the skewness of the observations.
MC index is calculated by the following equation:
where
and
are members of a univariate sample
of size
N from a continuous unimodal distribution, and
stands for the sample
median. When the
MC index returns a positive value, it means that observations are skewed to the right; when zero, it means that observations are purely symmetrical; and negative results inducate that observations are skewed to the left. The MC was then applied to the interquartile range (IQR) outlier detection method according to the following equations, for both
MC > 0 (Equation (
2)) and
MC < 0 (Equation (
3)) case scenarios:
The IQR corresponds to the range between the left () and right () quartiles (50% of the data around the median). After both left and right quartiles are calculated, every observation that falls outside these intervals is considered an outlier. In this case, the values of distance calculated by C2M are absolute values.
After removing the outliers, the model’s discrepancy evaluation uses the remaining C2M absolute values to obtain the descriptive statistics, such as the mean
(Equation (
4)) and the standard deviation
(Equation (
5)) given by:
where
is each point cloud’s discrepancy from the aligned UAV 3D mesh. Descriptive statistics for free distributions, on the other hand, are based on robust measures, such as the
median, given by:
and the normalized
median deviation (
), given by:
The root mean squared error (
RMSE) is also a common measure of model quality, as presented by some the related works. In the present context, the
RMSE is given by:
The above described measures can be effectively used to detect occasional errors and eliminate them, thereby conforming the SPI point cloud to the same setup found in UAV data.
2.6. Automatic Hybrid Point Cloud Integration Strategy
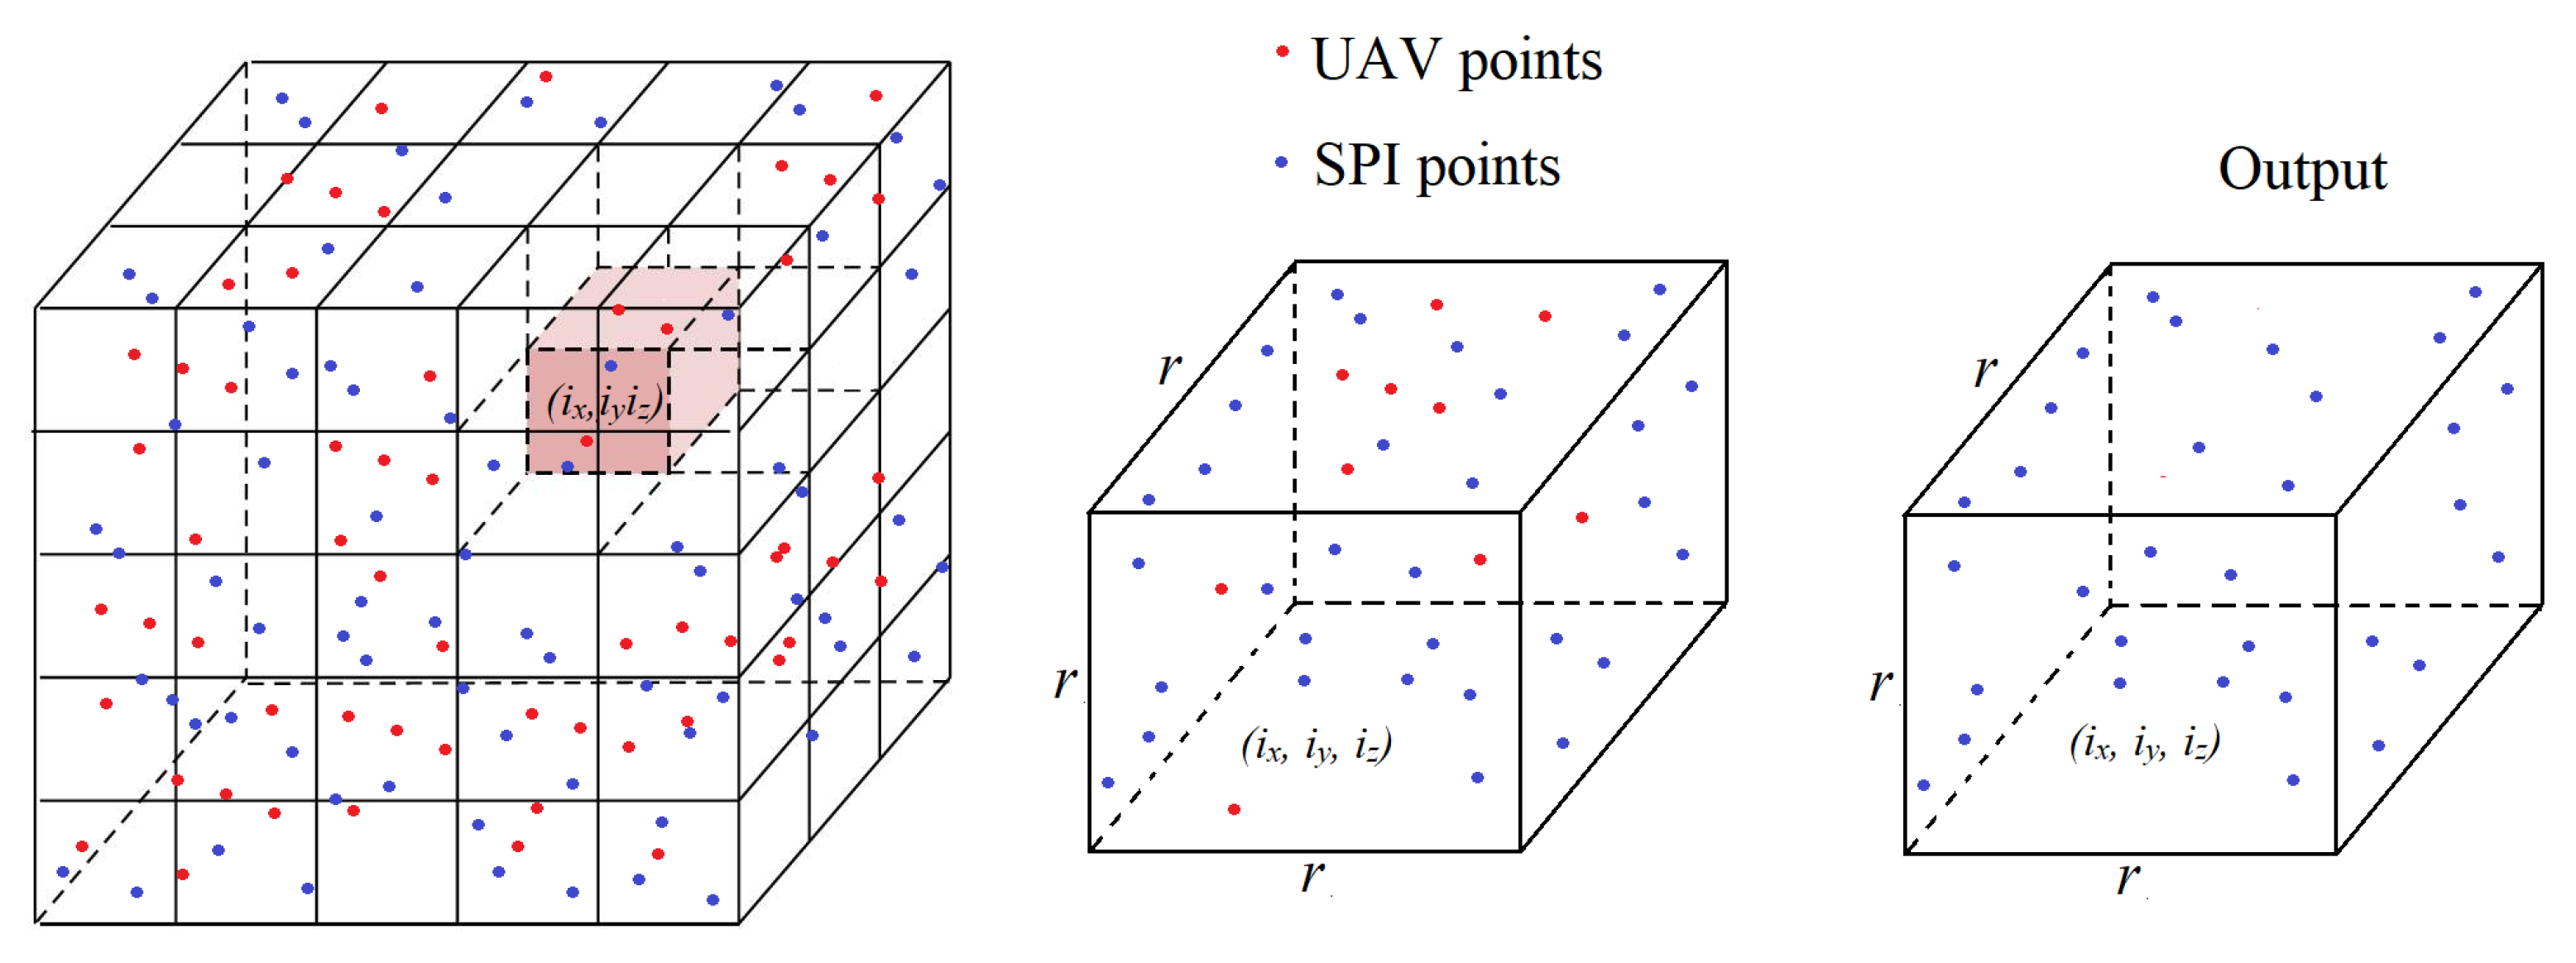
Assuming the quality of the point cloud generated by SPI data is shown to be consistent with the data acquired using UAV photogrametry, the last step of the proposed method can be applied. In our proposition, the final point cloud is composed by a combination of both the SPI and UAV point cloud sources. We suggest the application of an octree approach [
27] to analyze every region of the point cloud in the 3D space. The octree is a tree data structure in which each internal node has exactly eight children. Octrees are the three-dimensional analogs of quadtrees and are most often used to partition a three-dimensional space by recursively subdividing it into eight octants. The blocks within an octree are referred to as volume elements, or voxels. The voxels are small cubes with sides
r that cover all the points of the two clouds (
Figure 6). Each voxel
can be represented in the 3D space in Cartesian coordinates as
where
and
are the spatial coordinates of each voxel
i of length
r. In our analysis, each voxel is checked to determine which source (SPI or UAV) presents most of the points contributing to the cloud. For every
, the set of UAV points
belonging to it can be computed as
where
is the UAV point
in the position
. In an analogous form, the set of SPI points
belonging to
can be expressed as
The winning source will have its points preserved, whereas the other will be eliminated according to the following rule:
where
and
are the numbers of points inside a given
for UAV and SPI, respectively. The rationale behind this voxel-based selective strategy is that, for some parts of the reconstructed outcrop, the SPI will present better observations, which provide higher quality points (mainly for subvertical structures). Conversely, other regions can present the best observations composed by UAV data (mainly by superior parts), which justify the choice for UAV-like points preservation, whereas SPI are eliminated.
The final product will be formed by a set of points resulting from the trade-off between using points from SPI or UAV for each consecutive path of the octree. The resulting set of hybrid points can be used to produce the mesh and the textured model. The Python script of the presented octree methodology is available at GitHub platform (
https://github.com/ademirmarquesjunior/octree_cloud_merge, accessed on 11 July 2022).
To quantitatively assess the results of the integration technique, the distances between each point and its respective neighbors were measured using a kd-tree algorithm [
28]. This algorithm performs a binary subdivision of the point cloud, where leaves are further divided into two nodes until each final node or branch in the tree contains one element. Using the kd-tree algorithm to assess 10 neighbors for each point, we measure the mean distances to evaluate the point cloud densification in both the original UAV/SPI cloud and the optimized UAV/SPI cloud obtained from the octree cloud merging method.
4. Discussion
The fine reconstruction of complex environments such as outcrops is challenging due to the very detailed features and requirements for high fidelity outputs. It is well-known that geoscientists are drawing attention to trustworthy solutions concerning remote visualization and interpretation of the environment through digital media. The effectiveness of the reconstructed model relies on the ability of the methodology to provide a reliable environment that is able to represent as much as possible the real characteristics and sensations experimented by the analyst in a real survey. Being able to rely on effective and rapid methodologies to achieve this goal is essential to make available a large number and a great diversity of existing outcrops to analyze wherever and whenever.
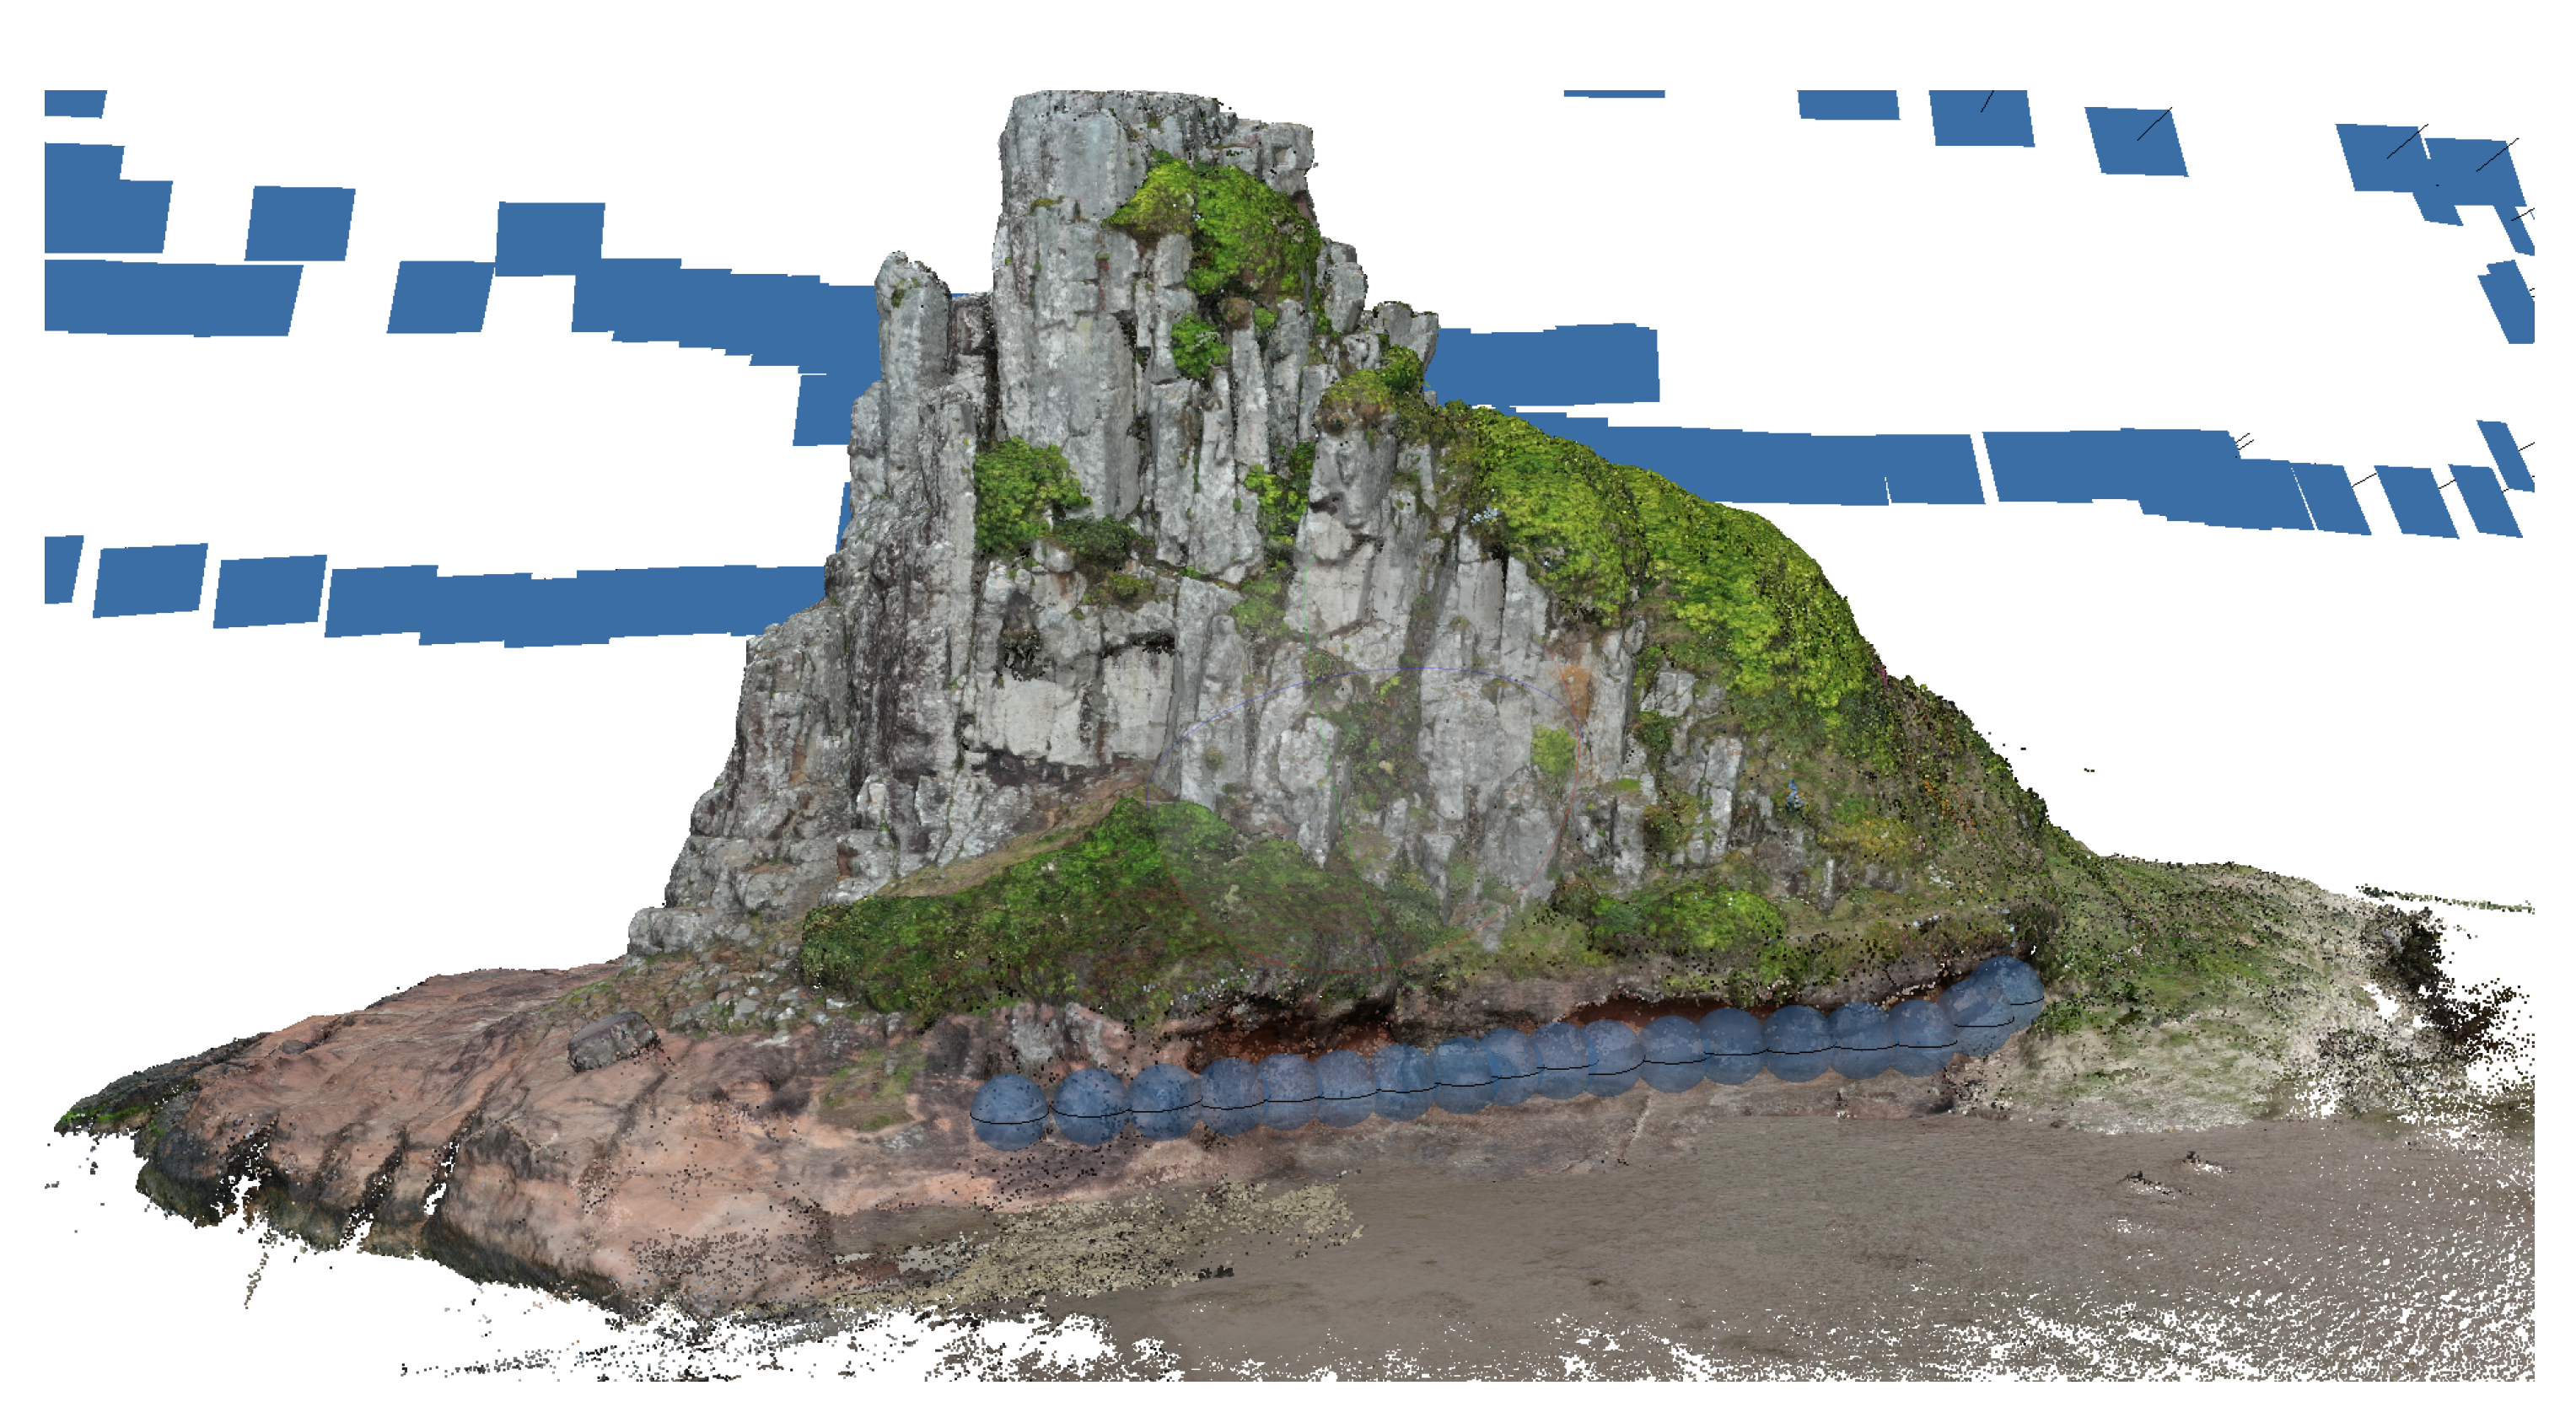
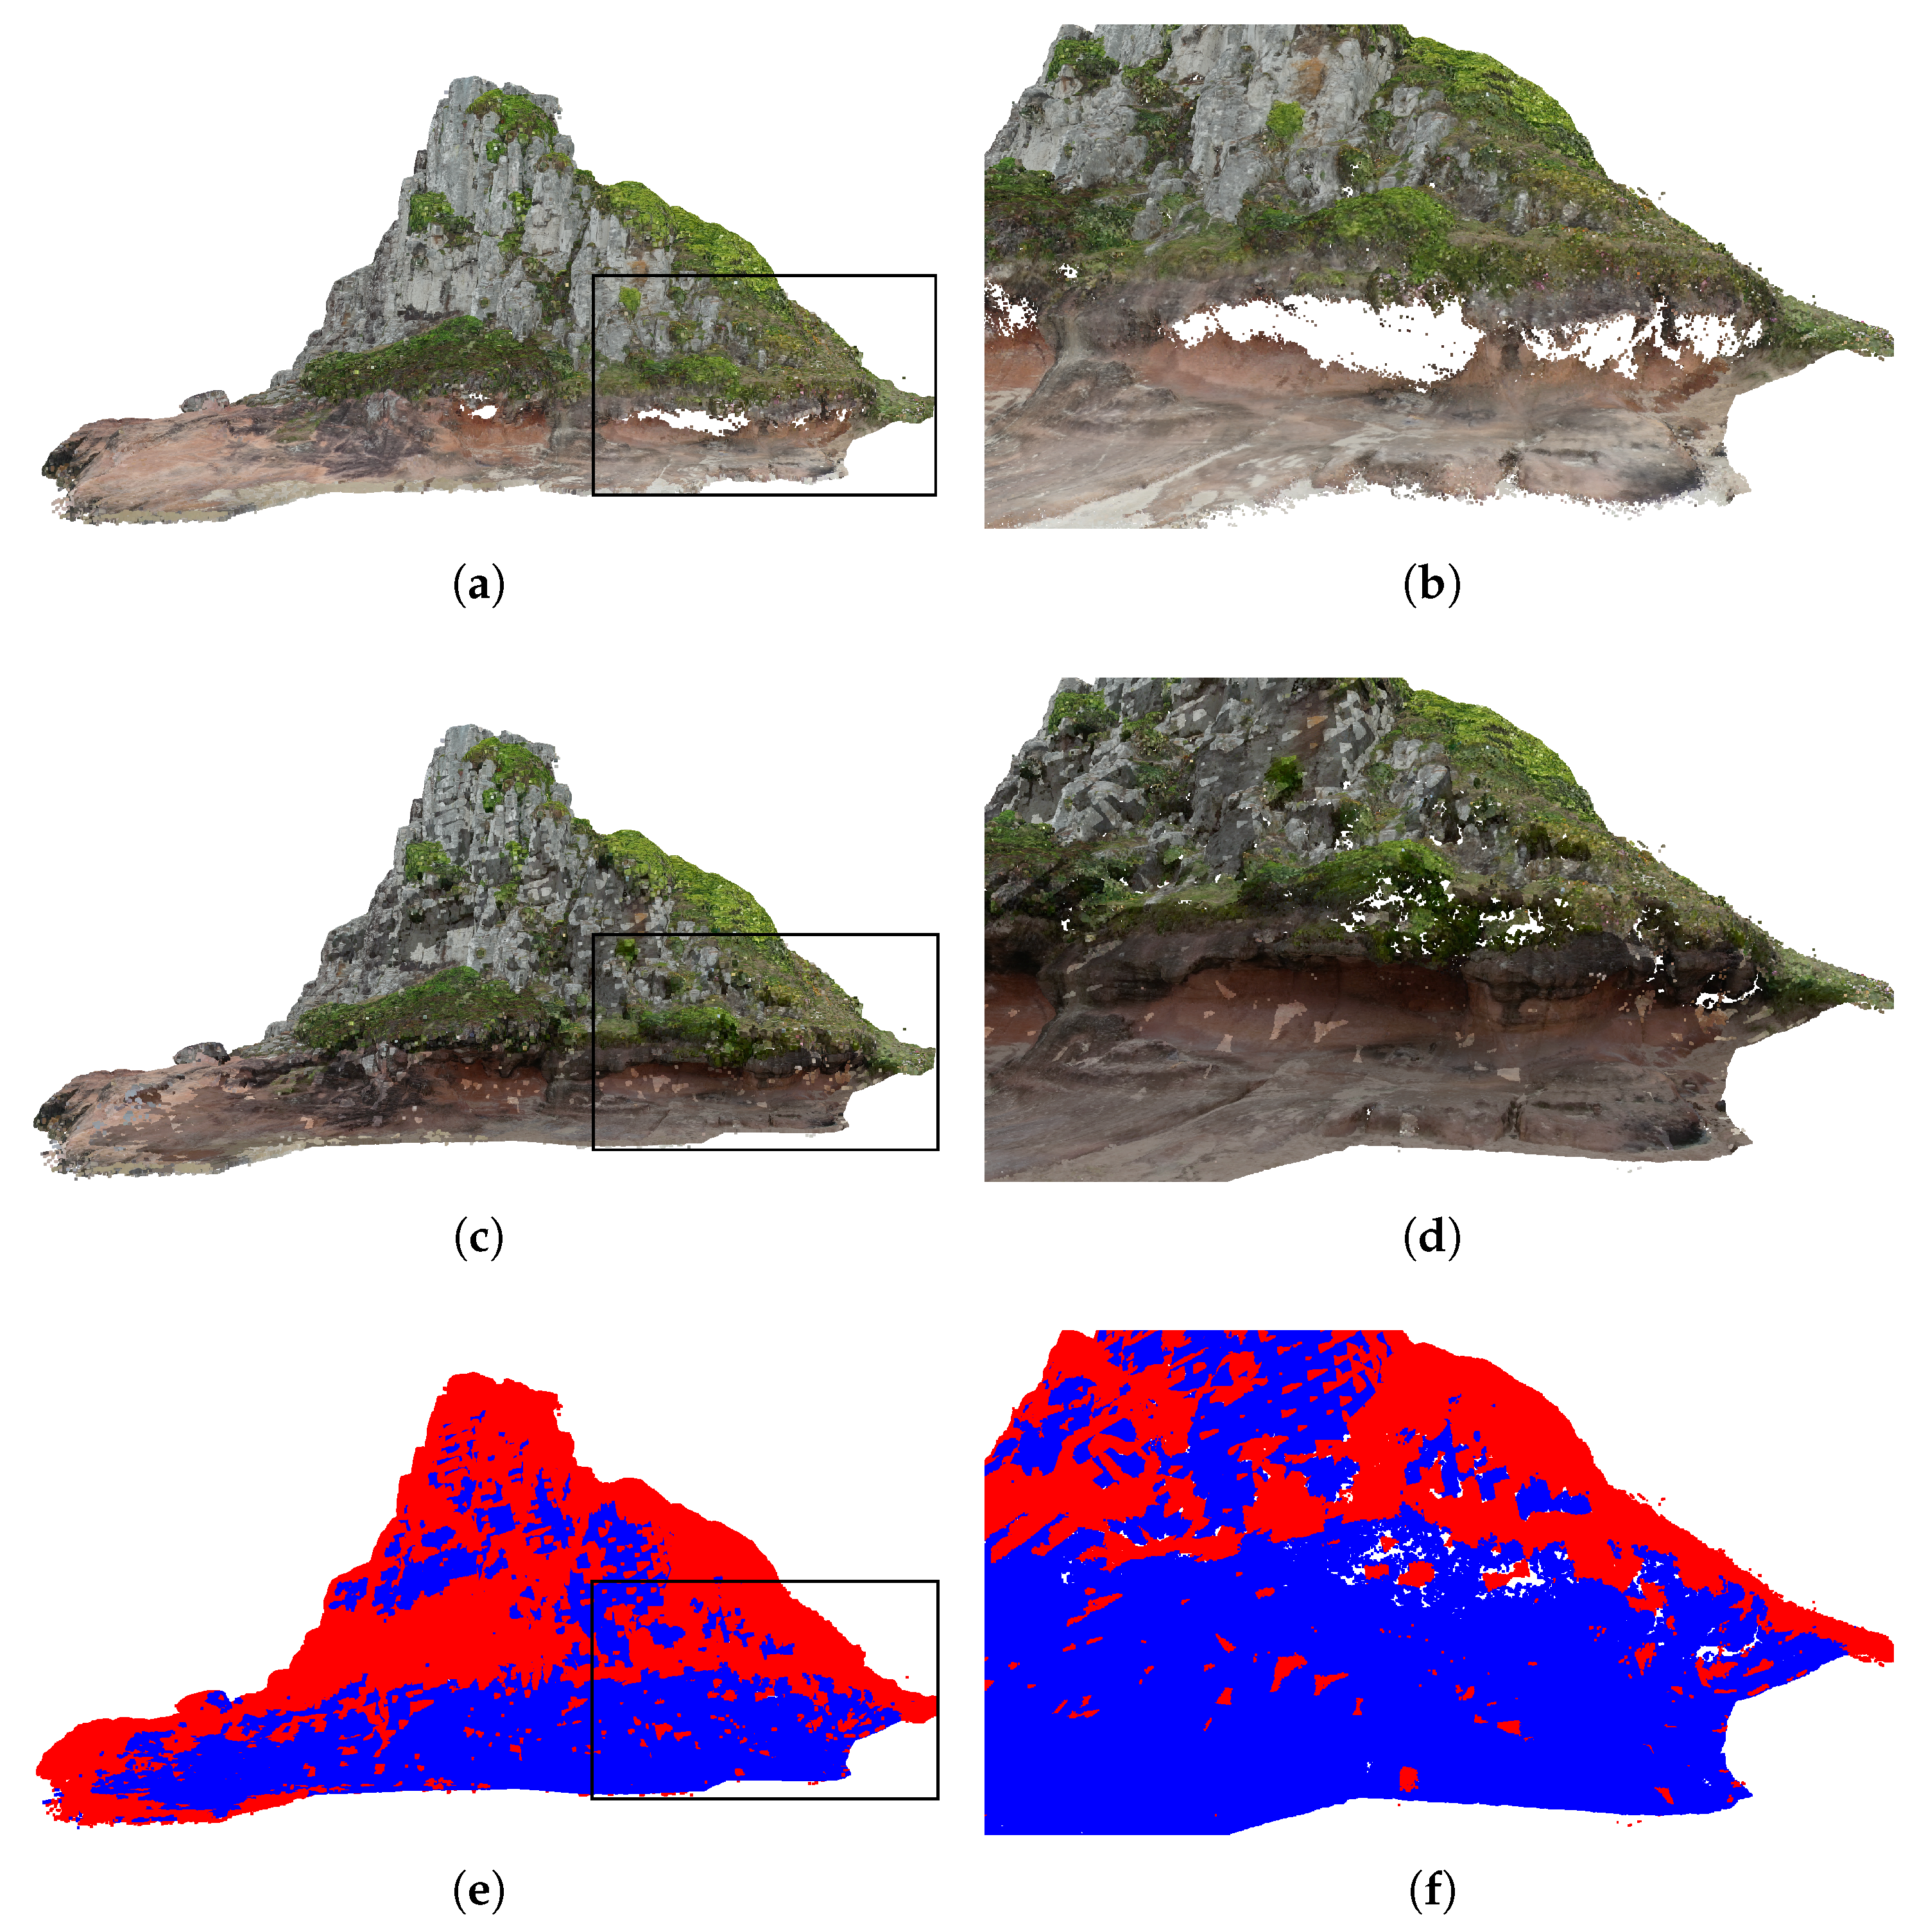
The approach proposed in this work improves the prior ability to visualize any portion of outcrops, allowing an adequate reconstruction by 3D models. This is accomplished by adding another systematic view of a scene previously only viewed from an aerial (UAV) perspective: SPI imaging. The controlled experiment performed here, including pre-processing for adequacy of the SPI, could guarantee the effectiveness of the integration approach and the establishment of the proper procedure necessary to generate the model. Due to the severe spatial limitation of the unmanned platform, many parts of the studied outcrop remained uncovered by the survey. After including the SPI data in a controlled way, as described here, the original point cloud was densified, and the final product resulted in a most confident representation of the real environment. At the same time, it is important to stress that SPIs by itself would not be able to be used alone, since features located at high positions could not be visualized, as shown by
Figure 7b.
Even though terrestrial photogrammetry is not a novel approach for the generation of DOMs, one of the contributions of this work is the use of an omnidirectional camera, such as the GoPro Fusion. This type of camera can be helpful in terrestrial photogrammetry projects by covering a full spherical field of view from the point where the image is captured. This feature is important because it can provide the overlap between photos required by digital photogrammetry in a more practical way and with fewer photos, when compared to traditional frame cameras, which can help improve considerably both survey time and complexity.
Besides that, another contribution of this paper was the development of a weighted densecloud merging Python script that can integrate a pair of aligned pointclouds, made available for free to the community. Open-source tools can help popularize the photogrammetry technique and assist researchers in their most varied research areas.


 ,
, 
