
Machine Learning Approaches to Automatically Detect Glacier Snow Lines on Multi-Spectral Satellite Images
by
 , and
, and
Colin Prieur
1,2,*, 
Antoine Rabatel
3,
Jean-Baptiste Thomas
1, 
Ivar Farup
1 and
and
Jocelyn Chanussot
4 1
Department of Computer Science, Norwegian University of Science and Technology (NTNU), Teknologivegen 22, 2815 Gjøvik, Norway
2
Data Science Experts (DSE), 19 Rue des Bergers, F-38000 Grenoble, France
3
Univ. Grenoble Alpes, CNRS, IRD, Grenoble-INP, IRD, Institut des Géosciences de l’Environnement (IGE, UMR 5001), F-38000 Grenoble, France
4
(Grenoble Images Parole Signal Automatique) GIPSA-Lab, Grenoble INP, CNRS, University Grenoble Alpes, F-38000 Grenoble, France
*
Author to whom correspondence should be addressed.
Remote Sens. 2022, 14(16), 3868; https://doi.org/10.3390/rs14163868
Submission received: 21 April 2022
/
Revised: 5 June 2022
/
Accepted: 19 July 2022
/
Published: 9 August 2022
(This article belongs to the Special Issue Applications of Remote Sensing in Glaciology)
Abstract
:Documenting the inter-annual variability and the long-term trend of the glacier snow line altitude is highly relevant to document the evolution of glacier mass changes. Automatically identifying the snow line on glaciers is challenging; recent developments in machine learning approaches show promise to tackle this issue. This manuscript presents a proof of concept of machine learning approaches applied to multi-spectral images to detect the snow line and quantify its average altitude. The tested approaches include the combination of different image processing and classification methods, and takes into account cast shadows. The efficiency of these approaches is evaluated on mountain glaciers in the European Alps by comparing the results with manually annotated data. Solutions provided by the different approaches are robust when compared to the ground truth’s snow lines, with a Pearson’s correlation ranging from 79% to 96% depending on the method. However, the tested approaches may fail when snow lines are not continuous or exhibit a strong change of elevation. The major advantage over the state of the art is that the proposed approach does not require one calibration per glacier.
1. Introduction
As iconic sentinels of climate change, monitoring the evolution of glaciers is highly relevant and timely. In mountain regions, they constitute strategic water resources, and their evolution can profoundly influence the behavior of natural ecosystems and anthropogenic activities [1]. Several methods can be employed to address the glaciers’ evolution, with the glacier mass changes being one of the most relevant variables and listed as an essential climate variable by the Global Climate Observing System (https://gcos.wmo.int/en/essential-climate-variables (accessed on 3 March 2021)).
Several methods are commonly used to assess the mass balance of a glacier, from in situ measurements [2,3] to remote sensing approaches, such as the gravimetric method [4,5], the altimetric methods [6,7], the surface area variation method [8] or the regional snow cover (SC) mapping method [9,10].
Another approach to estimate the mass balance of a glacier is to use the altitude of its equilibrium line, meaning the line between its accumulation area (usually covered by snow) and its ablation area (where the glacier ice directly appears) as a proxy for the mass balance of a glacier [11,12,13]. However, the limit between the accumulation and the ablation areas can sometime be difficult to detect on remote sensing data with, for example, the presence of super-imposed ice within the ablation area [14]. Such phenomena do not appear on temperate Alpine glaciers. Therefore, at the end of the ablation period, it is possible to consider the uppermost position reached by the snow line of the glaciers as an accurate proxy of the equilibrium line [15].
With the increasing number of satellite acquisitions and free access to the data, the monitoring of individual glaciers becomes feasible at the glacier-to-massif scale. For instance, refs. [16,17,18] were able to detect glaciers snow lines from satellite images for up to few hundreds of glaciers, which could then give the possibility to deepen our understanding about the glacier dynamics and the relations to their environment at the catchment to mountain range scale. Although promising, such methods show limitations in their regional-to-global scale application due to, for example, manual steps that still need to be applied or the use of thresholds requiring some a priori knowledge.
Thus, we propose a proof-of-concept that takes into account multi-spectral satellite images (Landsat data in the present case study) paired with standard machine learning algorithms to ensure a supervised classification between ice and snow. Then, with the joint use of the Copernicus digital model (EU-DEM v1.1) at a 30-meter resolution [19], we apply some post-processing operations based on the processed classification map to effectively retrieve the snow line [17,18]. Our results are evaluated compared to manually annotated data.
In Section 2, we present the available data to support our study. In Section 3, we describe the different methods to construct our data set, produce the ice and snow classification map and finally estimate the potential snow line on a glacier. Section 4 presents the performance of the methods. Finally, Section 5 and Section 6 summarize the main findings and gives some perspective for the future developments of our algorithm.
2. Data
2.1. Study Area
Our approach was tested on glaciers located on the eastern side of the Zermatt valley in the massif of Mont Rose, Switzerland (Figure 1). The considered glacierized area covers 166 km and contains 118 glaciers, annotated from the 2015 Sentinel-2 images [20]. Among these 118 glaciers, 31 glaciers have an uppermost elevation above 4000 m above sea level (a.s.l.), 45 glaciers have a mean elevation above 3500 m a.s.l. and the maximum elevation of this area is 4635 m a.s.l., so we can assure that there is a snow line within this area at the end of summer [20].
2.2. Optical Imagery: Landsat 8 Products
Landsat images at a L1TP level of processing converted to radiometric values represent a good balance between spatial and radiometric resolutions. The Landsat program has a long history spanning close to 60 years. Such properties make Landsat products a good choice for glacier monitoring.
Indeed, fine radiometric and spatial resolutions are required for the snow line detection [16,17], a good temporal coverage, which means a data set extended in time (the Landsat 8 data set begins in 2013), as well as a short revisit period, which means a high frequency of acquisitions (16 to 8 days between each acquisition) are necessary to provide extended and frequent results along a large period of time. This allows researchers to deepen their understanding on glacier dynamics while making the snow line detection algorithm more robust to the potential cloud cover that may prevent the study of areas of interest.
The Landsat 8 satellite has two different embedded imaging sensors: the Operational Land Imager (OLI), an optical imager providing all the optical bands (1st to 9th) of the Landsat 8 product, and the Thermal InfraRed Sensor (TIRS), a thermal imager providing the 10th and 11th bands of the Landsat 8 product (Table 1).
Landsat 8 L1TP products of the collection 1 of the Alps from 2014 to 2020 were used for this study, each pixel digital number value was converted into radiometric value.
2.3. Digital Elevation Model
A digital elevation model (DEM) gives crucial information about the altitude of the study area. Here, a DEM was used to post-process the classification result in order to initialize a potential snow line considering different equipotential within each glacier [17]. This method for snow line altitude (SLA) detection was also implemented in [16].
It remains important to consider that global DEMs have significant inaccuracy in high slopes. So far, the latest Copernicus DEM that we used [19] suffers from a mean accuracy of at least 6 m as an absolute vertical error on slopes higher than 20%, compared to the ICEsat data [22,23]. The average slope of our study area is 28.7% [20], meaning that we can assume that the DEM used has an accuracy of 6 m as an absolute vertical error compared to the ICESat sensor derived elevation products used as a proxy of an actual ground truth [22,23]. From a DEM image perspective, this accuracy is at the pixel value, so it can also be considered a form of noise within the image, with the properties described in [22].
3. Method
Figure 2 illustrates the overall workflow developed for this study.
The snow line detection algorithm operates within different scales. A dark box represents a product operation, meaning that this operation takes into account an entire Landsat 8 product. A red box only takes into account a clipped Landsat 8 product with regard to a study area shape file, designating a mountainous area. A blue box represents an operation at the glacier scale, meaning it takes only into account an area flagged by the rasterized glacier inventory, which is an image mapping the glaciers of the study area with a flag equals to the glaciers’ number in the 2015 glacier inventory [20]. For each glacier of the study area, the algorithm ensures a successive binary classification of the area to discard the shadowed area (shadow extraction) of a glacier and the remnants of ice or snow uncovered pixels (glacier extraction) to finally provide an ice and snow mapping of the glacier, which can be a binary map or a probability map depending on the method used for the extraction. Given that ice- and snow-covered areas without clouds can be found on a glacier, our workflow proposes two methods to detect the snow line on the glacier otherwise the processing of the glacier is discarded. A gradient computing of the ice- and snow-cover maps, followed by gradient’s outlier correction, given their elevation value with a multi-Otsu thresholding and an elevation bin decomposition of the glacier to detect the most probable snow line [17] followed by a polynomial interpolation of its results to be used as the initialization of an active contours approach to fit the snow line to the ice and snow cover map.
3.1. Overview
The developed algorithm works in two steps:
- A pixel-wise classification workflow, designated as extraction in the flowchart, which provides a binary or probability map of ice and snow cover on a glacier.
- A snow line detection workflow, which uses the result of the classification workflow and the Copernicus’ DEM to provide an estimated snow line on each glacier.
Our architecture proposes a “pixel-wise” approach for the land-cover mapping, opposed to more complex object classification, refs. [16,17,24]; this approach is based on the hypothesis that it is possible to cluster directly ice and snow pixels given their bottom of atmosphere radiance.
Figure 3 shows that the information contained in the different spectral bands of Landsat 8 can be used to characterize the spectral signature of snow and ice in the radiometric scope of the OLI sensor. This is a strong incentive to support a pixel-wise approach.
3.2. Data Set
3.2.1. Snow Line Annotation
A data set of the end-of-summer snow line was performed on several glaciers in the Western European Alps [10,25]. However, it was not referring to a single date but to several Landsat 8 scenes from 2014 depending on where the cloud conditions were optimal for manual annotation, and thus its use as ground truth was limited.
Therefore, a new manual snow line annotation was carried out for the current study from a Landsat 8 product recorded on 3 September 2019. A shape file containing the snow line of each glacier of the study region was generated and used as ground truth.
3.2.2. Glacier Inventory
The glacier inventory is a shape file of the 2015 outlines of the glaciers in the European Alps with information concerning their location, surface area, elevation and slopes, and identification number [20]. We then converted this shape file as a georeferenced image, mapping all the glaciers within a study area flagged with their identification number.
With this information, each glacier was processed one by one in the workflow, allowing the implementation of more precise methods for the snow line detection.
3.2.3. Data Set Construction
In addition to the snow line annotation, labeled data are required to train and assess the reliability of our pixel classification methods. We constructed different balanced data sets containing annotated Landsat 8 pixels, Table 2.
- One data set with pixels with the label “mountain’s shadow” or the label “illuminated areas”, used in the mountain’s shadow extraction task.
- One data set with pixels with the label “ice or snow” or the label “foreground areas”, which corresponds to the mountainous areas within the glacier outlines of 2015 [20] that are not covered by ice or snow anymore at the time of acquisition. This data set is used in the glacier extraction task.
- One data set with pixels with the label “ice” or the label “snow", used in the ice and snow extraction task.
All the pixels of those balanced data sets were acquired from a GIS study over several Landsat 8 images (Table 3).
As shown on Figure 4, hand-labeled shape files were then annotated corresponding to areas of a designated label (ice, snow, shadowed areas, and foreground). Pixels resulting from the clipping of those shape files were then stored with their label within a .csv file.
3.3. Pre-Processing
3.3.1. Cloud Cover Estimation
The level 1 Landsat 8 product provides a quality assessment band, which is the result of the Fmask version 3.3 algorithm implemented in C (CFmask) on the optical and thermal bands of the said product [26]. Such an algorithm is able to perform cloud and cloud shadow detection by implementing an object classification framework upon Landsat 8 original bands [26,27]. Ref. [26] built a validation data set consisting of 96 Landsat 8 scenes, and their conclusion was that the CFmask version 3.3 was the fittest solution, providing 90.97% accuracy upon the said data set, without any auxiliary data nor geographic restrictions. Nowadays, CFmask version 3.3 is outdated [28,29] but it still proves great reliability upon Landsat 8 scenes, and its result is provided as auxiliary data with Landsat 8 scenes, which makes its calculation cost non-existent. The CFmask version 3.3 also provides ice and snow cover detection; unfortunately the low resolution of the algorithm and the lack of accuracy’s assertion [26] in its bibliography for a proper glacier mapping led us to develop our own glacier ice and snow cover detection tool. Our method does not implement cloud detection; a cloud pixel will always be misclassified in the rest of our framework (Figure 2). We must then select a threshold over the FMask results that favors positive cloud detection in order to reject all the possible presence of cloud within our method.
As the Fmask lacks spatial accuracy but provides information considering the cloud condition of an area, we used its results as an indicator of potential pixels identified as clouds within each glacier to process. To surpass the misclassification of ice pixels as cloud pixels [26], we introduced a maximum acceptable threshold of the ratio of clouded pixels over the size (in pixels) of each extracted glacier (Figure 2). That way we could allow some errors of classification of the FMask within our method, and potential ice pixels misclassified as clouds by the FMask will then be rightly classified by our methods; see Figure 2 and Section 3.4
3.3.2. Glacier and Mountain’s Shadow Extraction
Depending on the period of the year but also the date of the image acquisition, the extent of shadows from the surrounding mountains can vary. Since “ice” and “shadowed snow” can be misidentified by a standard pixel-classification algorithm [30], it is therefore necessary to map the mountain’s shadowed area to achieve proper glacier ice extraction before further processing.
- Shadow extraction. Shadow extraction is a common pre-processing operation in land cover classification [31,32]. Indeed, such mapping can be useful for further processing of the shadowed areas, for instance, to have a shadow mask usable for further processing. For example, ref. [31] extracted mountain shadows to adjust their brightness properties for an altitude extraction method. However, we decided to discard the processing of such areas within our workflow by mapping them with standard machine learning algorithms. On the contrary, we rely on a support vector machine (SVM) approach that has been proven effective for shadow extraction of remote sensing images [31]. This is particularly true for the mountain’s shadow [32]. Thanks to the use of a DEM with a spatial resolution of the same order of magnitude as the acquisition and a solar azimuth map, it is even possible to build, for each acquisition, a rough estimate of the shadow areas by calculating the projected shadow of the DEM with respect to the solar azimuth map [32]. The resulting shadow mask provides a decent labeled data set to train another classifier for the acquisition [32].We hand-labeled a fixed data set for this study (Equation (1)) with several Landsat 8 scenes for different dates of acquisition during the melting season. However, such a workflow could then be implemented for the optimal use of SVM for the shadow extraction method with adaptive learning per date of acquisition [32].
- Glacier extraction. Ice- and snow-cover extraction compared to a foreground from pixel classification with classical supervised machine learning techniques, such as SVM, random forest (RF) or artificial neural networks (ANNs) [33,34,35] or object classification methods [35,36] is a popular topic and has already shown promising results [33,35].In order to produce a decent binary map of ice and snow to detect a snow line, we need to be sure to feed onto the last classifier of our method (ice and snow extraction, see Figure 2) only pixels of ice or snow. For this purpose we implemented another SVM trained upon a handmade data set from Landsat 8 scenes (see Table 2) to provide the last pre-processing step in order to isolate pixels of ice and snow from foreground pixels (Equation (2)).
3.4. Snow and Ice Detection
At the end of the ablation season, the snow line reaches its uppermost elevation and is, for the glacier where superimposed ice is negligible, the interface between the accumulation zone (covered by snow) and the ablation zone (where the ice is exposed) [15]. It is then of major importance to differentiate ice pixels from snow pixels in order to provide a method to detect the snow line. It has to be noted that for some years, when the surface mass balance is more negative than during the previous year, a firn line is likely to be visible (lower in elevation than the snow line). In this case, the firn area belongs to the ablation zone, and the firn line is not to be considered as a proxy of the ELA. We are confident in the manual delineation we made in the annotation process for the ground truth to be the snow line. So far, refs. [16,17] implemented two methods to detect snow line on glaciers, ensuring a differentiation between ice and snow.
In this study, we propose two ways to ensure ice and snow differentiation:
- A pixel classification approach to produce the same bitmap results as the previously mentioned shadow and ice and snow extractions for each glacier;
- A pixel regression approach to retrieve the probability of a pixel to belong to the ice or snow class to produce a probability map of belonging to ice for each glacier.
As in [33], the most common machine learning methods were investigated, such as ANN, RF or SVM for mapping debris-covered glaciers. Such methods as RF were already proven effective for land cover classification [37] but also for the automatic classification of ice cover types on glaciers using Landsat 8 imagery [38]. SVM also were used for debris-covered glaciers classification with a joint use of Sentinel-1 and Sentinel-2, Landsat 8 (TIRS) and digital elevation data [39]. Regarding ANN, an approach, although not very conclusive, was also made to map debris-covered glaciers from various multi-spectral data [40].
All of these approaches [33,37,38,39,40] led us to choose the RF, SVM with two different kernels (Gaussian and linear) and an ANN as different methods to carry out the pixel classification approach. Secondly, another RF was trained to provide regression maps instead of classification maps. The classification results are presented over the data set of Table 2 in Section 4.2. As we only used one model to provide regression maps, we only compared its results over the snow line elevation metrics presented in Section 4.3.
3.5. Snow Line Detection
The snow line can hardly be directly extracted from the snow cover mapping, as the interface between the snow-covered part of a glacier and its ice-exposed area is rarely a continuous line [17]. Indeed, wind-blow, avalanche deposits, hollows and local shading can cause local snow accumulation and an inhomogeneous distribution of remaining snow patches [13,17,41]. Therefore, we also introduced two additional techniques to estimate the snow line as the most pertinent line between the snow and ice parts of a glacier in an inhomogeneous snow-covered environment, using the snow cover map of each glacier and a digital elevation model. The first method is aiming to improve the ASMAG’s snow line detection method [17] by the use of an active contour algorithm run on the snow cover map, which can be a probability map or a binary map. The second method uses a traditional gradient computation algorithm [16] with noise filtering based upon a digital elevation model.
For this step of processing, we now consider the results of the ice and snow pixel detection as a binary or a probability map, where is the output of the supervised methods presented in Section 3.4:
3.5.1. Active Contour Snow Line Detection
Rastner et al. proposed in 2019 an approach (hereafter called ASMAG for automatic snow mapping on glaciers) to provide the most probable snow line given a snow cover map and a digital elevation model [17].
We rely on this approach and propose a further development for which the resulting elevation bin, considered the most probable snow line, is used to initialize an active contours algorithm on the classification map.
- Elevation bins’ decomposition. This method assumes that a snow line should be considered as an area instead of a straight line [41].
- -
- First, we used the Copernicus DEM and decomposed it into elevation bins for each glacier. As the elevation values of the Copernicus DEM can sometimes have little variability given the extracted glacier, we ensured bin decomposition with regard to the number of elevation values within the extracted glacier. The fewer different elevation values are found in a given glacier, the less elevation bins are used for the snow line detection within this glacier.
- -
- We then used the elevation bins and intersected them with the snow cover map (Figure 5) using the same methodology as [17]. Each of the bins, starting from the lowest elevation to the highest, contains a different ratio of snow pixels; a bin with a ratio of snow-covered pixels higher than 50% is tagged as a snow bin. However, for each glacier, the snow bin with the highest number of consecutive snow bins above it is tagged as the potential snow line. Ref. [17] chose the lowest bin, accumulating at least five bins with a majority of snow above it. Then, depending on the result of the algorithm (pass or fail), Ref. [17] decreased the necessary consecutive snowy bins by one up to three bins and then chose the one with the lowest elevation.
- Snow line initialization. Given DEM inaccuracies [19], but also given the high slopes present within a glacier, mapping on a DEM given a particular elevation range often results in a spatially irregular and discontinuous line or area over the glacier. This only allows a poorly designed initialization line for active contour methods, which then impacts the performance of the said active contour method [42,43]. In this processing step, we propose to simplify the result of the bin decomposition by a polynomial regression [44] of its result. This operation works under the assumption that a glacier has an inclined gutter shape, i.e., the concavity of the contour lines in the upper reaches of the glaciers is upstream [8]. It means that if we select the equipotential of a glacier, hence the intersection of this gutter with a plane, we will likely obtain a simple polynomial curve, where its maximum or minimum is located on the decreasing axis. Hence, such a polynomial curve can be approximated by a low-order polynomial fitted to the bins’ decomposition results. However, the spatial orientation of such a curve will depend on the glacier orientation. Given x and y the columns and the line of the study area image, and depending on the main orientation of the glacier, we need to approximate with a polynomial function the x coordinates given y of the bin, or the y coordinates given x of the bin (Figure 6). Finally, we introduce a range of altitude () of ±20 m (depending on the size of the glacier, we allow this range of altitude to go up to ±100 m if not enough pixels are available; if the polynomial fit still lacks data, we reduce the polynomial order of the approximation up to 2 degrees.) around the selected elevation to map more pixels on the glacier in order to reduce instabilities during the fitting of the polynomialWe then have, with the initialized bin,We are then able to provide two possible polynomial regressions:Depending on the R score of the computed approximations, we can choose the one that achieves the best R score over the selected bins:Depending on the result of the approximations, the best approximation (meaning the one with the lowest R score) is selected as the final snow line.
- Active contour method. The ASMAG algorithm was developed under the assertion that the snow line, as an area, is an equipotential [17], but sometimes, winds, avalanches or shadows force the snow line to have a different elevation depending on its position within the glacier [13,41]. To overcome this issue, we propose to implement an active contour detection [45] initialized by the best polynomial interpolation of the potential snow line (Figure 7).
3.5.2. No Bin’s Approach
As the snow cover can sometime be chaotic, a direct extraction can be difficult to ensure. This approach uses a binary classification map of the snow cover and applies mathematical morphology correction in order to discard potential snow patches located in the ablation area of a glacier. It then applies a regular mathematical morphology gradient followed by a gradient correction with regard to a digital elevation model for outliers’ removal.
- Closing operation. In order to remove the snow patches in the ice-exposed area of a glacier, we intend to apply a binary morphological closing [46,47] on the binary snow map where B is a structuring element. The goal of this operation is to simplify the ice and snow cover map in order to have a less noisy gradient.
- Gradient computing. As the result of the closing operation is still a binary map, we implement a local gradient computation, Figure 8, which returns the local gradient of an image (i.e., local maximum–local minimum) given a footprint, which defines the local neighborhood around the pixel used for the computation in order to detect the interfaces between ice and snow [47,48].
4. Results
4.1. Pre-Processing
The pre-processing step contains classification operations whose performance needs to be assessed in order to justify their use within the general workflow of the snow detection algorithm. The pre-processing operation contains two steps illustrated in Figure 10:
- The shadow classification step to detect and discard the shadowed pixels within the glacier;
- The glacier classification step to detect ice and snow pixels compared to potential foreground pixels that are no longer covered by the glacier but still present in the 2015 glacier inventory shape file [20].
With state-of-the-art methods, we are able to provide an accuracy of 100%. In the worst case (SVM with a Gaussian kernel), the classification model was only mispredicting four pixels in our data (for a total of 30,000 shadowed pixels). Such performance should be put into perspective, as we hand-labeled the data set, focusing on obviously shadowed areas, thus virtually increasing the performance of the tested algorithms.
We then apply the same metric to check the performance of classification of the glacier pixels compared to foreground pixels.
For the same reasons as for the shadow extraction methods, as we built a handmade data set focused on obvious ice and snow areas, thereby virtually increasing the performance of the tested algorithms, all of the classifiers achieve at least 99% accuracy on the testing set, obtained from a random testing subset of the data set built for the shadow detection task, Table 2
4.2. Snow and Ice Detection
We trained and studied the performance of our algorithms over a carefully hand-labeled data set (Section 3.2.1).
The labeling of the ice and snow data set is based on the following assertions:
- There are only two types of classes to detect, ice and snow, with no regards to other characteristics.
- To limit experimental errors within the labeling process, only obvious snow and ice pixel were selected as training samples, meaning that snow and ice pixels near snow lines are not present within the training and evaluation data set.
We trained four different classifiers. Results are presented in Table 4. We observe that their performance results are significantly high. The reason could come from our need to reduce the experimental errors within our data set. With our data set, the random forest models give the best results. Random forest models usually outperform SVM on simple classification tasks [50]. However, random forest models usually segment sequentially their parametric space to build their classification function, which can be an unrealistic operation given the spectral signature of ice vs. snow (Figure 3), where the decision function between the two classes is to be an additive feature. As more complete and potentially mixed ice and snow pixels were not present in our data set, it is difficult to assess this weakness, and it is reasonable to question the results of this model around the snow line. Only the feed forward neural network and the RF regression provide a regression workflow. For a fair comparison with the other methods, we converted the results into a binary classifier by thresholding their output.
4.3. Snow Line Detection
We use the metrics presented in [17]. For all the glaciers located in the study area, we perform the following:
- We compute the snow line using the different methods presented in the Method section.
- We embed the resulted snow lines on the Copernicus DEM, and compute their average elevation for each glacier using the outlines of the 2015 glacier inventory [20].
- We compute the Pearson’s correlation coefficient [51] of the average computed snow line elevation and the average ground truth snow line elevation per glacier.
The comparison of the automatically derived and manually derived SLAs for the glaciers of the study area shows similar results, whatever the choice of the snow line detection methods or the type of model used for the classification.
Figure 11 shows the results obtained with the “active contour algorithms”, and Figure 12 show the results obtained with the simple gradient approach.
Results shown in Figure 11 tend to change a lot between each model, as the selection of a potential snow line only happens for areas whose prediction tends to be ambiguous for all models (meaning areas of mixed ice and snow pixels, around the snow line to detect). As expected with regard to the classifiers results in Table 4, the best performance for the snow line detection is provided by the SVM with a Gaussian kernel model, as its results tend to favor the classification of snowy ice pixels for ice pixels, compared to the random forest classifier. It then proposes a classification map closer to the actual definition of the ice and snow cover of the glacier. Building a more precise data set that contains pixels “of snowy ice” areas would probably increase the performance of the snow line detection based on a random forest classifier.
Even if the no bins approach provides somehow less satisfactory results than the active contour approach, the no bins is less computationally demanding that the active contours approach. Regardless, the active contour approach does provide better results in terms of elevation’s accuracy, but a tradeoff between the spatial coherence and precision of detection of the detected snow line (Figure 11) against computational efficiency (Figure 12) needs to be taken into account.
4.4. Outliers Removal
Several glaciers can produce outliers in the snow line detection, e.g., where the snow line fails to initialize properly, such glaciers can be described as two different cases:
- Glaciers whose complex shapes and chaotic topographic conditions do not allow a clear definition of a snow line with regard to a simple elevation line. In general, such glaciers are not indicated by the glaciers inventory [20] and reject the hypothesis of a glacier to have a monotonic elevation topography or a single applicable snow line over the entire glacier. Such glaciers were removed from our study. Figure 13 shows an example of such glaciers.
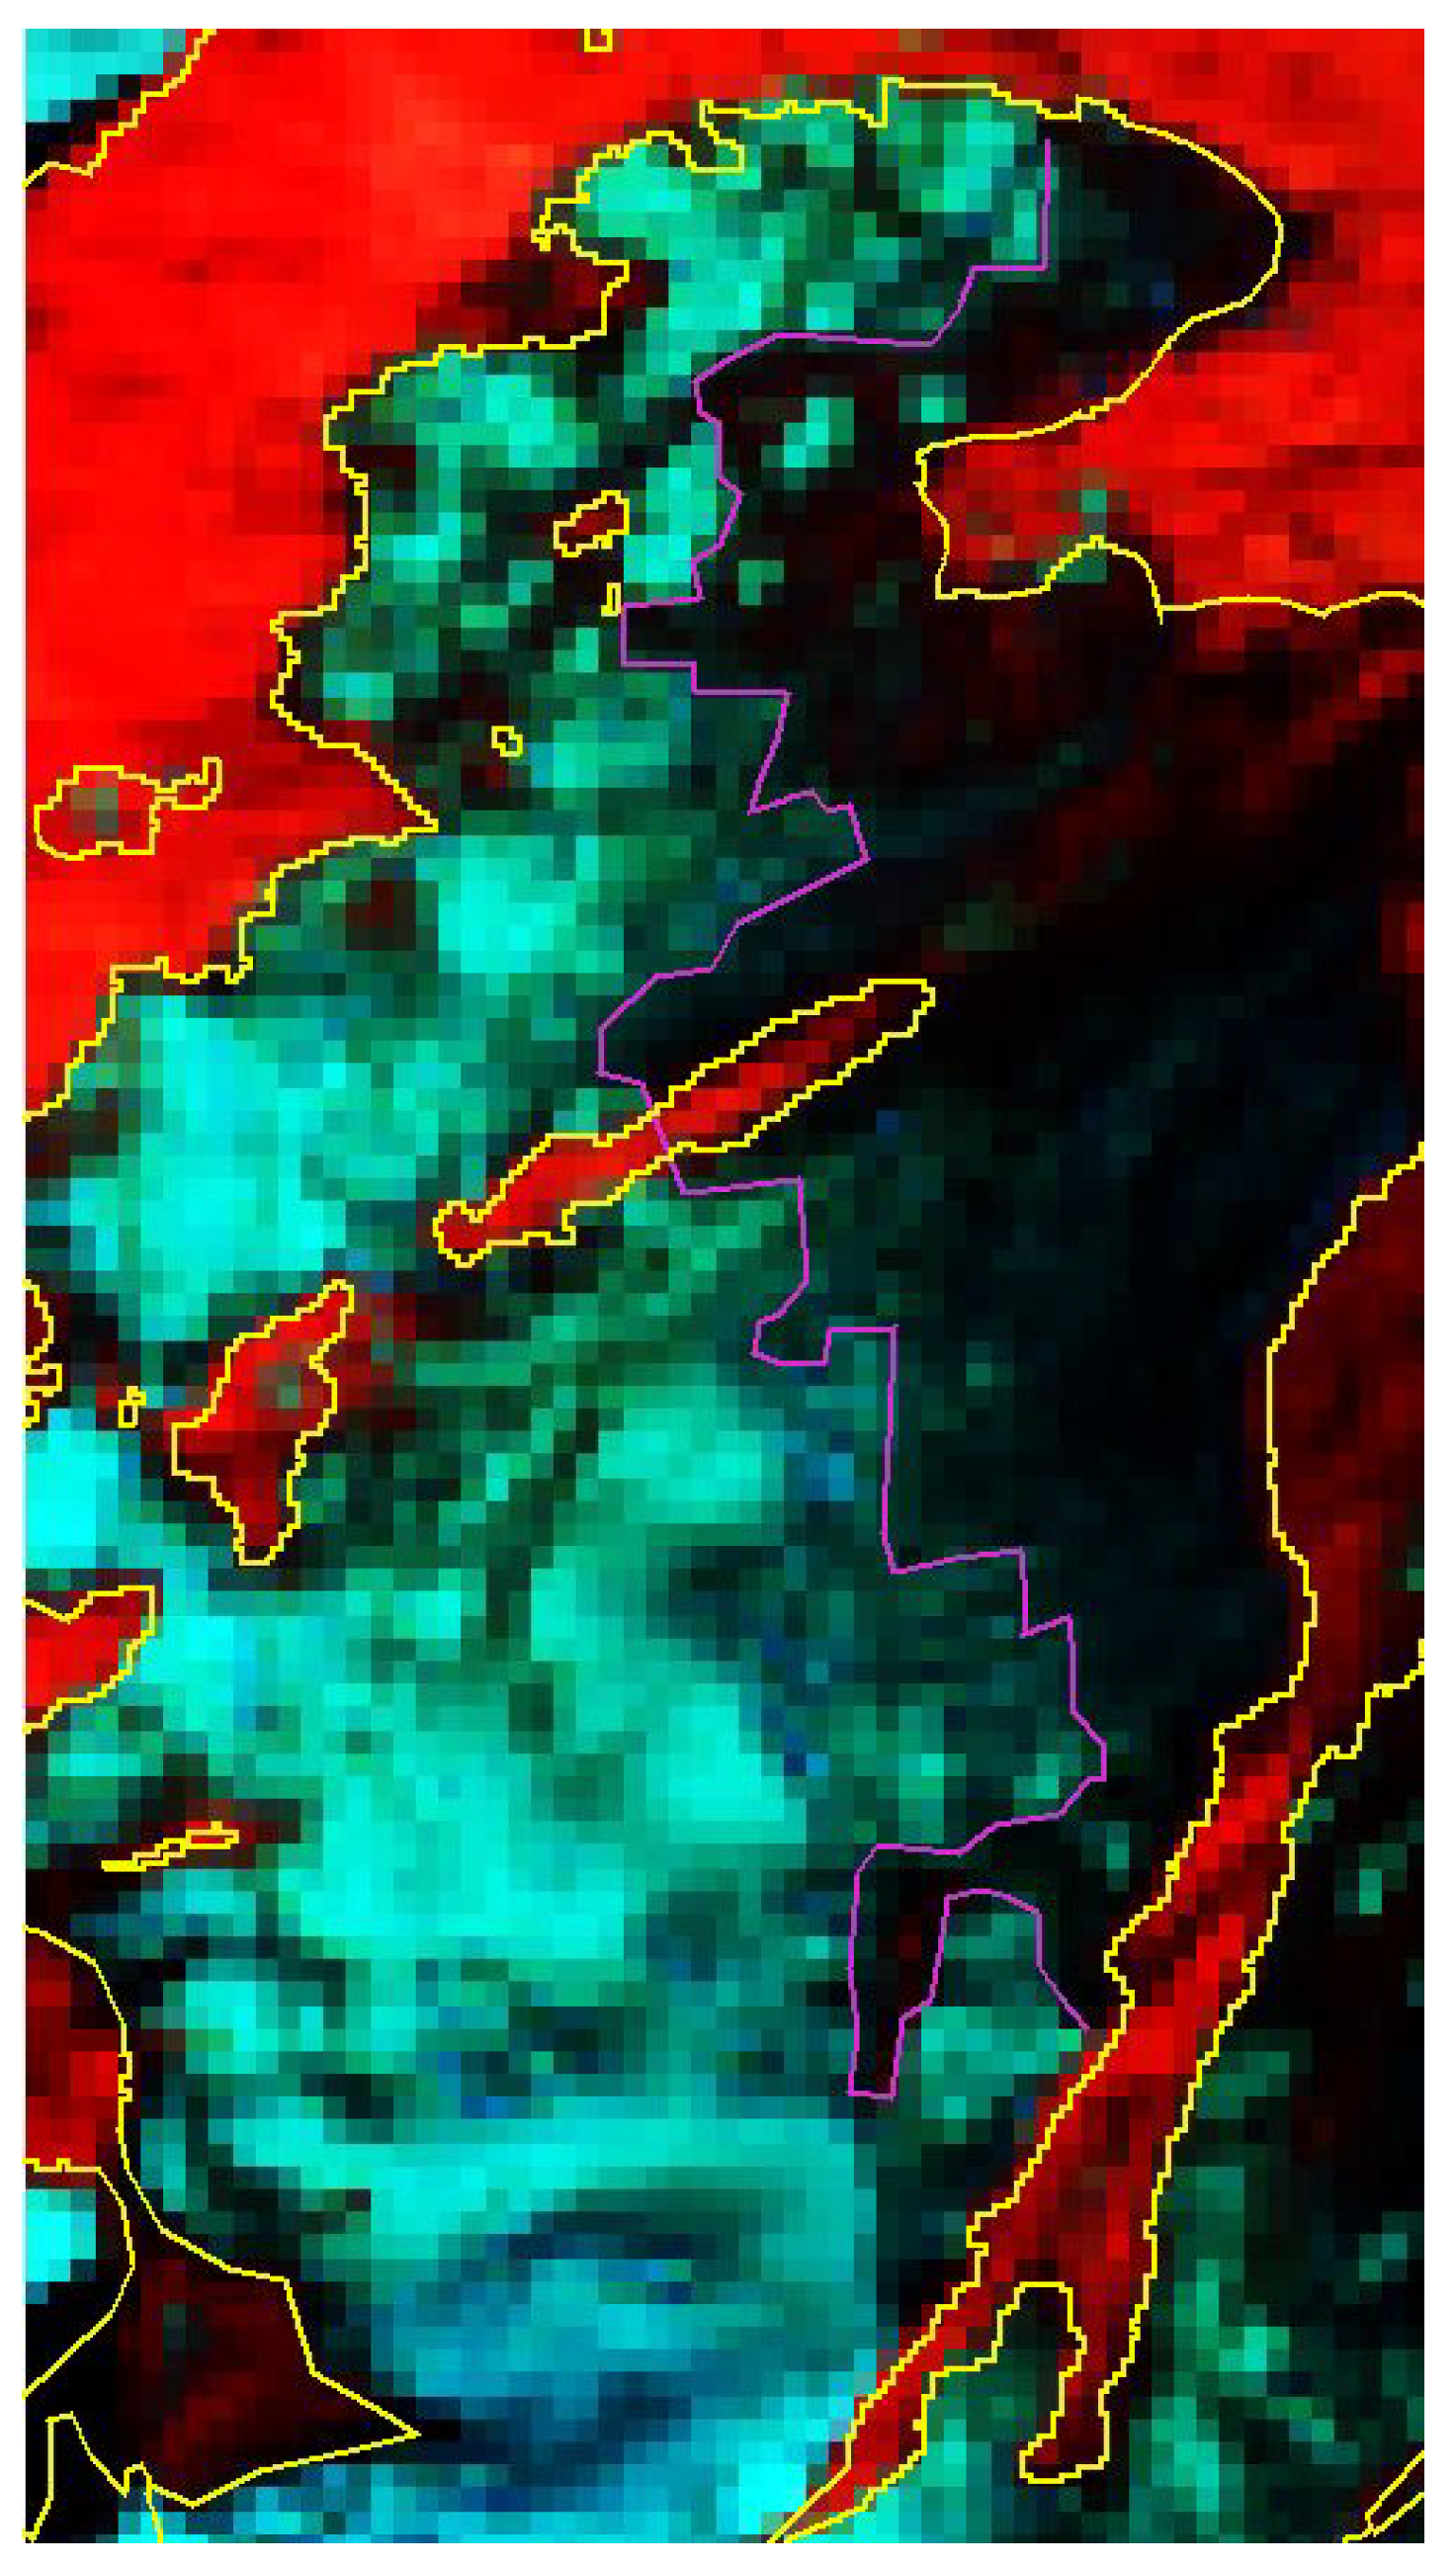
- Glaciers which contain a chaotic snow line area that sometimes extends over several hundred of meters height. For such cases, one would detect the snow line at the bottom of the this area, or would detect it above. Because of such a chaotic situation, the result between different models can highly differ, as their output can be significantly different upon pixels, referring to an area that contains an equal amount of ice and snow. As, within such a context, it appears improbable to propose a reliable ground truth, we chose to discard these glaciers in our study. Figure 14 shows an example of such glaciers.
5. Discussion
Our algorithm performs well where the hypothesis of a continuous snow line at a fairly homogeneous altitude exists. Given this hypothesis, the presented approaches are able to show promising performance with regard to the presented metric (Figure 11 and Figure 12). Our study also shows that standard machine learning algorithms are able to classify properly ice and snow (Table 4). This finding is encouraging, as we can thus propose simple cost effective and scalable methods to be applied on numerous glaciers and areas that are not yet monitored, allowing more complex and contextualized algorithms to be implemented (Section 3.5.1 and Section 3.5.2).
While doing that, we overcome the problem of initialization that was present in the other state-of-the-art studies and increase the robustness of the detection, e.g., the tuning of the Otsu threshold was defined locally for each glacier in [17] and suffered from the presence of fresh snow on top of the glacier and topographic shadows. We also integrate the pre-processing of the shadows in our workflow. In addition, our post-processing allows to reduce the noise in the snow line estimation.
As for every machine learning approaches, the performance results are dependent on the training data, that is to say that the annotated data should be as accurate as possible. Another limitation of our work is that our algorithms still fail when the snow line is very steep or discontinuous.
Regarding the initialization of the snow line by elevation bins (see Section 3.5.2), glaciers that do not have a surface topography which is continuously inclined from the bottom to the top can also become complex to process. Indeed, the definition of the snow line within this approach supposes that an elevation bin is the intersection of an equipotential to a monotonic decreasing gutter-shaped glacier [8], resulting in a simple line to fit with a polynomial regression. If the topology of the glaciers happens to be more complex, the intersection of the equipotential is not a line and can be simplified, with some difficulty, as a polynomial resulting in a badly conditioned polynomial regression and active contours processing, (Section 3.5.1).
The workflow presented in this study is very likely transferable to other mountains ranges, but not the models themselves. Indeed, these are data dependent and most probably parameterized by local features and behavior. Therefore, to apply the workflow in other areas, a new training data set and local ground truth must be performed.
5.1. Potential Enhancement of the Study
Cases where the algorithms fail are (i) where the topography is chaotic steep glacier surface slope with presence of crevasses and/or seracs), that leads to non-continuous snow lines at very different altitudes (Figure 13); and (ii) when the snow line is blurred alongside the glacier (Figure 14). This situation also happens where small glaciers are clustered as one within the inventory (Figure 13).
These cases can be considered outliers that need to be discarded in order to provide a relevant snow cover mapping from one image to be completed with other Landsat 8 products, where the snow and ice conditions of the concerned glaciers are more lenient.
In order to identify automatically those outliers and process them separately, a time-series approach of the evolution of the elevation of the snow line per glacier over the ablation season could be applied in order to detect irrelevant snow line altitudes in comparison with the glacier snow line elevation for the same period (i.e., detected on the images recorded few days before/after). This could be done thanks to the availability of images every 16 days with Landsat, or more frequently with other sensors, such as Sentinel-2.
5.2. Extension of Our Work to Other Multi-Spectral Images
The first limit to the expandability of our work to other multi-spectral images is the limit of the CFMask version 3.3 algorithm to other products, such as the Copernicus’ Sentinel-2 products [28]. Various possibilities still exist to detect clouds with regard to a multi-spectral data set [29]. To this end, a cloud mask simply used for providing a proxy to the cloud coverage of a glacier nowadays seems to be a reasonable operation. The second limit is the necessity of the classifiers to be retrained upon the new multi-spectral products, as a different multi-spectral imaging system does not provide the same information about the general spectrum of the land cover. Although this constraint seems to be rather restrictive, our classifiers do not require a lot of samples to be trained, as they do not contain a lot of parameters given the fact that the classification task of ice and snow is rather straightforward.
Finally, even if the extension of the presented workflow seems to be promising, adjustments can be implemented to fit different multi-spectral products. The accuracy of an upgraded workflow should then be evaluated with regard to the same metric presented in this paper, applied in [17].
5.3. From a Proof of Concept to a Finalized Product
In the current context of open science and the availability of processing chains and associated products, the notion of FAIR Data (findable, accessible, interoperable and reusable) has emerged. However, from the proof of concept presented in this article to the distribution of a finalized product available to an end-user, several steps need to be tackled:
- Automatize the entire processing chain (from the images download on the satellite data providers platforms to the distribution of the finalized products);
- Quantify and document all uncertainties, so that the end-user is confident that the product has gone through a quality control;
- Make the product available (open interface for data distribution), in a reusable and interoperable format, and when possible in real time.
6. Conclusions
In this study, we presented the results of a workflow we developed to automatically detect the snow line on glaciers on the basis of satellite images. The workflow was applied on mountain temperate glaciers in the European Alps. Different machine-learning based approaches were tested on Landsat 8 products, taking into account the Alps’ glacier inventory from 2015 and the 30 m Copernicus DEM. On top of the classically used classifier in image segmentation (e.g., feed forward neural network, linear or Gaussian kernels, and random forest), we further developed two methods. The first one consists of an adapted version of the ASMAG’s bins decomposition detection workflow, using the resulting snow line of the said workflow as a initialization vector for active contours detection. The second method consists of a regular gradient computing of the snow cover map followed by a thresholding of the resulting gradient, given its elevation in order to discard the gradient detected by possible patches of snow in the ablation area of the glacier. Both methods show similar results and good performance to detect the snow line. However, both methods fail when snow lines are not continuous or located in steep and highly crevassed parts of the glaciers. The methods could be extended to other multi-spectral products. Future works should address those issues.
A potential further application would be a multi-temporal approach applied at the scale of the ablation season. Such an application would need to combine images from different sensors (e.g., Sentinel-2 data on top of Landsat images) to increase the frequency of data availability and of the retrieved time series of evolution of the snow line elevation. Such time series could allow improving the detection on complex glaciers, based on an outlier detection of the snow line elevation identified by the presented workflow for each satellite image. These time series could also allow glaciologists to monitor the changes in elevation of the snow line at the glacier surface during the course of the ablation season [52] and use this information (1) as a proxy for studying surface mass balance processes (i.e., ablation and accumulation); (2) to calibrate glacier surface mass balance models [53]; or (3) pursue the development of assimilation schemes in glaciological models [54].
Author Contributions
C.P., data, state of the art, technical discussions, writing; A.R., data, state of the art, technical discussions, writing; J.-B.T., management, technical discussions, writing; I.F., technical discussions on classification and regression, writing; J.C., funding, technical discussions, and writing. All authors have read and agreed to the published version of the manuscript.
Funding
This research was partially supported by funds from both NTNU and Data Science Experts.
Data Availability Statement
Data used for this study are available upon request to the first author. Landsat data are freely available through the USGS portal (https://www.usgs.gov/landsat-missions/landsat-data-access). The Copernicus DEM is freely available through the Copernicus portal (https://spacedata.copernicus.eu/web/cscda/data-access).
Acknowledgments
We want to thank Mathieu Nguyen for the fruitful discussions on snow imaging and appearance models. Antoine Rabatel acknowledges the support of LabEx OSUG@2020 (Investissements d’avenir—ANR10 LABX56). Comments made by the anonymous reviewers helped improving the manuscript.
Conflicts of Interest
The authors declare no conflict of interest.
References
- Pörtner, H.O.; Roberts, D.C.; Masson-Delmotte, V.; Zhai, P.; Tignor, M.; Poloczanska, E.; Weyer, N. The ocean and cryosphere in a changing climate. In Special Report on the Ocean and Cryosphere in a Changing Climate; IPCC: Geneva, Switzerland, 2019. [Google Scholar]
- Østrem, G.; Stanley, A.; Subdivision, R.G.; Saskatoon: National Hydrological Research Institut. Glacier mass-balance measurements: A manual for field and office work. Arct. Alp. Res. 1993, 25, 77–78. [Google Scholar] [CrossRef]
- Kaser, G.; Fountain, A.; Jansson, P. A Manual for Monitoring the Mass Balance of Mountain Glaciers; Unesco: Paris, France, 2003; Volume 137. [Google Scholar]
- Jacob, T.; Wahr, J.; Pfeffer, W.T.; Swenson, S. Recent contributions of glaciers and ice caps to sea level rise. Nature 2012, 482, 514–518. [Google Scholar] [CrossRef]
- Gardner, A.S.; Moholdt, G.; Cogley, J.G.; Wouters, B.; Arendt, A.A.; Wahr, J.; Berthier, E.; Hock, R.; Pfeffer, W.T.; Kaser, G. A reconciled estimate of glacier contributions to sea level rise: 2003 to 2009. Science 2013, 340, 852–857. [Google Scholar] [CrossRef]
- Howat, I.M.; Smith, B.E.; Joughin, I.; Scambos, T.A. Rates of southeast Greenland ice volume loss from combined ICESat and ASTER observations. Geophys. Res. Lett. 2008, 35, L17505. [Google Scholar] [CrossRef]
- Menounos, B.; Hugonnet, R.; Shean, D.; Gardner, A.; Howat, I.; Berthier, E.; Pelto, B.; Tennant, C.; Shea, J.; Noh, M.J.; et al. Heterogeneous Changes in Western North American Glaciers Linked to Decadal Variability in Zonal Wind Strength. Geophys. Res. Lett. 2018, 46, 200–209. [Google Scholar] [CrossRef]
- Bahr, D.B.; Meier, M.F.; Peckham, S.D. The physical basis of glacier volume-area scaling. J. Geophys. Res. Solid Earth 1997, 102, 20355–20362. [Google Scholar] [CrossRef]
- Drolon, V.; Maisongrande, P.; Berthier, E.; Swinnen, E.; Huss, M. Monitoring of seasonal glacier mass balance over the European Alps using low-resolution optical satellite images. J. Glaciol. 2016, 62, 912–927. [Google Scholar] [CrossRef]
- Rabatel, A.; Sirguey, P.; Drolon, V.; Maisongrande, P.; Arnaud, Y.; Berthier, E.; Davaze, L.; Dedieu, J.P.; Dumont, M. Annual and Seasonal Glacier-Wide Surface Mass Balance Quantified from Changes in Glacier Surface State: A Review on Existing Methods Using Optical Satellite Imagery. Remote Sens. 2017, 9, 507. [Google Scholar] [CrossRef]
- Braithwaite, R.J. Can the Mass Balance of a Glacier be Estimated from its Equilibrium-Line Altitude? J. Glaciol. 1984, 30, 364–368. [Google Scholar] [CrossRef]
- Benn, D.I.; Lehmkuhl, F. Mass balance and equilibrium-line altitudes of glaciers in high-mountain environments. Quat. Int. 2000, 65-66, 15–29. [Google Scholar] [CrossRef]
- Rabatel, A.; Dedieu, J.P.; Vincent, C. Using remote-sensing data to determine equilibrium-line altitude and mass-balance time series: Validation on three French glaciers, 1994–2002. J. Glaciol. 2005, 51, 539–546. [Google Scholar] [CrossRef]
- Paterson, W.S.B. Physics of Glaciers; Butterworth-Heinemann: Oxford, UK, 1994. [Google Scholar]
- Lliboutry, L. Traité de Glaciologie. Tome 2. Glaciers, Variations du Climat, Sols Gelés; Masson: Paris, France, 1965. [Google Scholar]
- Davaze, L.; Rabatel, A.; Rabatel, A.; Hugonnet, R.; Arnaud, Y. Region-Wide Annual Glacier Surface Mass Balance for the European Alps From 2000 to 2016. Front. Earth Sci. 2020, 8, 149. [Google Scholar] [CrossRef]
- Rastner, P.; Prinz, R.; Notarnicola, C.; Nicholson, L.; Sailer, R.; Schwaizer, G.; Paul, F. On the Automated Mapping of Snow Cover on Glaciers and Calculation of Snow Line Altitudes from Multi-Temporal Landsat Data. Remote Sens. 2019, 11, 1410. [Google Scholar] [CrossRef]
- Racoviteanu, A.E.; Rittger, K.; Armstrong, R. An Automated Approach for Estimating Snowline Altitudes in the Karakoram and Eastern Himalaya From Remote Sensing. Front. Earth Sci. 2019, 7, 220. [Google Scholar] [CrossRef]
- Fahrland, E.; Jacob, P.; Schrader, H.; Kahabka, H. Copernicus Digital Elevation Model, Product Handbook; Airbus Defence and Space—Intelligence: Potsdam, Germany, 2020. [Google Scholar]
- Paul, F.; Rastner, P.; Azzoni, R.S.; Diolaiuti, G.; Fugazza, D.; Le Bris, R.; Nemec, J.; Rabatel, A.; Ramusovic, M.; Schwaizer, G.; et al. Glacier inventory of the Alps from Sentinel-2, shape files. Supplement to: Paul, F.; Rastner, P., R.; Azzoni, R.S.; Diolaiuti, G.; Fugazza, D.; Le Bris, R.; Nemec, J.; Rabatel, A.; Ramusovic, M.; Schwaizer, G.; Smiraglia, C.: Glacier shrinkage in the Alps continues unabated as revealed by a new glacier inventory from Sentinel-2. Earth Syst. Sci. Data 2020, 12, 1805–1821. [Google Scholar] [CrossRef]
- Ihlen, V.L.; Zanter, K. Landsat 8 (L8) Data Users Handbook; Data Users Handbook Version 5.0; Department of the Interior, U.S. Geological Survey: Sioux Falls, SD, USA, 2019.
- Rizzoli, P.; Martone, M.; Gonzalez, C.; Wecklich, C.; Borla Tridon, D.; Bräutigam, B.; Bachmann, M.; Schulze, D.; Fritz, T.; Huber, M.; et al. Generation and performance assessment of the global TanDEM-X digital elevation model. ISPRS J. Photogramm. Remote Sens. 2017, 132, 119–139. [Google Scholar] [CrossRef]
- Zwally, H.J.; Schutz, B.; Bentley, C. GLAS/ICESat L2 Global Land Surface Altimetry Data, Version 34, 2014. Type: Dataset. Available online: https://nsidc.org/data/gla14/versions/34 (accessed on 3 March 2021).
- Rastner, P.; Bolch, T.; Notarnicola, C.; Paul, F. A Comparison of Pixel- and Object-Based Glacier Classification With Optical Satellite Images. IEEE J. Sel. Top. Appl. Earth Obs. Remote Sens. 2014, 7, 853–862. [Google Scholar] [CrossRef]
- Rabatel, A.; Letréguilly, A.; Dedieu, J.P.; Eckert, N. Changes in glacier equilibrium-line altitude in the western Alps from 1984 to 2010: Evaluation by remote sensing and modeling of the morpho-topographic and climate controls. Cryosphere 2013, 7, 1455–1471. [Google Scholar] [CrossRef]
- Foga, S.; Scaramuzza, P.L.; Guo, S.; Zhu, Z.; Dilley, R.D.; Beckmann, T.; Schmidt, G.L.; Dwyer, J.L.; Joseph Hughes, M.; Laue, B. Cloud detection algorithm comparison and validation for operational Landsat data products. Remote Sens. Environ. 2017, 194, 379–390. [Google Scholar] [CrossRef]
- Zhu, Z.; Woodcock, C.E. Object-based cloud and cloud shadow detection in Landsat imagery. Remote Sens. Environ. 2012, 118, 83–94. [Google Scholar] [CrossRef]
- Qiu, S.; Zhu, Z.; He, B. Fmask 4.0: Improved cloud and cloud shadow detection in Landsats 4–8 and Sentinel-2 imagery. Remote Sens. Environ. 2019, 231, 111205. [Google Scholar] [CrossRef]
- Mahajan, S.; Fataniya, B. Cloud detection methodologies: Variants and development—A review. Complex Intell. Syst. 2020, 6, 251–261. [Google Scholar] [CrossRef]
- Nolin, A.W.; Dozier, J.; Mertes, L.A.K. Mapping alpine snow using a spectral mixture modeling technique. Ann. Glaciol. 1993, 17, 121–124. [Google Scholar] [CrossRef]
- Sheng, T.; Chen, Q. Dark Channel Prior-Based Altitude Extraction Method for a Single Mountain Remote Sensing Image. IEEE Geosci. Remote. Sens. Lett. 2017, 14, 132–136. [Google Scholar] [CrossRef]
- Tolt, G.; Shimoni, M.; Ahlberg, J. A shadow detection method for remote sensing images using VHR hyperspectral and LIDAR data. In Proceedings of the 2011 IEEE International Geoscience and Remote Sensing Symposium, Vancouver, BC, Canada, 24–29 July 2011; pp. 4423–4426. [Google Scholar] [CrossRef]
- Khan, A.A.; Jamil, A.; Hussain, D.; Taj, M.; Jabeen, G.; Malik, M.K. Machine-Learning Algorithms for Mapping Debris-Covered Glaciers: The Hunza Basin Case Study. IEEE Access 2020, 8, 12725–12734. [Google Scholar] [CrossRef]
- Callegari, M.; Marin, C.; Notarnicola, C. Multi-temporal and multi-source alpine glacier cover classification. In Proceedings of the 2017 9th International Workshop on the Analysis of Multitemporal Remote Sensing Images (MultiTemp), Brugge, Belgium, 27–29 June 2017; pp. 1–3. [Google Scholar] [CrossRef]
- Raza, I.U.R.; Kazmi, S.S.A.; Ali, S.S.; Hussain, E. Comparison of Pixel-based and Object-based classification for glacier change detection. In Proceedings of the 2012 Second International Workshop on Earth Observation and Remote Sensing Applications, Shanghai, China, 8–11 June 2012; pp. 259–262. [Google Scholar] [CrossRef]
- Wang, X.; Gao, X.; Zhang, X.; Wang, W.; Yang, F. An Automated Method for Surface Ice/Snow Mapping Based on Objects and Pixels from Landsat Imagery in a Mountainous Region. Remote Sens. 2020, 12, 485. [Google Scholar] [CrossRef]
- Gislason, P.O.; Benediktsson, J.A.; Sveinsson, J.R. Random forests for land cover classification. Pattern Recognit. Lett. 2006, 27, 294–300. [Google Scholar] [CrossRef]
- Zhang, J.; Jia, L.; Menenti, M.; Hu, G. Glacier Facies Mapping Using a Machine-Learning Algorithm: The Parlung Zangbo Basin Case Study. Remote Sens. 2019, 11, 452. [Google Scholar] [CrossRef]
- Alifu, H.; Vuillaume, J.F.; Johnson, B.A.; Hirabayashi, Y. Machine-learning classification of debris-covered glaciers using a combination of Sentinel-1/-2 (SAR/optical), Landsat 8 (thermal) and digital elevation data. Geomorphology 2020, 369, 107365. [Google Scholar] [CrossRef]
- Paul, F.; Huggel, C.; Kääb, A. Combining satellite multispectral image data and a digital elevation model for mapping debris-covered glaciers. Remote Sens. Environ. 2004, 89, 510–518. [Google Scholar] [CrossRef]
- World Meteorological Office. Seasonal Snow Cover, 1970. Available online: https://gcw.met.no/node/6 (accessed on 3 March 2021).
- Rodtook, A.; Kirimasthong, K.; Lohitvisate, W.; Makhanov, S.S. Automatic initialization of active contours and level set method in ultrasound images of breast abnormalities. Pattern Recognit. 2018, 79, 172–182. [Google Scholar] [CrossRef]
- Keatmanee, C.; Makhanov, S.S.; Kotani, K.; Lohitvisate, W.; Thongvigitmanee, S.S. Automatic initialization for active contour model in breast cancer detection utilizing conventional ultrasound and Color Doppler. In Proceedings of the 2017 39th Annual International Conference of the IEEE Engineering in Medicine and Biology Society (EMBC), Jeju, Korea, 11–15 July 2017; pp. 3248–3251. [Google Scholar] [CrossRef]
- Ostertagová, E. Modelling using Polynomial Regression. Procedia Eng. 2012, 48, 500–506. [Google Scholar] [CrossRef]
- Kass, M.; Witkin, A.; Terzopoulos, D. Snakes: Active contour models. Int. J. Comput. Vis. 1988, 1, 321–331. [Google Scholar] [CrossRef]
- Haralick, R.M.; Sternberg, S.R.; Zhuang, X. Image Analysis Using Mathematical Morphology. IEEE Trans. Pattern Anal. Mach. Intell. 1987, PAMI-9, 532–550. [Google Scholar] [CrossRef]
- Vincent, L. Grayscale area openings and closings, their efficient implementation and applications. In Proceedings of the EURASIP Workshop on Mathematical Morphology and Its Applications to Signal Processing, Barcelona, Spain, May 1993. [Google Scholar]
- Huang, T.; Yang, G.; Tang, G. A fast two-dimensional median filtering algorithm. IEEE Trans. Acoust. Speech, Signal Process. 1979, 27, 13–18. [Google Scholar] [CrossRef]
- Otsu, N. A Threshold Selection Method from Gray-Level Histograms. IEEE Trans. Syst. Man, Cybern. 1979, 9, 62–66. [Google Scholar] [CrossRef]
- Belgiu, M.; Drăguţ, L. Random forest in remote sensing: A review of applications and future directions. ISPRS J. Photogramm. Remote. Sens. 2016, 114, 24–31. [Google Scholar] [CrossRef]
- Pearson’s Correlation Coefficient. In Encyclopedia of Public Health; Kirch, W. (Ed.) Springer: Dordrecht, The Netherlands, 2008; pp. 1090–1091. [Google Scholar] [CrossRef]
- Mernild, S.H.; Pelto, M.; Malmros, J.K.; Yde, J.C.; Knudsen, N.T.; Hanna, E. Identification of snow ablation rate, ELA, AAR and net mass balance using transient snowline variations on two Arctic glaciers. J. Glaciol. 2013, 59, 649–659. [Google Scholar] [CrossRef]
- Barandun, M.; Huss, M.; Usubaliev, R.; Azisov, E.; Berthier, E.; Kääb, A.; Bolch, T.; Hoelzle, M. Multi-decadal mass balance series of three Kyrgyz glaciers inferred from modelling constrained with repeated snow line observations. Cryosphere 2018, 12, 1899–1919. [Google Scholar] [CrossRef]
- Landmann, J.M.; Künsch, H.R.; Huss, M.; Ogier, C.; Kalisch, M.; Farinotti, D. Assimilating near-real-time mass balance stake readings into a model ensemble using a particle filter. Cryosphere 2021, 15, 5017–5040. [Google Scholar] [CrossRef]
Figure 1.
The red outline defines our study area. This visualization is based on data acquired on 3 September 2019 by Landsat 8. (a) True color image of the study area. (b) (Green/NIR/SWIR) image of the study area. (c) Study area projected upon openStreetMap.
Figure 1.
The red outline defines our study area. This visualization is based on data acquired on 3 September 2019 by Landsat 8. (a) True color image of the study area. (b) (Green/NIR/SWIR) image of the study area. (c) Study area projected upon openStreetMap.
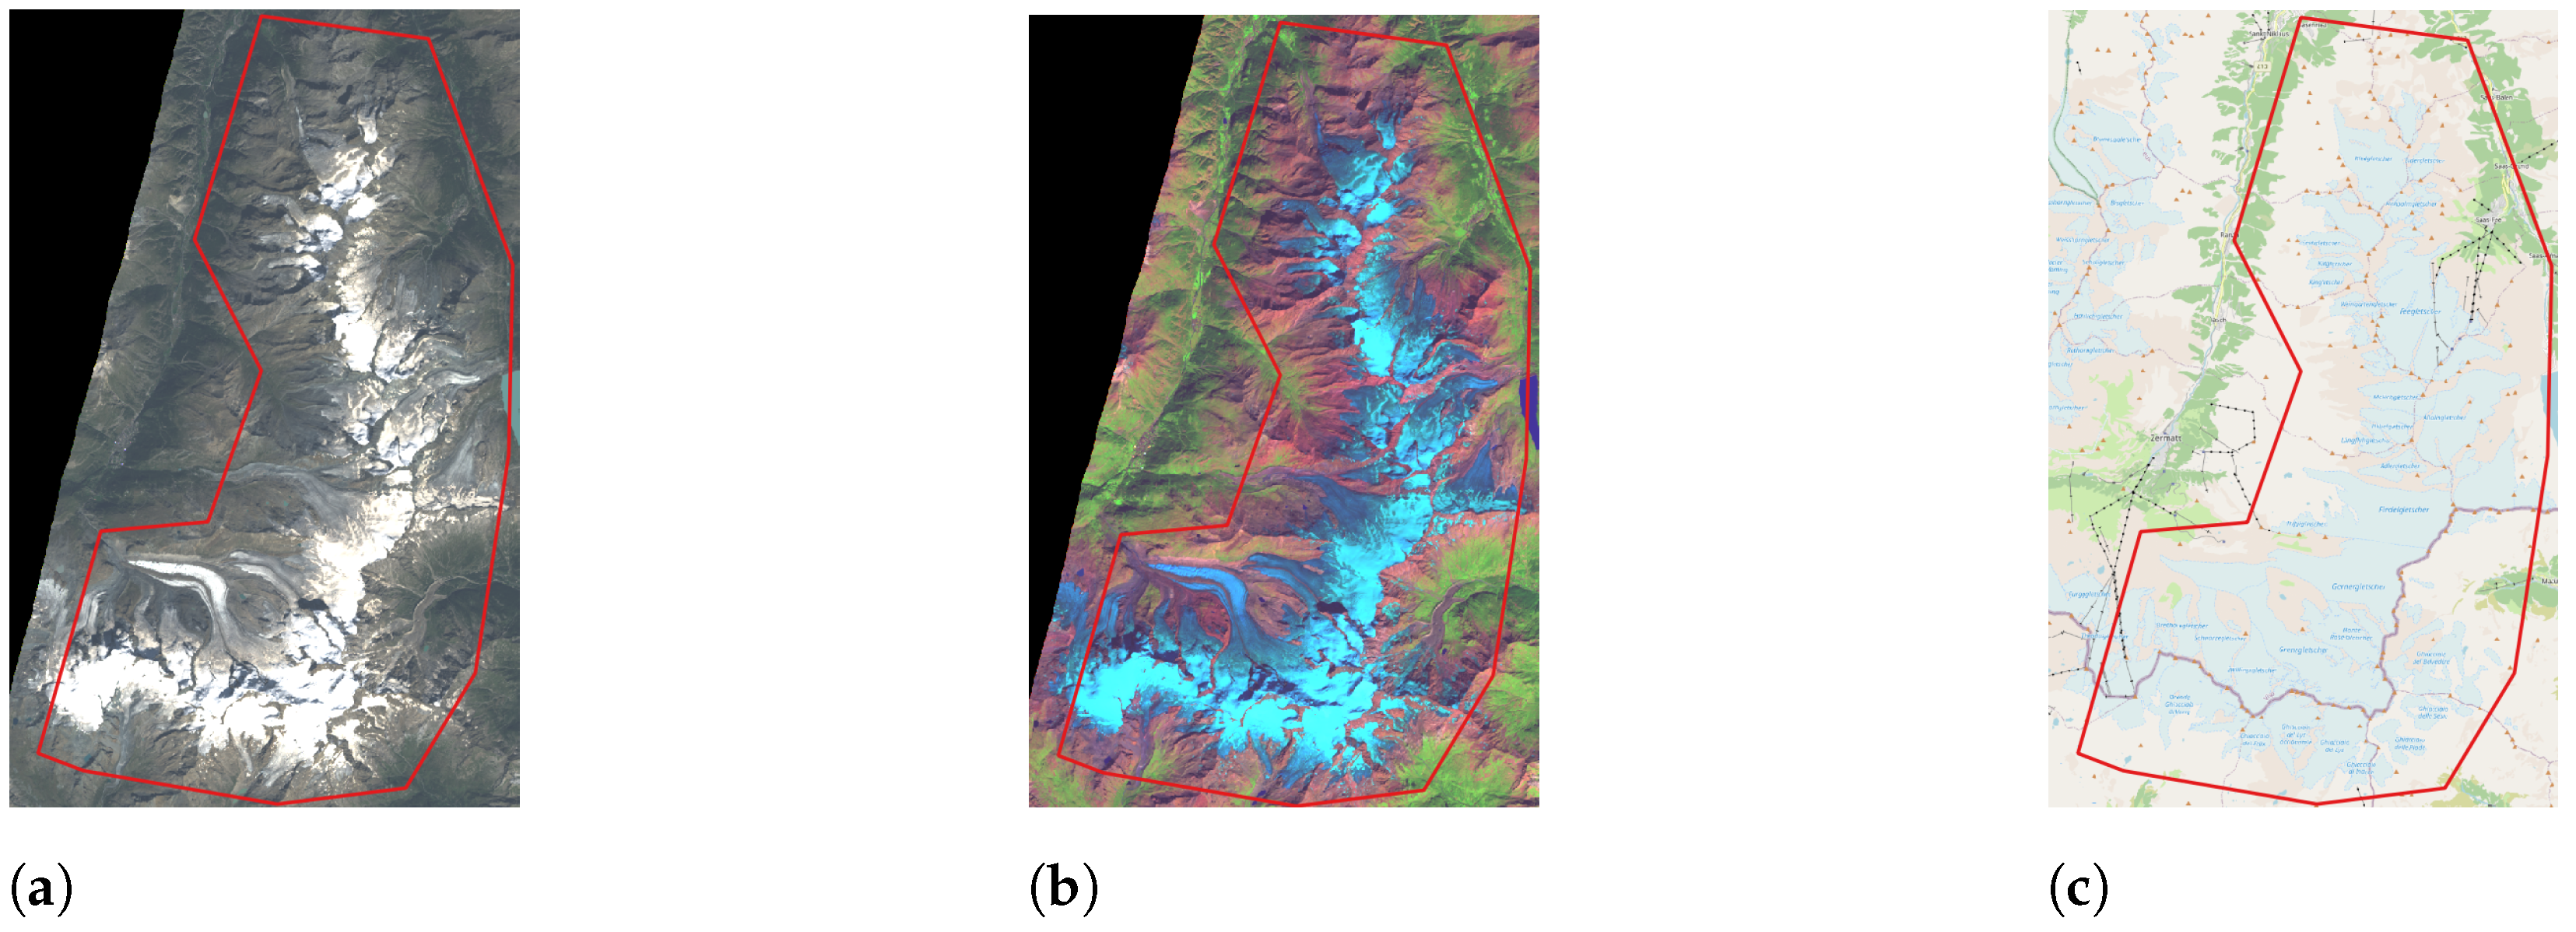
Figure 2.
General flowchart of the proposed method.

Figure 3.
Spectral signatures of glacier ice, different types of snow and thick clouds for the optical to shortwave infrared domain, adapted from [16]. Each box represents the spectral range covered by each band of the Landsat 8 OLI, and the boxes number refers to the band number of the sensor.
Figure 3.
Spectral signatures of glacier ice, different types of snow and thick clouds for the optical to shortwave infrared domain, adapted from [16]. Each box represents the spectral range covered by each band of the Landsat 8 OLI, and the boxes number refers to the band number of the sensor.
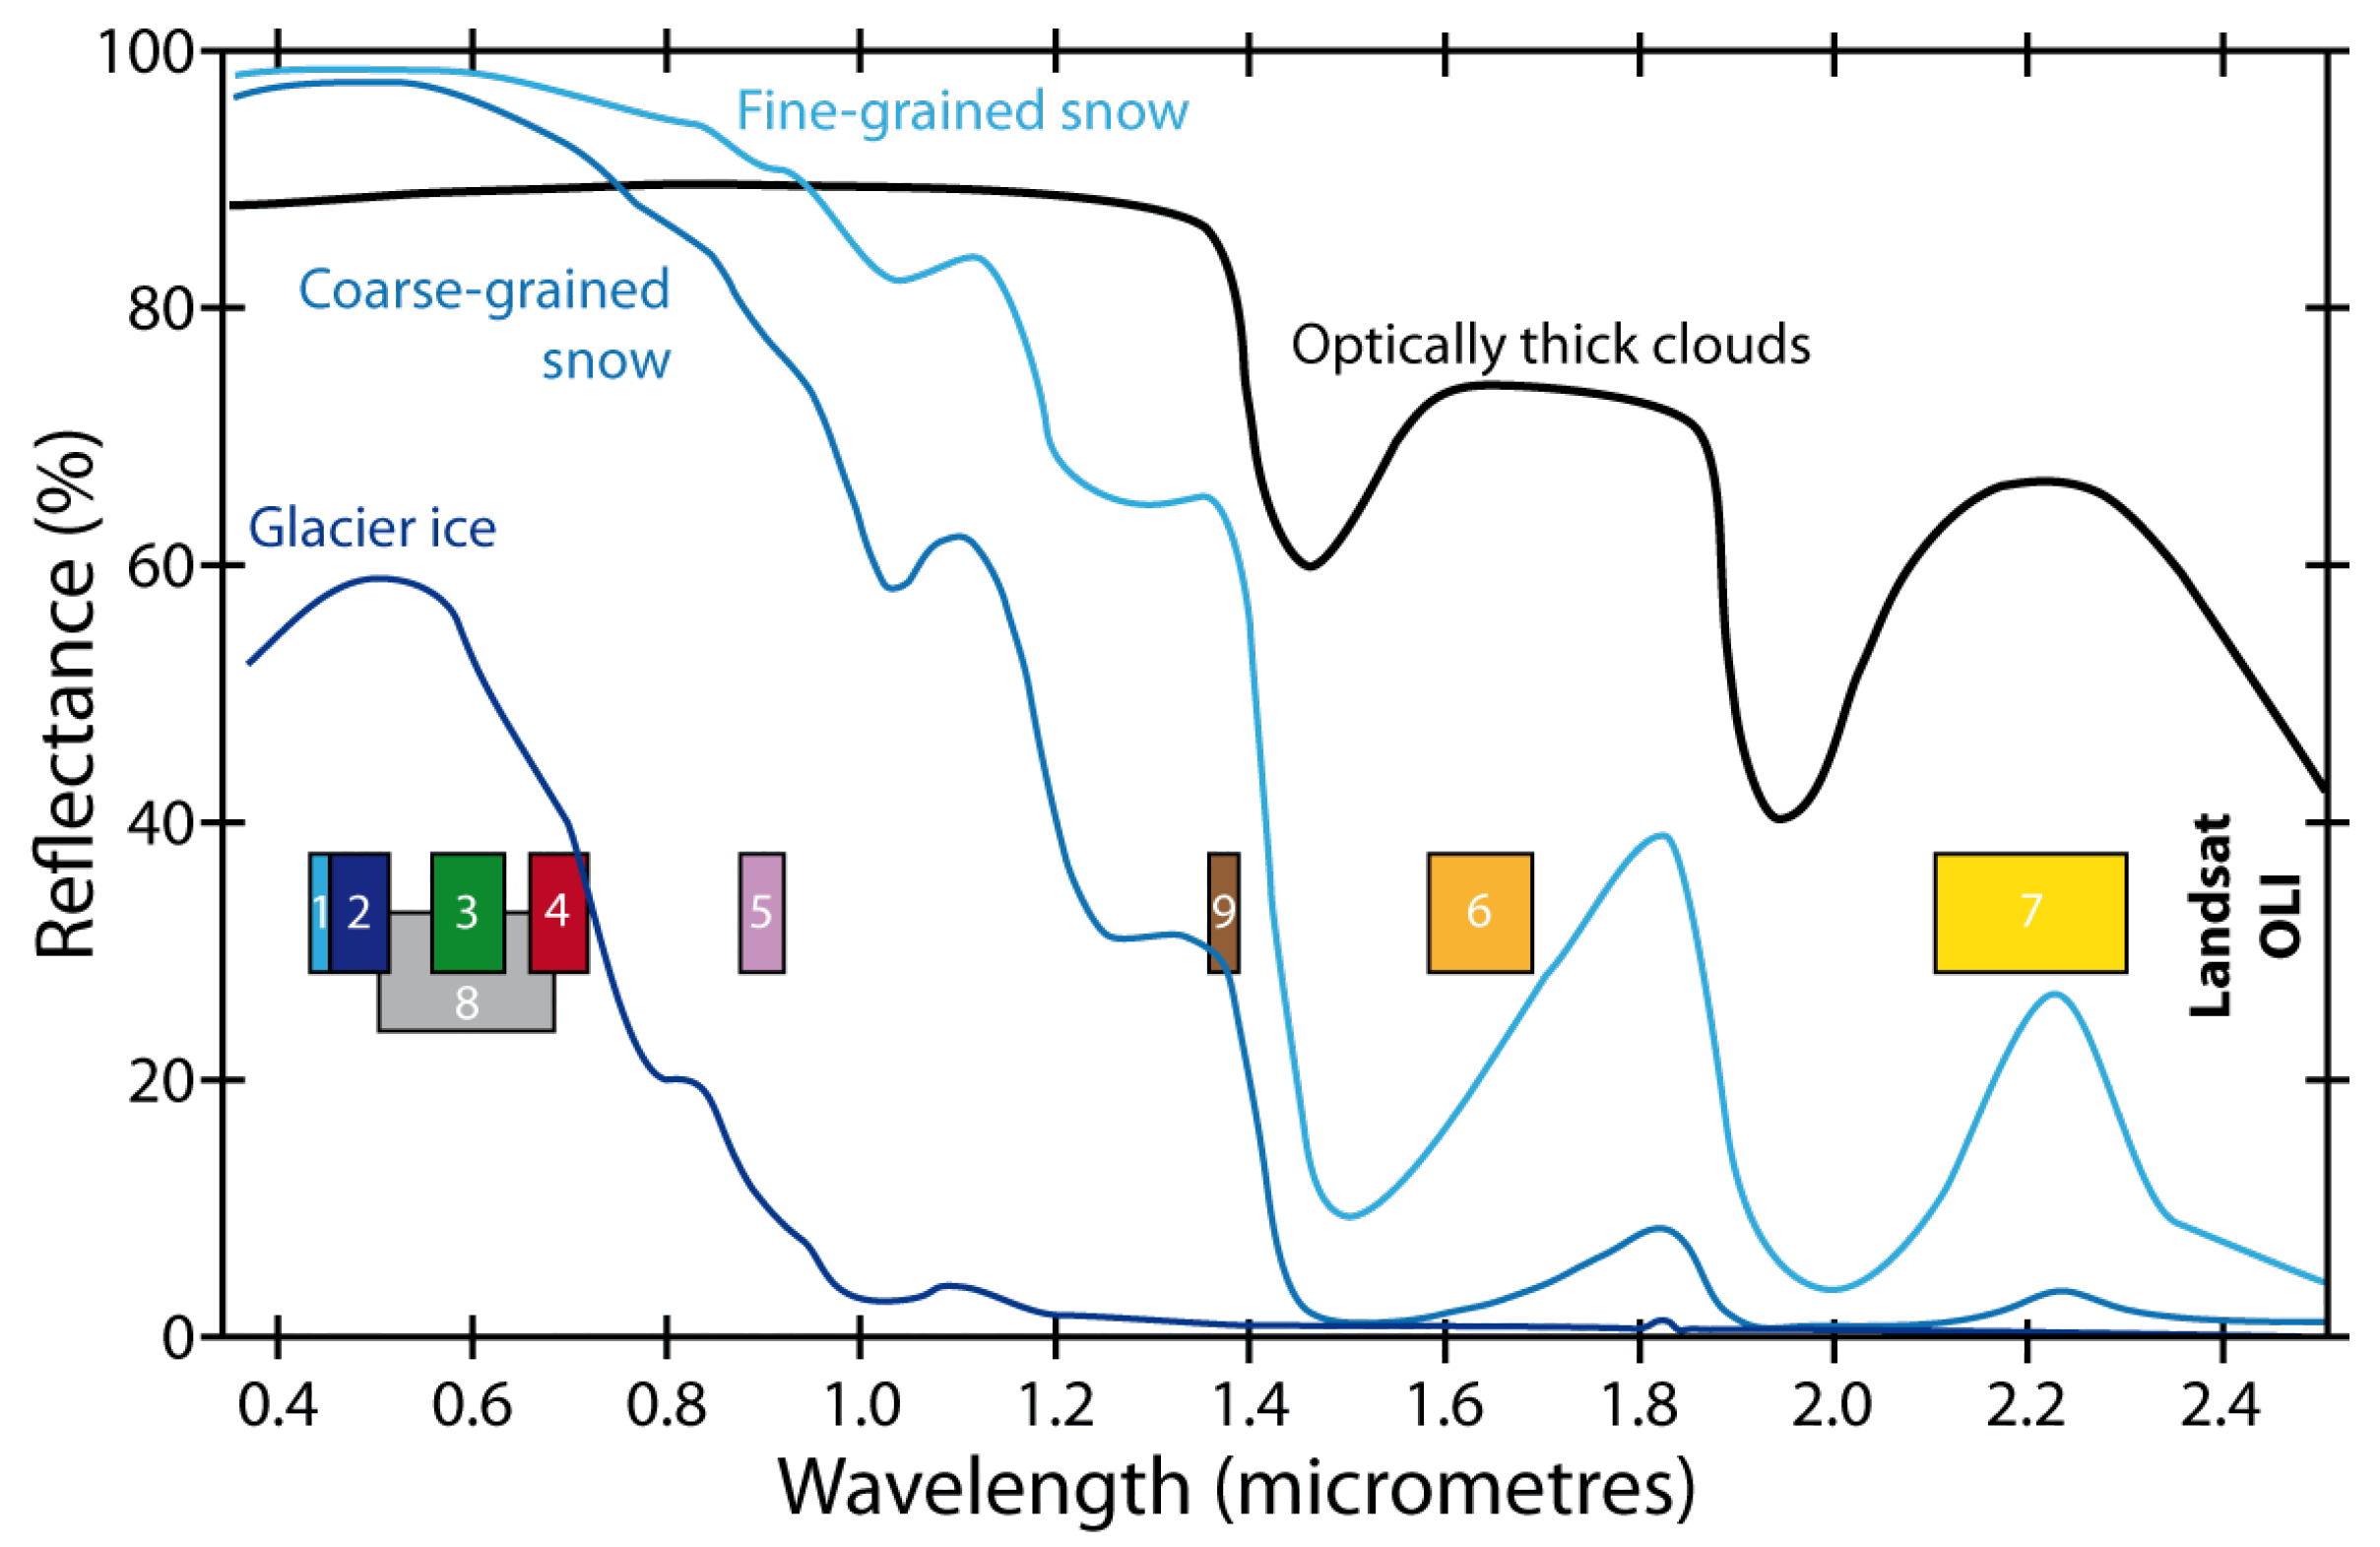
Figure 4.
Example of a Landsat 8 scene used to build our data set. For each scene, snow and ice areas are designated with shape files (here illustrated with the red polygons) hand-edited from a false color Green/NIR/SWIR representation. The light blue area (top of the image) is snow, and the darker area (bottom of the image) is ice.

Figure 5.
(a) Patchy distribution of SC on Kesselwandferner (photo by Christian Engl, 1 July 2007). (b) Classified SC distribution for similar snow conditions (11 August 1990). The usage of only one elevation bin (red arrow) for snow line altitude (SLA) determination could be erroneous, as the SC in one elevation bin is greater than 50%. The green arrow indicates the correct bin to derive the SLA. Figure reproduced from [17].

Figure 6.
The point cloud represents the selected bin, and the x and y axes are the coordinates of the bins within the study image. On the left is a 4th-order polynomial regression of the elevation bin given the X coordinates; this regression is ineffective and achieves a low R-score. On the right is a 4D polynomial regression of the bins given the Y coordinates; this regression is effective and achieves a better R-score than the first approximation. We then use it for the active contour initialization.

Figure 7.
A representation on a Green/NIR/SWIR spectral band combination of the southern side of the Mont Rose area with the initialized snow line, with a 4-dimensional polynomial in black, the result of the active contour detection in red, and the 3 September 2019 ground truth snow line in purple.
Figure 7.
A representation on a Green/NIR/SWIR spectral band combination of the southern side of the Mont Rose area with the initialized snow line, with a 4-dimensional polynomial in black, the result of the active contour detection in red, and the 3 September 2019 ground truth snow line in purple.

Figure 8.
Illustration of a snow line detection over the Lys Glacier, southern side of Mont Rose (3 September 2019). The snow line is in purple. (a) Green/NIR/SWIR combination of the study area. (b) Classification of snow (in blue) and ice (in grey) with an SVM (linear kernel). (c) Resulting gradient computing.

Figure 9.
Illustration of a corrected snow line detection over the Lys Glacier, where the corrected snow line does not contains the gradient of the packs of ice around the snow part of the glacier that were removed with respect to their elevation. (a) Histogram of the elevation values of the classification map’s gradient of the Lys Glacier; the red line is the selected threshold by the Otsu method [49]. (b) Resulting gradient of the classification map of the Lys Glacier of Lys overlaid on a Green/NIR/SWIR spectral bands combination. (c) Corrected gradient thresholded by its elevation value with regard to the detected Otsu threshold. Purple line in (b,c) is the ground truth snow line.

Figure 10.
Illustration of a glacier extraction operation over the Mer de Glace. (a) TCI of Mer de Glace. (b) Green/NIR/SWIR spectral band combination image of Mer de Glace. (c) Shadows pixel classification over Mer de Glace, shadows are mapped in black, in white is the resulting mask to apply to remove shadows. (d) Glaciers’ pixel classification over the Mer de Glace. Glaciers are mapped in white and used as a mask to isolate pixels of ice and snow for the ice and snow extraction process.

Figure 11.
Active contour snow line detection algorithm performance over the ground truth for the 3 September 2019 Landsat 8 scene. (a) Ground truth snow line altitude vs. active contour approach with a random forest classification snow mapping SLA. (b) Ground truth snow line altitude vs. active contour approach with a random forest regression snow mapping SLA. (c) Ground truth snow line altitude vs. active contour approach with a SVM and linear kernel snow mapping SLA. (d) Ground truth snow line altitude vs. active contour approach with a SVM and Gaussian kernel snow mapping SLA. (e) Ground truth snow line altitude (SLA) vs. active contour approach with a neural network snow mapping SLA.

Figure 12.
No bins approach algorithm performance over the ground truth for the 3 September 2019 Landsat 8 scene. (a) Ground truth SLA vs. no bins and RF classification. (b) Ground truth SLA vs. no bins and RF regression. (c) Ground truth SLA vs. no bins and SVM and linear kernel classification. (d) Ground truth SLA vs. no bins and SVM and Gaussian kernel classification. (e) Ground truth SLA vs. no bins and SVM and neural network classification.

Figure 13.
Two glaciers were discarded from our study (yellow outlines), the Ghiacciaio di Belvedere (right) and a small overhanging glacier in the north face of the central Breithorn peak (left).
Figure 13.
Two glaciers were discarded from our study (yellow outlines), the Ghiacciaio di Belvedere (right) and a small overhanging glacier in the north face of the central Breithorn peak (left).

Figure 14.
Example of glaciers discarded from our study due to a too chaotic zone where the SLA can be found. The ground truth snow line is in purple.
Figure 14.
Example of glaciers discarded from our study due to a too chaotic zone where the SLA can be found. The ground truth snow line is in purple.

Table 1.
OLI and TIRS bands description, information gathered from [21]. The visible part of the electromagnetic spectrum is covered by bands 1–4 and 8 with a ground resolution of 30 m, except for bands 8 that has a resolution of 15 m. The NIR is covered by band 5 with a resolution of 30 m. The SWIR is covered by bands 6 and 7 with a resolution of 30 m. The thermal bands 10 and 11 have a resolution of 100 m on the ground.
| Name and Resolution (m) | Spectral Range m | Band Number |
|---|---|---|
| Coastal/Aerosol (30 m) | 0.435–0.451 | Band 1 |
| Blue (30 m) | 0.452–0.512 | Band 2 |
| Green (30 m) | 0.533–0.590 | Band 3 |
| Red (30 m) | 0.636–0.673 | Band 4 |
| Near InfraRed (NIR) (30 m) | 0.851–0.879 | Band 5 |
| Short Wave InfraRed 1 (SWIR 1) (30 m) | 1.566–1.651 | Band 6 |
| SWIR 2 (30 m) | 2.107–2.294 | Band 7 |
| Panchromatic (15 m) | 0.503–0.676 | Band 8 |
| Cirrus (30 m) | 1.363–1.384 | Band 9 |
| Long InfraRed 1 (100 m) | 10.60–11.19 | Band 10 |
| Long InfraRed 2 (100 m) | 11.50–12.51 | Band 11 |
Table 2.
Different data sets used in this article. Around 600,000 pixels were labeled.
| Detection Task | Size (in Pixels) | Expert Verification |
|---|---|---|
| Ice and snow extraction | 270,000 | Yes |
| Glacier extraction | 200,000 | Yes |
| Mountain shadow extraction | 140,000 | Yes |
Table 3.
Landsat 8 product used for model’s ground-truth data labeling.
| Acquisition Date | Path | Row |
|---|---|---|
| 28 September 2014 | 195 | 28 |
| 28 September 2014 | 195 | 29 |
| 5 September 2020 | 194 | 28 |
| 24 November 2020 | 194 | 28 |
Table 4.
Performance of the models used for the ice vs. snow detection task obtained from a random testing subset of the data set built for the ice and snow detection task (Table 2).
Table 4.
Performance of the models used for the ice vs. snow detection task obtained from a random testing subset of the data set built for the ice and snow detection task (Table 2).
| Model | F1-Score | Accuracy (in %) |
|---|---|---|
| Feed forward neural network | 0.98 | 98.0 |
| SVM linear kernel | 0.98 | 98.7 |
| SVM Gaussian kernel | 0.99 | 99.0 |
| Random forest | 1 | 99.8 |
Publisher’s Note: MDPI stays neutral with regard to jurisdictional claims in published maps and institutional affiliations. |
© 2022 by the authors. Licensee MDPI, Basel, Switzerland. This article is an open access article distributed under the terms and conditions of the Creative Commons Attribution (CC BY) license (https://creativecommons.org/licenses/by/4.0/).
Share and Cite
MDPI and ACS Style
Prieur, C.; Rabatel, A.; Thomas, J.-B.; Farup, I.; Chanussot, J. Machine Learning Approaches to Automatically Detect Glacier Snow Lines on Multi-Spectral Satellite Images. Remote Sens. 2022, 14, 3868. https://doi.org/10.3390/rs14163868
AMA Style
Prieur C, Rabatel A, Thomas J-B, Farup I, Chanussot J. Machine Learning Approaches to Automatically Detect Glacier Snow Lines on Multi-Spectral Satellite Images. Remote Sensing. 2022; 14(16):3868. https://doi.org/10.3390/rs14163868
Chicago/Turabian StylePrieur, Colin, Antoine Rabatel, Jean-Baptiste Thomas, Ivar Farup, and Jocelyn Chanussot. 2022. "Machine Learning Approaches to Automatically Detect Glacier Snow Lines on Multi-Spectral Satellite Images" Remote Sensing 14, no. 16: 3868. https://doi.org/10.3390/rs14163868
Note that from the first issue of 2016, this journal uses article numbers instead of page numbers. See further details here.