
Mapping Dynamic Turbidity Maximum Zone of the Yellow River Estuary from 38 Years of Landsat Imagery


1
Key Laboratory of Submarine Geosciences and Prospecting Technology, Ministry of Education, Institute of Estuarine and Coastal Zone, College of Marine Geosciences, Ocean University of China, Qingdao 266100, China
2
Laboratory of Marine Geology, Qingdao National Laboratory for Marine Science and Technology, Qingdao 266061, China
3
State Key Laboratory of Geodesy and Earth’s Dynamics, Innovation Academy for Precision Measurement Science and Technology, Chinese Academy of Sciences, Wuhan 430077, China
4
State Key Laboratory of Estuarine and Coastal Research, East China Normal University, Shanghai 200062, China
5
Frontiers Science Center for Deep Ocean Multispheres and Earth System (FDOMES), Key Laboratory of Physical Oceanography, Institute for Advanced Ocean Studies, Ocean University of China, Qingdao 266100, China
6
College of Geological Engineering and Geomatics, Chang’an University, Xi’an 710054, China
*
Author to whom correspondence should be addressed.
Remote Sens. 2022, 14(15), 3782; https://doi.org/10.3390/rs14153782
Submission received: 23 June 2022
/
Revised: 28 July 2022
/
Accepted: 3 August 2022
/
Published: 6 August 2022
(This article belongs to the Special Issue Remote Sensing Observation on Coastal Change)
Abstract
:Turbidity maximum zone (TMZ) plays a crucial role in estuarine ecosystems, exerting effects on erosion, environment evolution and socioeconomic activities in the coastal area. However, the long-term understanding of the TMZ in large river estuary such as the Yellow River estuary is still lacking. In this study, we focus on the TMZ distribution, variation and regulation mechanisms in the Yellow River estuary from different time scales. Based on time series Landsat images during the period 1984 to 2021 and Google Earth Engine (GEE), we proposed a TMZ extracting method in the Yellow River estuary to generate 322 TMZ maps. The overall accuracy of our algorithm reached 97.4%. The results show that there are clear decadal and seasonal TMZ variations during the 38-year period in the Yellow River estuary. Morphology, currents and wind speeds combined with seawater stratification have direct effects on TMZ at different time scales, while the direct impacts of tides and fluvial output of the Yellow River on TMZ are limited. In this article, the highly robust method provides a cost-effective alternative to accurately map the TMZ in global large river estuaries and systematically reveals the spatiotemporal evolution of TMZ, shedding light on the response mechanism of coastal geomorphology, marine ecological environment and biogeochemical cycle.

1. Introduction
As the feedback of complex interactions among hydrodynamics, sediment transport and morphodynamics [1], turbidity maximum zone (TMZ) is the region within an estuary where the suspended sediment concentration (SSC) is much higher than that in surrounding waters [2,3]. The suspended sediment dynamics in the TMZ plays an important role in estuarine ecosystems and biogeochemical cycles [4], affecting the light propagation in water [5] and transportation of nutrients and pollutants [6], exerting influences on erosion and biotic community in the coastal fringe. It also has socioeconomic implications, such as the impact on coastal engineering stability and production activities [7,8]. Thus, to sustain its ecological and social services, it is critical to identify the extent, formation and variation of TMZ.
The Yellow River has been ranked the second largest sediment-laden river in the world [9] and is well-known for its frequent channel migrations in history. The large amount river outflow into sea causes huge carbon flux and strongly affects the marine environment in the river estuary [10]. Meanwhile, as the generalization of highly turbid water, TMZ could reflect the status of sediment dynamics. Studies on the TMZ in global large river estuaries, such as the Yellow River estuary, have significant scientific implications in promoting cycles of carbon, oxygen and nutrients in coastal and surrounding sea areas [11].
The spatial and temporal variation of estuarine SSC is drastic. This heterogeneity makes it difficult for in situ monitoring to obtain a synoptic view of estuarine SSC and TMZ [12]. Remote sensing methods based on satellite imagery have the advantages of large monitoring extent and regular revisit period. Ocean color satellite sensors, such as Moderate Resolution Imaging Spectroradiometer (MODIS), Medium Resolution Imaging Spectrometer (MERIS) and Geostationary Ocean Color Imager (GOCI), have been widely utilized in estuarine turbidity monitoring [12,13,14,15]. Nevertheless, the coarse spatial resolution (250 m to 1 km) of these sensors is incompetent in capture the detailed information of SSC in relatively small areas such as estuaries [12]. Thus, the higher spatial resolution of 30 m for Landsat sensors makes them more suitable in estuary application [16].
Both SSC and suspended particulate matter (SPM) are important aspects of water turbidity. SSC or SPM assessment based on satellite imagery have been carried out in the Yellow River estuary in recent years [15,17,18,19,20,21,22], identifying their pattern and influencing factors. By means of developing model from in situ data, the SSC in the Yellow River estuary was retrieved [17,19,21]. Interannual and seasonal variations plus spatial distributions of SSC in the Yellow River estuary from 2000 to 2010 were investigated, showing the strong influence of the Yellow River sediment output on the estuary [17]. Correlation analysis revealed that wind speed reduction was critical in the decreasing trend of SSC from 2003 to 2016 in the Yellow River estuary [21]. In addition, SPM in the Yellow River estuary was also estimated from tuned model [18,20,22]. The SPM variance in dry and wet seasons has been observed during 2013 to 2016 [18] and hourly river mouth SPM dynamics has been explored [20]. Using a clustering method, Wang et al. [15] further identified six turbidity patterns. Using time series satellite images, Li et al. [22] studied the spatiotemporal dynamics of SPM in the Yellow River estuary from 1997 to 2018. However, all these studies did not extract the extent of TMZ and did not treat TMZ as an integral phenomenon.
The retrieval model requires cruise data, which needs much financial support and labor power. Theoretically, in consideration of the high variability of sediment dynamics, retrieval model demands concurrent field samplings and satellite overpass, while this is almost impossible [13]. Moreover, signals of satellite sensor bands could saturate in high turbidity waters [23], resulting unreliable retrieval model results. In addition, current remote sensing sediment dynamics studies in the Yellow River estuary rarely utilize images for more than 30 years, prohibiting the understanding from a larger picture. Finally, the regulation mechanism of sediment dynamics has not been thoroughly understood and is not unanimous [21].
TMZ has been systematically studied in other estuaries around the world [8]. However, long time series patterns and mechanisms of TMZ in the Yellow River estuary are not clear at present. It needs to be noted that the relatively broad TMZ range in the Yellow River estuary makes it closer to the coastal turbidity maximum. To solve this problem, there are two clear obstacles: a high computing power demand for efficient large amounts of images procession and a robust TMZ extraction algorithm. Google Earth Engine (GEE) is a cloud-based platform that possesses massive computational capabilities and archives multi-petabyte analysis-ready data with an intrinsically parallel computation service [24]. The Landsat images and computing power of GEE could greatly facilitate the long time series TMZ research.
Considering these challenges, we aim to develop a long time series TMZ extracting algorithm based on Landsat images using GEE. This algorithm can avoid the dependence on field data and model development with high efficiency and reproductivity. Then, we will investigate the time series variation, decadal and seasonal pattern of TMZ from 1984 to 2021 in the Yellow River estuary. In addition, we will also discuss the various interactive factors affecting TMZ distribution at different time scales.
2. Materials and Methods
2.1. Study Area
With a length of 5464 km, the Yellow River originates from the northern Qinghai-Tibetan plateau and meanders eastward before entering into the Bohai Sea [25] (Figure 1). In history, about 1.64 × 10⁹ tons of sediment and 5.74 × 10¹⁰ m3 of freshwater were discharged into the Bohai Sea annually, accounting for approximately 90% of sediment and 50–60% freshwater the Bohai Sea received [18,26]. The currently active Yellow River Delta (YRD) has been quickly built since the diversion of the Yellow River from the Diaokou course to the Qingshuigou course in 1976. In addition, to facilitate the construction of local oilfields, the river channel was slightly redirected to the current Qing 8 course in 1996 [25]. Sediments discharged from the Yellow River mouth tend to migrate southward [27].
The Yellow River estuary belongs to the temperate monsoon climate zone. Weak southerly winds prevail in summer, while frequent strong northly winds dominate in winter [20]. Furthermore, most local waves belong to wind waves and thus have clear seasonal variability. This microtidal estuary is dominated by an irregular semi-diurnal tide, with an average tidal range of 0.6 to 0.8 m at the river mouth and 1.5 to 2.0 m in the Laizhou Bay [28]. The water depth of Laizhou Bay is less than 15 m. More than half of it is shallower than 10 m, especially along the coast [29]. In general, currents off the Yellow River estuary head south [18]. Most suspended sediments of the Yellow River estuary are clay, silt and fine sand. Since the channel diversion in 1976, most of these riverine sediments have been deposited in Laizhou Bay [19].
2.2. Datasets
2.2.1. Landsat Images
Currently, the Landsat surface reflectance dataset on GEE comes from five Landsat satellites: Landsat 4, 5, 7, 8 and 9. They have been successively launched from 1982 to 2021, carrying Thematic Mapper (TM), TM, Enhanced Thematic Mapper Plus (ETM+), Operational Land Imager (OLI) and OLI-2 sensors, respectively. The Landsat series run around the same sun-synchronous track, which means two satellites in orbit at a given time could achieve an 8-day revisit frequency [30]. The Landsat 4, 5, 7, 8 and 9 share the same global notation system (Worldwide Reference System-2) and take advantage of the similar Path/Row system. All the spectral mappers or imagers loaded on these satellites could achieve a 30 m spatial resolution in red, green, blue and NIR bands.
GEE archives the whole Landsat time series surface reflectance images. In addition, the surface reflectance data of Landsat 4, 5, 7, 8 and 9 has been thoroughly pre-processed on GEE [24], which makes them analysis-ready. In this study, we used the tile of Path 121 and Row 34, since this tile could entirely cover the study area. In total, 761 Landsat images acquired during the period 1984–2021 were processed for water–land boundary generating, including Landsat 4 (2 images), 5 (325 images), 7 (299 images), 8 (133 images) and 9 (2 images). After screening, we obtained 322 dense cloud and cloud-shadow-free Collection-1 Landsat images from 1984 to 2021 for TMZ mapping, including Landsat 4, 5, 7 and 8 (Figure 2). The whole procedures of Landsat data processing were implemented on GEE.
2.2.2. Tide Data
As shown in Figure 1, the tide height data at two tidal stations, namely Yangjiaogou (abandoned in 2011) and Weifanggang (2011 to present), were obtained from tide tables published by National Marine Data and Information Service (http://global-tide.nmdis.org.cn/, accessed on 1 June 2022). The tidal datum has been united to 107 cm below mean sea level.
2.2.3. Water Discharge and Sediment Load
The runoff and sediment load data of the Yellow River to the sea are recorded at the Lijin gauging station (Figure 1), which is the closest main hydrometric station to the Yellow River estuary (about 100 km upstream the estuary). These data were collected from the Yellow River Sediment Bulletin published by the Yellow River Conservancy Commission of the Ministry of Water Resources (http://www.yrcc.gov.cn/, accessed on 31 May 2022).
2.2.4. Wind Speed Data
The wind speed data were obtained from the fifth generation European Centre for Medium-Range Weather Forecasts reanalysis for the global climate and weather (ERA5), with temporal resolution of 1 h and spatial resolution of 0.25° × 0.25° (https://cds.climate.copernicus.eu/, accessed on 3 June 2022).
Considering that the acquisition time of all Landsat images of Path 121 and Row 34 was centered at around 2:00 in UTC, we used the average wind speed during 1:00 to 2:59 in UTC in this study.
2.3. Methods
Our TMZ mapping algorithm was mainly composed of three parts: (1) high-quality images collection, (2) land–water separation and (3) TMZ extraction through red band thresholding (Figure 3).
2.3.1. High-Quality Imagery Selection
In this study, high-quality images mean images free of dense cloud and cloud shadows that could lead to severe ground information loss [31]. First, based on the ‘CLOUD_COVER’ property of Landsat images on GEE, the original image archive was filtered with the restriction of cloud cover less than 60% in the tile Path 121 Row 34 (Figure 3a). Then, these filtered images were clipped to the study area. These images were used for two purposes, that is, water–land boundary generation and TMZ delineating (Figure 3b).
For the water–land boundary generation, the bad-quality pixels with cloud and cloud shadows were masked out in images based on the quality assessment bands (QA bands). The QA bands were integrated in the Landsat surface reflectance dataset packaged by GEE, flagging bad-quality pixels. The derived cloud-masked images were ready for Normalized Difference Water Index (NDWI) compositing (Section 2.3.2).
For single-image TMZ delineating, images are required to be generally intact and free of cloud coverage. Within the extent of the study area, we managed to calculate the cloud and cloud shadow percentage through QA bands and limited this percentage to less than 10% through programming on GEE (Figure 3b). In addition, small cloud and cloud shadow patches were still masked out. The obtained images could be regarded as intact and clear images.
2.3.2. Land–Water Boundary Generation
The accuracy of TMZ mapping could be affected by inland features such as tidal flats, inland turbid water bodies and aquacultures, as they may share spectral characteristics with TMZ. Previous related studies often ignored the lowest tide line during long time periods in the Yellow River estuary [15,17,18,19], causing inland features (especially tidal flats) to be mixed into the sea water turbidity mapping results. Thus, to avoid misleading outcomes, it is crucial to mask out inland features before TMZ mapping.
Image compositing methods select suitable pixels for each pixel location from an image stack and can robustly generate composite images representing different tidal inundation statuses [32]. Tidal flats are non-vegetated areas between the highest and lowest tidal inundations [33]. The lowest tide composite images represent the largest land extent, which includes the whole tidal flats. Therefore, we used the lowest tide composite images to generate the land–water boundary, which could maximize the removal of inland features from sea waters.
Considering that the NDWI extremum composites have been successfully applied in representing the tidal inundation status, that is, maximum composite denotes the highest tide condition and the minimum composite denotes the lowest tide condition [32,33,34], we selected the NDWI minimum composites to derive the land–water boundaries. In light of the relatively low revisit frequency of Landsat satellites (16 days when alone in orbit), we referred to the scheme adopted by Murray et al. [34] in which the composites were derived from Landsat image stacks of every three years. From 1 January 1983–1 January 1986 to 1 January 2019–1 January 2022, 13 sets of Landsat image stack were built. To obtain 13 NDWI minimum composites, it is theoretically reasonable with all images in every image stack to composite the NDWI minimums into one image.
However, this method could accumulate lots of noise in the composite images [32,33]. Previous researchers have found positive relationships between the NDWI of tidal flat and tidal height [32]. Taking advantage of the time series tidal flat datasets beginning in 1984 (http://intertidal.app, accessed on 1 April 2022) [34], we flagged each Landsat image with the sum of NDWI value within the tidal flat regions and sorted them in ascending order. The top 20% ranked scenes were regarded as the low tide images [32]. The NDWI minimum composite image was generated through minimum NDWI compositing on these 20% images. In total, 13 composite images were derived. In this way, the occurrence of noise was greatly reduced in the results.
In order to separate land and water in the NDWI composites, the adaptive binary classification algorithm, namely the Otsu method [35], was applied. The Otsu method could automatically select the optimal dividing value of two categories and has shown good performance in separating land and water [33,36,37]. However, in a small portion of the study area, the Otsu-derived boundary could be ambiguous due to inland water and coastal aquacultures, so some minor adjustments were made to delineate the final land–water line (Figure 3b).
2.3.3. Red Band Thresholding
After clipping the imagery using the land–water boundary, only the sea water area was retained for TMZ mapping (Figure 3c). We tested random forest (RF) classifiers [38] to carry out a supervised classification of TMZ owning to its robustness in ground feature mapping [39].
The result showed that band 4 (red) has the highest importance in the process of RF classification (Figure S1b), meaning that it could act as a good proxy in TMZ delineating. The red band image also shares a similar pattern (especially the extent) with the TMZ within the sea area (Figure 3c). In addition, the red band has shown strong reliability and sensitivity in Case 2 water-turbidity-related mapping in previous studies [23,40,41,42]. Therefore, the red band was used in this study. Furthermore, to delineate the TMZ, proper thresholds were needed for different Landsat sensors.
Based on 15 random-selected and land-masked clear images (5 TM, 5 ETM+ and 5 OLI), we manually drew multiple polygon samples which contained only TMZ or other water area on the red band images. As a result, a total of nearly 4 × 107 pixels were selected to build the histogram in Figure 4. We found that the threshold 1400 could effectively identify TMZ from other water area on TM and ETM+, and the threshold 1300 could be applied on OLI (Figure 4). Thus, the TMZ was defined as red band >1400 on TM and ETM+ or red band >1300 on OLI.
The difference in thresholds was attributed to the different wavelength range of red bands on different sensors (0.63–0.69 μm for TM and ETM+, and 0.636–0.673 μm for OLI).
2.3.4. Accuracy Assessment
Firstly, all the derived 322 TMZ maps from the period 1984–2021 were checked using visual inspection. In general, the TMZ maps could reflect the real condition of TMZ in the Yellow River estuary very well despite its drastic variations during such a long time period.
We randomly selected 30 images to be applied to quantitatively accuracy assessments. These images involved various TMZ patterns, covered four seasons and roughly the whole study time period and included sensors of TM, ETM+ and OLI. The 30 images provided wide representation and could be used to reflect the accuracy of the whole. In total, 3552 validation samples were selected based on these images and divided into two categories, that is, ‘TMZ’ and ‘other’, with the number of 1746 and 1806, respectively (Figure 5). The confusion matrix of each image and entire samples was calculated (Table 1 and Table S1).
3. Results
3.1. Outcome of Evaluation
Through visual inspection of the full time series TMZ maps, our algorithm has high practicability and robustness in capturing the extent of TMZ (30 examples were displayed in Figure 5). Furthermore, all the overall accuracy (OA) of the random selected images have achieved more than 91%, most of which were higher than 95% (Table S1). In a holistic view, the integral OA of the complete 3552 samples was 97.4%, accompanied with high user accuracy (UA) and producer accuracy (PA) of ‘TMZ’ and ‘other’ categories (Table 1).
3.2. Time Series TMZ Maps
Time series TMZ extent results were analyzed in two aspects: area (Figure 6) and spatial pattern (Figure 7). For the spatial pattern, all derived TMZ maps in this study were composited based on seasons and years on GEE, as shown in Figure 7.
Notably, we did not stretch the 25 legends (the color bar) in Figure 7 to the same range. Theoretically, the range of TMZ occurrences during the same time spans should be approximately equivalent to each other. However, higher cloud cover in the wet season and the dynamic running status of Landsat constellation make it difficult to acquire a similar number of clear images during the same time spans (e.g., Figure 7u,v). Furthermore, the true TMZ occurrence pattern in one period does not necessarily depend on the absolute number of TMZ maps. In other words, due to the randomness of clear images, thin TMZ maps stacks could still generate a composite that reveals the true relative pattern of TMZ occurrences during that corresponding period. In addition, if all the ranges of legends in Figure 7 were adjusted to the same scale, then small-dataset composites (e.g., Figure 7a–e) may only exhibit one color, and their relative TMZ occurrence patterns would be completely phased out. Therefore, to better highlight the relative TMZ occurrence pattern during every selected period, the range of legends in Figure 7 was not scaled to the same but suited the actual ranges of every composite image instead.
3.2.1. Variation of Area
The area of TMZ in the Yellow River estuary has varied not only abruptly but cyclically from 1984 to 2021. The largest area of TMZ could reach 6360 km2 on 1 March 1992, while the smallest only covered an area of 1 km2 on Jul 16, 2001 (Figure 6). The amplitude of TMZ variation has also experienced evolution. Based on the amplitude, we divided the study period into four decadal periods: 1984–1989, 1990–1999, 2000–2009 and 2010–2021.
In general, the decadal average TMZ area presents an increasing momentum during 1984–2009 but declines sharply from 2010. From 2000 to 2009, the average TMZ area is 1785 km2, which ranked the highest among the four periods. The period 1990–1999 has an average TMZ area of 1682 km2, which is slightly lower than that of the period 2000–2009 and significantly higher than that of the period 1984–1989 (1011 km2) and 2010–2021 (1117 km2).
3.2.2. Decadal Variation
Figure 7y is a composite of all 322 TMZ maps, representing the overall TMZ spatial distribution. It reveals that TMZ occurred most frequently in an ovate area south of the Qing 8 course from 1984 to 2021. Furthermore, based on the four decadal periods mentioned above, another four TMZ occurrences images were composited (Figure 7e,j,o,t). The number of TMZ maps used in the TMZ map stacks to generate Figure 7e,j,o,t was 28, 73, 115 and 106, respectively. Compared with the other three periods, 28 maps of the period 1984–1989 were relatively sparse. This is caused by two factors. First, the period 1984–1989 is shorter than other periods. Additionally, during the period 1984 to 1989, Landsat 4 and Landsat 5 were in track at the same time. However, Landsat 4 TM just provided two images for this study (Figure 2) owing to its constant device failures.
In the period 1984–1989, TMZ mainly occurred along the coast of the YRD, and its extent was mostly limited to a narrow belt near the coast (Figure 7e). For the following 10 years, the TMZ significantly expanded its extent south of the Qingshuigou course (Figure 7j). Compared with the period 1990–1999, the TMZ in the period 2000–2009 increased in the southern part of the Yellow River mouth except for the landward intrusion, while it also extended further seaward following the Qing 8 course (Figure 7o). In the period 2010–2021, the TMZ appeared more frequently around the current Yellow River mouth, assembling in an ovate area surrounding the mouth of the Yellow River (Figure 7t).
3.2.3. Seasonal Variation
TMZ in the Yellow River estuary indicated clear seasonal variations. In both four decadal and overall periods, the maximum range and high occurrence area of TMZ in summer were the smallest (Figure 7b,g,l,q,v), with an average TMZ area of 364 km2 (Figure 8a). These two aspects of TMZ grew larger in spring (Figure 7a,f,k,p,u) and autumn (Figure 7c,h,m,r,w), with spring TMZ showing higher coverage than autumn TMZ (1357 km2 to 814 km2 in Figure 8a). Meanwhile, winter TMZ showed the largest pattern among four seasons in all time spans (Figure 7d,i,n,s,x), with an average TMZ area of up to 2730 km2 (Figure 8a). In general, the TMZ in the dry season was more active and stronger than that in the wet season. In addition, the spectrum analysis revealed the prominent one-year period (370 days) of time series TMZ area in Figure 8b, which confirmed the statistical significance of the TMZ seasonal dynamics.
4. Discussion
4.1. Water Discharge and Sediment Load of Yellow River
The riverine output of the Yellow River is an important source of sediment in the Laizhou Bay. Water discharge and sediment load of the Yellow River has shown decreasing trends during the period 1984 to 2002 (Figure 9a). In 2002, the water-sediment regulation scheme (WSRS) was initiated by the Yellow River Conservancy Committee (YWCC). After the WSRS, the variation tendencies of water and sediment began to depart from each other [43]. From 2002 to 2021, the water discharge remained relatively stable in general, while the sediment load had a downward trend (Figure 9a).
However, compared with water discharge and sediment load, the variation of yearly averaged TMZ area displayed quite a different pattern. Basically, the yearly TMZ area has experienced an increasing–stable–decreasing trend (Figure 6 and Figure 9b). The correlation coefficient for TMZ and water and TMZ and sediment was −0.27 and −0.15, respectively. It means that no robust correlation for TMZ and riverine output existed on the yearly and decadal time scale.
In addition, most of the Yellow River sediment deposited quickly in the region less than 15 km from the river mouth, limiting its direct impact on the estuary [21,28]. Furthermore, the seasonal trends of the riverine output of the Yellow River and the TMZ were not consistent. The water discharge and sediment load from the Yellow River to the sea mostly centered in summer and autumn both before and after the start of WSRS in 2002, yet the TMZ composite results indicated a much smaller TMZ in summer and autumn compared with that in spring and winter. In winter, the water discharge and sediment load of the Yellow River into the sea have not changed distinctly during recent decades [21], yet the area of TMZ has markedly reduced from the period 1990–1999 to the period 2010–2021 (Figure 6 and Figure 7i,n,s).
Before 2000, the huge water extraction and low precipitation resulted in the drying up of the Yellow River. Specifically, starting Feb 7, the no-flow days of the Yellow River even reached 226 days in 1997, causing extremely low water and sediment output to the sea (Figure 9). However, the TMZ still showed high vitality with relatively large extent even during the no-flow period in 1997 (Figure 6 and Figure 9).
The impact of the fluvial discharge of the Yellow River on the YRD and estuary is complex and systemic. The fluvial discharge of the Yellow River into the sea is the fundamental source of the suspended sediment in the Yellow River estuary, offering the prerequisite of the formation of TMZ. However, based on all the above-mentioned evidence, it can be concluded that the TMZ variation in the Yellow River estuary is not directedly related to the water discharge and sediment load of the Yellow River.
4.2. Morphology Evolution of Yellow River Mouth
In 1984, the river mouth was heading east–southeast (Figure 10a). Since 1984 to 1996, this lobe has prograded seaward, and the river mouth direction has turned to the southeast (Figure 10b). After 1996, the Qing 8 delta lobe began to develop, and the river mouth started to head northeast because of the artificial channel diversion (Figure 10c). In the meantime, the abandoned Qingshuigou lobe was beginning to retreat mainly because of sediment starvation [25]. Around 2007, bank bursting started to develop a new north heading branch despite the fact that the river mouth was still northeastward (Figure 10d). Those small branches have finally evolved into a northward river mouth by 2010 (Figure 10e). From 2010 to 2020, the northward river mouth has remained relatively stable except for the formation of a sub channel heading east (Figure 10f).
From the period 1984–1989 to the period 1990–1999, the intrusion of the Qingshuigou lobe was accompanied by the seaward retreat of TMZ (Figure 7e,j). From 2000 to 2021, the development of Qing 8 and the gradually north-turning of the river mouth resulted in the northward shifting of TMZ (Figure 7o,t). The TMZ extent south of the Qingshuigou lobe also decreased in general. TMZ was more inclined to appear in the shape of an oval (Figure 7t). Therefore, a morphology evolution of the Yellow River mouth has a clear impact on the TMZ pattern to a large extent.
4.3. Currents
In the long term, currents are the major driver of sediment transport in Laizhou Bay [18]. In recent years, the coastal dynamics have barely changed near the Yellow River mouth [44]. Model results and previous research have shown that coastal circulation off the estuary were normally directed south and kept a clockwise circulation south of the Yellow River mouth [15,18,45]. As for the tidal currents, they are low-velocity reciprocating flows transported northward during ebb tides and southward during flood tides, forming a swirling water body south of the Yellow River mouth [28].
However, the impact of tidal currents has been, on average, minor in the long term [18]. In addition, the tidal shear front, located near the river mouth, acted as a barrier to offshore transport of fluvial sediment [46]. The highest velocity of currents was found near the Yellow River mouth, and the velocity decreased southward and northward [18]. As a result, a large amount of riverine sediment was carried south and gathered around the south of the river mouth, while a minority has been transported northwest [15,18,19]. Therefore, it explained the fact that, in the long term, TMZ in the Yellow River estuary tends to gather around south of the river mouth, and only a small part of TMZ moves northwest along the coast (Figure 7e,j,o,t,y).
4.4. Wind Speeds
Wind is one of the main driving forces of sediment resuspension in shallow seas such as Laizhou Bay and has the ability to reach the seabed of Laizhou Bay [29]. Previous studies have shown that decadal turbidity changes in the Laizhou Bay were related to the long-term wind speed variation trend, especially the variation in winter. The seasonality of turbidity patterns was attributed to the seasonal variation of wind speeds. Weak wind in summer was related to low SSC, while strong wind in winter was related to high SSC [18,21]. In addition, the impact of wind direction on the long-term turbidity pattern variation was relatively small [21].
To further investigate the effect of wind speeds on TMZ distribution, we explored the relationship between every single TMZ area and its synchronous wind speed during 1984 to 2021. In general, the TMZ area tended to increase as the wind speed grew. In summer, wind was weaker, corresponding to a smaller TMZ. Larger TMZ corresponded to relatively stronger wind in winter (Figure 11). However, it should be noted that the TMZ area could still vary greatly at similar wind speed, especially in the range of 3 to 7 m/s (Figure 11a). A higher wind speed did not fully guarantee a larger TMZ area on a singular basis.
We divided the results into four groups based on four seasons (Figure 11b–e). In a holistic view, wind speeds in spring and winter are higher than those in summer and autumn. Therefore, the stronger wind in spring and winter caused a more violent resuspension of sediment, leading to a larger TMZ distribution (Figure 7u–x). Previous studies also confirmed the different impacts of wind strength on the sediment resuspension during wet and dry seasons [18,21,22]. However, these studies did not pay much attention to the different response behaviors of sediment suspension to wind in four seasons. In fact, the response sensitivity of TMZ area to wind speeds varied with seasons (Figure 11b–e). Most points were circled in ellipses that excluded outliers, and the slope of major axis of the ellipse could roughly reflect the response sensitivity of TMZ area to wind speeds. For example, the TMZ area in summer barely changed even though the wind speed was increasing and the slope of the major axis of that ellipse was the smallest among four seasons (Figure 11c). On the other hand, the TMZ area expanded rapidly with the increase in wind speeds in winter, and its major axis slope was almost the largest among four seasons (Figure 11e). The major axis slope of ellipses in spring and autumn followed the similar pattern with winter and summer, respectively (Figure 11b,d).
Seawater stratification is an important oceanographical phenomena, which impedes the vertical matter exchange in the sea. In summer, the water column was strongly stratified [47], hindering the wind resuspension of seabed sediment. In winter, the water column was vertically uniform [29], allowing the effect of wind to easily penetrate through seawater to stir the underlying sediments. Spring and autumn were the transition period between summer and winter. Therefore, it indicated that the stratification condition in different seasons caused different seasonal responses of TMZ to winds (Figure 11b–e). In addition, water column stratification could partly explain the weak correlation between TMZ area and wind speed, with an overall correlation of 0.4.
4.5. Tides
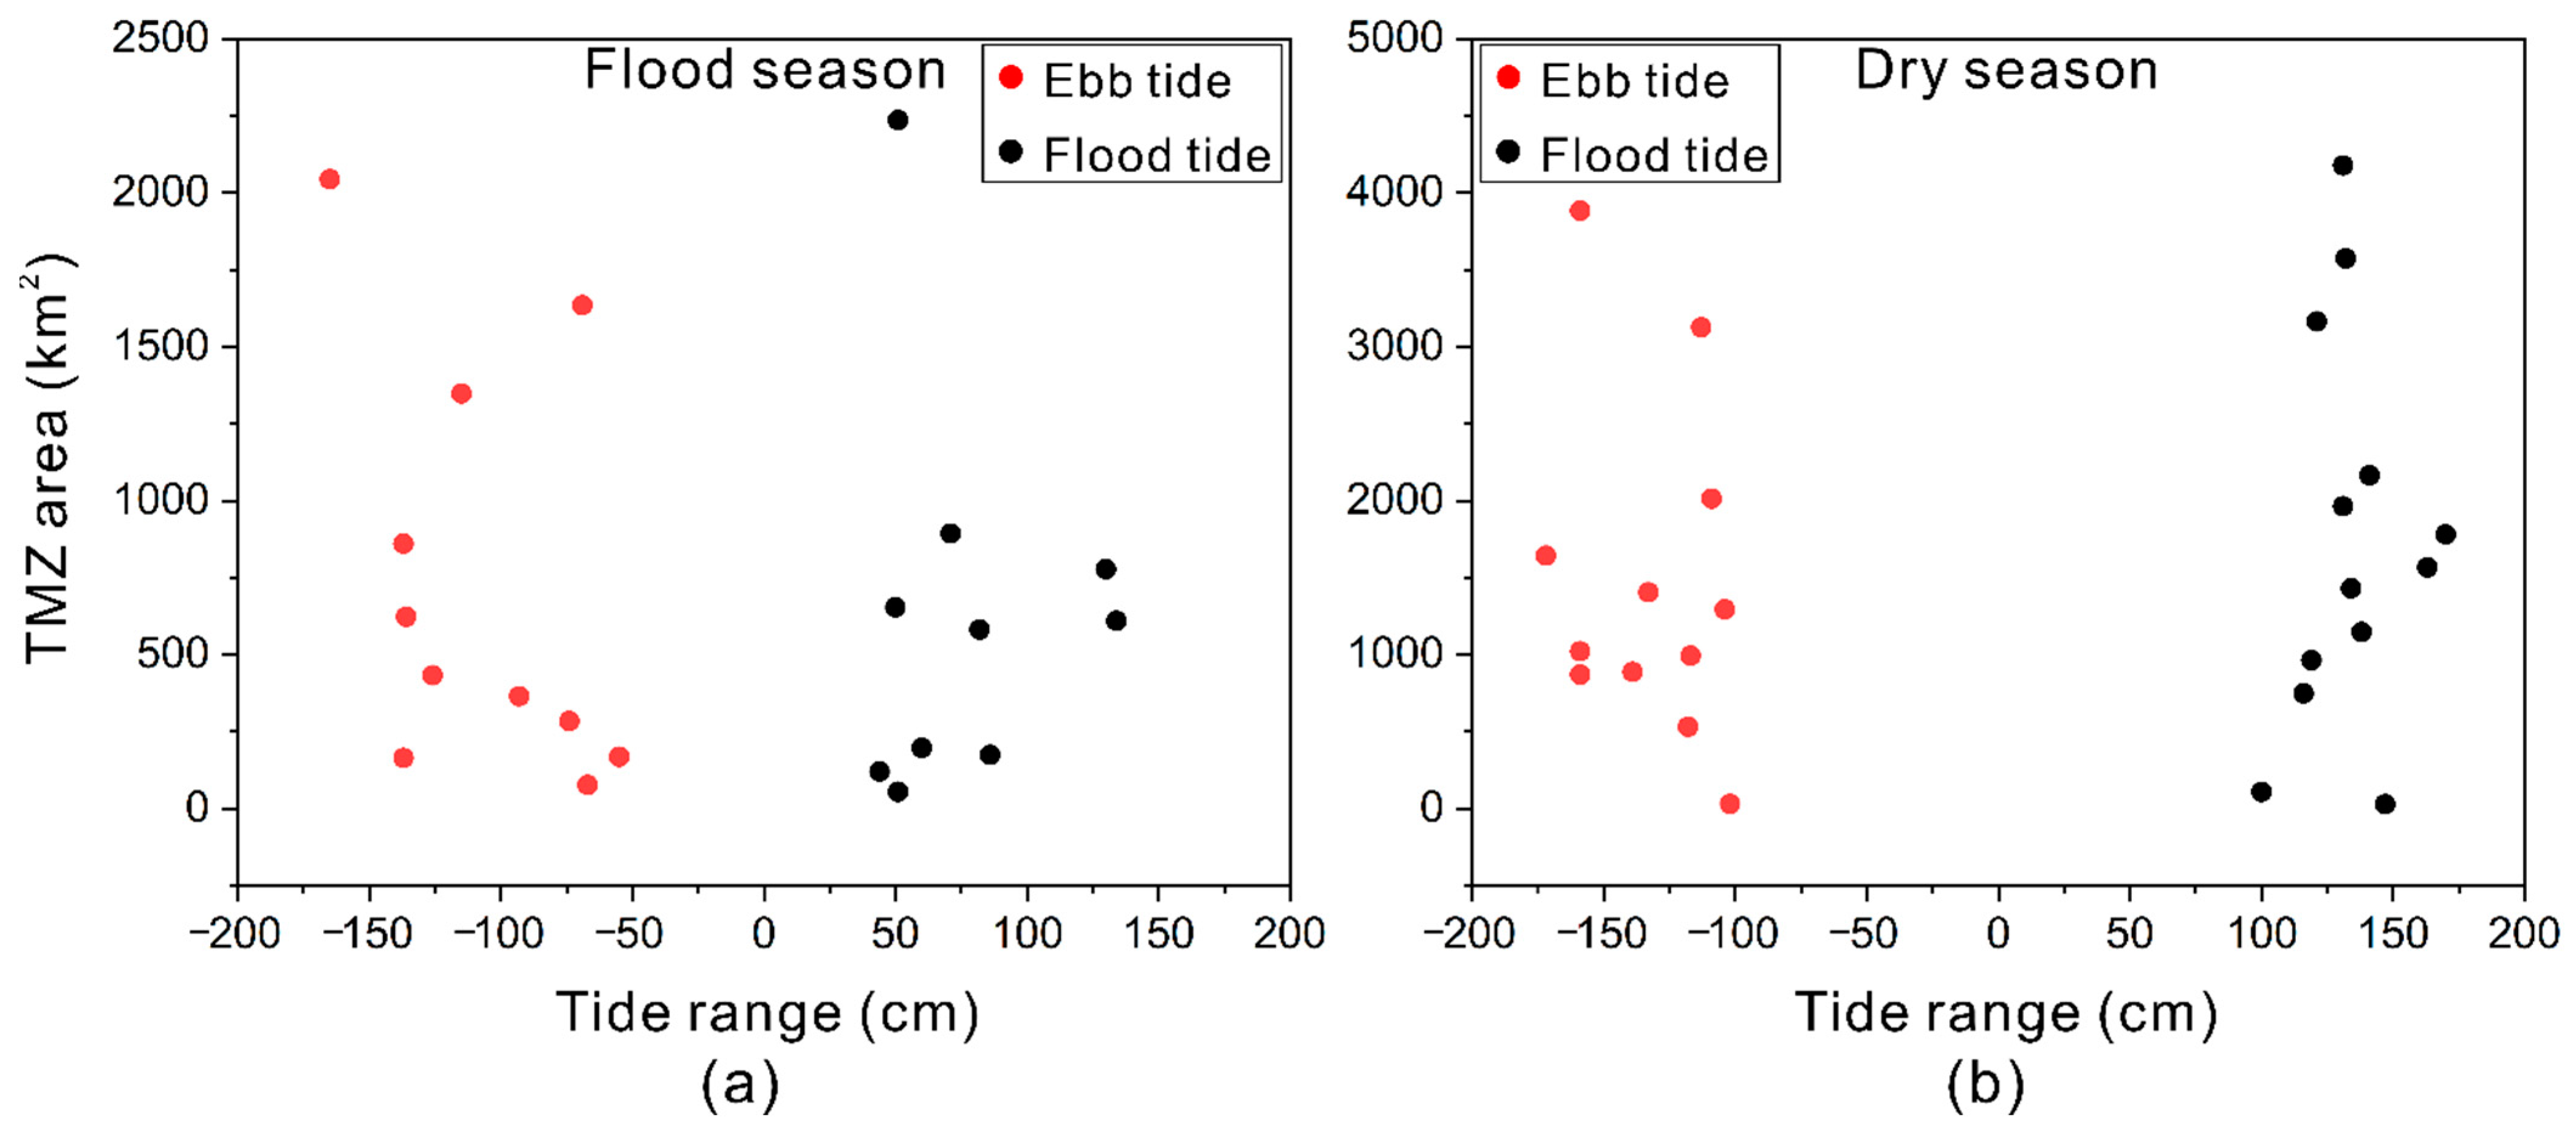
We find that TMZ area can still vary largely at similar wind speeds of 4–5 m/s within the same or similar seasons (Figure 11a). We further explored the relationship between tide and TMZ area under the circumstances that they were in similar seasons and wind speeds (Figure 12).
Under the influence of similar wind speeds and seasons, TMZ area did not display a clear correlation with tide, which has sharp contrast with the condition in the Yangtze estuary where tide could exert significant influences on TMZ extent [3,48]. Regardless of whether it was in flood season (summer and autumn) or in dry season (spring and winter), the TMZ area did not change linearly or quasi-linearly with the absolute value of tide range (Figure 12a,b). At the same time, there were no significant difference between the impact of ebb and flood tide on TMZ area (Figure 12a,b). This evidence suggests that tides were not the essential factor influencing the area of TMZ on a singular basis in the Yellow River estuary.
4.6. Limitations and Uncertainties
It should be noted that the scan line corrector (SLC)-off issue of Landsat 7 and haze contamination images could lead to inaccurate TMZ mapping. In 2003, the SLC on board Landsat 7 failed, resulting in intermittent pixels missing. Although gap filling methods existed [49], these artificial filling values may have created false detections considering the dynamic spatiotemporal variability of water. These techniques should be used with caution [50]. Haze is similar to thin cloud and mostly arises from water droplets, smog, dust and other particles, diming the scene clarity. Haze images accounted for a small portion of our ready-to-map imagery stacks. It is difficult to remove haze in satellite imagery without information distortion. Therefore, to avoid missing TMZ area count, we manually delineated the outline according to TMZ extraction results for SLC-off images. For haze contamination, its similar spectral property with TMZ in the red band tended to enlarge the TMZ extent. Thus, we modified the TMZ extraction results for haze images.
Previous studies utilized cruise data to validate the time series water turbidity results from remote sensing retrieval models [12,17,18]. Cruise data are often acquired at specific locations and during short time periods, meaning that cruise data could only validate limited derived results. Like these studies, we did not display and validate all the 322 TMZ maps, which may have limited the quality of accuracy assessment. However, 30 images used in the accuracy assessment were random selected, covered a variety of conditions and achieved a high overall accuracy, meaning that these images were representative of all the results.
The sediment discharge of the Yellow River into the sea was the foundation of TMZ formation, while the TMZ was not directly related to the fluvial output of the Yellow River. Morphology, currents, wind speeds and water column stratification were the main factors regulating the behavior of TMZ in the Yellow River estuary. However, these factors still could not fully explain the behavior of TMZ. The coexistence of various interactive factors effecting sediment dynamics, e.g., biogeochemical processes, subaqueous topography, sediment grain size especially after the WSRS, and the combined effect of direction of wind and currents, makes it challenging for mechanism research of TMZ at different time scales. In addition, uncertainties intensified when trying to fully understand sediment dynamics only through the TMZ extent. Besides the extent of the TMZ, the inner variability could still bear information about sediment dynamics to some extent, especially when the TMZ was highly extensive. Thus, to better understand the TMZ in the large river estuary, details of the relationship between different factors, such as the hysteresis between discharge and SSC [51], and more statistical tools, such as the wavelet methodology [52], should be considered.
5. Conclusions
In this article, we proposed a new method to derive the long-term time series TMZ area based on time series Landsat images and GEE. This method has been successfully applied to the Yellow River estuary to generate a 38-year TMZ product. Visual and quantitative accuracy assessment show that our algorithm is robust and has great potential in large-scale TMZ mapping of global estuaries.
TMZ varies drastically in different time scales. In decadal time scale, the TMZ area shows an increasing trend from 1984 to 2009 but has sharply decreased since 2010. In general, as for seasonal variation, TMZ extent is largest in winter and smallest in summer.
Possible driving forces of TMZ variation were investigated. The morphology of the Yellow River mouth shifts the position of the TMZ. Currents aggregate the TMZ in an ovate area south of the Yellow River estuary. In terms of the Yellow River fluvial output, the water discharge and sediment load show negligible direct influences on the TMZ. The seasonal pattern of TMZ is caused by the different strength of wind in different seasons. However, on a singular basis, higher wind speeds do not necessarily lead to a larger TMZ area. The seasonality of stratification condition causes the different response sensitivity of TMZ area to wind speeds. In addition, we find that tides could barely affect the area of TMZ even in the case of similar wind speeds and seasons.
Supplementary Materials
The following are available online at https://www.mdpi.com/article/10.3390/rs14153782/s1, Figure S1: Results of the Random Forest (RF) classifier, Table S1: Detailed information of images in Figure 5.
Author Contributions
Conceptualization, M.C., P.L. and Z.L.; methodology, M.C.; software, M.C. and Y.S.; validation, M.C. and P.L.; formal analysis, M.C. and P.L.; investigation, M.C. and P.L.; resources, M.C., P.L., Z.L. and H.W.; data curation, M.C. and Y.S.; writing—original draft preparation, M.C.; writing—review and editing, M.C., P.L., Y.S., Z.L. and H.W.; visualization, M.C.; supervision, P.L., Z.L. and H.W.; project administration, P.L., Z.L. and H.W.; funding acquisition, P.L., Z.L. and H.W. All authors have read and agreed to the published version of the manuscript.
Funding
This work was jointly supported by the Natural Science Foundation of China (No. 41806108; No. 42041005-4), National Key Research and Development Program of China (No. 2017YFE0133500), State Key Laboratory of Geodesy and Earth’s Dynamics from Innovation Academy for Precision Measurement Science and Technology, Chinese Academy of Sciences (no. SKLGED2021-5-2) and the Open Research Fund of the State Key Laboratory of Estuarine and Coastal Research (no. SKLEC-KF202002) from the East China Normal University.
Data Availability Statement
Landsat images are publicly available in GEE platform: https://earthengine.google.com, accessed on 1 April 2022. The time series TMZ map results in the Yellow River estuary are available from the corresponding author upon reasonable request.
Acknowledgments
We thank the Google Earth Engine platform, National Aeronautics and Space Administration (NASA) and U.S. Geological Survey (USGS) for the free-access computation power and Landsat images. We also appreciate the data from National Marine Data and Information, China, Lijin gauging station and European Centre for Medium-Range Weather Forecasts reanalysis (ECMWF). The authors sincerely thank the editors and four anonymous reviewers for their constructive and excellent reviews that have greatly improved the quality of the article.
Conflicts of Interest
The authors declare no conflict of interest.
References
- Jalón-Rojas, I.; Dijkstra, Y.M.; Schuttelaars, H.M.; Brouwer, R.L.; Schmidt, S.; Sottolichio, A. Multidecadal Evolution of the Turbidity Maximum Zone in a Macrotidal River Under Climate and Anthropogenic Pressures. J. Geophys. Res. Oceans 2021, 126, e2020JC016273. [Google Scholar] [CrossRef]
- Schubel, J.R. Turbidity Maximum of the Northern Chesapeake Bay. Science 1968, 161, 1013–1015. [Google Scholar] [CrossRef] [PubMed] [Green Version]
- Teng, L.; Cheng, H.; de Swart, H.; Dong, P.; Li, Z.; Li, J.; Wang, Y. On the mechanism behind the shift of the turbidity maximum zone in response to reclamations in the Yangtze (Changjiang) Estuary, China. Mar. Geol. 2021, 440, 106569. [Google Scholar] [CrossRef]
- Du, Z.; Yu, Q.; Peng, Y.; Wang, L.; Lin, H.; Wang, Y.; Gao, S. The Formation of Coastal Turbidity Maximum by Tidal Pumping in Well-Mixed Inner Shelves. J. Geophys. Res. Oceans 2022, 127, e2022JC018478. [Google Scholar] [CrossRef]
- Hou, X.; Feng, L.; Duan, H.; Chen, X.; Sun, D.; Shi, K. Fifteen-year monitoring of the turbidity dynamics in large lakes and reservoirs in the middle and lower basin of the Yangtze River, China. Remote Sens. Environ. 2017, 190, 107–121. [Google Scholar] [CrossRef]
- Gebhardt, A.; Schoster, F.; Gaye, B.; Beeskow, B.; Rachold, V.; Unger, D.; Ittekkot, V. The turbidity maximum zone of the Yenisei River (Siberia) and its impact on organic and inorganic proxies. Estuar. Coast. Shelf Sci. 2005, 65, 61–73. [Google Scholar] [CrossRef] [Green Version]
- Stive, M.J.; de Schipper, M.A.; Luijendijk, A.P.; Aarninkhof, S.G.; van Gelder-Maas, C.; Vries, J.S.V.T.D.; de Vries, S.; Henriquez, M.; Marx, S.; Ranasinghe, R. A New Alternative to Saving Our Beaches from Sea-Level Rise: The Sand Engine. J. Coast. Res. 2013, 290, 1001–1008. [Google Scholar] [CrossRef]
- Wang, C.; Wang, L.; Wang, D.; Li, D.; Zhou, C.; Jiang, H.; Zheng, Q.; Chen, S.; Jia, K.; Liu, Y.; et al. Turbidity maximum zone index: A novel model for remote extraction of the turbidity maximum zone in different estuaries. Geosci. Model Dev. 2021, 14, 6833–6846. [Google Scholar] [CrossRef]
- Milliman, J.D.; Meade, R.H. World-Wide Delivery of River Sediment to the Oceans. J. Geol. 1983, 91, 1–21. [Google Scholar] [CrossRef]
- Syvitski, J.P.M.; Vörösmarty, C.J.; Kettner, A.J.; Green, P. Impact of Humans on the Flux of Terrestrial Sediment to the Global Coastal Ocean. Science 2005, 308, 376–380. [Google Scholar] [CrossRef]
- Li, M.; Xu, K.; Watanabe, M.; Chen, Z. Long-term variations in dissolved silicate, nitrogen, and phosphorus flux from the Yangtze River into the East China Sea and impacts on estuarine ecosystem. Estuar. Coast. Shelf Sci. 2007, 71, 3–12. [Google Scholar] [CrossRef]
- Luo, W.; Shen, F.; He, Q.; Cao, F.; Zhao, H.; Li, M. Changes in suspended sediments in the Yangtze River Estuary from 1984 to 2020: Responses to basin and estuarine engineering constructions. Sci. Total Environ. 2022, 805, 150381. [Google Scholar] [CrossRef]
- Shen, F.; Zhou, Y.; Li, J.; He, Q.; Verhoef, W. Remotely sensed variability of the suspended sediment concentration and its response to decreased river discharge in the Yangtze estuary and adjacent coast. Cont. Shelf Res. 2013, 69, 52–61. [Google Scholar] [CrossRef]
- Doxaran, D.; Lamquin, N.; Park, Y.-J.; Mazeran, C.; Ryu, J.-H.; Wang, M.; Poteau, A. Retrieval of the seawater reflectance for suspended solids monitoring in the East China Sea using MODIS, MERIS and GOCI satellite data. Remote Sens. Environ. 2014, 146, 36–48. [Google Scholar] [CrossRef]
- Wang, S.; Shen, M.; Ma, Y.; Chen, G.; You, Y.; Liu, W. Application of Remote Sensing to Identify and Monitor Seasonal and Interannual Changes of Water Turbidity in Yellow River Estuary, China. J. Geophys. Res. Oceans 2019, 124, 4904–4917. [Google Scholar] [CrossRef]
- Normandin, C.; Lubac, B.; Sottolichio, A.; Frappart, F.; Ygorra, B.; Marieu, V. Analysis of Suspended Sediment Variability in a Large Highly Turbid Estuary Using a 5-Year-Long Remotely Sensed Data Archive at High Resolution. J. Geophys. Res. Oceans 2019, 124, 7661–7682. [Google Scholar] [CrossRef] [Green Version]
- Zhang, M.; Dong, Q.; Cui, T.; Xue, C.; Zhang, S. Suspended sediment monitoring and assessment for Yellow River estuary from Landsat TM and ETM+ imagery. Remote Sens. Environ. 2014, 146, 136–147. [Google Scholar] [CrossRef]
- Qiu, Z.; Xiao, C.; Perrie, W.; Sun, D.; Wang, S.; Shen, H.; Yang, D.; He, Y. Using Landsat 8 data to estimate suspended particulate matter in the Yellow River estuary. J. Geophys. Res. Oceans 2017, 122, 276–290. [Google Scholar] [CrossRef]
- Zhan, C.; Yu, J.; Wang, Q.; Li, Y.; Zhou, D.; Xing, Q.; Chu, X. Remote sensing retrieval of surface suspended sediment concentration in the Yellow River Estuary. Chin. Geogr. Sci. 2017, 27, 934–947. [Google Scholar] [CrossRef] [Green Version]
- Li, P.; Ke, Y.; Wang, D.; Ji, H.; Chen, S.; Chen, M.; Lyu, M.; Zhou, D. Human impact on suspended particulate matter in the Yellow River Estuary, China: Evidence from remote sensing data fusion using an improved spatiotemporal fusion method. Sci. Total Environ. 2021, 750, 141612. [Google Scholar] [CrossRef]
- Zhao, G.; Jiang, W.; Wang, T.; Chen, S.; Bian, C. Decadal Variation and Regulation Mechanisms of the Suspended Sediment Concentration in the Bohai Sea, China. J. Geophys. Res. Oceans 2022, 127, e2021JC017699. [Google Scholar] [CrossRef]
- Li, P.; Ke, Y.; Bai, J.; Zhang, S.; Chen, M.; Zhou, D. Spatiotemporal dynamics of suspended particulate matter in the Yellow River Estuary, China during the past two decades based on time-series Landsat and Sentinel-2 data. Mar. Pollut. Bull. 2019, 149, 110518. [Google Scholar] [CrossRef] [PubMed]
- Dogliotti, A.; Ruddick, K.; Nechad, B.; Doxaran, D.; Knaeps, E. A single algorithm to retrieve turbidity from remotely-sensed data in all coastal and estuarine waters. Remote Sens. Environ. 2015, 156, 157–168. [Google Scholar] [CrossRef] [Green Version]
- Gorelick, N.; Hancher, M.; Dixon, M.; Ilyushchenko, S.; Thau, D.; Moore, R. Google Earth Engine: Planetary-scale geospatial analysis for everyone. Remote Sens. Environ. 2017, 202, 18–27. [Google Scholar] [CrossRef]
- Wu, X.; Wang, H.; Bi, N.; Nittrouer, J.A.; Xu, J.; Cong, S.; Carlson, B.; Lu, T.; Li, Z. Evolution of a tide-dominated abandoned channel: A case of the abandoned Qingshuigou course, Yellow River. Mar. Geol. 2020, 422, 106116. [Google Scholar] [CrossRef]
- Fan, H.; Huang, H. Response of coastal marine eco-environment to river fluxes into the sea: A case study of the Huanghe (Yellow) River mouth and adjacent waters. Mar. Environ. Res. 2008, 65, 378–387. [Google Scholar] [CrossRef] [Green Version]
- Wang, H.; Yang, Z.; Li, G.; Jiang, W. Wave Climate Modeling on the Abandoned Huanghe (Yellow River) Delta Lobe and Related Deltaic Erosion. J. Coast. Res. 2006, 224, 906–918. [Google Scholar] [CrossRef]
- Bi, N.; Yang, Z.; Wang, H.; Hu, B.; Ji, Y. Sediment dispersion pattern off the present Huanghe (Yellow River) subdelta and its dynamic mechanism during normal river discharge period. Estuar. Coast. Shelf Sci. 2010, 86, 352–362. [Google Scholar] [CrossRef]
- Wang, H.; Wang, A.; Bi, N.; Zeng, X.; Xiao, H. Seasonal distribution of suspended sediment in the Bohai Sea, China. Cont. Shelf Res. 2014, 90, 17–32. [Google Scholar] [CrossRef]
- Masek, J.G.; Wulder, M.A.; Markham, B.; McCorkel, J.; Crawford, C.J.; Storey, J.; Jenstrom, D.T. Landsat 9: Empowering open science and applications through continuity. Remote Sens. Environ. 2020, 248, 111968. [Google Scholar] [CrossRef]
- Wu, K.; Xu, Z.; Lyu, X.; Ren, P. Cloud detection with boundary nets. ISPRS J. Photogramm. Remote Sens. 2022, 186, 218–231. [Google Scholar] [CrossRef]
- Zhang, Z.; Xu, N.; Li, Y.; Li, Y. Sub-continental-scale mapping of tidal wetland composition for East Asia: A novel algorithm integrating satellite tide-level and phenological features. Remote Sens. Environ. 2022, 269, 112799. [Google Scholar] [CrossRef]
- Chang, M.; Li, P.; Li, Z.; Wang, H. Mapping Tidal Flats of the Bohai and Yellow Seas Using Time Series Sentinel-2 Images and Google Earth Engine. Remote Sens. 2022, 14, 1789. [Google Scholar] [CrossRef]
- Murray, N.J.; Phinn, S.R.; DeWitt, M.; Ferrari, R.; Johnston, R.; Lyons, M.B.; Clinton, N.; Thau, D.; Fuller, R.A. The global distribution and trajectory of tidal flats. Nature 2018, 565, 222–225. [Google Scholar] [CrossRef]
- Otsu, N. A threshold selection method from gray-level histograms. IEEE Trans. Syst. Man Cybern. 1979, 9, 62–66. [Google Scholar] [CrossRef] [Green Version]
- Zhao, C.; Qin, C.-Z.; Teng, J. Mapping large-area tidal flats without the dependence on tidal elevations: A case study of Southern China. ISPRS J. Photogramm. Remote Sens. 2020, 159, 256–270. [Google Scholar] [CrossRef]
- Jia, M.; Wang, Z.; Mao, D.; Ren, C.; Wang, C.; Wang, Y. Rapid, robust, and automated mapping of tidal flats in China using time series Sentinel-2 images and Google Earth Engine. Remote Sens. Environ. 2021, 255, 112285. [Google Scholar] [CrossRef]
- Belgiu, M.; Drăguţ, L. Random forest in remote sensing: A review of applications and future directions. ISPRS J. Photogramm. Remote Sens. 2016, 114, 24–31. [Google Scholar] [CrossRef]
- Pelletier, C.; Valero, S.; Inglada, J.; Champion, N.; Dedieu, G. Assessing the robustness of Random Forests to map land cover with high resolution satellite image time series over large areas. Remote Sens. Environ. 2016, 187, 156–168. [Google Scholar] [CrossRef]
- Concha, J.A.; Schott, J.R. Retrieval of color producing agents in Case 2 waters using Landsat 8. Remote Sens. Environ. 2016, 185, 95–107. [Google Scholar] [CrossRef] [Green Version]
- Kuhn, C.; De Matos Valerio, A.; Ward, N.; Loken, L.; Sawakuchi, H.O.; Kampel, M.; Richey, J.; Stadler, P.; Crawford, J.; Striegl, R.; et al. Performance of Landsat-8 and Sentinel-2 surface reflectance products for river remote sensing retrievals of chlorophyll-a and turbidity. Remote Sens. Environ. 2019, 224, 104–118. [Google Scholar] [CrossRef] [Green Version]
- Wen, Z.; Wang, Q.; Liu, G.; Jacinthe, P.-A.; Lyu, L.; Tao, H.; Ma, Y.; Duan, H.; Shang, Y.; Zhang, B.; et al. Remote sensing of total suspended matter concentration in lakes across China using Landsat images and Google Earth Engine. ISPRS J. Photogramm. Remote Sens. 2022, 187, 61–78. [Google Scholar] [CrossRef]
- Wang, H.; Wu, X.; Bi, N.; Li, S.; Yuan, P.; Wang, A.; Syvitski, J.P.; Saito, Y.; Yang, Z.; Liu, S.; et al. Impacts of the dam-orientated water-sediment regulation scheme on the lower reaches and delta of the Yellow River (Huanghe): A review. Glob. Planet. Chang. 2017, 157, 93–113. [Google Scholar] [CrossRef]
- Kong, D.; Miao, C.; Borthwick, A.G.; Duan, Q.; Liu, H.; Sun, Q.; Ye, A.; Di, Z.; Gong, W. Evolution of the Yellow River Delta and its relationship with runoff and sediment load from 1983 to 2011. J. Hydrol. 2015, 520, 157–167. [Google Scholar] [CrossRef] [Green Version]
- Wu, X.; Bi, N.; Kanai, Y.; Saito, Y.; Zhang, Y.; Yang, Z.; Fan, D.; Wang, H. Sedimentary records off the modern Huanghe (Yellow River) delta and their response to deltaic river channel shifts over the last 200 years. J. Southeast Asian Earth Sci. 2015, 108, 68–80. [Google Scholar] [CrossRef]
- Wu, X.; Wang, H.; Saito, Y.; Syvitski, J.; Bi, N.; Yang, Z.; Xu, J.; Guan, W. Boosting riverine sediment by artificial flood in the Yellow River and the implication for delta restoration. Mar. Geol. 2022, 448, 106816. [Google Scholar] [CrossRef]
- Bian, C.; Jiang, W.; Pohlmann, T.; Sündermann, J. Hydrography-Physical Description of the Bohai Sea. J. Coast. Res. 2016, 74, 1–12. [Google Scholar] [CrossRef] [Green Version]
- Jiang, X.; Lu, B.; He, Y. Response of the turbidity maximum zone to fluctuations in sediment discharge from river to estuary in the Changjiang Estuary (China). Estuar. Coast. Shelf Sci. 2013, 131, 24–30. [Google Scholar] [CrossRef] [Green Version]
- Chen, J.; Zhu, X.; Vogelmann, J.; Gao, F.; Jin, S. A simple and effective method for filling gaps in Landsat ETM+ SLC-off images. Remote Sens. Environ. 2011, 115, 1053–1064. [Google Scholar] [CrossRef]
- Pekel, J.-F.; Cottam, A.; Gorelick, N.; Belward, A.S. High-resolution mapping of global surface water and its long-term changes. Nature 2016, 540, 418–422. [Google Scholar] [CrossRef]
- Juez, C.; Hassan, M.A.; Franca, M.J. The Origin of Fine Sediment Determines the Observations of Suspended Sediment Fluxes Under Unsteady Flow Conditions. Water Resour. Res. 2018, 54, 5654–5669. [Google Scholar] [CrossRef]
- Juez, C.; Garijo, N.; Hassan, M.A.; Nadal-Romero, E. Intraseasonal-to-Interannual Analysis of Discharge and Suspended Sediment Concentration Time-Series of the Upper Changjiang (Yangtze River). Water Resour. Res. 2021, 57, e2020WR029457. [Google Scholar] [CrossRef]
Figure 1.
Location of the study area, displaying the extent of the Yellow River Basin (left) and the Yellow River estuary (right). TMZ: turbidity maximum zone; YRD: Yellow River Delta.
Figure 1.
Location of the study area, displaying the extent of the Yellow River Basin (left) and the Yellow River estuary (right). TMZ: turbidity maximum zone; YRD: Yellow River Delta.
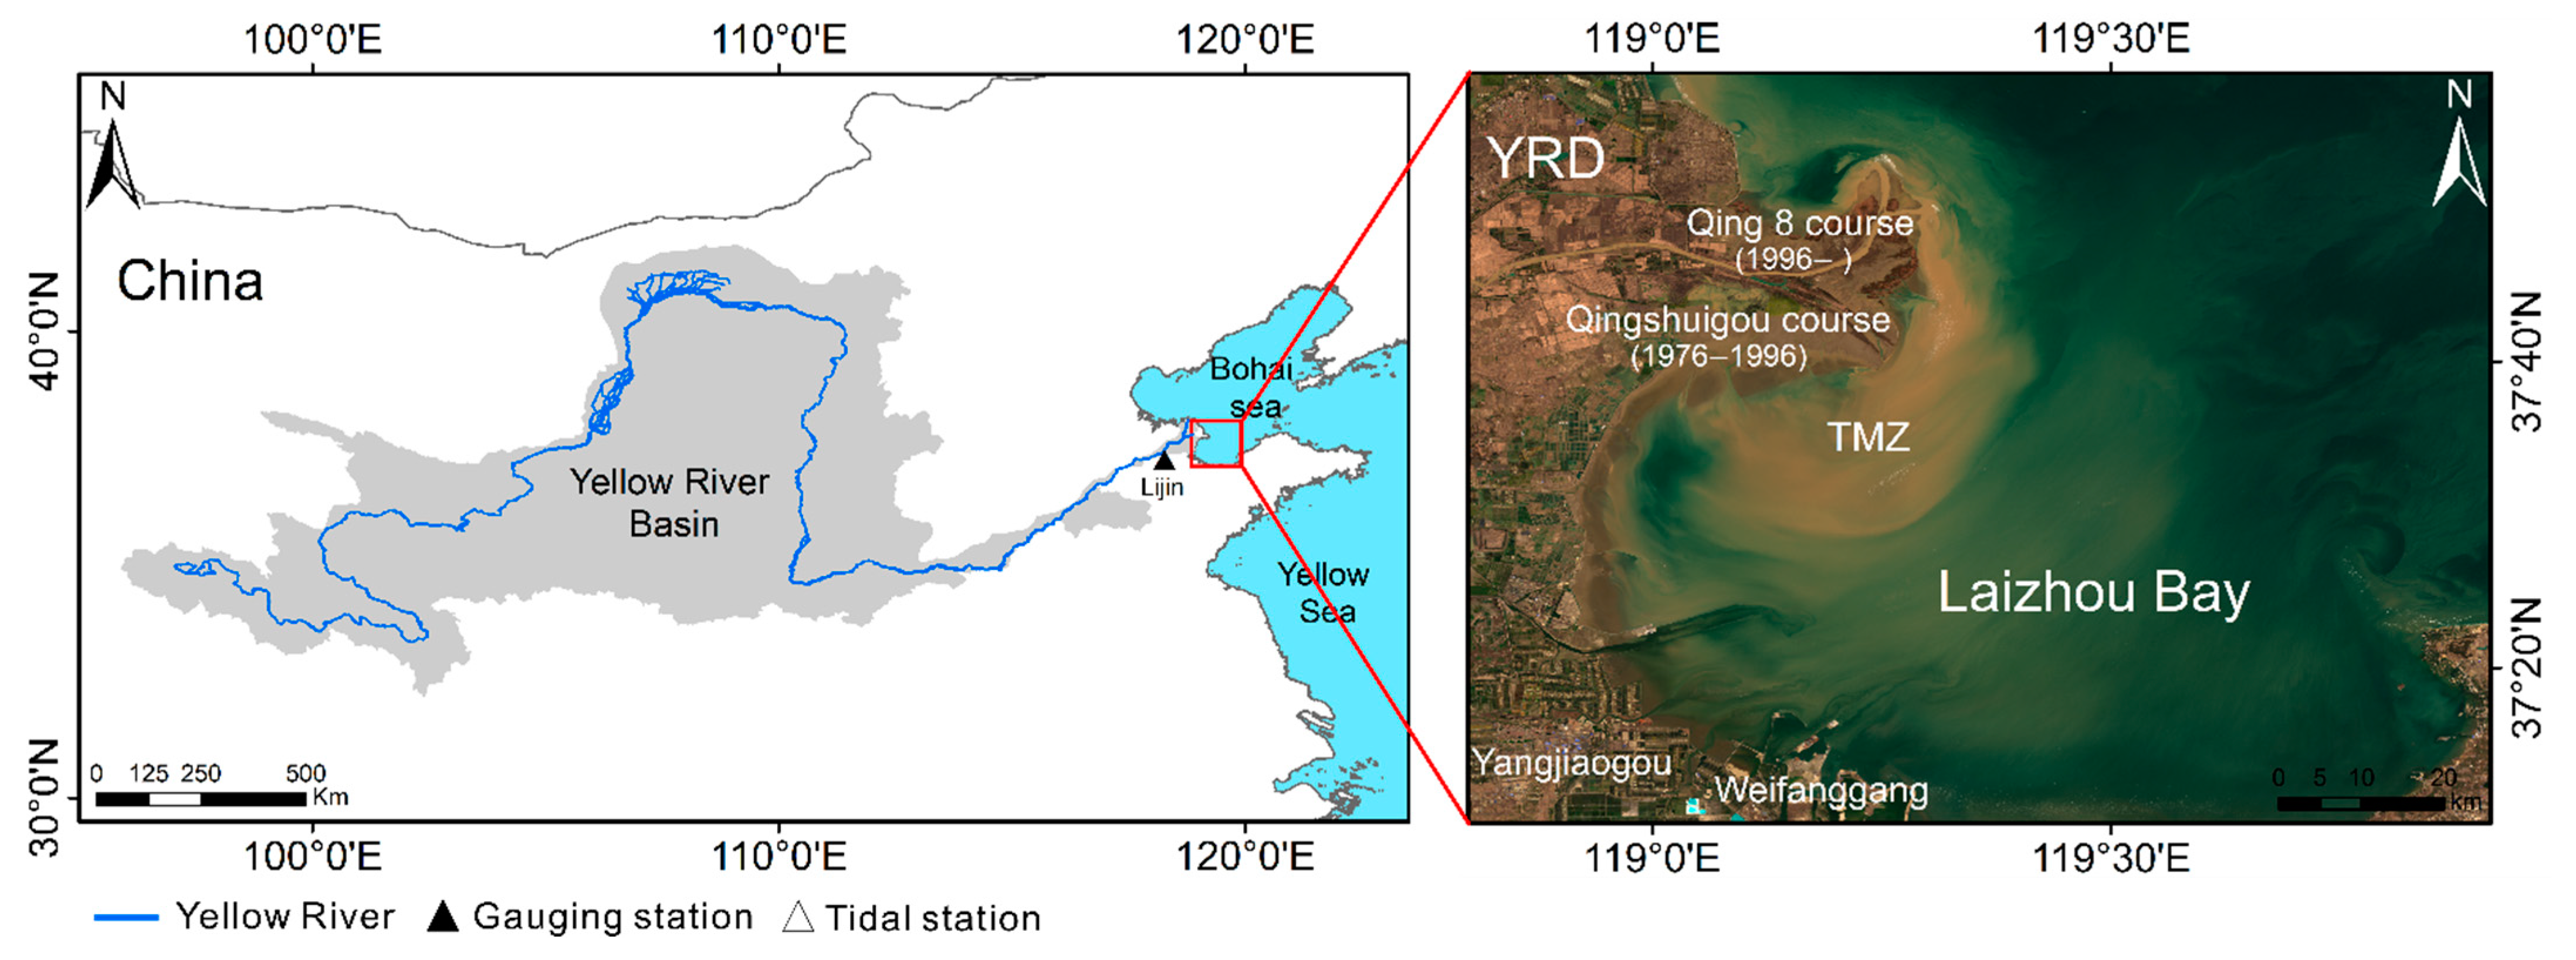
Figure 2.
The number of Landsat images (Path 121 and Row 34) used for TMZ mapping. TM, Thematic Mapper; ETM+, Enhanced Thematic Mapper Plus; OLI, Operational Land Imager.
Figure 2.
The number of Landsat images (Path 121 and Row 34) used for TMZ mapping. TM, Thematic Mapper; ETM+, Enhanced Thematic Mapper Plus; OLI, Operational Land Imager.

Figure 3.
Flowchart of time series TMZ mapping during the period 1984–2021 in the Yellow River estuary. (a) Preliminary images filtration; (b) land–water boundary generation and further cloud filtration; (c) TMZ mapping based on red band thresholding. All these processes were conducted on GEE.
Figure 3.
Flowchart of time series TMZ mapping during the period 1984–2021 in the Yellow River estuary. (a) Preliminary images filtration; (b) land–water boundary generation and further cloud filtration; (c) TMZ mapping based on red band thresholding. All these processes were conducted on GEE.
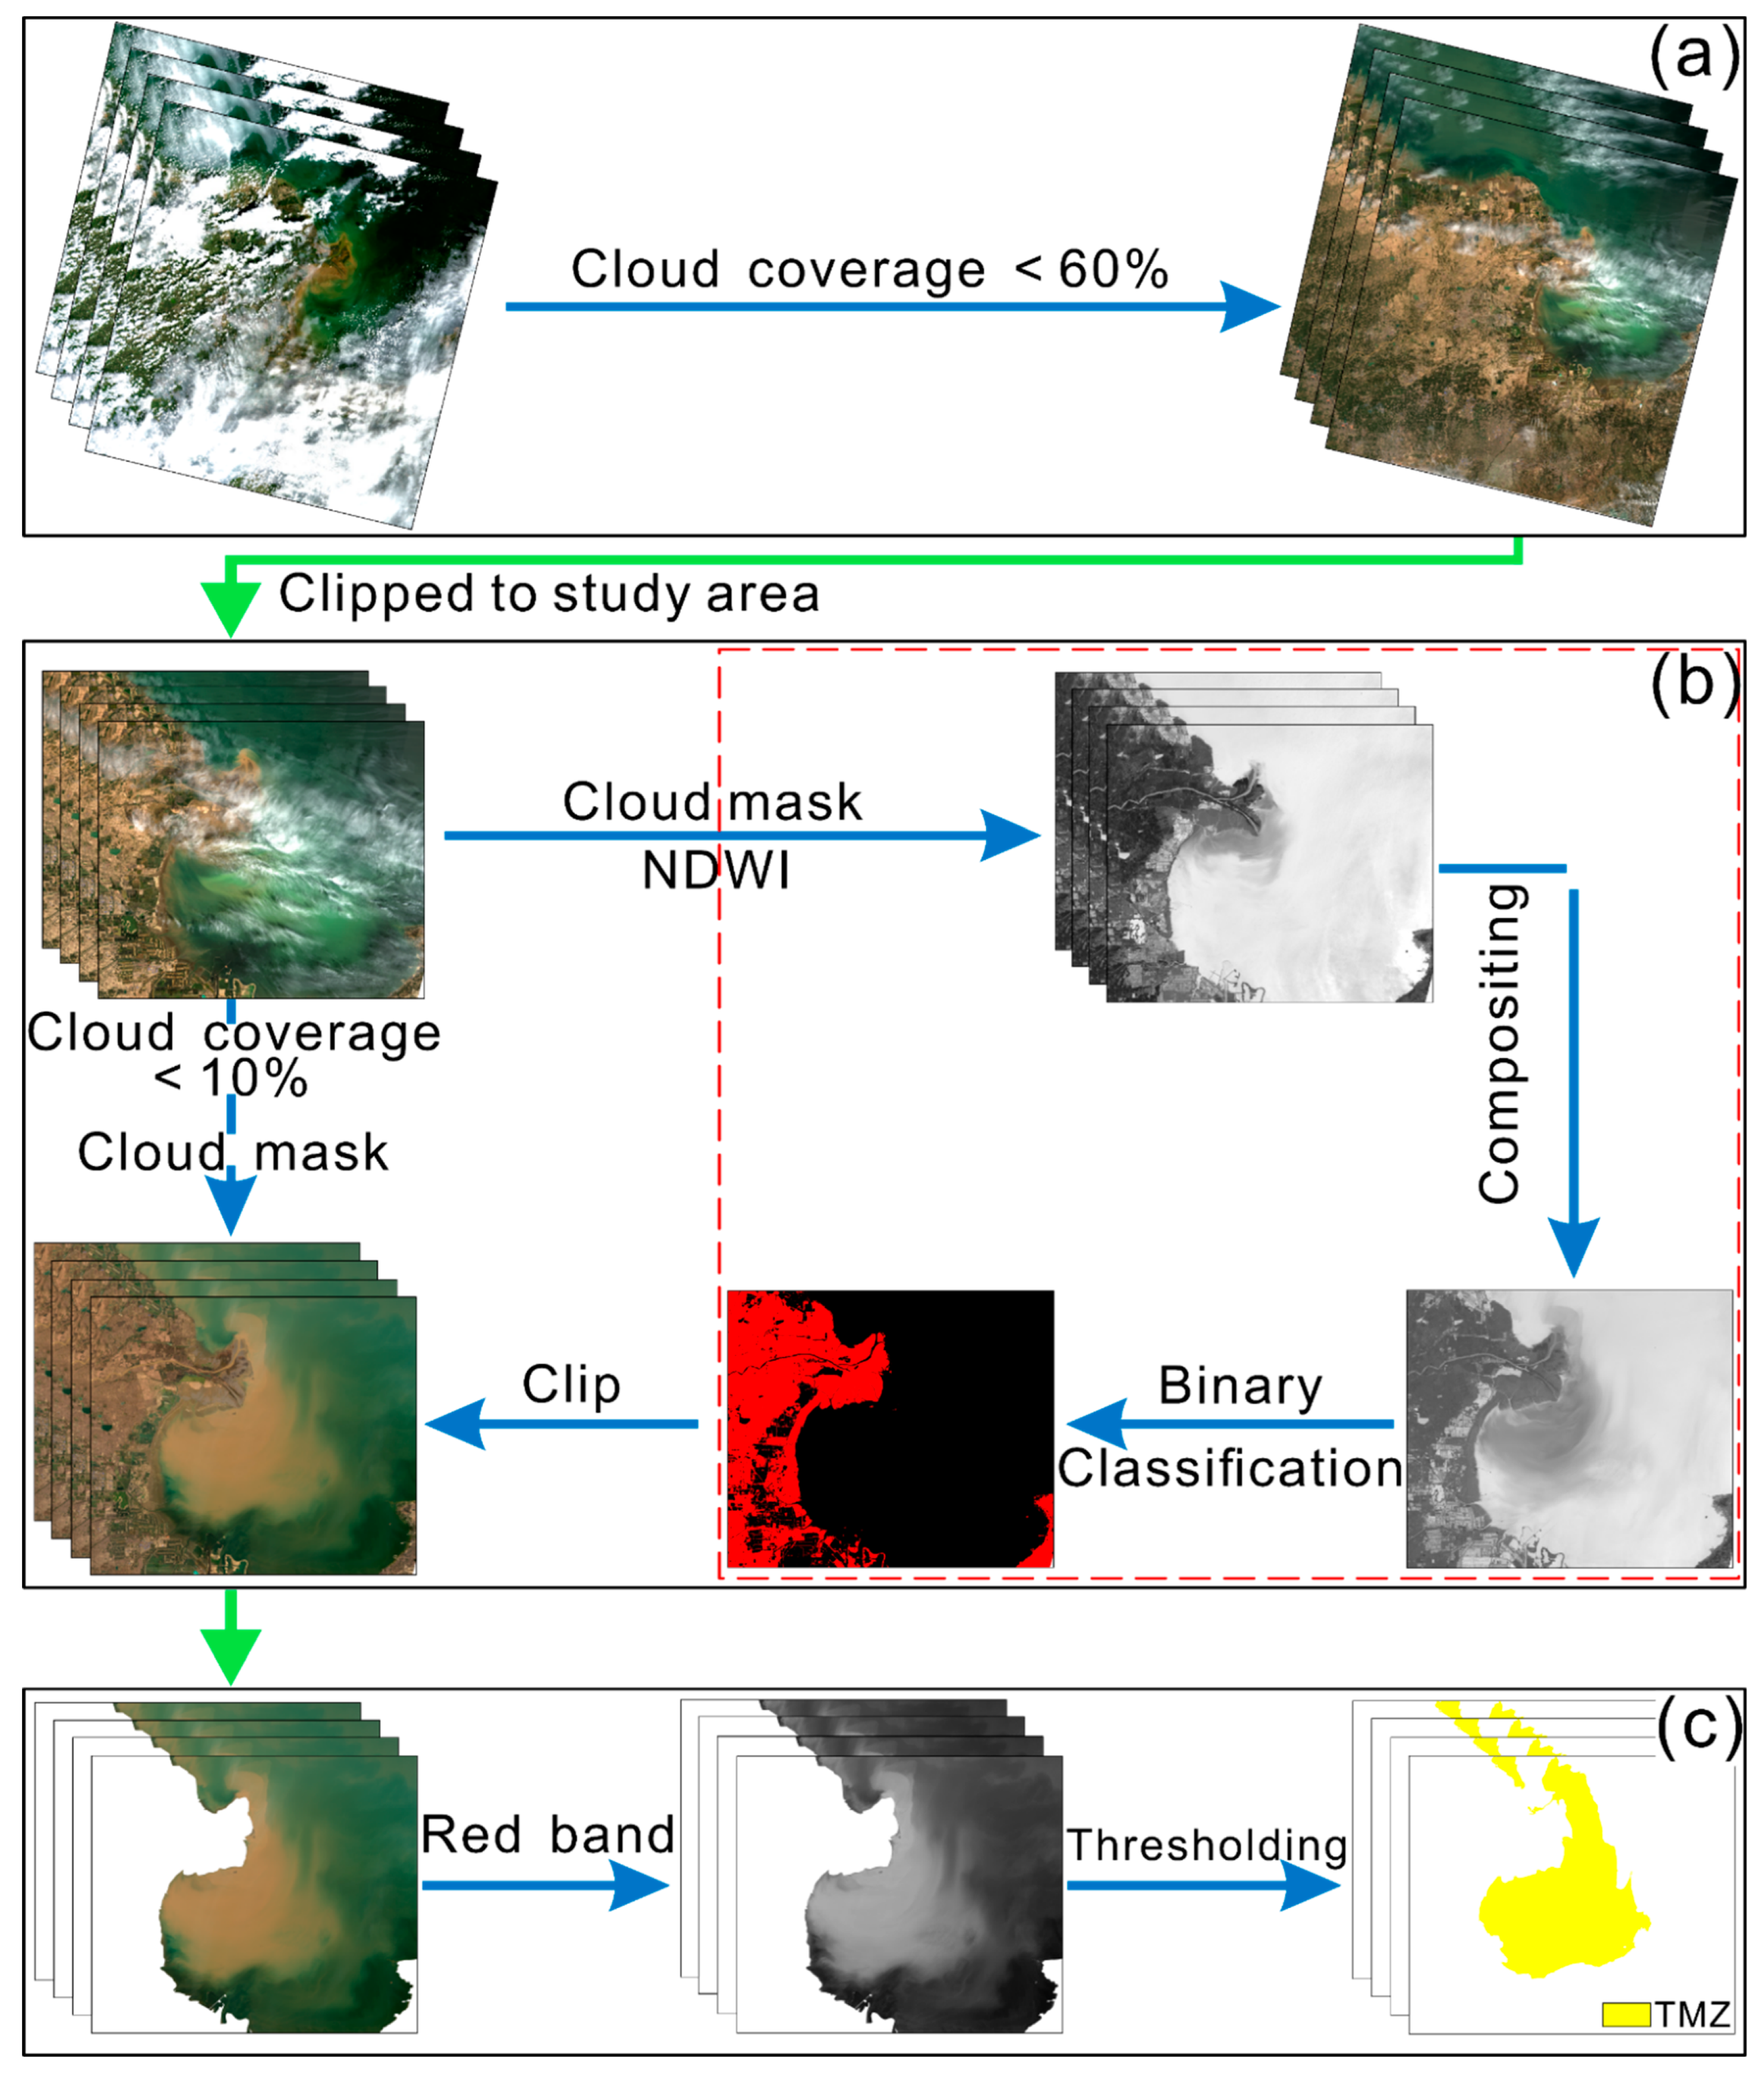
Figure 4.
Red band reflectance (RR) frequency (Fre.) histogram of TMZ and other water area in the Yellow River estuary. TMZ and other water area samples in subfigures (a–e), (f–j) and (k–o) were selected based on TM, ETM+ and OLI, respectively. Images (a-o) were acquired on 5 February 1989, 25 November 1985, 24 June 1987, 24 August 1992, 22 October 1996, 10 December 1999, 18 March 2001, 3 April 2001, 17 February 2002, 7 October 1999, 14 March 2020, 24 October 2020, 30 September 2017, 1 March 2015 and 2 April 2013, respectively.
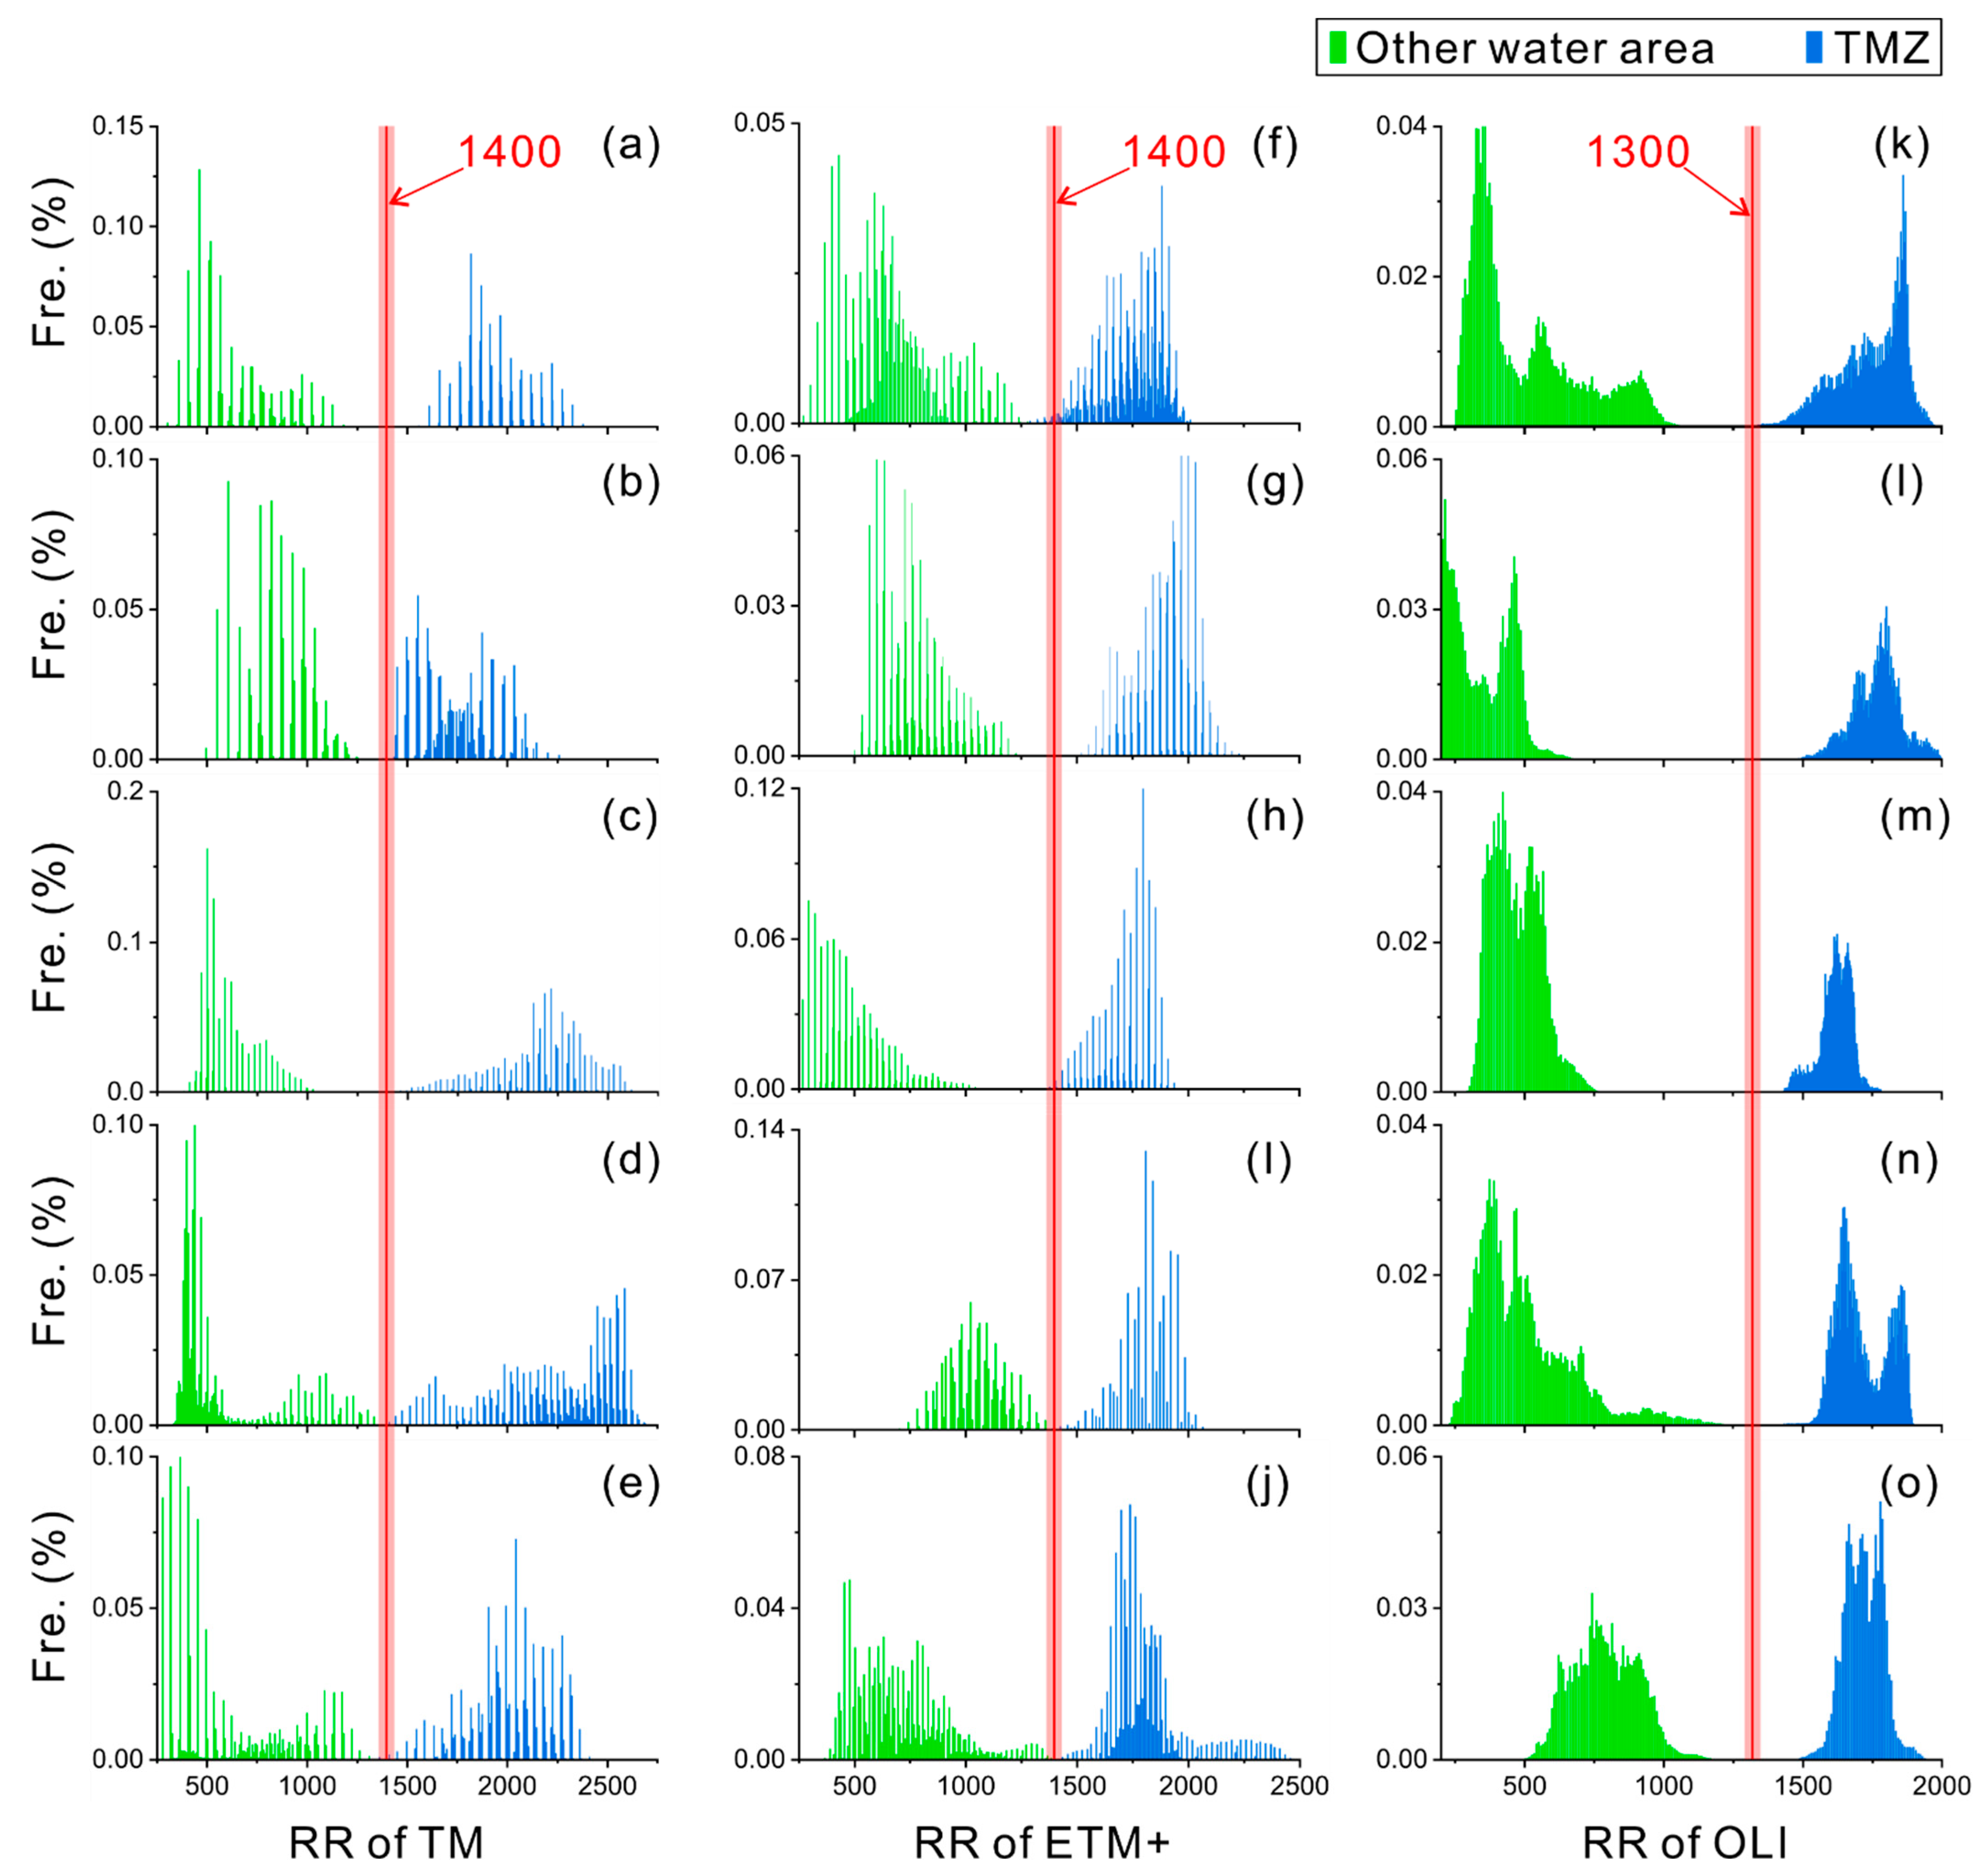
Figure 5.
Presentation of the randomly selected 30 Landsat true-color images with their derived TMZ maps and validation samples. Images (1–30) are sorted by date in an ascending order. The detailed information of these images is in Table S1.
Figure 5.
Presentation of the randomly selected 30 Landsat true-color images with their derived TMZ maps and validation samples. Images (1–30) are sorted by date in an ascending order. The detailed information of these images is in Table S1.
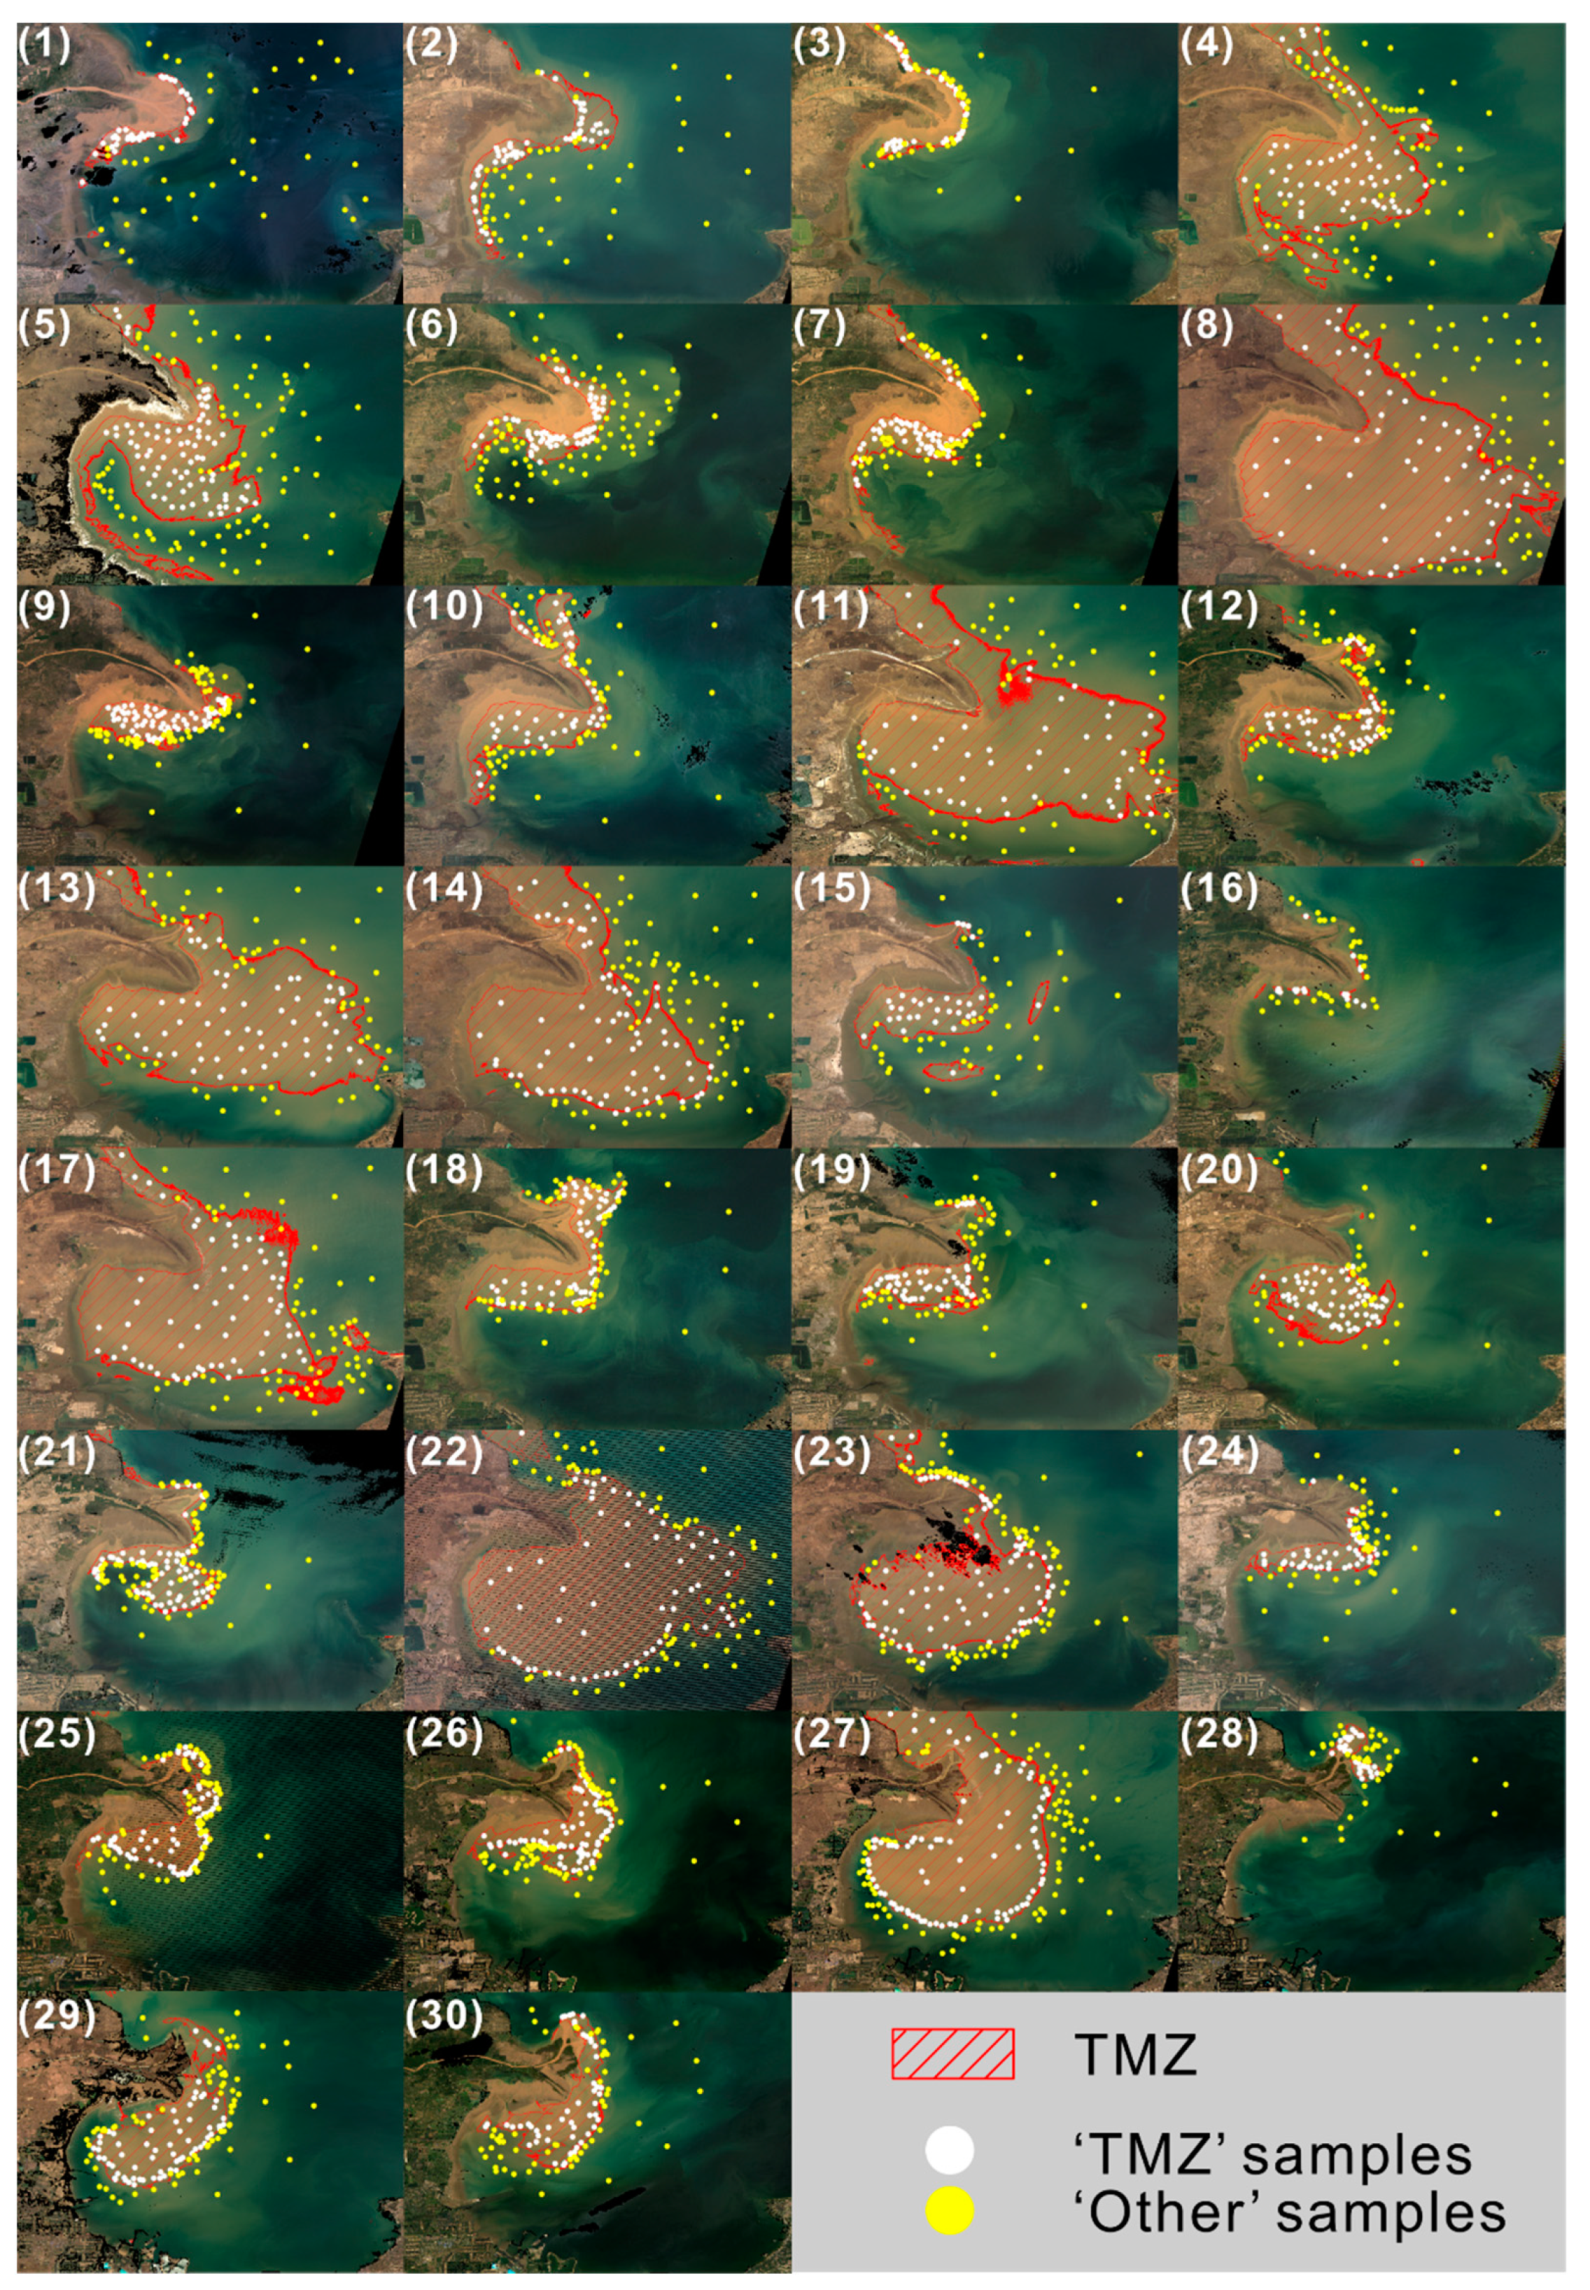
Figure 6.
The variation of TMZ area in the Yellow River estuary from 1984 to 2021. Four decadal TMZ averages were calculated, labeled as red numbers above the red line. Four stages cover the periods of 1984–1989, 1990–1999, 2000–2009 and 2010–2021, respectively.
Figure 6.
The variation of TMZ area in the Yellow River estuary from 1984 to 2021. Four decadal TMZ averages were calculated, labeled as red numbers above the red line. Four stages cover the periods of 1984–1989, 1990–1999, 2000–2009 and 2010–2021, respectively.
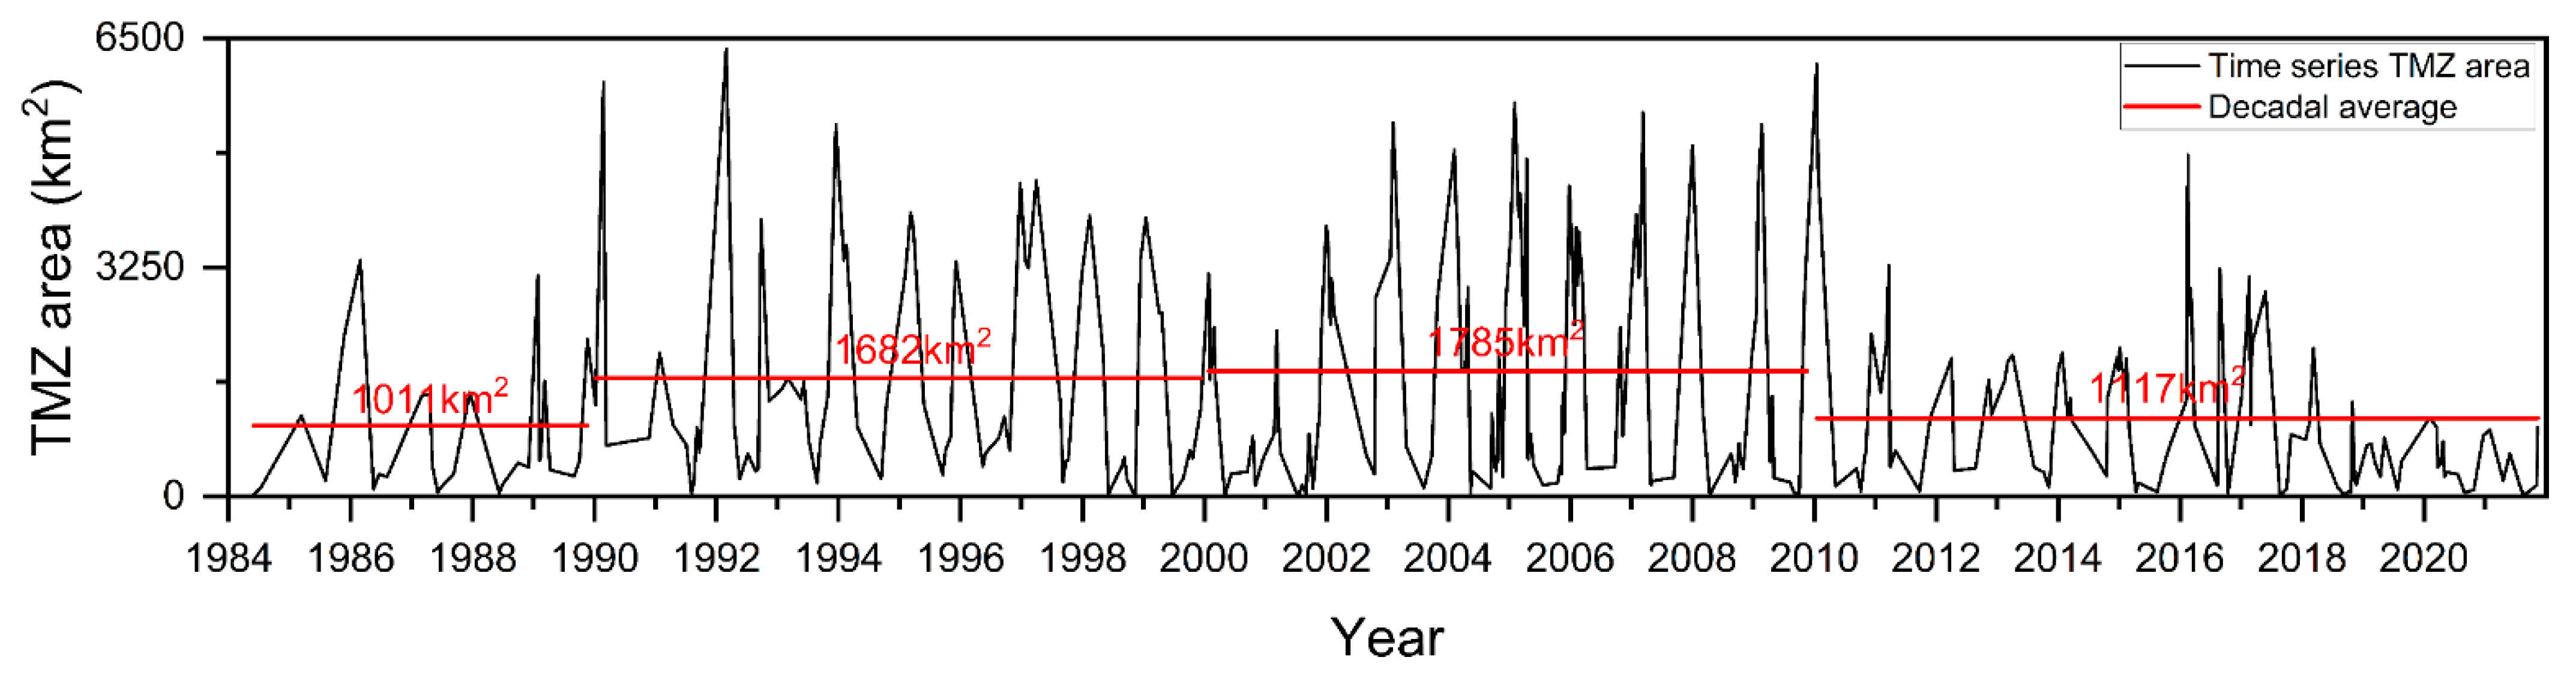
Figure 7.
The number of TMZ occurrences during different time periods in the Yellow River estuary. The first to the fifth column denote TMZ occurrences in Spring (March to May), summer (June to August), Autumn (September to November), Winter (December to February) and all seasons, respectively. (a–e), (f–j), (k–o), (p–t) and (u–y) are TMZ occurrences composites during the periods 1984–1989, 1990–1999, 2000–2009, 2010–2021 and 1984–2021, respectively.
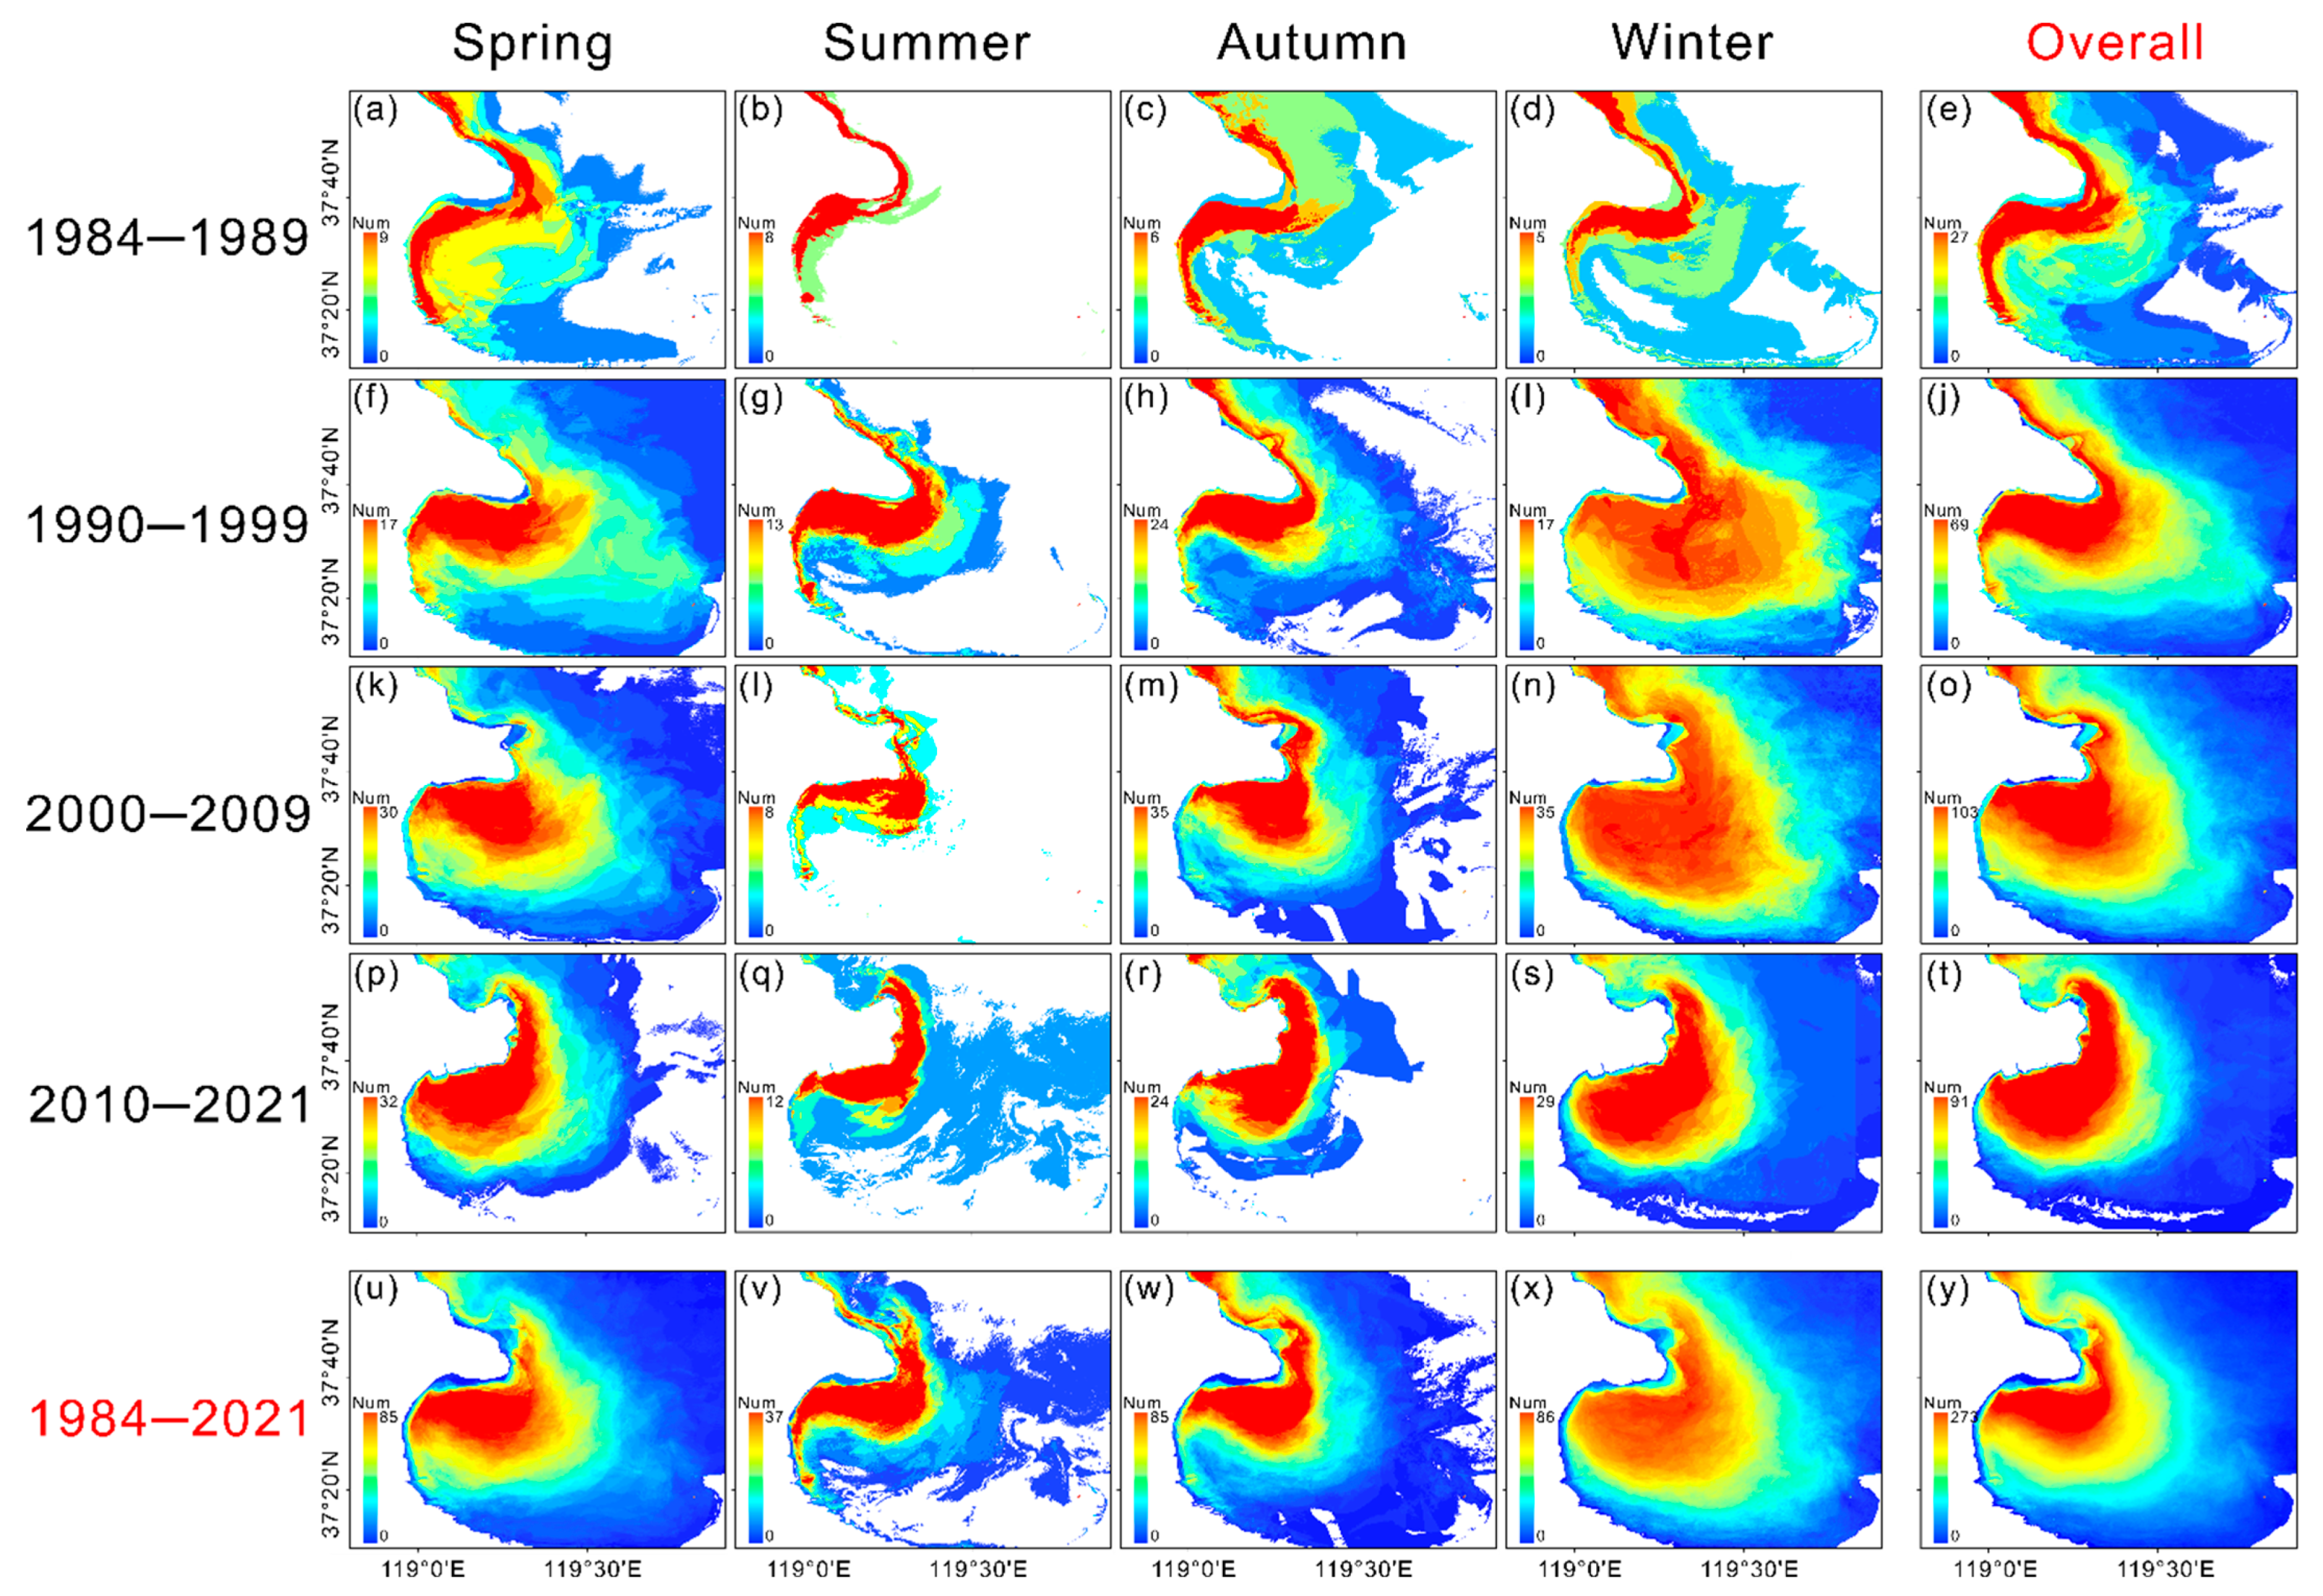
Figure 8.
(a) Monthly statistics of TMZ area from 1984 to 2021. The spring, summer, autumn and winter seasonal TMZ area means are 1357 km2, 364 km2, 814 km2 and 2730 km2, respectively. (b) Spectrum analysis of time series TMZ area from 1984 to 2021 through fast Fourier transform (FFT). The highest peak denotes the frequency of 0.0027, corresponding to 370-day period.
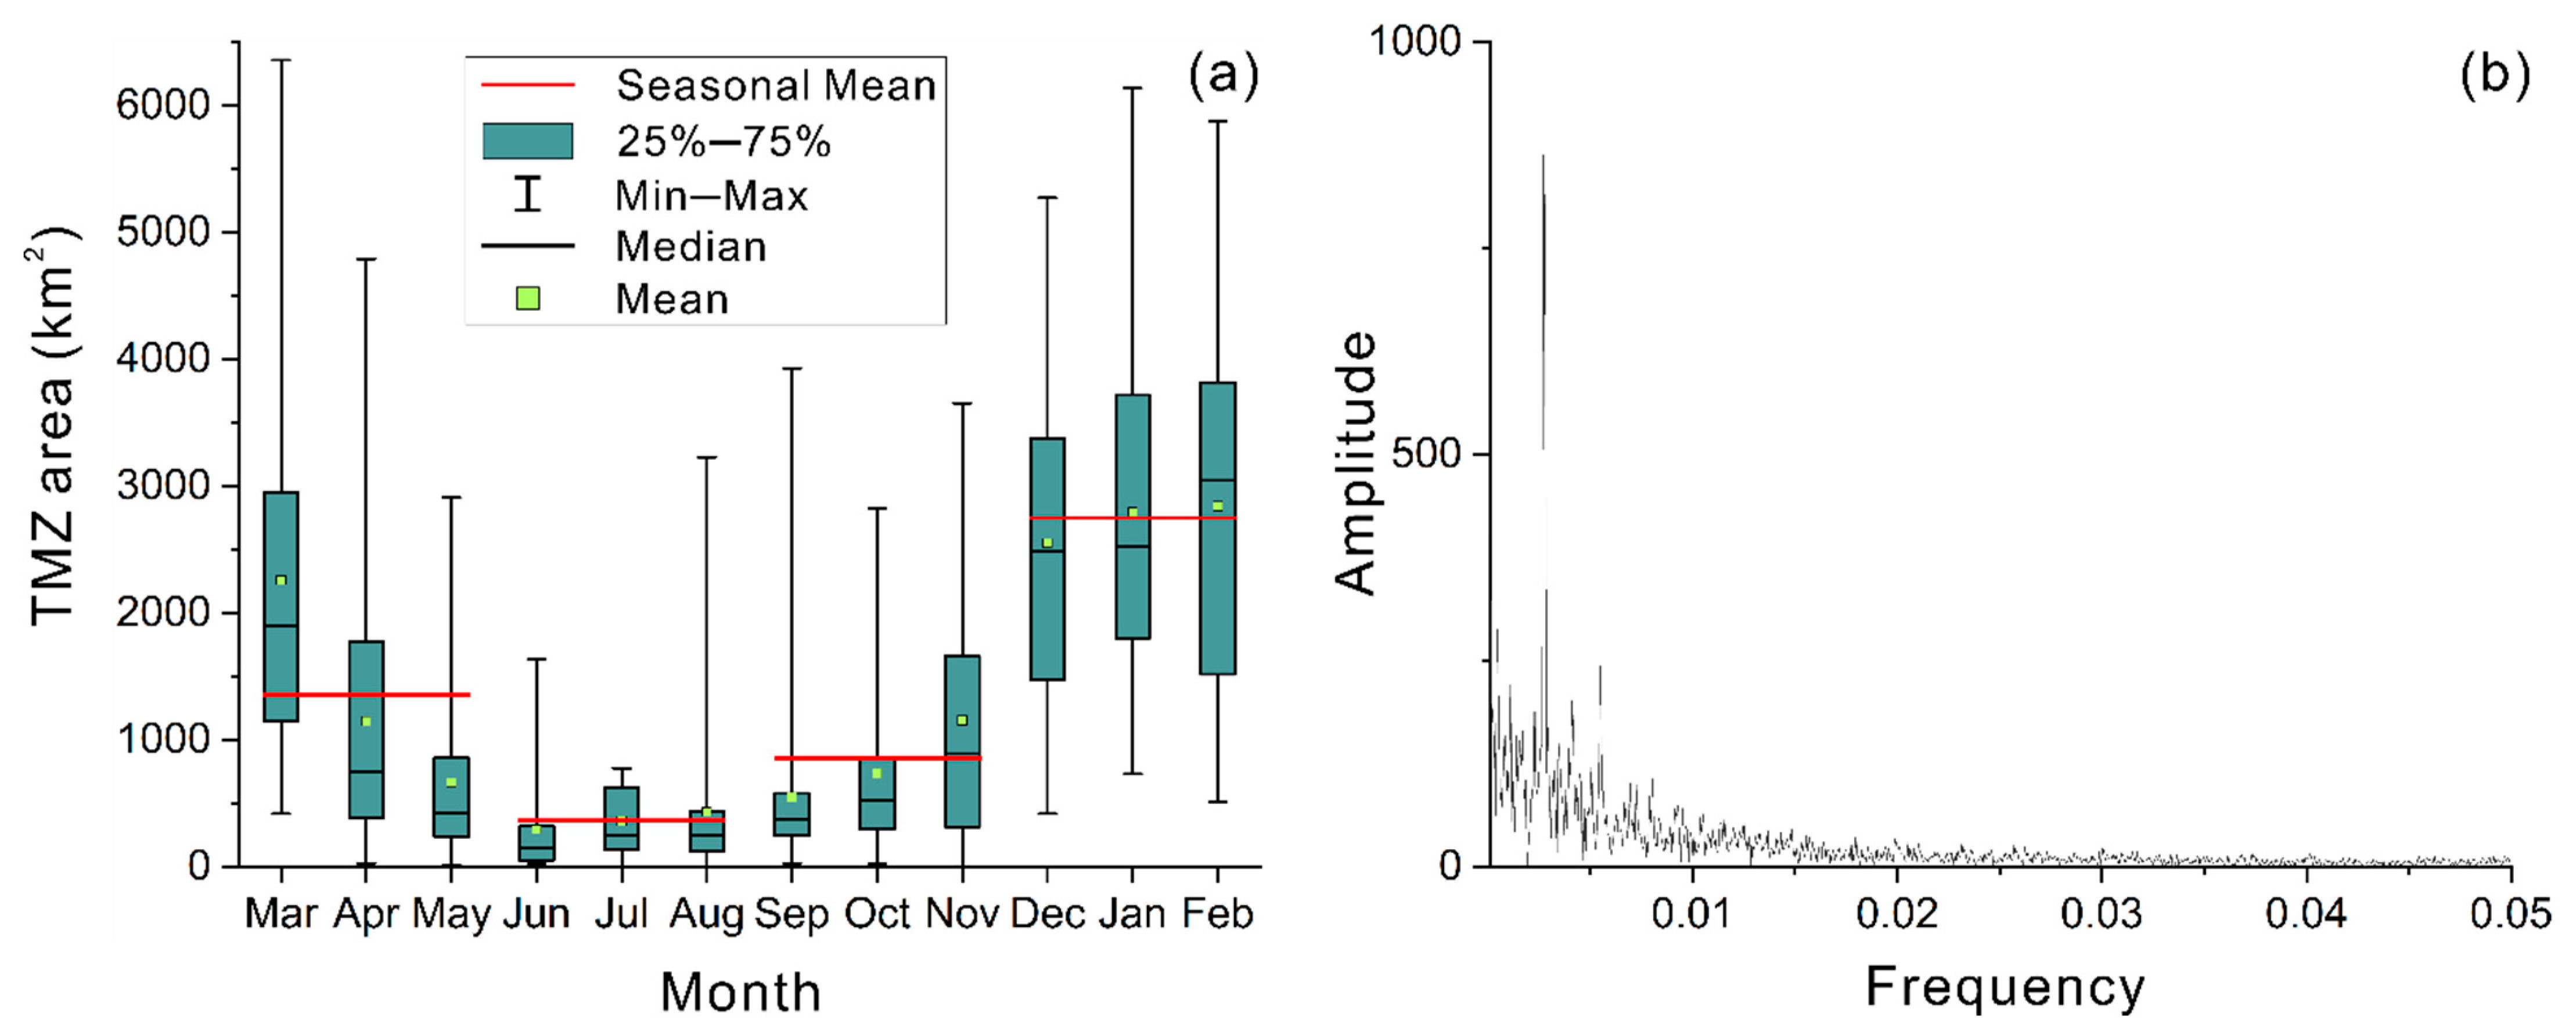
Figure 9.
Water discharge and sediment load at Lijin gauging station (a) and yearly averaged TMZ area in the Yellow River estuary (b) from 1984 to 2021. The pink shaded area denotes the 226-day no flow event of the Yellow River in 1997.
Figure 9.
Water discharge and sediment load at Lijin gauging station (a) and yearly averaged TMZ area in the Yellow River estuary (b) from 1984 to 2021. The pink shaded area denotes the 226-day no flow event of the Yellow River in 1997.
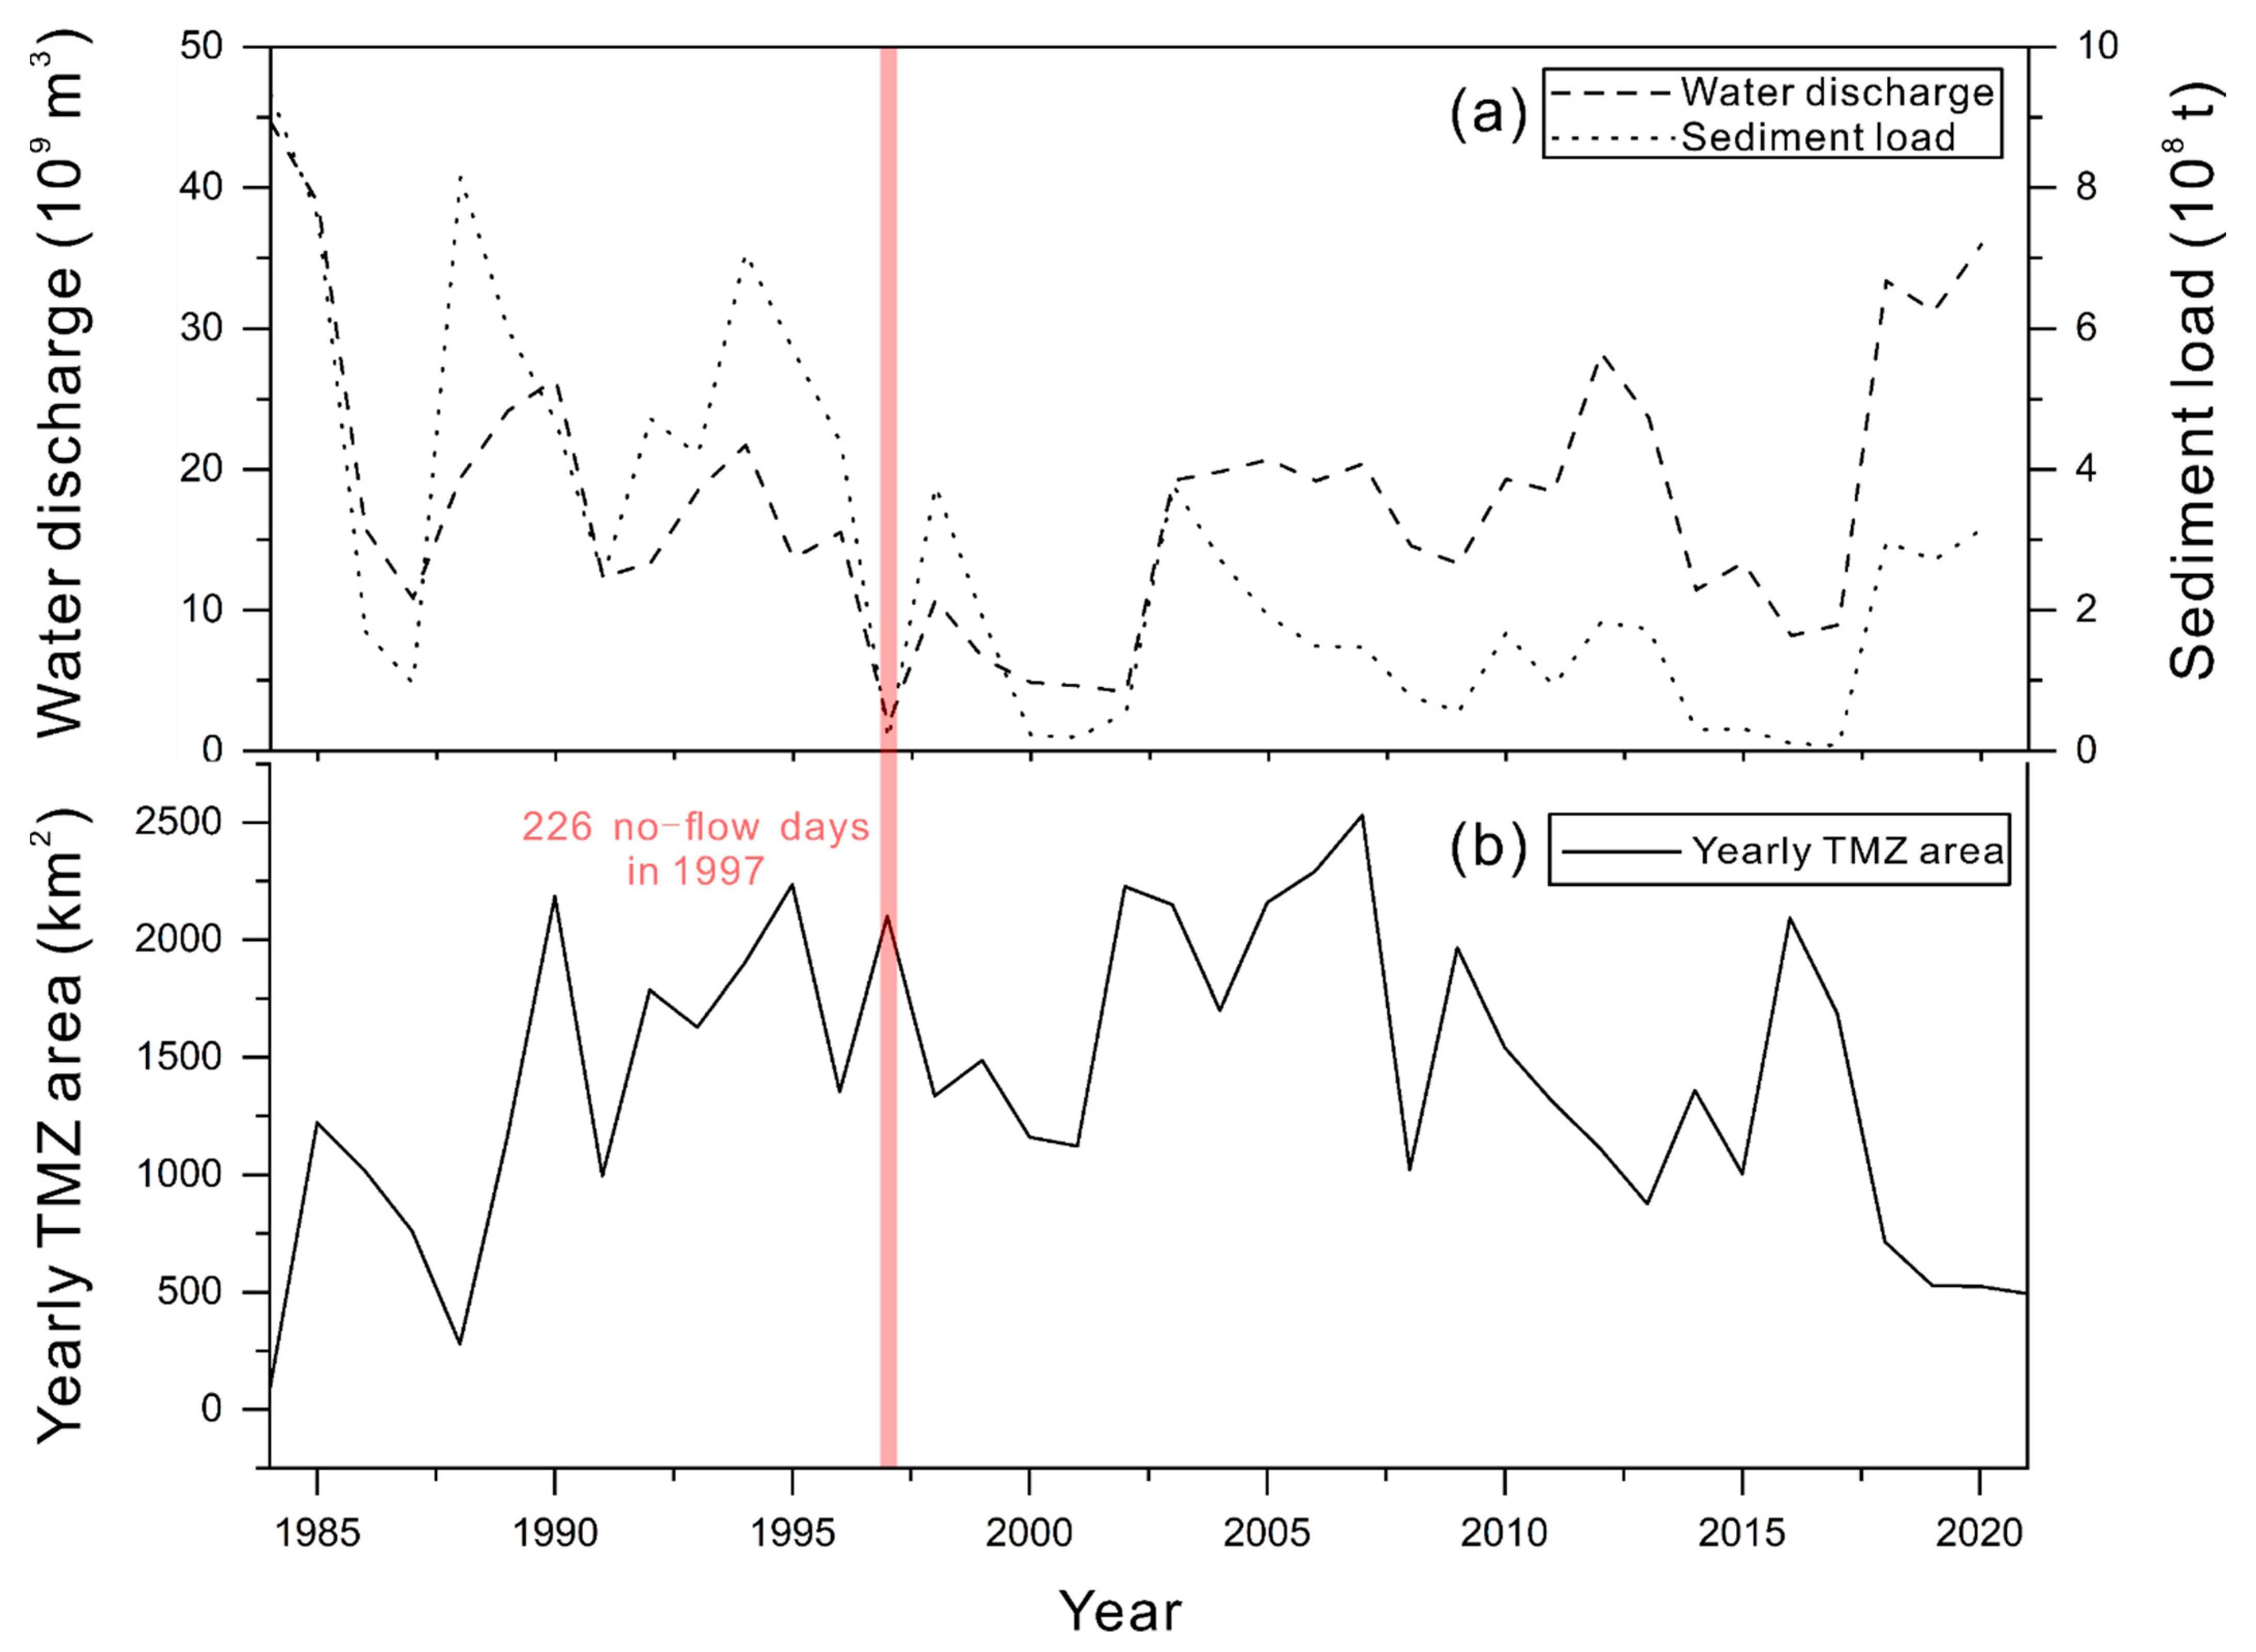
Figure 10.
Morphology evolution of the Yellow River mouth at Qingshuigou and Qing 8 course. (a–f) indicate the status of the Yellow River mouth in 1984, 1996, 1997, 2007, 2010 and 2020, respectively. The green arrows indicate the direction in which the Yellow River entered the sea.
Figure 10.
Morphology evolution of the Yellow River mouth at Qingshuigou and Qing 8 course. (a–f) indicate the status of the Yellow River mouth in 1984, 1996, 1997, 2007, 2010 and 2020, respectively. The green arrows indicate the direction in which the Yellow River entered the sea.
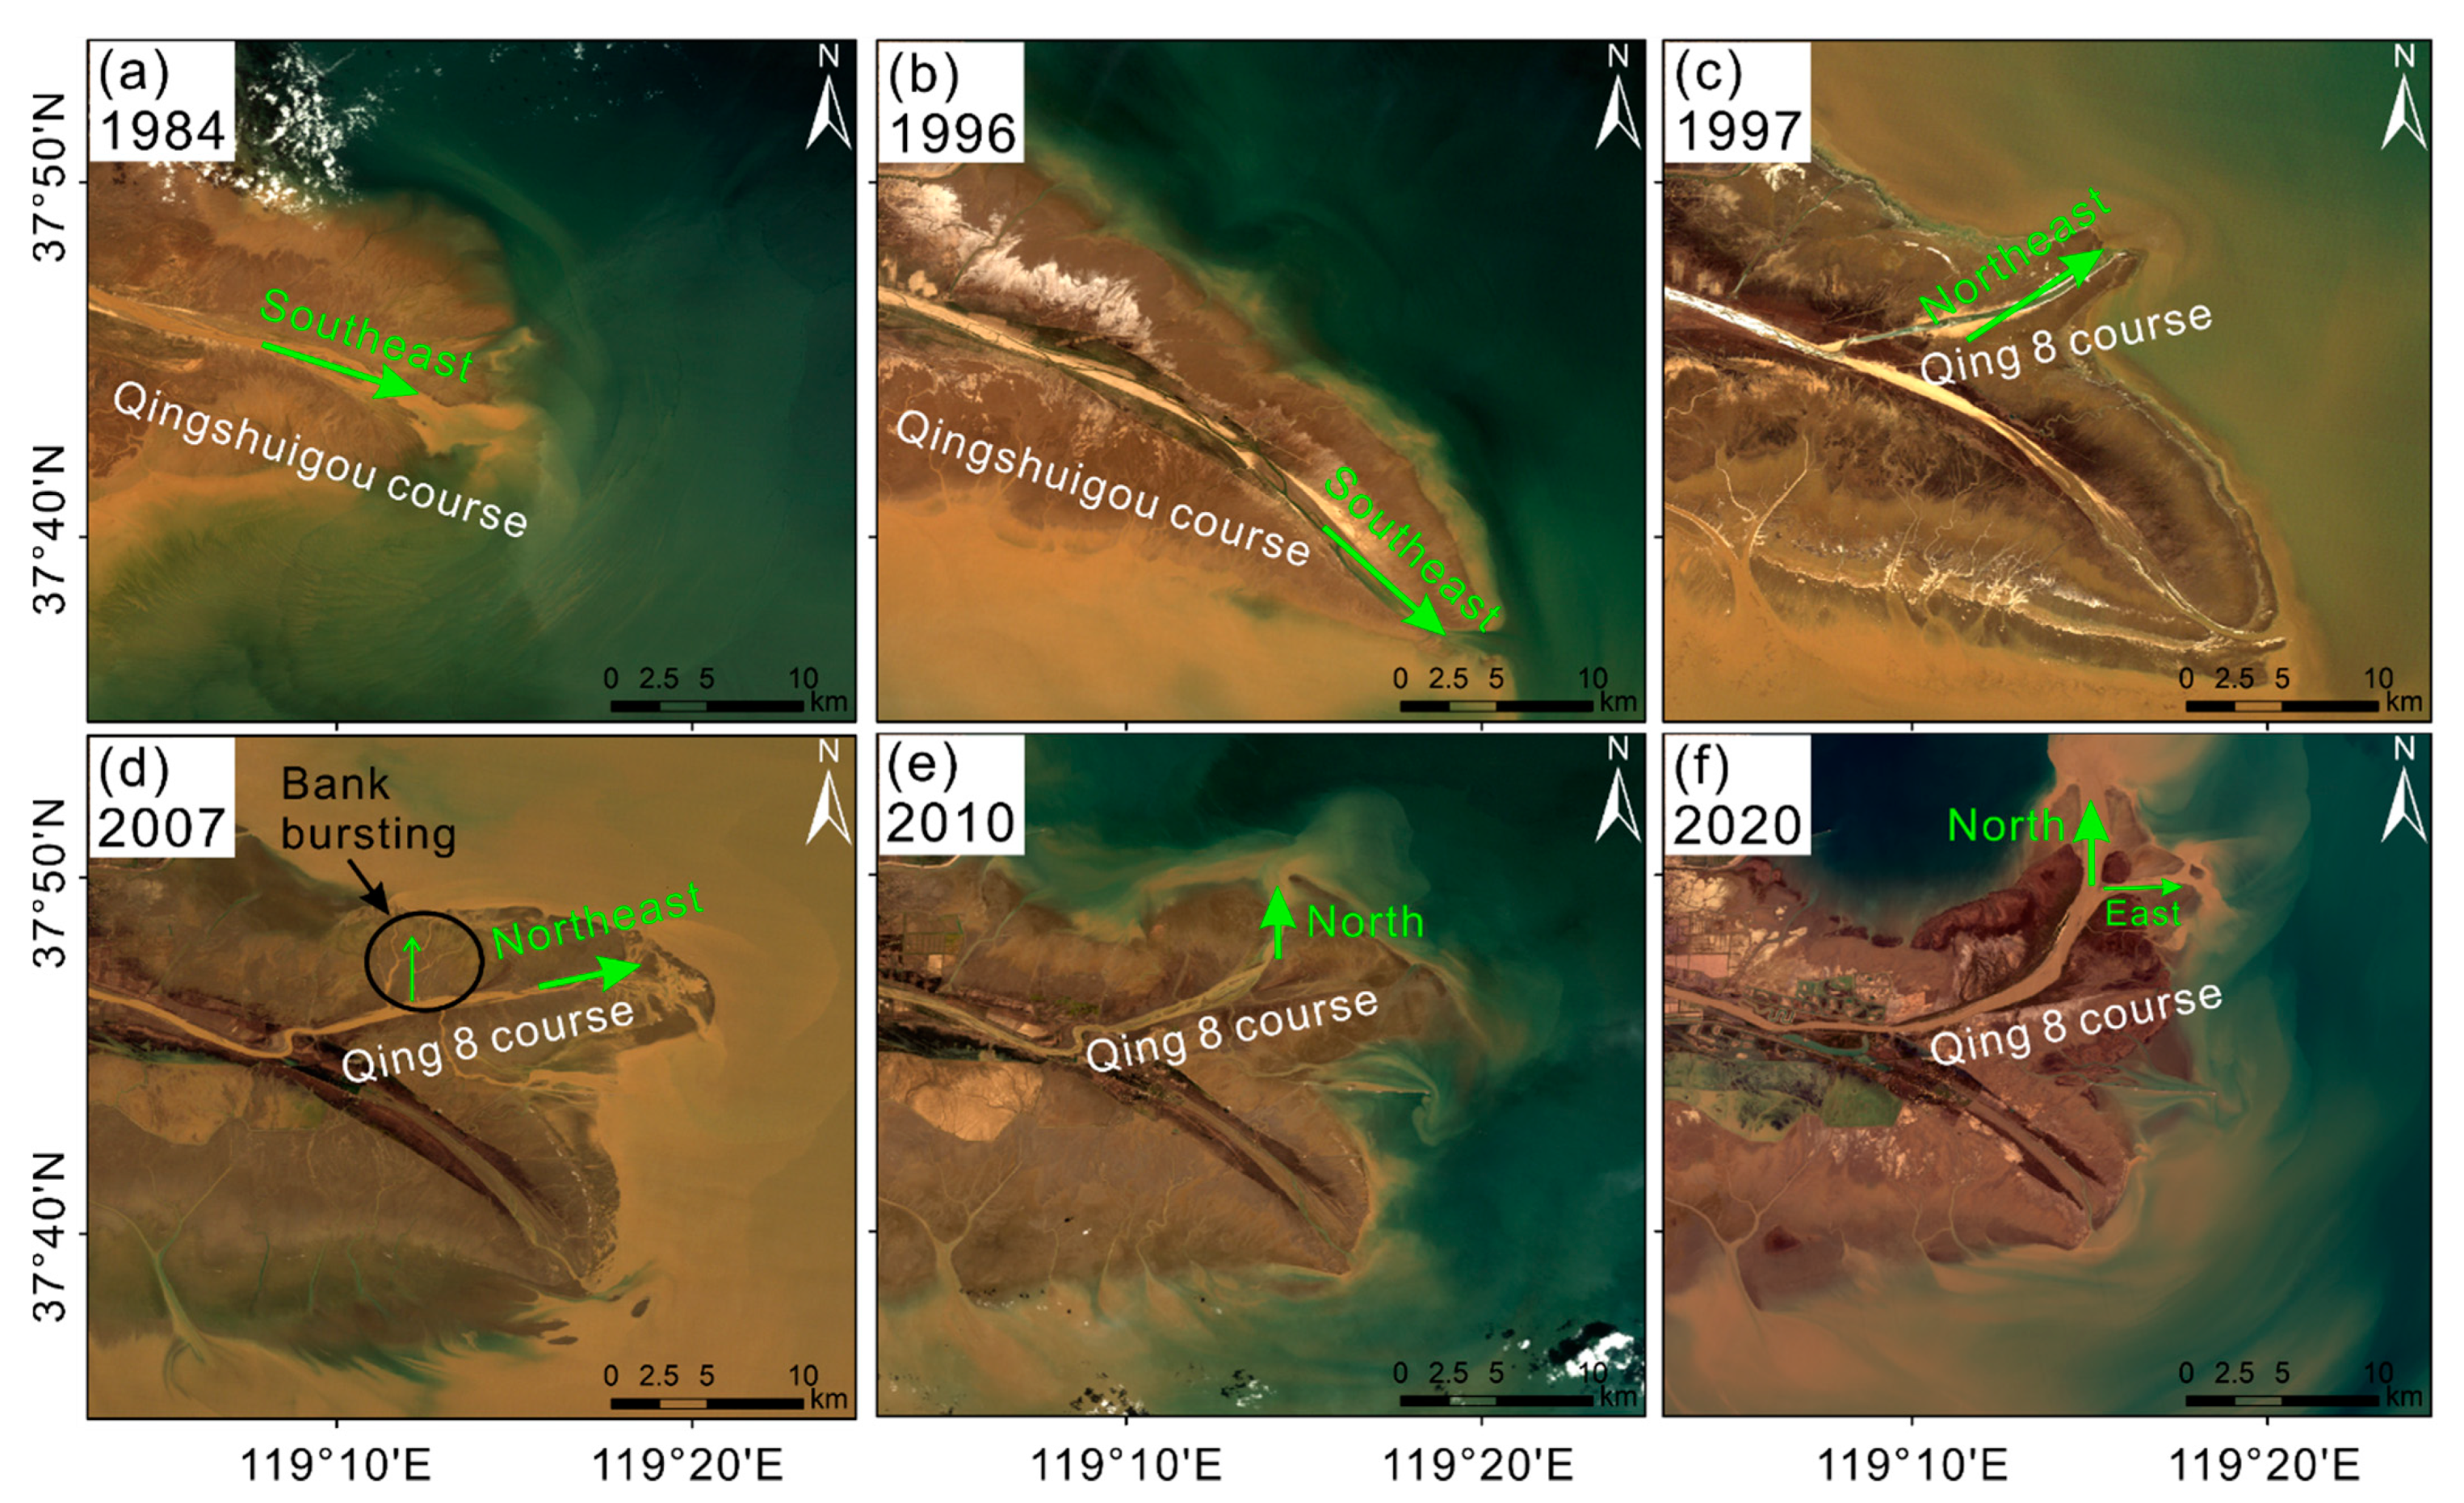
Figure 11.
Relationship between the TMZ area and the synchronous wind speed from 1984 to 2021. (a) is the scatterplot of all derived TMZ area results and its corresponding wind speed. The points in (b–e) are in spring, summer, autumn and winter from 1984 to 2021, respectively. The ellipse in (b–e) circles most of the points and excludes the outliers. The slope of the major axis of ellipses roughly represents the level of the response sensitivity of TMZ area to wind speeds.

Figure 12.
Relationship between tide and TMZ area. The tide range denotes the tidal difference of high tide and low tide within one tide cycle. Data in (a) are in flood season (summer and autumn), (b) were in dry season (spring and winter). The wind speed in (a,b) was between 4 and 5 m/s.
Figure 12.
Relationship between tide and TMZ area. The tide range denotes the tidal difference of high tide and low tide within one tide cycle. Data in (a) are in flood season (summer and autumn), (b) were in dry season (spring and winter). The wind speed in (a,b) was between 4 and 5 m/s.

Table 1.
Confusion matrix of the whole validation samples. OA, UA and PA represent overall accuracy, user accuracy and producer accuracy, respectively.
Table 1.
Confusion matrix of the whole validation samples. OA, UA and PA represent overall accuracy, user accuracy and producer accuracy, respectively.
| Reference | ||||
|---|---|---|---|---|
| TMZ | Other | UA | ||
| Classified | TMZ | 1720 | 69 | 96.1% |
| Other | 26 | 1739 | 98.5% | |
| PA | 98.5% | 96.2% | ||
| OA | 97.4% | |||
Publisher’s Note: MDPI stays neutral with regard to jurisdictional claims in published maps and institutional affiliations. |
© 2022 by the authors. Licensee MDPI, Basel, Switzerland. This article is an open access article distributed under the terms and conditions of the Creative Commons Attribution (CC BY) license (https://creativecommons.org/licenses/by/4.0/).
Share and Cite
MDPI and ACS Style
Chang, M.; Li, P.; Sun, Y.; Wang, H.; Li, Z. Mapping Dynamic Turbidity Maximum Zone of the Yellow River Estuary from 38 Years of Landsat Imagery. Remote Sens. 2022, 14, 3782. https://doi.org/10.3390/rs14153782
AMA Style
Chang M, Li P, Sun Y, Wang H, Li Z. Mapping Dynamic Turbidity Maximum Zone of the Yellow River Estuary from 38 Years of Landsat Imagery. Remote Sensing. 2022; 14(15):3782. https://doi.org/10.3390/rs14153782
Chicago/Turabian StyleChang, Maoxiang, Peng Li, Yue Sun, Houjie Wang, and Zhenhong Li. 2022. "Mapping Dynamic Turbidity Maximum Zone of the Yellow River Estuary from 38 Years of Landsat Imagery" Remote Sensing 14, no. 15: 3782. https://doi.org/10.3390/rs14153782
Note that from the first issue of 2016, this journal uses article numbers instead of page numbers. See further details here.