
The Spatiotemporal Response of Vegetation Changes to Precipitation and Soil Moisture in Drylands in the North Temperate Mid-Latitudes


1
Key Laboratory of Water Cycle and Related Land Surface Processes, Institute of Geographic Sciences and Natural Resources Research, Chinese Academy of Sciences, Beijing 100101, China
2
University of Chinese Academy of Sciences, Beijing 100049, China
3
Yellow River Laboratory, Zhengzhou University, Zhengzhou 450001, China
*
Author to whom correspondence should be addressed.
†
These authors contributed equally to this work.
Remote Sens. 2022, 14(15), 3511; https://doi.org/10.3390/rs14153511
Submission received: 15 June 2022
/
Revised: 17 July 2022
/
Accepted: 19 July 2022
/
Published: 22 July 2022
(This article belongs to the Special Issue Remote Sensing for Drought Monitoring and Forecasting)
Abstract
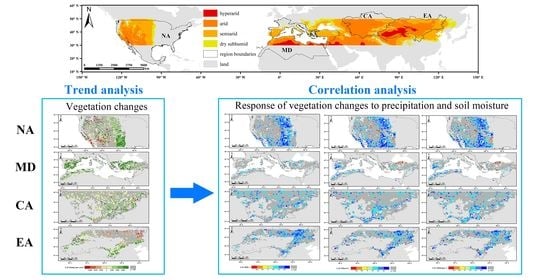
:Vegetation growth in drylands is highly constrained by water availability. How dryland vegetation responds to changes in precipitation and soil moisture in the context of a warming climate is not well understood. In this study, warm drylands in the temperate zone between 30 and 50° N, including North America (NA), the Mediterranean region (MD), Central Asia (CA), and East Asia (EA), were selected as the study area. After verifying the trends and anomalies of three kinds of leaf area index (LAI) datasets (GLASS LAI, GLEAM LAI, and GLOBAMAP LAI) in the study area, we mainly used the climate (GPCC precipitation and ERA5 temperature), GLEAM soil moisture, and GLASS LAI datasets from 1981 to 2018 to analyze the response of vegetation growth to changes in precipitation and soil moisture. The results of the three mutually validated LAI datasets show an overall greening of dryland vegetation with the same increasing trend of 0.002 per year in LAI over the past 38 years. LAI and precipitation exhibited a strong correlation in the eastern part of the NA drylands and the northeastern part of the EA drylands. LAI and soil moisture exhibited a strong correlation in the eastern part of the NA drylands, the eastern part of the MD drylands, the southern part of the CA drylands, and the northeastern part of the EA drylands. The results of this study will contribute to the understanding of vegetation dynamics and their response to changing water conditions in the Northern Hemisphere midlatitude drylands.
1. Introduction
Drylands cover approximately 45% of the global land surface [1], and semiarid lands in particular have expanded over the last several decades [2,3]. Drylands support approximately 40% of the human population and host 20% of the major global plant [4]. Dryland ecosystems are fragile [5], and approximately 10–20% of global drylands are already degraded [6,7].
The global land surface temperature has increased by approximately 1.1 °C compared with the average in 1850–1900, and the current global warming rate will likely continue or accelerate due to increasing anthropogenic greenhouse gases [8]. Due to climate warming and atmospheric circulation anomalies, the global hydrological cycle is intensifying, and drylands are expected to become drier [9]. Recent studies indicated that evaporation increased by 1.1 mm·year−1, while precipitation and runoff decreased by −2.32 mm·year−1 and −0.8 mm·year−1, respectively, in global drylands from 1980 to 2015 [10]. Global coupled atmosphere–ocean general circulation models [2,11] have predicted that warm trends over drylands were twice as much as those over humid regions, and the area of global drylands is projected to expand by ∼10% by 2100.
Climate warming is applying a major strain on fragile dryland ecosystems and is likely to worsen in the future [12,13]. Nevertheless, greening of vegetation in some parts of drylands has been detected since the 1980s. Generally, water-restricted vegetation is widely distributed in drylands, especially in warm drylands south of 50°N [14]. The growth of vegetation in drylands is constrained primarily by water availability [15]. Precipitation provides a direct source of water for plants in drylands and plays a significant role in aridity index (AI) changes [11,16,17,18]. In addition, soil moisture, which is strongly dependent on precipitation and groundwater [19], plays an important role in vegetative growth, especially in arid and water-scarce areas [20]. Soil moisture has also been indicated to control evapotranspiration in the processes of energy and water exchange in dryland ecosystems [21,22,23].
Meanwhile, precipitation and soil moisture vary largely across spatial and temporal scales in drylands [24], such that changes in precipitation and soil moisture are anticipated to have direct effects on vegetation growth. Therefore, in this study, we investigated vegetation and its water source controls (mainly precipitation and soil moisture) across midlatitude (30–50°N) drylands of the Northern Hemisphere and selected four typical regions (i.e., western North America, Mediterranean region, Central Asia, and East Asia) for further analysis. The objectives of this study are to (1) characterize the temporal change trends and spatial patterns of dryland climate variables and vegetation growth in the mid-latitudes of the Northern Hemisphere from 1981 to 2018; (2) distinguish differences in vegetation growth, precipitation, and soil moisture among four selected typical regions; and (3) carry out attribution analyses of the response mechanism of dryland vegetation to precipitation and soil water under drought stress.
2. Materials and Methods
2.1. Study Area
In this research, we selected warm drylands in the temperate zone between 30 and 50°N as the study area where vegetation is severely limited by water resources [14,15]. The degree of drought in the study area can be divided into four categories based on the drought index (AI) [2,25]: hyperarid (AI < 0.05), arid (0.05 ≤ AI < 0.2), semiarid (0.2 ≤ AI < 0.5), and dry subhumid (0.5 ≤ AI < 0.65). Each of the four categories occupies a total area of 12%, 38%, 40%, and 10%, respectively, from hyperarid to dry subhumid. The four categories occupy 12%, 38%, 40%, and 10% of the total dryland area of 8.4 million km2 dryland area, and the dryland areas include western North America, the Mediterranean region and surrounding areas, Central Asia, and much of East Asia (Figure 1 and Figure 2). There are four climate types in the study area: temperate continental climate, Mediterranean climate, plateau mountain climate, and temperate monsoon climate, among which temperate continental climate is mainly and most widely distributed.
To better represent the changes in regional vegetation, four typical dryland regions were selected in the study area, including North America (NA, which includes United States and Mexico), the Mediterranean region (MD, which includes eleven European countries including Spain and Italy, six Asian countries including Turkey and Israel, and five African countries including Egypt and Libya), Central Asia (CA, which includes Kazakhstan, Uzbekistan, Kyrgyzstan, Tajikistan, and Turkmenistan), and East Asia (EA, which includes Mongolia, northwest China, and the Inner Mongolia Autonomous Region) [26,27,28,29].
2.2. Data Sources
2.2.1. Climate Data
Global Precipitation Climatology Centre (GPCC) monthly precipitation data (Version 2020) during the period from 1981 to 2018 at a spatial resolution of 0.5° (http://gpcc.dwd.de/ accessed on 7 March 2022) [30,31] were used in the study. Gridded datasets were based on the ~85,000 stations worldwide that had records lasting 10 years or longer. GPCC data have been widely applied in global water cycle and drought studies [32,33,34], and the GPCC precipitation data (PRE) were resampled and averaged annually.
ERA5-land monthly 2 m temperature averaged data during the period from the 1981 to 2018 period at a spatial resolution of 0.1° (https://www.copernicus.eu/ accessed on 7 March 2022) [35,36] were used. ERA5-Land is a replay of the land component of the ERA5 climate reanalysis, forced by meteorological fields from ERA5. ERA5 is the fifth generation ECMWF atmospheric reanalysis of the global climate. ERA5-land data have been widely applied in hydrological cycles and global climate change [37,38,39]. The ERA5-land temperature data (TMP) were resampled to average annually and 0.5° resolution with the nearest neighborhood method to match the spatial resolution of the precipitation dataset.
2.2.2. Soil Moisture Data
Global Land Evaporation Amsterdam Model (GLEAM) yearly soil moisture data (version 3.5a) during the period from 1981 to 2018 at a spatial resolution of 0.25° (https://www.gleam.eu/ accessed on 7 March 2022) [40,41,42] were used, including surface soil moisture (SMsurf) and deeper soil moisture (SMdeeper). GLEAM is a set of algorithms that separately estimate the different components of terrestrial evaporation based on satellite observations. GLEAM soil moisture data have been widely applied in terrestrial evapotranspiration and soil desiccation studies [43,44,45]. The GLEAM soil moisture data (SMsurf and SMdeeper) were resampled to a 0.5° resolution to match the spatial resolution of the climate datasets.
2.2.3. Potential Evapotranspiration and Evapotranspiration
Climatic Research Unit gridded Time Series (CRU TS) is a climate dataset (version TS4.00) on a 0.5° × 0.5° grid over all land domains of the world except Antarctica, which is derived by the interpolation of monthly climate anomalies from extensive networks of weather station observations (https://www.uea.ac.uk/ accessed on 7 March 2022) [46,47]. In this dataset, potential evapotranspiration (PET) is calculated using the Penman–Monteith formula [48]. The CRU TS data have been widely applied in water balance and the evolution of drought studies [49,50,51]. The dataset of potential evapotranspiration was selected from 1981 to 2018 and resampled to average annually and 0.5° resolution to match the spatial resolution of the climate datasets.
GLEAM yearly actual evaporation data (version 3.5a) during the period from 1981 to 2018 at a spatial resolution of 0.25° were used. The GLEAM actual evapotranspiration data (ET) were resampled to a 0.5° resolution to match the spatial resolution of the climate datasets.
2.2.4. Leaf Area Index (LAI) Data
The Global Land Surface Satellite (GLASS) product is primarily based on NASA’s Advanced Very High Resolution Radiometer (AVHRR) long-term data record (LTDR) and Moderate Resolution Imaging Spectroradiometer (MODIS) data, in conjunction with other satellite data and ancillary information using general regression neural networks (http://www.glass.umd.edu/ accessed on 7 March 2022) [52,53,54]. Currently, these products (version 50) are officially released leaf area index (LAI) images of 8 days from 1981 to 2018 based on NASA’s AVHRR. The GLASS LAI dataset is appropriate for the study of long-term global vegetation dynamics and has been widely used for various research purposes [55,56,57,58,59].
To verify the quality and availability of GLASS LAI data, GIMMS LAI and GLOBAMAP LAI datasets were adopted. The Global Inventory Modelling and Mapping Study (GIMMS) LAI3 g (version 4.0) dataset provides the longest global LAI time series from July 1981 to December 2016, with a resolution of 1/12° and a temporal resolution of 15 days. It was generated from AVHRR GIMMS NDVI3 g using an Artificial Neural Network-derived model [60]. The globmap leaf area index product (version 3) provides highly consistent long time-series leaf area index (LAI) data worldwide [61]. The GLOBMAP LAI is a combination of the AVHRR and MODIS LAI, with global coverage at a 15-day temporal resolution and an 8 km spatial resolution for the period from 1981 to 2018 [57]. The datasets of LAI were nearest resampled to 0.5° resolution and averaged annually [58].
2.2.5. Land Cover Data
The MODIS Land Cover Type Product (MCD12Q1) (http://modis-land.gsfc.nasa.gov/ accessed on 7 March 2022) [62,63] supplies global maps of land cover at annual time steps and 0.05° spatial resolution for 2001–present. The product contains the International Geosphere-Biosphere Programme (IGBP) legacy classification scheme in each 0.05° pixel, which was classified using the C4.5 decision tree algorithm that ingested a full year of 8-day MODIS nadir BRDF-adjusted reflectance [64,65,66]. A total of 450 MODIS Land Cover Type Product images of 8 days from 2004 to 2013 were selected to composite the annual average image and classify the type of vegetation in drylands between 30 and 50° N. Congener vegetations were combined and divided into habitats of trees, shrubs, and grasses. The images were resampled to 0.5° resolution with the nearest neighborhood method to match the spatial resolution of the climate datasets.
Before the actual research analysis was undertaken, considerable work was carried out to classify vegetation. According to MCD12Q1 land cover data and the IGBP classification scheme, the vegetation in the study area was divided into forest, shrublands, and grasslands. Forests and shrublands were “woody vegetation”, while grasslands and savannas were “herbaceous vegetation” (Table A1 and Figure A1 and Figure A2). Among them, woody vegetation and herbaceous vegetation accounted for 18% and 72%, respectively.
2.3. Method
2.3.1. Principal Component Analysis (PCA)
Many spatial datasets are highly dimensional and, as such, can be difficult to visualize and interpret. Therefore, it is often of interest to reduce the dimensionality of the data [67]. To screen and reconfirm the indices affecting vegetation LAI, principal component analysis (PCA) is established to explain the correlation degree between the mean value of water factor indices and LAI in the study area from 1981 to 2018 [68]. It is used to reduce the dimensionality of the multivariate dataset by extracting the information in the form of a small number of principal components, and the main principal factors can be extracted containing all the required information [69]. In the PCA, each principal component (PC) represents the direction of one eigenvector. The score on each PC represents the projection of each variable onto it, which is the weight of the variable. Loading represents the degree of correlation between each variable and PC. The cumulative variance contribution rate is often used as an index to judge the number of PCs. In general, the cumulative contribution rate is greater than 0.8. Before PCA, all variables are normalized.
2.3.2. Linear Regression Analysis
To analyze the trends in meteorological data, soil moisture data, and vegetation LAI from 1981 to 2018, a linear regression analysis method was established [70]. One-dimensional linear regression analysis of the trends is a method that can reflect the long-term dynamics of long time-series data. It is used to calculate spatiotemporal variations in variates [71,72,73]. The significance of these changes was determined using a T test at three significance levels of 0.05, 0.01, and 0.001.
2.3.3. Pearson Correlation Coefficient
The Pearson correlation coefficient (Pearson’s r) is a measure of linear correlation between two sets of data [74]. It is essentially a normalized measurement of the covariance, such that the result always has a value between −1 and 1. We performed Pearson’s correlations to analyze the linear relationships between vegetation growth influencing factors and LAI from 1981 to 2018 [75]. The significance of these changes was determined at a significance level of 0.05.
2.3.4. Partial Correlation Analysis
The partial correlation coefficient is used to study the correlation between an independent variable and the dependent variable by excluding the impact of the other independent variables [76]. For this research, we used the partial correlation coefficient to explore the relationship between climate variables and LAI, soil moisture, and LAI in areas where the LAI growth trend is higher than the average trend and LAI decline [77]. The significances of the calculated partial correlations at three significance levels were 0.05, 0.01 and 0.001.
2.3.5. Space Weighted Average
The spatial mean of the dataset was calculated, but the spatial variability of the pixel area cannot be solved due to the ordinary arithmetic mean. To solve the problem that the mean value of raster data varies with latitude area, Equation (1) was adopted. It was used to calculate the weighted average of the raster dataset over the entire study area [78].
where is the total mean of the regional variable, is the value of the variable at each raster data point, and is the latitude of the raster data point.
3. Results
3.1. Meteorological Characteristics
3.1.1. Spatial Patterns of Temperature (TMP), Potential Evapotranspiration (PET), and Precipitation (PRE)
As shown in Figure 3, TMP, PET, and PRE are highly spatially heterogeneous in the drylands between 30 and 50° N. The multiyear mean TMP in most areas of the study area was over 0 °C and varied from −13.89 °C to 26.72 °C, except that the multiyear mean TMPs in the mountainous areas of eastern Central Asia, the Qinghai–Tibet Plateau, and the northern Mongolia Plateau were less than 0 °C. The high TMPs with multiyear mean temperatures exceeding 20 °C were mainly concentrated in the drylands in the south-western United States, southern Central Asia, northern Africa, and southern Mediterra-nean, where the highest multiyear mean TMP reached 26.7 °C. The low TMP was mainly concentrated in the northern part of the study area, and the spatial distribution of temper-ature was affected by latitude and elevation. The temperature tended to decrease as the altitude and latitude changed from low to high.
The multiyear mean PET in the study area ranged from 596 mm to 2438 mm and decreased from south to north as a whole. High PET values exceeding 1200 mm per year were widely distributed in most areas of the study area, including the drylands of the southwestern United States, southern Mediterranean region, southern Central Asia, and arid and semiarid areas in China. As shown in Figure 3b, the multiyear mean PET was generally higher in hyperarid regions but lower in arid and semiarid regions. PET was affected by radiation and hydrothermal conditions, and the distribution of PET in drylands did not completely follow the distribution of the AI index. At the same time, the multiyear mean PET showed an increase in stratification from north to south in North America and Central Asia.
However, the multiyear mean PRE ranged from 22 mm to 1124 mm in the study area. In addition to the southwestern drylands of the United States, southern Mediterranean, and most of the drylands of Asia, many of the areas showed low annual PREs, with some regions far below 350 mm per year. The distribution of the multiyear mean PRE was similar to that of the AI in the study area. The low multiyear mean PRE below 500 mm occupied most of the study area and showed large to small change trends from humid to arid regions.
Although high PET was associated with radiation, wind speed, and vapor pressure differences, PET and PRE with long-term uneven spatial distributions were affected by differences in geography.
3.1.2. Temporal Variations in Temperature (TMP), Potential Evapotranspiration (PET), and Precipitation (PRE)
Figure 4 shows the temporal trends of the average annual TMP, PET, and PRE of the entire study area from 1981 to 2018. The average annual TMP (slope = 0.04, p < 0.001) and PET (slope = 1.53, p < 0.001) showed significant interannual increasing trends, but the average annual PRE showed an insignificant trend (slope = 1.53, p > 0.05). However, there were substantial differences in the changes in TMP, PET, and PRE in different regions reflecting different vegetation types (Figure 5). While the TMP in most regions showed an increasing trend, the TMP variation ranges of vegetation points varied between 0 °C and 0.12 °C per year, with most in the range of 0.3 °C to 0.06 °C per year. The PET variation ranges of vegetation points varied between −1.73 mm and 0.12 mm per year. The grid points with greater PET increases were mainly distributed in the central drylands of North America, the drylands in western Central Asia, and the drylands in northeast East Asia. Even though PRE had no significant trend overall (Figure 4c) and had no significant trends in European and Asian areas, PRE had significant decreasing trends in North American drylands.
3.2. Vegetation Conditions and Changes
3.2.1. Vegetation Leaf Area Index (LAI) Conditions
To represent the spatial variation in vegetation across the study area, GLASS LAI annual average data from 1981 to 2018 were applied (Figure A4). With the GIMMS LAI dataset and the GLOBAMAP LAI dataset [56], the temporal variation trends and anomalies of LAI in the whole study area were verified (Figure 6 and Figure A3).
All three LAI datasets in the study area showed significant increasing trends at a similar rate of 0.002 per year. Although LAI trends differ in spatial distribution, the LAI trend indicates the possibility of overall greening of vegetation in the study area (Figure A3). Compared with the LAI datasets of GLASS and GLOBAMAP, the LAI of GIMMS had larger anomalies in the study area, and the fitted trend line was significantly lower. Even though the fitting trend lines of GLASS and GLOBAMAP passed the significance test (p < 0.001), according to relevant literature [56,79], the global change in GLASS LAI is significant and more sensitive to drought than GLOBAMAP LAI. Therefore, the GLASS LAI dataset was chosen for further analysis.
3.2.2. Regional LAI Change
As shown in Figure 7, the vegetation LAI of EA, CA, and MD showed significant increasing trends over a 38-year period from 1981 to 2018 (MD: slope = 0.006, p < 0.001; CA: slope = 0.001, p < 0.001; EA: slope = 0.001, p < 0.01). However, there was no obvious trend of vegetation LAI increase in drylands of NA in terms of the region as a whole. The regional average LAI of drylands in the MD was at a high level, and the growth rate was the largest among the four regions. Compared to those of NA and MD, the regional average LAI changes of EA and CA were in a state of low fluctuation.
Given that the spatial distribution of vegetation variation trends was not uniform, the spatial variation trends of the annual average vegetation LAI in the four regions were analyzed (Figure 8).
In the drylands of NA, vegetation LAI increased significantly (> 0.006 per year) in the eastern parts of the drylands (0.2 ≤ AI < 0.5), where the terrain was flat and the altitude was low, while it decreased significantly in the central mountains and southwestern plains of the drylands (< −0.006 per year). In the Mediterranean surrounding area, most of the vegetation LAI showed significant increasing trends at higher elevations, where increasing trends exceeded 0.002 per year. For the vegetation LAI in the drylands of CA, grid points where vegetation LAI showed significant increases were scattered throughout the region, but most were concentrated in the southeastern part of drylands. In addition, the significant increasing trends of EA vegetation LAI were concentrated in the southeastern part of drylands in East Asia, while the significant decreasing trends were concentrated in the northwestern part of East Asia. It is worth noting that in the borderlands of southeast CA and northwest EA, AI shows a transition from semiarid to dry subhumid, and the elevations here were higher than the average elevations of the two regions. In the drylands of four typical regions, in general, the vegetation in the high-altitude area showed significant increasing trends, while the vegetation in the more arid area showed trends of browning and significant decrease. The overall situation of vegetation change trends in the four regions is shown in Table 1.
3.3. Relationship between the LAI and Effect Variables
3.3.1. Main Influencing Variables of LAI Based on PCA
The PCA method was applied to analyze and screen the main variables influencing vegetation LAI changes in the study area. Among them, the LAI, SMsurf, SMdeeper, PET, PRE, TMP, and ET were averaged over 38 years from 1981 to 2018.
As shown in Figure 9, we conducted a principal component analysis on the datasets in drylands between 30 and 50°N. The results showed that the first two principal components (PC1 and PC2) explained 79% of the variance: 53% by PC1 and 26% by PC2. PC3 explained 10% of the total variance. The correlation coefficients between the first principal component (PC1) and LAI, SMsurf, SMdeeper, PRE, and ET were large. The first principal component was a linear combination of LAI, SMsurf, SMdeeper, PRE, and ET, and the original variables all had positive effects on vegetation growth. From the loading figure of PC1, vegetation LAI may be related to precipitation and soil moisture (SMsurf and SMdeeper) from the perspective of vegetation growth water. The correlation coefficients between the second principal component (PC2) and PET and TMP were large, so the second principal component is a linear combination of PET and temperature, both of which have a positive effect on vegetation growth. From the loading figure of PC2, PET and TMP were positively correlated, indicating that the vegetation greening caused by the rise in PET may be related to the rise in TMP in the drylands of the study area. However, it is worth noting that the correlation coefficients between the first principal component (PC1) and SMsurf and SMdeeper were positive and that between PC1 and LAI was negative. Therefore, it is worth exploring the effect of precipitation soil moisture on dryland vegetation changes.
3.3.2. Relationship between the LAI and Precipitation and Soil Moisture
The Pearson correlation coefficient was calculated to evaluate the responses of the vegetation LAI to precipitation and soil moisture from 1981 to 2018. As shown in Figure 10, the relationship between LAI and precipitation showed strong correlations in the eastern part of NA drylands and the northeastern part of EA drylands. However, in CA and MD drylands, the spatial distribution of correlation coefficients between LAI and precipitation showed fragmentation and discontinuity, and some of these properties at a few sites passed the significance test. The correlation coefficients between LAI and surface soil moisture and deeper soil mois-ture also had a similar spatial distribution pattern as those between LAI and precipitation, which are shown in Figure A5 and Figure A6. However, as shown in Table 2, the Pearson coefficients for the relationships between the LAI and PRE and SMsurf and SMdeeper in the four regions were different in terms of proportions. In the long time series of 38 years, compared with MD and CA vegetation, NA and EA vegetation had stronger responses to PRE, SMsurf, and SMdeeper.
However, due to the influence of precipitation lag, the annual average vegetation LAI has no significant responses to precipitation in some regions within a year [80,81,82,83]. Based on this lack of response, the 12-month LAI and monthly mean values of precipitation were analyzed in the four study regions (NA, MD, CA, and EA). Monthly LAI data were obtained by the maximum value synthesis method compositing the 8-day time step of the GLASS LAI dataset. The maximum value synthesis method has reduced directional reflectance and off-nadir viewing effects, minimizes sun-angle and shadow effects, and minimizes aerosol and water-vapor effects [84]. The correlation coefficients between them with monthly variation were used to characterize the lag responses of LAI to precipitation.
As shown in Figure 11, there were vegetation LAI lag responses of 2–4 months and 4–6 months to precipitation in the drylands of CA and MD. These results also explained why there were many fragmented white grid points distributed on the map of LAI in response to precipitation and soil moisture based on annual mean value data in the two regions. Compared with CA, the lag response of vegetation in MD to precipitation was more serious. However, there were no obvious vegetation LAI lag responses in the drylands of NA and EA.
3.3.3. Long-Term Vegetation LAI Changes under the Influence of Precipitation and Soil Moisture
To identify the main factors affecting regional vegetation LAI, the variation trends of precipitation, surface soil moisture, and deeper soil moisture in the four regions from 1981 to 2018 are shown in Figure 12. In the trends of regional precipitation, no significant trends were evident in the four regions. The regional surface soil moisture and deeper soil moisture in the drylands of CA (slope = −0.002, p < 0.05) and NA (slope = −0.006, p < 0.01; slope = −0.004, p < 0.05) showed significant downwards trends.
Meanwhile, a partial correlation analysis was performed to evaluate the relationship between the 38-year average LAI and precipitation, surface soil moisture, and deeper soil moisture in the places where LAI increasing trends were greater than the regional average and LAI decreased significantly (Figure 7). As shown in Table 3, drylands where LAI decreased significantly (slope < 0 per year) exhibited positive correlations (p < 0.001) between LAI and SMsurf and negative correlations (p < 0.001) between LAI and SMdeeper in NA, MD, and EA. The correlations between LAI and PRE exhibited positive correlations (p < 0.001) in NA, CA, and EA. However, drylands where LAI increasing trends were greater than the regional average (slope > 0.001 and 0.006 per year) exhibited positive correlations (p < 0.001) between LAI and SMsurf in all four regions and negative correlations (p < 0.001) between LAI and SMdeeper in NA, MD, and EA. The correlations between LAI and PRE were positive (p < 0.001) in all four regions.
4. Discussion
4.1. Validation and Spatial Differentiation of Dryland Vegetation Greening
Global vegetation greening has become a widely recognized scientific phenomenon, and previous studies have indicated that increases in vegetation growth are due to the ease of climatic constraints and fertilization effects of elevated CO2 concentrations [85,86,87]. Related studies on global vegetation greening trend tests based on sensed data estimated that vegetation in the middle latitudes of the Northern Hemisphere showed a significant increasing trend overall, but there were certain differences in space, and the areas with more vegetation increases were mainly concentrated in the southeastern US, northern India, Mediterranean Northern regions and southeastern China [88,89,90,91,92]. At the same time, in high-altitude areas such as the Qinghai–Tibet Plateau, energy restriction is obvious for vegetation, and water conditions are not the only condition limiting vegetation growth [77,93,94].
However, this study found that due to water stress exacerbated by serious drought, vegetation decreased significantly in the drylands of Eurasia, Inner Asia, and the southwestern United States, which was shown by previous findings [95,96,97]. The greening of dryland vegetation may need further validation.
In this paper, a linear regression method was used to verify the greening of dryland vegetation in the north temperate mid-latitudes from 1981 to 2018 and to describe the interregional and intraregional variation characteristics of LAI changes. The slope of the linear regression equation represented the vegetation change at the grid point. This study found that there was a significant increase at a rate of 0.002 per year in the northern temperate midlatitude drylands and significant trends of vegetation greening in the drylands of the Mediterranean, Central Asia, and East Asia. These results are consistent with previous findings of vegetation greening in dryland areas of the Mediterranean, the Middle East, Northern China, and Mongolia [98,99,100,101]. Compared to previous studies, this study shows the following novel results: (1) Under the same water constraint conditions, the greening tendency and degree of vegetation at high altitudes were greater than those at low altitudes in drylands in the north temperate mid-latitudes, and (2) the greening rate of dryland vegetation does not completely follow the gradient distribution of the aridity index.
4.2. Vegetation Changes Response to Precipitation and Soil Moisture with Evapotranspiration Involved
Evapotranspiration (ET) represents the change state of dryland vegetation to a certain extent. ET is one of the biggest data gaps in water management [102]; it plays an important role in dryland water and energy cycles with large spatial heterogeneity and accounts for 88% of precipitation [29,103,104]. In areas where grassland is widely distributed, especially in our study area (herbaceous vegetation mainly), intense drought limits the supply level of water resources, and vegetation is more sensitive to precipitation than other influencing factors, such as temperature. According to the PCA results in our study (Figure 9), LAI, PRE, and ET are closely correlated on PC1. The transpiration/evapotranspiration (T/ET) values of natural ecosystems could be up to 0.85 in drylands. In long time-series statistics, evaporation and transpiration in dryland ecosystems were equivalents [105]. The mean transpiration rate is directly linked to the productivity of ecosystems from the vegetation point of view [106].
Evapotranspiration is an important part of heat flux and water exchange between the soil and atmosphere, and it is also one of the processes in which vegetation participates in the carbon budget of the global ecosystem. Shallow soil moisture (0–20 cm) can be rapidly lost by evaporation during dry periods [107]; however, it is an important water source for shallow-rooted herbaceous plants [108,109]. Deep soil moisture (20–60 cm) is primarily used for transpiration [110,111,112] for deeper-rooted woody plants. In our study, vegetation LAI’s strong responses to surface soil moisture content were closely related to years of rain, but the negative correlation between long-term vegetation LAI changes and deeper soil moisture showed that in drylands, in addition to the evaporation of surface soil moisture dissipation, deeper soil water in shallow roots is not used by vegetation. Deeper soil water drainage to deeper soil results in soil water drought [113,114]. Because of the hydraulic uplift of vegetation roots, the moisture of deeper soil moisture is reduced by some deep roots absorbing water from deeper soil layers and then releasing soil water into shallower soil by shallower vegetation roots in arid habitats [115,116,117,118]. The greening of dryland vegetation has resulted in excessive consumption of soil water resources and the formation of dry soil layers [119].
It is worth noting that increased TMP and PET, coupled with no significant change in precipitation, may increase the severity of dryland drought in the mid-latitudes of the North temperate zone as a manifestation of dryland expansion. Even if there were declines in individual years, the continuous rises of the multiyear mean temperature in the study area were the concentrated embodiment of global warming in local regional temperature changes.
4.3. Implications and Limitations
In this study, the trend of vegetation greening and its response to precipitation and soil water in the north temperate mid-latitudes were analyzed. The work is conducted without considering surface runoff and groundwater recharge [120,121,122,123].
Meanwhile, vegetation greening is a combination of a warming climate and human activities. Anthropogenic activities, such as fire [75,124,125], grazing and afforestation [92,126,127], also influence vegetation changes in the regions. Under the influence of climate change and human activities, we will continue to explore the effects of vegetation dryland vegetation greening on the hydrological cycle with groundwater and surface water participation in the future.
5. Conclusions
This study reveals the trends of dryland vegetation growth and its response to precipitation and soil moisture in the north temperate mid-latitudes from 1981 to 2018 under global warming. The average TMP, PET, and LAI increased at 0.04 °C, 1.53 mm and 0.002 per year from 1981 to 2018 in the study area, respectively. Dryland vegetation in the study area has a certain spatial heterogeneity in spatial distribution and variation trend and has a high response to precipitation and soil moisture. LAI grew faster in the eastern dryland of NA, dryland along the Mediterranean Sea, southeastern dryland of CA, and southeastern dryland of EA. There is a strong relationship between vegetation growth and regional water supply patterns. The regions with strong correlations between LAI and PRE, SMsurf and SMdeeper were located in the eastern and southwestern drylands of NA, the western dryland of MD, the southern drylands of CA, and the eastern drylands of EA. Our results are helpful for understanding vegetation dynamics in the drylands of northern temperate mid-latitudes and may play an important guiding role in vegetation protection against the background of global warming.
Author Contributions
Formal analysis, Z.Y.; investigation, Z.Y.; writing—original draft, Z.Y. and P.W.; conceptualization, T.W. and P.W.; data curation, Z.Y.; writing—review and editing, T.W. and J.Y.; funding acquisition, P.W. and J.Y.; methodology, T.W.; validation, T.W.; supervision, P.W. and J.Y.; software, T.W. All authors have read and agreed to the published version of the manuscript.
Funding
This study was funded by grants from the National Natural Science Foundation of China (NSFC) (Nos. 42071042 and 41877165), the Natural Science Foundation of Henan (No. 222300420327) and the Key Research Projects of Henan Higher Education Institutions (No. 22A170020).
Institutional Review Board Statement
Not applicable.
Informed Consent Statement
Not applicable.
Data Availability Statement
The datasets used and/or analyzed during the present study are available from the corresponding author on reasonable request.
Acknowledgments
The authors are grateful to our colleagues Shangyu Shi, Shiqi Liu, and Qiwei Huang for their advice. The authors gratefully acknowledge Dragana Panic, the anonymous associate editor, and two anonymous reviewers for their valuable comments and suggestions, which have led to substantial improvements over an earlier version of the manuscript.
Conflicts of Interest
The authors declare no conflict of interest.
Appendix A

Table A1.
Vegetation classification in the study area.
| Vegetation Biomes | Features (Vegetation Cover) | Vegetation Distribution | Reclassified Vegetation Types | |
|---|---|---|---|---|
| Woody | Herbaceous | |||
| Evergreen Needleleaf Forests | >60% | - | forestland | Woody vegetation |
| Evergreen Broadleaf Forests | >60% | - | ||
| Deciduous Needleleaf Forests | >60% | - | ||
| Deciduous Broadleaf Forests | >60% | - | ||
| Mixed Forests | >60% | - | ||
| Closed Shrublands | >60% | - | shrubland | |
| Open Shrublands | 10–60% | - | ||
| Woody Savannas | 30–60% | - | ||
| Savannas | 10–30% | Dominated | grassland | Herbaceous vegetation |
| Grasslands | - | Dominated | ||
Figure A1.
Distributions of herbaceous and woody vegetation.

Figure A2.
Distributions of the sampling points.

Figure A3.
Spatial variation in vegetation LAI across the study area.

Figure A4.
Temporal variation trends and anomalies of GLASS, GIMMS and GLOBAMAP LAI (**, p < 0.01; ***, p < 0.001).
Figure A4.
Temporal variation trends and anomalies of GLASS, GIMMS and GLOBAMAP LAI (**, p < 0.01; ***, p < 0.001).

Figure A5.
Relationship between the LAI and surface soil moisture from 1981 to 2018 (p < 0.05) in (a) North America, (b) Mediterranean region, (c) Central Asia, and (d) East Asia.
Figure A5.
Relationship between the LAI and surface soil moisture from 1981 to 2018 (p < 0.05) in (a) North America, (b) Mediterranean region, (c) Central Asia, and (d) East Asia.

Figure A6.
Relationship between the LAI and deeper soil moisture from 1981 to 2018 (p < 0.05) in (a) North America, (b) Mediterranean region, (c) Central Asia, and (d) East Asia.
Figure A6.
Relationship between the LAI and deeper soil moisture from 1981 to 2018 (p < 0.05) in (a) North America, (b) Mediterranean region, (c) Central Asia, and (d) East Asia.

References
- Prăvălie, R. Drylands extent and environmental issues. A global approach. Earth-Sci. Rev. 2016, 161, 259–278. [Google Scholar] [CrossRef]
- Huang, J.; Yu, H.; Guan, X.; Wang, G.; Guo, R. Accelerated dryland expansion under climate change. Nat. Clim. Change 2016, 6, 166–171. [Google Scholar] [CrossRef]
- Huang, J.; Ji, M.; Xie, Y.; Wang, S.; He, Y.; Ran, J. Global semi-arid climate change over last 60 years. Clim. Dyn. 2016, 46, 1131–1150. [Google Scholar] [CrossRef] [Green Version]
- Maestre Fernando, T.; Quero José, L.; Gotelli Nicholas, J.; Escudero, A.; Ochoa, V.; Delgado-Baquerizo, M.; García-Gómez, M.; Bowker Matthew, A.; Soliveres, S.; Escolar, C.; et al. Plant Species Richness and Ecosystem Multifunctionality in Global Drylands. Science 2012, 335, 214–218. [Google Scholar] [CrossRef] [PubMed] [Green Version]
- Huang, J.; Li, Y.; Fu, C.; Chen, F.; Fu, Q.; Dai, A.; Shinoda, M.; Ma, Z.; Guo, W.; Li, Z. Dryland climate change: Recent progress and challenges. Rev. Geophys. 2017, 55, 719–778. [Google Scholar] [CrossRef]
- Carpenter, S.R.; DeFries, R.; Dietz, T.; Mooney, H.A.; Polasky, S.; Reid, W.V.; Scholes, R.J. Millennium ecosystem assessment: Research needs. Am. Assoc. Adv. Sci. 2006, 314, 257–258. [Google Scholar] [CrossRef]
- Yirdaw, E.; Tigabu, M.; Monge Monge, A.A. Rehabilitation of degraded dryland ecosystems–review. Silva Fenn. 2017, 51, 1673. [Google Scholar] [CrossRef] [Green Version]
- Tollefson, J. IPCC climate report: Earth is warmer than it’s been in 125,000 years. Nature 2021, 596, 171–172. [Google Scholar] [CrossRef]
- Feng, H.; Zhang, M. Global land moisture trends: Drier in dry and wetter in wet over land. Sci. Rep. 2015, 5, 18018. [Google Scholar] [CrossRef]
- Luo, M.; Liu, Y.Z.; Shao, T.B. Response of drylands’ water-cycle to the global warming. Int. J. Climatol. 2021, 41, 4587–4602. [Google Scholar] [CrossRef]
- Feng, S.; Fu, Q. Expansion of global drylands under a warming climate. Atmos. Chem. Phys. 2013, 13, 10081–10094. [Google Scholar] [CrossRef] [Green Version]
- El-Beltagy, A.; Madkour, M. Impact of climate change on arid lands agriculture. Agric. Food Secur. 2012, 1, 3. [Google Scholar] [CrossRef] [Green Version]
- Shukla, P.R.; Skeg, J.; Calvo Buendia, E.; Masson-Delmotte, V.; Pörtner, H.-O.; Roberts, D.C.; Zhai, P.; Slade, R.; Connors, S.; van Diemen, S.; et al. Climate Change and Land: An IPCC Special Report on Climate Change, Desertification, Land Degradation, Sustainable Land Management, Food Security, and Greenhouse Gas Fluxes in Terrestrial Ecosystems; Intergovernmental Panel on Climate Change (IPCC): Geneva, Switzerland, 2019.
- Lian, X.; Piao, S.L.; Chen, A.P.; Huntingford, C.; Fu, B.J.; Li, L.Z.X.; Huang, J.P.; Sheffield, J.; Berg, A.M.; Keenan, T.F.; et al. Multifaceted characteristics of dryland aridity changes in a warming world. Nat. Rev. Earth Environ. 2021, 2, 232–250. [Google Scholar] [CrossRef]
- Jiao, W.; Wang, L.; Smith, W.K.; Chang, Q.; Wang, H.; D’Odorico, P. Observed increasing water constraint on vegetation growth over the last three decades. Nat. Commun. 2021, 12, 3777. [Google Scholar] [CrossRef]
- He, B.; Wang, S.; Guo, L.; Wu, X. Aridity change and its correlation with greening over drylands. Agric. For. Meteorol. 2019, 278, 107663. [Google Scholar] [CrossRef]
- Piao, S.; Wang, X.; Park, T.; Chen, C.; Lian, X.; He, Y.; Bjerke, J.W.; Chen, A.; Ciais, P.; Tømmervik, H. Characteristics, drivers and feedbacks of global greening. Nat. Rev. Earth Environ. 2020, 1, 14–27. [Google Scholar] [CrossRef]
- Zhu, Z.; Piao, S.; Myneni, R.B.; Huang, M.; Zeng, Z.; Canadell, J.G.; Ciais, P.; Sitch, S.; Friedlingstein, P.; Arneth, A. Greening of the Earth and its drivers. Nat. Clim. Change 2016, 6, 791–795. [Google Scholar] [CrossRef]
- Zhang, P.; Xiao, P.Q.; Yao, W.Y.; Liu, G.B.; Sun, W.Y. Profile distribution of soil moisture response to precipitation on the Pisha sandstone hillslopes of China. Sci. Rep. 2020, 10, 9136. [Google Scholar] [CrossRef]
- Nicolai-Shaw, N.; Zscheischler, J.; Hirschi, M.; Gudmundsson, L.; Seneviratne, S.I. A drought event composite analysis using satellite remote-sensing based soil moisture. Remote Sens. Environ. 2017, 203, 216–225. [Google Scholar] [CrossRef]
- Dekker, S.C.; Rietkerk, M.; Bierkens, M.F.P. Coupling microscale vegetation-soil water and macroscale vegetation-precipitation feedbacks in semiarid ecosystems. Glob. Change Biol. 2007, 13, 671–678. [Google Scholar] [CrossRef] [Green Version]
- Seneviratne, S.I.; Corti, T.; Davin, E.L.; Hirschi, M.; Jaeger, E.B.; Lehner, I.; Orlowsky, B.; Teuling, A.J. Investigating soil moisture–climate interactions in a changing climate: A review. Earth-Sci. Rev. 2010, 99, 125–161. [Google Scholar] [CrossRef]
- Small, E.E.; Kurc, S.A. Tight coupling between soil moisture and the surface radiation budget in semiarid environments: Implications for land-atmosphere interactions. Water Resour. Res. 2003, 39, 1278. [Google Scholar] [CrossRef] [Green Version]
- Guillod, B.P.; Orlowsky, B.; Miralles, D.G.; Teuling, A.J.; Seneviratne, S.I. Reconciling spatial and temporal soil moisture effects on afternoon rainfall. Nat. Commun. 2015, 6, 6443. [Google Scholar] [CrossRef] [PubMed]
- Middleton, N.; Thomas, D. World Atlas of Desertification; United Nations Environment Programme (UNEP): London, UK, 1997; 182p. [Google Scholar]
- Barger, N.N.; Archer, S.R.; Campbell, J.L.; Huang, C.Y.; Morton, J.A.; Knapp, A.K. Woody plant proliferation in North American drylands: A synthesis of impacts on ecosystem carbon balance. J. Geophys. Res.-Biogeosci. 2011, 116, 17. [Google Scholar] [CrossRef]
- Zdruli, P. Desertification in the Mediterranean Region; European Institute of the Mediterranean (IEMed): Barcelona, Spain, 2011; pp. 250–254. [Google Scholar]
- Bai, J.; Shi, H.; Yu, Q.; Xie, Z.Y.; Li, L.H.; Luo, G.P.; Jin, N.; Li, J. Satellite-observed vegetation stability in response to changes in climate and total water storage in Central Asia. Sci. Total Environ. 2019, 659, 862–871. [Google Scholar] [CrossRef]
- Xia, J.Z.; Liang, S.L.; Chen, J.Q.; Yuan, W.P.; Liu, S.G.; Li, L.H.; Cai, W.W.; Zhang, L.; Fu, Y.; Zhao, T.B.; et al. Satellite-Based Analysis of Evapotranspiration and Water Balance in the Grassland Ecosystems of Dryland East Asia. PLoS ONE 2014, 9, e97295. [Google Scholar] [CrossRef]
- Global Precipitation Climatology Centre (GPCC). Available online: http://gpcc.dwd.de/ (accessed on 7 March 2022).
- Schneider, U.; Becker, A.; Finger, P.; Meyer-Christoffer, A.; Ziese, M. GPCC Full Data Monthly Product Version 2018 at 0.5°: Monthly land-surface precipitation from rain-gauges built on GTS-based and historical data. Glob. Precip. Climatol. Cent. 2018. [Google Scholar] [CrossRef]
- Schneider, U.; Finger, P.; Meyer-Christoffer, A.; Rustemeier, E.; Ziese, M.; Becker, A. Evaluating the Hydrological Cycle over Land Using the Newly-Corrected Precipitation Climatology from the Global Precipitation Climatology Centre (GPCC). Atmosphere 2017, 8, 52. [Google Scholar] [CrossRef] [Green Version]
- Schneider, U.; Becker, A.; Finger, P.; Meyer-Christoffer, A.; Ziese, M.; Rudolf, B. GPCC’s new land surface precipitation climatology based on quality-controlled in situ data and its role in quantifying the global water cycle. Theor. Appl. Climatol. 2014, 115, 15–40. [Google Scholar] [CrossRef] [Green Version]
- Ziese, M.; Schneider, U.; Meyer-Christoffer, A.; Schamm, K.; Vido, J.; Finger, P.; Bissolli, P.; Pietzsch, S.; Becker, A. The GPCC Drought Index—A new, combined and gridded global drought index. Earth Syst. Sci. Data 2014, 6, 285–295. [Google Scholar] [CrossRef] [Green Version]
- European Union’s Earth observation programme. Available online: https://www.copernicus.eu/ (accessed on 7 March 2022).
- Muñoz Sabater, J. ERA5-land monthly averaged data from 1981 to present, Copernicus Climate Change Service (C3S) Climate Data Store (CDS). Earth Syst. Sci. Data 2019, 55, 5679–5695. [Google Scholar] [CrossRef]
- Li, J.D.; Miao, C.Y.; Wei, W.; Zhang, G.; Hua, L.J.; Chen, Y.L.; Wang, X.X. Evaluation of CMIP6 Global Climate Models for Simulating Land Surface Energy and Water Fluxes During 1979–2014. J. Adv. Model. Earth Syst. 2021, 13, 32. [Google Scholar] [CrossRef]
- Kuo, Y.N.; Lo, M.H.; Liang, Y.C.; Tseng, Y.H.; Hsu, C.W. Terrestrial Water Storage Anomalies Emphasize Interannual Variations in Global Mean Sea Level During 1997–1998 and 2015–2016 El Nino Events. Geophys. Res. Lett. 2021, 48, 9. [Google Scholar] [CrossRef]
- Chen, X.N.; Yang, Y.P.; Ma, Y.Z.; Li, H. Distribution and Attribution of Terrestrial Snow Cover Phenology Changes over the Northern Hemisphere during 2001-2020. Remote Sens. 2021, 13, 1843. [Google Scholar] [CrossRef]
- Global Land Evaporation Amsterdam Model (GLEAM). Available online: https://www.gleam.eu/ (accessed on 7 March 2022).
- Martens, B.; Miralles, D.G.; Lievens, H.; van der Schalie, R.; de Jeu, R.A.M.; Fernandez-Prieto, D.; Beck, H.E.; Dorigo, W.A.; Verhoest, N.E.C. GLEAM v3: Satellite-based land evaporation and root-zone soil moisture. Geosci. Model Dev. 2017, 10, 1903–1925. [Google Scholar] [CrossRef] [Green Version]
- Miralles, D.G.; Holmes, T.R.H.; De Jeu, R.A.M.; Gash, J.H.; Meesters, A.; Dolman, A.J. Global land-surface evaporation estimated from satellite-based observations. Hydrol. Earth Syst. Sci. 2011, 15, 453–469. [Google Scholar] [CrossRef] [Green Version]
- Greve, P.; Orlowsky, B.; Mueller, B.; Sheffield, J.; Reichstein, M.; Seneviratne, S.I. Global assessment of trends in wetting and drying over land. Nat. Geosci. 2014, 7, 716–721. [Google Scholar] [CrossRef]
- Zhang, Y.Q.; Pena-Arancibia, J.L.; McVicar, T.R.; Chiew, F.H.S.; Vaze, J.; Liu, C.M.; Lu, X.J.; Zheng, H.X.; Wang, Y.P.; Liu, Y.Y.; et al. Multi-decadal trends in global terrestrial evapotranspiration and its components. Sci. Rep. 2016, 6, 12. [Google Scholar] [CrossRef] [Green Version]
- Martens, B.; Waegeman, W.; Dorigo, W.A.; Verhoest, N.E.C.; Miralles, D.G. Terrestrial evaporation response to modes of climate variability. npj Clim. Atmos. Sci. 2018, 1, 7. [Google Scholar] [CrossRef]
- University of East Anglia. Available online: https://www.uea.ac.uk/ (accessed on 7 March 2022).
- Harris, I.; Osborn, T.J.; Jones, P.; Lister, D. Version 4 of the CRU TS monthly high-resolution gridded multivariate climate dataset. Sci. Data 2020, 7, 109. [Google Scholar] [CrossRef] [Green Version]
- Allen, R.G.; Pereira, L.S.; Raes, D.; Smith, M. Crop evapotranspiration-Guidelines for computing crop water requirements-FAO Irrigation and drainage paper 56. FAO 1998, 300, D05109. [Google Scholar]
- Mutti, P.R.; Dubreuil, V.; Bezerra, B.G.; Arvor, D.; de Oliveira, C.P.; Silva, C. Assessment of Gridded CRU TS Data for Long-Term Climatic Water Balance Monitoring over the Sao Francisco Watershed, Brazil. Atmosphere 2020, 11, 1207. [Google Scholar] [CrossRef]
- Collins, B.; Etedali, H.R.; Tavakol, A.; Kaviani, A. Spatiotemporal variations of evapotranspiration and reference crop water requirement over 1957-2016 in Iran based on CRU TS gridded dataset. J. Arid Land 2021, 13, 858–878. [Google Scholar] [CrossRef]
- Perri, S.; Molini, A.; Hedin, L.O.; Porporato, A. Contrasting effects of aridity and seasonality on global salinization. Nat. Geosci. 2022, 15, 375–381. [Google Scholar] [CrossRef]
- The Global Land Surface Satellite (GLASS). Available online: http://www.glass.umd.edu/ (accessed on 7 March 2022).
- Liang, S.L.; Cheng, J.; Jia, K.; Jiang, B.; Liu, Q.; Xiao, Z.Q.; Yao, Y.J.; Yuan, W.P.; Zhang, X.T.; Zhao, X.; et al. The Global Land Surface Satellite (GLASS) Product Suite. Bull. Amer. Meteorol. Soc. 2021, 102, E323–E337. [Google Scholar] [CrossRef]
- Xiao, Z.Q.; Liang, S.L.; Wang, J.D.; Chen, P.; Yin, X.J.; Zhang, L.Q.; Song, J.L. Use of General Regression Neural Networks for Generating the GLASS Leaf Area Index Product From Time-Series MODIS Surface Reflectance. IEEE Trans. Geosci. Remote Sens. 2014, 52, 209–223. [Google Scholar] [CrossRef]
- Guli, J.; Liang, S.; Yi, Q.; Liu, J. Vegetation dynamics and responses to recent climate change in Xinjiang using leaf area index as an indicator. Ecol. Indic. 2015, 58, 64–76. [Google Scholar] [CrossRef]
- Huang, Y.; Gerber, S.; Huang, T.; Lichstein, J.W. Evaluating the drought response of CMIP5 models using global gross primary productivity, leaf area, precipitation, and soil moisture data. Glob. Biogeochem. Cycles 2016, 30, 1827–1846. [Google Scholar] [CrossRef]
- Zhu, Z.; Piao, S.; Lian, X.; Myneni, R.B.; Peng, S.; Yang, H. Attribution of seasonal leaf area index trends in the northern latitudes with “optimally” integrated ecosystem models. Glob. Change Biol. 2017, 23, 4798–4813. [Google Scholar] [CrossRef]
- Ran, Y.; Li, X.; Cheng, G. Climate warming over the past half century has led to thermal degradation of permafrost on the Qinghai–Tibet Plateau. Cryosphere 2018, 12, 595–608. [Google Scholar] [CrossRef] [Green Version]
- Chaudhari, S.; Pokhrel, Y.; Moran, E.; Miguez-Macho, G. Multi-decadal hydrologic change and variability in the Amazon River basin: Understanding terrestrial water storage variations and drought characteristics. Hydrol. Earth Syst. Sci. 2019, 23, 2841–2862. [Google Scholar] [CrossRef] [Green Version]
- Zhu, Z.C.; Bi, J.; Pan, Y.Z.; Ganguly, S.; Anav, A.; Xu, L.; Samanta, A.; Piao, S.L.; Nemani, R.R.; Myneni, R.B. Global Data Sets of Vegetation Leaf Area Index (LAI)3g and Fraction of Photosynthetically Active Radiation (FPAR)3g Derived from Global Inventory Modeling and Mapping Studies (GIMMS) Normalized Difference Vegetation Index (NDVI3g) for the Period 1981 to 2011. Remote Sens. 2013, 5, 927–948. [Google Scholar] [CrossRef] [Green Version]
- Liu, Y.; Liu, R.G.; Chen, J.M. Retrospective retrieval of long-term consistent global leaf area index (1981-2011) from combined AVHRR and MODIS data. J. Geophys. Res.-Biogeosci. 2012, 117, 14. [Google Scholar] [CrossRef]
- National Aeronautics and Space Administration Goddard Space Flight Center. Available online: http://modis-land.gsfc.nasa.gov (accessed on 7 March 2022).
- Sulla-Menashe, D.; Friedl, M.A. User guide to collection 6 MODIS land cover (MCD12Q1 and MCD12C1) product. USGS 2018, 1, 18. [Google Scholar] [CrossRef]
- Loveland, T.R.; Belward, A.S. The International Geosphere Biosphere Programme Data and Information System global land cover data set (DISCover). Acta Astronaut. 1997, 41, 681–689. [Google Scholar] [CrossRef]
- Belward, A.S.; Estes, J.E.; Kline, K.D. The IGBP-DIS global 1-km land-cover data set DISCover: A project overview. Photogramm. Eng. Remote Sens. 1999, 65, 1013–1020. [Google Scholar]
- Schaaf, C.B.; Gao, F.; Strahler, A.H.; Lucht, W.; Li, X.W.; Tsang, T.; Strugnell, N.C.; Zhang, X.Y.; Jin, Y.F.; Muller, J.P.; et al. First operational BRDF, albedo nadir reflectance products from MODIS. Remote Sens. Environ. 2002, 83, 135–148. [Google Scholar] [CrossRef] [Green Version]
- Demsar, U.; Harris, P.; Brunsdon, C.; Fotheringham, A.S.; McLoone, S. Principal Component Analysis on Spatial Data: An Overview. Ann. Assoc. Am. Geogr. 2013, 103, 106–128. [Google Scholar] [CrossRef]
- Pearson, K. On lines and planes of closest fit to systems of points in space. Philos. Mag. 1901, 2, 559–572. [Google Scholar] [CrossRef] [Green Version]
- Abdi, H.; Williams, L.J. Principal component analysis. Wiley Interdiscip. Rev. Comput. Stat. 2010, 2, 433–459. [Google Scholar] [CrossRef]
- Montgomery, D.C.; Peck, E.A.; Vining, G.G. Introduction to Linear Regression Analysis; John Wiley & Sons: Hoboken, NJ, USA, 2021. [Google Scholar]
- Wang, Y.; Yang, J.; Chen, Y.; Wang, A.; De Maeyer, P. The Spatiotemporal Response of Soil Moisture to Precipitation and Temperature Changes in an Arid Region, China. Remote Sens. 2018, 10, 468. [Google Scholar] [CrossRef] [Green Version]
- Luo, M.; Sa, C.; Meng, F.; Duan, Y.; Liu, T.; Bao, Y. Assessing remotely sensed and reanalysis products in characterizing surface soil moisture in the Mongolian Plateau. Int. J. Digit. Earth 2021, 14, 1255–1272. [Google Scholar] [CrossRef]
- Meng, F.; Luo, M.; Sa, C.; Wang, M.; Bao, Y. Quantitative assessment of the effects of climate, vegetation, soil and groundwater on soil moisture spatiotemporal variability in the Mongolian Plateau. Sci. Total Environ. 2022, 809, 152198. [Google Scholar] [CrossRef] [PubMed]
- Benesty, J.; Chen, J.; Huang, Y.; Cohen, I. Pearson correlation coefficient. In Noise Reduction in Speech Processing; Springer: Berlin/Heidelberg, Germany, 2009; pp. 1–4. [Google Scholar]
- Dong, C.Y.; MacDonald, G.M.; Willis, K.; Gillespie, T.W.; Okin, G.S.; Williams, A.P. Vegetation Responses to 2012-2016 Drought in Northern and Southern California. Geophys. Res. Lett. 2019, 46, 3810–3821. [Google Scholar] [CrossRef]
- Kenney, J.F.; Keeping, E.S. Mayhematics of Statistics; D. van Nostrand Company: New York, NY, USA, 1939. [Google Scholar]
- Wang, G.; Wang, P.; Wang, T.Y.; Zhang, Y.C.; Yu, J.J.; Ma, N.; Frolova, N.L.; Liu, C.M. Contrasting Changes in Vegetation Growth due to Different Climate Forcings over the Last Three Decades in the Selenga-Baikal Basin. Remote Sens. 2019, 11, 426. [Google Scholar] [CrossRef] [Green Version]
- Cowtan, K.; Jacobs, P.; Thorne, P.; Wilkinson, R.J.D. Statistical analysis of coverage error in simple global temperature estimators. Dyn. Stat. Clim. Syst. 2018, 3, dzy003. [Google Scholar] [CrossRef] [Green Version]
- Jiang, C.; Ryu, Y.; Fang, H.; Myneni, R.; Claverie, M.; Zhu, Z. Inconsistencies of interannual variability and trends in long-term satellite leaf area index products. Glob. Change Biol. 2017, 23, 4133–4146. [Google Scholar] [CrossRef]
- Cui, L.L.; Shi, J. Temporal and spatial response of vegetation NDVI to temperature and precipitation in eastern China. J. Geogr. Sci. 2010, 20, 163–176. [Google Scholar] [CrossRef]
- Liu, C.; Yan, X.Y.; Jiang, F.Q. Desert vegetation responses to the temporal distribution patterns of precipitation across the northern Xinjiang, China. Catena 2021, 206, 14. [Google Scholar] [CrossRef]
- Gessner, U.; Naeimi, V.; Klein, I.; Kuenzer, C.; Klein, D.; Dech, S. The relationship between precipitation anomalies and satellite-derived vegetation activity in Central Asia. Glob. Planet. Change 2013, 110, 74–87. [Google Scholar] [CrossRef]
- Ma, Y.J.; Shi, F.Z.; Hu, X.; Li, X.Y. Climatic Constraints to Monthly Vegetation Dynamics in Desert Areas Over the Silk Road Economic Belt. Remote Sens. 2021, 13, 995. [Google Scholar] [CrossRef]
- Holben, B.N. Characteristics of Maximum-Value Composite Images from Temporal AVHRR Data. Int. J. Remote Sens. 1986, 7, 1417–1434. [Google Scholar] [CrossRef]
- Pan, N.Q.; Feng, X.M.; Fu, B.J.; Wang, S.; Ji, F.; Pan, S.F. Increasing global vegetation browning hidden in overall vegetation greening: Insights from time-varying trends. Remote Sens. Environ. 2018, 214, 59–72. [Google Scholar] [CrossRef]
- Fensholt, R.; Langanke, T.; Rasmussen, K.; Reenberg, A.; Prince, S.D.; Tucker, C.; Scholes, R.J.; Le, Q.B.; Bondeau, A.; Eastman, R. Greenness in semi-arid areas across the globe 1981–2007—an Earth Observing Satellite based analysis of trends and drivers. Remote Sens. Environ. 2012, 121, 144–158. [Google Scholar] [CrossRef]
- Piao, S.L.; Friedlingstein, P.; Ciais, P.; Zhou, L.M.; Chen, A.P. Effect of climate and CO2 changes on the greening of the Northern Hemisphere over the past two decades. Geophys. Res. Lett. 2006, 33, 6. [Google Scholar] [CrossRef] [Green Version]
- Slayback, D.A.; Pinzon, J.E.; Los, S.O.; Tucker, C.J. Northern hemisphere photosynthetic trends 1982-99. Glob. Change Biol. 2003, 9, 1–15. [Google Scholar] [CrossRef]
- Xiao, J.; Moody, A. Geographical distribution of global greening trends and their climatic correlates: 1982-1998. Int. J. Remote Sens. 2005, 26, 2371–2390. [Google Scholar] [CrossRef]
- Beck, H.E.; McVicar, T.R.; van Dijk, A.; Schellekens, J.; de Jeu, R.A.M.; Bruijnzeel, L.A. Global evaluation of four AVHRR-NDVI data sets: Intercomparison and assessment against Landsat imagery. Remote Sens. Environ. 2011, 115, 2547–2563. [Google Scholar] [CrossRef]
- De Jong, R.; de Bruin, S.; de Wit, A.; Schaepman, M.E.; Dent, D.L. Analysis of monotonic greening and browning trends from global NDVI time-series. Remote Sens. Environ. 2011, 115, 692–702. [Google Scholar] [CrossRef] [Green Version]
- Mao, J.F.; Ribes, A.; Yan, B.Y.; Shi, X.Y.; Thornton, P.E.; Seferian, R.; Ciais, P.; Myneni, R.B.; Douville, H.; Piao, S.L.; et al. Human-induced greening of the northern extratropical land surface. Nat. Clim. Change 2016, 6, 959–963. [Google Scholar] [CrossRef]
- Zhang, G.L.; Zhang, Y.J.; Dong, J.W.; Xiao, X.M. Green-up dates in the Tibetan Plateau have continuously advanced from 1982 to 2011. Proc. Natl. Acad. Sci. USA 2013, 110, 4309–4314. [Google Scholar] [CrossRef] [PubMed] [Green Version]
- Peng, S.S.; Piao, S.L.; Ciais, P.; Myneni, R.B.; Chen, A.P.; Chevallier, F.; Dolman, A.J.; Janssens, I.A.; Penuelas, J.; Zhang, G.X.; et al. Asymmetric effects of daytime and night-time warming on Northern Hemisphere vegetation. Nature 2013, 501, 88–92. [Google Scholar] [CrossRef] [PubMed]
- Piao, S.L.; Wang, X.H.; Ciais, P.; Zhu, B.; Wang, T.; Liu, J. Changes in satellite-derived vegetation growth trend in temperate and boreal Eurasia from 1982 to 2006. Glob. Change Biol. 2011, 17, 3228–3239. [Google Scholar] [CrossRef]
- Parolari, A.J.; Katul, G.G.; Porporato, A. An ecohydrological perspective on drought-induced forest mortality. J. Geophys. Res.-Biogeosci. 2014, 119, 965–981. [Google Scholar] [CrossRef] [Green Version]
- Mohammat, A.; Wang, X.H.; Xu, X.T.; Peng, L.Q.; Yang, Y.; Zhang, X.P.; Myneni, R.B.; Piao, S.L. Drought and spring cooling induced recent decrease in vegetation growth in Inner Asia. Agric. For. Meteorol. 2013, 178, 21–30. [Google Scholar] [CrossRef]
- Osborne, C.P.; Woodward, F.I. Biological mechanisms underlying recent increases in the NDVI of Mediterranean shrublands. Int. J. Remote Sens. 2001, 22, 1895–1907. [Google Scholar] [CrossRef]
- Runnstrom, M.C. Is northern China winning the battle against desertification? Satellite remote sensing as a tool to study biomass trends on the Ordos Plateau in semiarid China. Ambio 2000, 29, 468–476. [Google Scholar] [CrossRef]
- Hellden, U.; Tottrup, C. Regional desertification: A global synthesis. Glob. Planet. Change 2008, 64, 169–176. [Google Scholar] [CrossRef]
- Nielsen, T.T.; Adriansen, H.K. Government policies and land degradation in the Middle East. Land Degrad. Dev. 2005, 16, 151–161. [Google Scholar] [CrossRef]
- Hashem, A.A.; Engel, B.A.; Bralts, V.F.; Marek, G.W.; Moorhead, J.E.; Rashad, M.; Radwan, S.; Gowda, P.H. Landsat Hourly Evapotranspiration Flux Assessment Using Lysimeters for the Texas High Plains. Water 2020, 12, 1192. [Google Scholar] [CrossRef]
- Sun, G.; Alstad, K.; Chen, J.Q.; Chen, S.P.; Ford, C.R.; Lin, G.H.; Liu, C.F.; Lu, N.; McNulty, S.G.; Miao, H.X.; et al. A general predictive model for estimating monthly ecosystem evapotranspiration. Ecohydrology 2011, 4, 245–255. [Google Scholar] [CrossRef]
- Pan, N.; Wang, S.; Liu, Y.; Li, Y.; Xue, F.; Wei, F.; Yu, H.; Fu, B. Rapid increase of potential evapotranspiration weakens the effect of precipitation on aridity in global drylands. J. Arid Environ. 2021, 186, 104414. [Google Scholar] [CrossRef]
- Sun, X.; Wilcox, B.P.; Zou, C.B. Evapotranspiration partitioning in dryland ecosystems: A global meta-analysis of in situ studies. J. Hydrol. 2019, 576, 123–136. [Google Scholar] [CrossRef]
- Laio, F.; Porporato, A.; Ridolfi, L.; Rodriguez-Iturbe, I. Plants in water-controlled ecosystems: Active role in hydrologic processes and response to water stress: II. Probabilistic soil moisture dynamics. Adv. Water Resour. 2001, 24, 707–723. [Google Scholar] [CrossRef]
- Gowing, J.W.; Konukcu, F.; Rose, D.A. Evaporative flux from a shallow watertable: The influence of a vapour-liquid phase transition. J. Hydrol. 2006, 321, 77–89. [Google Scholar] [CrossRef]
- Cavanaugh, M.L.; Kurc, S.A.; Scott, R.L. Evapotranspiration partitioning in semiarid shrubland ecosystems: A two-site evaluation of soil moisture control on transpiration. Ecohydrology 2011, 4, 671–681. [Google Scholar] [CrossRef]
- Szutu, D.J.; Papuga, S.A. Year-Round Transpiration Dynamics Linked With Deep Soil Moisture in a Warm Desert Shrubland. Water Resour. Res. 2019, 55, 5679–5695. [Google Scholar] [CrossRef] [Green Version]
- Sala, O.; Lauenroth, W.; Golluscio, R. 11 Plant functional types in temperate semi-arid regions. Plant Funct. Types Relev. Ecosyst. Prop. Glob. Change 1997, 1, 217. [Google Scholar]
- Schenk, H.J.; Jackson, R.B. Rooting Depths, Lateral Root Spreads and Below-Ground/Above-Ground Allometries of Plants in Water-Limited Ecosystems. J. Ecol. 2002, 90, 480–494. [Google Scholar] [CrossRef] [Green Version]
- Verbruggen, W.; Schurgers, G.; Horion, S.; Ardö, J.; Bernardino, P.N.; Cappelaere, B.; Demarty, J.; Fensholt, R.; Kergoat, L.; Sibret, T.; et al. Contrasting responses of woody and herbaceous vegetation to altered rainfall characteristics in the Sahel. Biogeosciences 2021, 18, 77–93. [Google Scholar] [CrossRef]
- Tietjen, B.; Jeltsch, F.; Zehe, E.; Classen, N.; Groengroeft, A.; Schiffers, K.; Oldeland, J. Effects of climate change on the coupled dynamics of water and vegetation in drylands. Ecohydrology 2010, 3, 226–237. [Google Scholar] [CrossRef]
- Tietjen, B.; Zehe, E.; Jeltsch, F. Simulating plant water availability in dry lands under climate change: A generic model of two soil layers. Water Resour. Res. 2009, 45, 14. [Google Scholar] [CrossRef]
- Lamusa, A.; Deruing, J.; Yongming, L.U.O. Review on Study Progress of Hydraulic Lift in Plant Roots. Arid Zone Res. 2008, 25, 236–241. [Google Scholar] [CrossRef]
- Siqueira, M.; Katul, G.; Porporato, A. Onset of water stress, hysteresis in plant conductance, and hydraulic lift: Scaling soil water dynamics from millimeters to meters. Water Resour. Res. 2008, 44, 14. [Google Scholar] [CrossRef]
- Kitajima, K.; Allen, M.F.; Goulden, M.L. Contribution of hydraulically lifted deep moisture to the water budget in a Southern California mixed forest. J. Geophys. Res.-Biogeosci. 2013, 118, 1561–1572. [Google Scholar] [CrossRef] [Green Version]
- Wang, T.Y.; Wang, P.; Wang, Z.L.; Niu, G.Y.; Yu, J.J.; Ma, N.; Wu, Z.N.; Pozdniakov, S.P.; Yan, D.H. Drought adaptability of phreatophytes: Insight from vertical root distribution in drylands of China. J. Plant Ecol. 2021, 14, 1128–1142. [Google Scholar] [CrossRef]
- Zhang, S.L.; Yang, Y.T.; McVicar, T.R.; Yang, D.W. An Analytical Solution for the Impact of Vegetation Changes on Hydrological Partitioning Within the Budyko Framework. Water Resour. Res. 2018, 54, 519–537. [Google Scholar] [CrossRef]
- Wang, T.Y.; Yu, J.J.; Wang, P.; Min, L.L.; Pozdniakov, S.P.; Yuan, G.F. Estimating groundwater evapotranspiration by phreatophytes using combined water level and soil moisture observations. Ecohydrology 2019, 12, e2092. [Google Scholar] [CrossRef]
- Luan, J.; Miao, P.; Tian, X.; Li, X.; Ma, N.; Abrar Faiz, M.; Xu, Z.; Zhang, Y. Estimating hydrological consequences of vegetation greening. J. Hydrol. 2022, 611, 128018. [Google Scholar] [CrossRef]
- Yuan, R.Q.; Chang, L.L.; Gupta, H.; Niu, G.Y. Climatic forcing for recent significant terrestrial drying and wetting. Adv. Water Resour. 2019, 133, 9. [Google Scholar] [CrossRef]
- Chang, L.L.; Yuan, R.Q.; Gupta, H.V.; Winter, C.L.; Niu, G.Y. Why Is the Terrestrial Water Storage in Dryland Regions Declining? A Perspective Based on Gravity Recovery and Climate Experiment Satellite Observations and Noah Land Surface Model With Multiparameterization Schemes Model Simulations. Water Resour. Res. 2020, 56, 17. [Google Scholar] [CrossRef]
- Caon, L.; Vallejo, V.R.; Ritsema, C.J.; Geissen, V. Effects of wildfire on soil nutrients in Mediterranean ecosystems. Earth-Sci. Rev. 2014, 139, 47–58. [Google Scholar] [CrossRef]
- Wilder, L.E.; Veblen, K.E.; Gunnell, K.L.; Monaco, T.A. Influence of fire and mechanical sagebrush reduction treatments on restoration seedings in Utah, United States. Restor. Ecol. 2019, 27, 308–319. [Google Scholar] [CrossRef]
- Miao, L.J.; Sun, Z.L.; Ren, Y.J.; Schierhorn, F.; Muller, D. Grassland greening on the Mongolian Plateau despite higher grazing intensity. Land Degrad. Dev. 2021, 32, 792–802. [Google Scholar] [CrossRef]
- Munkhzul, O.; Oyundelger, K.; Narantuya, N.; Tuvshintogtokh, I.; Oyuntsetseg, B.; Wesche, K.; Jaschke, Y. Grazing Effects on Mongolian Steppe Vegetation—A Systematic Review of Local Literature. Front. Ecol. Evol. 2021, 9, 13. [Google Scholar] [CrossRef]
Figure 1.
Distribution map of the drylands between 30 and 50°N.

Figure 2.
Elevation in the drylands between 30 and 50°N.

Figure 3.
Spatial distribution of the average annual temperature (TMP) (a), potential evapotranspiration (PET) (b), and precipitation (PRE) (c) over the study area from 1981 to 2018.
Figure 3.
Spatial distribution of the average annual temperature (TMP) (a), potential evapotranspiration (PET) (b), and precipitation (PRE) (c) over the study area from 1981 to 2018.

Figure 4.
Temporal variations in the average annual temperature (TMP) (a), potential evapotranspiration (PET) (b), and precipitation (PRE) (c) over the entire study area from 1981 to 2018 (*** p < 0.001).
Figure 4.
Temporal variations in the average annual temperature (TMP) (a), potential evapotranspiration (PET) (b), and precipitation (PRE) (c) over the entire study area from 1981 to 2018 (*** p < 0.001).

Figure 5.
Temporal trends of the average annual temperature (TMP) (a), potential evapotranspiration (PET) (b), and precipitation (PRE) (c) at vegetation distribution grid points from 1981 to 2018.
Figure 5.
Temporal trends of the average annual temperature (TMP) (a), potential evapotranspiration (PET) (b), and precipitation (PRE) (c) at vegetation distribution grid points from 1981 to 2018.

Figure 6.
Temporal variation trends of the leaf area index (LAI) over the entire study area from 1981 to 2018 (** p < 0.01; *** p < 0.001).
Figure 6.
Temporal variation trends of the leaf area index (LAI) over the entire study area from 1981 to 2018 (** p < 0.01; *** p < 0.001).

Figure 7.
Temporal variation trends of LAI in four regions from 1981 to 2018 (** p < 0.01; *** p < 0.001).
Figure 7.
Temporal variation trends of LAI in four regions from 1981 to 2018 (** p < 0.01; *** p < 0.001).

Figure 8.
Spatial distribution of the change trends (p < 0.05) of vegetation LAI over four regions (a) North America, (b) Mediterranean region, (c) Central Asia, and (d) East Asia from 1981 to 2018.
Figure 8.
Spatial distribution of the change trends (p < 0.05) of vegetation LAI over four regions (a) North America, (b) Mediterranean region, (c) Central Asia, and (d) East Asia from 1981 to 2018.

Figure 9.
Relationship between the LAI and effect variables based on PCA.

Figure 10.
Relationship between the LAI and PRE from 1981 to 2018 (p < 0.05) (a) North America, (b) Mediterranean region, (c) Central Asia, and (d) East Asia.
Figure 10.
Relationship between the LAI and PRE from 1981 to 2018 (p < 0.05) (a) North America, (b) Mediterranean region, (c) Central Asia, and (d) East Asia.

Figure 11.
Temporal variation lag effect of precipitation on vegetation LAI in four study regions: (a) North America, (b) Mediterranean region, (c) Central Asia, and (d) East Asia.
Figure 11.
Temporal variation lag effect of precipitation on vegetation LAI in four study regions: (a) North America, (b) Mediterranean region, (c) Central Asia, and (d) East Asia.

Figure 12.
Temporal variation trends of precipitation, surface soil moisture and deeper soil moisture over four regions from 1981 to 2018 (* p < 0.05; ** p < 0.01).
Figure 12.
Temporal variation trends of precipitation, surface soil moisture and deeper soil moisture over four regions from 1981 to 2018 (* p < 0.05; ** p < 0.01).

Table 1.
Statistical results of the LAI change trend in the four regions.
| Region | Trend Ratio (%) | ||
|---|---|---|---|
| Significant | Insignificant | ||
| Increasing | Decreasing | ||
| NA | 27.57 | 10.19 | 62.24 |
| MD | 56.23 | 2.37 | 41.40 |
| CA | 27.96 | 4.64 | 67.40 |
| EA | 23.94 | 11.70 | 64.36 |
| ALL | 31.54 | 7.96 | 60.51 |
Table 2.
Pearson coefficients for the relationships between the LAI and PRE, SMsurf, and SMdeeper in the four regions.
Table 2.
Pearson coefficients for the relationships between the LAI and PRE, SMsurf, and SMdeeper in the four regions.
| Relationship | Regions | Correlation Ratio (%) | ||
|---|---|---|---|---|
| Significant | Insignificant | |||
| Positive | Negative | |||
| LAI and PRE | NA | 33.50 | 1.44 | 65.06 |
| MD | 12.95 | 0.25 | 86.80 | |
| CA | 21.38 | 0.26 | 78.35 | |
| EA | 34.49 | 0.44 | 65.07 | |
| ALL | 27.51 | 0.74 | 71.75 | |
| LAI and SMsurf | NA | 38.13 | 1.99 | 59.88 |
| MD | 19.55 | 2.37 | 78.08 | |
| CA | 22.79 | 0.35 | 76.86 | |
| EA | 33.33 | 1.15 | 65.51 | |
| ALL | 30.38 | 1.48 | 68.15 | |
| LAI and SMdeeper | NA | 38.24 | 2.05 | 59.71 |
| MD | 18.43 | 2.62 | 78.95 | |
| CA | 24.98 | 0.44 | 74.58 | |
| EA | 31.83 | 0.89 | 67.29 | |
| ALL | 30.40 | 1.50 | 68.11 | |
Table 3.
Partial correlation coefficient between LAI and precipitation, surface soil moisture, and deeper soil moisture (*, p < 0.05; ***, p < 0.001).
Table 3.
Partial correlation coefficient between LAI and precipitation, surface soil moisture, and deeper soil moisture (*, p < 0.05; ***, p < 0.001).
| Regions | LAI Trends | SMsurf | SMdeeper | PRE |
|---|---|---|---|---|
| NA | <0 yr−1 | 0.49 *** | −0.44 *** | 0.57 *** |
| >0.001 yr−1 | 0.35 *** | −0.35 *** | 0.71 *** | |
| MD | <0 yr−1 | 0.61 *** | −0.61 *** | 0.43 |
| >0.006 yr−1 | 0.48 *** | −0.47 *** | 0.38 *** | |
| CA | <0 yr−1 | −0.18 | 0.23 | 0.77 *** |
| >0.001 yr−1 | 0.13 * | −0.10 | 0.55 *** | |
| EA | <0 yr−1 | 0.50 *** | −0.51 *** | 0.65 *** |
| >0.001 yr−1 | 0.35 *** | −0.29 *** | 0.26 *** |
Publisher’s Note: MDPI stays neutral with regard to jurisdictional claims in published maps and institutional affiliations. |
© 2022 by the authors. Licensee MDPI, Basel, Switzerland. This article is an open access article distributed under the terms and conditions of the Creative Commons Attribution (CC BY) license (https://creativecommons.org/licenses/by/4.0/).
Share and Cite
MDPI and ACS Style
Yu, Z.; Wang, T.; Wang, P.; Yu, J. The Spatiotemporal Response of Vegetation Changes to Precipitation and Soil Moisture in Drylands in the North Temperate Mid-Latitudes. Remote Sens. 2022, 14, 3511. https://doi.org/10.3390/rs14153511
AMA Style
Yu Z, Wang T, Wang P, Yu J. The Spatiotemporal Response of Vegetation Changes to Precipitation and Soil Moisture in Drylands in the North Temperate Mid-Latitudes. Remote Sensing. 2022; 14(15):3511. https://doi.org/10.3390/rs14153511
Chicago/Turabian StyleYu, Zongxu, Tianye Wang, Ping Wang, and Jingjie Yu. 2022. "The Spatiotemporal Response of Vegetation Changes to Precipitation and Soil Moisture in Drylands in the North Temperate Mid-Latitudes" Remote Sensing 14, no. 15: 3511. https://doi.org/10.3390/rs14153511
Note that from the first issue of 2016, this journal uses article numbers instead of page numbers. See further details here.