
A Novel Method for SAR Ship Detection Based on Eigensubspace Projection


1
College of Computer and Information Engineering, Henan University, Kaifeng 475004, China
2
Henan Engineering Research Center of Intelligent Technology and Application, Henan University, Kaifeng 475004, China
3
Henan Key Laboratory of Big Data Analysis and Processing, Henan University, Kaifeng 475004, China
4
Land Satellite Remote Sensing Application Center, Ministry of Natural Resources, Beijing 100048, China
5
Air Force Research Institute, Beijing 100085, China
*
Author to whom correspondence should be addressed.
Remote Sens. 2022, 14(14), 3441; https://doi.org/10.3390/rs14143441
Submission received: 4 June 2022
/
Revised: 6 July 2022
/
Accepted: 12 July 2022
/
Published: 18 July 2022
(This article belongs to the Special Issue Applications of Synthetic Aperture Radar to Target Detection and Tracking)
Abstract
:Synthetic Aperture Radar (SAR) is a high-resolution radar that operates all day and in all weather conditions, so it has been widely used in various fields of science and technology. Ship detection using SAR images has become important research in marine applications. However, in complex scenes, ships are easily submerged in sea clutter, which cause missed detection. Due to this, strong sidelobes in SAR images generate false targets and reduce the detection accuracy. To solve these problems, a ship detection method based on eigensubspace projection (ESSP) in SAR images is proposed. First, the image is reconstructed into a new observation matrix along the azimuth direction, and the phase space matrix of the reconstructed image is constructed by using the Hankel characteristic, which preliminarily determines the approximate position of the ship. Then, the autocorrelation matrix of the reconstructed image is decomposed by eigenvalue decomposition (EVD). According to the size of the eigenvalues, the corresponding eigenvectors are divided into two parts, which constitute the basis of the ship subspace and the clutter subspace. Finally, the original image is projected into the ship subspace, and the ship data in the ship subspace are rearranged to obtain the precise position of the ship with significantly suppressed clutter. To verify the effectiveness of the proposed method, the ESSP method is compared with other detection methods on four images at different sea conditions. The results show that the detection accuracy of the ESSP method reaches 89.87% in complex scenes. Compared with other methods, the proposed method can extract ship targets from sea clutter more accurately and reduce the number of false alarms, which has obvious advantages in terms of detection accuracy and timeliness.
1. Introduction
As an active microwave remote sensing technology, Synthetic Aperture Radar (SAR) can provide all-day and all-weather high-resolution observations for land and ocean [1,2]. As the main carrier for the implementation of major marine tasks, ships occupy an important position in the detection of surface targets and the research of corresponding technologies [3,4]. The detection of ship targets in SAR images and the acquisition of the ship position, track, and other information are of great significance to many applications, such as maritime rescue, marine traffic management, and military intelligence collection. Ship detection based on SAR images is the first stage of the maritime ship target detection system, and it is also the basis of ship identification [5,6,7].
At present, ship detection methods based on spaceborne SAR images are roughly classified into four categories, as follows: (1) Ship detection methods based on statistical distribution characteristics [8,9,10]. The probability distribution of sea clutter and the ship target is mathematically modeled, and the calculated detection threshold is compared with each pixel in the image to determine whether the pixel is a ship target. Ai et al. [11] used the idea of a partial window to achieve the detection of ships in a nonuniform background based on the Constant False Alarm Rate (CFAR) target detection algorithm. (2) Ship detection methods based on matrix decomposition [12,13]. The original image is decomposed into a low-rank matrix and a sparse matrix, which represent background clutter and the ship target, respectively. In the literature [14], Robust Principal Component Analysis (RPCA) was used for the first time to transform the ship target detection problem into a low-rank and sparse matrix decomposition problem. (3) Ship detection methods based on polarization characteristics [15,16,17]. The difference in scattering mechanism between the ship target and sea clutter is utilized to distinguish the target from the background [18,19]. Novak [20] proposed the concept of a polarization detector based on the principle of the likelihood ratio test and made a foundational contribution to the field of target polarization detection. (4) Ship target detection methods based on deep learning [21,22,23]. This type of method has powerful feature extraction and data processing capabilities and does not rely significantly on prior knowledge. Chen et al. [24] constructed a loss function incorporating generalized intersection over union (GIoU) loss to reduce the scale sensitivity of the network and address the diverse scale problem of ship targets.
In the actual detection process, these methods have certain limitations. The detection effect of CFAR is extremely dependent on the artificially selected clutter model, and the detection effect of different models varies greatly. Furthermore, it is difficult to develop an accurate statistical model that is not affected by ocean waves and the environment. The overall efficiency of the CFAR method is low, and it is difficult to apply in complex multi-target detection scenarios. The matrix decomposition method is widely used in many image processing fields, such as image denoising [25], image detection [26], image super-resolution analysis [27], and image fusion. However, in complex backgrounds, the sea clutter in the SAR image does not satisfy the low-rank property, so the applicability of the method is limited. Moreover, the data structure of the original image and the matrix decomposition algorithm is not completely consistent, which leads to a significant increase in the number of false alarms. Although the obtained physical features and geometric structures using the polarization scattering characteristics methods are richer than those obtained using statistical methods, it is difficult to obtain and process polarization information. The ship target detection method based on deep learning has high accuracy and strong applicability, but it has high requirements regarding the sample set and can only be trained on a labeled dataset [28,29,30].
To improve the detection performance of SAR images, two methods are generally used: Signal-to-Clutter Ratio (SCR) improvement [31] and clutter suppression [32]. When the sea state is unstable, the echo signal of small targets is weak, and it is difficult to obtain a high SCR, which is not conducive to target detection. Based on the idea of subspace, Yang et al. [33] proposed the Orthogonal Projection Constant False Alarm Rate (OP-CFAR) detection algorithm, which constructs an orthogonal projection operator to suppress clutter and reduce computational complexity. Therefore, motivated by the eigensubspace filtering method in signal processing [34], an SAR ship target detection method based on eigensubspace projection (ESSP) is proposed in this paper. First, the image is reconstructed into a new observation matrix along the azimuth direction to enhance the low rank of the image, and the phase space matrix of the reconstructed image is used to replace the phase space matrix of the original image. Then, the autocorrelation matrix of the reconstructed image is decomposed by the EVD. According to the eigenvalues, the eigenvectors are divided into two parts, which constitute the basis of the ship subspace and the clutter subspace, respectively. Because the size of the phase space matrix constructed by the ESSP method is much smaller than that of the original image, the EVD takes less time and the time complexity of the method is low. Finally, the original image is projected into the ship subspace, and the ship data in the ship subspace are rearranged to obtain the final detection result. On the low sea state, there is a smaller difference in the detection results among different methods. Therefore, SAR images under moderate or high sea states are used to compare the proposed method with the classical RPCA method and the Superpixel-Level CFAR (SP-CFAR) method in this paper. The experimental results show that the ESSP method has a higher detection accuracy and fewer false alarms than the two methods, which verifies the effectiveness of the proposed method.
The rest of the paper is organized as follows. In Section 2, the experimental data and three ship detection methods are introduced, including the SP-CFAR, the RPCA, and the ESSP method. In Section 3, the evaluation indicators and experimental results are introduced. The performance of the three methods is analyzed and discussed in Section 4. The conclusions are drawn in Section 5.
2. Materials and Methods
2.1. Experimental Data
At present, there are few public datasets in the field of SAR image ship detection. The publicly reported datasets mainly include SSDD [35] and OpenSARShip [36]. The two datasets contain mainly slices of ship targets. The slice size is generally 256 × 256 pixels, and the resolution includes 3 m, 5 m, 8 m, 10 m, and 20 m. The background of the image is mainly offshore, and the nearshore background is less. In fact, ship detection in satellite applications is often processed on the whole image and covers an area up to several tens of square kilometers. In this case, the docks, roads, buildings, and even waves around the target have a great influence on ship detection. Therefore, a dataset containing different offshore and nearshore scenarios and covering various types of ship targets is more conducive to exploring ship detection methods with better performance, stronger robustness, and higher practicability in SAR images.
Based on the Gaofen-3 (GF-3) SAR satellite, the Aerospace Information Research Institute at the Chinese Academy of Sciences constructed a public sample dataset of SAR images for ship targets, named AIR-SARShip-1.0, which is oriented to wide scenes and close to practical application. The GF-3 satellite is also the first C-band multi-polarization high-resolution SAR in China, and it is a civilian microwave remote sensing imaging satellite involved in the major project of the China national high-resolution earth observation system. The AIR-SARShip-1.0 dataset contains 31 images of the GF-3 satellite [37], and the specific parameters are shown in Table 1. The image resolution includes 1 m and 3 m. The imaging modes include spotlight and strip-map, and the polarization mode is single polarization.
The 31 images with different levels of sea states contain various scene types such as ports, islands, and sea surfaces. The targets in the images cover more than 10 types of ships such as transport ships, oil tankers, and fishing boats. The image resolutions include 1 m and 3 m and most of the image sizes are 3000 × 3000 pixels (one of them is 4140 × 4140 pixels). Therefore, this dataset is suitable for ship target detection and application in complex scenes. The scene and sea state information of some images in the dataset is listed in Table 2.
In this paper, images under four different scenes in this dataset were selected as experimental materials, as shown in Figure 1. Among them, there are 2 nearshore scenes and 2 offshore scenes. Figure 1a shows a level 1 sea state image in the nearshore scene. Figure 1b shows a level 3 sea state image in the nearshore scene. Figure 1c shows a level 1 sea state image in the offshore scene. Figure 1d shows a level 4 sea state image in the offshore scene, and there is strong sea clutter around the ship target. These images not only contain ship target information but also include the relevant information on the surrounding sea area and land. Therefore, the dataset is closer to the actual ship detection application.
2.2. CFAR Method
The Constant False Alarm Rate (CFAR) detection method is a detection algorithm based on an adaptive threshold, which is widely used in ship detection in SAR images. The core idea of the CFAR detector is to obtain the detection threshold T according to the false alarm probability and the clutter probability density function (PDF) of the SAR image. The detection threshold is used to determine whether the detected target in the SAR image is a ship [38], and if the detected target is judged to be the background, it will be removed from the image. Letting the gray value of a pixel be I, the PDFs of the background and the target distribution are and , respectively. In the actual ship detection work, only can be obtained in most cases. Therefore, according to the given false alarm probability , the detection threshold T can be calculated as
If the pixel to be detected is higher than the threshold T, the pixel is judged as background clutter. Otherwise, it is judged as the ship. The relationship between background clutter and ship targets in the gray-scale spatial distribution is shown in Figure 2. The horizontal axis is the intensity of the SAR image to be detected, and the vertical axis is the probability density function. The distribution function represents the background clutter, and the distribution function represents the ship. Background clutter is distributed in the area of low intensity, while the ship target is distributed in the area of high intensity.
In order to better define clutter pixels and alleviate the effects of multiple targets, superpixels are introduced into CFAR to produce the Superpixel-Level CFAR (SP-CFAR) method in ship detection. The SP-CFAR method first uses the superpixel-generating algorithm to segment the SAR image [39]. Then, based on the superpixels generated, the CFAR method is used to obtain the PDF of the clutter and reduce the number of clutter pixels. Finally, hierarchical clustering is used to make a cluster of the detected superpixels to obtain the candidate targets.
2.3. RPCA Method
The RPCA method can effectively identify the most “major” elements and structures in the data, and remove noise and redundancy [40]. In general, the original data X, which belongs to the time domain, contains structure information and noise. If X is affected by random noise, the low-rank property will be destroyed and it will become full-rank. Therefore, X needs to be decomposed into the sum of low-rank matrix L containing its real structure and sparse noise matrix S. As long as a low-rank matrix is found, the essential low-dimensional space of the data is identified. In the SAR image used for ship detection, the sea surface echo is weak and changes randomly, which means that the sea surface has an approximate low-rank attribute. The ship echo is strong and the ship is sparsely distributed on the sea surface, which means that the ship has an approximate sparse attribute. Therefore, SAR images can be decomposed into low-rank images L and sparse images S by using the inherent properties of SAR images, to achieve ship target detection and clutter suppression. Figure 3 shows a schematic diagram depicting SAR image decomposition into a low-rank image and a sparse image [41].
The RPCA model decomposes the data matrix into the low-rank and sparse matrices. The ALM algorithm [42] transforms the RPCA model into the following unconstrained optimization problem by selecting the appropriate Lagrangian multiplier:
where represents the nuclear norm of L; represents the ℓ1 norm of S. λ represents the proportion of noise. In general, λ = 1/max (m, n), where (m, n) represents the size of the image. Y is the Lagrange multiplier, svd(X) represents the singular value decomposition (SVD) of X, and μ is the relaxation parameter. Let the size of X be N, and the time complexity of the SVD operation is O(N3).
The RPCA method based on the ALM algorithm seeks to first minimize L and then minimize S. Matrices L and are updated iteratively, and the parameter μ is updated according to the iteration termination condition. Finally, the Lagrange multiplier matrix Y is updated according to the residual (X − L − S) [43].
2.4. The Proposed Method
Statistics-based SAR ship target detection methods are usually simple and easy to understand, but the detection efficiency is low, so the low-lank and sparse decomposition method has gradually been applied to SAR ship detection. The low-rank and sparse decomposition method takes advantage of the low-rank characteristics of background clutter and the sparse characteristics of ship targets and uses RPCA to transform the problem of ship detection in SAR images into a matrix factorization problem. However, the sea surface of SAR images in complex scenes has strong randomness, and the sea clutter generally does not meet the low-rank criterion, resulting in the ship echo signal being far lower than the clutter signal and the ship targets being completely submerged in clutter. Therefore, it is of great significance to fully suppress clutter in SAR images to improve ship detection performance in complex sea areas [44,45]. In order to balance accuracy and timeliness in complex scene detection, this paper proposes an SAR ship target detection method based on the ESSP method.
The basic idea of the ESSP method is to decompose the autocorrelation matrix of the original data image. As the single-polarization SAR image has a high correlation in the local area, it is necessary to reconstruct the image into a new observation matrix along the azimuth direction. The phase space matrix of the reconstructed image is used to replace the phase space matrix of the original image. Then, the autocorrelation matrix of the reconstructed image is decomposed by eigenvalue decomposition, and the corresponding eigenvectors are divided into two categories according to the size of the eigenvalues [46]. The energy of ships in SAR images is higher than that of background clutter and is sparsely distributed on the sea surface, so the eigenvalues of ships are much larger than those of background clutter. The eigenvectors corresponding to significantly large eigenvalues constitute the ship subspace I, and the eigenvectors corresponding to other eigenvalues represent the clutter subspace G. The clutter subspace and the ship subspace are spatially orthogonal to each other, so the ship components can be reconstructed by projecting the original data into the ship subspace [47]. Figure 4 shows a flow chart depicting ship detection in SAR images based on the ESSP method.
2.4.1. Phase Space Matrix Construction
The marine SAR image can be expressed as the sum of target information and background clutter information. The ESSP method aims to project the useful target data and clutter data into different spaces and then filter the clutter without introducing strong sidelobes in the target data. The core of this projection method is the EVD of the autocorrelation matrix on the original data [48]. The autocorrelation matrix is composed of the phase space matrix, so the first step is to construct the phase space matrix P of the original data in the spatial domain.
For the one-dimensional radar raw data x(.), when the dimension of the phase space is determined, the phase space matrix P can be constructed according to the Hankel characteristic. The constructed matrix P can describe the raw data and the construction process is as follows.
where L represents the dimension of the phase space, M = N + 1 − L, and N represents the number of samples in the raw data. Assuming that the dimension of the phase space is L, the dimension of the phase space matrix P to be constructed is L × M.
The method of constructing a phase space matrix in ship detection is the same as that in eigensubspace filtering. According to the low-rank decomposition theory, the ships in the single-polarization SAR images used for ship detection are sparse components and have a high correlation in the local area. Therefore, it is necessary to reconstruct the image into the form of one-dimensional signals to improve the low-rank background. Specifically, the SAR image is divided into equal N columns by pixel from the first to the end. The N columns of data constitute a new observation matrix, i.e., the reconstructed image. Assuming that there are 50 sampling data in the azimuth direction of the SAR reconstructed image, the dimension of the phase space to be constructed is 32. Taking a column of data in the image as an example, the k column data are constructed as a phase space matrix P according to Equation (3). The first data point to the 18th data point in this column constitute the first row of P, and the second data point to the 19th data point constitute the second row of P. Then, one data point is taken backward each time to constitute the next row of P, and so on. The construction process is shown in Figure 5.
The yellow and blue rectangles represent the ship and the clutter pixel, respectively. The left side of Figure 5 presents the SAR reconstructed image, the middle part presents the k column data in the reconstructed image, and the right side presents the phase space matrix P constructed by the column data. Assuming that the azimuth of the SAR image to be processed has N sampled data and the dimension of the phase space is set to L, the size of the constructed phase space matrix is L × M, where M = N + 1 − L. The value of L has an important relationship with the number and form of radar noise signals, usually . If L is too small, the EVD will be insufficient, resulting in low resolution and aggravating the loss of ship signals during data projection. If L is too large, it will increase the workload of calculation, and the image quality will not be improved significantly. In real data processing, L is generally chosen to be 32 or 64, and in this experiment, L is 32.
2.4.2. Eigenvalue Decomposition
In the eigensubspace, the eigen-dimension plays an important role in image representation. A lower eigen-dimension has less influence on the representation of the eigenspace, and a higher eigen-dimension has a greater influence on the representation of the eigenspace [49]. Therefore, the eigensubspace filtering method projects the noise data and target signal data into different spaces by comparing the vector dimensions of the noise data and target signal data. Based on the above theory, the ESSP method in this paper obtains the eigen-dimensions of ship targets and background clutter through EVD, to establish the ship subspace and the clutter subspace. The original image is projected into the ship subspace to detect the ship target.
The product of the phase space matrix P and its conjugate transpose is used as the autocorrelation matrix of the image. Therefore, is the spectral domain of matrix P, and is also a covariance matrix. The EVD of can be expressed as
where = diag () is a diagonal matrix of L × L. The eigenvalues obtained by decomposition are arranged as from large to small, and the corresponding eigenvector is .
In the eigensubspace filtering method, these eigenvalues are the key elements in distinguishing the target signal subspace and the noise subspace. After obtaining the sequence of eigenvalues, the space spanned by the eigenvectors corresponding to the K largest eigenvalues is called the target signal subspace, which can be indicated as
The space spanned by the eigenvectors corresponding to the remaining L-K eigenvalues is called the noise subspace, and it can be indicated as
Due to the orthogonality of the signal subspace and the noise subspace, projecting the autocorrelation matrix into the signal subspace can effectively eliminate the noise, i.e., the clutter in this paper. The ESSP method in this paper is based on the eigenvalues obtained from the EVD of the autocorrelation matrix . The size of is L × L, so the time complexity of EVD is O(L3). The autocorrelation matrix is divided into two parts according to the size of the eigenvalues. These two parts constitute the ship subspace and the clutter subspace. The decomposition expression is as follows:
According to the eigenvalues of the matrix , the K(K < L) largest eigenvalues can be found and construct a diagonal matrix . The eigenvector corresponding to these eigenvalues constitutes the basis of the ship subspace . Similarly, is a diagonal matrix composed of the remaining L − K eigenvalues, and the eigenvector corresponding to these eigenvalues forms the basis of the clutter subspace G.
2.4.3. Image Reconstruction
As mentioned previously, the EVD divides the autocorrelation matrix into two subspaces, and the clutter subspace and the ship subspace are orthogonal to each other. Therefore, the autocorrelation matrix can be projected into the ship subspace, and the ship data can be rearranged to obtain the final ship detected image. However, the reconstruction of the ship data from the ship subspace requires further study. Although the data can be recovered according to the inverse process of the data obtained by the sliding vector, the data structure changes after projection. When constructing the phase space matrix, = = originally, but after projection, ≠ . At this time, the problem of how to select the data and rearrange them into the ship data needs to be considered [50].
To reconstruct the ship components in the ship subspace, it is first necessary to reconstruct a one-dimensional ship data sequence j(k) from the ship subspace. In this paper, a diagonal averaging method is used to reconstruct the clutter sequence. This method transforms the ship subspace matrix I into a one-dimensional data sequence of length N, which is equivalent to the inverse process of constructing the observation matrix. First, the mean value of all elements in each diagonal parallel to the inverse diagonal is estimated, and then all elements on the inverse diagonal are replaced by the mean value. Finally, the first element of these inverse diagonals is constituted as a new N-dimensional sequence. The structure is as follows:
The diagonal averaging method needs to average all the values of the same label when reconstructing the ship data matrix. Compared with the method that only selects a specific value as a one-dimensional data element, the image reconstructed by the diagonal averaging method is more accurate and of higher quality. Figure 6 presents a schematic diagram of image reconstruction.
3. Results
3.1. Evaluation Indicators
In order to evaluate the detection performance of the ESSP method, the detection accuracy, missed detection rate, false alarm rate, and other indicators were selected. As a parameter to judge the accuracy of target detection, the quality factor [51] is the ratio of the number of correct detections to the sum of the false alarms and the real ships. is defined as
where is the true positive, which represents the number of correctly detected ships. is the false positive, representing the number of false alarms. is the number of true ships in the image.
The missed detection rate, , represents the proportion of undetected ships among all real ships. is defined as
where is the number of false negatives, which can be understood as missed detection.
The false alarm rate, represents the ratio of the number of false alarms to the number of real ships. is defined as
Therefore, the higher the detection accuracy, the lower the missed detection rate and the false alarm rate, and the better the performance.
3.2. Experimental Results
In this experiment, four SAR images in different scenarios in the AIR-SARShip-1.0 dataset were used to verify the effectiveness of the ESSP method. The four images were two nearshore scenes and two offshore scenes, and each type of scene contained two images of different sea states, as shown in Figure 1. The first image was a level 1 sea state image in the nearshore scene. In the nearshore scene, the sea surface is relatively calm and there will not be too many waves, and the sea state generally does not exceed level 3. Therefore, the second image was the sea state of a level 3 image in the nearshore scene. The third and fourth SAR images were a level 1 sea state image and a level 4 sea state image in the offshore scene, respectively.
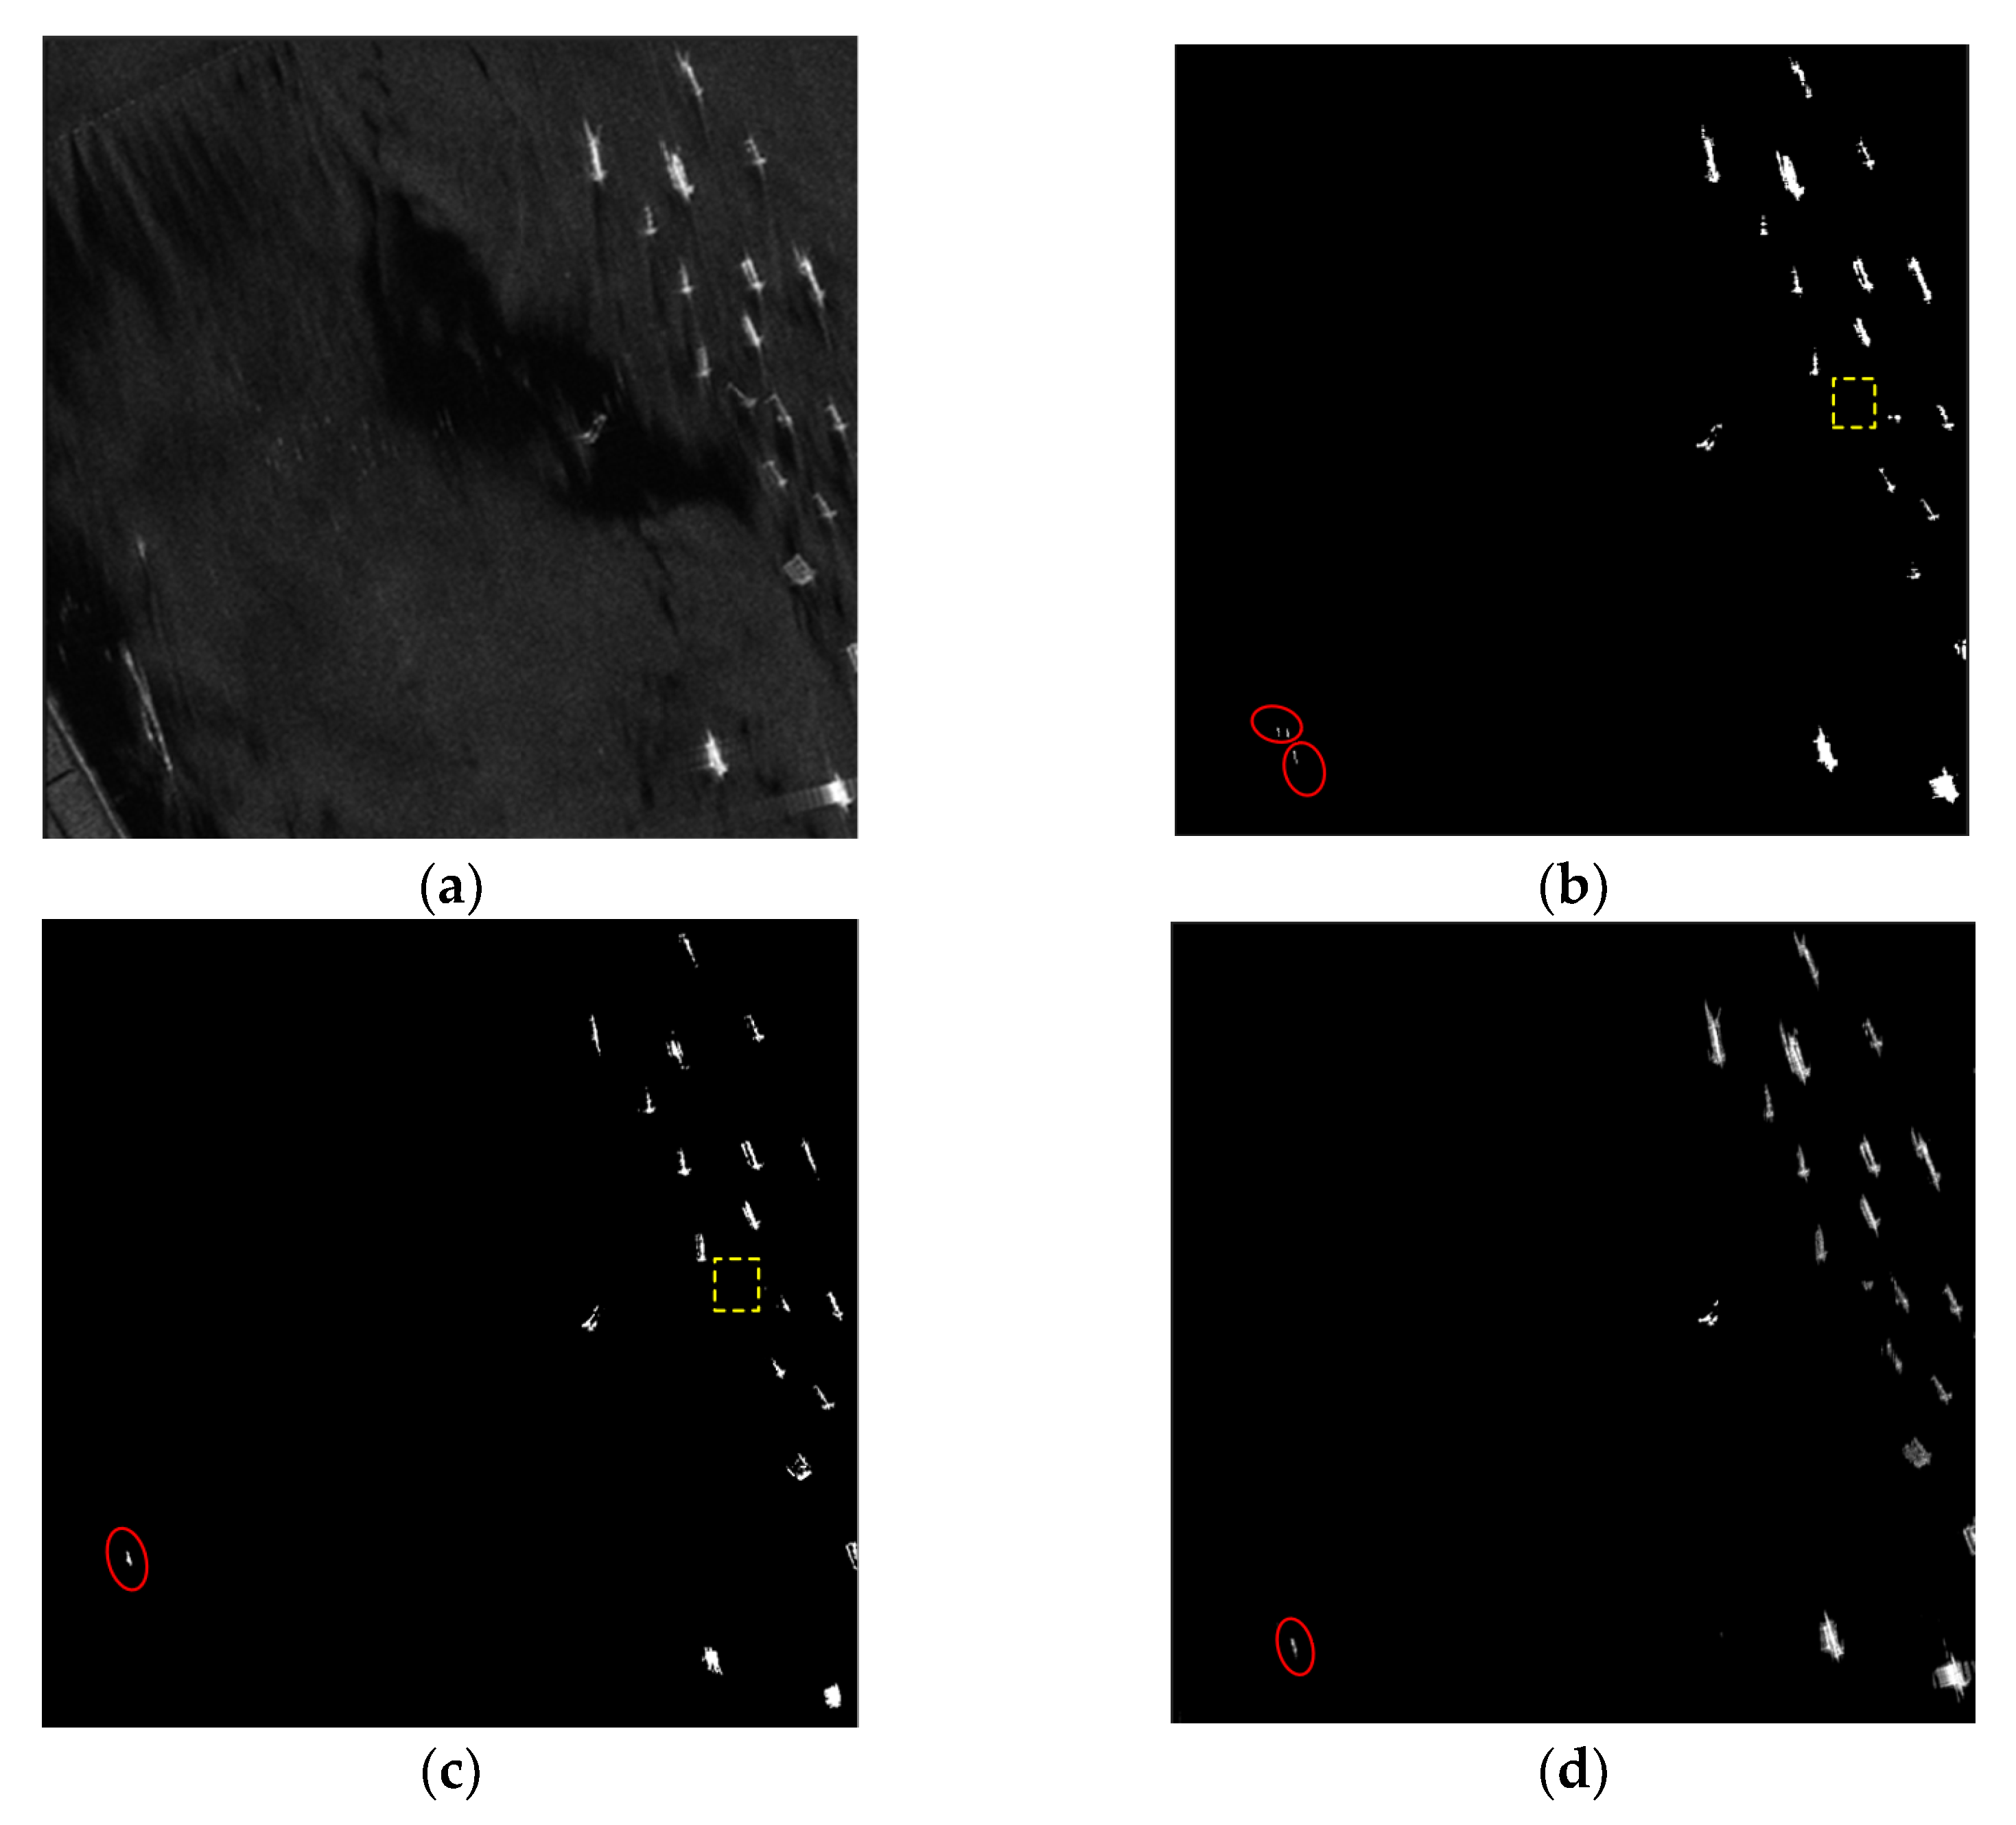
The ship detection results of the four images under the RPCA method, the SP-CFAR method, and the ESSP method were compared, as shown in Figure 7, Figure 8, Figure 9 and Figure 10. The missed ship targets are marked with yellow rectangles, and the false targets are marked with red circles. Figure 7a, Figure 8a, Figure 9a and Figure 10a show the four original SAR images. Figure 7b, Figure 8b, Figure 9b and Figure 10b show the detection results of the RPCA method for the four images. Figure 7c, Figure 8c, Figure 9c and Figure 10c show the detection results of the SP-CFAR method. Figure 7d, Figure 8d, Figure 9d and Figure 10d show the detection results of the proposed method. It can be seen from Figure 7b and Figure 8b,c that the detection results of the two images in the nearshore scene contain many false alarms. Because the sea waves are relatively weak in the nearshore area, the probability of missed detection is small. In the offshore area, the marine environment is harsh and the climate is changeable, so missed detection can easily occur. For example, in Figure 9b–d and Figure 10b,c, the situation of missed detection appears. In particular, in the third scene, the ship target is easily submerged in the strong sea clutter. Table 3 presents the detailed detection results of the four images.
It can be seen from Table 3 that the detection results of the RPCA method are the most unsatisfactory. There are many false alarms and false positives in both nearshore and offshore scenarios. With the exception of the last image, the other three images have the highest false alarm rate and missed detection rate. In particular, in the second image, the false alarm rate of the RPCA method is as high as 100%. The SP-CFAR method also yields some false positives and false negatives in different scenarios, but the overall detection effect is better than that of the RPCA method. For example, in Figure 7 and Figure 10, the number of missed detections by the SP-CFAR method is only half that of the RPCA method. Due to the strong sea surface clutter, the ESSP method inevitably yields a few false positives in some areas, but only one missed detection occurs, as shown in Figure 9d. Therefore, compared with the other two methods, the proposed method has a great advantage, as it yields the lowest number of missed detections and false alarms.
In order to quantitatively evaluate the effectiveness of the proposed method, the evaluation indexes of the four images were averaged in this experiment, and the results are shown in Table 4. Among other detection methods, the RPCA method has the highest missed detection rate, and the false alarm rate is as high as 33.83%. Although the detection accuracy and false alarm rate of the SP-CFAR method are better than those of the RPCA, the false alarm rate has a certain difference from that of the ESSP method. The detection accuracy of the ESSP method is 89.87%, and the detection time is lowest. The SP-CFAR method, based on statistics, involves pixel-by-pixel detection, so the time overhead of the method is relatively high. For the RPCA method and the ESSP method, the time complexity mainly depends on SVD or EVD. The traditional RPCA method needs to perform SVD on the original image of dimension N, while the ESSP method only needs to perform EVD on the phase space matrix of dimension L. The time complexity of the former is approximately O(N3), and the time complexity of the latter is approximately O(L3), usually , so the efficiency of the ESSP method is higher than that of the traditional RPCA method. Therefore, at complex sea conditions, the method proposed in this paper has obvious advantages in terms of accuracy and timeliness.
4. Discussion
This paper uses the SAR data of GF-3 to conduct ship detection experiments under different sea states. The results show that the ESSP method has better performance for ship detection in complex sea states. Especially when the sea surface is unstable and the sea state is very high, the ship target can be detected accurately and completely. The results of the ESSP method have been compared with those of the classical RPCA method and the SP-CFAR method. The false alarm rate and missed detection rate of the ESSP method are significantly lower than those of the other two methods. Both detection accuracy and detection timeliness indicate good performance. Therefore, the method in this paper provides a new concept and a new method for ship detection in complex sea states. However, some highly scattered sea clutter and shore buildings will still exist in SAR images in the form of bright spots, because it is difficult to determine whether these bright spots are ships or clutter, which will result in false detection. This represents the main area of improvement of the algorithm and a future research direction.
5. Conclusions
In order to improve the robustness of ship target detection in SAR images at complex sea conditions, a ship target detection method based on ESSP in SAR images is proposed in this paper. The proposed method avoids the mismatch risk of the clutter model and eliminates the requirement that the sea surface must conform to the low rank. First, the original SAR image is reconstructed into a new observation matrix along the azimuth direction, i.e., the reconstructed image. The phase space matrix of the original data image is replaced by the phase space matrix of the reconstructed image. Then, the autocorrelation matrix of the reconstructed image is decomposed by eigenvalue decomposition. According to the eigenvalues, the original image is divided into the clutter data subspace and the ship data subspace. Finally, the original image is projected into the ship subspace, so the ship data can be reconstructed from the subspace to achieve accurate ship detection. The proposed method does not require knowledge of the model parameters of the background clutter, and it only needs to separate the clutter subspace and the ship subspace by constructing the eigensubspace. Therefore, the method eliminates the mismatch risk of the clutter model and maintains image details. The SAR images of the GF-3 satellite in different sea states were used for the experiment, and the experimental results were compared with those obtained using the classical RPCA method and the SP-CFAR method. The experimental results show that the ESSP method achieves a detection accuracy of 89.87% in complex sea states. The method can not only reduce the false alarm rate but also has great advantages in improving detection efficiency.
Author Contributions
Conceptualization, G.S. and N.L.; Data Curation, N.L.; Formal Analysis, G.S. and N.L.; Funding Acquisition, G.S. and Q.W.; Investigation, G.S., J.C. and Q.W.; Methodology, G.S., J.C. and N.L.; Project Administration, G.S. and Q.W.; Resources, N.L.; Software, J.C., J.L. and Q.W.; Supervision, N.L.; Validation, G.S. and J.C.; Visualization, J.C.; Writing—Original Draft, G.S. and J.C.; writing—review and editing, G.S., J.C. and N.L. All authors have read and agreed to the published version of the manuscript.
Funding
This research was funded in part by National Natural Science Foundation of China, grant number 41901302; in part by Natural Science Foundation of Henan, grant number 222300420115.
Data Availability Statement
Publicly available datasets were analyzed in this study. This data is provided by Journal of Radars and can be found here: [https://radars.ac.cn/web/data/getData?newsColumnId=d25c94d7-8fe8-415f-a897-cb88657a8141&pageType=en] (accessed on 3 June 2022).
Acknowledgments
The GF-3 satellite data acquisition from the website: https://osdds.nsoas.org.cn (accessed on 3 June 2022). The authors would like to thank the National High-Resolution Earth Observation System Major Science and Technology Project and Aerospace Information Research Institute for providing the AIR-SARShip-1.0 dataset for ship detection applications.
Conflicts of Interest
The authors declare no conflict of interest.
References
- Eldhuset, K. An Automatic Ship and Ship Wake Detection System for Spaceborne SAR Images in Coastal Regions. IEEE Trans. Geosci. Remote Sens. 1996, 34, 1010–1019. [Google Scholar] [CrossRef]
- Jie, L.; Ji, W.; Bo, S.; Zhu, S.; Luo, W. Research on Ground Based Microwave Signature Measurement Technology for Spaceborne SAR Applications. In Proceedings of the IEEE International Geoscience and Remote Sensing Symposium, Toronto, ON, Canada, 24–28 June 2002; Volume 5, pp. 2663–2665. [Google Scholar] [CrossRef]
- Yang, R.; Wang, G.; Pan, Z.; Lu, H.; Zhang, H.; Jia, X. A Novel False Alarm Suppression Method for CNN-Based SAR Ship Detector. IEEE Geosci. Remote Sens. Lett. 2021, 18, 1401–1405. [Google Scholar] [CrossRef]
- Du, L.; Wang, Z.; Wang, Y.; Wei, D.; Li, L. Survey of Research Progress on Target Detection and Discrimination of Single-channel SAR Images for Complex Scenes. J. Radars 2020, 9, 34–54. [Google Scholar] [CrossRef]
- Greenspan, M.; Pham, L.; Tardella, N. Development and Evaluation of a Real Time SAR ATR System. In Proceedings of the IEEE National Conference on Radar, Dallas, TX, USA, 14 May 1998; pp. 38–43. [Google Scholar] [CrossRef]
- Chong, J.; Zhu, M. Survey of the Study on Ship and Wake Detection in SAR Imagery. Acta Electron. Sin. 2003, 31, 1356–1360. [Google Scholar]
- Li, J.; Tian, J.; Gao, P.; Li, L. Ship Detection and Fine-Grained Recognition in Large-Format Remote Sensing Images Based on Convolutional Neural Network. In Proceedings of the IEEE International Symposium on Geoscience and Remote Sensing (IGARSS), Waikoloa, HI, USA, 26 September–2 October 2020; pp. 2859–2862. [Google Scholar] [CrossRef]
- Yu, W.; Wang, Y.; Liu, H.; He, J. Superpixel-Based CFAR Target Detection for High-Resolution SAR Images. IEEE Geosci. Remote Sens. Lett. 2016, 13, 730–734. [Google Scholar] [CrossRef]
- Ai, J.; Cao, Z.; Mao, Y.; Wang, H.; Wang, F.; Jin, J. An Improved Bilateral CFAR Ship Detection Algorithm for SAR Image in Complex Environment. J. Radars 2021, 10, 499–515. [Google Scholar] [CrossRef]
- Li, C.; Yu, Z.; Chen, J. Overview of Techniques for Improving High-resolution Spaceborne SAR Imaging and Image Quality. J. Radars 2019, 8, 717–731. [Google Scholar] [CrossRef]
- Ai, J.; Cao, Z.; Xing, M. An Adaptive-trimming-depth Based CFAR Detector of Heterogeneous Environment in SAR Imagery. Remote Sens. Lett. 2020, 11, 730–738. [Google Scholar] [CrossRef]
- Markopoulos, P.; Dhanaraj, M.; Savakis, A. Adaptive L1-Norm Principal-Component Analysis with Online Outlier Rejection. IEEE J. Sel. Top. Signal Process. 2018, 12, 1131–1143. [Google Scholar] [CrossRef]
- Javed, S.; Mahmood, A.; Al-Maadeed, S.; Bouwmans, T.; Ki Jung, S. Moving Object Detection in Complex Scene Using Spatiotemporal Structured-Sparse RPCA. IEEE Trans. Image Process. 2018, 28, 1007–1022. [Google Scholar] [CrossRef]
- Biondi, F. Low-Rank Plus Sparse Decomposition and Localized Radon Transform for Ship-Wake Detection in Synthetic Aperture Radar Images. IEEE Geosci. Remote Sens. Lett. 2018, 15, 117–121. [Google Scholar] [CrossRef]
- Liu, T.; Yang, Z.; Jiang, Y.; Gao, G. Review of Ship Detection in Polarimetric Synthetic Aperture Imagery. J. Radars 2021, 10, 1–19. [Google Scholar] [CrossRef]
- Zou, B.; Qiu, Y.; Zhang, L. Ship Detection Using PolSAR Images Based on Simulated Annealing by Fuzzy Matching. IEEE Geosci. Remote Sens. Lett. 2022, 19, 1–5. [Google Scholar] [CrossRef]
- Xi, Y.; Zhang, X.; Lai, Q.; Li, W.; Lang, H. A New PolSAR Ship Detection Metric Fused by Polarimetric Similarity and the Third Eigenvalue of the Coherency Matrix. In Proceedings of the IEEE International Geoscience and Remote Sensing Symposium, Beijing, China, 10–15 July 2016; pp. 112–115. [Google Scholar] [CrossRef]
- Liu, T.; Yang, Z.; Yang, J.; Gao, G. CFAR Ship Detection Methods Using Compact Polarimetric SAR in a K-Wishart Distribution. IEEE J. Sel. Top. Appl. Earth Obs. Remote Sens. 2019, 12, 3737–3745. [Google Scholar] [CrossRef]
- Fan, Q.; Chen, F.; Cheng, M.; Wang, C.; Li, J. A Modified Framework for Ship Detection from Compact Polarization SAR Image. In Proceedings of the IEEE International Geoscience and Remote Sensing Symposium, Valencia, Spain, 22–27 July 2018; pp. 3539–3542. [Google Scholar] [CrossRef]
- Novak, L.M.; Owirka, G.J.; Netishen, C.M. Performance of a High-Resolution Polarimetric SAR Automatic Target Recognition System. Linc. Lab. J. 1992, 6, 11–23. [Google Scholar]
- Li, C.; Xu, H.; Qian, K.; Deng, B.; Feng, Z. Survey of Ship Detection Technology Based on Deep Learning. J. Ordnance Equip. Eng. 2021, 42, 57–63. [Google Scholar] [CrossRef]
- Kang, M.; Ji, K.; Leng, X.; Lin, Z. Contextual Region-Based Convolutional Neural Network with Multilayer Fusion for SAR Ship Detection. Remote Sens. 2017, 9, 860. [Google Scholar] [CrossRef] [Green Version]
- Ma, M.; Chen, J.; Liu, W.; Yang, W. Ship Classification and Detection Based on CNN Using GF-3 SAR Images. Remote Sens. 2018, 10, 2043. [Google Scholar] [CrossRef] [Green Version]
- Chen, C.; He, C.; Hu, C.; Pei, H.; Jiao, L. A Deep Neural Network Based on an Attention Mechanism for SAR Ship Detection in Multiscale and Complex Scenarios. IEEE Access 2019, 7, 104848–104863. [Google Scholar] [CrossRef]
- Wu, D.; Du, X.; Wang, K. An Effective Approach for Underwater Sonar Image Denoising Based on Sparse Representation. In Proceedings of the IEEE International Conference on Image, Vision and Computing (ICIVC), Chongqing, China, 27–29 June 2018; pp. 389–393. [Google Scholar] [CrossRef]
- Soganli, A.; Cetin, M. Sparsity-driven SAR Image Reconstruction via Low-rank Sparse Matrix Decomposition. In Proceedings of the Signal Processing and Communications Applications Conference, Malatya, Turkey, 16–19 May 2015; pp. 2333–2336. [Google Scholar] [CrossRef]
- Zhang, S.; Zhang, Y.; Chou, Y.; Wang, Z.; Shi, Y.; Sun, Z. Analysis of the Multispectral and SAR Image. In Proceedings of the IEEE International Conference on Computer and Communication Systems (ICCCS), Chengdu, China, 23–26 April 2021; pp. 312–315. [Google Scholar] [CrossRef]
- Zhang, G.; Li, Z.; Li, X.; Yin, C.; Shi, Z. A Novel Salient Feature Fusion Method for Ship Detection in Synthetic Aperture Radar Images. IEEE Access 2020, 8, 215904–215914. [Google Scholar] [CrossRef]
- Zhao, Y.; Zhao, L.; Xiong, B. Kuang, G. Attention Receptive Pyramid Network for Ship Detection in SAR Images. IEEE J. Sel. Top. Appl. Earth Obs. Remote Sens. 2020, 13, 2738–2756. [Google Scholar] [CrossRef]
- Zhang, S.; Wu, R.; Xu, K.; Wang, J.; Sun, W. R-CNN-Based Ship Detection from High Resolution Remote Sensing Imagery. Remote Sens. 2019, 11, 631. [Google Scholar] [CrossRef] [Green Version]
- Miao, A.D.; Farina, A.; Foglia, G. Knowledge-Based Recursive Least Squares Techniques for Heterogeneous Clutter Suppression. IET Radar Sonar Navig. 2007, 1, 106–115. [Google Scholar] [CrossRef] [Green Version]
- Zhao, J.; Wen, B.; Tian, Y.; Tian, Z.; Wang, S. Sea Clutter Suppression for Shipborne HF Radar Using Cross-Loop/Monopole Array. IEEE Geosci. Remote Sens. Lett. 2019, 16, 879–883. [Google Scholar] [CrossRef]
- Yang, Y.; Xiao, S.; Wang, X. Radar Detection of Small Target in Sea Clutter Using Orthogonal Projection. IEEE Geosci. Remote Sens. Lett. 2019, 16, 382–386. [Google Scholar] [CrossRef]
- Zhou, F.; Xing, M.; Bao, Z. Narrow Band Interference Suppression for SAR Using Eigen-Subspace Based Filtering. J. Electron. Inf. Technol. 2005, 27, 767–770. [Google Scholar]
- Zhang, T.; Zhang, X.; Li, J.; Xu, X.; Wang, B.; Zhan, X.; Xu, Y.; Ke, X.; Zeng, T.; Su, H.; et al. SAR Ship Detection Dataset (SSDD): Official Release and Comprehensive Data Analysis. Remote Sens. 2021, 13, 3690. [Google Scholar] [CrossRef]
- Huang, L.; Liu, B.; Li, B.; Guo, W.; Yu, W.; Zhang, Z.; Yu, W. OpenSARShip: A Dataset Dedicated to Sentinel-1 Ship Interpretation. IEEE J. Sel. Top. Appl. Earth Obs. Remote Sens. 2018, 11, 195–208. [Google Scholar] [CrossRef]
- Sun, X.; Wang, Z.; Sun, Y.; Diao, W.; Zhang, Y.; Fu, K. AIR-SARShip-1.0: High-resolution SAR ship detection dataset. J. Radars 2019, 8, 852–862. [Google Scholar] [CrossRef]
- Tao, D.; Normann Anfinsen, S.; Brekke, C. Robust CFAR Detector Based on Truncated Statistics in Multiple-Target Situations. IEEE Geosci. Remote Sens. Lett. 2015, 54, 117–134. [Google Scholar] [CrossRef]
- Pappas, O.; Achim, A.; Bull, D. Superpixel-Level CFAR Detectors for Ship Detection in SAR Imagery. IEEE Geosci. Remote Sens. Lett. 2018, 15, 1397–1401. [Google Scholar] [CrossRef] [Green Version]
- Vaswani, N.; Bouwmans, T.; Javed, S.; Narayanamurthy, P. Robust Subspace Learning: Robust PCA, Robust Subspace Tracking, and Robust Subspace Recovery. IEEE Signal Process. Mag. 2018, 35, 32–55. [Google Scholar] [CrossRef] [Green Version]
- Candes, E.J.; Li, X.; Ma, Y.; Wright, J. Robust Principal Component Analysis. J. ACM 2011, 58, 1–37. [Google Scholar] [CrossRef]
- Eckstein, J.; Bertsekas, D. On the Douglas-Rachford Splitting Method and the Proximal Point Algorithm for Maximal Monotone Operators. Math. Program. 1992, 55, 293–318. [Google Scholar] [CrossRef] [Green Version]
- Qiu, W.; Zhou, J.; Fu, Q. Jointly Using Low-Rank and Sparsity Priors for Sparse Inverse Synthetic Aperture Radar Imaging. IEEE Trans. Image Process. 2020, 29, 100–115. [Google Scholar] [CrossRef]
- Shi, G.; Huang, T.; Dong, W.; Wu, J.; Xie, X. Robust Foreground Estimation via Structured Gaussian Scale Mixture Modeling. IEEE Trans. Image Process. 2018, 27, 4810–4824. [Google Scholar] [CrossRef]
- Zheng, L.; Yao, W.; Yang, C.; Qiu, H. Clutter Suppression Method for Short Range Slow Moving Target Detection. J. Electron. Inf. Technol. 2018, 40, 2506–2512. [Google Scholar] [CrossRef]
- Nguyen, L.H.; Ton, T.; Wong, D.; Soumekh, M. Adaptive Coherent Suppression of Multiple Wide-bandwidth RFI Sources in SAR. In Proceedings of the SPIE—The International Society for Optical Engineering, Orlando, FL, USA, 2 September 2004; Volume 5427, pp. 1–16. [Google Scholar] [CrossRef]
- Yang, J.; Kavehm, M. Adaptive eigensubspace algorithms for direction or frequency estimation and tracking. IEEE Trans. Acoust. 1988, 36, 241–251. [Google Scholar] [CrossRef]
- Sun, Y.; Zhang, B.; Wang, C.; Wu, F. Ship detection Based on Eigenvalue-eigenvector Decomposition and OS-CFAR Detector. In Proceedings of the International Conference on Computer Vision in Remote Sensing, Xiamen, China, 16–18 December 2012; pp. 350–355. [Google Scholar] [CrossRef]
- Santhanam, A.; Rahman, M. Moving Vehicle Classification Using Eigenspace. In Proceedings of the IEEE/RSJ International Conference on Intelligent Robots and Systems, Beijing, China, 5–9 October 2006; pp. 3849–3854. [Google Scholar] [CrossRef]
- Wu, J.; Cao, X.; Chen, Y.; Sun, J. Tow Ship Interference Suppression for Towed Array Sonar via Subspace Reconstruction. In Proceedings of the International Conference on Wireless Communications and Signal Processing (WCSP), Hangzhou, China 18–20 October 2018; pp. 1–7. [Google Scholar] [CrossRef]
- Liu, G.; Zhang, X.; Meng, J. A Small Ship Target Detection Method Based on Polarimetric SAR. Remote Sens. 2019, 11, 2938. [Google Scholar] [CrossRef] [Green Version]
Figure 1.
The experimental data. (a) Level 1 sea state in the nearshore scene; (b) level 3 sea state in the nearshore scene; (c) level 1 sea state in the offshore scene; (d) level 4 sea state in the offshore scene.
Figure 1.
The experimental data. (a) Level 1 sea state in the nearshore scene; (b) level 3 sea state in the nearshore scene; (c) level 1 sea state in the offshore scene; (d) level 4 sea state in the offshore scene.

Figure 2.
The gray-scale spatial distribution of background and ship targets.
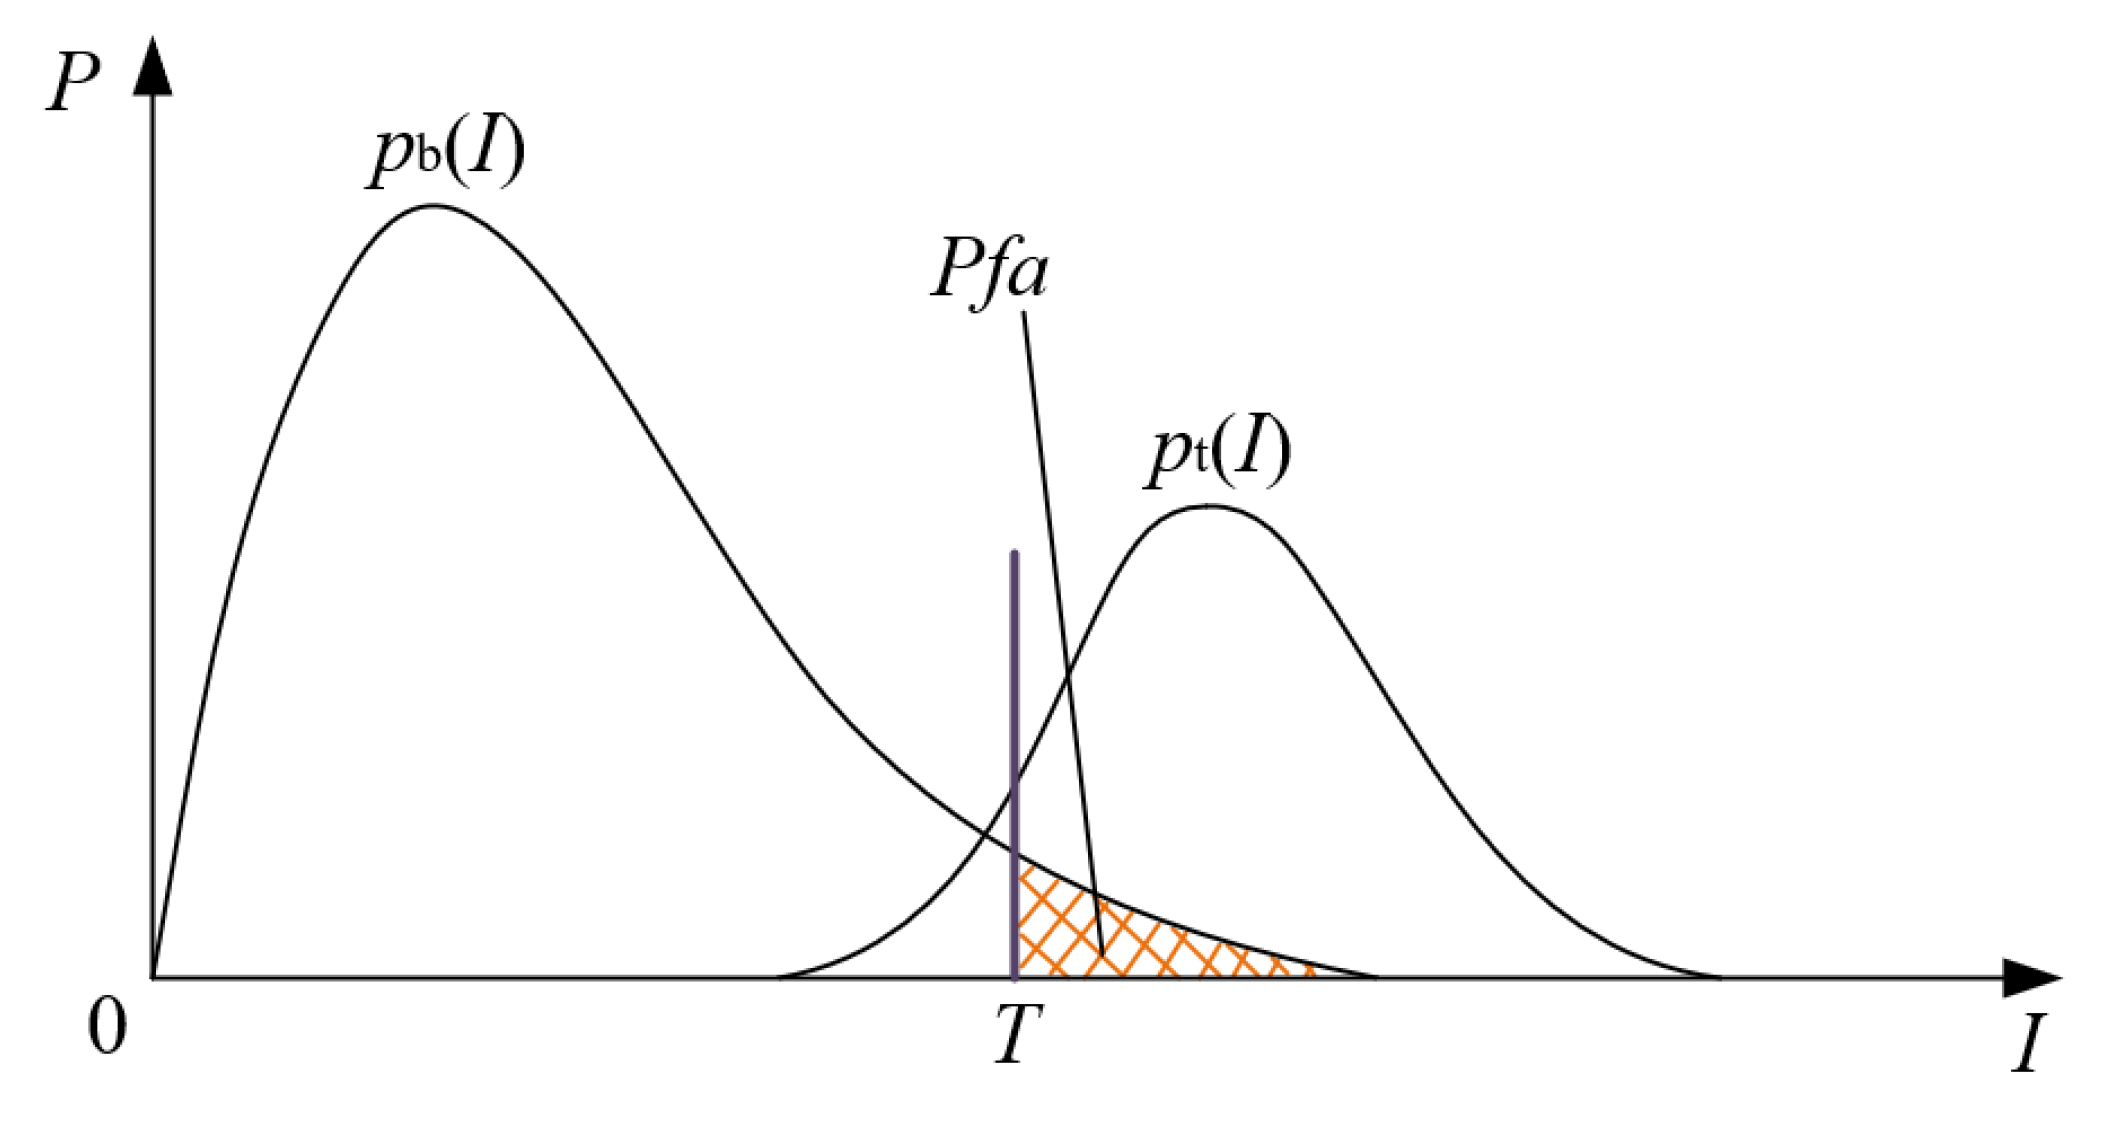
Figure 3.
Diagram of low-rank and sparse decomposition of SAR image.
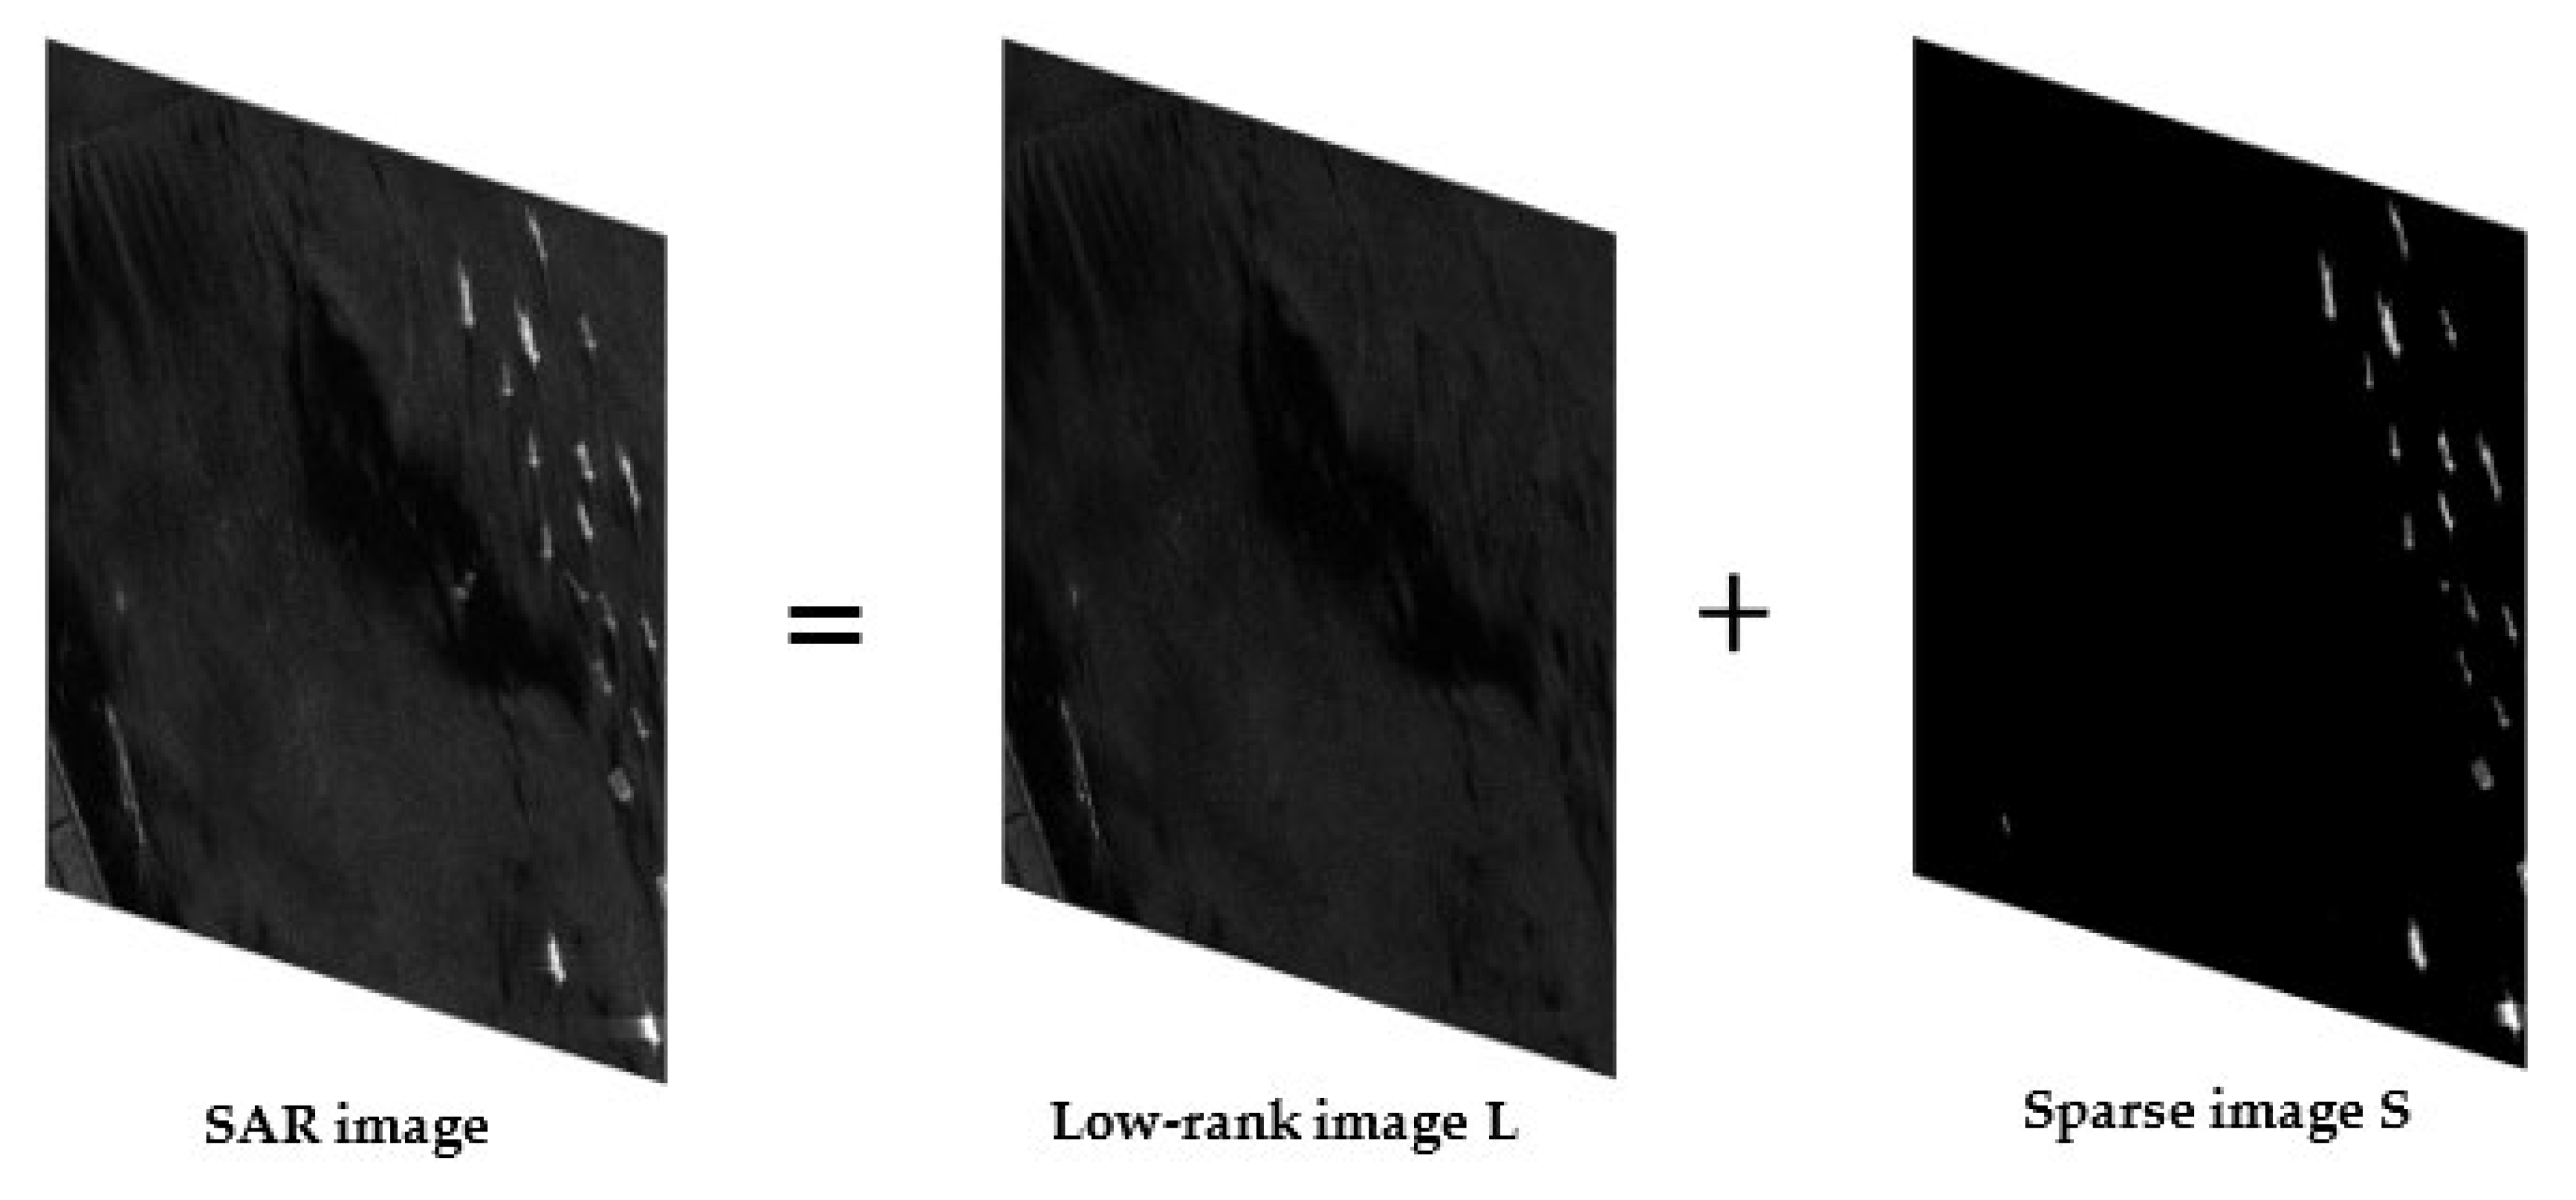
Figure 4.
The flow chart of the ESSP method.
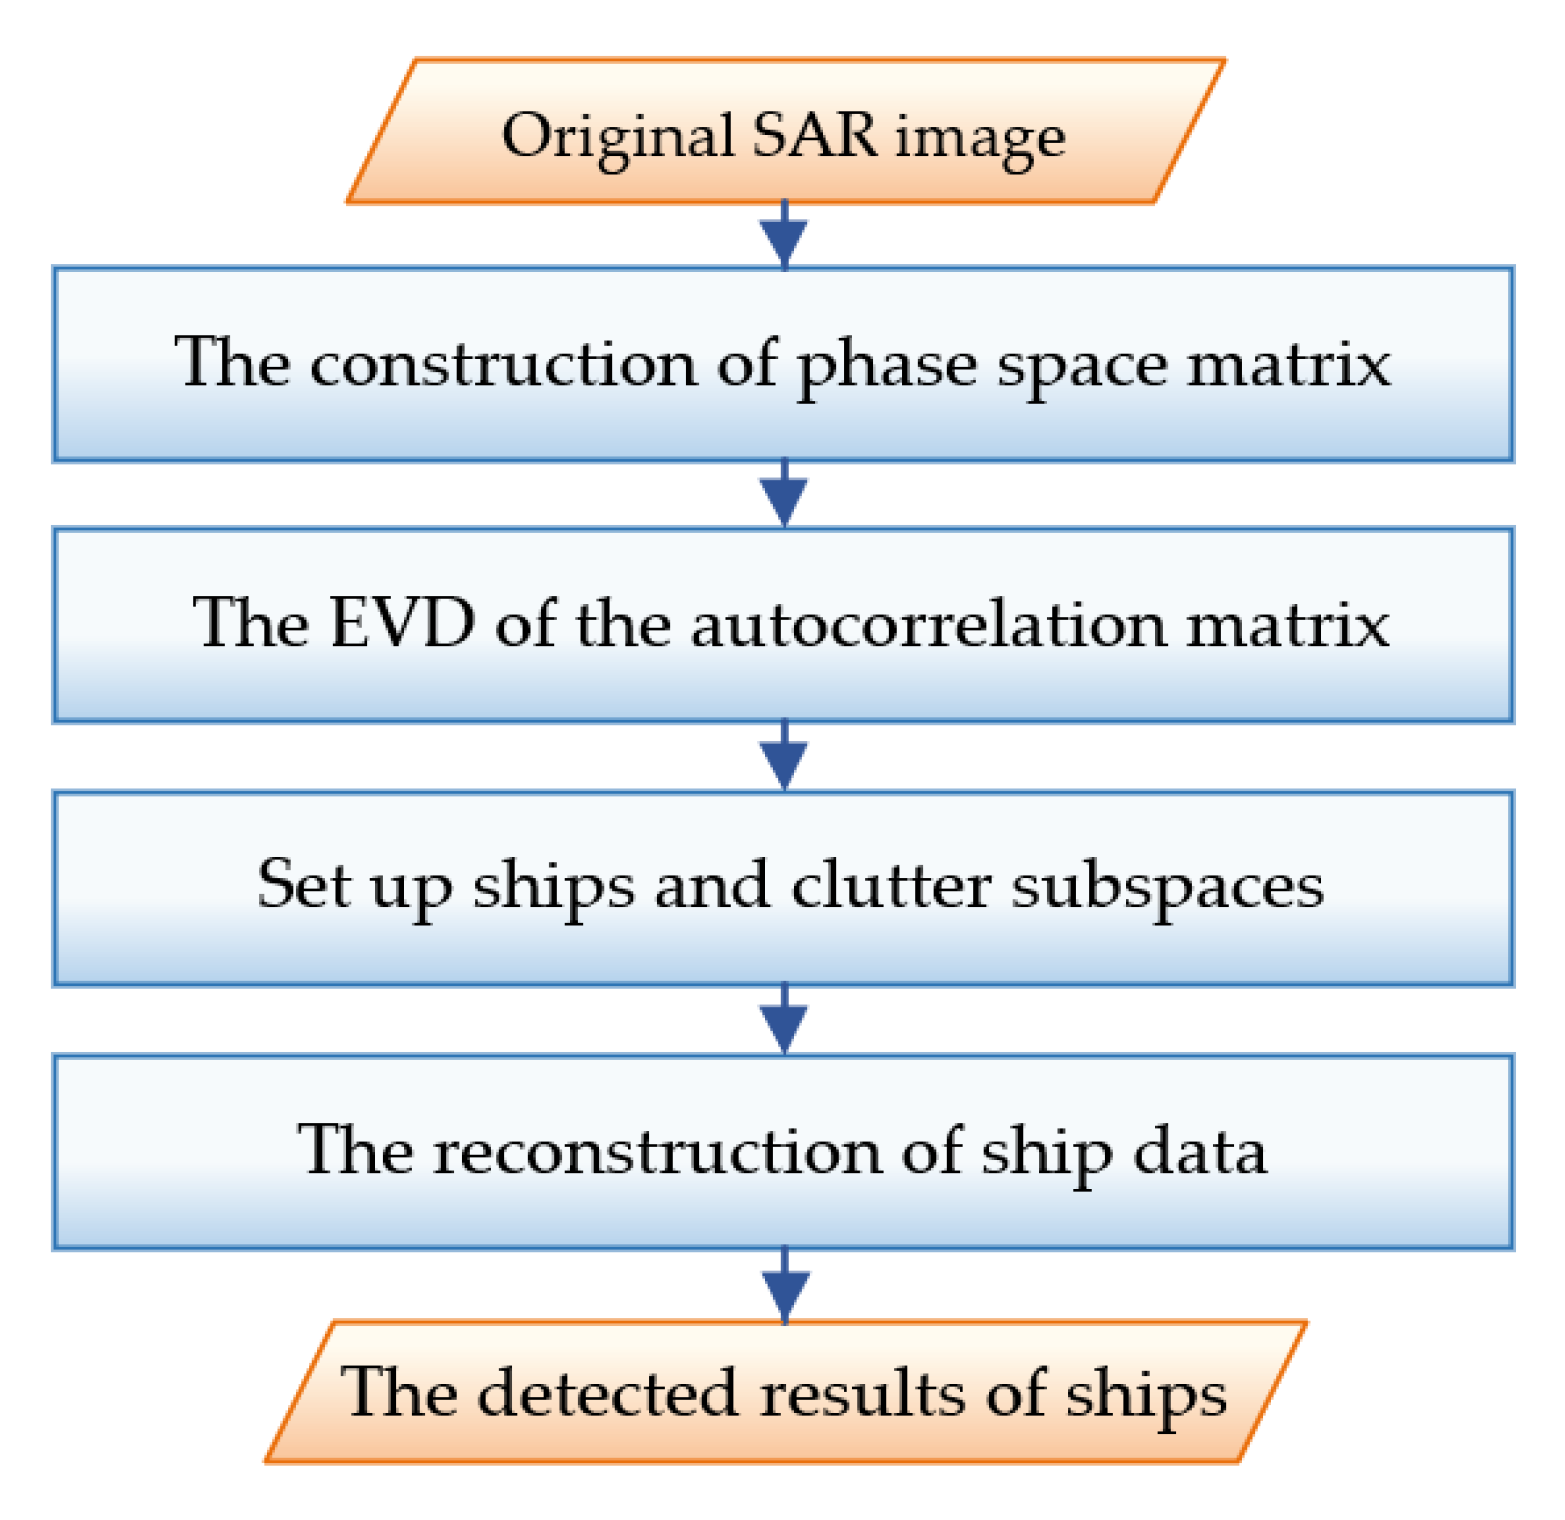
Figure 5.
The construction process of phase space matrix.

Figure 6.
Schematic diagram of image reconstruction.
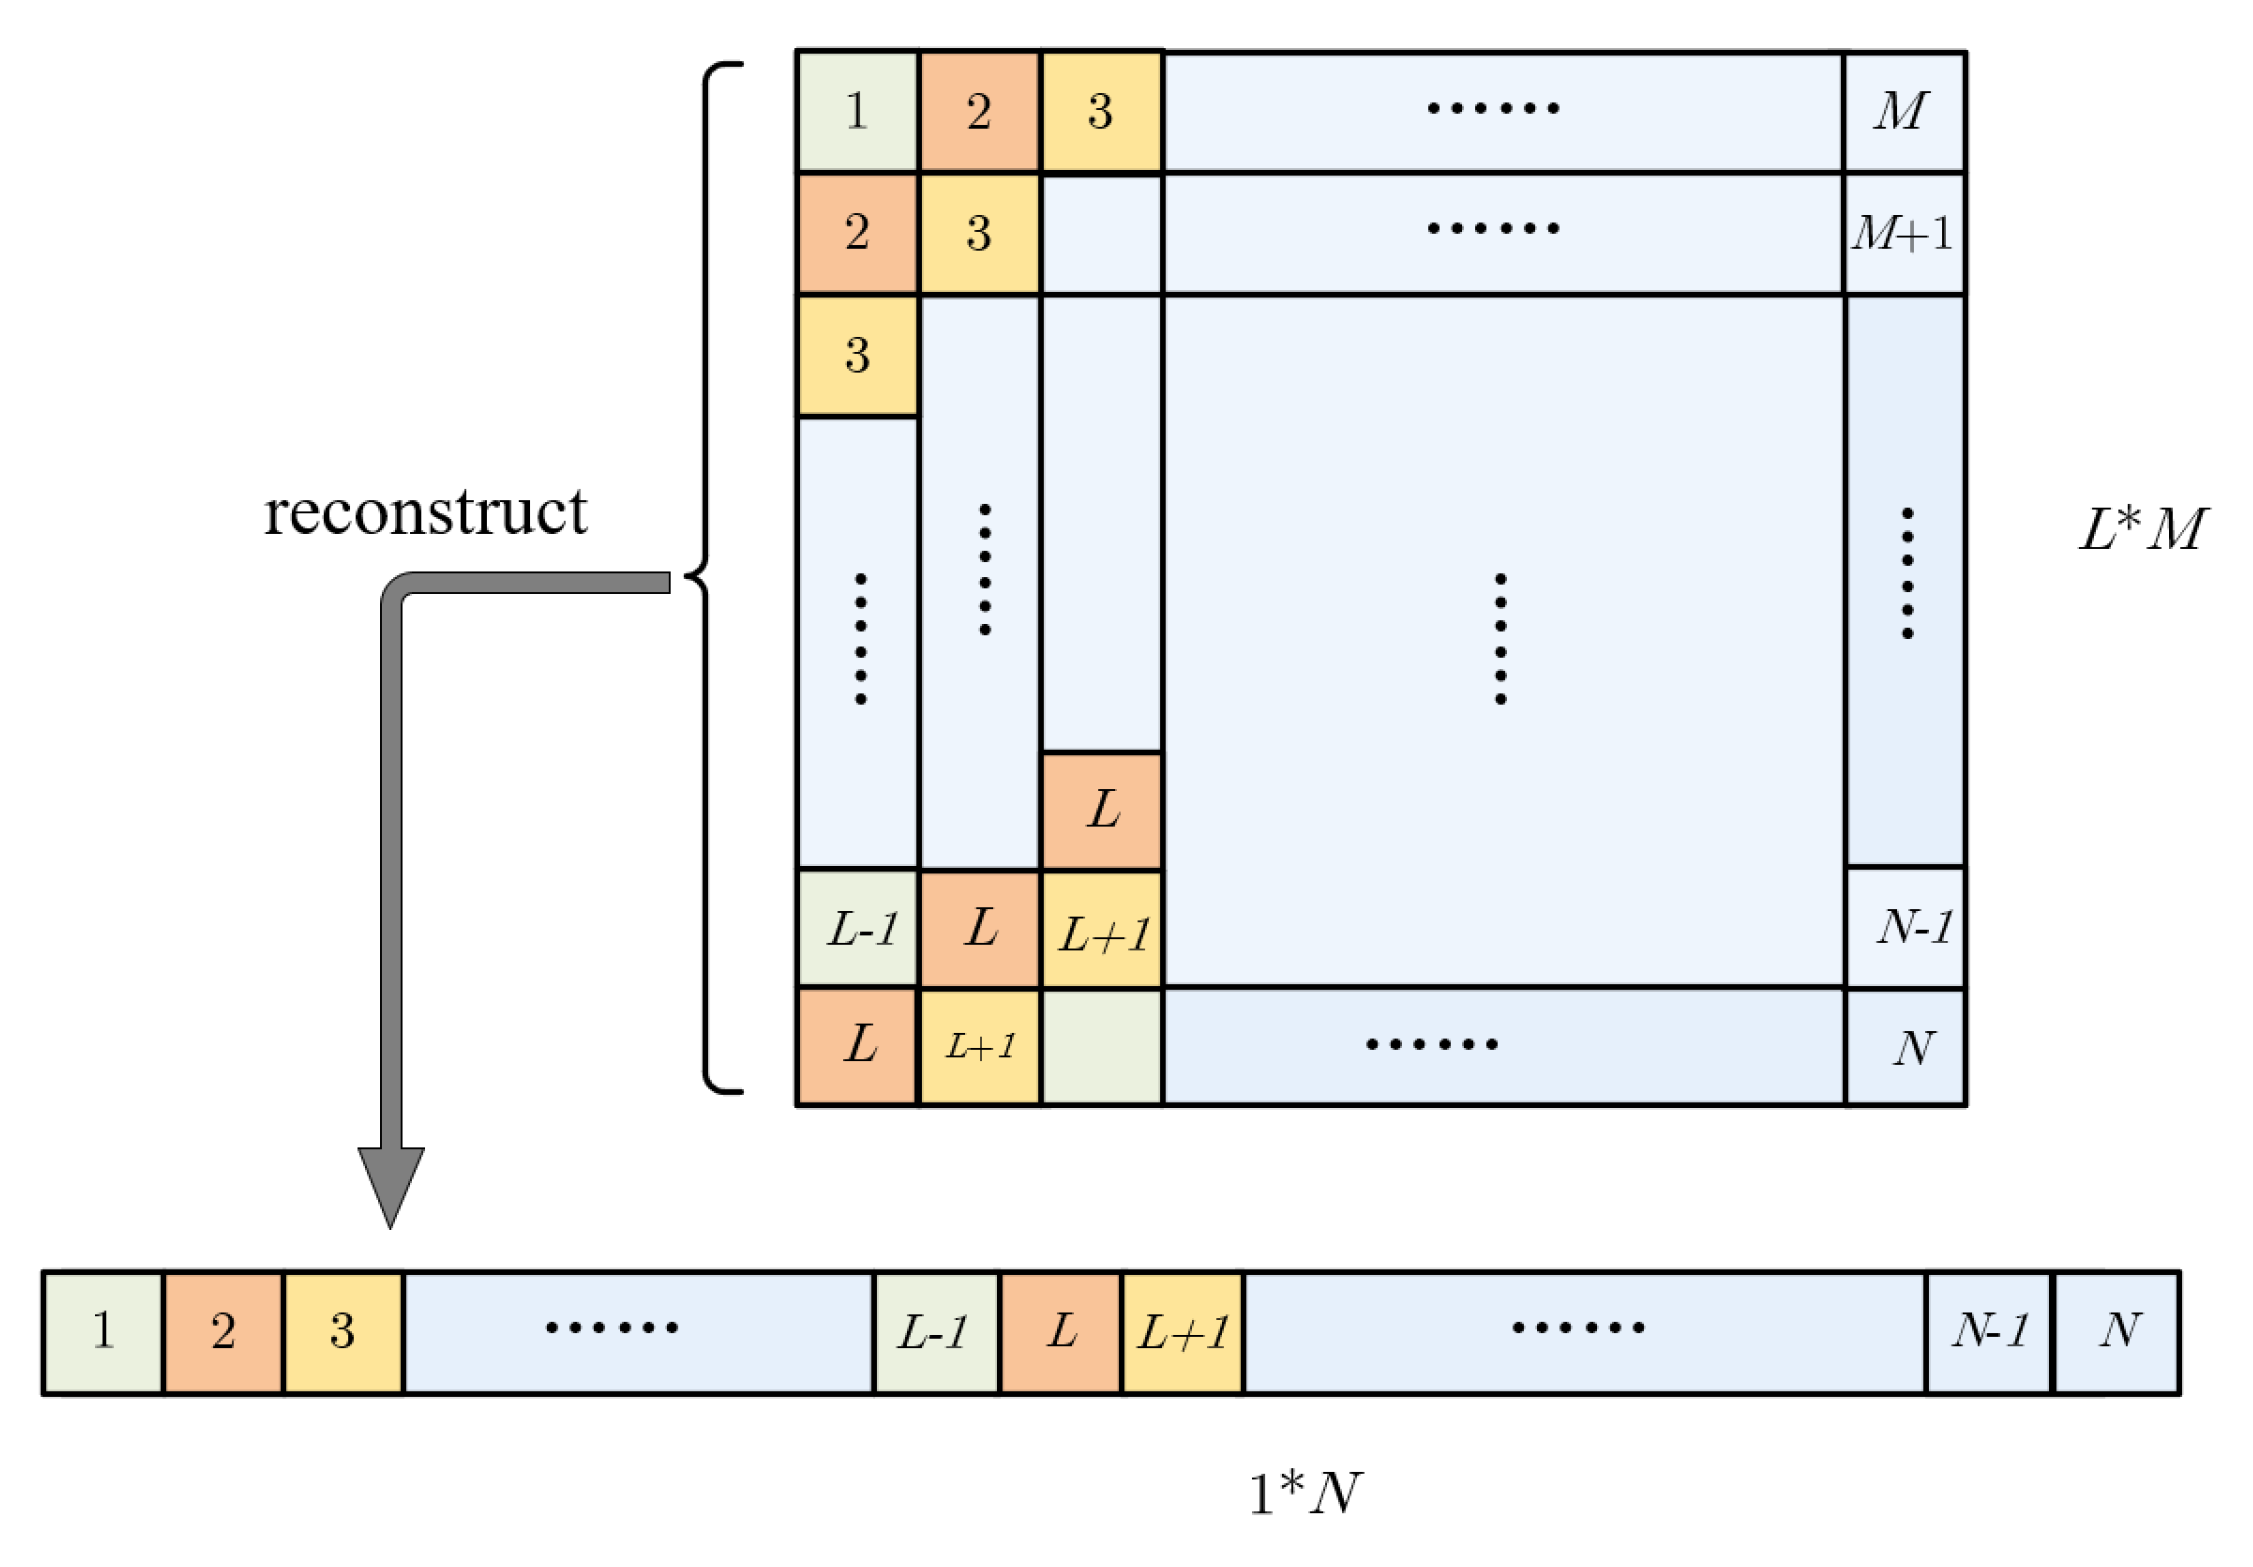
Figure 7.
Detection results of the different methods in the first image. (a) Original SAR image; (b) RPCA method; (c) SP-CFAR method; (d) the ESSP method.
Figure 7.
Detection results of the different methods in the first image. (a) Original SAR image; (b) RPCA method; (c) SP-CFAR method; (d) the ESSP method.
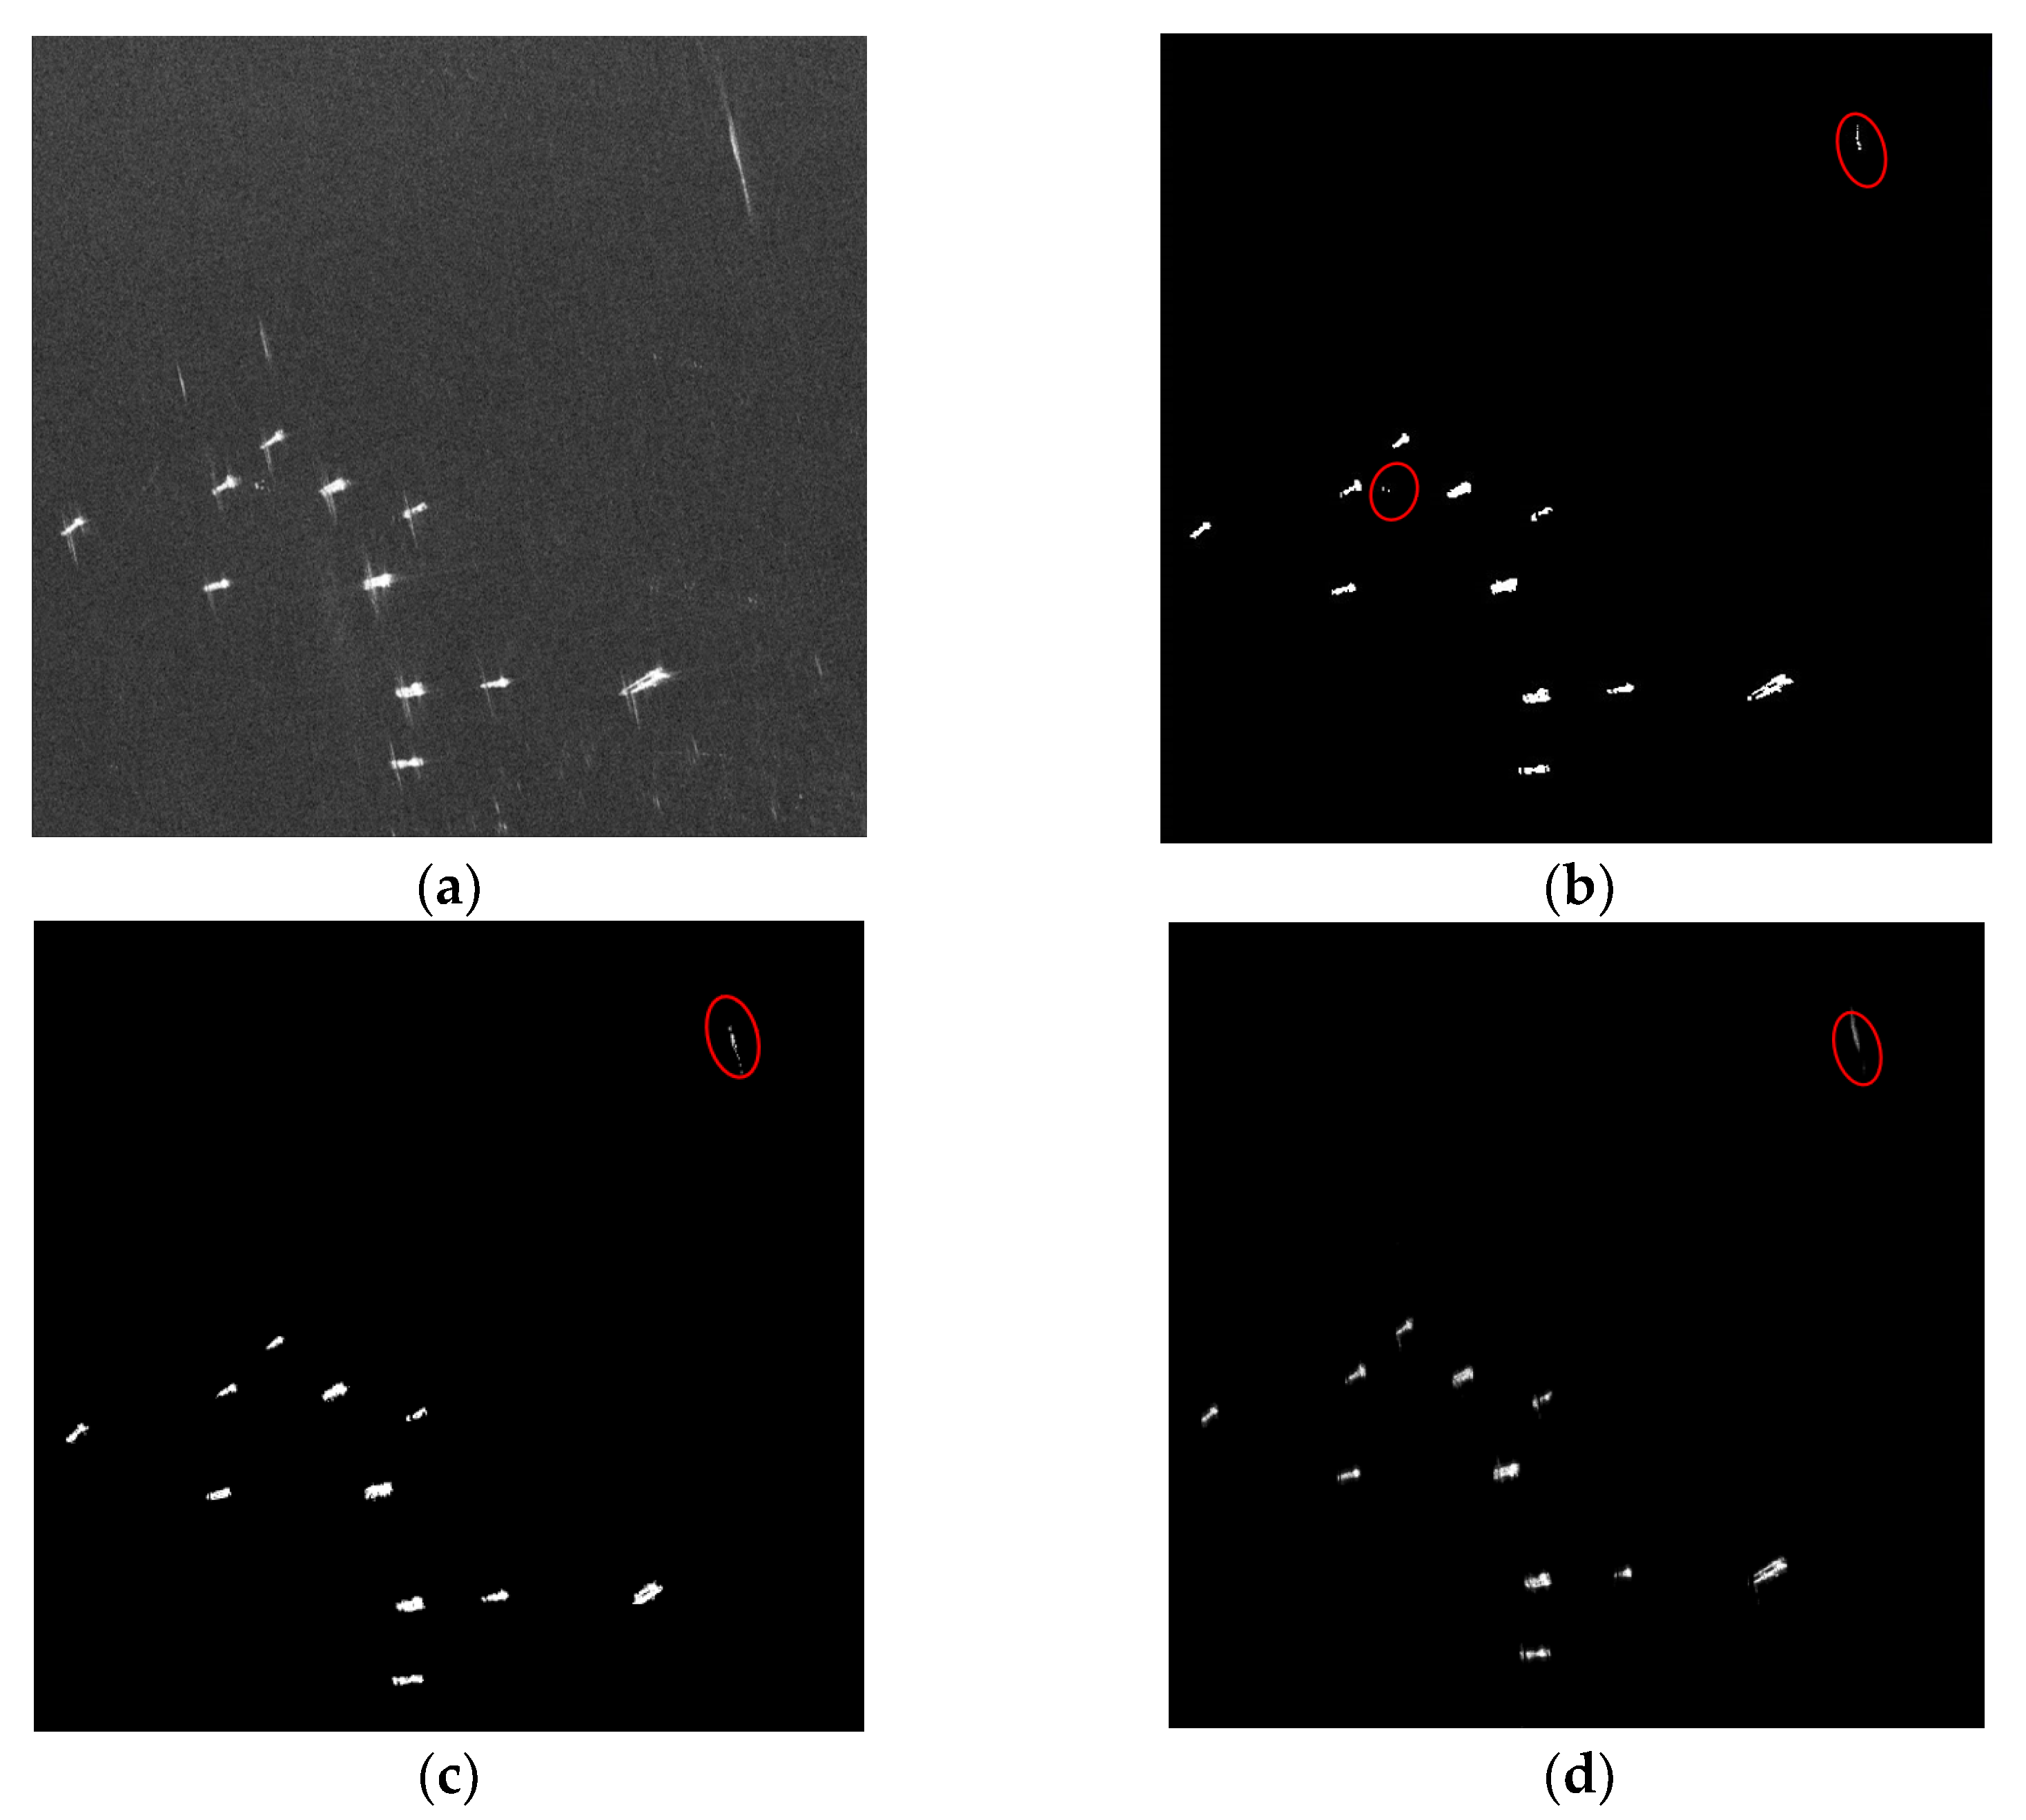
Figure 8.
Detection results of the different methods in the second image. (a) Original SAR image; (b) RPCA method; (c) SP-CFAR method; (d) the ESSP method.
Figure 8.
Detection results of the different methods in the second image. (a) Original SAR image; (b) RPCA method; (c) SP-CFAR method; (d) the ESSP method.
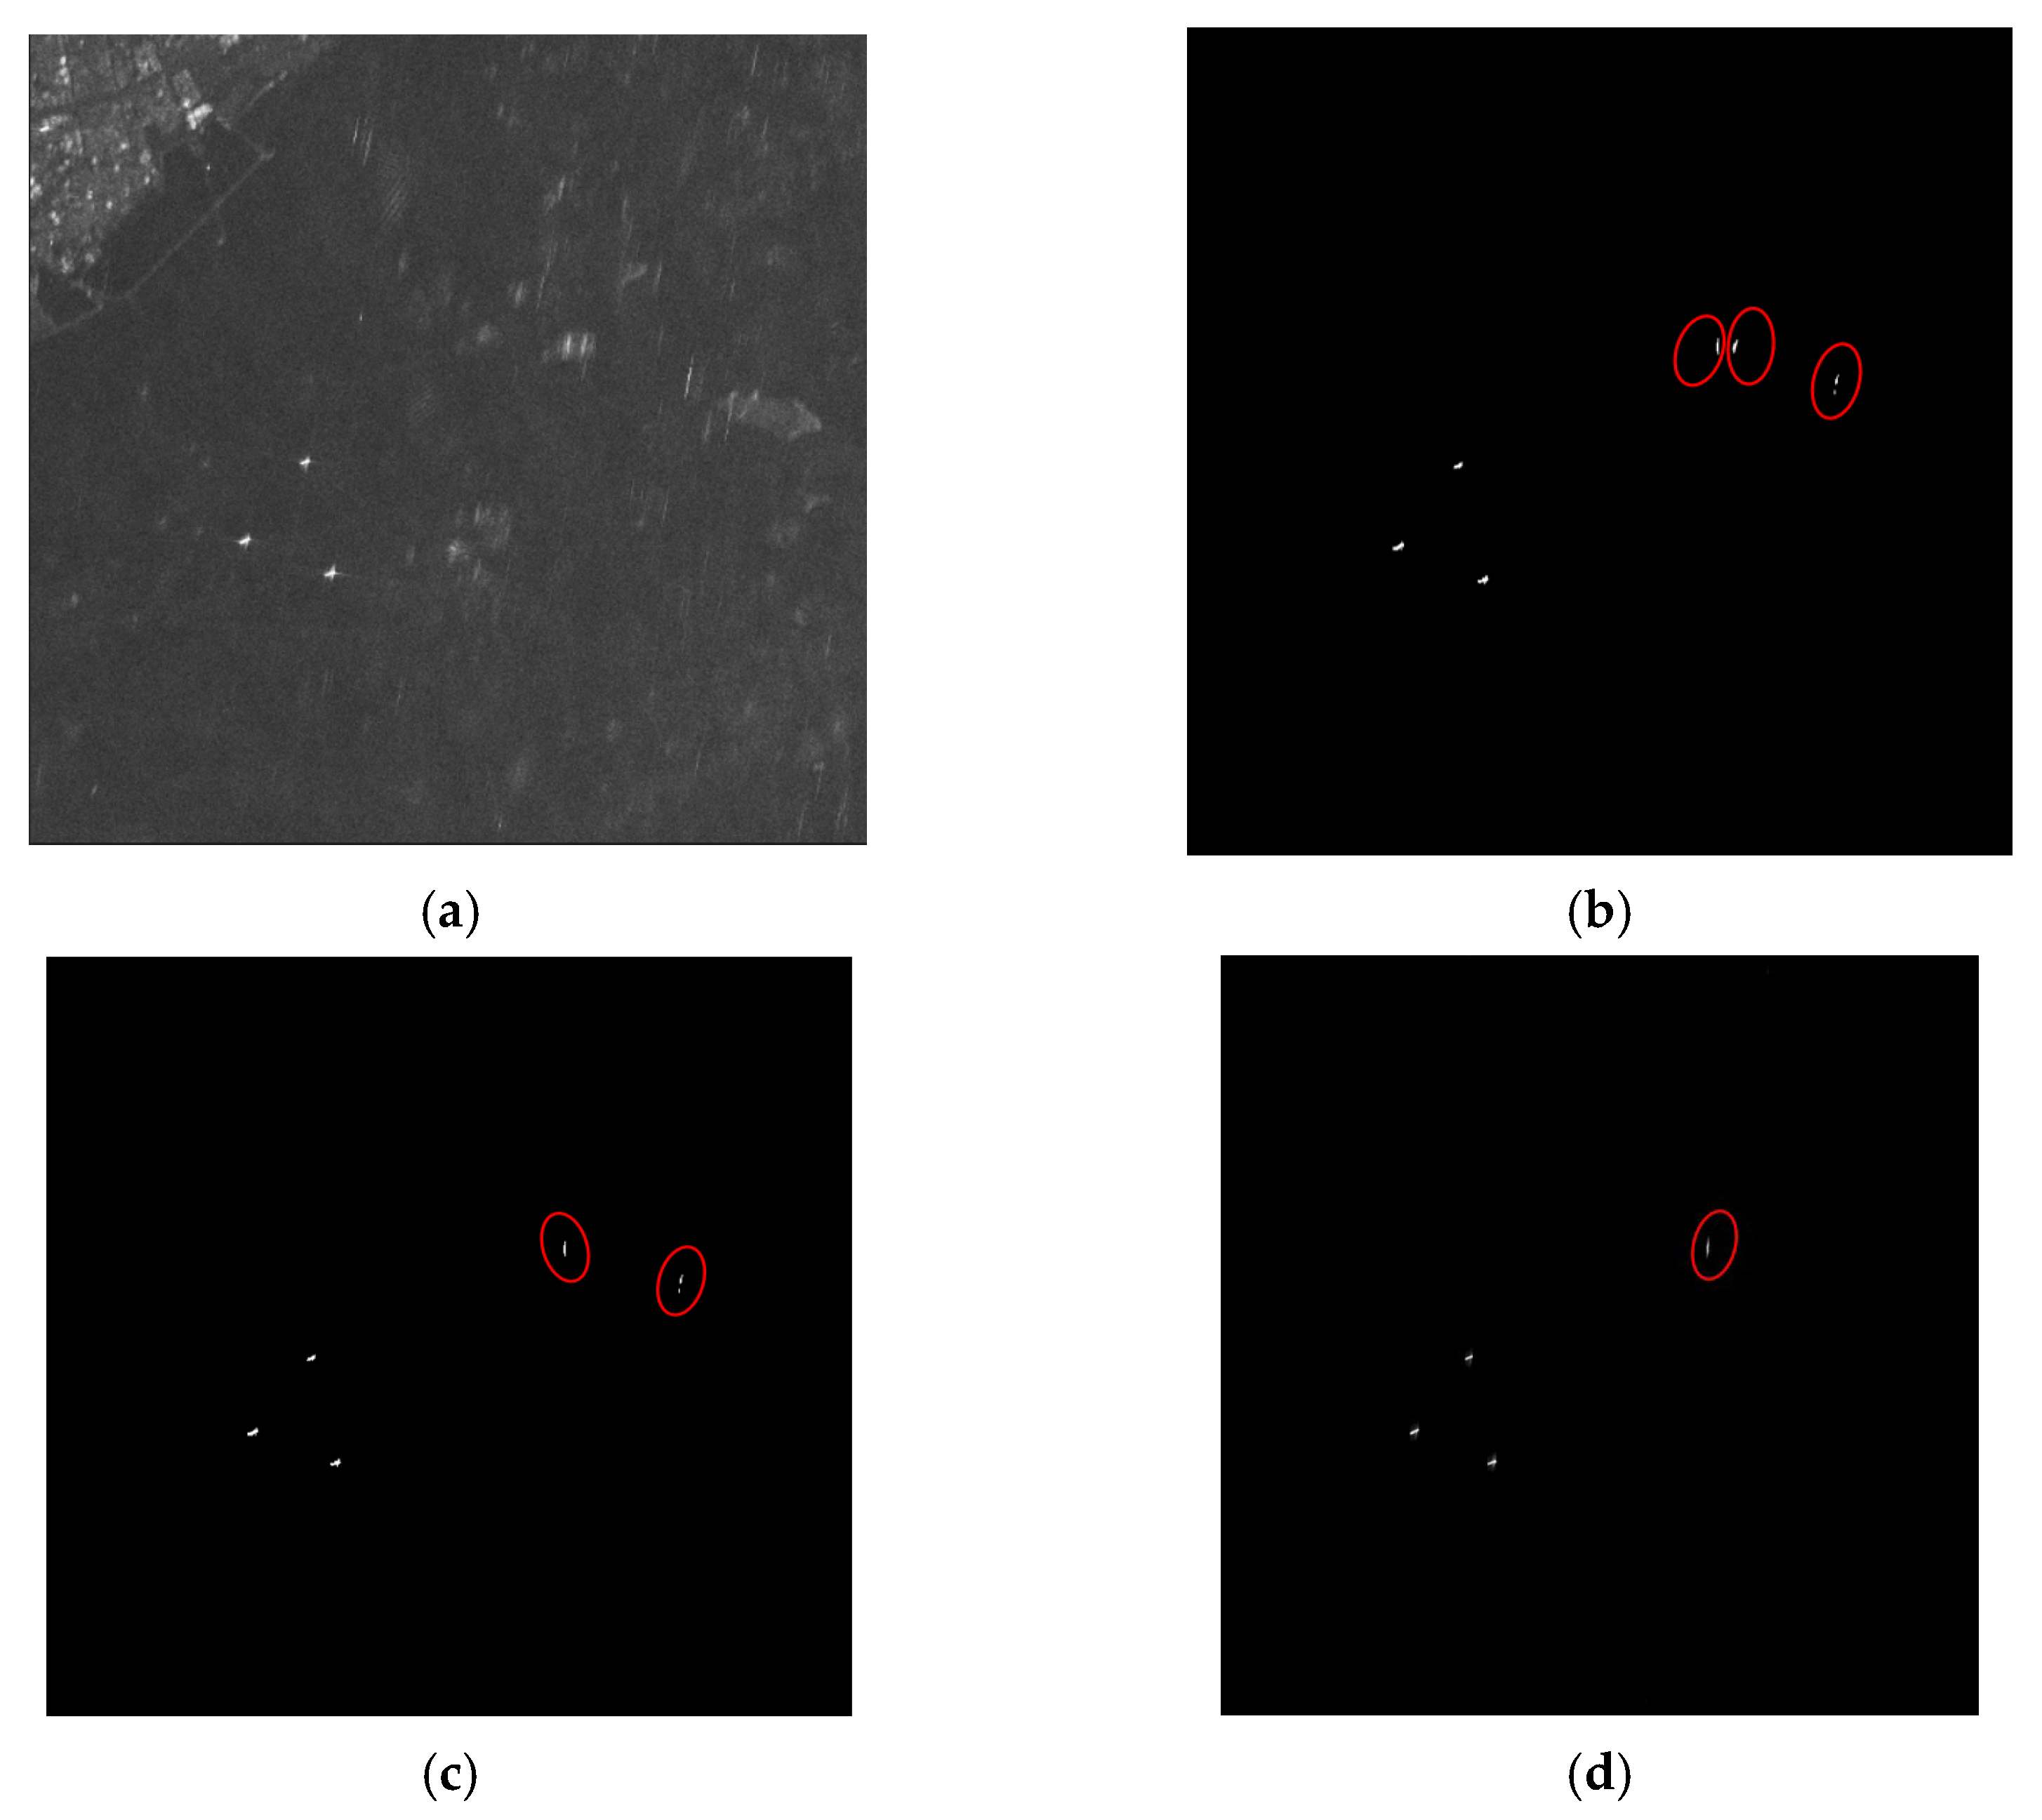
Figure 9.
Detection results of the different methods in the third image. (a) Original SAR image; (b) RPCA method; (c) SP-CFAR method; (d) the ESSP method.
Figure 9.
Detection results of the different methods in the third image. (a) Original SAR image; (b) RPCA method; (c) SP-CFAR method; (d) the ESSP method.

Figure 10.
Detection results of the different methods in the fourth image. (a) Original SAR image; (b) RPCA method; (c) SP-CFAR method; (d) the ESSP method.
Figure 10.
Detection results of the different methods in the fourth image. (a) Original SAR image; (b) RPCA method; (c) SP-CFAR method; (d) the ESSP method.

Table 1.
Imaging parameters of GF-3 satellite.
| Imaging Mode | Incident Angle (°) | Resolution (m) | Polarization Mode |
|---|---|---|---|
| Spotlight | 20–50 | 1 | Single polarization |
| Strip-map | 20–50 | 3 | Single polarization |
Table 2.
The scene and sea state information of the AIR-SARShip-1.0 dataset.
| Scene | Sea State | Number of Images |
|---|---|---|
| Nearshore | 0 | 1 |
| 1 | 9 | |
| 2 | 7 | |
| 3 | 4 | |
| Offshore | 1 | 2 |
| 2 | 2 | |
| 3 | 2 | |
| 4 | 4 |
Table 3.
Specific detection results of four images.
| Image | Method | FoM (%) | MR (%) | FR (%) | ||||
|---|---|---|---|---|---|---|---|---|
| 1 | RPCA | 11 | 11 | 0 | 2 | 84.62 | 0 | 18.18 |
| SP-CFAR | 11 | 0 | 1 | 91.67 | 0 | 9.09 | ||
| ESSP | 11 | 0 | 1 | 91.67 | 0 | 9.09 | ||
| 2 | RPCA | 3 | 3 | 0 | 3 | 50.00 | 0 | 100 |
| SP-CFAR | 3 | 0 | 2 | 60.00 | 0 | 66.67 | ||
| ESSP | 3 | 0 | 1 | 75.00 | 0 | 33.33 | ||
| 3 | RPCA | 42 | 40 | 2 | 3 | 88.89 | 4.76 | 7.14 |
| SP-CFAR | 41 | 1 | 2 | 93.18 | 2.38 | 4.16 | ||
| ESSP | 41 | 1 | 0 | 97.61 | 2.38 | 0 | ||
| 4 | RPCA | 20 | 19 | 1 | 2 | 86.36 | 5.00 | 10.00 |
| SP-CFAR | 19 | 1 | 1 | 90.48 | 5.00 | 10.00 | ||
| ESSP | 20 | 0 | 1 | 95.23 | 0 | 5.00 |
Table 4.
The quantitative detection performance of three methods.
| Method | FoM (%) | MR (%) | FR (%) | Time (s) |
|---|---|---|---|---|
| RPCA | 77.47 | 2.44 | 33.83 | 84.35 |
| SP-CFAR | 83.83 | 1.85 | 21.23 | 198.24 |
| ESSP | 89.87 | 0.59 | 11.86 | 21.37 |
Publisher’s Note: MDPI stays neutral with regard to jurisdictional claims in published maps and institutional affiliations. |
© 2022 by the authors. Licensee MDPI, Basel, Switzerland. This article is an open access article distributed under the terms and conditions of the Creative Commons Attribution (CC BY) license (https://creativecommons.org/licenses/by/4.0/).
Share and Cite
MDPI and ACS Style
Shu, G.; Chang, J.; Lu, J.; Wang, Q.; Li, N. A Novel Method for SAR Ship Detection Based on Eigensubspace Projection. Remote Sens. 2022, 14, 3441. https://doi.org/10.3390/rs14143441
AMA Style
Shu G, Chang J, Lu J, Wang Q, Li N. A Novel Method for SAR Ship Detection Based on Eigensubspace Projection. Remote Sensing. 2022; 14(14):3441. https://doi.org/10.3390/rs14143441
Chicago/Turabian StyleShu, Gaofeng, Jiahui Chang, Jing Lu, Qing Wang, and Ning Li. 2022. "A Novel Method for SAR Ship Detection Based on Eigensubspace Projection" Remote Sensing 14, no. 14: 3441. https://doi.org/10.3390/rs14143441
Note that from the first issue of 2016, this journal uses article numbers instead of page numbers. See further details here.