Article

Remote Sensing Data Fusion to Evaluate Patterns of Regional Evapotranspiration: A Case Study for Dynamics of Film-Mulched Drip-Irrigated Cotton in China’s Manas River Basin over 20 Years

1
College of Land Science and Technology, China Agricultural University, No. 2 Yuanmingyuan W Rd., Haidian District, Beijing 100193, China
2
Gilat Research Center, Soil, Water and Environmental Sciences, Agricultural Research Organization, Mobile Post Negev 85280, Israel
*
Author to whom correspondence should be addressed.
Remote Sens. 2022, 14(14), 3438; https://doi.org/10.3390/rs14143438
Submission received: 22 May 2022 / Revised: 28 June 2022 / Accepted: 15 July 2022 / Published: 17 July 2022
(This article belongs to the Special Issue Remote Sensing-Based Evapotranspiration Models)

Abstract

:
The accurate quantification of evapotranspiration (ET) is critical to the sustainable management of irrigated agriculture. In this study, we proposed a remote sensing data fusion method for predicting ET, coupling a surface energy balance system model with an enhanced spatial and temporal adaptive reflectance fusion model utilizing remote sensing inversion with satellite data from Landsat and MODIS. The method was tested for a case study with cotton fields under film-mulched drip irrigation (FMDI) in the Manas River Basin. Areas under FMDI were identified, and ET patterns were evaluated for a 21-year period spanning from 2000 to 2020. A field experiment, a regional survey, and data retrieved from the literature provided results demonstrating that the method allowed reliable estimation of ET distribution with simultaneously, relatively high spatial and temporal resolutions at both field and regional scales. ET was found to decline from upstream to downstream in the basin, with the difference gradually diminishing over time. Supported by the promotion of FMDI technology, the area under cotton production in the basin increased by an average of 4.9% annually. Limited irrigation quotas to farmers and, therefore, water application per area led to a decreasing ratio of relative water supply for potential ET and, thus, to a reduction in average actual ET of 7.5 mm year−1. The average ET in the basin declined to about 415.7 mm in 2020, 287.2 mm lower than its water demand. The dynamics of fused ET provide a reliable scientific basis for agricultural water resources planning and management and for the sustainable utilization of water and soil resources in the basin. The method, with simultaneously high temporal and spatial resolutions, should have both local and global practical potential.

Graphical Abstract

1. Introduction

Evapotranspiration (ET) is a principal component of the hydrological cycle, affected by both biophysical and environmental processes at the interface between soil, vegetation, and atmosphere. Reliable evaluation of ET is essential for sustainable agricultural and ecological water management, especially in arid and semiarid regions [1]. Methods of monitoring and estimating ET are greatly scale-dependent. Considerable progress has recently been made on the point (farm) scale. For example, weighing lysimeters, eddy covariance systems, the Penman–Monteith formula, and Bowen ratio systems are all examples of methods successfully applied to analyze point-scale water balance and ET dynamics for farmland water management [2]. Obtaining ET at the regional scale is influenced by many complicated factors, including spatial variation, human activity, and labor costs, and involves characteristics unlike those at the point scale [3]. Remote sensing has been demonstrated as effective and powerful in monitoring and evaluating regional ET through repeated acquisition of multi-band and multi-temporal information over large areas [4,5].
Enormous effort has been made to estimate ET through remote sensing inversion using empirical statistical and energy balance models. Comparatively speaking, energy balance models are more mechanical and practical by taking full consideration of the surface thermodynamic characteristics and energy balance processes [6]. As one of the most widely and successfully applied energy balance models, the Surface Energy Balance System model (SEBS) uses sensible heat flux to determine the surface energy balance index pixel-by-pixel through considering the effects of additional dry and wet limits. This enables the expression of the uneven distribution of water and energy typically found in arid and semiarid areas, thus significantly enhancing simulation accuracy [7,8]. Moreover, parameters related to complex aerodynamic resistances needed for the calculation process in SEBS can be readily estimated using meteorological data and underlying surface characteristics inversed from remote sensing data. Monitoring or estimation of regional ET is dependent on accurate identification or classification of surface features. The underlying surface in those arid or semiarid regions can often be comprised of complex landscapes, including farmland, forest, wasteland, roads, rivers or canals, reservoirs, buildings, and other components.
The arid inland Manas River Basin (MRB) is a typical oasis agricultural area in northern Xinjiang, China, with cotton as the dominant cultivated crop. Sustainable development of local oasis agriculture in the MRB is restricted by the shortage of water resources and soil salinization due to scarce precipitation and intense evaporation [9]. Beneficial for its ability to save water, alleviate salinization, and enhance crop yield, the technology of film-mulched drip irrigation (FMDI) has been applied successfully and widely in Xinjiang since its development in the MRB at the end of the last century [10]. In recent years, oasis agriculture in the region has been influenced by combined environmental and management changes. Climate change and changes in the watershed’s hydrological cycle have been responded to and accompanied by the adoption of water-saving technologies and an adjustment of agricultural cultivation methodologies. This has resulted in unpredictable patterns of soil water–salt dynamics, including ET [11], and especially the necessity for understanding the spatiotemporal variation of ET in cotton fields under film-mulched drip irrigation (CFFMDI) in the MRB.
The ET of CFFMDI, affected by many complex and continuously changing factors, such as meteorological, soil environmental, and crop growth conditions, fluctuates drastically over time. Too large a time interval between acquisitions of remote sensing images used for inferring ET would result in inaccurate capturing of ET dynamics. Both high temporal and spatial resolutions are therefore required for estimating regional ET of CFFMDI in the MRB. Unfortunately, current remote sensing estimation of regional ET is mostly based on limited data sources, e.g., Landsat or MODIS. Due to technical or cost constraints, it is difficult to simultaneously achieve high resolution of both time and space [12]. Among commonly used remote sensing image sources, the Landsat series satellites provide a high spatial resolution of up to 30 m, as well as great potential in vegetation index extraction and monitoring of land cover dynamic change. However, Landsat is limited by a long, up to 16-day, revisit cycle and is susceptible to atmospheric conditions, such as cloud cover and aerosols, that disturb image acquisition [13]. In contrast, MODIS images are acquired daily, but with a lower spatial resolution of 250–1000 m, making effective analysis of complex underlying surfaces difficult. Hence, we hypothesized that fusing remote sensing data from both Landsat and MODIS would be an efficient and economical method to simultaneously meet the requirements of high spatial and temporal resolutions for the estimation of regional ET in CFFMDI in the MRB.
Traditional image fusion methods, such as luminance–hue–saturation (IHS) transform, principal component analysis, and wavelet transform [14], were proposed mainly through fusing high-resolution panchromatic data and low-resolution multispectral data to improve the spatial resolution, but not the temporal resolution [12]. The widespread application of big data and cloud computing has given birth to data fusion technologies designed to meet the requirements for simultaneous, high spatial and temporal resolutions using various remote sensing data sources [15]. For example, as one of the most widely used spatiotemporal fusion models, the Spatial and Temporal Adaptive Reflectance Fusion Model can effectively fuse remote sensing images mainly based on weight function [16]. However, implicated by mixed pixels, especially when images of critical periods are missing, this model is only feasible for the fusion of surface parameters, such as normalized differential vegetation index (NDVI), which change slowly with time, and it is likely to fail in effectively capturing the sharp fluctuations of surface features and, thus, to lead to an irrational calculation of ET [4]. An Enhanced Spatial and Temporal Adaptive Reflectance Fusion Model (ESTARFM) was proposed to overcome the above shortcoming by assuming that the reflectance of features changes linearly over a period of time, and the corresponding values of mixed pixels are linearly combined by spectral values of different surface features [12]. A conversion coefficient was introduced into the model to solve the mixed-pixel problem, making the selection of similar pixels and temporal weight calculation more reasonable and thereby improving the fusion accuracy of a complex surface. ESTARFM has been successfully applied in surface reflectance fusion [8]. Nevertheless, further attention should be paid to the applicability and effectiveness of ESTARFM in remote sensing monitoring and estimation for regional ET.
The objectives of this study were to (1) propose and verify a remote sensing data fusion method to estimate ET with simultaneously high temporal and spatial resolutions by coupling the models of SEBS and ESTARFM; and (2) analyze the past 21 years’ (2000–2020) temporal and spatial variation of fused ET in CFFMDI over growing seasons (April–September) in the MRB so as to provide reasonable strategies of allocation management and sustainable utilization for local agricultural water resources. The spatial distributions of CFFMDI were identified using a Random Forest (RF) algorithm based on the downloaded Landsat images of the basin for the last 21 years. Both Landsat and MODIS series remote sensing data were employed to estimate (by SEBS) and fuse (by ESTARFM) regional ET distributions. Measurements from a field irrigation experiment, a regional survey, and literature retrieval for CFFMDI were used to verify the method at both farmland and regional scales.

2. Materials and Methods

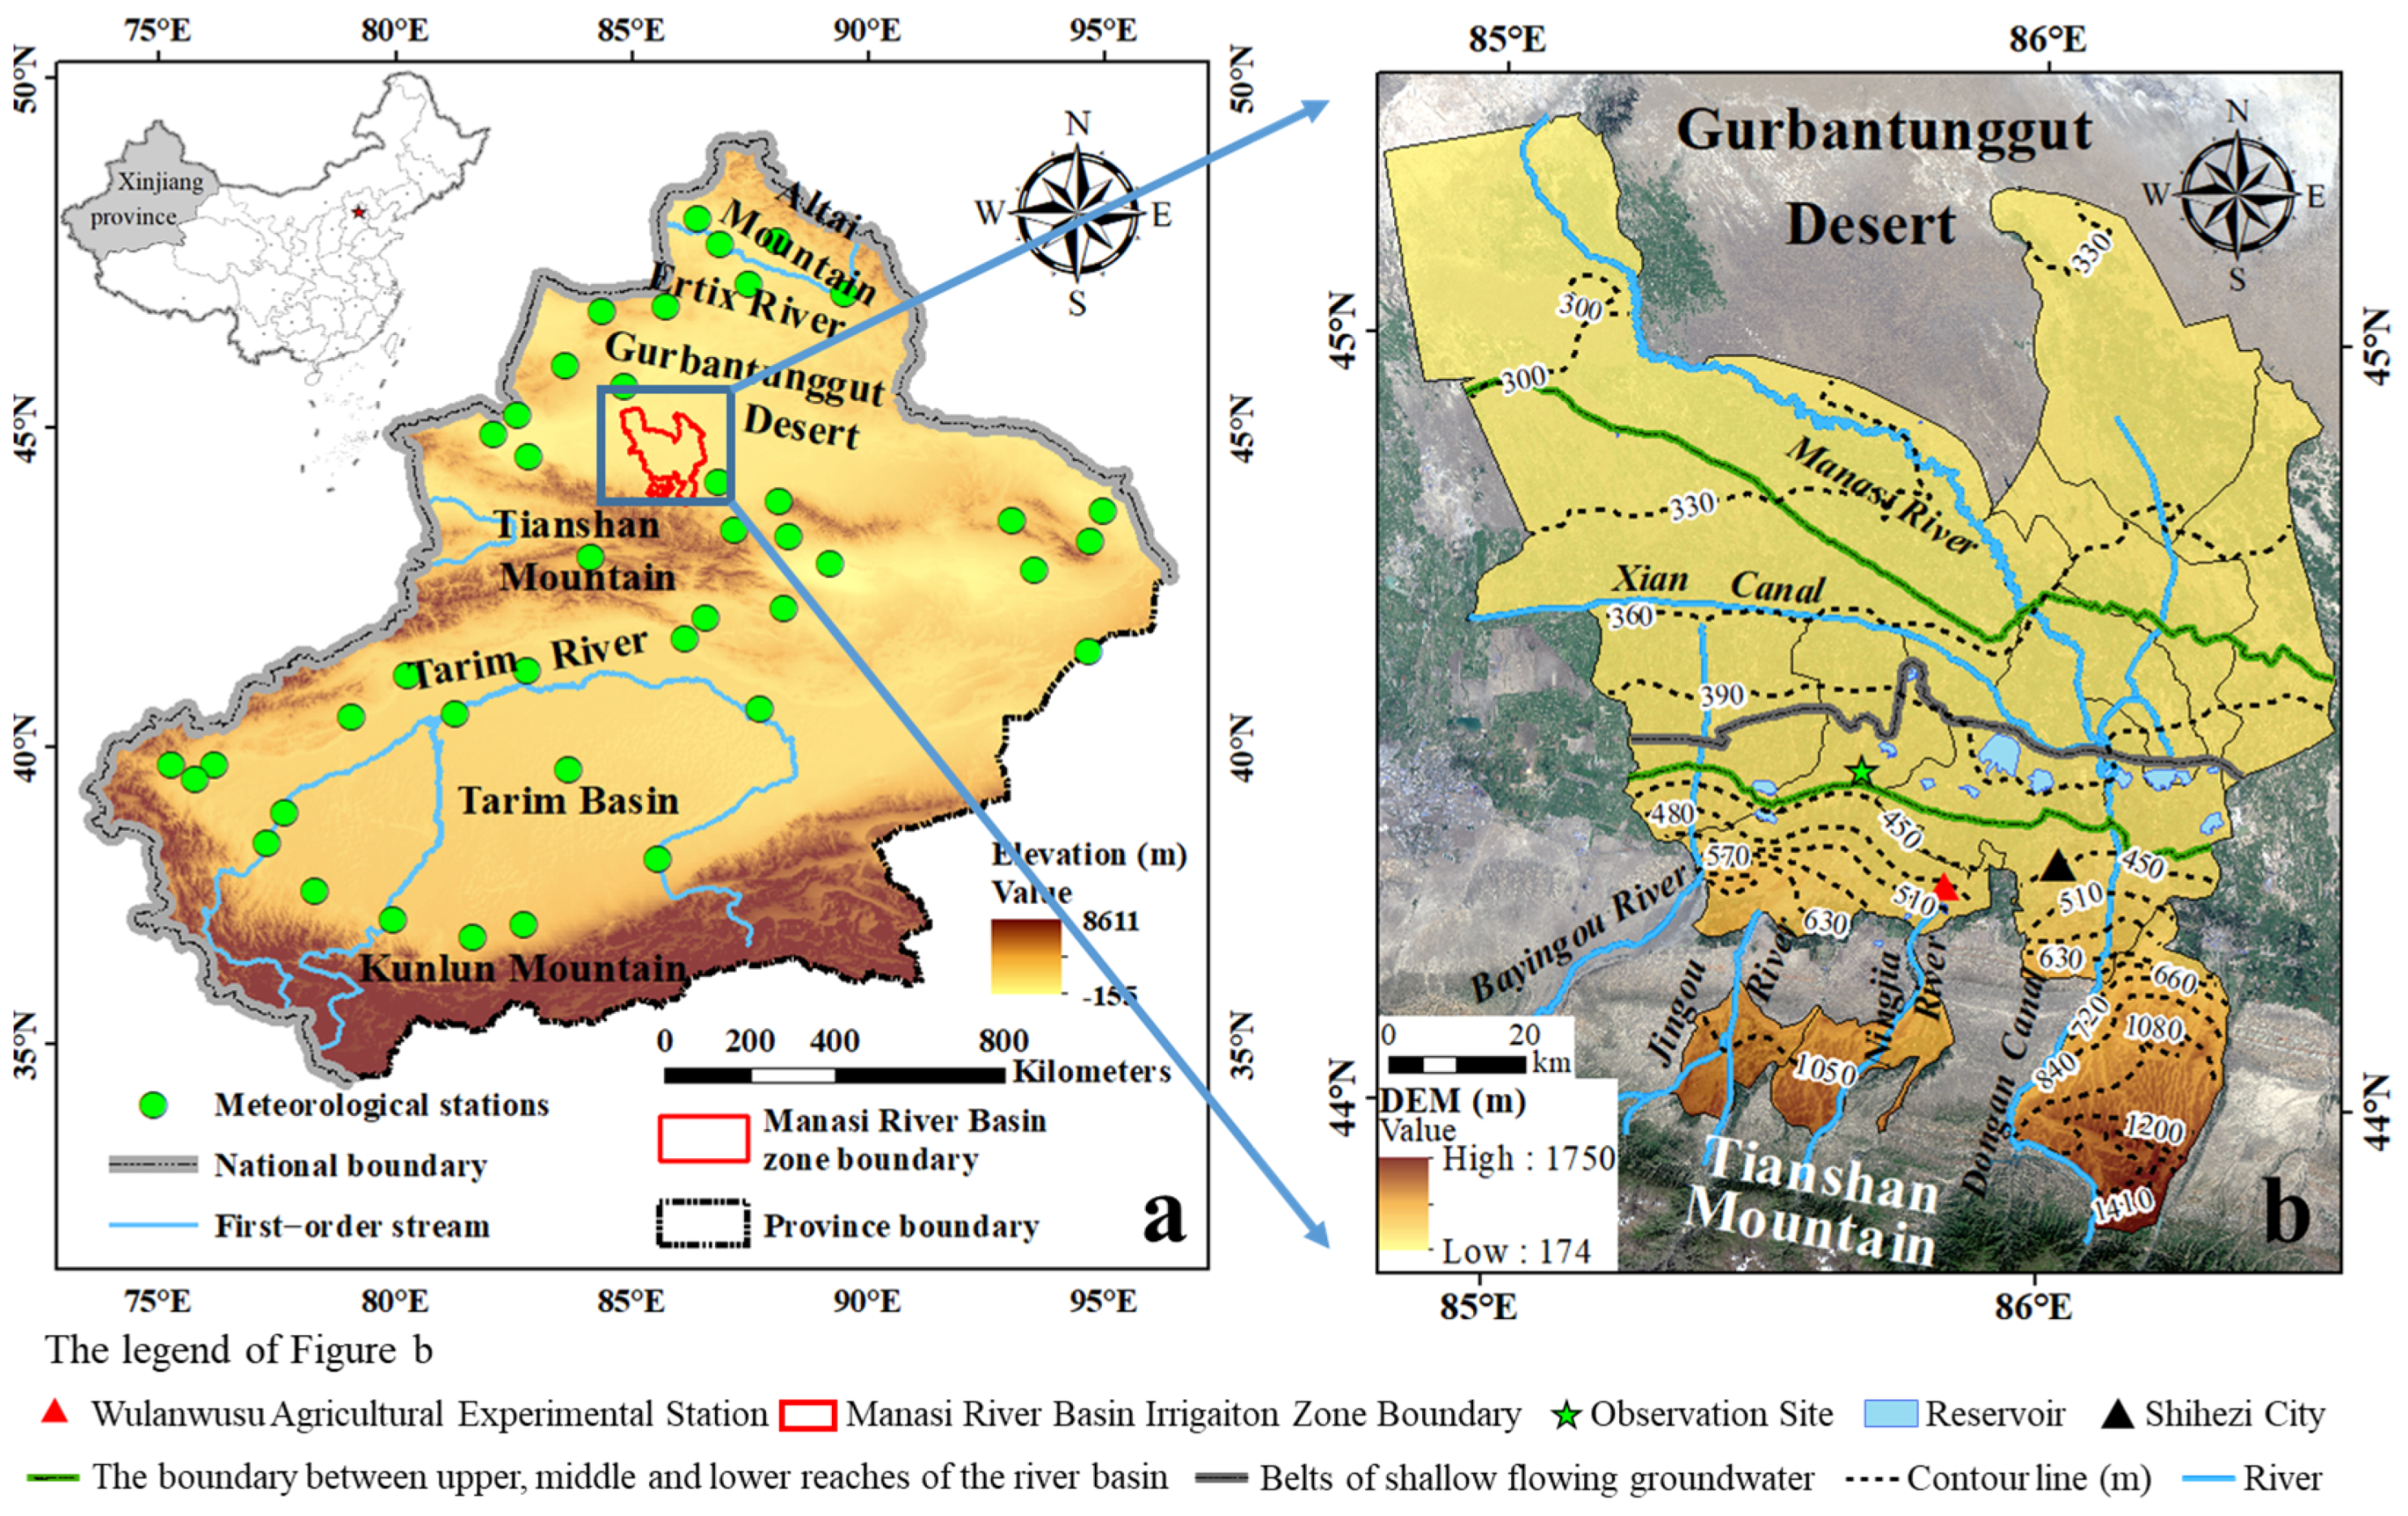
2.1. Overview of Study Area

The MRB is located at the northern foot of Tianshan Mountain and the southern margin of the Junggar Basin (Figure 1a), covering an area of about 33,400 km2. With gradually decreasing elevation from 1748 masl in its southeast to 175 masl in its northwest, the MRB consists of typical mountain–oasis–desert geomorphic features [17], among which oasis (43°27′–45°21′N, 85°1′–86°2′E) covers about 11,090 km2 (Figure 1b). The basin is a typical continental arid climate zone, with annual average precipitation of 110–210 mm, free water evaporation of 1600–2300 mm, average relative humidity of 65%, mean temperature of 6.0–6.9 °C, and maximum temperature of 41 °C. Limited by strong evaporation and scarce precipitation, local agricultural production is heavily dependent on irrigation.
The soil texture in the basin is mainly silty clay loam, including sierozem soil, meadow soil, and saline soil, with poor fertility. Farmland in the MRB is located mostly mid- and downstream, with only small areas farmed upstream. The most heavily salinized area is near belts of shallow (around 1.2 m below the surface) flowing groundwater (Figure 1b) [17]. The technology of FMDI has been widely promoted and applied in local areas since its local development in 1999. Almost all the irrigated areas in the MRB are equipped with FMDI and the agriculture is highly mechanized. Besides the main crop of cotton, a small number of other crops, such as grape vineyards, wheat, maize, and pepper, are cultivated in the MRB. The annual growing season of cotton typically lasts from April to September, with its early growth stage between April and early May, middle from mid–late May to the end of August, and final in September. Considering that this study concerned the spatiotemporal evolution dynamics of ET in the cotton fields of the MRB since the promotion of FMDI, we studied the annual local cotton growing seasons from April to September over a 21-year period from 2000 to 2020.

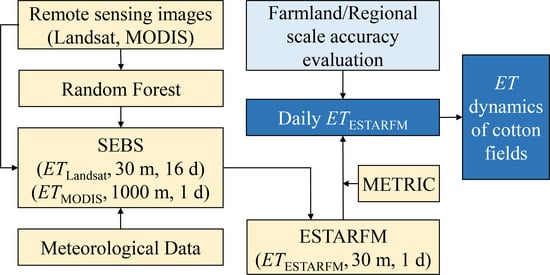
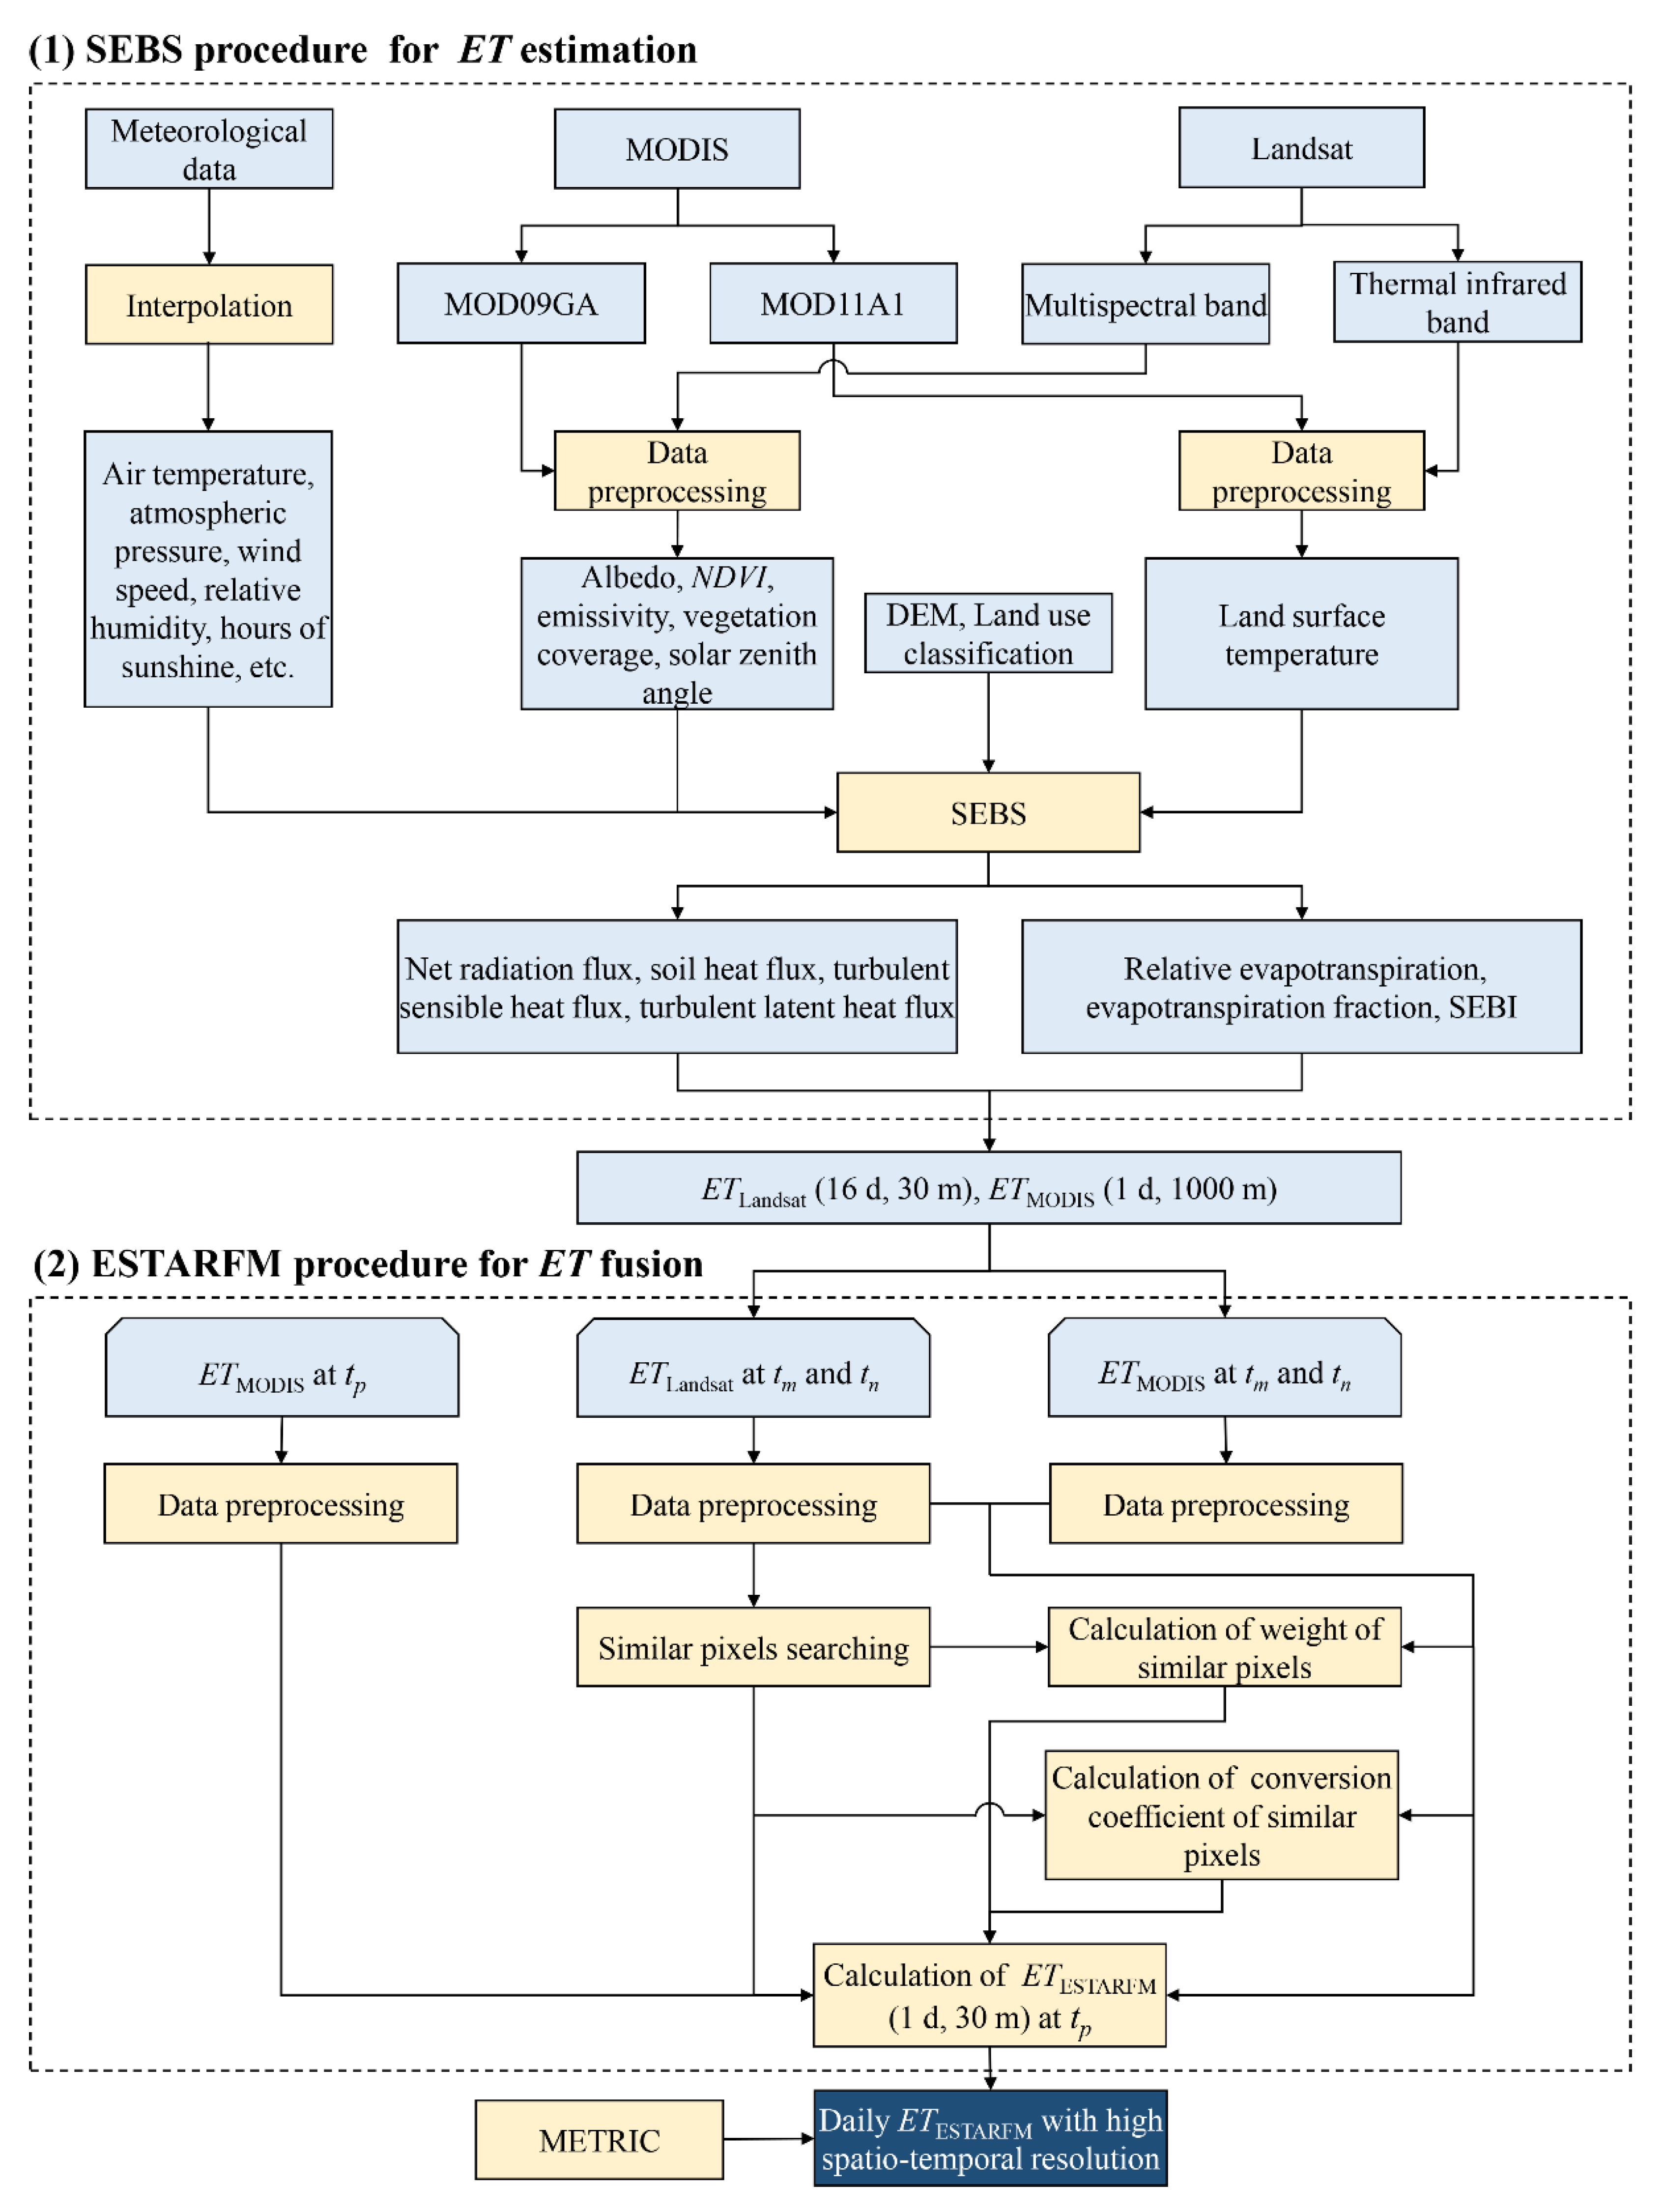
2.2. SEBS for Estimating Daily ET

As a typical single-source energy balance model focusing on the theoretical relationship between net radiation flux and its component fluxes, including soil, sensible, and latent heat, the SEBS estimates the ET-incorporated atmospheric turbulent (latent heat) flux through a combination of remote sensing images (Landsat or MODIS data) and surface meteorological data [7]. In a word, ET can be conveniently calculated based on the turbulent latent heat flux estimated on the known net radiation flux, soil heat flux, and sensible heat flux. Among the simulation processes, taking both short- and long-wave radiation into consideration, net radiation flux was estimated with surface reflectance (calculated using fitting formula varying according to remote sensing data source), emissivity (calculated based on NDVI), and radiation temperature obtained from remote sensing images [18,19]. Then, soil heat flux was estimated through splitting net radiation flux according to the vegetation coverage calculated from NDVI [7,20]. Finally, the turbulent sensible heat flux was estimated through iteratively solving three nonlinear equations between the variables of friction velocity, sensible heat flux, and Obukhov length, which were established on the similarity theory of atmospheric boundary layer [21,22]. The input parameters and status variables, such as temperature, wind speed, and NDVI, required for the equations were readily measured, with no need to consider complicated surface energy balance terms [7]. For the convenience of reference, the corresponding theoretical background and simulation procedure of SEBS for estimating daily ET are supplemented in Section S1 of the Supplementary Materials.

2.3. ESTARFM for Fusing Remote Sensing Data

As previously mentioned, the energy balance parameters (e.g., surface albedo, emissivity, temperature, atmospheric transmittance, etc.) required for ET estimation by SEBS have different time and spatial resolutions, depending on whether the inversion source originated from Landsat or MODIS remote sensing images. The spatial resolution is 30 m for ETLandsat (mm d−1, representing the ET distribution estimated using Landsat remote sensing images) every 16 d, and is 1000 m for daily ETMODIS (mm d−1). To simultaneously ensure high resolution of ET evaluation over both time and space, ETLandsat and ETMODIS were fused through ESTARFM to obtain the dynamics of daily evapotranspiration rate ETESTARFM (mm d−1) during the growing season of CFFMDI in the MRB [23]. Detailed theoretical background and the data fusion procedure are attached in Section S2 of the Supplementary Materials.
As demonstrated in Section S2, every ETESTARM-p at the predicted time tp was fused through four series of ETLandsat-m, ETLandsat-n, ETMODIS-m, and ETMODIS-n at two reference times tm and tn, and one serial of ETMODIS-p at tp. To fully understand the dynamics of crop water consumption and use efficiency, daily evapotranspiration would be expected to be fused through ESTARFM, using ETMODIS of each growing day as the input information. However, during the entire growth period of the crop, only those days under favorable atmospheric conditions (such as without clouds, aerosols, or dust) were effective to acquire good-quality MODIS images for estimating ETMODIS and then fusing ETESTARM. Consequently, the METRIC (mapping evapotranspiration with internalized calibration) algorithm, a time reconstruction method of remote sensing inversion results, was chosen to obtain the missing ETESTARM through linear interpolation of the ratio between ETESTARM and reference ET by taking into account the effect of changes in physiological characteristics during vegetation growth on ET [24]. The corresponding fusion process of ETESTARM is summarized and illustrated in a flow chart in Figure 2.

2.4. Data Used for Remote Sensing Inversion and Model Validation

2.4.1. Remote Sensing Data

A total of 48 Landsat images (path 144, row 29, spatial resolution 30 m) with no uncommon environmental phenomena, such as clouds, aerosols, or dust (i.e., under clear sky conditions), covering the study area and the annual crop growing season in the 21 years from 2000 to 2020 were selected for land-use classification (i.e., identification of cotton fields) and ET estimation. The images were downloaded from the national geological survey explorer database (www.earthexplorer.usgs.gov (accessed on 10 January 2021)), with their specific overpass dates and other details shown in Table S1 of Section S3. All images were calibrated and atmospherically corrected using the QUAC (Quick Atmospheric Correction) module. Influenced by SLC-off Landsat7 ETM+, gaps of the images from 2002–2005 and 2012 were filled based on the triangulation algorithm [25]. Among the 48 images that underwent a series of preprocessing, 42 images were used for the inversion of the surface parameters NDVI, vegetation coverage, surface albedo, and temperature to estimate ET using SEBS. Given that the boll opening stage of cotton is the best time to identify cotton fields in this study area [26], a total of 21 scenes of Landsat remote sensing images (Table S1) during August–October of each year were selected for land-use classification and to identify CFFMDI in the MRB through the RF method, a machine learning algorithm. If there was no relevant image that could meet the above screening conditions, the cloudless image in the near period was used to replace it. Compared with Landsat, the freely available Copernicus Sentinel-2 should be feasible to provide more advanced multispectral images with finer spatial resolution (10–20 m) and shorter revisit time (3–10 d). However, the related satellite was not put into operation until 2016. To keep the consistency of remote sensing data from different sources during the considered 21-year period, only Landsat images were used for both surface feature classification and ET estimation in this study. Remote sensing images for ET estimation and fusion also originated from the moderate-resolution imaging spectroradiometer (MODIS) database, Level-1 and Atmosphere Archive & Distribution System (https://ladsweb.modaps.eosdis.nasa.gov (accessed on 12 May 2020–10 January 2021)). The MODIS data (with horizontal bands H23 and H24, vertical band of V04, temporal resolution of 1 d, and spatial resolution of 1000 m) included surface reflectance (MOD09GA) and temperature (MOD11A1) during April–September of each year from 2000 to 2020, covering the same study area and period as those for Landsat images. All the downloaded images were visually inspected, and only those with effective data covering more than 75% of the MRB were selected for ET estimation. The gaps of the images were also filled based on the nibble function in Python2.7 (Guido Van Rossum, The Netherlands). Prior to estimation, the remote sensing data prepared for SEBS were preprocessed with all the original images reprojected into World Geodetic System 1984/Universal Transverse Mercator 45 North coordinate system using the MODIS Reprojection Tool.
The Digital Elevation Model (DEM) data required for atmospheric transmittance inversion came from the ASTER GDEM V2 dataset of Geospatial Data Cloud (http://www.gscloud.cn/ (accessed on 19 September 2020)) at the Computer Network Information Center, Chinese Academy of Sciences, with a spatial resolution of 30 m. The data were processed into a format consistent with the spatial reference and resolution of Landsat and MODIS images, and then spliced and clipped according to the range of the study area.

2.4.2. Meteorological Data

In order to obtain the reference evapotranspiration and potential evapotranspiration, daily meteorological data of the study area over the 21 years were retrieved from the single meteorological station in the Hutubi study area available via the China Meteorology Data Sharing Service System (http://cdc.cma.gov.cn/ (accessed on 10 January 2021)). Furthermore, to obtain the spatial distributions of various daily meteorological variables with the same coordinate system and spatial resolution as those for Landsat and MODIS images during the calculation process of SEBS in the basin, an inverse distance-weighting interpolation was performed using collected meteorological data from 42 weather stations in Xinjiang (Figure 1a) [27].

2.4.3. Ground Observation Data

(1)
Validation Data for ET
The accuracy of ET estimation was evaluated using measured and surveyed values at both farm and regional scales, alternatively using water balance or eddy covariance. For the water balance process, farmland-scale data concerning irrigation schedule and root-zone soil water storage were measured in a field irrigation experiment, and regional-scale irrigation and crop data were collected from the Shihezi Water Resources Bureau. Precipitation data at both scales were obtained from the China Meteorology Data Sharing Service System. Addition farmland-scale ET data retrieved from the literature were measured using an eddy covariance system [11].
(a)
Irrigation experiment
From April to September 2019, an irrigation experiment with field-grown cotton under FMDI was carried out at a cotton breeding base of Xinjiang Agricultural University (44°26′28″N, 85°40′29″E, altitude 430 m). The site, belonging to the middle reach of the MRB, is indicated by a green star in Figure 1b and located in the Zhongjiazhuang Town, Shihezi City, Xinjiang. The soil in the root zone of 0–100 cm was silt loam, comprising three distinct soil layers of 0–30, 30–60, and 60–100 cm with bulk density of 1.44, 1.63, and 1.46 g cm−3, respectively. In the experiment, cotton (Xinnongda 4) was planted in 15 plots (6.9 m × 7.5 m) under FMDI and conventionally managed according to local practice. In addition to 37.5 mm of germination water, the crop was irrigated eight times with 60 mm water each time, for a total of 480 mm during the whole growth period after germination. The eight irrigation events were conducted on 22 June, 2, 10, 21 and 30 July, and 9, 18 and 25 August, respectively. An auger (2 cm in diameter by 15 cm) was used to sample soil cores on 9 and 29 July, 8, 10 and 15 August, and 15 and 28 September for a total of 7 soil sampling times. In each plot, soil was sampled beneath a drip tape or planting row, from the surface to a depth of 100 cm at an interval of 10 cm, and used to measure soil water content through traditional weighing method. Hence, soil water content was determined for 1050 samples from the 15 plots. Root-zone water balance components in the field experiment included irrigation, precipitation, ET, deep leakage/recharge, runoff, and soil water storage. Since the local farmland is mostly distributed in the flat area, and the single effective rainfall is usually small during the crop growing period in the study area under persistent drought and scarce rainfall conditions [28,29], no runoff was observed in the CFFMDI. In addition, due to the fact that the planned moist layer in the soil of CFFMDI is not more than 60 cm and local groundwater depth is greater than 2 m, another component—deep leakage/recharge in field water balance—was considered negligible [29]. Therefore, average ETWBF (mm d−1) was estimated based on measured soil water content distributions, irrigation, and precipitation amount during a water balance period, which was then used to verify and evaluate ETESTARFM.
(b)
Regional survey
Lots of results have shown that little change of root-zone soil water storage is found throughout a growing season for CFFMDI in Xinjiang; thus, it is often assumed to be negligible in the regional soil water balance [28]. Therefore, the regional-scale total evapotranspiration TETWBR (mm) of cotton fields during each growing season (April–September) from 2000 to 2020 was evaluated using the collected data of irrigation amount and precipitation from different irrigation districts in the MRB to further validate the fusion method of ETESTARFM. There are ten irrigation districts in the basin. However, only six of them (i.e., Anjihai, Manas, Xiayedi, Shihezi, Mosuowan, and Jingouhe) provided effective irrigation data for the regional-scale water balance. The six irrigation districts are distributed in the upstream, midstream, and downstream of the river basin (Figure 1b), with a total area of 9135 km2, accounting for about 82.3% of the oasis irrigated area in the MRB.
(c)
Retrieved ET data
At farmland scale, in addition to the above field irrigation experiment, ETEC (mm d−1), measured through an eddy covariance system, was retrieved from the literature [11]. The relevant field measurements were conducted between April and September 2012 in a cotton field under FMDI at the Wulanwusu Agricultural Experimental Station of the 8th Agricultural Division, Xinjiang Production and Construction Corps (44°16′48″N, 85°49′11″E, altitude 469 m, indicated by a red triangle in Figure 1b), located in the middle upstream of the MRB. The eddy covariance system was installed in the center of the experimental field (330 m × 120 m) within a wide range of similar surrounding environments, with the same planting pattern and fertigation management for cotton to avoid margin effects.
(2)
Data for Land-Use Classification and Accuracy Validation
In order to classify the features and verify the identification accuracy of CFFMDI by the RF remote sensing inversion model, the center coordinates of samples of various surface features in the MRB were recorded by portable GPS during the period of July–August in 2018 and 2019. A total of 500 samples containing different crops, such as cotton (246 points), grape vineyard (48), pepper (30), maize (96), and wheat (80), were collected in each year. Other surface features, including wasteland, construction land, and water body, which were more easily identified through visual interpretation from the remote sensing images than crops, were not investigated in the field, and the samples were directly selected from the correspondingly downloaded images of each year. Then, according to the spectral and texture characteristics of the samples shown in the image, the visual interpretation labels were established. Thereupon, the samples of other years without sampling were selected by manual visual interpretation based on the labels [30]. The above procedure provided a total of 9685 classification samples of pepper (186 samples), grape vineyard (567), water body (580), cotton (2268), corn (1023), wheat (1592), wasteland (1710), and construction land (1759) in the 21 years. Limited by its small planting area, pepper samples were not selected before 2015. Each sample field covered an area of about 0.36 km2 with 400 pixels. After vectorization of all the recorded classification samples, a sample set was formed, in which 50% were randomly selected to train the RF classifier, and the other 50% were used to verify the classifier.

2.5. Model Verification and Accuracy

2.5.1. Remote Sensing Identification of Cotton Fields

The image recognition accuracy was evaluated based on the confusion matrix, through comparing the classification results with the verification samples pixel-by-pixel. The evaluation indices were chosen as the producer’s accuracy (PA), user’s accuracy (UA), overall accuracy (OA), and Kappa coefficient [30,31].

2.5.2. Verification of Estimated ET

Before verifying ET estimation results with measurements, the fusion accuracy was tested using six series of estimated ETLandsat and ETMODIS distributions on 14 June, 1 and 17 August 2018, respectively. As described in Section 2.3 and Section S2, the two reference times tm and tn were set as 14 June and 17 August, respectively, and the remaining 1 August was designed as the prediction time tp. With the four series of ETLandsat and ETMODIS on tm and tn combined with ETMODIS on tp, the ETESTARFM of tp (1 August) was fused. Thereupon, the fused ETESTARFM was compared with the estimated ETLandsat on tp to evaluate the fusion accuracy, using four statistical indices: the coefficient of determination (R2), root-mean-square error (RMSE), relative error (RE), and mean absolute error (MAE).
After the fusion accuracy test, the accuracy of the fusion estimation (ETESTARFM) was further evaluated with the water balance results from the irrigation experiment (ETWBF) as well as the retrieved ETEC at the farmland scale. For the regional scale, the fused ETESTARFM distributions during each growing season were summed and compared with the total evapotranspiration amount TETWBR in the six data-collected irrigation districts. The estimation accuracy was also evaluated using the indices of R2, RMSE, RE, and MAE.

3. Results and Discussion

ET estimation and fusion should be based on the remote sensing inversion of surface feature classification (Figure 2). In this study, the RF algorithm-based inversion model of classification was rigorously tested and evaluated through comparing the classification results with the verification samples, as stated in Section 2.4.3. and Section 2.5.1. To concentrate on the subject of data fusion, the corresponding results and discussion related to land-use identification and classification, such as accuracy evaluation and dynamics of CFFMDI in the MRB, are provided in Section S4 of the Supplementary Materials. Overall, the established inversion model of classification should be rationally applicable in estimating and fusing ET of CFFMDI in the MRB.

3.1. Verification of ET Estimation

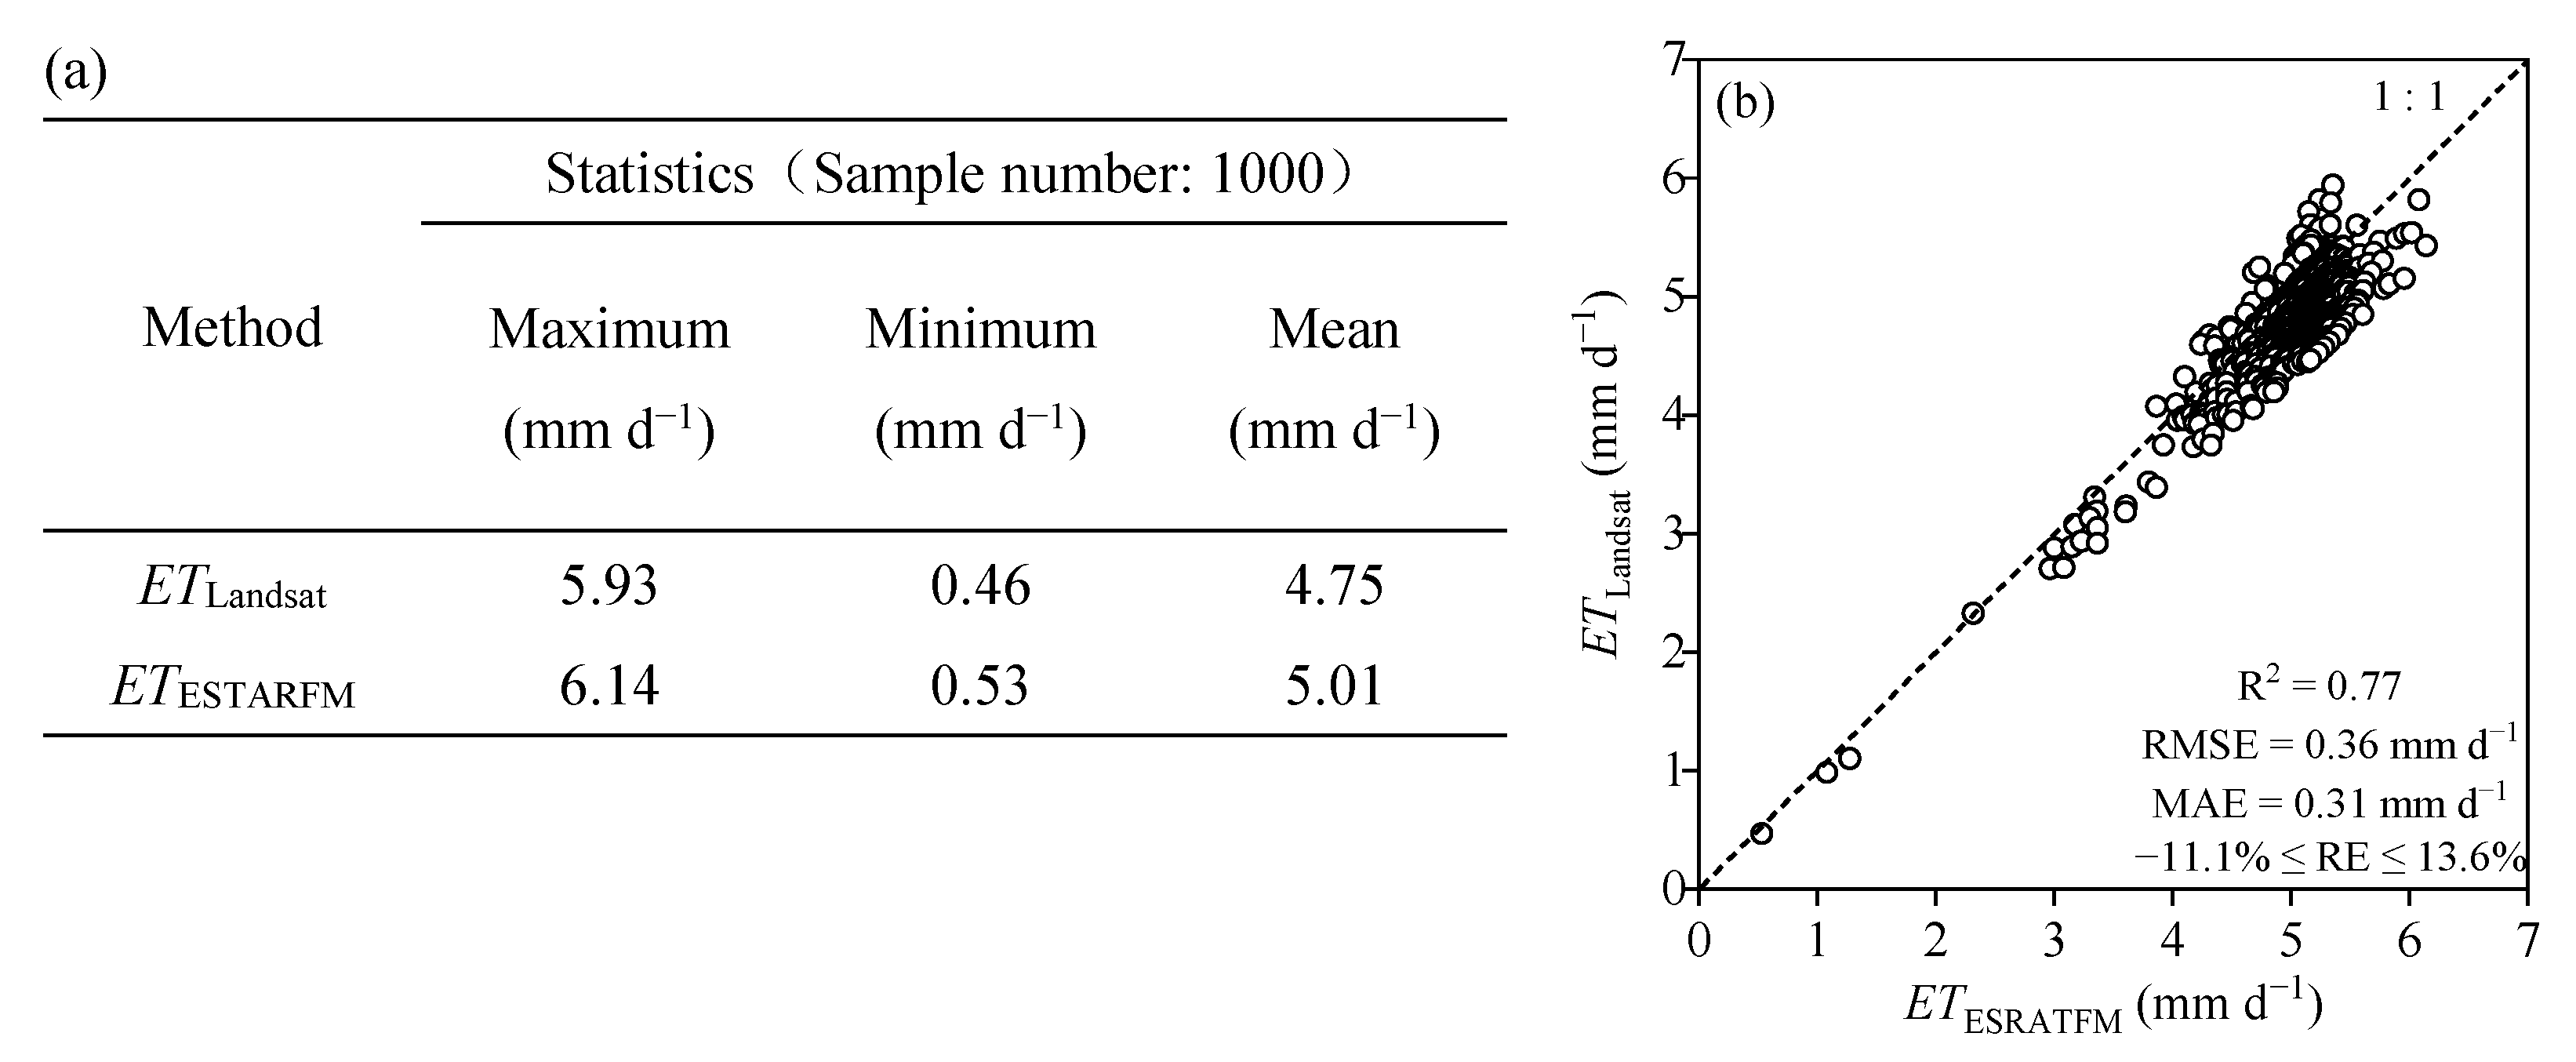
3.1.1. Fusion Accuracy of ESTARFM

Based on the five series of ETLandsat and ETMODIS on 14 June and 17 August and ETMODIS on 1 August 2018 (Figure 3a–e), ESTARFM was used to implement data fusion and to obtain the fused ET distribution on 1 August (ETESTARFM, Figure 3g). The fusion accuracy of the ESTARFM algorithm was tested by comparing the fused ETESTARFM with the correspondingly estimated ETLandsat (Figure 3f). With the same spatial resolution of 30 m for both ETLandsat and ETESTARFM, 1000 values of ETESTARFM were randomly selected from Figure 3g and compared with the ETLandsat located at the same sites corresponding to the selected ETESTARFMs in Figure 3f (Figure 4). The results showed that the fused ETESTARFM was in good agreement with the estimated ETLandsat, with statistical characteristics including maximum, minimum, and mean very similar to each other (Figure 4a), and with R2 of 0.77, RMSE of 0.36 mm d−1, MAE of 0.31 mm d−1, and −11.1% ≤ RE ≤ 13.6% between them (Figure 4b).
In addition, in order to display the fusion estimation effect more clearly, an ET distribution with 800 × 400 pixels (covering an area of 288 km2) was randomly selected from ETLandsat in Figure 3f and compared with that at the same location from ETESTARFM in Figure 3g, each of which were enlarged and are shown in Figure 3h,i, respectively. The enlarged results of Figure 3h,i also demonstrated high similarity and small differences, with the mean absolute error of 0.46 mm d−1 (Figure 3j) and the mean absolute relative error of 12.2% (Figure 3k) between them. Therefore, the recommended ESTARFM fusion algorithm should be able to successfully couple ET distributions estimated from Landsat and MODIS remote sensing images.

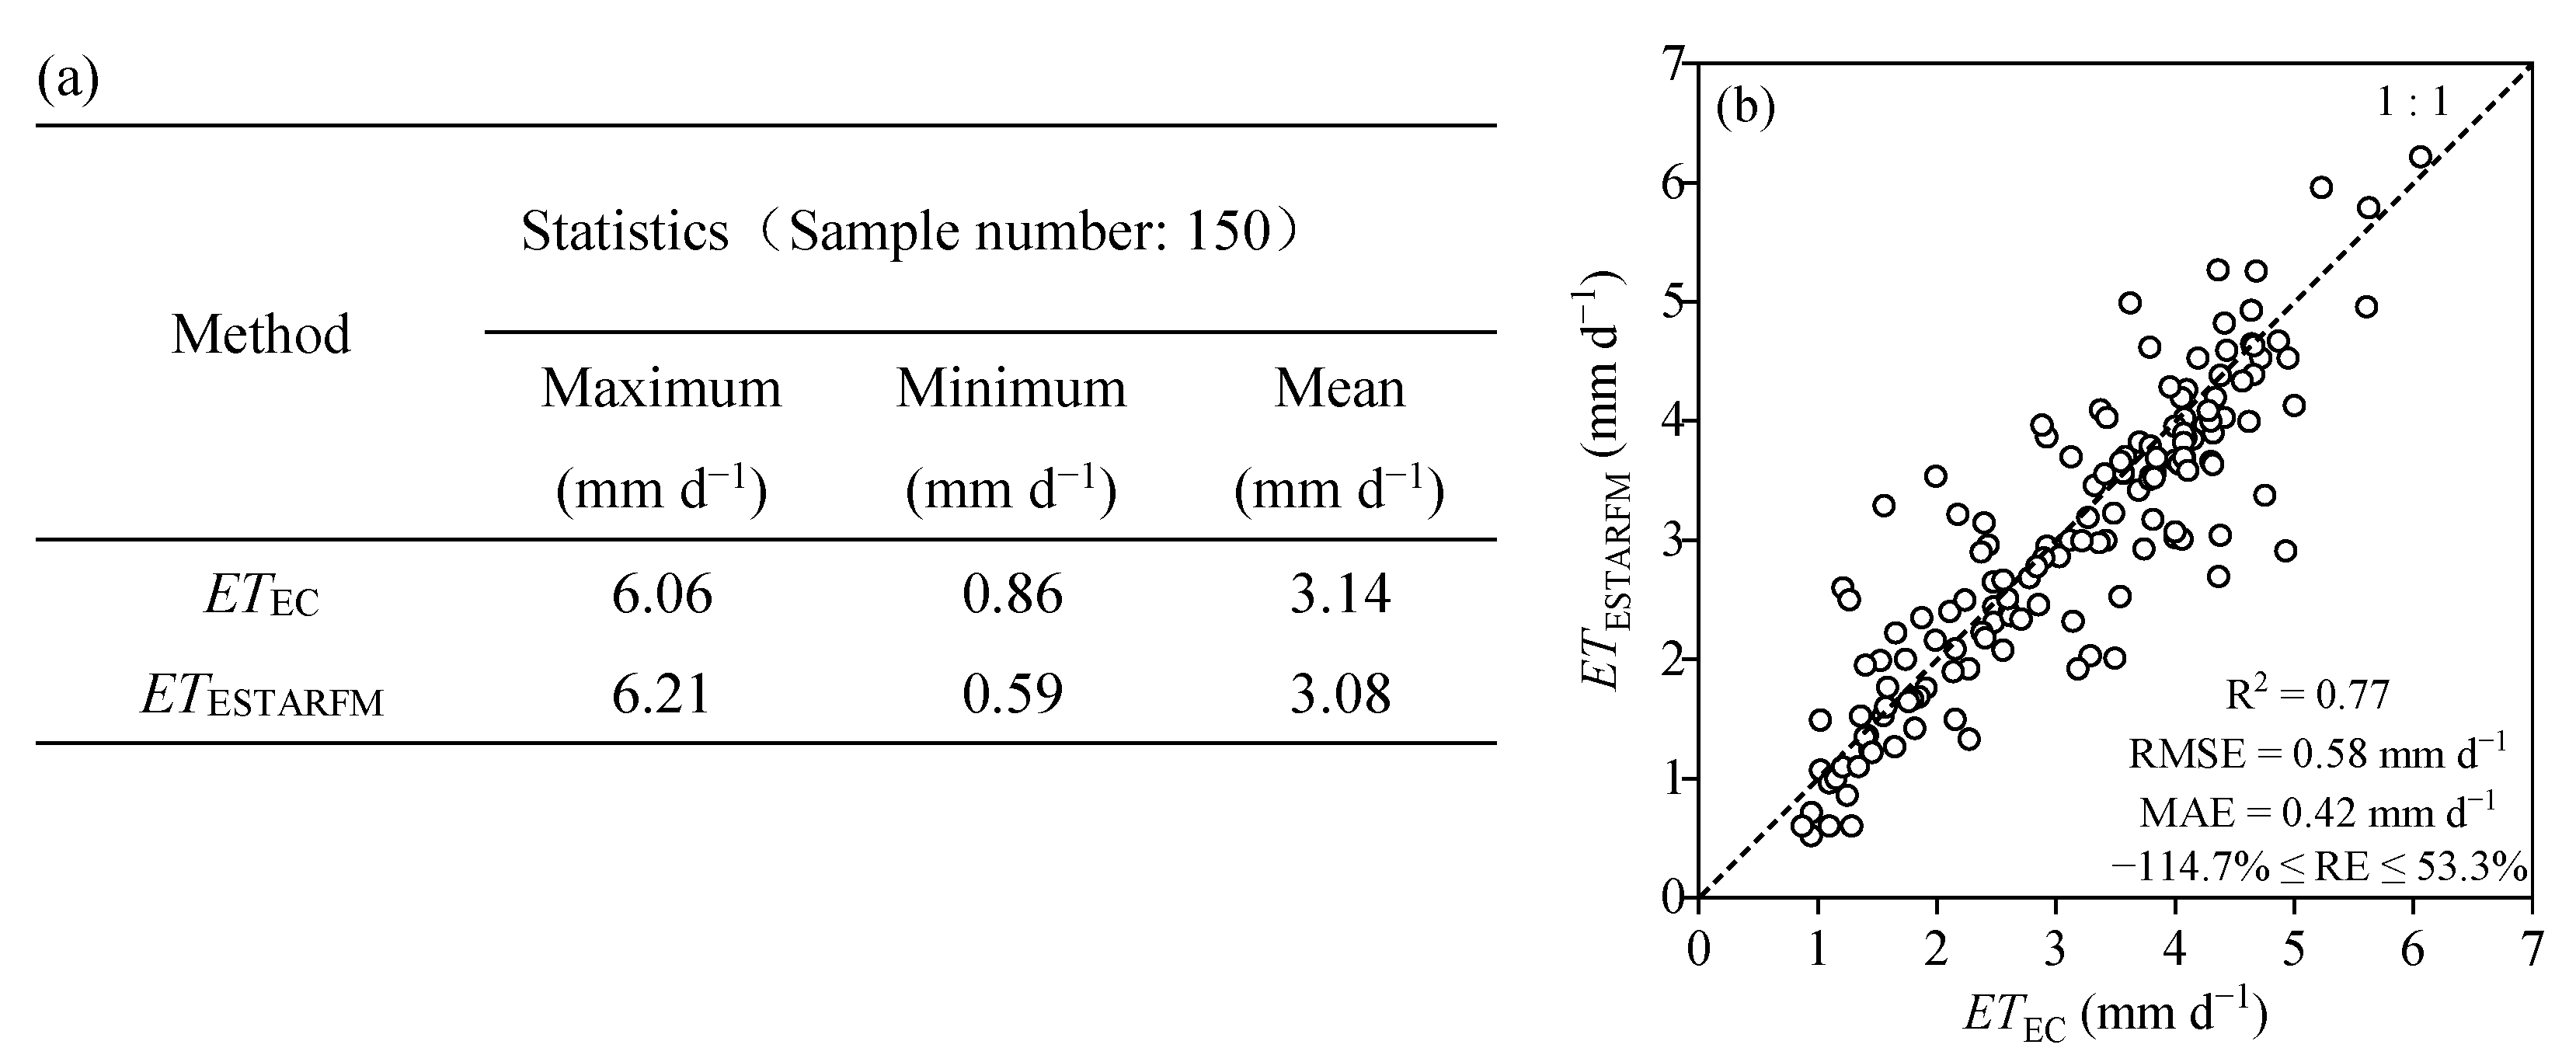
3.1.2. Comparisons of ET Estimation with Measurements

It remains necessary to verify the accuracy of ET estimation results through the measured data, which were respectively taken from the field experiments and regional survey. SEBS was applied to invert ET of CFFMDI with the downloaded Landsat and MODIS images of the MRB for the growing seasons from 2000 to 2020, and to consequentially obtain 48 ETLandsat and 2462 ETMODIS distribution maps. The 2462 daily-scale and 30 m spatial-resolution ETESTARFM distribution maps for different years were fused by ESTARFM, which were then extended to a daily serial of ETESTARFM, with 150 distribution maps for each growing season and 3150 in total for the 21 years, through the METRIC algorithm and utilized to compare with the measurements at both farmland and regional scales as follows.
(1)
Verifications at farmland scale
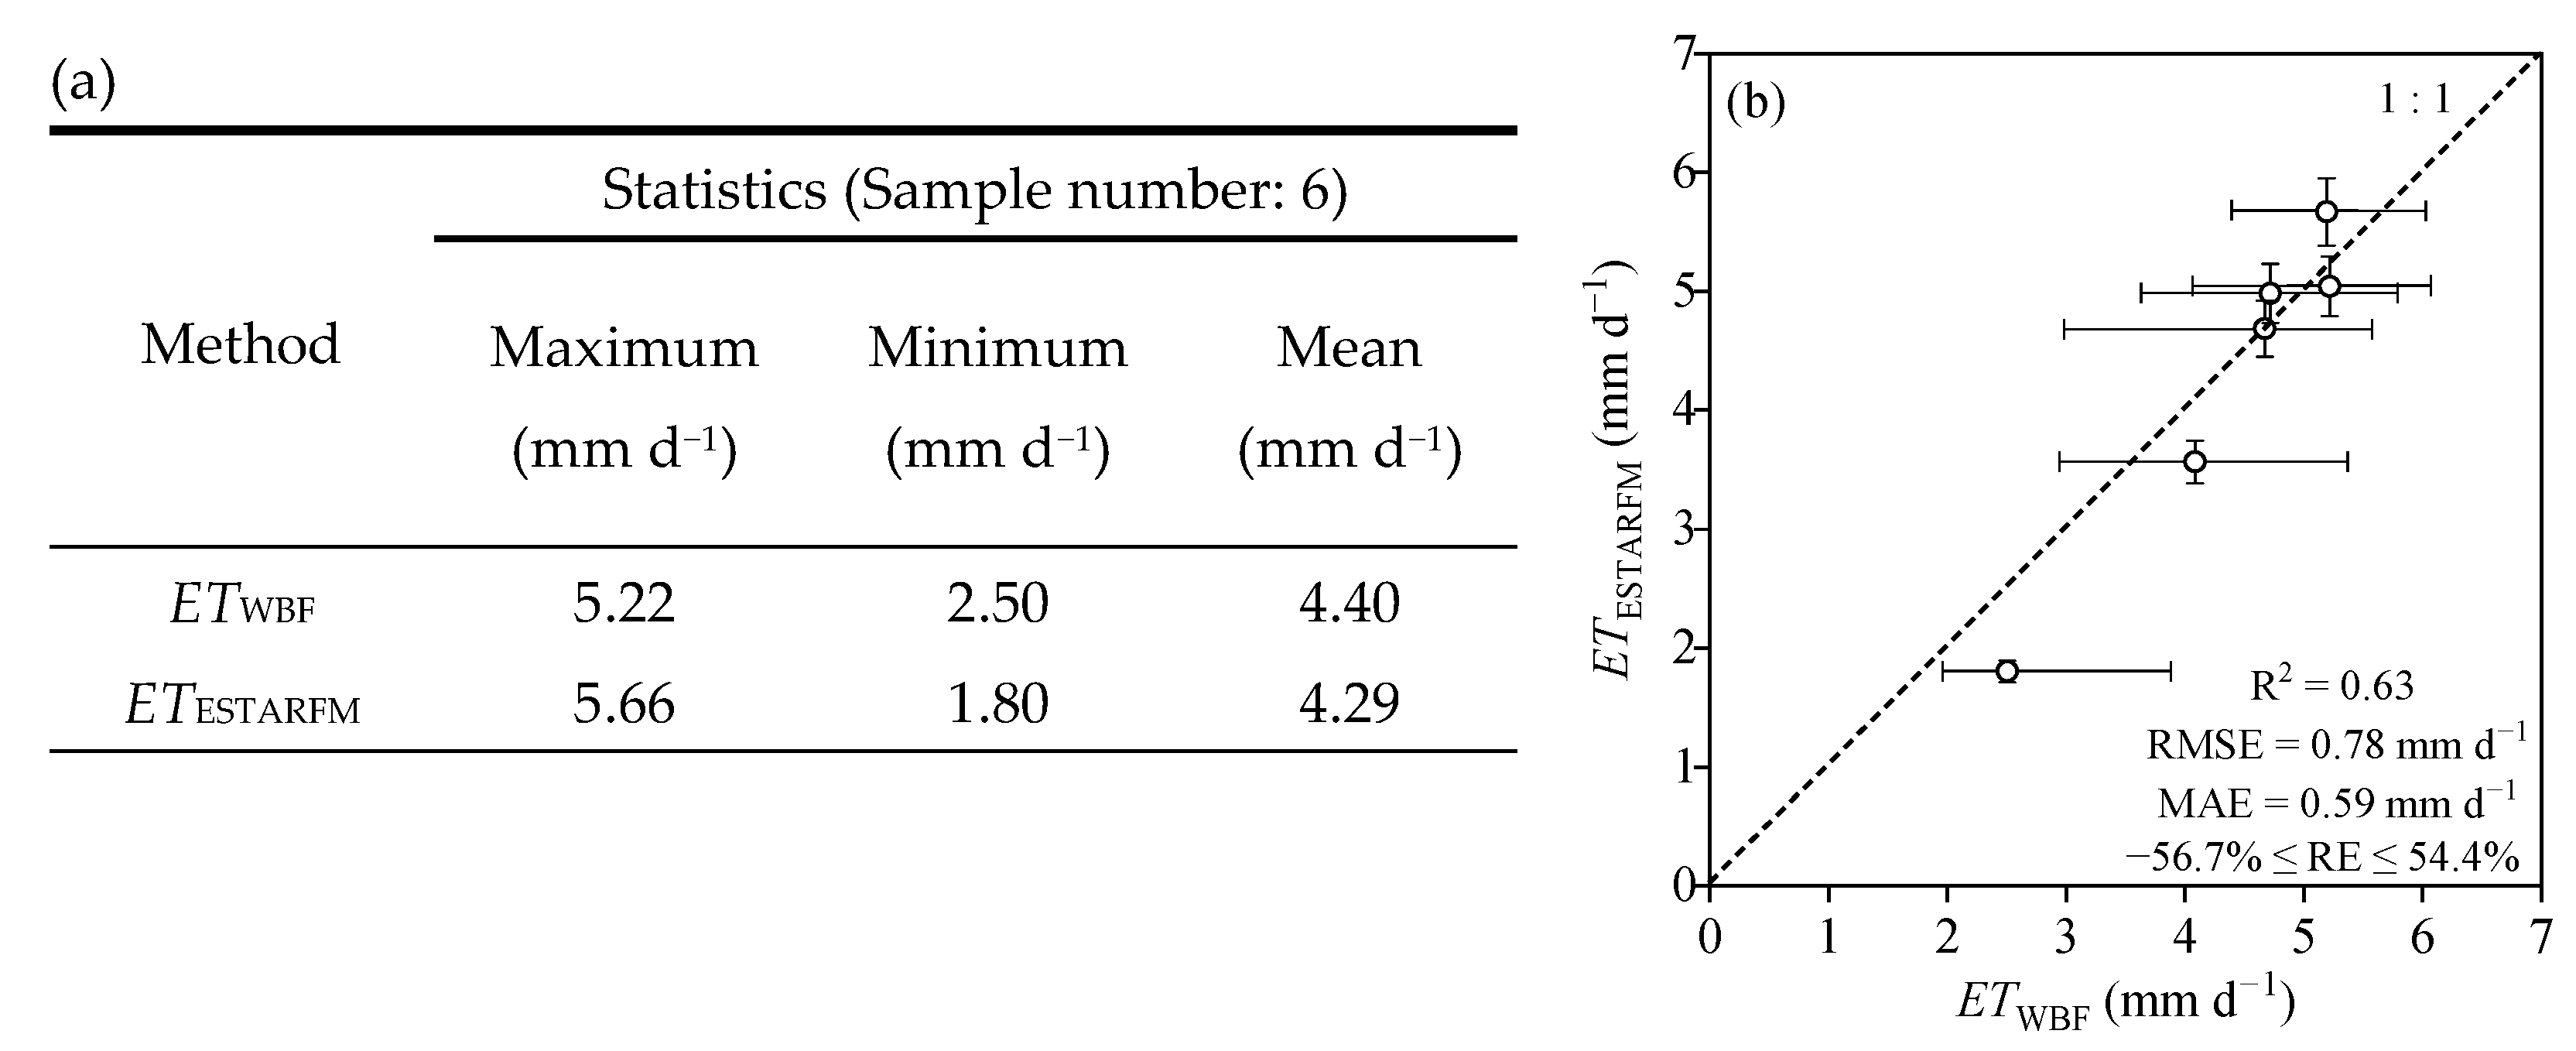
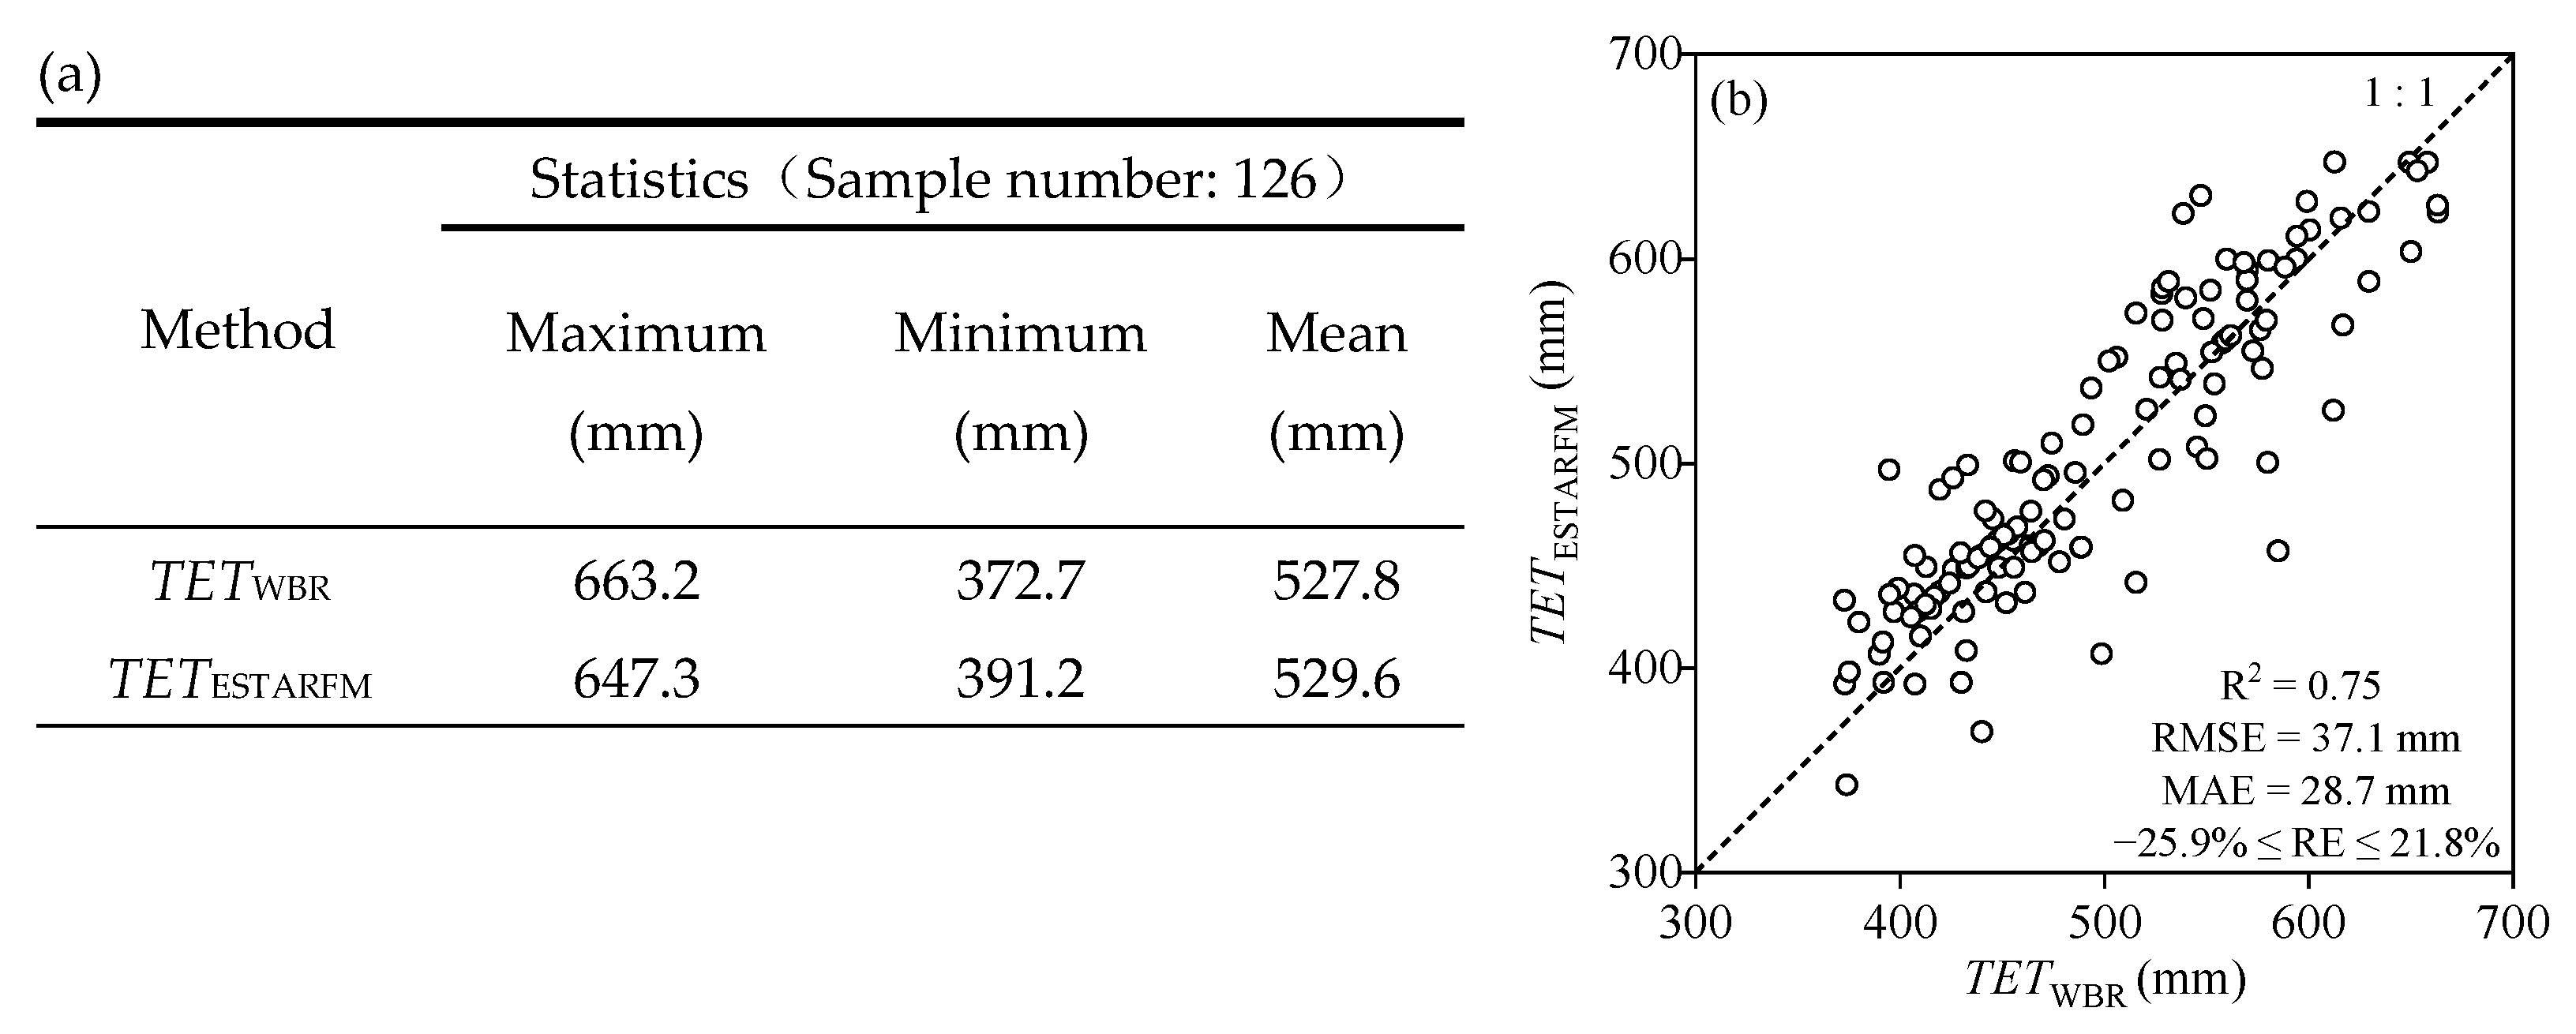
Monitoring based on ETEC at the Wulanwusu Agricultural Experimental Station produced 150 sets of ET data covering the entire 150 d FDMI cotton growing period [11]. Values of ET were found to range from 0.86–6.06 mm d−1 with a mean of 3.14 mm d−1 (Figure 5a). The experimental station (44°16′48″N, 85°49′11″E, Figure 1b) falls into the pixel situated on the southeastern side of the Jingouhe Irrigation District in the northern part of the upstream section of the MRB. The corresponding pixel in the distribution maps of ETESTARFM was then determined to pick up the 150 sets of the fused ETESTARFM values during the same growing period as that for the measured ETEC. The fused ETESTARFMs generally compared well with the measured ETEC, with R2, RMSE, and MAE of 0.77, 0.58 mm d−1, and 0.42 mm d−1, respectively, between them (Figure 5b). Although the minimum RE reached as low as −114.7%, more than 60% of |RE|s were within 10%. In addition, the statistics of the two serials were similar to each other with the exception of the minimum value (Figure 5a). Considering the influence of complex factors, such as spatial variability and dramatic changes in meteorological conditions, the above errors should be within an acceptable range for the inversion of evapotranspiration using remote sensing data.
Farmland-scale water balance data that originated from an irrigation experiment at Xinjiang Agricultural University’s cotton breeding base provided seven sampling times (six growing stages for water balance) in CFFMDI, covering 81 d of growth period from 9 July to 28 September in 2019. During each growing stage, daily ET was first calculated in each plot by the water balance method and then averaged over 15 duplicate plots to obtain a mean value (ETWBF). The calculation process yielded six average values of ETWBF for different growing stages of cotton under FMDI, with a maximum, minimum, and mean of 5.22, 2.50, and 4.40 mm d−1, respectively (Figure 6a). These values were slightly different from those measured in the Wulanwusu Agricultural Experimental Station located in upstream MRB (Figure 5a). Probably affected by soil spatial variability, great differences in ETWBF were found among the 15 duplicate plots, and the maximum deviation of ETWBF reached as high as 1.68 mm d−1 (Figure 6b). The cotton breeding base-located pixel was determined to be in the middle part of the Jingouhe Irrigation District in the southern midstream area of the basin (44°26′28″N, 85°40′29″E, Figure 1b). A total of 81 fused ETESTARFM distribution maps were included in the six growing stages, whereupon a daily average value of ETESTARFM was calculated for each balance growing stage and compared with the correspondingly measured ETWBF in Figure 6b. The evaluation indices of R2, RMSE, MAE, and RE were 0.63, 0.78 mm d−1, 0.59 mm d−1, and −56.7% to 54.4% (with a mean of 4.8%), respectively. Moreover, the statistical characteristics were roughly similar to each other for the two series of measured ETWBF and fused ETESTARFM. Cammalleri et al., (2014) also evaluated the effect of remote sensing inversion through comparing inverted ETs with measured values obtained from farmland water balance [4]. They studied cotton growth in a field experiment conducted in a semiarid area near Amarillo, Texas, USA (35°11′N, 102°4′W), covering a larger range of ET that varied between 0.9 and 7.2 mm d−1 than that in the current study (Figure 6a). The corresponding RMSE in their study was between 1.11 and 1.81 mm d−1, a little higher than that shown in Figure 6b (0.78 mm d−1) for the field irrigation experiment in this study.
In the process of remote sensing data fusion, ETESTARFM fully combines the rich spatial distribution information of ETLandsat and the advantages of ETMODIS in the description of temporal dynamics. The verification results based on both the eddy covariance system and the field water balance method showed that the fused ETESTARFM should be applicable to basically meet the requirement of ET estimation at the farmland scale for the CFFMDI in MRB.
(2)
Verifications at regional scale
The ET amount, TETWBR (mm), for each growing season was calculated using the water balance method in each of the six irrigation districts, Anjihai, Manas, Xiayedi, Mosuowan, Shihezi, and Jingouhe, in the MRB for a total of 126 values over the 21 years of the study. Seasonal TETWBR was characterized by large differences between years and irrigation districts and averaged 528 mm, ranging from 373 mm to 663 mm, affected strongly by water supply (Figure 7a).
The fused daily distribution maps of ETESTARFM were superimposed to obtain the total, TETESTARFM (mm), distribution throughout the basin during each year’s growing season. Thereupon, TETESTARFM for each irrigation district in each of the 21 years was collected and compared with the corresponding TETWBR (Figure 7). The errors including RMSE, MAE, and |RE| between measured TETWBR and simulated TETESTARFM were small, with values of 37.1, 28.7 mm, and less than 26%, respectively, and R2 was as high as 0.75 (Figure 7b). Moreover, the statistical characteristics of the two series were also very similar to each other (Figure 7a). This successful remote sensing estimation of ET continues previous success in regional evapotranspiration inversion. For example, the regional-scale ET of irrigated farmland in the Hetao Irrigation District of Inner Mongolia, China was estimated using a model of Surface Energy Balance Algorithm for Land and verified through a water balance method [6], showing a good estimation with acceptable RMSE (26.1 mm) and MAE (29.8 mm), roughly comparable to the corresponding values in this study.
In summary, the ET verification results based on different scales and measurement methods indicate that the proposed ESTARFM for ET fusion through integrating ETLandsat and ETMODIS estimated by SEBS was effective and rational to estimate both farmland- and regional-scale ET with simultaneously high temporal and spatial resolutions. Theoretically speaking, more advanced multispectral images with higher spatial and temporal resolutions (e.g., Sentinel-2) than the remote sensing data employed in this study should produce more accurate fusion results when incorporated into the ESTARFM model and should therefore be the topic of further evaluation.

3.2. Dynamics of ET in CFFMDI in the MRB

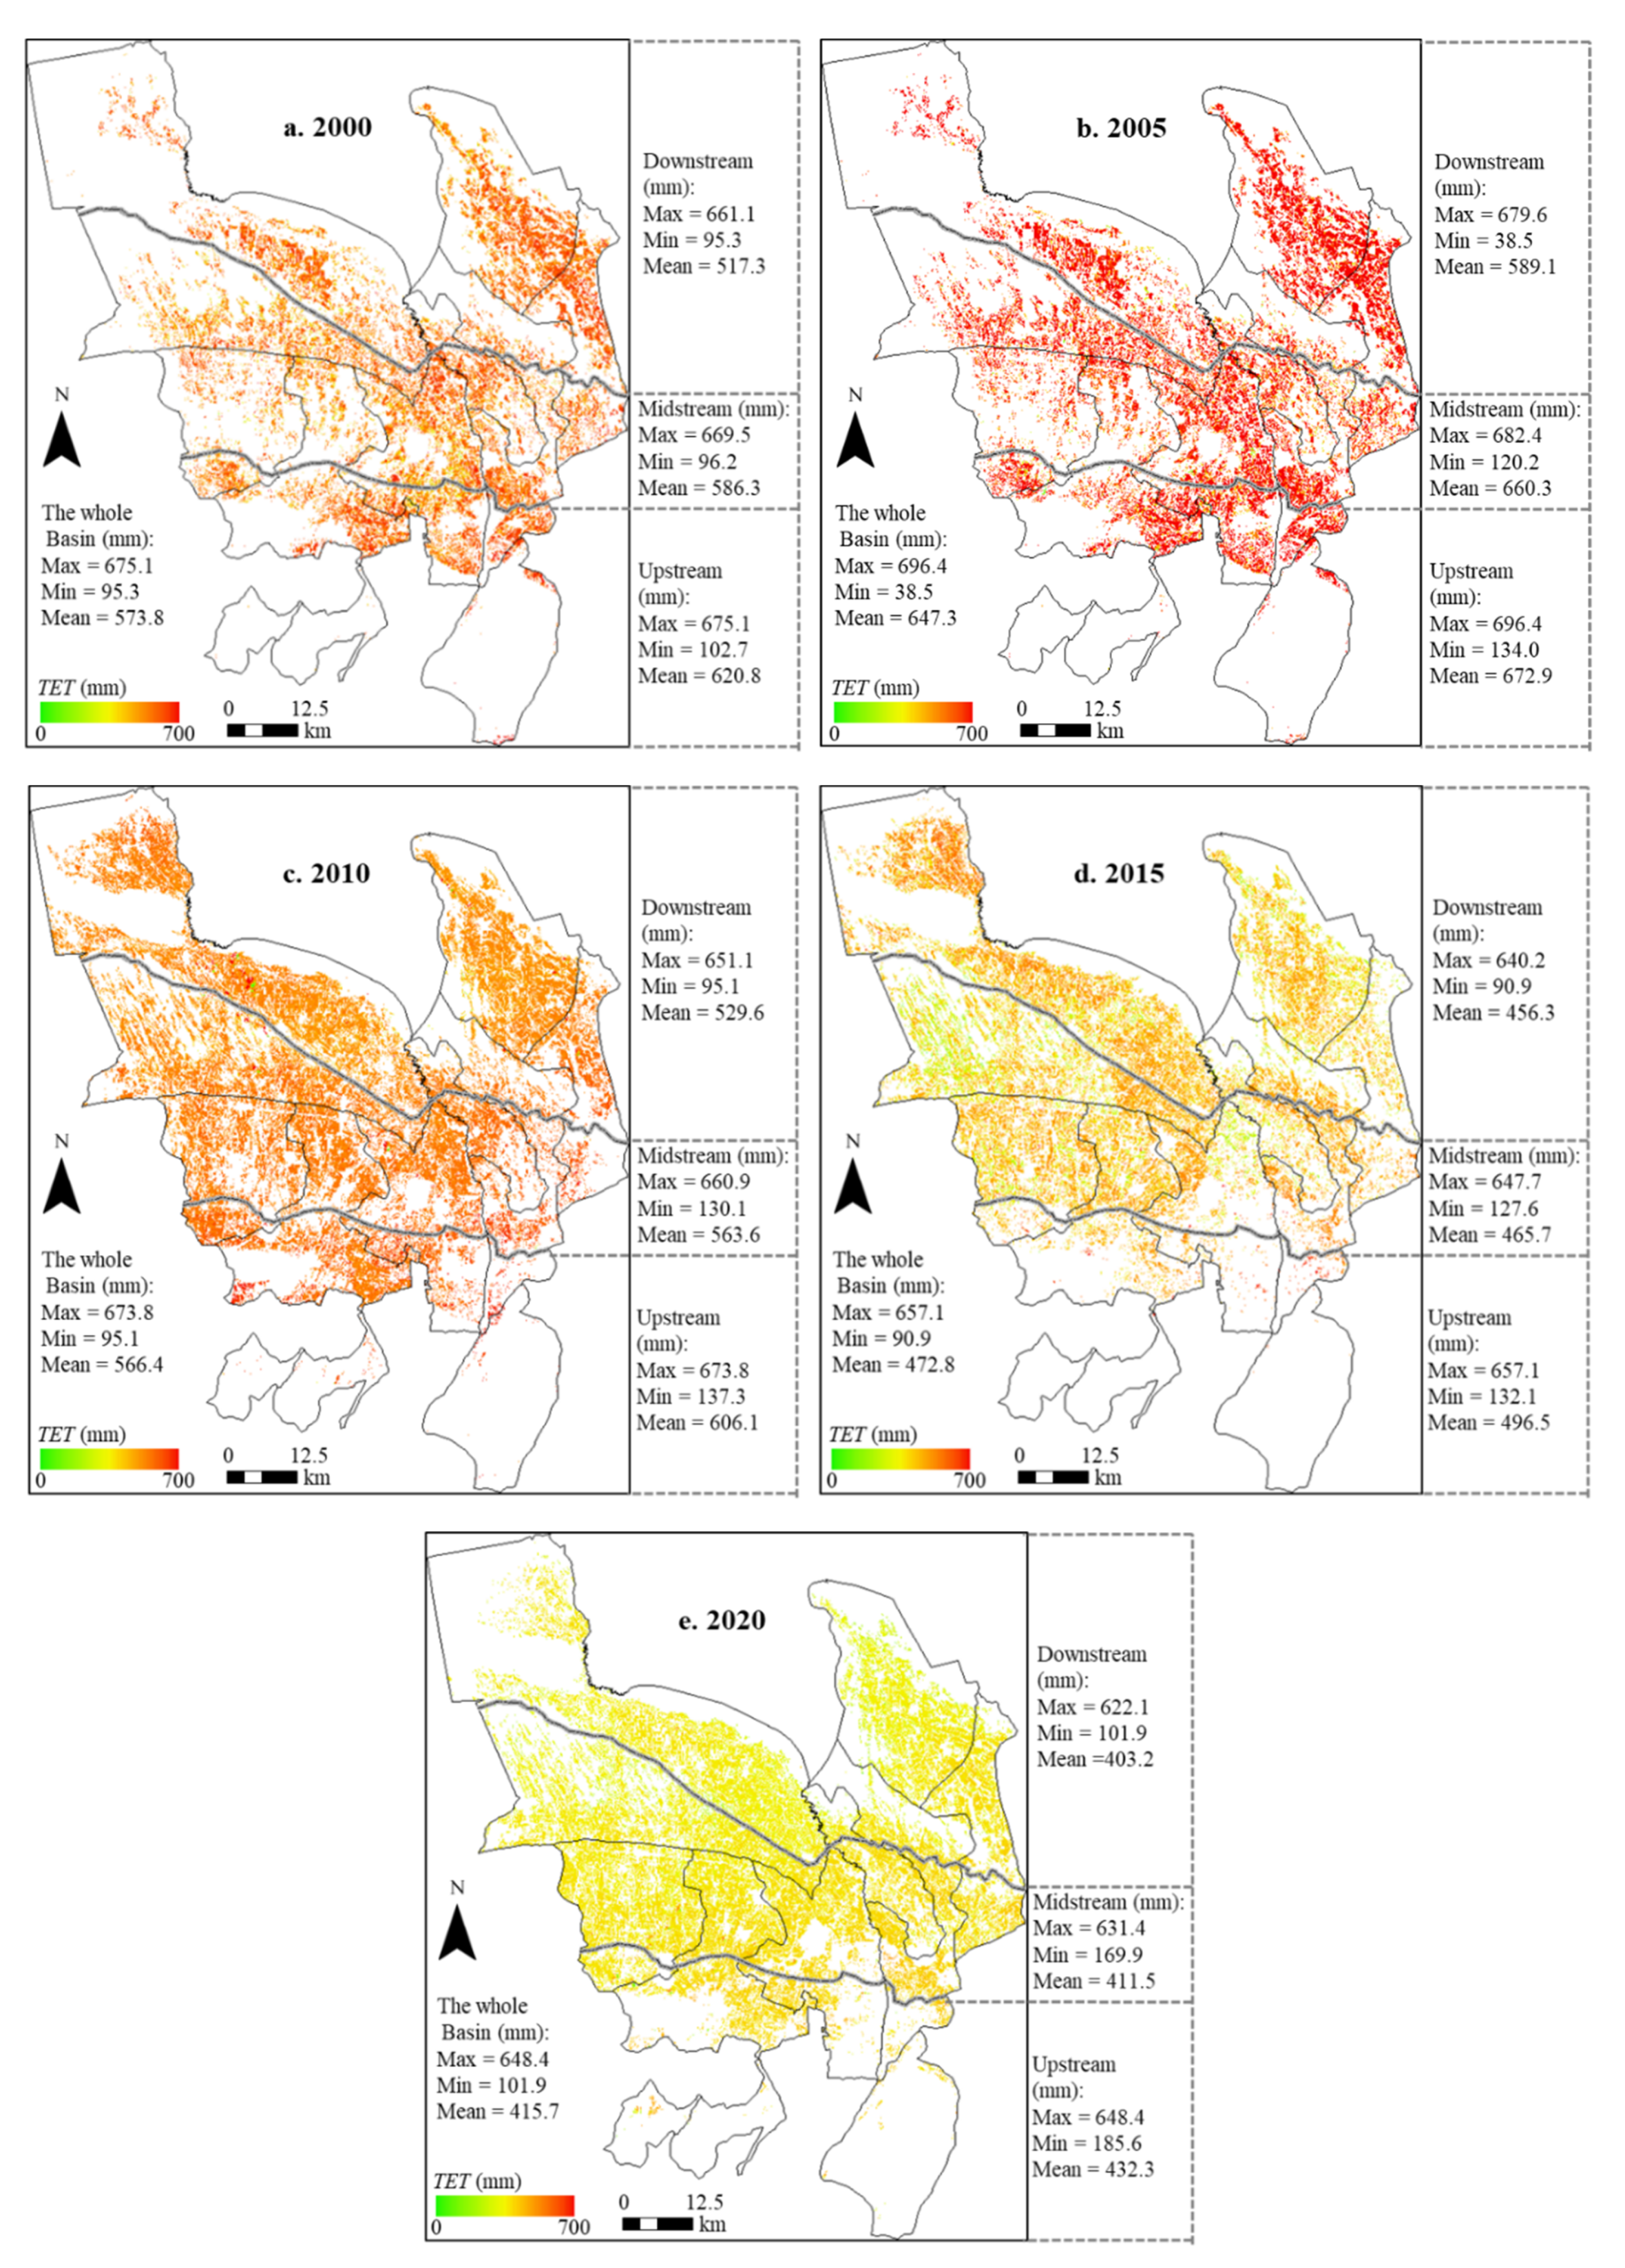
3.2.1. Spatial Distribution Characteristics

The distribution of total evapotranspiration TET during the growing season of each year from 2000 to 2020 for CFFMDI in the MRB was estimated. To illustrate, the results from five-year intervals including the years 2000, 2005, 2010, 2015, and 2020 are shown in Figure 8. Accompanying the popularity and adoption of FMDI technology and the subsequent expansion of the cotton planting area, changes in the basin regarding water supply dynamics resulted in inconsistent spatial and temporal distributions of ET in CFFMDI [32,33]. We estimated that, from 2000 to 2020, the cotton growing season TET fluctuated tremendously, ranging between 38.5 and 699.4 mm with a mean of 529.6 mm throughout the basin. This is similar to other results reported for the region [11,34].
As for the spatial distribution, TET generally tended to decrease from the upstream to the downstream parts of the basin, also shown by its relative corresponding mean value in the various sections during the years represented in Figure 8. (1) Upstream TET: The upstream is characterized by high terrain, a deep groundwater table, and abundant fresh surface water resources for irrigation. Therefore, the area suffers neither from lack of water for irrigation nor soil salinization and thus has the basin’s highest average values of TET. From 2000 to 2020, the average TET in the upstream region was 565.7 mm, about 7% (36.1 mm) higher than the average of the basin as a whole (Figure 8). The maximum TET in the entire basin, with the value of 696.4 mm, was observed in the upstream zone (Figure 8b). (2) Downstream TET: The TET in the downstream portion of the basin was relatively small, with a mean 29–103 mm lower than that in the upstream area (Figure 8). A minimum value of 38.5 mm was found in 2005 (Figure 8b), which could have been caused by an extreme lack of water supply for irrigation, severely salinized stress, or even the mismatch of pixels between cotton fields and other non-farmland features, such as construction land or wasteland (Figure S1). The overall average value of TET in the basin’s downstream section was about 499.1 mm, approximately 88% of that upstream. Among all the pixels, the proportion of TET not exceeding 300 mm in the past 21 years was less than 0.5%. It is worth noting that the promotion of FMDI technology has gradually made it possible to reclaim and utilize originally medium and severe saline wasteland, leading to a continuous downstream increase in area of cotton fields (Figure S2). The statistical report from the Shihezi Water Resources Bureau showed that, limited by the ability of water supply for irrigation, the irrigation quota (i.e., the irrigation amount per unit area during the whole growth period) of cotton fields was found to gradually decline from 470.8 mm in 2000 to 306.3 mm in 2020. As a result of declining irrigation quota, cotton ET in the downstream section (and also the entire basin) was significantly weakened (Figure 8) and decreased 185.9 (231.6) mm from its peak in 2005 to 2020 (Figure 8b,e). The main reason is that the water supply in 2005 was the maximum at this stage. (3) Midstream TET: The value of TET in the midstream (including the statistics of maximum, minimum, and mean, as shown in Figure 8) generally fell between that for the upstream and downstream sections. The southern part of the midstream section neighbors the northern upstream section, sharing its high terrain, deep groundwater table, and good irrigation conditions, and thus, typically has high TET. Areas of low TET in the midstream CFFMDI are mainly concentrated around belts of shallow flowing groundwater, reservoirs, rivers, and canals, with intense phreatic water evaporation and, thus, severe soil salinization [17]. However, the planting proportion of this part is still relatively low (Figure S2).

3.2.2. Basin-Scale Intra-Season Dynamics of ET and Water Supply

With the declining mean TET values for different sections of up-, mid-, and downstream in the MRB, the differences between the sections were also observed to gradually decrease from 2000 to 2020. In the following analysis on the dynamic changes of ET, the basin was therefore considered as a single unit. The dataset of daily ETEC measured at the upstream Wulanwusu Agricultural Experimental Station (Figure 1b), covering a complete growing season of cotton in 2012 [11], was used as a reference (Figure 9). In order to more intuitively demonstrate the relationship between ET and its main impact factors, the dynamics of leaf area index (LAI), mean air temperature (T), and total water supply (irrigation plus precipitation, I + P) measured in the Wulanwusu Agricultural Experimental Station are also included in Figure 9. Analysis of intra-season dynamics for the average E T ¯ ESTARFM over the entire basin, based on the 150 distribution maps of fused ETESTARFM of cotton fields, shows an uneven distribution with large variation during the growing season (Figure 9). This variability likely was a function of multiple complex factors, such as crop physiology, meteorological conditions, and irrigation events. The dynamics of fused E T ¯ ESTARFM were very similar to the measured ETEC (R2 = 0.79), increasing over time to a single peak value and then decreasing. This pattern reflects the typical dynamic characteristics of ET in CFFMDI, which are likely dominated by temperature and irrigation and are thus contemporaneous with regional hydrological and thermal changes [34].
The minimum E T ¯ ESTARFM (0.61 mm d−1) was found in the seedling stage (2 May), mainly due to the low air temperature resulting in slow cotton growth and small leaf area, as well as the film mulch that inhibited soil evaporation. From the bud stage on, the temperature rises, the cotton enters into a rapid growth period, and contingent upon sufficient water supply, ET increases. Crop growth, water demand, and therefore, ET continue at peak levels until the flowering and boll setting stage. A large amount of water is usually supplied to irrigate cotton at this stage for almost all the irrigation districts in the MRB, thus often leading to the maximum ET [11]. For example, a maximum E T ¯ ESTARFM of 5.93 mm d−1 was found on 27 July 2012 (Figure 9), a day in the middle of the flowering and boll setting stage. Beginning in late August, the temperature gradually drops, and the cotton enters the boll opening stage, with its growth rate gradually slowing down until the final defoliation stage. Crop ET decreases correspondingly, until irrigation water application is no longer necessary.
The values of TET per growth stage in 2012, calculated from E T ¯ ESTARFM (Figure 9), were 55.1, 88.5, 255.6, and 63.5 mm at seedling (27 April–1 June, 36 days in total), bud (2 June–27 June, 26 days), flowering and boll setting (28 June–29 August, 63 days), and boll opening stage (30 August–23 September, 25 days), respectively. The TET for the annual growth periods overall was as low as 462.7 mm in 2012 (Figure 10). The average irrigation amount (I) of the involved six irrigation districts was 38.0, 84.0, 318.0, and 0.0 mm, respectively, for the corresponding stages. The example year of 2012 was dry, with only 16.1 mm of effective precipitation (P) occurring at the seedling stage during the whole growing season (Figure 10). The total water supply (I + P) in 2012 was 456.1 mm, with a precipitation component of only about 3.5%, indicating that the source of ET was almost totally irrigation.

3.2.3. Basin-Scale Inter-Season Dynamics of ET and its Sustainability Effects

By superposing and accumulating all the fused daily-scale ETESTARFM distribution maps of the annual cotton growing seasons, the variation dynamics of TET as a function of year and their inter-season mean TET were obtained (Figure 10). Over the last 21 years, the TET of CFFMDI in the MRB ranged from 391.2 to 623.2 mm, with a mean of 529.6 mm, very similar to the reported value of 501.3 mm ± 13.9 mm in this area [35]. Although TET demonstrated inconsistent fluctuation patterns in different years, it could be roughly divided into two periods according to its relationship with the mean TET. The TET values in the first 10 years were greater than the mean TET, and those in the second period were lower. This is likely related to the aforementioned gradually declining irrigation quota resulting from the promotion and adoption of FMDI technology and the expansion of cotton fields.
At a regional inter-season scale in arid and semiarid areas, most of the scarce precipitation falling prior to the growing season is usually quickly consumed through evaporation and has little impact on later crop growth; hence, the variation of root-zone soil water storage is often assumed to be negligible throughout a growing season [34,36]. In addition, effective precipitation (P) in arid oasis areas is typically very limited with little variation. For example, the average P during the growing season in the MRB between 2000 and 2020 was 88.2 mm, accounting for 17% of the mean TET (Figure 10). Irrigation is undoubtedly the lifeblood of oasis agriculture, that is, water demand and consumption of crops and root-zone salt leaching are all dependent on irrigation [8]. Decreasing the irrigation amount (including leaching) leads to the decline in soil water content (or potential) and an increase in salt content in the root zone, which further inhibits root water uptake and crop evapotranspiration [37]. As shown in Figure 10, the ratio of water supply to evapotranspiration ((I + P)/TET) was mostly above 95% and even reached nearly 100% in some years. As the change of P was small and its proportion in water supply was very low, TET had a good correlation with I (R2 = 0.88, Figure 10). Over the past 21 years, the area of cotton fields expanded at a rate of about 119 km2 year−1 in the MRB, but without any supplemental water supply for irrigation. The irrigation quota was reduced by 164.5 mm from 2000 to 2020, resulting in an average 7.5 mm year−1 decrease in TET, from 573.8 mm to 415.7 mm. Especially after 2010, the supply of irrigation water resources failed to meet the needs for cotton field expansion, causing TET to fall below the mean TET (529.6 mm), with a particularly obvious decline in the most recent three years from 2018 to 2020 (Figure 10). The decrease in TET was found to be nearly inevitable both in historic cotton fields and in fields located in newly reclaimed wasteland. The historic fields were obviously affected by gradually declining irrigation quotas. The cotton fields in newly reclaimed wastelands were rather impacted by severe salinity stress and insufficient water supply, leading to typically low TET levels. Nevertheless, small abnormal fluctuations in TET were apparently due to changes in the cultivated cotton field area (Supplementary Materials Figures S2 and S3). For example, in 2005, the decrease in cotton field area led to a significant increase in TET (to 647.3 mm), while after 2018, an opposite changing process was observed as TET rapidly decreased to 391.2 mm before slowly rising (Figure 10).
The annual water demand (i.e., potential evapotranspiration, TETp) of cotton under FMDI during 2000–2020 was estimated by multiplying the reference evapotranspiration [2], with the crop coefficient taken as the recommended values of 0.45, 1.15, and 0.46 for the initial (from 27 April–1 June, 36 days in total), middle (2 June–29 August, 89 days), and final (30 August to 23 September, 25 days) growth stages of cotton [10]. Influenced by changing meteorological conditions, inconsistent but similar values of TETp were estimated for different years, ranging from 668.7 to 737.4 mm with a mean TETp of 702.9 mm (Figure 10). The value of the mean TETp was about 170 mm higher than the mean TET, reflecting that water supply failed to meet the water demand and that the cotton suffered from relatively serious water stress. Especially with the promotion of FMDI technology and the expansion of cotton fields, a larger difference between TET and TETp and lower relative water supply ((I + P)/TETp) were found. By 2020, the value of actual TET was 287.2 mm less than the mean TETp, and the water supply could only meet 56% of the water demand (Figure 10).
At the beginning of this century (2000–2007), when the technology of FMDI began to be promoted, water supply in most irrigation districts was likely roughly sufficient for irrigation requirements, part of which would undoubtedly be consumed for salt leaching, especially in those cotton fields newly reclaimed from moderate to severe saline lands. Hence, the ratio of (I + P)/TETp was basically higher than 0.8 (Figure 10). However, the statistical yearbook showed that cotton yield at this time was not more than 2050 kg hm−2 [38]. From then on, due to the benefit of long-term application of FMDI, the root-zone salinization of cotton fields would gradually be alleviated to form more positive soil environments for cotton growth [10]. Subsequently, higher cotton yields between 2400 and 2513 kg hm−2 were reported in the more recent years of 2012–2018, in spite of the fact that the corresponding (I + P)/TETp was at even lower levels due to the shortage of water supply [38]. It should be noted that the contribution to yield enhancement may also originate from agricultural scientific and technological progress, such as the breeding and application of drought-resistant and salt-tolerant varieties, advances in agronomy, and mechanization [39]. Nevertheless, the dynamics of root-zone salinity of CFFMDI in the MRB and its impact on crop water demand, consumption, and yield are beyond the scope of this study and require further research.
In summary, under the premise of limited water resources in the basin, the promotion of FMDI technology has brought a few benefits, such as the expansion of cultivated land area and the increase in production potential on one hand. On the other hand, ensuing problems cannot be ignored. For example, irrigation water supply has become increasingly unsustainable, agricultural production capacity has been negatively affected, and the non-sustainable use of water and soil resources has become increasingly prominent. The following measures would be helpful to alleviate the tension between the expansion of the cotton production area and the limitation of irrigation water supply in the MRB.
(1)
Appropriately control the expansion of cultivated land and optimize cropping structure. If the total amount of available water resources cannot meet the requirements of cropland expansion and planned crop cropping systems, it may lead to the reduction in crop ET and yield [8] and may also increase the risk of secondary salinization because of the weakened leaching capacity of the root zone [37,40,41]. Based on the rigid constraint of irrigation water resource-bearing capacity, the potential scale of expansion of cultivated lands must be determined and crop planting optimized in order to maximize agricultural and water productivity and promote sustainable development [8,35].
(2)
Explore high-efficiency root-zone salt removal measures. The current mean value of root-zone soil salt content is about 4.8 g kg−1 in CFFMDI [29,32], representing a main factor inhibiting crop ET and yield in the arid MRB. Decreasing root-zone salt content will inevitably be beneficial for enhancing ET, yield, and water productivity [37,41,42]. Traditional salt removal measures of water conservancy projects, such as drainage ditches, subsurface pipes, and wells, utilize a large amount of water resources for leaching, which may often impede their wide application in an arid oasis such as the MRB. Therefore, it is necessary to further explore root-zone salt removal measures with low fresh-water consumption and high salt-drainage efficiency, e.g., biological reclamations [43], salt removal by fabric coverings [39], or even irrigation with water extremely low in salts made possible by desalination [40,42,44].
(3)
Strengthen the research on water-saving mechanisms and technologies to understand the ET dynamics of crops and reduce extravagant water consumption. Breeding and selection of drought- and salt-tolerant varieties, as well as the development and adoption of water-saving irrigation methods and agronomic measures (e.g., drip irrigation, mulching, no-tillage, regulated deficit irrigation scheduling, shading, etc.), can be useful to reduce water requirements or extravagant water consumption of crops without a cost to yield [45]. In addition, as shown in Figure 10, the water demand (TETp) of CFFMDI reached as high as about 700 mm during the growing season. This number was estimated using a method mainly for field crops without any consideration of the fact that the cotton was drip-irrigated under mulch. Further research is needed to investigate and quantify potential overestimation of TETp under conditions of film mulching [5].

4. Conclusions

Based on both measured data (from our field experiment, the regional survey, and literature retrieval) and downloaded images of Landsat and MODIS, this study systematically tested a remote sensing inversion model for surface feature classification and a fusion model for ET estimation of CFFMDI in the MRB. The tested models were applied to simultaneously identify cotton fields and estimate daily distribution of ET with a high spatial resolution of 30 m for a 21-year time period scanning from 2000 to 2020. The spatiotemporal evolution characteristics and sustainability effects of ET were discussed. The main conclusions from the study were:
(1)
The remote sensing inversion model of surface feature classification based on the RF algorithm reliably identified the CFFMDI in the MRB, with overall accuracy of identification above 0.88. Apparently, due to the continuous promotion and application of FMDI technology, a large number of originally salinized wastelands in the mid- and downstream areas of the MRB were gradually reclaimed into cotton fields, resulting in an area-wide annual expansion rate of 4.9% for the past 21 years.
(2)
By combining SEBS and ESTARFM, ET distributions were fused to meet the requirements of high spatial and temporal resolutions for CFFMDI in the MRB at both farmland and regional scales. The statistical characteristics of the fused results agreed well with those of measured series, with the coefficient of determination between them more than 0.77.
(3)
The spatial distribution of ET of cotton fields in the MRB, potentially affected by numerous complex factors such as topography, geomorphology, hydrology, farm management including irrigation, and salinization, indicated a number of phenomena. Fields with low ET values were mainly concentrated in the basin’s more seriously salinized areas, such as belts of shallow flowing groundwater, low-lying terrain, proximity to reservoirs and river channels, and the edge of desert, as well as other areas far away from rivers and thus difficult to irrigate. In general, the overall ET was found to gradually decrease from the upstream to the downstream zones, with the difference between them decreasing in recent years as ET decreased over the entire basin as a result of cotton field expansion and irrigation water supply shortage.
(4)
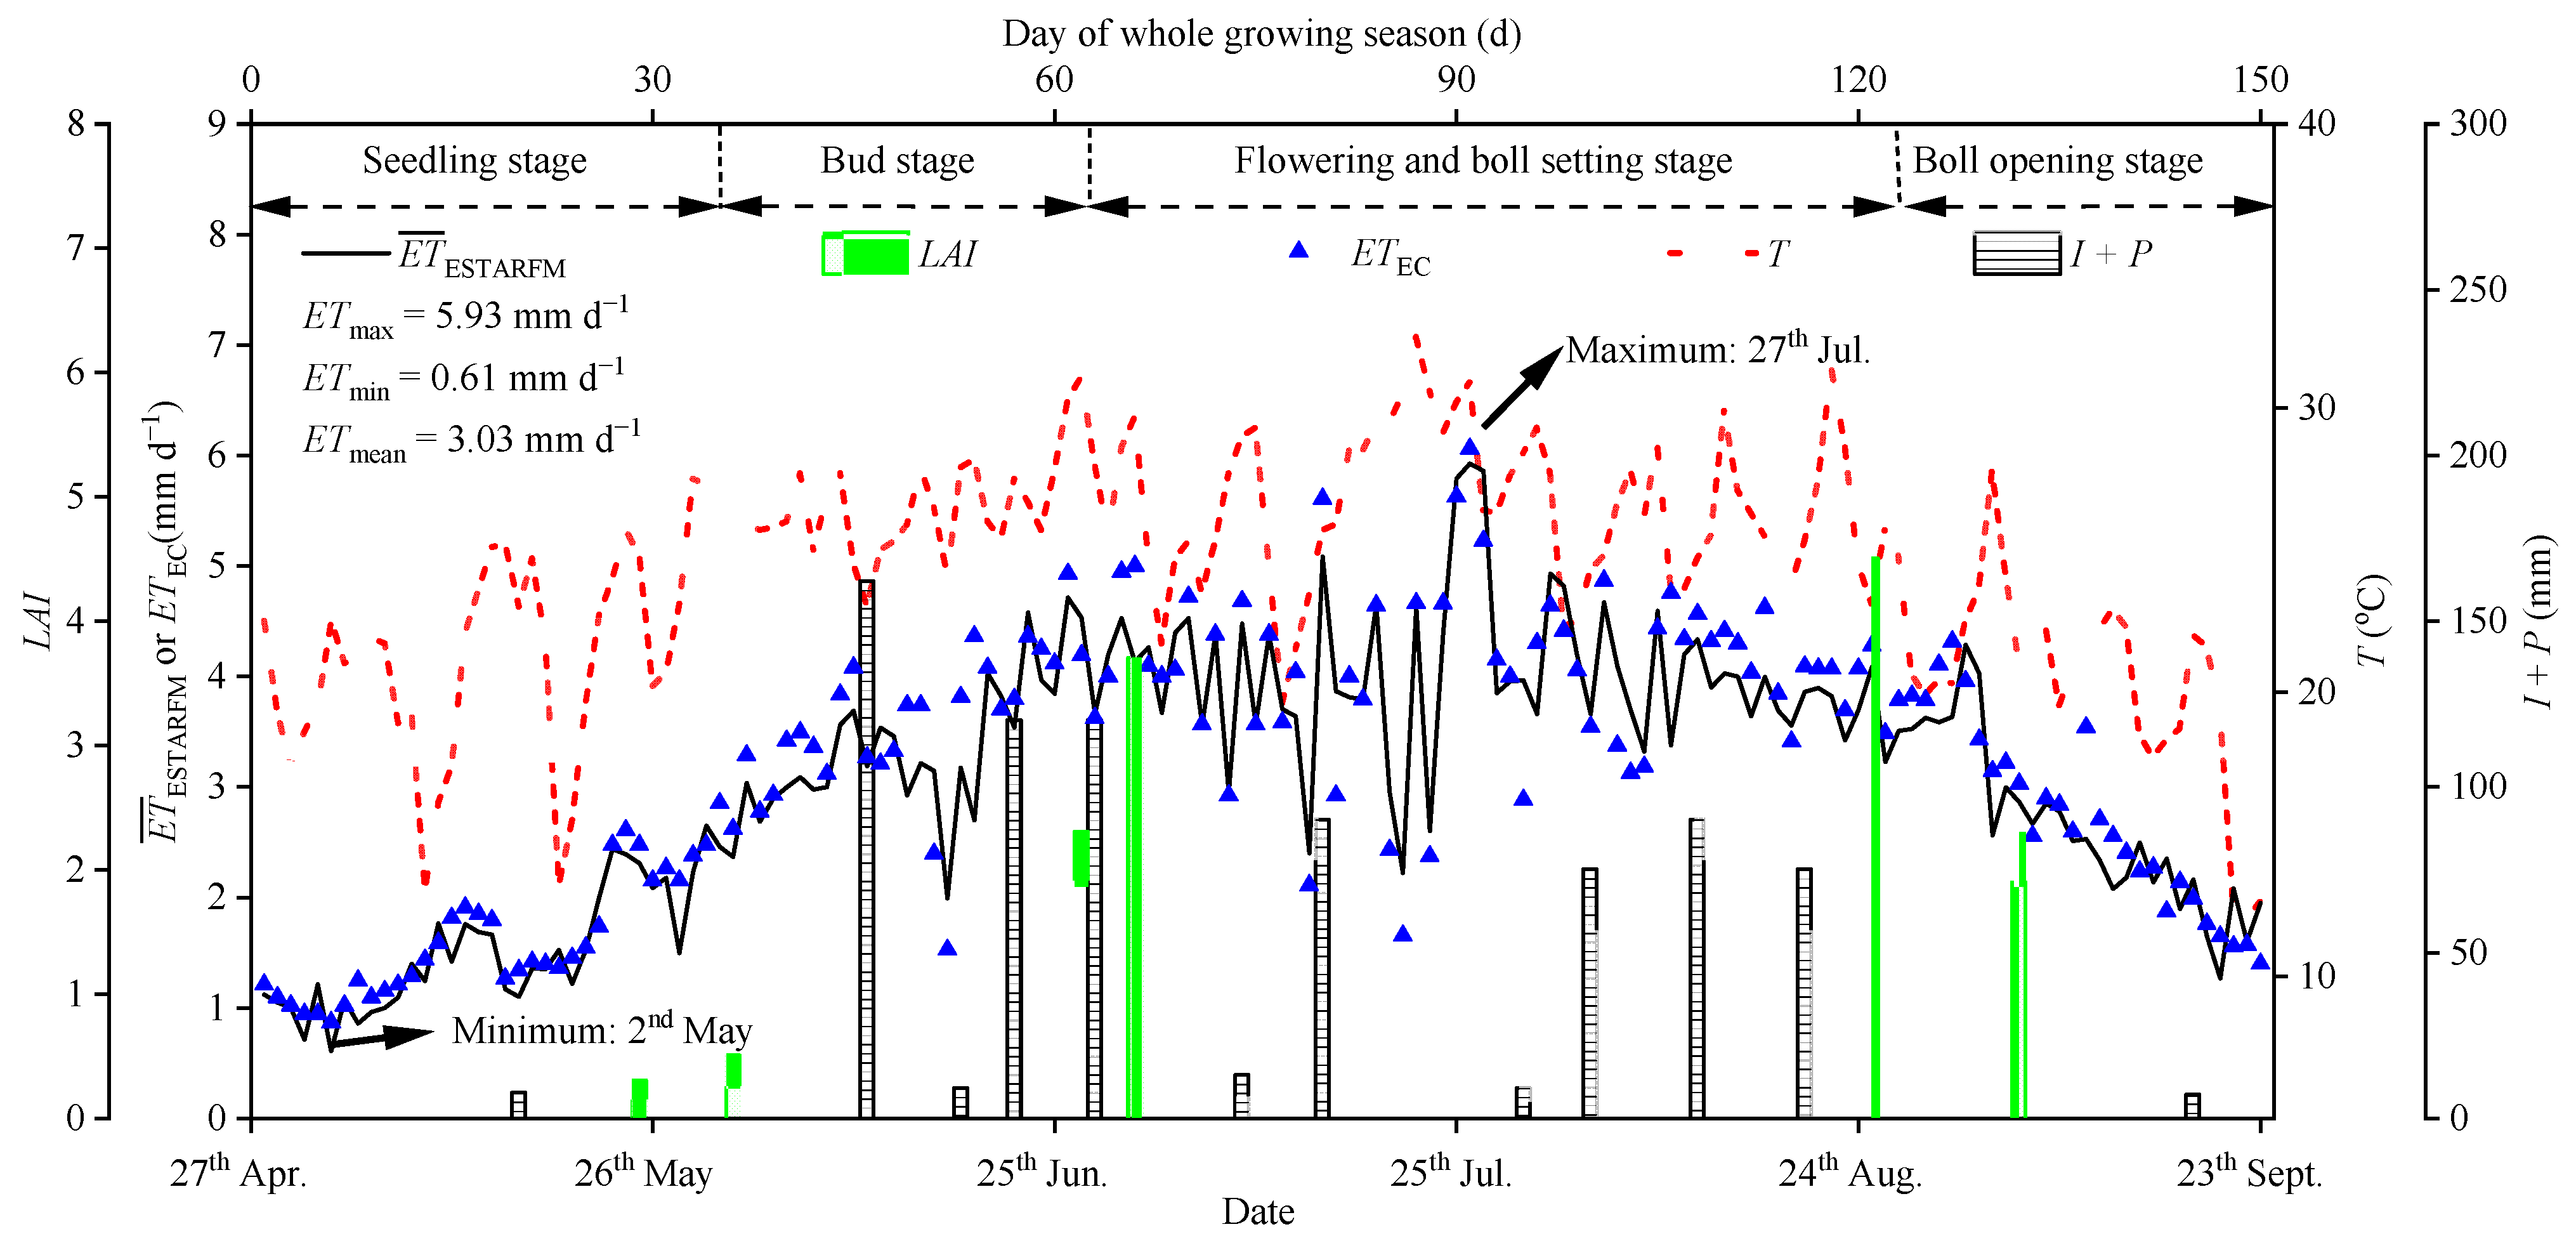
The intra-season daily distribution of ET varied over a large range but was characterized by a trend of first increasing to a single peak and then decreasing. This trend was contemporaneous with local hydrothermal changes mainly dominated by air temperature and irrigation. The minimum (0.61 mm d−1) and maximum (5.93 mm d−1) average ET of CFFMDI in the MRB appeared at the seedling stage and the flowering and boll setting stage, respectively. Over the 21 years from 2000 to 2020, the average total annual evapotranspiration TET was determined to be around 529.6 mm for the CFFMDI in the MRB. With the continuous increase in cotton field area and the gradual decrease in irrigation quotas, the TET decreased year by year, with an average decreasing rate of 7.5 mm year−1. By 2020, its value was as low as 415.7 mm, much lower than the local water requirement of cotton, 702.9 mm. In order to avoid non-sustainable utilization of water and soil resources, it is necessary to appropriately control the expansion scale of cultivated lands, optimize and adjust the cropping structure, explore efficient methods of root-zone salt removal, and strengthen research and development of water-saving agricultural mechanisms and technologies.
The remote sensing data fusion method proposed in this study should have great potential for the monitoring and evaluation of regional evapotranspiration or other variables with simultaneous requirements for high temporal and spatial resolutions, particularly in arid and semiarid areas. The dynamics of fused evapotranspiration for CFFMDI in the MRB provide a reliable scientific basis for local agricultural water resources planning and management and for the sustainable utilization of water and soil resources. However, it remains to be further studied how to scientifically resolve the contradiction between the expansion of cultivated land area, shortage of water resources supply, and limited bearing capacity of water resources.

Supplementary Materials

The following supporting information can be downloaded at: https://www.mdpi.com/article/10.3390/rs14143438/s1. Section S1: SEBS for estimating daily ET; Section S2: ESTARFM for fusing remote sensing data; Section S3: Information of Landsat images used in this study; Section S4: Results and discussion about land-use identification and classification. Table S1. Specification of Landsat 5, Landsat 7, and Landsat 8 data used in this study; Table S2. Classification accuracy statistics in 2018 and 2019. Figure S1. Confusion matrix of surface feature classification in (a) 2018 and (b) 2019. Note: Each column represents the real category of the instance, and each row represents the predicted category of the instance. The main diagonal value is producer’s accuracy; Figure S2. Dynamic spatial distribution of cotton fields, non-cotton agricultural fields, and non-farmland in the Manas River Basin in (a) 2000; (b) 2005; (c) 2010; (d) 2015; (e) 2020; Figure S3. Changing process of the area for cotton fields, non-cotton agricultural fields, and non-farmland in the Manas River Basin from 2000 to 2020.

Author Contributions

Conceptualization, X.Q. and Q.Z.; methodology, X.Q., G.Y. and Q.Z.; software, X.Q. and G.Y.; validation, X.Q., G.Y., Q.Z., J.S., L.L., M.N. and X.W.; formal analysis, X.Q., G.Y., Q.Z. and A.B.-G.; investigation, X.Q., G.Y., Q.Z. and A.B.-G.; data curation, X.Q., G.Y. and Q.Z.; writing—original draft preparation, X.Q.; writing—review and editing, X.Q., G.Y., Q.Z. and A.B.-G.; visualization, X.Q. and G.Y.; supervision, Q.Z. All authors have read and agreed to the published version of the manuscript.

Funding

This research was funded by the National Natural Science Foundation of China, grant number 52079136 and 51790532. The research was also supported by the National Key Research and Development Program of China under award numbers 2016YFC0501401. The APC was funded by 52079136, 51790532, and 2016YFC0501401.

Data Availability Statement

Not applicable.

Acknowledgments

The authors gratefully acknowledge all the reviewers and editors for their comments on this paper.

Conflicts of Interest

The authors declare no conflict of interest.

References

  1. Xu, S.Q.; Yu, Z.B.; Yang, C.G.; Ji, X.B.; Zhang, K. Trends in evapotranspiration and their responses to climate change and vegetation greening over the upper reaches of the Yellow River Basin. Agric. For. Meteorol. 2018, 263, 118–129. [Google Scholar] [CrossRef]
  2. Allen, R.G.; Pereira, L.S.; Howell, T.A.; Jensen, M.E. Evapotranspiration information reporting: I. factors governing measurement accuracy. Agric. Water Manag. 2011, 98, 899–920. [Google Scholar] [CrossRef] [Green Version]
  3. Mu, Q.Z.; Zhao, M.S.; Running, S.W. Improvements to a MODIS global terrestrial evapotranspiration algorithm. Remote Sens. Environ. 2011, 115, 1781–1800. [Google Scholar] [CrossRef]
  4. Cammalleri, C.; Anderson, M.C.; Gao, F.; Hain, C.R.; Kustas, W.P. Mapping daily evapotranspiration at field scales over rainfed and irrigated agricultural areas using remote sensing data fusion. Agric. For. Meteorol. 2014, 186, 1–11. [Google Scholar] [CrossRef] [Green Version]
  5. Zhang, Z.Y.; Li, X.Y.; Liu, L.J.; Wang, Y.G.; Li, Y. Influence of mulched drip irrigation on landscape scale evapotranspiration from farmland in an arid area. Agric. Water Manag. 2019, 230, 105953. [Google Scholar] [CrossRef]
  6. Yang, Y.T.; Shang, S.H.; Jiang, L. Remote sensing temporal and spatial patterns of evapotranspiration and the responses to water management in a large irrigation district of North China. Agric. For. Meteorol. 2012, 164, 112–122. [Google Scholar] [CrossRef]
  7. Su, Z.B. The Surface Energy Balance System (SEBS) for estimation of turbulent heat fluxes. Hydrol. Earth Syst. Sci. 2002, 6, 85–99. [Google Scholar] [CrossRef]
  8. Bai, L.L.; Cai, J.B.; Liu, Y.; Chen, H.; Zhang, B.Z.; Huang, L.X. Responses of field evapotranspiration to the changes of cropping pattern and groundwater depth in large irrigation district of Yellow River basin. Agric. Water Manag. 2017, 188, 1–11. [Google Scholar] [CrossRef]
  9. Ning, S.R.; Zhou, B.B.; Shi, J.C.; Wang, Q.J. Soil water/salt balance and water productivity of typical irrigation schedules for cotton under film mulched drip irrigation in northern Xinjiang. Agric. Water Manag. 2021, 245, 106651. [Google Scholar] [CrossRef]
  10. Ning, S.R.; Shi, J.C.; Zuo, Q.; Wang, S.; Ben-Gal, A. Generalization of the root length density distribution of cotton under film mulched drip irrigation. Field Crop. Res. 2015, 177, 125–136. [Google Scholar] [CrossRef]
  11. Ma, J.L.; Liu, L.J.; Li, X.Y.; Wang, J.; Yang, H.J. Evapotranspiration process of cotton field under mulched drip irrigation of oasis in arid region. Chin. J. Ecol. 2015, 34, 974–981. [Google Scholar]
  12. Zhu, X.L.; Helmer, E.H.; Gao, F.; Liu, D.S.; Chen, J.; Lefsky, M.A. A flexible spatiotemporal method for fusing satellite images with different resolutions. Remote Sens. Environ. 2016, 172, 165–177. [Google Scholar] [CrossRef]
  13. Anderson, M.C.; Allen, R.G.; Morse, A.; Kustas, W.P. Use of Landsat thermal imagery in monitoring evapotranspiration and managing water resources. Remote Sens. Environ. 2012, 122, 50–65. [Google Scholar] [CrossRef]
  14. Zhao, R.; Du, S.H. Spectral-Spatial Residual Network for Fusing Hyperspectral and Panchromatic Remote Sensing Images. Remote Sens. 2022, 14, 800. [Google Scholar] [CrossRef]
  15. Busetto, L.; Meroni, M.; Colombo, R. Combining medium and coarse spatial resolution satellite data to improve the estimation of sub-pixel NDVI time series. Remote Sens. Environ. 2008, 112, 118–131. [Google Scholar] [CrossRef]
  16. Gao, F.; Masek, J.; Schwaller, M.; Hall, F. On the blending of the Landsat and MODIS surface reflectance: Predicting daily Landsat surface reflectance. IEEE Trans. Geosci. Remote Sens. 2006, 44, 2207–2218. [Google Scholar]
  17. Qiao, X.J.; Shi, J.C.; Tan, L.L.; Fan, W.H.; Xuan, J.W.; Sheng, J.D.; Zuo, Q. Multi-scale spatial distribution characteristics of soil salinity in root-zone in film-mulched drip-irrigated cotton fields in Anjihai irrigation zone, Xinjiang. Acta Pedol. Sin. 2021, 58, 1202–1213. [Google Scholar]
  18. Liang, S.L. Narrowband to broadband conversions of land surface albedo I: Algorithms. Remote Sens. Environ. 2001, 76, 213–238. [Google Scholar] [CrossRef]
  19. Sobrino, J.A.; Jiménez-Munoz, J.C.; Paolin, L. Land surface temperature retrieval from Landsat TM 5. Remote Sens. Environ. 2004, 90, 434–440. [Google Scholar] [CrossRef]
  20. Kustas, W.P.; Daughtry, C.S.T. Estimation of the soil heat flux/net radiation ratio from spectral data. Agric. For. Meteorol. 1990, 49, 205–223. [Google Scholar] [CrossRef]
  21. Su, Z.B.; Schmugge, T.; Kustas, W.P.; Massman, W.J. An evaluation of two models for estimation of the roughness height for heat transfer between the land surface and the atmosphere. J. Appl. Meteorol. 2001, 40, 1933–1951. [Google Scholar] [CrossRef] [Green Version]
  22. Brutsaert, W. Aspects of bulk atmospheric boundary layer similarity under free-convective conditions. Rev. Geophy. 1999, 37, 439–451. [Google Scholar] [CrossRef]
  23. Zhu, X.L.; Chen, J.; Gao, F.; Chen, X.H.; Masek, J.G. An enhanced spatial and temporal adaptive reflectance fusion model for complex heterogeneous regions. Remote Sens. Environ. 2010, 114, 2610–2623. [Google Scholar] [CrossRef]
  24. Allen, R.G.; Tasumi, M.; Trezza, R. Satellite-based energy balance for mapping evapotranspiration with internalized calibration(METRIC)-model. J. Irrig. Drain. Eng. 2007, 133, 380–394. [Google Scholar] [CrossRef]
  25. Wang, Z.; Zhang, F.; Zhang, X.; Chan, N.W.; Kung, H.; Zhou, X.; Wang, Y. Quantitative evaluation of spatial and temporal variation of soil salinization risk using GIS-based geostatistical method. Remote Sens. 2020, 12, 2405. [Google Scholar] [CrossRef]
  26. Wang, W.J.; Zhang, X.; Zhao, Y.D.; Wang, S.D. Cotton extraction method of integrated multi-features based on multitemporal Landsat 8 images. J. Remote Sens. 2017, 21, 115–124. [Google Scholar] [CrossRef]
  27. Hou, D.Y.; O’Connor, D.; Nathanail, P.; Tian, L.; Ma, Y. Integrated GIS and multivariate statistical analysis for regional scale assessment of heavy metal soil contamination: A critical review. Environ. Pollut. 2017, 231, 1188–1200. [Google Scholar] [CrossRef]
  28. Tan, S.; Wang, Q.; Zhang, J.; Chen, Y.; Shan, Y.; Xu, D. Performance of AquaCrop model for cotton growth simulation under film-mulched drip irrigation in southern Xinjiang, China. Agric. Water Manag. 2018, 196, 99–113. [Google Scholar] [CrossRef]
  29. Liu, L.N.; Wang, T.S.; Wang, L.C.; Wu, X.; Zuo, Q.; Shi, J.C.; Sheng, J.D.; Jiang, P.A.; Chen, Q.J.; Ben-Gal, A. Plant water deficit index-based irrigation under conditions of salinity. Agric. Water Manag. 2022, 269, 107669. [Google Scholar] [CrossRef]
  30. Van Niel, T.G.; McVicar, T.R.; Datt, B. On the relationship between training sample size and data dimensionality: Monte Carlo analysis of broadband multi-temporal classification. Remote Sens. Environ. 2005, 98, 468–480. [Google Scholar] [CrossRef]
  31. Cohen, J. A coefficient of agreement for nominal scales. Educ. Psychol. Meas. 1960, 20, 37–46. [Google Scholar] [CrossRef]
  32. Meng, C.R.; Yan, L.; Zhang, S.J.; Wei, C.Z. Variation of soil salinity in plow layer of farmlands under long-term mulched drip irrigation in arid region. Acta Pedol. Sin. 2017, 54, 1386–1394. [Google Scholar]
  33. Cheng, W.M.; Zhou, C.H.; Liu, H.J.; Zhang, Y.; Jiang, Y.; Zhang, Y.C.; Yao, Y.H. Oasis 50-year expansion and evolution of the ecological environment in Manas River Basin. Sci. China Ser. D Earth Sci. 2006, 49, 163–175. [Google Scholar] [CrossRef]
  34. Zhou, S.Q.; Wang, J.; Liu, J.X.; Yang, J.H.; Xu, Y.; Li, J.H. Evapotranspiration of a drip-irrigated, film-mulched cotton field in northern Xinjiang, China. Hydrol. Process. 2012, 26, 1169–1178. [Google Scholar] [CrossRef]
  35. Bai, J.; Wang, J.; Chen, X.; Luo, G.; Shi, H.; Li, L.; Li, J. Seasonal and inter-annual variations in carbon fluxes and evapotranspiration over cotton field under drip irrigation with plastic mulch in an arid region of Northwest China. J. Arid Land 2015, 7, 272–284. [Google Scholar] [CrossRef] [Green Version]
  36. Teuling, A.J.; Hirschi, M.; Ohmura, A.; Wild, M.; Reichstein, M.; Ciais, P.; Buchmann, N.; Ammann, C.; Montagnani, L.; Richardson, A.D.; et al. A regional perspective on trends in continental evaporation. Geophys. Res. Lett. 2009, 36, L02404. [Google Scholar] [CrossRef] [Green Version]
  37. Minhas, P.S.; Ramos, T.; Ben-Gal, A.; Pereira, L.S. Coping with salinity in irrigated agriculture: Crop evapotranspiration and water management issues. Agric. Water Manag. 2020, 227, 105832. [Google Scholar] [CrossRef]
  38. Statistics Bureau of Xinjiang Uygur Autonomous Region. Xinjiang Statistical Yearbook; China Statistics Press: Beijing, China, 2001–2020; Available online: https://navi.cnki.net/knavi/yearbooks/YXJTJ/detail?uniplatform=NZKPT (accessed on 16 September 2021).
  39. Xu, Z.Q.; Mao, X.M.; Adeloye, A.J.; Hu, K.J.; Zhu, Y.; Ma, X.W. Geotextile covering: Potential technique for farmland salinization control. Land Degrad. Dev. 2021, 32, 2493–2508. [Google Scholar] [CrossRef]
  40. Raveh, E.; Ben-Gal, A. Irrigation with water containing salts: Evidence from a macro-data national case study in Israel. Agric. Water Manag. 2016, 170, 176–179. [Google Scholar] [CrossRef]
  41. Hopmans, J.W.; Qureshi, A.S.; Kisekka, I.; Munns, R.; Grattan, S.R.; Rengasamy, P.; Ben-Gal, A.; Assouline, S.; Javaux, M.; Minhas, P.S.; et al. Critical Knowledge Gaps and Research Priorities in Global Soil Salinity. Adv. Agron. 2021, 169, 1–191. [Google Scholar] [CrossRef]
  42. Raveh, E.; Ben-Gal, A. Leveraging sustainable irrigated agriculture via desalination: Evidence from a macro-data case study in Israel. Sustainability 2018, 10, 974. [Google Scholar] [CrossRef] [Green Version]
  43. Bao, A.K.; Guo, Z.G.; Zhang, H.F.; Wang, S.M. A procedure for assessing the salt tolerance of lucerne (Medicago sativa L.) cultivar seedlings by combining agronomic and physiological indicators. N. Z. J. Agric. Res. 2009, 52, 435–442. [Google Scholar] [CrossRef]
  44. Kaner, A.; Tripler, E.; Hadas, E.; Ben-Gal, A. Feasibility of desalination as an alternative to irrigation with water high in salts. Desalination 2017, 416, 122–128. [Google Scholar] [CrossRef]
  45. Han, L.J.; Ding, J.L.; Wang, J.J.; Zhang, J.Y.; Xie, B.Q.; Hao, J.P. Monitoring Oasis Cotton Fields Expansion in Arid Zones Using the Google Earth Engine: A Case Study in the Ogan-Kucha River Oasis, Xinjiang, China. Remote Sens. 2022, 14, 225. [Google Scholar] [CrossRef]
Figure 1. Location map of the study area ((a). Location of the Manas River Basin and meteorological stations in Xinjiang; (b). Map of the Manas River Basin).
Remotesensing 14 03438 g001
Figure 2. Flow chart of the fusion process for ETESTARFM with high spatiotemporal resolution.
Remotesensing 14 03438 g002
Figure 3. Distribution maps of ET in cotton fields under film-mulched drip irrigation in the Manas River Basin, respectively estimated using SEBS based on the remote sensing images from Landsat (ETLandsat) or MODIS (ETMODIS), and using ESTARFM (ETESTARFM) based on the fusion of ETLandsat and ETMODIS: (a) ETMODIS and (b) ETLandsat on 14 June 2018; (c) ETMODIS and (d) ETLandsat on 17 August 2018; (e) ETMODIS, (f) ETLandsat, and (g) ETESTARFM on 1 August 2018; (h) Selected partial detail distribution of ET in (f); (i) Correspondingly selected partial detail distribution of ET in (g), in comparison with that of (h); (j) Absolute errors of ET between (h,i) (|AE|); and (k) Absolute relative errors of ET between (h,i) (|RE|).
Remotesensing 14 03438 g003
Figure 4. Comparisons of fused ETESTARFM and estimated ETLandsat in cotton fields under film-mulched drip irrigation in the Manas River Basin on 1 August 2018: (a) Table for the statistical characteristics of fused ETESTARFM and estimated ETLandsat; and (b) 1:1 diagram (R2: coefficient of determination; RMSE: root-mean-square error; RE: relative error; MAE: mean absolute error).
Remotesensing 14 03438 g004
Figure 5. Comparisons of ETEC measured by an eddy covariance system and ETESTARFM fused by ESTARFM in cotton fields under film-mulched drip irrigation at the Wulanwusu Agricultural Experimental Station in 2012: (a) Table for the statistical characteristics of measured ETEC and fused ETESTARFM; and (b) 1:1 diagram (R2: coefficient of determination; RMSE: root-mean-square error; RE: relative error; MAE: mean absolute error).
Remotesensing 14 03438 g005
Figure 6. Comparisons of the fused ETESTARFM by ESTARFM and measured ETWBF in the field experiment for cotton growth under film-mulched drip irrigation in 2019: (a) Table for the statistical characteristics of measured ETWBF and fused ETESTARFM; and (b) 1:1 diagram (R2: coefficient of determination; RMSE: root-mean-square error; RE: relative error; MAE: mean absolute error).
Remotesensing 14 03438 g006
Figure 7. Comparisons of the annual total evapotranspiration between TETWBR measured at regional scale and TETESTARFM fused by ESTARFM in cotton fields under film-mulched drip irrigation in the Manas River Basin from 2000 to 2020: (a) Table for the statistical characteristics of measured TETWBR and fused TETESTARFM; and (b) 1:1 diagram (R2: coefficient of determination; RMSE: root-mean-square error; RE: relative error; MAE: mean absolute error).
Remotesensing 14 03438 g007
Figure 8. Spatial distributions of the fused total evapotranspiration (TET, mm) during the growing seasons of (a) 2000, (b) 2005, (c) 2010, (d) 2015, and (e) 2020 in cotton fields under film-mulched drip irrigation in the Manas River Basin.
Remotesensing 14 03438 g008
Figure 9. Dynamics of leaf area index (LAI), mean air temperature (T), total water supply of irrigation and precipitation (I + P), and daily evapotranspiration rate measured by an eddy covariance system (ETEC) in the Wulanwusu Agricultural Experimental Station and estimated by remote sensing fusion as an average over the entire Manas River Basin ( E T ¯ ESTARFM ) during the growing season (April–September) of cotton fields under film-mulched drip irrigation in 2012.
Remotesensing 14 03438 g009
Figure 10. Actual evapotranspiration (TET), irrigation amount (I), effective precipitation (P), ratio of water supply to evapotranspiration ((I + P)/TET) and relative water supply ((I + P)/TETp), mean of actual evapotranspiration (Mean TET), and mean of potential evapotranspiration (Mean TETp) for cotton fields under film-mulched drip irrigation in the Manas River Basin from 2000 to 2020.
Remotesensing 14 03438 g010
Publisher’s Note: MDPI stays neutral with regard to jurisdictional claims in published maps and institutional affiliations.

