Article

A Deep Learning Time Series Approach for Leaf and Wood Classification from Terrestrial LiDAR Point Clouds

by
Tao Han
and
Gerardo Arturo Sánchez-Azofeifa
*
Center for Earth Observation Sciences, Department of Earth and Atmospheric Sciences, University of Alberta, Edmonton, AB T6G 2R3, Canada
*
Author to whom correspondence should be addressed.
Remote Sens. 2022, 14(13), 3157; https://doi.org/10.3390/rs14133157
Submission received: 9 April 2022 / Revised: 7 May 2022 / Accepted: 10 May 2022 / Published: 1 July 2022
(This article belongs to the Special Issue Feature Paper Special Issue on Ecological Remote Sensing)

Abstract

:
The accurate separation between leaf and woody components from terrestrial laser scanning (TLS) data is vital for the estimation of leaf area index (LAI) and wood area index (WAI). Here, we present the application of deep learning time series separation of leaves and wood from TLS point clouds collected from broad-leaved trees. First, we use a multiple radius nearest neighbor approach to obtain a time series of the geometric features. Second, we compare the performance of Fully Convolutional Neural Network (FCN), Long Short-Term Memory Fully Convolutional Neural Network (LSTM-FCN), and Residual Network (ResNet) on leaf and wood classification. We also compare the effect of univariable (UTS) and multivariable (MTS) time series on classification accuracy. Finally, we explore the utilization of a class activation map (CAM) to reduce the black-box effect of deep learning. The average overall accuracy of the MTS method across the training data is 0.96, which is higher than the UTS methods (0.67 to 0.88). Meanwhile, ResNet spent much more time than FCN and LSTM-FCN in model development. When testing our method on an independent dataset, the MTS models based on FCN, LSTM-FCN, and ResNet all demonstrate similar performance. Our method indicates that the CAM can explain the black-box effect of deep learning and suggests that deep learning algorithms coupled with geometric feature time series can accurately separate leaf and woody components from point clouds. This provides a good starting point for future research into estimation of forest structure parameters.

Graphical Abstract

1. Introduction

Forest canopy structure affects the interactions between terrestrial ecosystems and the atmosphere [1]. Green leaves in the canopy control vital ecological processes such as photosynthesis, gas exchange, and light interception, while the woody part contributes to tree biomass [2,3]. Accurate separation of leaf and woody components from the canopy has the potential to improve our understanding and management of forests from a structural point of view [4].
The development of remote sensing techniques during the last multiple decades, particularly terrestrial laser scanning (TLS), has been increasingly applied to forestry and ecology due to its ability to capture detailed 3D information about forest structure [5,6]. TLS is an active remote sensing instrument that emits laser pulses, and then reads their return signal to generate 3D point clouds, allowing for the distance to surrounding objects to be calculated based on the pulse return time [7].
Many studies have investigated the potential of TLS point clouds to separate leaf and woody components from individual trees or plots using unsupervised and supervised machine learning algorithms. These separation methods can be subdivided into three groups: (1) by geometric features [8,9,10], (2) by radiometric features [11], and (3) by a mixture of both [4,12]. The radiometric method depends on the type of LiDAR system (e.g., wavelength) which makes it sensor-specific [9]. Conversely, the geometric method only needs the xyz coordinates of the points, which is the fundamental information provided by all sensors [8]. Moreover, the geometric method consistently outperforms the radiometric techniques when comparing results across the literature [3]. The mixed approach has been used to classify leaf and wood [4] and has consistently had the highest performance of all of the classification methods; however, the mixture method still relies on the type of LiDAR system due to the inclusion of radiometric features [10].
Geometric features describe the local geometry of a point and are often estimated from a local neighborhood of points [13]. Radially bounded nearest neighbor and k-nearest neighbor approaches typically define the local neighborhood of a point [8,10,14]. When comparing those two approaches, the radius-bounded nearest neighbor seems to be more advanced, while the density of the point clouds influences the latter. For example, the density of point cloud in the upper part of the tree is often lower than the points in the lower part, due to occlusion effects and physical distance between the target and scanner [2]. Thus, the geometric features obtained by the same k-nearest neighbors approach in the canopy are different from those in the understory [8]. By contrast, the features defined by the radius-bounded nearest neighbor approach can allow more consistent geometric meaning [14].
Current separation geometric feature separation methodologies that use the radius-bounded nearest neighbor approach have relied on a fixed size or have defined an optimal size using the criterion such as Shannon entropy [4,9]. In contrast, using a multiple radius method eliminates the need to select a single size to obtain features [8]. Belton et al. [13] also presented a leaf and wood classification method based on a multiple radius search approach, which demonstrated superiority to the single radius search approach; however, there are some problems with a multiple radius search approach when classifying leaf and wood components [8,12,13]. First, searching several sizes randomly may not completely capture the geometric information of each point at different scales. Second, the distribution of classes in the training and testing data affects the performance of machine learning models [15], since testing data may not have the same proportion of training data compared to the real world [16].
Recent advances in deep learning are providing an excellent opportunity to quantify forest structure and classify leaf and wood components [5]. Deep learning is believed to be the best solution for discovering complex architecture in high-dimensional data [17]. Compared with machine learning algorithms (random forest (RF) boosting), deep learning neural network (NN)-based algorithms are more complex and require high-performance hardware [18,19]. Additionally, deep learning algorithms are composed of black-box networks, which makes them difficult to interpret [20].
A time series is defined as a series of data points ordered based on a uniform interval [21]. Multiple radius nearest neighbors often search a set of radii from small (0.1 m) to large values (1 m) [8,13], and thus can be cast as time series data for classification. Generally, time series data can be grouped into univariable time series (UTC) and multivariable time series (MTC). MTC is the finite sequence of UTC, providing more patterns to understand the data [21,22].
Time series classification (TSC) is regarded as one of the main challenges in data mining over the last several years [23]. Also, time series data have found many applications in image classification [24], healthcare [25], human recognition [26], and the steel industry [27]. This is because any classification problem using data that is arranged according to some notion of order can be taken as a TSC problem [20]. With the increment of temporal data availability, many algorithms have been presented to tackle the TSC problem [20]. At the early stage of TSC, distance-based methods use pre-defined similarity measures like Eulidean distance or dynamic time warping (DTW) to perform a classification on original time series directly [28,29]. DTW coupled with k-nearest neighbors have become popularized recently and are largely considered the gold standard in this field [30]. Feature-based methods extract a number of features, which represent the local/global time series patterns, and then perform a classification [31]; however, those methods require more individualized data preprocessing and feature engineering [32]. Deep learning models, by contrast, apply an end-to-end approach that incorporates the feature engineering internally while the model makes decisions on its own process [26]. As a result, deep learning models have the ability to extract information from the time series in a more efficient and complete manner [18].
There are many methods presented primarily to handle satellite image time series classification problems [33,34,35]. For example, Xu et al. [34] proposed a recurrent neural network (RNN) coupled with random forest for scene classification using time series images, demonstrating higher performance than support vector machine (SVM). Meanwhile, Dou et al. [35] used deep learning networks based on convolutional neural network (CNN) on mapping land use and land cover change, producing an overall accuracy of 0.83. Though those deep learning methods demonstrate promising performance on time series image classification, their applications on TSC of point clouds are not well studied.
In the context of previous studies, this paper seeks to investigate the potential of deep learning algorithms to separate leaf and woody components using TLS data. Specifically, Section 2 introduces data source and deep learning methods, and Section 3 illustrates the performance of our methods on point clouds. Section 4 and Section 5 present discussion and conclusions. Moreover, our study focuses on the following questions: (1) Can the multiple radius search method be used to create time series data? (2) Does MTC have significant advantages over UTC for leaf and wood classifications using TLS data? (3) How well do different deep learning methods perform the classification of leaf and woody components using point clouds? (4) Can the black-box effect of deep learning become interpretable? We explore the above questions using seven broad-leaved trees scanned by TLS during the leaf-on and leaf-off conditions.

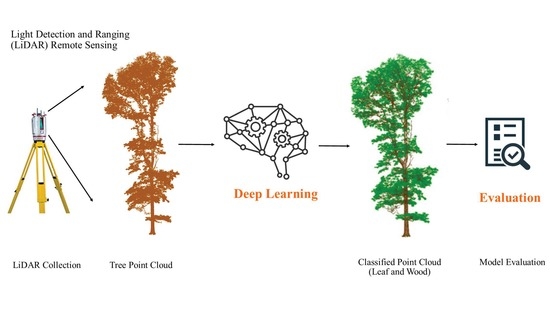
2. Materials and Methods

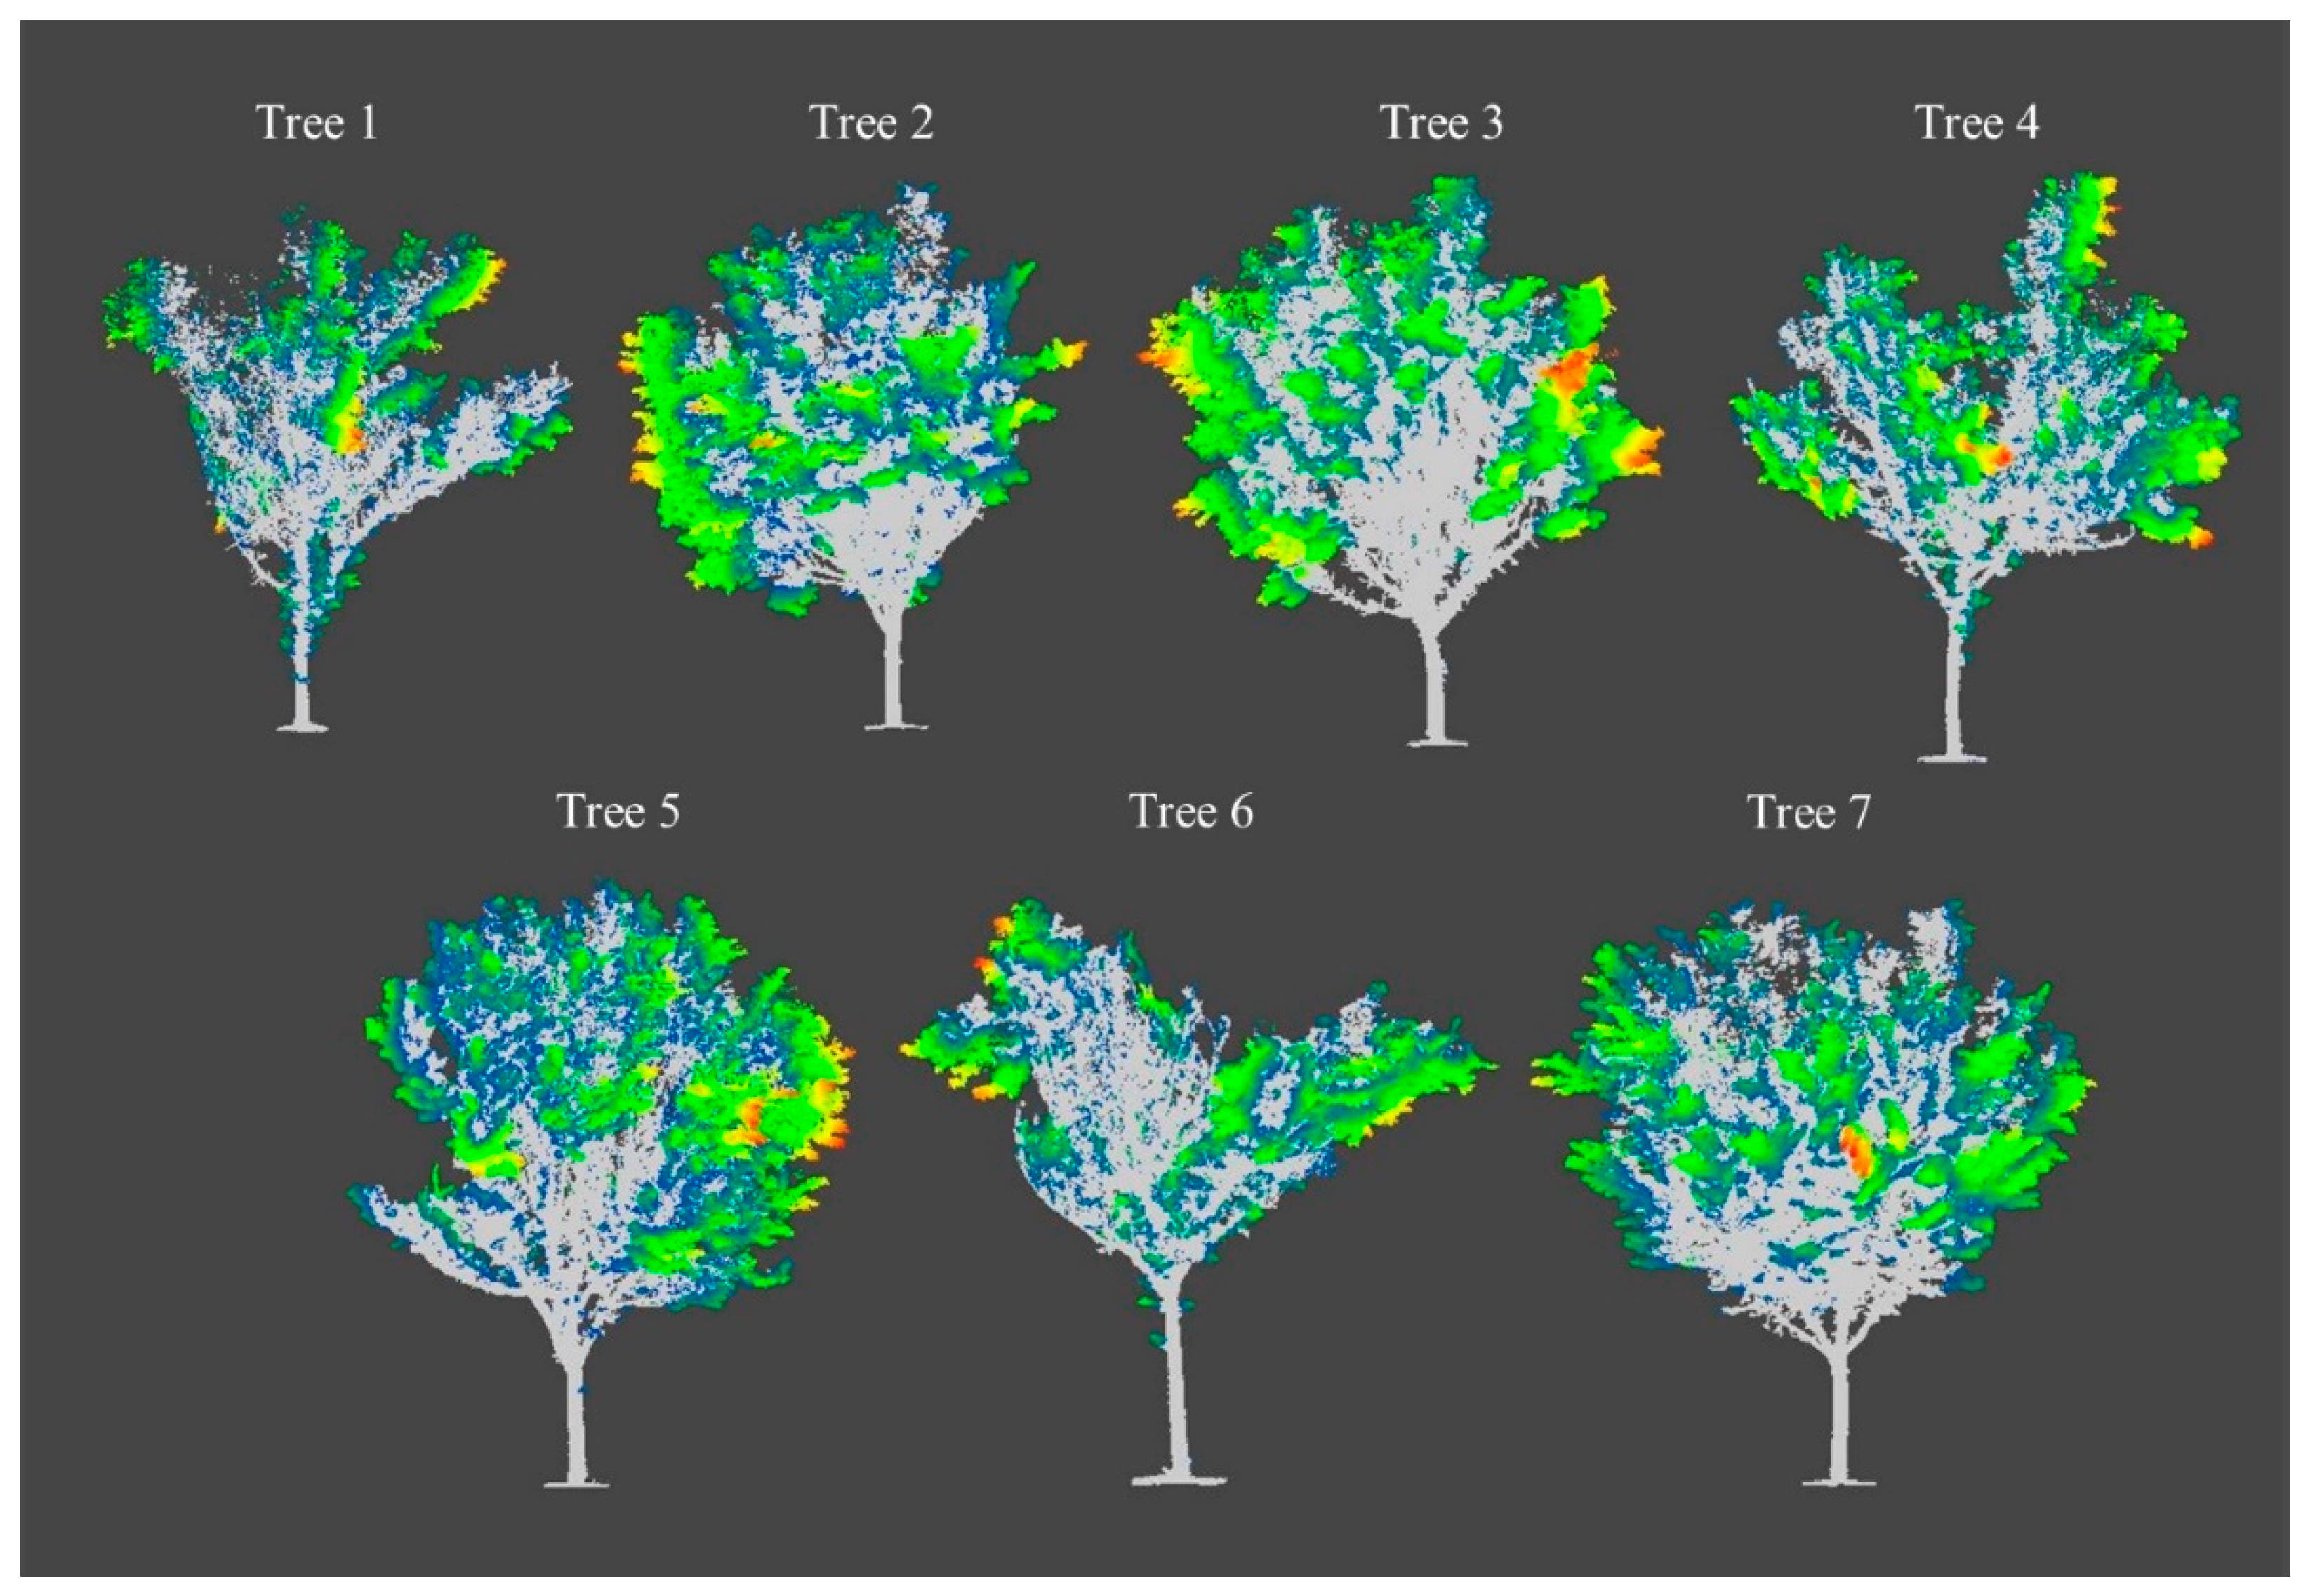
2.1. Study Area and Data

To evaluate deep learning algorithms on leaf and wood classification, we collected TLS point clouds from seven broad-leaved trees (Ulmus americana) at the North Campus, University of Alberta (53°31′42.4″ N, 113°31′26.5″ W). This site is located in Edmonton, Alberta, Canada which experiences a humid continental climate (mean annual precipitation −480 mm) with warmer summers (mean temperature up to 23.1 °C) and cold winters (mean temperature bottom to −14.8 °C) [36]. The seven trees were scanned during the leaf-on and leaf-off conditions in October 2017 and January 2019, respectively.
We used a Rigel VZ-400i (Horn, Austria), to scan all trees. This TLS uses a 1550 nm shortwave infrared laser light, with a maximum vertical field of view (FOV) of 120° and a horizontal FOV of 360°. The beam divergence of this TLS is 0.35 mrad, with a range accuracy of 0.005 m at 100 m range [7]. The scanning strategy took the form of a 30 m × 50 m plot. Six-cylinder reflectors installed on 2 m poles outsides of the bound of the plot as control points were used for registration. To minimize the occlusion effect, 12 scan positions were used to cover each tree. The registration was performed using RiSCAN PRO software (RIEGL Laser Measurement Systems GmbH, Horn, Austria). All points that did not belong to target trees from the registered point clouds were removed. The description of the point cloud of all trees registered under the leaf-on and leaf-off conditions is illustarated in Figure 1.

2.2. Data Processing

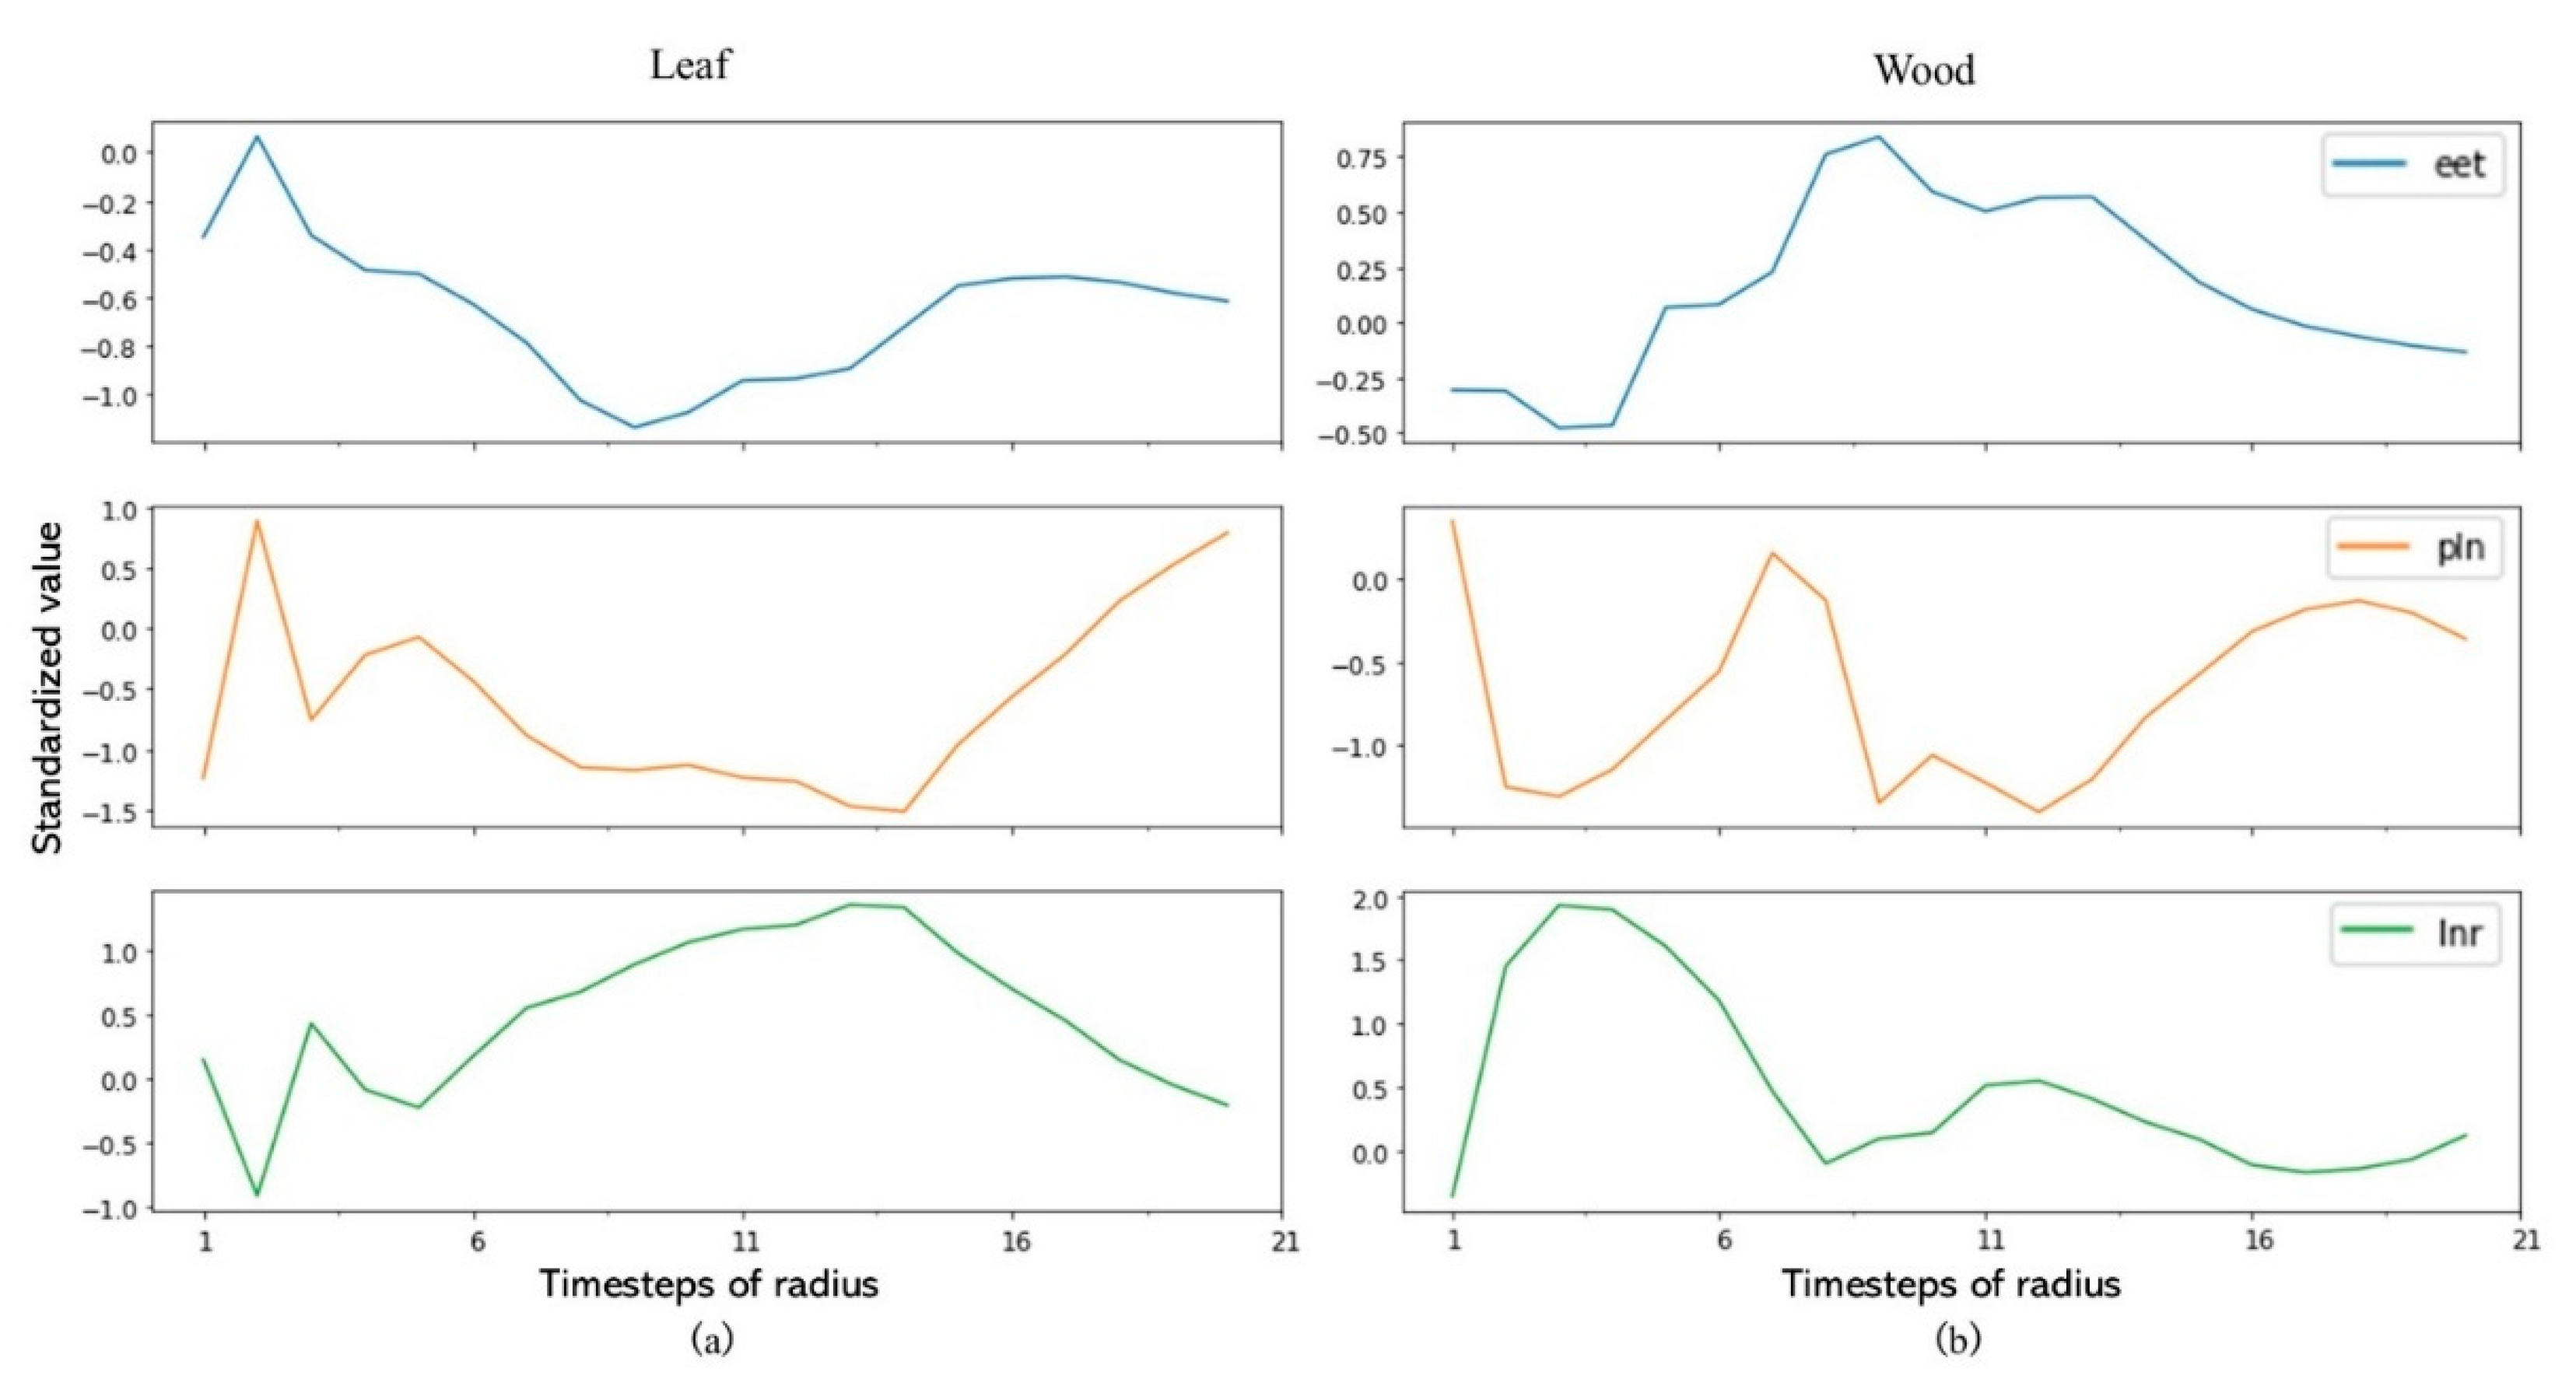
2.2.1. Predictor Variables

Local dimensional features express how neighborhood points are distributed in space. They use geometric attributes derived from point clouds data to support classification problems [9,37]. To obtain the local dimensional features, a covariance matrix is calculated based on several neighboring points within a specified radius. The spatial distribution of the point can then be represented by three positive eigenvalues (λ1, λ2, λ3).
We used the geometric features in Table 1 as predictor variables to classify leaf and woody components, which is consistent with other literature [10,38]. Cloud Compare (version 2.11, Cloud Compare, GPL software) was used to obtain those features directly [9].

2.2.2. Data Labeling

To train a deep learning model, we used the registration by distance function in Cloud Compare to identify clusters of points as training data. The distance obtained indicated the local changes due to loss of leaves and branches between the two phenological conditions. A large distance between the two phenological conditions often means leaves, while a small distance represents wood components (Figure 1). Here, we labeled the points from the clouds of seven trees into two classes by hand, where class 1 and class 0 represented wood and leaf, respectively.
The classes are often unbalanced in leaf and wood classification, where the wood class is smaller than the leaf class [8]. According to [16], using balanced training data does lead to the highest overall accuracy, regardless of the percentage of the two classes in the testing data. Therefore, we randomly sampled about ten percent of the total points of each tree (about five percent per class) as our training data (see Table A1), indicating the broader applicability of our method. We used this sample size to balance the computational power and the number of points.

2.2.3. Time-Series Data

Two types of time series, UTS and MTS, were used for the leaf and wood classification in this study. One of the challenges of applying deep learning to TSC is preparing the input time series [39]. Here, the input data X should be a three-dimensional array (number of samples, number of timesteps, number of variables), while the output Y label is a two-dimensional array (number of samples, number of labels). Traditionally, a time series Xi is defined as a set of ordered real values of length T, with a corresponding class Yi. The training data is composed of a number of n pairs (Xi, Yi) [20]. Therefore, the shape of UTS is (n, T), while MTS has the shape of (3n, T) in this case. As a result of this difference, we convert the two-dimensional shape of UTS and MTS mentioned above into the three-dimensional time series (UTS: (n, T, 1); MTS: (n, T, 3)) using the python package tsai [40].
Before applying multiple radius nearest neighbors to define the number of timesteps, we used a voxel grid filter of size 0.01 m to down-sample the point clouds [36]. Down-sampling ensures a uniform distribution of points in space, improving computation efficiency [41]. The geometric features were computed from an increasing radius ranging from 0.05 m to 1 m, stepped by 0.05 m. As a result, the shapes of UTS and MTS are (n, 20, 1) and (n, 20, 3), respectively. Since we have a binary classification, the shape of the label is (n, 1). The only preprocess step for the time series is standardizing the input data. The values of time series in similar ranges can speed up the computation of neural networks [30,42].

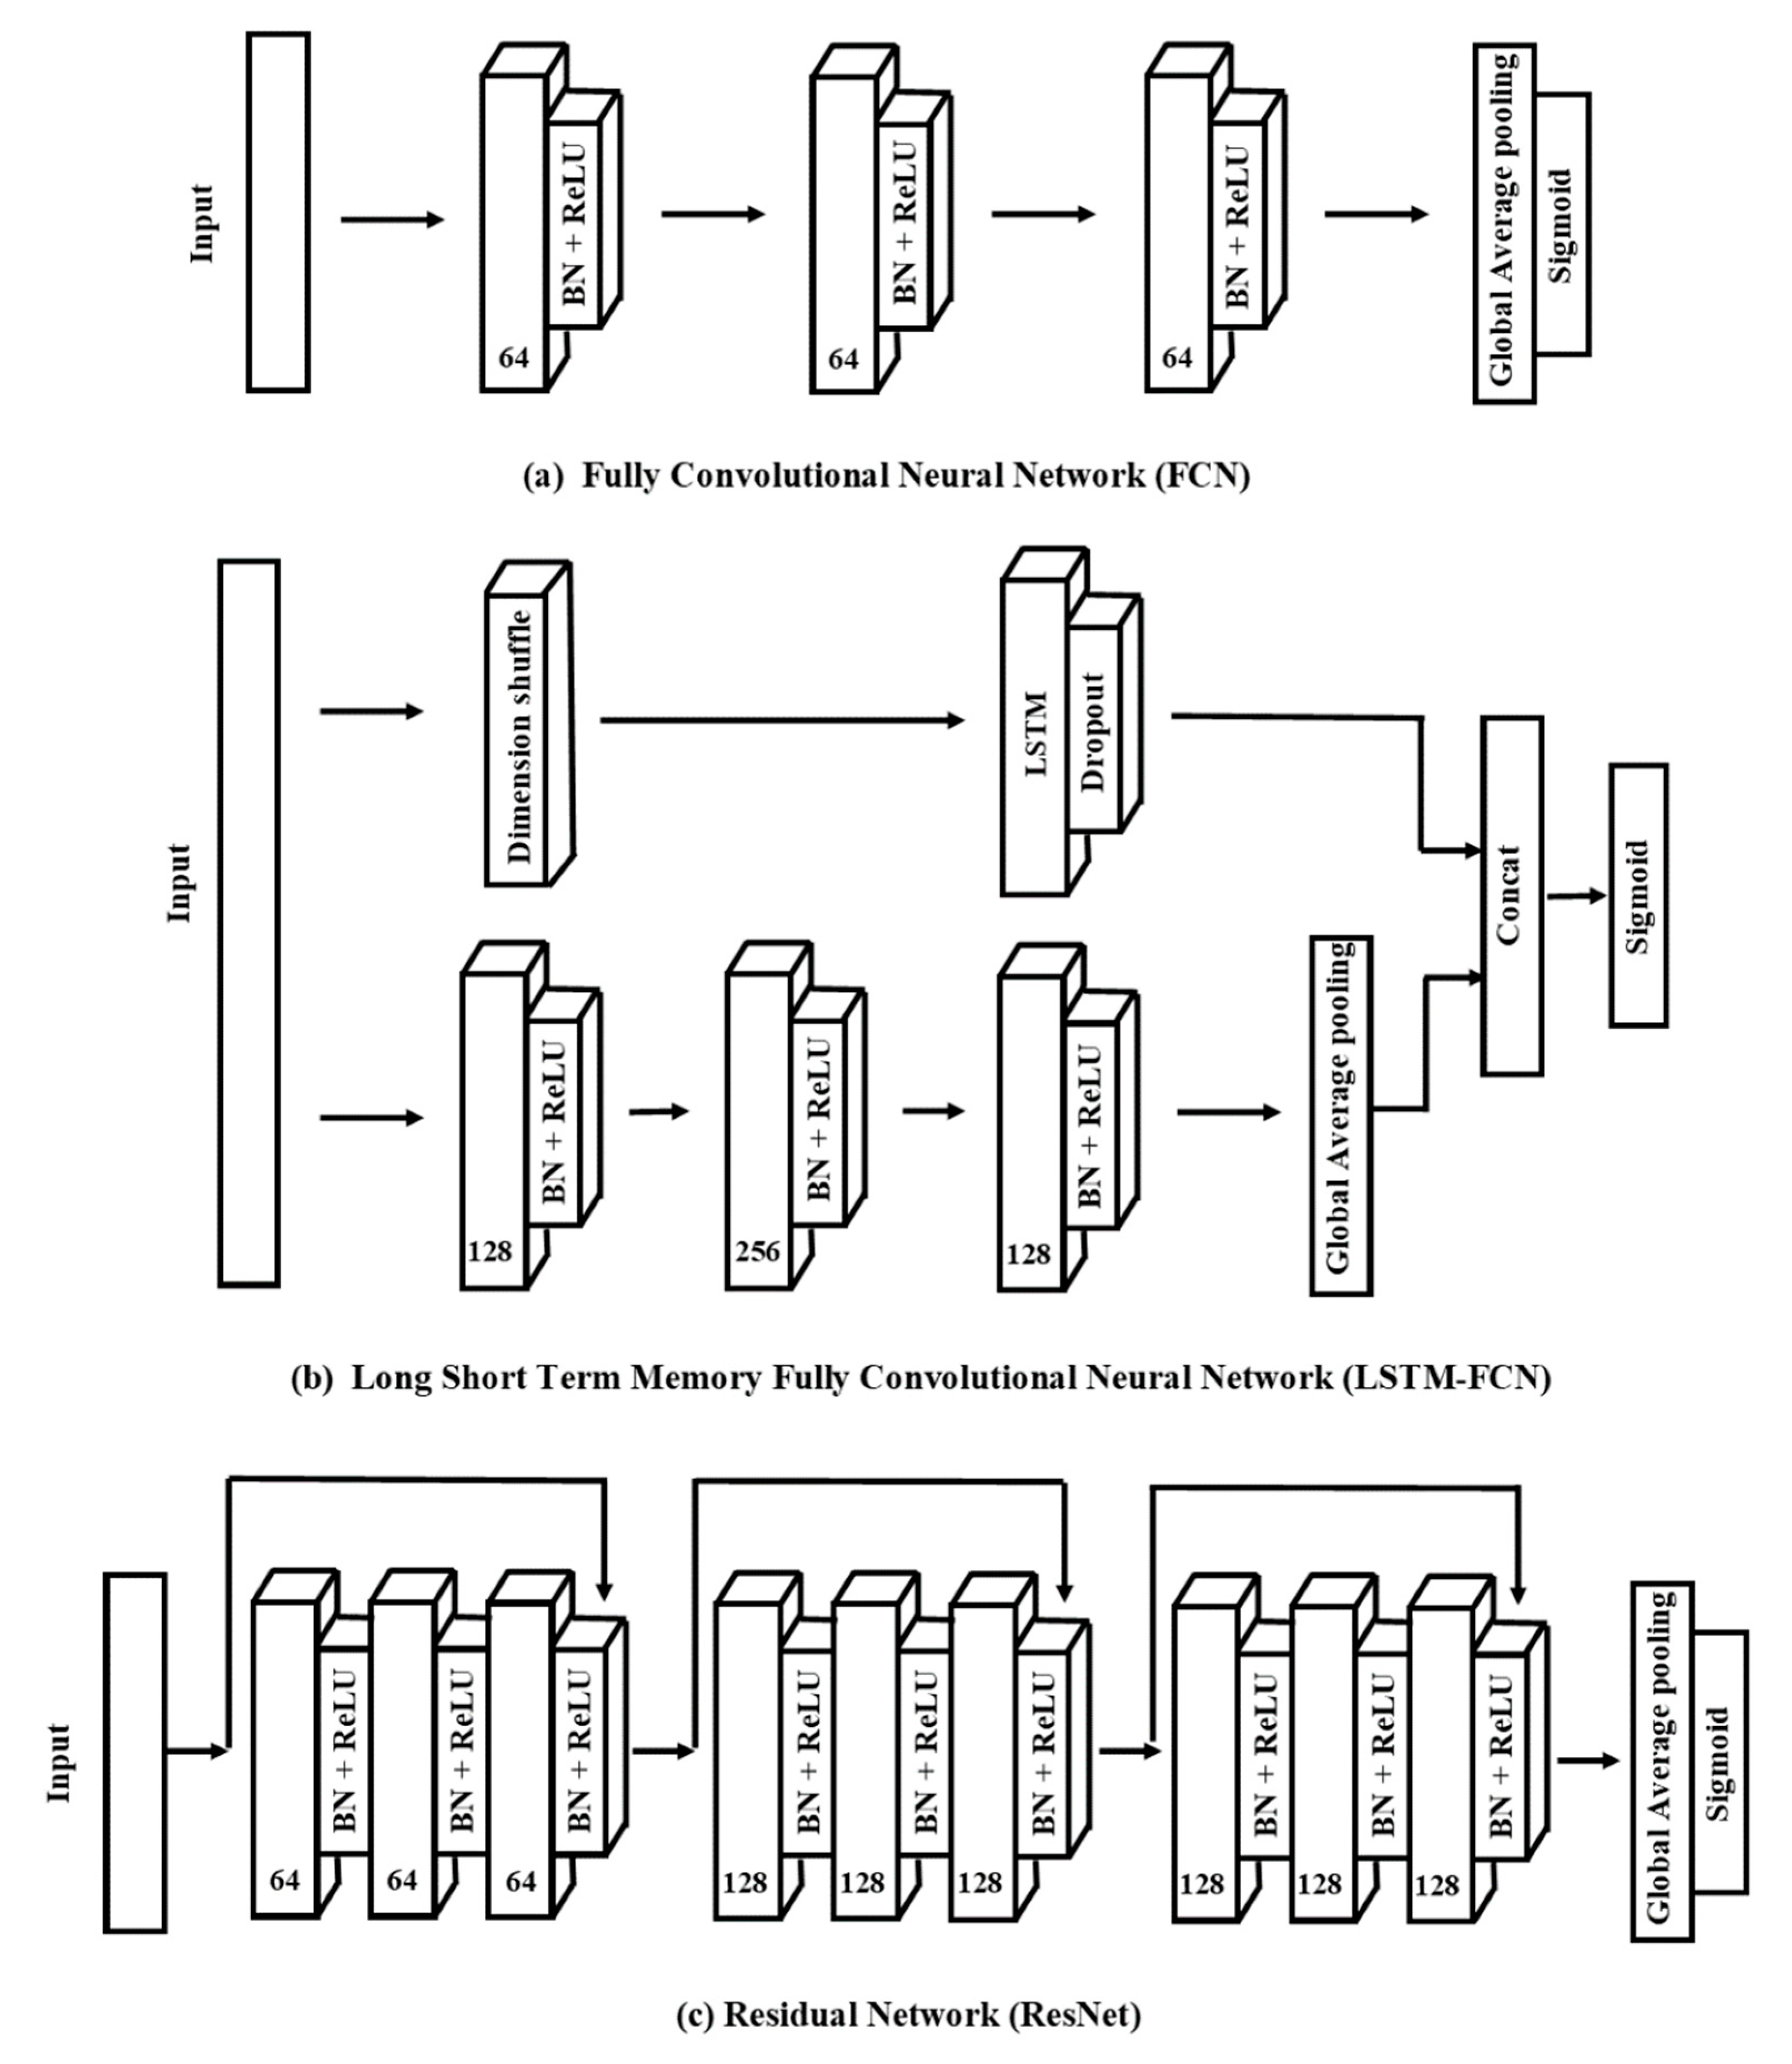
2.2.4. End-to-End Deep Learning Model

There are two groups of models, in terms of the deep learning architecture, that can solve TSC: (1) deep learning algorithms with manually made features, and (2) end-to-end deep learning algorithms. This study only considers end-to-end deep learning models that incorporate feature engineering while optimizing the classifier. The main objective of deep learning models is to eliminate the bias of hand-engineered features, thus enabling the network to independently learn and make intelligent decisions [43].
Convolutional neural networks (CNNs) have seen many successful applications for time series analysis [44,45], with some models obtaining accuracies of 99% [45]. CNNs often demonstrate higher performance in time series classification, because applying multiple convolutional filters on an input time series results in multiple other time series, which mean multiple discriminate features can then be acquired for the classification task [20].
A.
Fully Convolutional Neural Networks
Fully convolutional neural networks (FCNs) were originally proposed by Wang et al. [32]. This architecture outperformed other approaches (i.e., multilayer perceptrons, residual networks) for classifying UTS and MTS data according to the University of California Riverside/University of East Anglia (UCR/UEA) archive [32]. There are three convolutional blocks in this network, where each block also has three operations:
y = w x + b , z = B N   ( y ) , h = R e L U   ( z )
where: x = input data; w = weight matrix; b = bias; y = output neuron; z = batch normalization on output neuron; h = activation of the output neuron, ⊗ = convolutional operator, and BN = batch normalization (BN).
BN can help speed up convergence and improve generalization. Those three blocks are performed as feature extractors, and are fed into a global average pooling (GAP) layer instead of the traditional fully connected layer, thus reducing the number of parameters [46]. Finally, a sigmoid function connects the GAP layer’s output to produce the final label (Figure 2a).
B.
Long Short-Term Memory-Fully Convolutional Neural Networks
Long short-term memory (LSTM) is one of advanced RNN architecture, which handles vanishing gradient problems [47]. Karim et al. [48] proposed combined utilization of LSTM and FCN on time series classification, and the obtained LSTM-FCN method further increased the performance of FCN on the UCR archive.
With the same network of FCN, LSTM-FCN incorporated a sub-module which contained two layers (Figure 2b). The original time series will be input into the first layer, also called the dimensional shuffle. This layer transforms a univariable time series with N timesteps into a multivariable time series (N variables with one timestep). The transformed time series is then passed into a LSTM layer followed by a dropout, with the dropout layer helping to prevent overfitting. The outputs of the LSTM and GAP layers are concatenated and then input into a final sigmoid layer.
C.
Residual Networks
ResNet is also a high-performance deep neural network in time series classification tasks [49]. Xi et al. [12] compared the performance of 15 machine learning and deep learning methods on leaf and wood classification and determined that ResNet is one of the most competitive classifiers among them.
Figure 2c presents the network structure of ResNet used in this study. The ResNet network includes three residual blocks and connects with the GAP layer and a sigmoid function. We used the convolutional blocks in Equation (1) to develop each residual block. Here, the Blockn indicates the residual block with n filters, which have the following operations: x, input data; sn, output of each convolutional block; y, output neuron after adding shortcut connection; s, output of the residual block.
s 1 = B l o c k n 1 ( x ) , s 2 = B l o c k n 2 ( s 1 ) , s 3 = B l o c k n 3 ( s 2 ) , y = s 3 + x , s = R e L U   ( y )
Deep learning is often criticized for being a black-box network, meaning their network is harder to understand [18]. One of the benefits of the methodology employed here is that the GAP layer in the above network enables the utilization of class activation map (CAM) to reduce the black-box effect [50]. CAM highlights the contributing region in the raw data to the resulting classification. Therefore, CAM provides a possible explanation of how the convolution layers work for TSC [32].
When it comes to the hyperparameter of FCN, LSTM-FCN, and ResNet, the stride of all convolutions is equal to 1 with the same padding. This padding means that the length of the time series remains unchanged after the convolutions. The kernel size {3, 5, 8} and filter sizes {64, 128, 256} are determined by a random search method to find the best performing combinations. To make our method broadly applicable, we also add a regularization term to avoid overfitting in each convolution [51].
In this study, we used five trees for training and validation, while the remaining two trees served as testing data. The performance of our method, including parameter optimization, was evaluated via a k-fold cross-validation strategy [52]. Then, we applied Adam optimization to each method, and used binary cross-entropy as a loss function. Adam optimization is a commonly used gradient descent algorithm for training deep learning models [53]. We set up the learning rate as 0.001, the number of epochs as 100, and the batch size as 256, based on previous studies [20,54]. Moreover, we used EarlyStopping to avoid overfitting [55]. This approach keeps recording the loss on the validation data and stops training the classifier when there is no improvement in the performance of validation data. Finally, we applied the CAM method to identify the contribution region of an input time series for the predicted labels. More details about the hyperparameter of FCN, LSTM-FCN, and ResNet are given in Appendix B.

2.2.5. Evaluation

In addition to evaluating the performance of three deep learning networks on Trees 1 and 5, we tested our methods on six trees from [10] to indicate model generation on other tree species. Three of the trees came from Alice Holt, UK, named as alice_1, alice_2, and alice_3. The remaining three trees, called caxiuanaA_117, nouraguesH20_108, and pan_33 are from Caxiuana, Brazil, Nouragues, French Guiana and London, UK, respectively. More details about those trees can be obtained from Vicari et al. [10]. We randomly selected 10,000 points per class for each tree to evaluate our model generation.
To compare the performance of our method against other leaf and wood classification schemes in literature [4,8,10], we used Precision, Recall, F1 score, Accuracy, and a receiver operating characteristic (ROC) curve to evaluate our model’s performance. Precision measures the proportion of the true positive (TP) out of all predicted positive points (TP and FP).
P r e c i s o n = T P T P + F P
Recall is the proportion of the predicted true positive (TP) against all true positive points (TP and FN).
R e c a l l = T P T P + F N
F1 score is the trade-off between Precision and Recall, ranging from 0 to 1.0. A perfect classifier would give a 1.0 of F1 score.
F 1   s c o r e = 2 *   P r e c i s o n * R e c a l l P r e c i s o n + R e c a l l
Accuracy is the proportion of all corrected classified points (TP and TN) against all points.
A c c u r a c y = T P + T N T P + T N + F P + F N
We used a receiver operating characteristic (ROC) curve to understand the discrimination power of three networks. The curve is generated by True Positive Rate (Recall) vs. False Positive Rate at different thresholds. The area under the ROC curve is between 0 and 1. A high area indicates the high prediction score of the classifier.
F a l s e   P o s i t i v e   R a t e = F P F P + T N

3. Results

3.1. UTS vs. MTS

Figure 3 gives the time series of three features using the multiple radius search method, revealing the different changing patterns between a leaf and wood point. Concerning the leaf point, the eigentropy tended to have a lower standardized value (<−0.6) in the intermediate radius timesteps (6 to 16), while the radius value of the wood point (>0) was larger. No clear difference between the leaf and wood points linearity or planarity were found.
To assess the effects of UTS and MTS on the model performance, a five-fold cross-validation strategy was applied to the training data. Table 2 demonstrates all the classification result metrics for both the UTS and MTS of three deep learning networks. As indicated in the table, our method based on MTS clearly outperformed the method based on UTS. When used with MTS, LSTM-FCN and ResNet demonstrated the same overall accuracy of 0.96, with the same F1 score of 0.96 for leaves and wood. FCN had the lowest accuracy of 0.92 among the three networks. Concerning UTS, the eigentropy had a better F1 score for leaf and wood and accuracy than planarity and linearity for all three networks. For example, ResNet produced an overall accuracy of 0.88 on eigentropy, higher than planarity (0.80) and linearity (0.79). Moreover, the planarity and linearity demonstrated similar performances across all metrics for all three networks.
Table 3 provides information about the training process of the UTS and MTS methods of three networks. The average training time of ResNet (487 min) was around 7 and 14 times higher than FCN (68 min) and LSMT-FCN (35 min), respectively. Also, the average number of epochs and training time between UTS and MTS model were similar. For instance, the mean epochs and training time of UTS model based on ResNet were 225 ± 34 and 487 ± 74 min, while that of MTS model were 255 and 553 min.

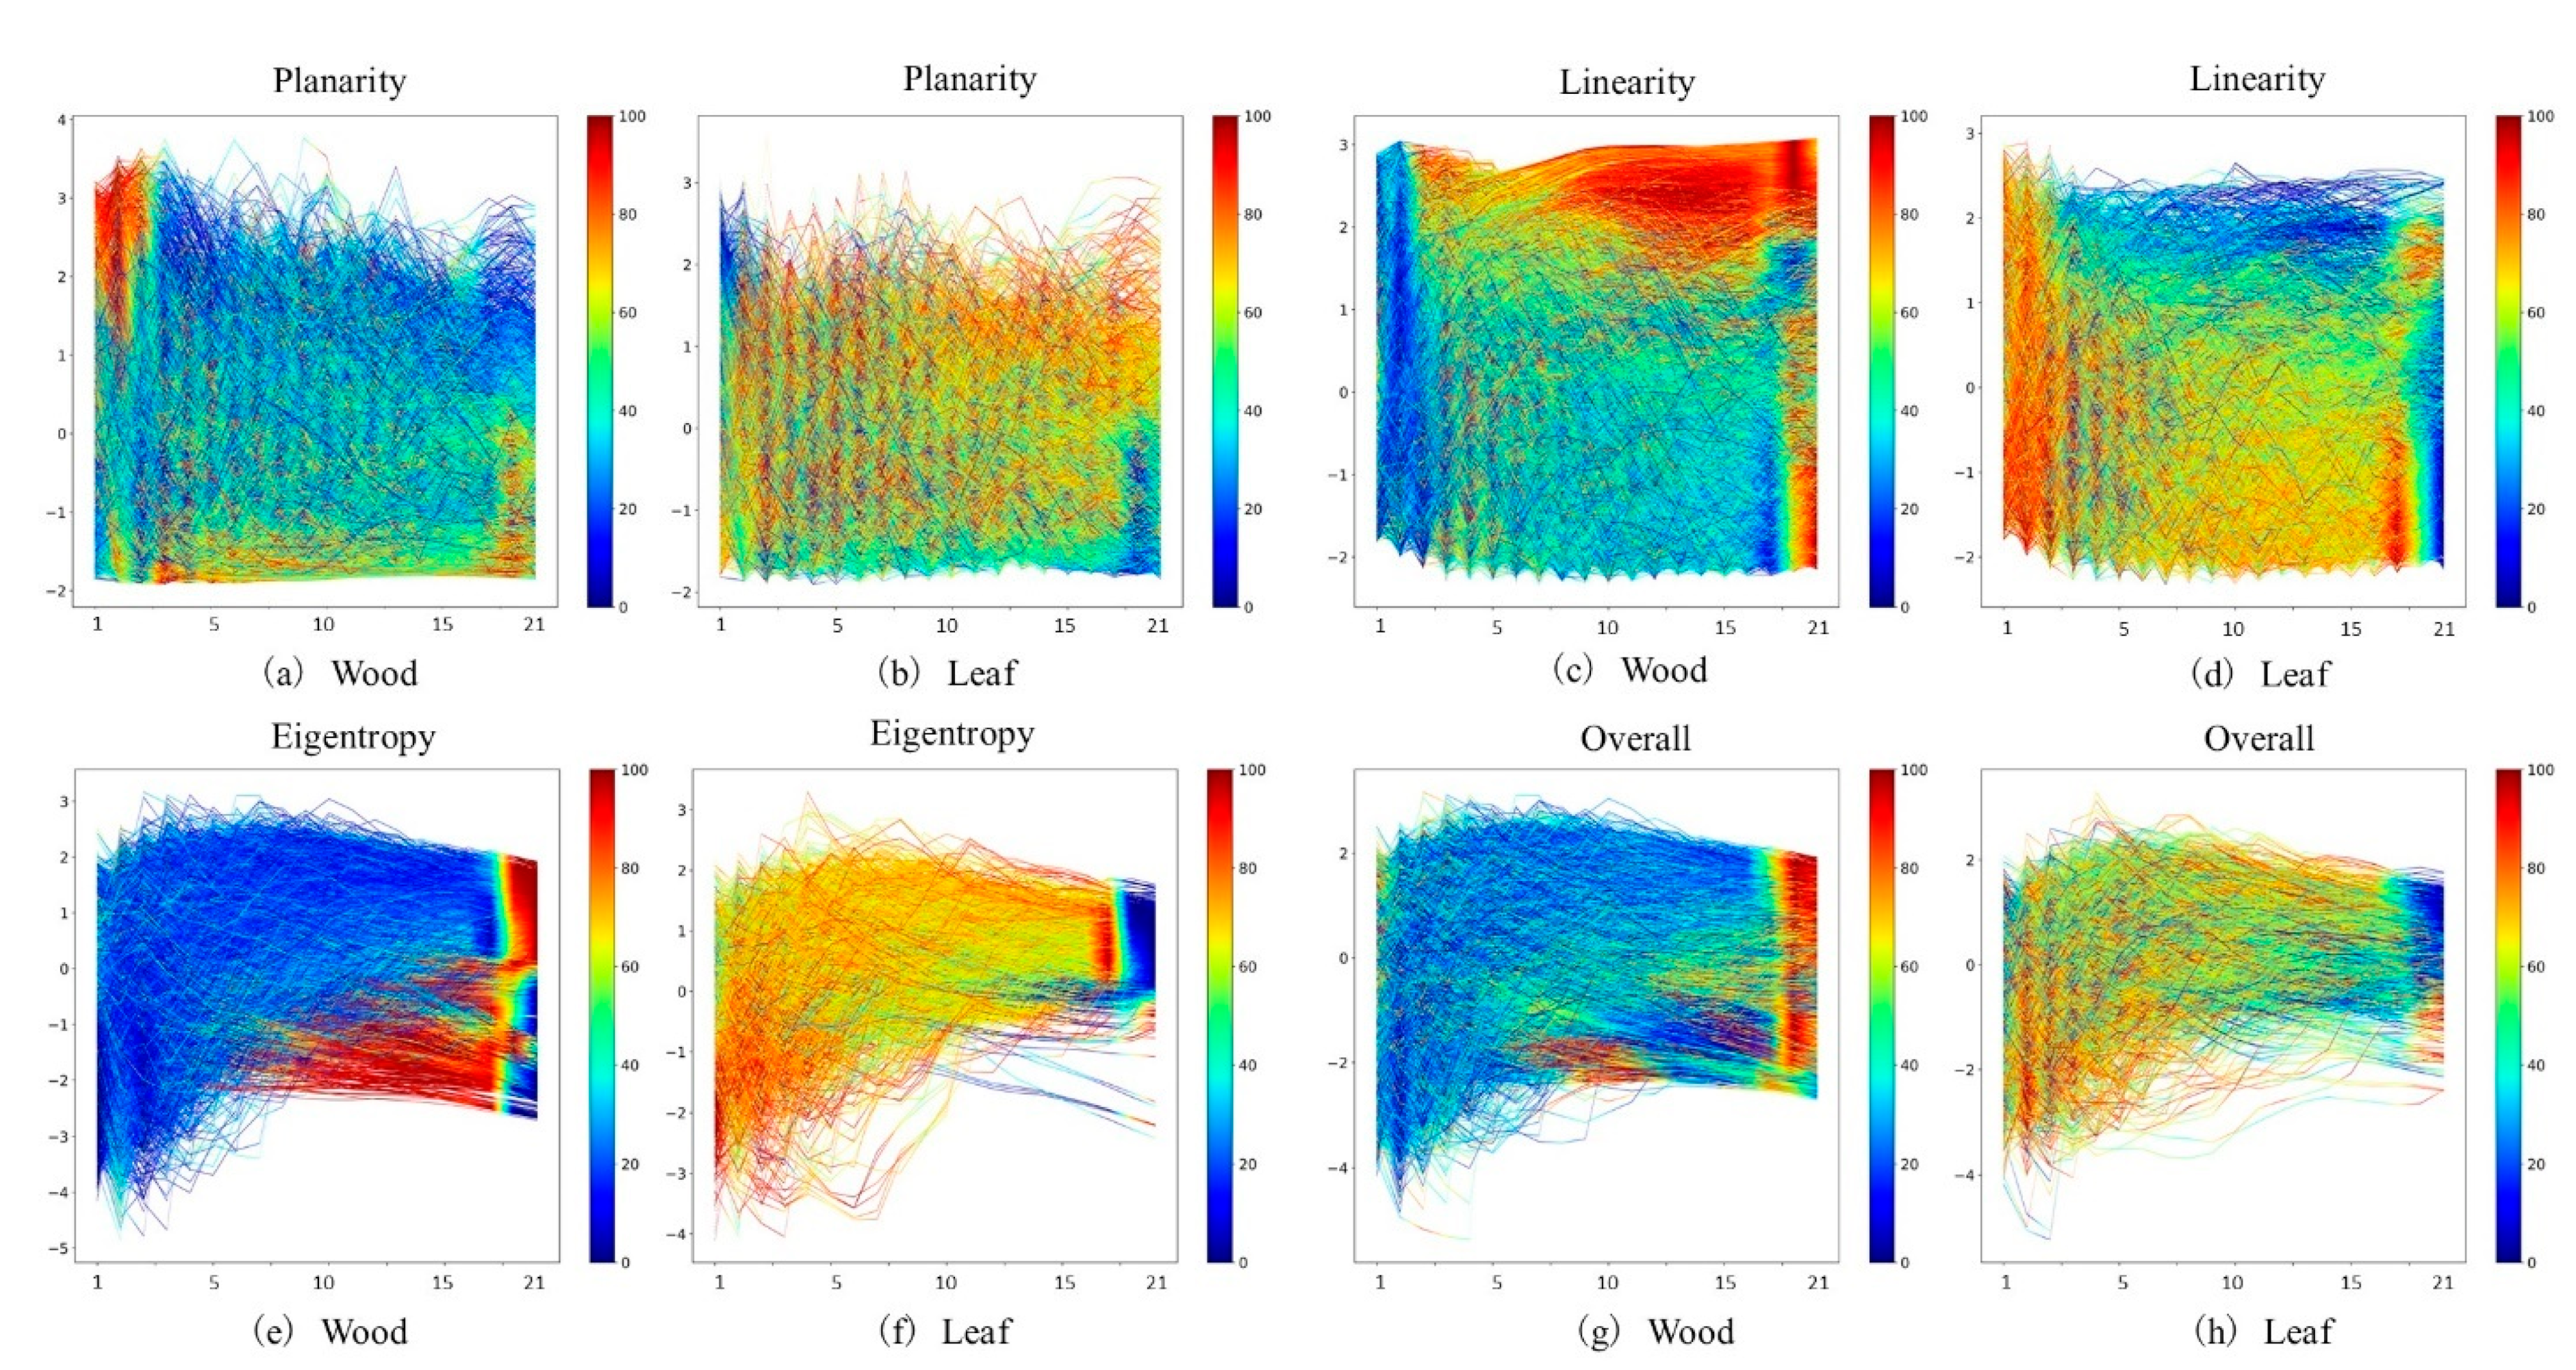
3.2. Class Activation Map

Figure 4 demonstrates the result of applying CAM on the validation data using the UTS and MTS methods on FCN. We observed that the most-contributed regions of the time series for the predicted class were highlighted in a red color, while the blue regions are non-discriminatory. With respect to UTS, the CAM of eigentropy was much firmer than that of planarity and linearity. In other words, the CAM of eigentropy contains darker red and blue regions, demostrating that the eigentropy can filter out the most contributed region with higher confidence than planarity and linearity. When comparing the eigentropy and MTS models, the red subsequence highlighted by the wood class of the MTS model was mainly located in a larger radius (Figure 4g). Conversely, the discriminatory regions of eigentropy can be observed in the middle and larger radius in the wood class of Figure 4e, demonstrating the overlap with the leaf class.

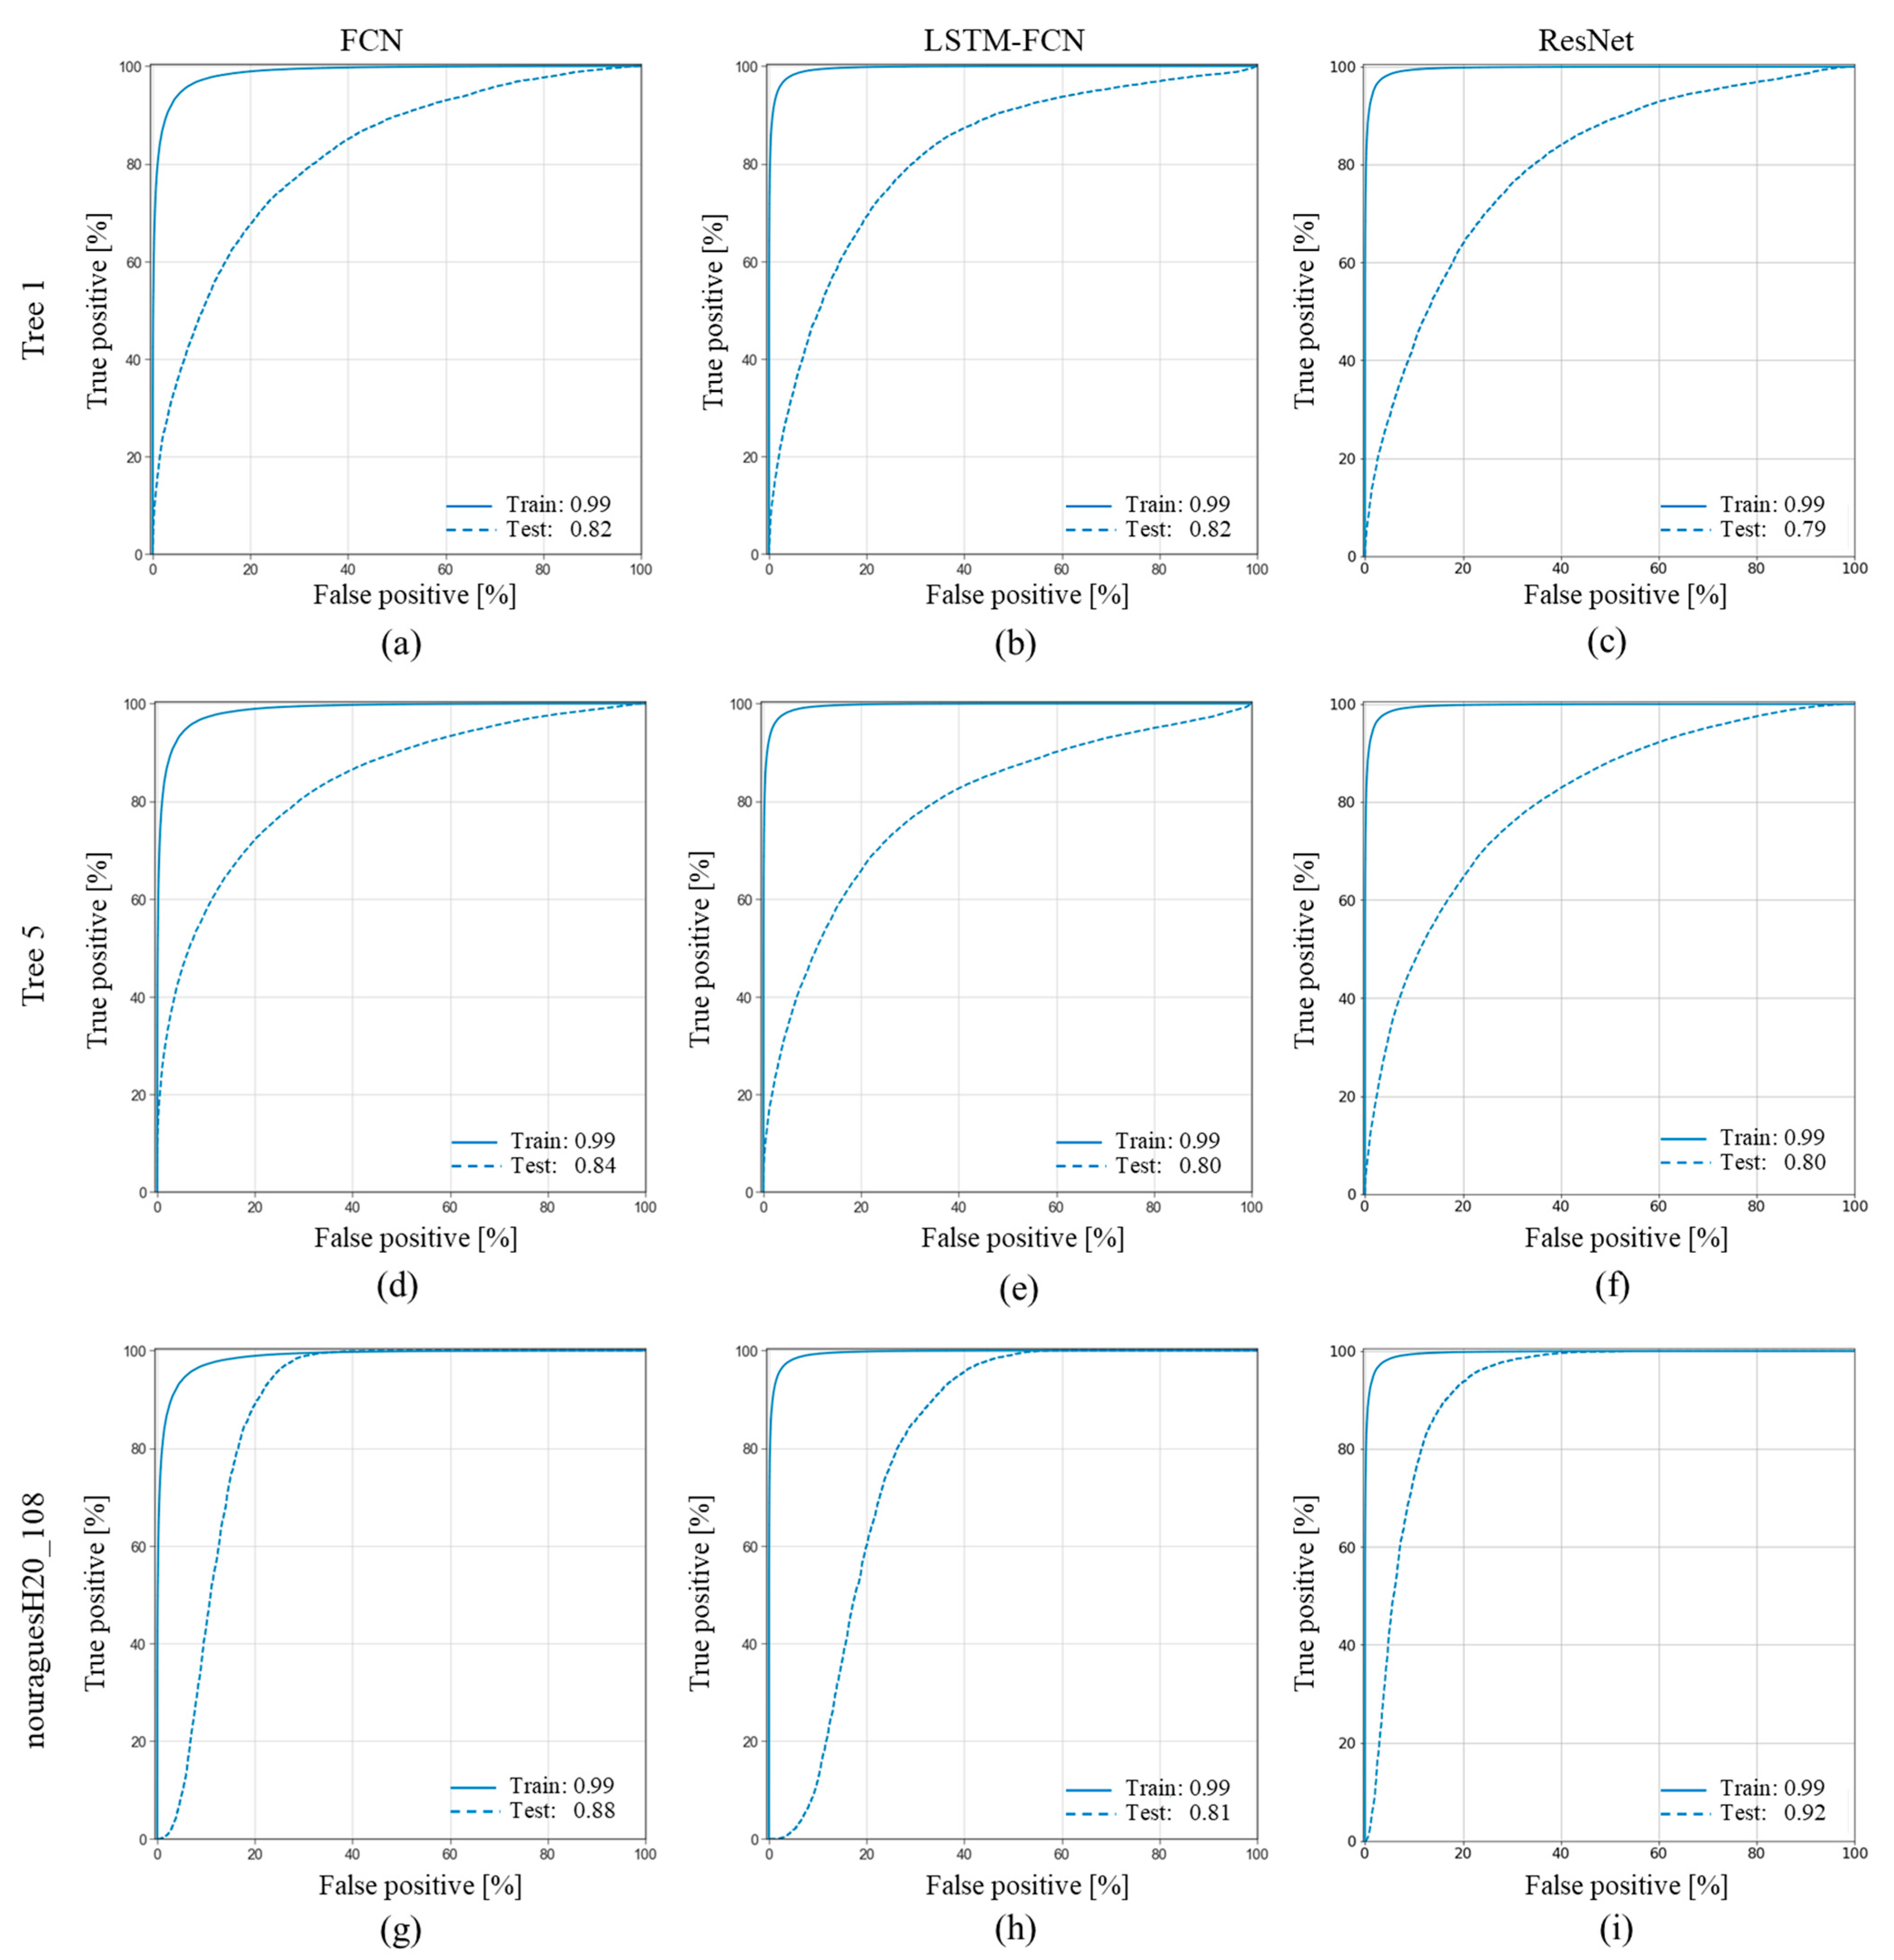
3.3. Model Generalization

Table 4 compares the performance of the MTS model based on FCN, LSTM-FCN, and ResNet on the testing data. We did not find a significant difference between the accuracy of three deep learning networks (FCN vs. LSTM-FCN: t = 0.78, p-value = 0.45; FCN vs. ResNet: t = 1.01, p-value = 0.33; LSTM-FCN vs. ResNet: t = 0.24, p-value = 0.82). FCN generated the highest accuracy and F1 score of leaf and wood, whether for Tree 1 or Tree 5. For example, the overall accuracy of FCN on Tree 5 was 0.78, with F1 score of leaf (0.77) and wood (0.79), while the overall accuracy and F1 score of leaf and wood of LSTM-FCN (0.75, 0.74, and 0.75) and ResNet (0.73, 0.72, and 0.74) were lower. With respect to testing data from [10], all three networks demonstrated relatively poor performance on caxiuanA_117 and pan_33, while they generated the highest accuracy and F1 score on nouragueH20_108.
Figure 5 displays the ROC curves of the MTS model of FCN, LSTM-FCN, and ReNet on Tree 1, Tree 5, and nouraguesH20_108. The area under the ROC curve of the training data was 0.99, indicating the solid discriminatory power of three networks. Although the area under ROC curve of three trees was lower than the training data, most of those areas were higher than 0.80, which still demonstrates the good discriminatory power of three deep learning networks. It should be note that the areas under ROC curve of Tree 1 (0.82, 0.82 and 0.79) and Tree 5 (0.84, 0.80 and 0.80) were similar for FCN, LSTM-FCN, and ResNet. When we evaluated nouraguesH20_108, ReNet (0.92) and FCN (0.88) had a higher area under the ROC curve than LSTM-FCN (0.81).
The prediction of the MTS model based on FCN for Tree 1, Tree 5, and nouragueHs20_108 can be seen in Figure 6. Our visual inspection indicated that FCN could detect most of the big wood structures. Though some parts of the main trunk were misclassified as the leaf in Tree 1, Tree 5, and nouraguesH20_108 (indicated by red square in Figure 6), we can manually correct those misclassified leaf points in the main trunk as wood points for each tree (indicated by red square in Figure 7).

4. Discussion

In this paper, we proposed a time series classification method based on three deep learning networks to separate leaf and woody components of given trees. We also compared the effects of the UTS and MTS methods on the classification results. As indicated in Table 2, the MTS method outperformed the UTS method on the training data. Meanwhile, ResNet spent much more time than FCN and LSTM-FCN in the training model. Moreover, we found the three networks performed similarly on the testing data. Finally, we understood the utilization of the class activation map (CAM) can explain the black-box effect of deep learning networks.

4.1. UTS or MTS

We applied the UTS and MTS methods to separate leaf and woody components of point clouds. Compared with UTS, MTS always demonstrated higher performance on the training data. It is not a surprise since MTS is a finite sequence of the UTS, thus providing more information to help the classification process [21,22]. It also can be observed in Table 3 that the UTS and MTS methods demonstrate similar training time (e.g., ResNet: 487 ± 74 min vs. 553 min) and numbers of epochs (225 ± 34 vs. 255). Therefore, we recommend the MTS method for leaf and wood classification. With respect to the UTS method, the eigentropy (0.82 of FCN, 0.85 of LSTM-FCN, and 0.88 of ResNet) seems to be the most advanced feature for leaf and wood classification, while the overall accuracy of planarity and linearity range from 0.67 to 0.80. Therefore, we believe the eigentropy contributes most to the performance of MTS. The performance of the MTS method may be further improved if more power features like eigentropy are included.
CAM provides a method to understand what deep learning is doing for the time series [20,32]. According to Figure 4, the main contributing regions of planarity for the wood points are located at a small radius, while the linearity for wood points is found in large values. The distribution of wood points across the different radii have been reported in Ma et al. [9] and Zhu et al. [4]. For example, in a smaller radius, the wood points in the main trunk could have a surface distribution, while the point clouds of the trunk are more likely to be linearly distributed at a large radius [9]. CAM also demonstrates that the discriminatory regions of planarity and linearity for both classes are less uniformly distributed than that of the eigentropy and MTS model for two classes. These leaf and wood points demonstrate similar discriminatory areas for planarity and linearity across the radius. This unequal distribution could be the reason for worse performance of the planarity and linearity models. Moorthy et al. [8] applied a geometric approach to classify leaf and woody components from point clouds and found that the geometric properties of the leaves demonstrated similarity with the wood points in long branches in the upper part of a tree. Conversely, the contribution regions’ boundary between leaf and wood in the MTS method is clear. The MTS method combines all features and extracts the most discriminatory regions from the time series, and thus has the highest F1 score and overall accuracy across training data.

4.2. Comparison with Other Leaf-Wood Classification Methods

In this paper, we applied deep learning networks to separate leaf and woody components from the point clouds, which demonstrated superiority to the state-of-art methods for leaf and wood classification in the literature [4,8,9,10]. Generally, those methods are mainly based on machine learning algorithms such as Gaussian mixture models (GMMs), random forest (RF) and boosting. Compared to deep learning algorithms, machine learning algorithms solve problems by decomposing a larger task into small tasks and combining the results. The features used in machine learning need to be accurately and precisely identified by users [18]. For instance, Zhu et al. [4] applied an adaptive radius nearest neighbor search algorithm to drive the optimal radius for each point, and then used RF algorithms to classify leaf and wood, with an average overall accuracy of 70.4%. Ma et al. [9] also conducted a sensitivity analysis to define the optimal radius for each point and then applied GMMs to separate leaf and wood, with an overall accuracy of 95.5%. Moreover, Moorthy et al. [8] investigated the spatial distribution of leaf and wood points using eigenvalues and eigenvectors at five radii, with applied RF and boosting algorithms for classification. The eigenvalues and eigenvectors gave the model an average overall accuracy of 94.2%.
Furthermore, Xi et al. [12] compared the performance of 15 machine learning and deep learning classifiers (i.e., RF, Ada Boost, PointNet, ResNet) on leaf and wood separation. This work computed geometric features of three randomly selected radii, and then combined radiometric features for classification. The results indicated that ResNet was one of the most competitive classifiers among the 15 approaches, while also providing a higher efficiency. In this study, we compared the performance of FCN, LSTM-FCN, and ResNet. As demonstrated in Table 3, ResNet spent much more time than the remaining two networks in developing the model, which means that FCN and LSTM-FCN were more efficient. When evaluating three networks on the testing data, we found FCN, LSTM-FCN, and ResNet performed similarly.
Here, we used the multiple radius search method to obtain the time series of leaf and wood points and input them into deep learning networks to make independent decisions. There is no need for prior knowledge, which means no heavy feature engineering is required to understand the feature distribution for deep learning algorithms. The only preprocessing step needed is standardizing the data. Deep learning algorithms can create new features through their own process and then make predictions [20].

4.3. Model Generalization

Developing a generable and transferable model for forests is one of the main challenges of point cloud classification [8]. Though there are many methods proposed for leaf and wood classification in previous studies, the generalization of those methods is questionable. Moorthy et al. [8] used imbalanced training data to classify leaf and wood, with the wood points accounting for about 15% of all the points. When testing the former method on the independent data, the average wood F1 score of field data was 0.69 (0.79 of FCN here). Wei and Dunbrack [18] demonstrated that the training and testing of models on binary classification problems depends on the fraction of the two classes. In simpler terms, it is not easy to apply a model to independent data from the real world that is similar to the training data based on the fraction of the two classes. Using balanced training data can lead to the highest accuracy, regardless of the fraction of the two classes in the independent data. Although Zhu et al. [4] applied a balanced method for classifying leaf and wood, only 1000 points per class are manually selected from the point clouds, much less than in the methodology applied here. We randomly selected 10% of the total points from each tree, thus creating 320,000 points for training (Table A1). The overall accuracy of Zhu et al.’s methodology [4] by geometric features on validation data was 70.4%, which is lower than our method (0.75 of FCN, see Table 4). Therefore, the presented method in this study has broader applicability than previous methods.
The main advantages of our method are as follows: First, we use a multiple radii search method to obtain a time series of the geometric features, which eliminates the work for a specific radius selection [9]. Second, since we use deep learning models for classification, the model provides an end-to-end network to tackle the problems without heavy crafting on data preprocessing and feature engineering [32]. Third, we take a multivariable time-series strategy coupled with deep learning algorithms to classify leaf and wood, which demonstrates superiority to univariable time series strategy. Fourth, we add global average pooling (GAP) layer on our networks to classify leaf and wood points, enabling the utilization of CAM to reduce the black box effects of deep learning algorithms. Finally, since we use a balanced class for leaf and wood classification, the performance of our method on the independent data is higher than in previous studies [8], which indicates the broader applicability of our proposed model.
The balanced class also brings the limitation of our method; the leaf and wood points are still balanced in the predicted results, which is not the case for the trees in the natural environment [8,9]. Therefore, we manually corrected the misclassified leaf points in the main trunk of the predicted tree, which can be seen in Figure 6 and Figure 7. Postprocessing steps may be needed to further improve the performance of our method; however, the presented leaf/wood separation model based on FCN demonstrated overall accuracies of 0.75, 0.78, and 0.84 on Tree 1, Tree 5, nouraguesH20_108, without any additional postprocessing, which means our model could provide a good starting point for the scientific community to using TLS to measure forest structure. It should be also noted that we do not include needle leaf trees in our study, as broad-leaved and needle leaf trees have different point arrangements. A more careful scanning protocol is needed since needles are often smaller than the footprint of the LiDAR instrument [4,10]. We provide the entire leaf and wood classification procedure as an open-source python package on Github (https://github.com/than2/leafandwood, accessed on 1 July 2022), expecting more researchers to evaluate our methods on other forest types (e.g., needle-leaf trees, dry, and rain forests). Future work could focus on understanding the discriminatory regions of the time series for each class obtained by the CAM. In other words, the CAM may also provide a solid foundation for leaf/wood separation based on traditional machine learning algorithms. For example, machine learning algorithms could use the radius around the discriminatory regions of the time series for each class obtained by CAM to classify leaf and wood, which may help to improve their performance.

5. Conclusions

In this paper, we proposed an automatic deep learning time series method for leaf and wood classification from 3D point clouds. The presented method uses the multiple radius search method to obtain the time series of the geometric features, with the MTS method found to be more robust than the UTS method. Our method eliminates the need for feature engineering, which is a requirement for most literature. Though the multiple radius search method results in high-dimensional data, this can be adequately handled by deep learning algorithms. The CAM of our deep learning time series networks can articulate the contributing region for leaf and wood points, and thus explain how the deep learning networks function. It is not a surprise that the generalization of our model is better than previous studies, since our model builds on and extends previous work. The presented method can help to understand forest structure and provide better estimates of forest structural parameters from TLS data such as LAI, WAI, or leaf area density.

Author Contributions

T.H. and G.A.S.-A. presented and designed the experiments; T.H. carried out the experiments, analyzed the data, and wrote the original paper. G.A.S.-A. contributed to reviewing and editing. All authors have read and agreed to the published version of the manuscript.

Funding

This research was funded by the Chinese Scholarship Council (No. 201806850089), and the National Science and Engineering Research Council of Canada (NSERC) Discovery Grant.

Data Availability Statement

Data used in this study and scripts used for analyses will be archived in the Tropi-Dry Dataverse repository, and the data DOI will be included at the end of the article upon publication. Currently, all files are attached as appendices for review.

Acknowledgments

The LiDAR instrument and data processing workstation were provided by the Center for Earth Observation Sciences (CEOS), University of Alberta. We also thank J. Antonio Guzman Q. for his assistance on data collection. We thank Kalya Stan for proof reading.

Conflicts of Interest

The authors declare no conflict of interest.

Abbreviations

The following abbreviations are used in this manuscript:
LiDARLight detection and ranging
TLSTerrestrial laser scanning
LAILeaf area index
AGBAbove-ground biomass
FCNsFully convolutional neural networks
TSCTime series classification
UTSUnivariable time series
MTSMultivariable time series
CAMClass activation map
NNNeural networks
RFRandom forest
LSTMLong short-term memory
RNNRecurrent neural network
CNNConvolutional neural network
DTWDynamic time warping
PR curvePrecision-recall curve

Appendix A

Trees 2, 3, 4, 6, and 7 were selected as the training data, while the remaining trees (1 and 5) were regarded as the independent data to test the model generalization. The final number of points of the training data is 320,000, and that of the testing data of Tree 1 and Tree 5 is 32,000 and 80,000, respectively.
Table A1. The sample size of seven trees for model training.
Tree IDSample PointsTotal Points
Tree 132,000319,037
Tree 270,000668,950
Tree 396,000947,704
Tree 456,000540,369
Tree 580,000802,740
Tree 632,000302,494
Tree 766,000653,643

Appendix B

There are many hyperparameters when using FCN, LSTM-FCN, and ResNet. The following values were used for those hyperparameters. The number of epochs is equal to 100, and it represents the number of times that the deep learning networks work through the entire training data. The batch size is equal to 256, and this hyperparameter determines the number of samples to work through before updating the parameters of the network. A large batch size would lead to the significant degradation of the performance of the model, while a small batch size means more training time. The range of batch sizes used in this study is 128, 256, 512.
The callbacks in deep learning mean a set of functions that can control the training procedure. We used ReduceLROnPlateau and EarlyStopping to control the learning rate and the number of epochs during the training process. ReduceLROnPlateau means that when the loss of validation stops improving, the learning rate will decrease. We set up the factor, patience, and min_lr as 0.5, 10, and 0.0001, respectively. This indicated that if the validation loss did not improve after ten epochs, the learning rate would decrease by 50% until it reached 0.0001. The patience in EarlyStopping was also equal to 10, which means that if the validation loss did not improve after ten epochs, the training procedure would stop. The verbose was equal to 1, demonstrating the output of our neural network when training the model.

References

  1. Hosoi, F.; Omasa, K. Voxel-Based 3-D Modeling of Individual Trees for Estimating Leaf Area Density Using High-Resolution Portable Scanning Lidar. IEEE Trans. Geosci. Remote Sens. 2006, 44, 3610–3618. [Google Scholar] [CrossRef]
  2. Béland, M.; Widlowski, J.L.; Fournier, R.A.; Côté, J.F.; Verstraete, M.M. Estimating Leaf Area Distribution in Savanna Trees from Terrestrial LiDAR Measurements. Agric. For. Meteorol. 2011, 151, 1252–1266. [Google Scholar] [CrossRef]
  3. Tao, S.; Guo, Q.; Xu, S.; Su, Y.; Li, Y.; Wu, F. A Geometric Method for Wood-Leaf Separation Using Terrestrial and Simulated Lidar Data. Photogramm. Eng. Remote Sens. 2015, 81, 767–776. [Google Scholar] [CrossRef]
  4. Zhu, X.; Skidmore, A.K.; Darvishzadeh, R.; Niemann, K.O.; Liu, J.; Shi, Y.; Wang, T. Foliar and Woody Materials Discriminated Using Terrestrial LiDAR in a Mixed Natural Forest. Int. J. Appl. Earth Obs. Geoinf. 2018, 64, 43–50. [Google Scholar] [CrossRef]
  5. Calders, K.; Adams, J.; Armston, J.; Bartholomeus, H.; Bauwens, S.; Bentley, L.P.; Chave, J.; Danson, F.M.; Demol, M.; Disney, M.; et al. Terrestrial Laser Scanning in Forest Ecology: Expanding the Horizon. Remote Sens. Environ. 2020, 251, 112102. [Google Scholar] [CrossRef]
  6. Disney, M.I.; Boni Vicari, M.; Burt, A.; Calders, K.; Lewis, S.L.; Raumonen, P.; Wilkes, P. Weighing Trees with Lasers: Advances, Challenges and Opportunities. Interface Focus 2018, 8, 20170048. [Google Scholar] [CrossRef] [Green Version]
  7. Calders, K.; Newnham, G.; Burt, A.; Murphy, S.; Raumonen, P.; Herold, M.; Culvenor, D.; Avitabile, V.; Disney, M.; Armston, J.; et al. Nondestructive Estimates of Above-Ground Biomass Using Terrestrial Laser Scanning. Methods Ecol. Evol. 2015, 6, 198–208. [Google Scholar] [CrossRef]
  8. Moorthy, S.M.; Calders, K.; Vicari, M.B.; Verbeeck, H. Improved Supervised Learning-Based Approach for Leaf and Wood Classification from LiDAR Point Clouds of Forests. IEEE Trans. Geosci. Remote Sens. 2020, 58, 3057–3070. [Google Scholar] [CrossRef] [Green Version]
  9. Ma, L.; Zheng, G.; Eitel, J.U.H.; Moskal, L.M.; He, W.; Huang, H. Improved Salient Feature-Based Approach for Automatically Separating Photosynthetic and Nonphotosynthetic Components within Terrestrial Lidar Point Cloud Data of Forest Canopies. IEEE Trans. Geosci. Remote Sens. 2016, 54, 679–696. [Google Scholar] [CrossRef]
  10. Vicari, M.B.; Disney, M.; Wilkes, P.; Burt, A.; Calders, K.; Woodgate, W. Leaf and Wood Classification Framework for Terrestrial LiDAR Point Clouds. Methods Ecol. Evol. 2019, 10, 680–694. [Google Scholar] [CrossRef] [Green Version]
  11. Béland, M.; Baldocchi, D.D.; Widlowski, J.L.; Fournier, R.A.; Verstraete, M.M. On Seeing the Wood from the Leaves and the Role of Voxel Size in Determining Leaf Area Distribution of Forests with Terrestrial LiDAR. Agric. For. Meteorol. 2014, 184, 82–97. [Google Scholar] [CrossRef]
  12. Xi, Z.; Hopkinson, C.; Rood, S.B.; Peddle, D.R. See the Forest and the Trees: Effective Machine and Deep Learning Algorithms for Wood Filtering and Tree Species Classification from Terrestrial Laser Scanning. ISPRS J. Photogramm. Remote Sens. 2020, 168, 1–16. [Google Scholar] [CrossRef]
  13. Belton, D.; Moncrieff, S.; Chapman, J. Processing Tree Point Clouds Using Gaussian Mixture Models. ISPRS Ann. Photogramm. Remote Sens. Spat. Inf. Sci. 2013, 2, 43–48. [Google Scholar] [CrossRef] [Green Version]
  14. Thomas, H.; Goulette, F.; Deschaud, J.-E.; Marcotegui, B.; LeGall, Y. Semantic Classification of 3D Point Clouds with Multiscale Spherical Neighborhoods. In Proceedings of the 2018 International Conference on 3D Vision (3DV), Verona, Italy, 5–8 September 2018; pp. 390–398. [Google Scholar]
  15. Joaquin, Q.-C.; Masashi, S.; Anton, S.; Lawrence, N.D. Dataset Shift in Machine Learning; Quiñonero-Candela, J., Sugiyama, M., Schwaighofer, A., Lawrence, N.D., Eds.; The MIT Press: Cambridge, MA, USA, 2008; ISBN 9780262170055. [Google Scholar]
  16. Wei, Q.; Dunbrack, R.L. The Role of Balanced Training and Testing Data Sets for Binary Classifiers in Bioinformatics. PLoS ONE 2013, 8, e67863. [Google Scholar] [CrossRef] [PubMed] [Green Version]
  17. LeCun, Y.; Bengio, Y.; Hinton, G. Deep Learning. Nature 2015, 521, 436–444. [Google Scholar] [CrossRef] [PubMed]
  18. Dargan, S.; Kumar, M.; Ayyagari, M.R.; Kumar, G. A Survey of Deep Learning and Its Applications: A New Paradigm to Machine Learning. Arch. Comput. Methods Eng. 2020, 27, 1071–1092. [Google Scholar] [CrossRef]
  19. Qi, C.R.; Yi, L.; Su, H.; Guibas, L.J. PointNet++: Deep Hierarchical Feature Learning on Point Sets in a Metric Space. Adv. Neural Inf. Process. Syst. 2017, 30, 5105–5114. [Google Scholar]
  20. Fawaz, I.H.; Forestier, G.; Weber, J.; Idoumghar, L.; Muller, P.A. Deep Learning for Time Series Classification: A Review. Data Min. Knowl. Discov. 2019, 33, 917–963. [Google Scholar] [CrossRef] [Green Version]
  21. Wang, L.; Wang, Z.; Liu, S. An Effective Multivariate Time Series Classification Approach Using Echo State Network and Adaptive Differential Evolution Algorithm. Expert Syst. Appl. 2016, 43, 237–249. [Google Scholar] [CrossRef]
  22. Zheng, Y.; Liu, Q.; Chen, E.; Ge, Y.; Zhao, J.L. Exploiting Multi-Channels Deep Convolutional Neural Networks for Multivariate Time Series Classification. Front. Comput. Sci. 2016, 10, 96–112. [Google Scholar] [CrossRef]
  23. Esling, P.; Agon, C. Time-Series Data Mining. ACM Comput. Surv. 2012, 45, 1–34. [Google Scholar] [CrossRef] [Green Version]
  24. Liu, J.; Wu, Y.; Gao, X.; Zhang, X. A Simple Method of Mapping Landslides Runout Zones Considering Kinematic Uncertainties. Remote Sens. 2022, 14, 668. [Google Scholar] [CrossRef]
  25. Rajkomar, A.; Oren, E.; Chen, K.; Dai, A.M.; Hajaj, N.; Hardt, M.; Liu, P.J.; Liu, X.; Marcus, J.; Sun, M.; et al. Scalable and Accurate Deep Learning with Electronic Health Records. NDJ Digit. Med. 2018, 1, 18. [Google Scholar] [CrossRef]
  26. Nweke, H.F.; Teh, Y.W.; Al-garadi, M.A.; Alo, U.R. Deep Learning Algorithms for Human Activity Recognition Using Mobile and Wearable Sensor Networks: State of the Art and Research Challenges. Expert Syst. Appl. 2018, 105, 233–261. [Google Scholar] [CrossRef]
  27. Mehdiyev, N.; Lahann, J.; Emrich, A.; Enke, D.; Fettke, P.; Loos, P. Time Series Classification Using Deep Learning for Process Planning: A Case from the Process Industry. Procedia Comput. Sci. 2017, 114, 242–249. [Google Scholar] [CrossRef]
  28. Lines, J.; Bagnall, A. Time Series Classification with Ensembles of Elastic Distance Measures. Data Min. Knowl. Discov. 2015, 29, 565–592. [Google Scholar] [CrossRef]
  29. Keogh, E.; Ratanamahatana, C.A. Exact Indexing of Dynamic Time Warping. Knowl. Inf. Syst. 2005, 7, 358–386. [Google Scholar] [CrossRef]
  30. Bagnall, A.; Lines, J.; Bostrom, A.; Large, J.; Keogh, E. The Great Time Series Classification Bake off: A Review and Experimental Evaluation of Recent Algorithmic Advances. Data Min. Knowl. Discov. 2017, 31, 606–660. [Google Scholar] [CrossRef] [Green Version]
  31. Baydogan, M.G.; Runger, G.; Tuv, E. A Bag-of-Features Framework to Classify Time Series. IEEE Trans. Pattern Anal. Mach. Intell. 2013, 35, 2796–2802. [Google Scholar] [CrossRef]
  32. Wang, Z.; Yan, W.; Oate, T. Time Series Classification from Scratch with Deep Neural Networks: A Strong Baseline. In Proceedings of the 2017 International Joint Conference on Neural Networks (IJCNN), Anchorage, AK, USA, 14–19 May 2017; pp. 1578–1585. [Google Scholar] [CrossRef] [Green Version]
  33. Wang, P.; Wang, L.; Leung, H.; Zhang, G. Super-Resolution Mapping Based on Spatial-Spectral Correlation for Spectral Imagery. IEEE Trans. Geosci. Remote Sens. 2021, 59, 2256–2268. [Google Scholar] [CrossRef]
  34. Xu, X.; Chen, Y.; Zhang, J.; Chen, Y.; Anandhan, P.; Manickam, A. A Novel Approach for Scene Classification from Remote Sensing Images Using Deep Learning Methods. Eur. J. Remote Sens. 2021, 54, 383–395. [Google Scholar] [CrossRef]
  35. Dou, P.; Shen, H.; Li, Z.; Guan, X. Time Series Remote Sensing Image Classification Framework Using Combination of Deep Learning and Multiple Classifiers System. Int. J. Appl. Earth Obs. Geoinf. 2021, 103, 102477. [Google Scholar] [CrossRef]
  36. Antonio Guzmán, Q.J.; Sharp, I.; Alencastro, F.; Sánchez-Azofeifa, G.A. On the Relationship of Fractal Geometry and Tree–Stand Metrics on Point Clouds Derived from Terrestrial Laser Scanning. Methods Ecol. Evol. 2020, 11, 1309–1318. [Google Scholar] [CrossRef]
  37. Wang, Z.; Zhang, L.; Fang, T.; Mathiopoulos, P.T.; Tong, X.; Qu, H.; Xiao, Z.; Li, F.; Chen, D. A Multiscale and Hierarchical Feature Extraction Method for Terrestrial Laser Scanning Point Cloud Classification. IEEE Trans. Geosci. Remote Sens. 2015, 53, 2409–2425. [Google Scholar] [CrossRef]
  38. Wang, D.; Hollaus, M.; Pfeifer, N. Feasibility of Machine Learning Methods for Separating Wood and Leaf Points from Terrestrial Laser Scanning Data. ISPRS Ann. Photogramm. Remote Sens. Spat. Inf. Sci. 2017, 4, 157–164. [Google Scholar] [CrossRef] [Green Version]
  39. van Kuppevelt, D.; Meijer, C.; Huber, F.; van der Ploeg, A.; Georgievska, S.; van Hees, V.T. Mcfly: Automated Deep Learning on Time Series. SoftwareX 2020, 12, 100548. [Google Scholar] [CrossRef]
  40. Oguiza, I. Tsai-A State-of-the-Art Deep Learning Library for Time Series and Sequential Data. Retrieved April 2020, 20, 2021. [Google Scholar]
  41. Burt, A.; Disney, M.; Calders, K. Extracting Individual Trees from Lidar Point Clouds Using Treeseg. Methods Ecol. Evol. 2019, 10, 438–445. [Google Scholar] [CrossRef] [Green Version]
  42. Ruiz, A.P.; Flynn, M.; Large, J.; Middlehurst, M.; Bagnall, A. The Great Multivariate Time Series Classification Bake off: A Review and Experimental Evaluation of Recent Algorithmic Advances. Data Min. Knowl. Discov. 2021, 35, 401–449. [Google Scholar] [CrossRef]
  43. Ordóñez, F.J.; Roggen, D. Deep Convolutional and LSTM Recurrent Neural Networks for Multimodal Wearable Activity Recognition. Sensors 2016, 16, 115. [Google Scholar] [CrossRef] [Green Version]
  44. Gamboa, J.C.B. Deep Learning for Time-Series Analysis. arXiv 2017, arXiv:1701.01887. [Google Scholar]
  45. Karim, F.; Majumdar, S.; Darabi, H.; Harford, S. Multivariate LSTM-FCNs for Time Series Classification. Neural Netw. 2019, 116, 237–245. [Google Scholar] [CrossRef] [Green Version]
  46. Lin, M.; Chen, Q.; Yan, S. Network in Network. In Proceedings of the ICLR 2014 2nd International Conference on Learning Representations, Banff, AB, Canada, 14–16 April 2014; pp. 1–10. [Google Scholar]
  47. Hochreiter, S.; Schmidhuber, J. Long Short-Term Memory. Neural Comput. 1997, 9, 1735–1780. [Google Scholar] [CrossRef]
  48. Karim, F.; Majumdar, S.; Darabi, H.; Chen, S. LSTM Fully Convolutional Networks for Time Series Classification. IEEE Access 2017, 6, 1662–1669. [Google Scholar] [CrossRef]
  49. He, K.; Zhang, X.; Ren, S.; Sun, J. Deep Residual Learning for Image Recognition. Indian J. Chem.-Sect. B Org. Med. Chem. 2015, 45, 1951–1954. [Google Scholar] [CrossRef]
  50. Zhou, B.; Khosla, A.; Lapedriza, A.; Oliva, A.; Torralba, A. Learning Deep Features for Discriminative Localization. In Proceedings of the IEEE Conference on Computer Vision and Pattern Recognition, Las Vegas, NV, USA, 27–30 June 2016; pp. 2921–2929. [Google Scholar] [CrossRef] [Green Version]
  51. van Laarhoven, T. L2 Regularization versus Batch and Weight Normalization. arXiv 2017, arXiv:1706.05350. [Google Scholar]
  52. Rhys, H.I. Machine Learning with R, the Tidyverse, and Mlr; Manning: Shelter Island, NY, USA, 2020; ISBN 9781617296574. [Google Scholar]
  53. Kingma, D.P.; Ba, J. Adam: A Method for Stochastic Optimization. In Proceedings of the 3rd International Conference on Learning Representations, ICLR 2015, San Diego, CA, USA, 7–9 May 2015; pp. 1–15. [Google Scholar]
  54. Smith, L.N. A Disciplined Approach to Neural Network Hyper-Parameters: Part 1—Learning Rate, Batch Size, Momentum, and Weight Decay. arXiv 2018, arXiv:1803.09820. [Google Scholar]
  55. Raskutti, G.; Wainwright, M.J.; Yu, B. Early Stopping and Non-Parametric Regression: An Optimal Data-Dependent Stopping Rule. J. Mach. Learn. Res. 2013, 15, 335–366. [Google Scholar]
Figure 1. Trees obtained after registering the point clouds under the two phenological conditions. Color points: leaf. Gray points: wood.
Remotesensing 14 03157 g001
Figure 2. The network structure of FCN (a), LSTM-FCN (b), and ResNet (c); feature extractor: block with a convolutional layer plus a batch normalization (BN) layer and a ReLU activation function; output layer: global average pooling with a sigmoid activation function.
Remotesensing 14 03157 g002
Figure 3. Time series of a leaf (a) and wood (b) point from a cloud using multiple radius nearest neighbors; eet: eigentropy; pln: planarity; lnr: linearity; the Y-axis is the standardized value of each feature; the X-axis is the timesteps of radius; here we have 20 radius or timesteps, then the value of X ranges from 1 to 21.
Remotesensing 14 03157 g003
Figure 4. Class Activation Map (CAM) of univariable (UTS) and multivariable time series (MTS) using fully convolutional networks (FCN) on the validation data; (a) CAM of Planarity on Wood, (b) CAM of Planarity on Leaf, (c) CAM of Linearity on Wood, (d) CAM of Linearity on Leaf, (e) CAM of Eigentropy on Wood, (f) CAM of Eigentropy on Leaf, (g) CAM of Overall on Wood, (h) CAM of Overall on Leaf.
Remotesensing 14 03157 g004
Figure 5. Receiver operating characteristic (ROC) curve for training data and testing data (Tree 1, Tree 5, and nouraguesH20_108) using multivariable time series (MTS) method based on FCN, LSTM-FCN, and ResNet; (a) FCN on Tree 1, (b) LSTM-FCN on Tree 1, (c) ResNet on Tree 1, (d) FCN on Tree 5, (e) LSTM-FCN on Tree 5, (f) ResNet on Tree 5, (g) FCN on nouraguesH20_108, (h) LSTM-FCN on nouraguesH20_108, (i) ResNet on nouraguesH20_108.
Remotesensing 14 03157 g005
Figure 6. The multivariable time series (MTS) model of fully convolutional networks (FCN) prediction for Tree 1 (a), Tree 5 (b), and nouraguesH20_108 (c); the red square highlights the misclassified areas. Green: leaf points. Brown: woody points.
Remotesensing 14 03157 g006
Figure 7. The multivariable time series (MTS) model of fully convolutional networks (FCN) prediction for Tree 1 (a), Tree 5 (b), and nouragueH20_108 (c) after manual intervention; the red square highlights the area where we make manual intervention.
Remotesensing 14 03157 g007
Table 1. Three geometric features extracted from the point clouds, λ represents eigenvalues.
FeatureNameEquation
1Planarity( λ 2 λ 3 ) / λ 1
2Linearity( λ 1 λ 2 ) / λ 1
3Eigentropy n = 1 3 λ n   *   l o g ( λ n )
Table 2. Comparison of univariable (UTS) and multivariable time series (MTS) model on FCN, LSTM-FCN, and ResNet using Precision, Recall, F1 score, and Accuracy for training data; Accuracy means the corrected classified leaf and wood points against the total points (UTS: Planarity; Linearity; Eigentropy, MTS: Overall).
FCNLSTM-FCNResNet
MethodAccuracyF1 Score
(Leaf)
F1 Score
(Wood)
AccuracyF1 Score
(Leaf)
F1 Score
(Wood)
AccuracyF1 Score
(Leaf)
F1 Score
(Wood)
Planarity0.67 ± 0.010.67 ± 0.070.66 ± 0.040.74 ± 0.000.74 ± 0.000.74 ± 0.010.80 ± 0.010.80 ± 0.010.80 ± 0.01
Linearity0.69 ± 0.020.65 ± 0.070.72 ± 0.020.76 ± 0.010.76 ± 0.010.76 ± 0.010.79 ± 0.010.79 ± 0.010.79 ± 0.01
Eigentropy0.82 ± 0.010.81 ± 0.010.82 ± 0.020.85 ± 0.010.85 ± 0.010.85 ± 0.010.88 ± 0.010.87 ± 0.010.88 ± 0.01
MTS0.92 ± 0.010.92 ± 0.000.92 ± 0.010.96 ± 0.010.96 ± 0.000.96 ± 0.000.96 ± 0.010.96 ± 0.010.96 ± 0.01
Table 3. The number of epochs and training time of univariable (UTS) and multivariable time series (MTS) model for FCN, LSMT-FCN, and ResNet; the number of epochs is the sum of the epochs of the fivefold cross-validation method; average is the mean of the number of epochs and training time of the three UTS methods (UTS: Planarity; Linearity; Eigentropy, MTS: Overall).
FCNLSTM-FCNResNet
MethodEpochsTime (Minutes)EpochsTime (Minutes)EpochsTime (Minutes)
Planarity2277422229253548
Linearity2267533545187405
Eigentropy1595423430234508
Average 204 ± 3968 ± 12264 ± 6235 ± 9225 ± 34487 ± 74
MTS1856222354255553
Table 4. The performance of multivariable time series (MTS) of FCN, LSTM-FCN, and ResNet on independent data; accuracy means the corrected classified leaf and wood points against the total points (Ave, average; Sd, standard derivation).
FCNLSTM-FCNResNet
Tree NameAccuracyF1 Score
(Leaf)
F1 Score
(Wood)
AccuracyF1 Score
(Leaf)
F1 Score
(Wood)
AccuracyF1 Score
(Leaf)
F1 Score
(Wood)
Tree 10.750.760.750.740.720.760.730.710.75
Tree 50.780.770.790.750.740.750.730.720.74
alice_10.760.750.830.730.720.690.650.660.64
alice_20.810.810.810.740.740.740.770.760.78
alice_30.790.780.810.750.740.780.780.770.82
caxiuanA_1170.610.520.760.630.590.760.660.600.78
nouraguresH20_1080.840.840.850.820.810.850.780.790.80
Pan_330.670.640.710.630.590.690.630.580.76
Ave ± Sd0.75 ± 0.080.73 ± 0.100.79 ± 0.050.72 ± 0.060.71 ± 0.080.75 ± 0.050.72 ± 0.060.70 ± 0.080.76 ± 0.06
Publisher’s Note: MDPI stays neutral with regard to jurisdictional claims in published maps and institutional affiliations.

