
The Different Impacts of Climate Variability and Human Activities on NPP in the Guangdong–Hong Kong–Macao Greater Bay Area

1
School of Culture Tourism and Geography, Guangdong University of Finance and Economics, Guangzhou 510320, China
2
Southern Marine Science and Engineering Guangdong Laboratory, Guangzhou 511458, China
3
South China Institute of Environmental Sciences, Ministry of Environmental Protection, Guangzhou 510655, China
4
State Environmental Protection Key Laboratory of Urban Ecological Simulation and Protection, Guangzhou 510655, China
5
School of Geography and Remote Sensing, Guangzhou University, Guangzhou 510006, China
*
Author to whom correspondence should be addressed.
Remote Sens. 2022, 14(12), 2929; https://doi.org/10.3390/rs14122929
Submission received: 17 May 2022
/
Revised: 13 June 2022
/
Accepted: 14 June 2022
/
Published: 19 June 2022
(This article belongs to the Special Issue Recent Advances in Terrestrial Vegetation Productivity with Remote Sensing Techniques)
Abstract
:As two main drivers of vegetation dynamics, climate variability and human activities greatly influence net primary productivity (NPP) variability by altering the hydrothermal conditions and biogeochemical cycles. Therefore, studying NPP variability and its drivers is crucial to understanding the patterns and mechanisms that sustain regional ecosystem structures and functions under ongoing climate variability and human activities. In this study, three indexes, namely the potential NPP (NPPp), actual NPP (NPPa), and human-induced NPP (NPPh), and their variability from 2000 to 2020 in the Guangdong–Hong Kong–Macao Greater Bay Area (GBA) were estimated and analyzed. Six main scenarios were generated based on change trends in the three indexes over the past 21 years, and the different relative impacts of climate variability and human activities on NPPa variability were quantitatively analyzed and identified. The results showed that the NPPp, NPPa, and NPPh had heterogeneous spatial distributions, and the average NPPp and NPPa values over the whole study area increased at rates of 3.63 and 6.94 gC·m−2·yr−1 from 2000 to 2020, respectively, while the NPPh decreased at a rate of −4.43 gC·m−2·yr−1. Climate variability and the combined effects of climate variability and human activities were the major driving factors of the NPPa increases, accounting for more than 72% of the total pixels, while the combined effects of the two factors caused the NPPa values to increase by 32–54% of the area in all cities expect Macao and across all vegetation ecosystems. Human activities often led to decreases in NPPa over more than 16% of the total pixels, and were mainly concentrated in the central cities of the GBA. The results can provide a reference for understanding NPP changes and can offer a theoretical basis for implementing ecosystem restoration, ecological construction, and conservation practices in the GBA.
1. Introduction
As a significant component and core cycle link in terrestrial ecosystems, vegetation plays an irreplaceable role in mediating the global carbon balance and reducing greenhouse gases such as CO2 in the atmosphere [1]. The net primary productivity (NPP) represents the organic matter accumulated by green plants per unit of time and area [2]. It is an important indicator for assessing the growth status of vegetation. It can also effectively indicate plant community productivity in specific environments, and is an indispensable index for measuring the ecosystem health and carbon balance at both local and global scales [3,4,5]. The NPP’s temporal and spatial variability depends largely on the complex interactions between the vegetation, soil, and climate variables, and it is also heavily influenced by human interference, making it an indispensable variable for both climate and environmental changes.
Climate variability and human activities are critical drivers of vegetation dynamics. Climate variability affects NPP changes by regulating plant metabolic processes [6], and it can even alter regional vegetation types over the long term [7]. Many studies have explored the impacts of climate variability on terrestrial ecosystems at the regional, national, or global scale, examining how the vegetation NPP responds [4,8]. Nemani [9] suggested that the global NPP increased by 3.4 petagrams of carbon from 1982 to 1999 after climate variability eased several critical climatic constraints on plant growth. Sullivan [10] found that global warming can promote NPP increases in ecosystems by increasing photosynthesis and plant growth rates; however, sustained high temperatures will enhance respiration and evapotranspiration, causing plants to consume more water and slowing down the rate of the increase in vegetation productivity [11]. Zhu [8] suggested that temperature, radiation, and precipitation were the main climate variables affecting the vegetation NPP, and that each limit NPP variability in time and place. Admittedly, climate variability is considered to be the main factor influencing NPP patterns in plant communities at the global scale, although the mechanisms involved are complicated [4,12].
Human activities also play a crucial role in vegetation dynamics because they can dramatically influence the biogeochemical cycles, soil quality, and hydrothermal conditions [13,14,15]. As a significant human-induced interference, land use–land cover (LULC) change is an unavoidable product of population growth and socio-economic development that alters the structure and functions of natural ecosystems [16], particularly in cities that are rapidly expanding [15,17,18]. Usually, LULC change caused by human activities is accompanied by considerable carbon emissions through factors such as increases in local fossil fuel usage and industrial processes, the transformation from vegetated to unvegetated land, and impervious surface expansion [15,19], which in turn inhibit carbon accumulation. Numerous studies have found that human activities often negatively affect NPP because the carbon fixing potential drops considerably when natural landscapes are converted to impervious surfaces [16,17,18]. It has been estimated that the potential photosynthetic capacity of global ecosystems has reduced by 5% over the last two centuries due to LULC change [20], and about 1.6 ± 0.7 Pg C (1 Pg = 1015 g) per year was released into the atmosphere in the 1980s as a result of human-induced land cover change [21]. Furthermore, human activities may further amplify the effects of climate variability on the environment and ecosystem structure and function [22], leading to severe ecosystem degradation [23]. With accelerating urbanization, the influences of LULC change caused by human activities on NPP are significant for the regional carbon balance and should be further investigated. However, the positive impacts of human activities on vegetation should not be ignored; for example, afforestation, ecological restoration, and ecological transformation not only directly increase vegetation coverage, but also enhance ecosystem resilience, all of which will result in significant ecosystem productivity increases [24].
Above all, both climate variability and human activities have significant impacts on ecosystem and vegetation productivity over time and space [25,26]; however, the mechanisms of these effects are very complex. In particular, the strong interactions between humans and the environment produce an intricate overlay of impacts on terrestrial ecosystems. It is essential to elucidate the effects of climate variability and human activities on NPP dynamics, especially in areas with complex natural regional structures, typical climatic characteristics, and high-intensity human interferences, such as urban agglomerations. Many methods and models have been developed to distinguish and quantify the relative influences of climate variability and human activities on NPP. The climatic productivity and light use efficiency (LUE) models have been widely applied to calculate the potential and actual NPP to compare the NPP dynamics and its mechanisms under climatic and human conditions [14,27,28]. Alternatively, a method that compares the residual trends between the actual and potential NPP at the pixel level has been widely applied to distinguish between climate variability and human-induced NPP dynamics [23,29]. This approach was effective in quantifying and discriminating the relative effects of climate variability and human activities on vegetation productivity [23,30].
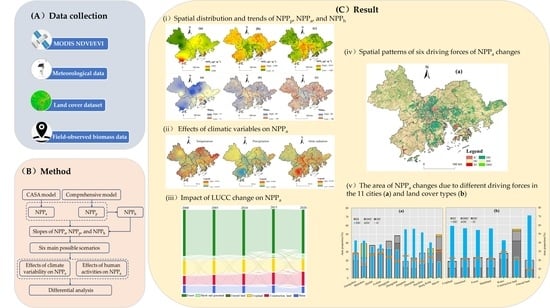
As a world-famous greater bay area, the Guangdong–Hong Kong–Macao Greater Bay Area (GBA) is one of the most populous, urbanized, and economically developed coastal regions in China. The GBA has experienced rapid population growth, economic increases, and urbanization since China’s reforms and opening-up. At the same time, the environmental elements, structures, and functions in the GBA have also experienced dramatic degradation and destruction under rapid urban development, which has further impacted ecosystem services and processes [17,31]. Moreover, the GBA is located in South China, with a typical subtropical climate characterized by cloudy and rainy weather, and terrestrial ecosystems have been continuously affected by climatic fluctuations. The accelerated development of the GBA will lead to more profound and complex changes in the future, which will introduce more severe challenges to the terrestrial carbon cycle and carbon balance. Furthermore, as the main component of the GBA, the Pearl River Delta (PRD) was the first “national forest urban agglomeration construction demonstration area” in China, so carbon neutrality is important for environment protection. Therefore, exploring the NPP dynamics and describing the different impacts of climate variability and human activities on NPP variability are of great significance for ecological construction and sustainable development in the GBA. The objectives of this study were the following: (1) to investigate the spatiotemporal characteristics of the actual NPP (NPPa), potential NPP (NPPp), and human-induced NPP (NPPh); (2) to analyze and describe the impacts of climate variability and human activities on NPPa; and (3) to identify the response of NPPa changes in different cities and land cover types to climate variability and human activities.
2. Materials and Methods
2.1. Study Area
The GBA (21°25′N~24°30′N, 111°12′E~115°35′E), also known as the PRD urban agglomeration, includes two Special Administrative Regions, namely Hong Kong and Macao, as well as nine cities in the PRD, namely, Guangzhou, Shenzhen, Zhuhai, Foshan, Dongguan, Zhongshan, Jiangmen, Zhaoqing, and Huizhou. The GBA is located in Southern China’s coastal area, downstream of the Pearl River and bordering the South China Sea (Figure 1), and it covers an area of 56,000 km2. The central part of the GBA contains plains, while the western, northern, and eastern parts are surrounded by hills. The GBA has a subtropical monsoon climate with an average annual temperature of 22.5 °C and total annual rainfall within the range of 1500–2500 mm. Over the past 40 years, climate change in the GBA was mainly characterized by average annual temperature increases, an increase in extreme precipitation, and a decrease in average annual sunshine hours [32,33]. Regional climate change presents enormous challenges to environmental quality. By the end of 2020, the population of the GBA was greater than 86 million, and its GDP exceeded 11 trillion yuan. Forests and croplands comprise the dominant vegetation types, and agriculture and aquaculture are well developed. The GBA now has become an important base for China to build a world-class city cluster with high-quality development, playing a strategic role in the development of the whole nation.
2.2. Data Collection and Processing
2.2.1. MODIS Data
Moderate-Resolution Imaging Spectroradiometer (MODIS) 16-day vegetation index composite data (NDVI/EVI, MOD13Q1) at 250 m spatial resolution over the study area from 2000 to 2020 were utilized in this study to estimate the NPPa. The NDVI and EVI are calculated from the MODIS surface reflectance, which is corrected for molecular scattering, ozone absorption, and aerosols [34], and the indices are essential inputs to assessment models for biogeochemistry, geomorphology, hydrology, agriculture, and the climate at local and global scales [35,36]. The NDVI/EVI product was provided by NASA (National Aeronautics and Space Administration (https://ladsweb.modaps.eosdis.nasa.gov/data/ (accessed on 1 December 2021))). The 16-day NDVI/EVI data were used to synthesize monthly NDVI/EVI values using the widely used maximum-value compositing (MVC) method [37,38,39], which can minimize the effects of clouds, the atmosphere, and other factors on time series images [40].
2.2.2. Land Cover Data
The Global Land Cover fine classification system dataset at 30 m resolution (GLC-FCS30) was used to identify land cover types in the GBA. Data from 2000–2020 at 30 m resolution were produced by combining Landsat time-series imagery and high-quality training data from the GSPECLib (Global Spatial–Temporal Spectral Library) within the Google Earth Engine computing platform [41,42]. Datasets for 2000, 2005, 2010, 2015, and 2020 were downloaded from the Aerospace Information Research Institute, Chinese Academy of Sciences (http://www.aircas.cas.cn/ (accessed on 1 December 2021)). The overall accuracy of the classification datasets was 82.5%, with a Kappa coefficient of 0.784. The final reclassified land types included seven primary classes and 11 sub-classes, namely forest (including evergreen broadleaved forest, evergreen needle forest, deciduous broadleaved forest, deciduous needle-leaved forest, and mixed forest), grassland, shrubland, cropland, water, construction land, and unused land types. The reclassified land cover data were resampled to 250 m spatial resolution to match the NDVI/EVI data. Additionally, since only five years of land use data were applied for NPPa estimation in this study, it was difficult to achieve that NPPa for each year, as this was driven by the corresponding yearly land cover data. Therefore, in this study, land cover data for one year were applied to estimate NPPa values for the adjacent two years, e.g., land cover data in 2005 were used to estimate NPPa values for 2003–2007.
2.2.3. Meteorological Data
Monthly meteorological data (2000–2020) were used in this study, including the average air temperature, total precipitation, and cumulative sunshine duration. The dataset was derived from the China Meteorological Science Data Center (http://data.cma.cn/ (accessed on 1 December 2021)), with 51 meteorological stations in and around the GBA (Figure 1). Due to the limited meteorological radiation data in the study area, we used an empirical formula to calculate the monthly total solar radiation based on the sunshine duration [43]. In addition, the Kriging interpolation method was applied to generate gridded meteorological data at 250 m spatial resolution. This method is widely used in geostatistics and considers the spatial correlation of the variables, which improves the accuracy of the interpolation results [36,44].
2.3. Estimating the NPPp, NPPa, and NPPh
The NPPp assumes an ideal condition in the absence of human interference, and is generally considered to be the NPPp value produced under the influence of climate conditions alone. In this study, the comprehensive model established by Zhou and Zhang [45] was applied to calculate the NPPp. The comprehensive model was based on the water and heat balance equation, and reflects the relationship between the potential evapotranspiration rate (PER), radiative dryness index (RDI), and vegetation. The model uses the following formulas:
where r represents the annual cumulative precipitation (mm), PET represents the annual potential evapotranspiration (mm), BT represents the annual average biological temperature (°C), and T is the monthly averaged temperature range of 0–30 °C.
RDI = (0.629 + 0.237 PER − 0.00313 PER2)2
PER = PET/r = BT∙58.93/r
In this study, the Carnegie–Ames–Stanford Approach (CASA) model was applied to calculate NPPa values from 2000 to 2020 over the GBA. The CASA was proposed by Potter [46], and is determined by the photosynthetically active radiation (APAR) (MJ·m−2) and light use efficiency (ε) (gC·MJ−1), which can be written as the following equations:
where NPPa (x, t) is the vegetation NPP for pixel x at time t, while SOL(x, t) represents the solar radiation (MJ·m−2) of pixel x at time t. The value of 0.5 is the ratio of the solar active radiation available for the vegetation. FPAR(x, t) represents the fraction of the photosynthetically active radiation absorbed by the vegetation canopy, which can be calculated from the NDVI-FPAR and SR-FPAR [47,48] values as:
where the NDVIi,max and NDVIi,min values correspond to 95% and 5% of NDVI population i, respectively; SR is the simple ratio; SRi,max and SRi,min correspond to the NDVIi,max and NDVIi,min, respectively.
NPPa (x, t) = APAR (x, t) × ε(x, t)
APAR (x, t) = SOL (x, t) × FPAR (x, t) × 0.5
ε (x, t) = T1(x, t) × T2(x, t) × W (x, t) × εmax
FPAR (x, t) = 0.5 FPARNDVI + 0.5 FPARSR FPAR ∈ [0.001, 0.95]
The εmax is the maximum light-use efficiency. T1 (x, t), T2 (x, t), and W (x, t) are the stress coefficients for εmax at the minimum temperature, maximum temperature, and water deficiency for pixel x at time t, respectively, and can be calculated as:
where Topt is the average monthly temperature when the NDVI is at a maximum; T (x, t) is the monthly average temperature of pixel x at time t; ET (x, t) and PET (x, t) represent the actual and potential evapotranspiration (mm) of pixel x at time t, respectively.
T1 (x, t) = 0.8 + 0.02 × Topt + 0.0005 × (Topt)2
The εmax varies considerably under different conditions and is primarily influenced by the physiological attributes, spatial scale, and uniformity of the land types. [49]. The fixed εmax value of 0.389 gC·MJ−1 was likely underestimated in the southern subtropical region. According to a previous study [17], the simulated forest NPP based on the average εmax values proposed by Pei [6] and Zhu [48] was closer to the field-based NPP. Therefore, the forest NPP in this study was calculated using the average εmax simulated by Pei [6] and Zhu [48]. Moreover, the average εmax value for the cropland was used based on the [17]. According to the above methods, the calculated εmax values for evergreen broadleaved forest, deciduous broadleaved forest, evergreen needle-leaved forest, deciduous needle-leaved forest, mixed forest, cropland, grassland, shrubland, and other areas were 0.808, 0.585, 0.378, 0.434, 0.461, 0.502, 0.482, 0.389, and 0.482, respectively.
The NPPh represents the influence of human activities on the NPPa [50], and can be calculated from the difference between the NPPp and NPPa as:
NPPh = NPPp − NPPa
Thus, when the NPPh > 0, this indicates human-induced NPP loss, while if the NPPh < 0, this indicates an increase.
2.4. Trend Analysis
The Mann–Kendall (M–K) method was used to calculate pixel-level NPP trends and the magnitude of the changes in each element. This method has been widely applied in long time series trend analyses of non-normal data [51,52,53]. An approximately normal distribution of the Z-test statistic is satisfied when the sample size of n ≥ 8 [54]. A positive Z value signifies an increasing trend, and vice versa. The M–K test statistic S can be calculated by the following formula [55]:
where k is the number of data points; xi and xj are data values in time series i and j (j > i), respectively; and sgn(xj − xi) is the sign function, denoted as:
The variance was calculated as follows:
where k is the number of data points, m is the number of tied groups, and ti is the number of ties of extent i. A tied group is a set of sample data with the same value. The standard normal test statistic Z was calculated as follows:
The Thiel–Sen median slope estimator used for estimating the slope of the trend in a sample with N pairs of data can be calculated as in Equation (13):
where xp and xq are the data values at times p and q (p > q), respectively.
2.5. Correlation Analysis between Climatic Variables, LULC Change and NPPa
In this study, a partial correlation analysis was used to explore the correlations between climatic variables (i.e., temperature, precipitation, and solar radiation) and the NPPa. The partial least squares (PLS) regression method explores the linear relationship between two factors while removing the effects of one or more influencing factors. This method has the advantages of the ordinary least squares linear regression method, canonical correlation analysis, and principal component analysis [56]. In this study, PLS regression was used to explore the relationships between the NPPa dynamics and different climatic variables at the pixel level from 2000 to 2020.
Moreover, in this study, LULC changes were considered as the most dominant human activities affecting vegetation productivity, and the conversion results for land covers in the four periods are displayed as a Sankey diagram.
2.6. The Relative Impacts of Climate Variability and Human Activities on NPPa
The NPP slope represents the change in the vegetation NPP at the pixel level over the entire period. A positive slope for the NPPa represents improved vegetation conditions and increased productivity. A negative slope signifies vegetation degradation and decreased productivity. The NPPp and NPPh slopes from 2000 to 2020 demonstrate the effects of climate variability and human activities on vegetation productivity. A positive or negative NPPp slope demonstrates that climate variability is either beneficial or detrimental to vegetation growth and productivity, whereas a positive or negative NPPh slope indicates that the human activities either exacerbated the vegetation degradation or promoted vegetation productivity. Referring to previous research methods regarding the relative influences of the climate variability and human activities on the vegetation NPPa [23,57,58], six main possible scenarios were presented according to the NPPa changes in this study (the other two scenarios, i.e., when slope NPPa > 0, slope NPPh > 0, and slope NPPp < 0, and when slope NPPa < 0, slope NPPh < 0 and slope NPPp > 0, are ignored in this study because the percentage of pixels in these two scenarios is very low at less than 0.2%), and are defined in Figure 2.
2.7. Validation of Simulated NPPa
Field-observed biomass data obtained from the Dinghushan and Heshan Forest Ecosystem State Field Observation and Research Station were used to evaluate the NPPa as calculated in the CASA model. Forest and shrub biomass data from 2005 to 2015 were collated and then converted to NPP values by multiplying them by 0.45 [59], which was done in this study to validate the accuracy of the CASA-NPPa results. A comparison of the two results showed a highly significant (R2 = 0.81, p < 0.001; Figure 3) correlation between the field-observed NPP and the CASA simulated NPPa, with a MAE and RMSE of 103.40 and 122.22 gC·m−2, respectively. This validation result indicated that simulated the NPPa was reliable and could be used for further analysis.
3. Results
3.1. Spatial Patterns and Trends Analysis of NPPp, NPPa, and NPPh
3.1.1. Spatial Distribution Patterns of NPPp, NPPa, and NPPh
Figure 4 shows the spatial patterns of the NPPp, NPPa, and NPPh from 2000 to 2020 for the GBA. The mean annual NPPp over the 21 years increased from northwest to south (Figure 4a), with an average value of 1611.54 gC·m−2·yr−1, due to differences in the hydrothermal conditions. The values were lowest in the northwest, with average values of less than 1500 gC·m−2·yr−1. The largest NPPp values were observed in the southwest, with average values greater than 1600 gC·m−2·yr−1.
The NPPa spatial distribution was heterogeneous (Figure 4b) due to the variable land cover and human activity intensity values. NPPa values were low in central areas and high in surrounding regions, with a mean value of 606.37 gC·m−2·yr−1 during the study period. The lowest values were primarily distributed in the central areas of the GBA, such as Foshan, Zhongshan, southern Guangzhou, western Dongguan, western Shenzhen, and Zhuhai. These areas were dominated by impervious surfaces and other non-vegetated areas, with mean values < 200 gC·m−2·yr−1. In contrast, the highest values (greater than 700 gC·m−2·yr−1) were found in Zhaoqing, Jiangmen, Huizhou, and northeast Guangzhou, and most of these areas were dominated by forests and croplands, with high light-use efficiency and better carbon sequestration capacity.
NPP changes driven by human activities reflected human-caused interference with vegetation growth. The results showed that the spatial pattern of the NPPh was almost opposite to that of the NPPa (Figure 4c). During the 21 years, the NPPh values were higher in the central region and lower in the southwest, northwest, and northeast, with a mean value of 1018.94 gC·m−2·yr−1. Generally, the high values in the central areas, which were dominated by non-vegetated areas, were greater than 1400 gC·m−2·yr−1, and the low values (less than 600 gC·m−2·yr−1) were found in the remaining areas, especially those with less human activities.
3.1.2. Trends in NPPp, NPPa, and NPPh
In this study, the M–K method was used to analyze and explore the trends and slope significance tests of the NPPp, NPPa, and NPPh at the pixel level. The temporal trends of the annual NPPp, NPPa, and NPPh values across the GBA are shown in Figure 5. During the study period from 2000 to 2020, the NPPp increased with a mean slope of 3.16 gC·m−2·yr−1 (Figure 5a). More than 98% of the total pixels increased, indicating positive effects of climate variability on the NPPp. About 97% of all pixels had a non-significant increase (p >0.05), and only 1.04% significantly decreased (p < 0.05; Figure 5d).
The NPPa trends were overall favorable, with an average slope of 6.94 gC·m−2·yr−1, and were especially significant in the northwest and northeast areas (Figure 5b,e), such as Jiangmen (8.44 gC·m−2·yr−1) and Huizhou (7.41 gC·m−2·yr−1). More than 73% of the total pixel values increased and about 43.41% of them were significantly (p < 0.05) or very significantly (p < 0.01) positive. These were mainly scattered in the northern, western, and eastern areas of the GBA dominated by woodland. Only 8.10% of the total pixels were significantly (p < 0.05) or very significantly (p < 0.01) negative, and were concentrated in the central region.
Temporally, the NPPh values declined across the entire region during the 21-year period, with an average slope of −4.43 gC·m−2·yr−1 (Figure 5c), suggesting a positive impact of human activities on vegetation productivity. Of the total pixels, about 60.93% decreased and were distributed in the northwest, southwest, and east, and about 17.5% were significantly (p < 0.05) or very significantly (p < 0.01) negative (Figure 5f). The remaining 39.07% of pixels increased, mostly concentrated in the central regions, where human activities tended to be detrimental to the vegetation’s carbon accumulation, and only 4.9% were significantly (p < 0.05) positive.
3.2. Impacts of Climate Variability and Human Activities on NPPa across the GBA
3.2.1. Relationships between Climatic Variables and NPPa
Previous studies have revealed that temperature, precipitation, and solar radiation are the three dominant climate-related factors affecting vegetation dynamics [60,61]. To better understand the relationship between the NPPa and these three climatic factors, a partial correlation analysis was used and the results are shown in Figure 6. The results showed that the NPPa was overall positively correlated with temperature and solar radiation (with partial correlation coefficients of 0.0339 and 0.0264, respectively; Figure 6a,b), but negatively correlated with precipitation (with a partial correlation coefficient of −0.1491; Figure 6c). Pixels that had positive correlations between temperature and the NPPa accounted for 52.45% of the total pixels (Figure 6d) and mostly occurred in the southern and northeast GBA (Figure 6a). A negative sensitivity to temperature was mostly found in the northwest and central GBA. A positive response of the NPPa to solar radiation was found in most of the southwest and central GBA (Figure 6b), accounting for 50.51% of the total pixels (Figure 6f), while negative correlations mostly occurred in the northwest and northeast GBA. Regarding precipitation sensitivities, about 79.87% of the total pixels had negative coefficients related to the NPPa, and they were mainly distributed in the southwest, southeast, and central GBA (Figure 6b,e).
3.2.2. Impact of LUCC Change on NPPa
In this study, LULC change due to urban expansion was the most dominant human activity affecting vegetation productivity. Conversions between the six land cover types were analyzed to identify the amount and direction of change in the GBA (Figure 7). Generally, the effect of LULC change on the NPPa was two-fold. LULC conversions from higher to lower productivity tended to result in a decrease in NPPa; for the opposite situation, an increase in NPPa was observed. Over the four periods, the total converted areas equaled 2137.26 km2, 1957.97 km2, 5094.92 km2, and 5768.87 km2. The conversions in land cover resulted in increases of 65.55 Gg C (1 Gg C = 109 g C), 71.07 Gg C, 446.82 Gg C, and 337.88 Gg C, and decreases of 265.60 Gg C, 217.27 Gg C, 364.90 Gg C, and 453.45 Gg C in total NPP over the four periods, respectively. Moreover, we found that vegetated ecosystems suffered the most area losses due to land conversion in the four study periods, and most vegetation types were converted to urban and construction land. Over the four study periods, for example, about 462.95 km2, 496.05 km2, 698.65 km2, and 943.16 km2 of cropland; 202.96 km2, 323.27 km2, 505.74 km2, and 806.98 km2 of forest; and 11.43 km2, 7.39 km2, and 7.49 km2, and 66.82 km2 of shrub and grassland were converted into construction land, respectively. Consequently, the conversion from vegetation to construction land resulted in a considerable loss in NPPa, with total losses of 118.30 Gg C, 154.25 Gg C, 220.38 Gg C, and 552.01 Gg C in the four periods. Moreover, land conversions between 2000 and 2020 were mainly characterized by the conversion from cropland (2149.59 km2) and forest (1275.72 km2) to construction land, resulting in a total decline of 614.22 Gg C.
3.2.3. Different Impacts of Climate Variability and Human Activities on NPPa
According to the NPPp, NPPa, and NPPh trends and the six defined scenarios, the study area was divided by the dominant influences to assess the relative contributions of climate variability and human activities to NPPa variability (Figure 8). The results indicated that climate variability and human activities had different effects on the spatial patterns and tendencies of NPPa changes (Figure 8a). We confirmed that the combined impacts of climate variability and human activities were the major factors contributing to NPPa changes in most areas from 2000 to 2020, accounting for 59.88% of the total pixels (Figure 8b). Positive contributions of the combined impacts on NPPa were widely distributed in the GBA, except in the central areas, such as Zhaoqing, Jiangmen, Huizhou, and northwest Guangzhou, accounting for 49.51% of pixels. Negative contributions to the NPPa were scattered in the east, north, and west of the GBA. Areas driven solely by climate variability accounted for approximately 22.86%, of which nearly 98% had a positive impact on the NPPa, scattered in the central and south areas. The remaining 17.18% of the area was affected solely by human activities and was mainly concentrated in the central areas, such as Zhongshan, Foshan, southern Guangzhou, western Dongguan and Shenzhen, and central Zhuhai, and most of these areas had negative NPPa impacts. The results suggested that both climate variability and the combined effects of climate variability and human activities promoted substantial improvements in the NPPa in most areas. In contrast, human activities resulted in large NPPa decreases that were more prominent in the central regions due to the higher human activity intensity.
3.3. Different Impacts of Climate Variability and Human Activities on NPPa at the Regional Scale
Figure 9a shows the different impacts of climate variability and human activities on the NPPa values of the 11 cities over the study period according to the six scenarios. Similarly, climate variability and the combined impacts of climate and human activities were the dominant driving factors increasing NPPa values, accounting for 49–81% of the total area in each respective city. The positive contributions of the combined impacts were especially significant in Zhaoqing, Jiangmen, and Huizhou, all of which encompassed greater than 52% of the total area. This was followed by a second echelon, i.e., Guangzhou, Shenzhen, and Hong Kong, where positive contributions made up 40–44% of the total area. In the remaining cities, i.e., Zhuhai, Dongguan, Zhongshan, and Foshan, the areas impacted made up 32–39% of each region. The negative impacts of human activities alone on NPPa values in 11 cities were also dramatic, and particularly remarkable in the central cities, with relatively uniform development, such as Zhuhai, Foshan, Dongguan, and Zhongshan, where they accounted for more than 27% of each region. Nevertheless, the most significant increase in NPPa due to human activities occurred in Shenzhen, accounting for approximately 16.27%, whereas it accounted for less than 5.5% in the remaining ten cities. Moreover, the significant adverse effects of the combined impacts of climate variability and human activities occurred in Zhaoqing, Huizhou, Hong Kong, Macao, and Shenzhen, accounting for more than 10% of each region. In addition, the NPPa decreases due to climate variability alone were the lowest in the 11 cities, at less than 2%.
3.4. Different Impacts of Climate Variability and Human Activities on NPPa by Land Cover
The NPPa sensitivity across different land classes to climate variability and human activities was calculated. The results are shown in Figure 9b. We found that the NPPa for the different land cover types was primarily affected by climate variability and the combined effects of climate variability and human activities in all land covers except for construction land. More than 54% of all vegetation types had increasing NPPa values due to the combined effects; for water and unused land, the NPPa values increased by 42.72% and 71.30%, respectively, due to the combined effects. Moreover, in most land cover types except water (29.48%) and unused land (8.70%), NPPa changes that were solely influenced by climate variability accounted for 21–22% of the effects, and most of these areas showed an increase. In contrast, about 11.0% of the four vegetation types, 21.09% of water, 43.78% of construction land, and 8.71% of unused land were solely dominated by human activities, and more than 96% of them had decreasing NPPa values, signifying a detrimental impact of human activities on vegetation growth.
4. Discussion
4.1. Spatiotemporal Variability of NPPp, NPPa, and NPPh
The comprehensive model established by Zhou and Zhang [45] was based on plant ecological and physiological features and the heat equilibrium relation equation, and considered only climatic variables, such as temperature, precipitation, and evapotranspiration. Therefore, the results estimated by this model can be used as the NPPp values. The results showed that the mean NPPp values across the GBA slightly increased from north to south, with little difference (Figure 4a). The average NPPp values ranged from 1400 to 1870 gC·m−2·yr−1 and were much higher than the NPPa values. This suggested that climate variability had more intensive positive effects on the vegetation dynamics under ideal climatic conditions. Comparatively, the spatial heterogeneities of NPPa and NPPh were significant and their spatial patterns were almost opposite (Figure 4b,c). Generally, the NPPa decreased distinctly from the edges to the center, which was in agreement with some other studies [52,62]. This may have been because of differences in the hydrothermal conditions, topographical conditions, and land covers from the middle part to the ground. For example, most northwest, southwest, and eastern areas of the GBA are characterized by mountains and hills with high vegetation coverage of typical subtropical evergreen forests and more abundant ecological resources than in the central regions. In addition, other factors, such as population density, economic development, and infrastructure increases, impacted the urban developmental disequilibrium in urban development and resulted in significantly different spatial NPPa patterns [17,18,63]. Additionally, the NPPh values over the entire study area were higher in the central regions and mostly greater than 1400 gC·m−2·yr−1, and the annual mean NPPh in the GBA was significantly greater than that in Guangzhou estimated by [14] based on the Chikugo model. This difference in NPPh between these two regions may have been due to the different input data, parameters, and model structures between the two models. In addition, the central GBA is the fastest growing and most developed area, and is densely inhabited with a high proportion of impervious surfaces, strong human interference, and intense inter-city linkages. These factors would accelerate NPPa losses. Therefore, the average NPPh for the whole region was much higher than in Guangzhou.
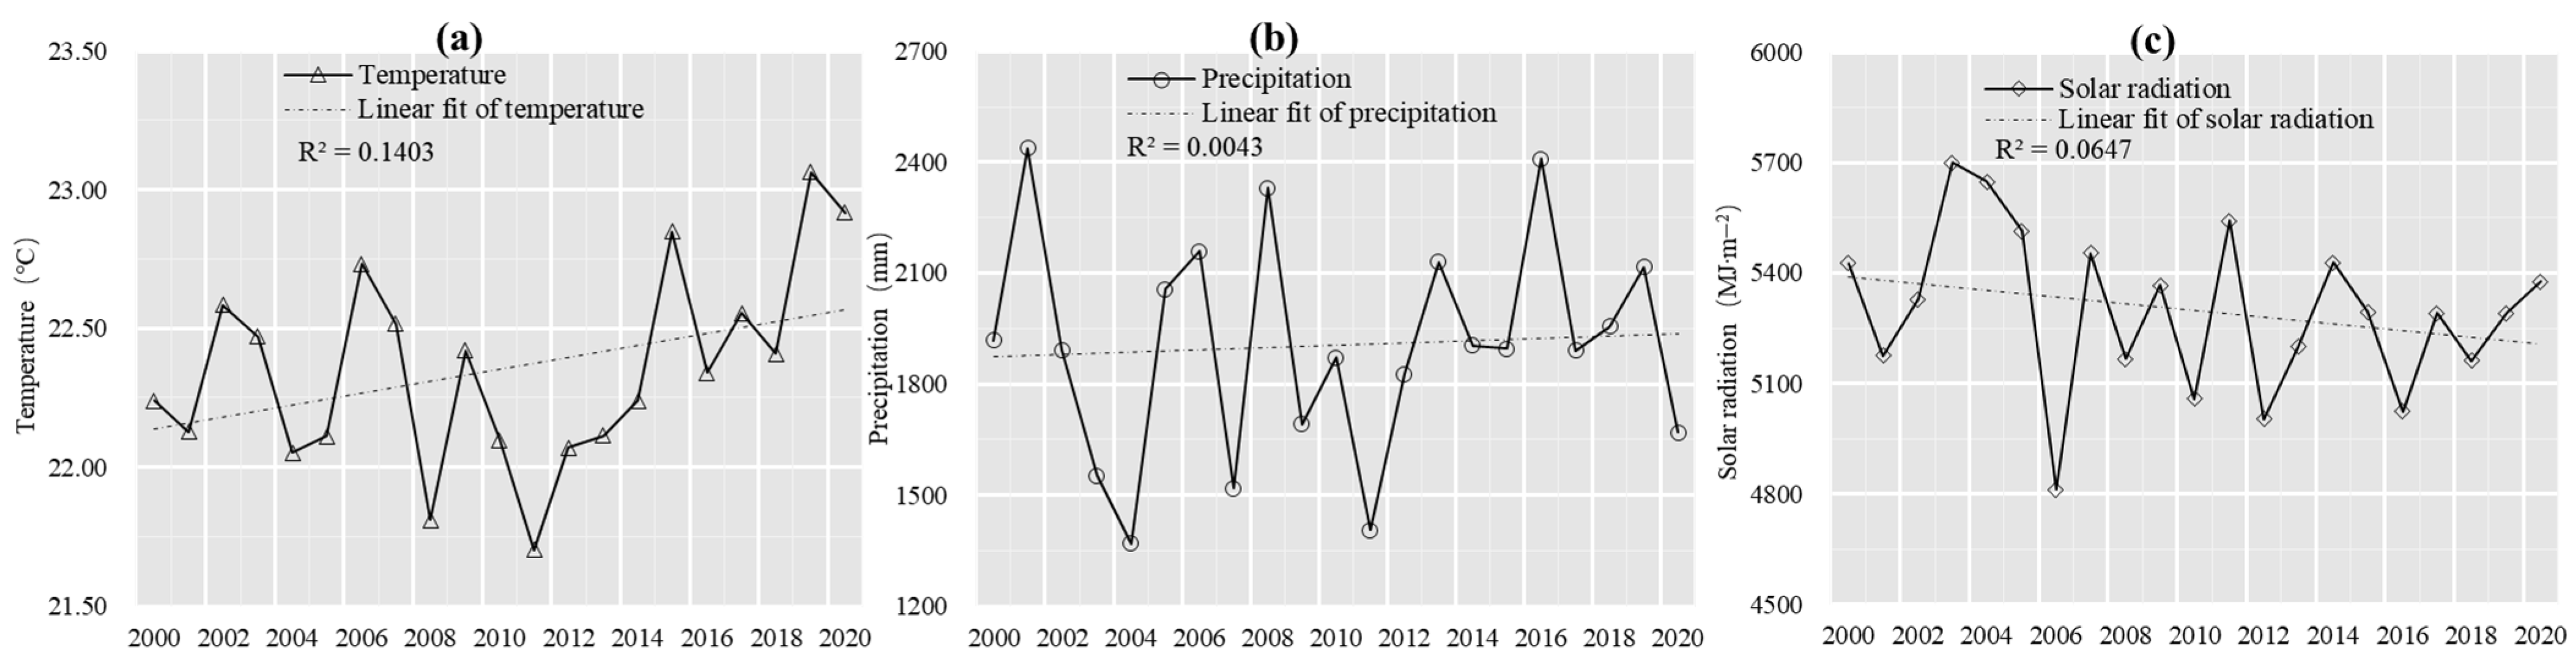
The temporal NPPp and NPPa trends were all spatially heterogeneous in the GBA from 2000 to 2020, with overall increases of 3.16 and 6.94 gC·m−2·yr−1, respectively, whereas an NPPh decrease of −4.43 gC·m−2·yr−1 was found (Figure 5). This indicated that climate variability and the combined effects of climate and human activities were beneficial to vegetated ecosystem changes. For instance, although the decreasing cumulative solar radiation may have inhibited vegetation photosynthesis, the increasing temperature and precipitation (Figure A1) resulted in warmer and more humid environmental conditions facilitating vegetation growth. Additionally, the increasing NPPa suggested that the vegetation conditions were overall improving and that disturbances in vegetated ecosystems by human activities gradually weakened.
In addition, the implementation of some forest conservation measures, such as forest classification management, natural forest protection, and plantation increases, was a significant impetus for the increase in NPPa [64]. It is important to note that the decreasing NPPa and increasing NPPh values were especially significant in the central regions of the GBA. This may have been due to the dramatic human interference. For instance, since the launch of the reform and opening-up, the construction land area increased by 5636.10 km2 from 1980 to 2018 in the GBA, with the central region exhibiting the highest rate of urban expansion [22]. The significant increase in construction land could be responsible for the NPPa decreases and NPPh increases. Moreover, related studies have shown that in addition to climate variables, soil conditions, CO2, forest age, policies, and regulations affect vegetation productivity [62,65]. For instance, the NPPa for cultivated land can be enhanced effectively with certain agricultural activities, such as irrigation, fertilization, and field management [66,67]. Therefore, human activities often promote the NPPa in infrequently transformed vegetated areas. As a result, there will be a lower or even negative NPPh than NPPp because the NPPa is greater than NPPp.
4.2. Relative Influences of Climate Variability and Human Activities on NPPa
4.2.1. Impact of Climatic Variables on NPPa
Generally, temperature, precipitation, and solar radiation are usually considered to be the most important climatic factors affecting the vegetation NPP [60,61]. From 2000 to 2020, the temperature and precipitation increased while the solar radiation decreased (Figure A1), which inevitably had a considerable influence on the vegetation dynamics. According to Figure 6, we found that more than 50% of the total NPPa pixels were positively correlated with temperature and solar radiation, and nearly 80% were negatively correlated with precipitation, indicating that the temperature and solar radiation favored NPP increases, whereas the precipitation was detrimental. Moreover, the pixels with positive correlations between the NPP and temperature were mostly distributed in forest-dominated areas. This was probably because of the enhanced photosynthetic capacity and increased photosynthetic enzyme activity contributing to the increase in forest productivity [68]. This conclusion was also supported by the majority of the pixels having a positive relationship between the NPPa and solar radiation in the region (Figure 6e). However, excessive precipitation will reduce plant solar radiation exposure [69,70], which resulted here in a reduction in photosynthetically active radiation absorption and a decrease in accumulated vegetation biomass [71]. Furthermore, in densely built-up urban areas such as the central GBA, the contributions of the temperature and precipitation on the NPPa were mainly negative, whereas that of the solar radiation was mainly positive. This may have been because of the more pronounced urban heat island effect in those areas [6] due to the large number of buildings and high level of impervious surface cover. Higher temperatures will enhance vegetation transpiration, reduce soil moisture, and increase the restriction of physiological vegetation activities, thereby inhibiting vegetation growth and carbon accumulation [72].
4.2.2. Impact of Human Activities on NPPa
Previous studies [17,31] have found that the major anthropogenic factor in the GBA that influences vegetated ecosystems is LULC change, because it has not only encroached on substantial natural ecosystems but has also caused further dramatic degradation of the vegetation functions and productivity. This has been especially significant in [22] highly urbanized areas. Therefore, LULC change was considered to be one of the most direct human influences and impacts on the environment in this study. The present study revealed that the land structure in the GBA underwent dramatic changes from 2000 to 2020 (Figure 7), which had a significant impact on the NPPa. In general, the LULC conversion increased or decreased the NPPa; for example, the return of farmland to forest areas and ecological restoration promoted NPP increases, while the encroachment of construction land on vegetation tended to reduce the NPPa. Moreover, we found that cropland and forest areas suffered the greatest area losses due to their conversion to construction land, which was responsible for the substantial reduction in NPPa. This suggested that human activities often negatively influence vegetation dynamics, particularly in urbanized areas. Thus, it is necessary and urgent to protect natural ecosystems and to preserve, restore, and promote the sustainable use of highly productive farmland, forest, and grassland areas in the GBA.
In addition, although climate variability and natural disasters likely promoted the decline in regional NPPa, anthropogenic factors, such as urban sprawl, population growth, economic development, and road construction, were also responsible for the vegetation deterioration in the urbanized areas [63]. We found that the areas where NPPa was negatively influenced by human activities (ADH) were mainly concentrated in the central GBA, such as in southern Guangzhou, most of Foshan, northern Zhongshan, western Dongguan, northern Zhuhai, and western Shenzhen. The more pronounced decreasing NPPa (Figure 10a,d; mean slope NPPa = −6.74), increasing NPPh (Figure 10b,e; mean slope NPPh = 10.13), and deteriorating vegetation conditions (Figure 10c,f; mean slope EVI = −0.0004) that occurred in the ADH suggested that human activities had more significant adverse effects in those areas. The underlying reason for this result was the extensive urbanization and subsequent LULC change, which drove the dramatic reduction and degradation of the vegetation dynamics (Figure 7). For example, regional development, urbanization, industrialization, integrated transportation, and infrastructure connectivity were further strengthened [22], resulting in significant pressure on the native vegetation and vegetation productivity.
However, what cannot be ignored is that notable and influential efforts have been made in urban land planning to protect green spaces and restore the ecology in the GBA. The integrated plan for environmental security in the PRD emphasized the importance of ecological security by establishing an ecological barrier, a coastal protection zone, two ecological corridors, and five ecological green nuclei, along with the Pearl River Delta National Forest Urban Agglomeration Construction Plan. This created favorable conditions for the improvement of vegetation productivity. Additionally, the Guangdong–Hong Kong–Macao Greater Bay Area Development Planning Outline proposes to promote sustainable development by implementing the most stringent environmental protection measures, ensuring the protection and restoration of important ecosystems and strengthening the protection of the forest ecosystem around the PRD [73], which would increase the NPPa. Most importantly, the urban integrated development of the GBA, such as the construction of a Guangzhou, Foshan, Zhaoqing, Shenzhen–Dongguan, and Shenzhen–Zhongshan economic circle and urban integration, not only accelerated the decrease in NPPa, but also may have escalated the conflict between social and economic factors and the NPPa [52]. Nonetheless, the NPPa declined in more than 16% of the total area due to human interference. Although many conservation efforts have been made, forests and farmland were still significantly degraded [74], and the newly added NPPa due to ecological protection did not offset the decrease in NPPa associated with destructive human activities. This phenomenon was particularly prominent in the central GBA. Thus, it is essential to consider and research how to improve the NPPa via the coordinated and integrated development of the GBA to achieve carbon neutrality.
4.2.3. Different Impacts of Climate Variability and Human Activities on NPPa
As two important factors influencing NPPa variability, climate variability and human impacts were spatially heterogeneous across the entire study area from 2000 to 2020 (Figure 8a). Compared with the NPPp, the NPPa and NPPh showed greater heterogeneities across the GBA, as shown in Figure 5, indicating significant differences in hydrothermal conditions and human activities in mountains and plains that created clear heterogeneities in vegetation dynamics. Approximately 22.86% and 49.51% of the total pixels were regulated by climate variability and the combined impacts of climate and human activities over time, respectively, with NPPa increases (Figure 8b). This result suggested that increased temperatures and abundant precipitation (Figure A1) provided suitable climatic conditions for vegetation growth in most areas, promoting carbon accumulation. In addition, areas dominated by climate variability and the combined impacts of climate and human activities were mainly distributed in the northwest, southwest, and east, especially in higher-latitude areas dominated by forests. This was because elevation increases reduced the impacts of human activities, and changes in NPPa were predominantly climate-driven. This finding is also supported by other studies [23,29]. On the contrary, human interference was responsible for the reduction in NPPa in the central GBA (Figure 9a), demonstrating that ecosystem degradation in urbanized areas was characterized by rapid urban expansion, economic growth, and population explosion. The conclusion was consistent with previous studies that human interference may have a more significant negative effect than climate variability in regulating NPPa variability in urbanized areas [14,18,63]. Moreover, a prior study [17] revealed that urbanization generally decreased NPP values even under favorable climate conditions in the urban and peri-urban regions of the Pearl River Delta, primarily by encroaching on the vegetable cover with urban impervious surfaces. The conclusion was consistent with our results that LULC caused by human activities was responsible for the reduction in NPPa. Although the conversion from low-productivity vegetation to high-productivity vegetation increased the NPPa, the increases in carbon absorption in highly urbanized areas were insufficient to offset the NPPa losses resulting from vegetation conversion.
In addition, LULC change was considered the main anthropogenic factor in this study, and LULC conversion and its effects on NPPa were analyzed. However, the NPP dynamics when LULC remained unchanged (i.e., affected only by climate variability) were not considered. To further investigate the effect of static LULC on changes in NPPa, pixels labeled as the same land class (i.e., unchanged LULC) in 2000 and 2020 at the same location were selected and the effects on NPP trends were analyzed. We found that about 29.49% of the total pixels experienced LULC change, with an average NPPa slope of 6.23 gC·m−2·yr−1; and static LULC was found in most areas, with an average NPPa slope of 7.32 gC·m−2·yr−1. This was greater than the NPPa change (6.94 gC·m−2·yr−1) due to the combined effects of climate variability and human activities, which indicated that climate variability alone promoted NPPa. However, the contribution of climate variability to the NPPa was significantly weakened by human activities, which was consistent with the finding that human activities had an adverse effect on NPPa in the present study.
Furthermore, our results also showed that the decreases in NPPa and EVI and increase in NPPh in the central GBA were significantly greater than in other regions (Figure 10), indicating that large-scale and high-intensity human activities have severely disturbed and damaged the vegetation dynamics in highly urbanized areas. Our results also confirmed the significant adverse impacts of human activities on the NPPa in the central cities of the GBA (Figure 8a). Although climate variability and the combined effects of climate and human activities greatly influenced the NPPa in most cities, the NPPa decreases due to human activities were more dramatic in Zhongshan, Macao, Dongguan, Foshan, Zhuhai, and Guangzhou (Figure 9a). This suggested that intensive human activities, such as urbanization and land structure change, were responsible for the NPPa decreases in the central cities of the GBA. Additionally, extensive urbanization has increased environmental problems, destroying the inherent structure and state of the natural environment, interfering with and disrupting the intrinsic linkages among elements of the ecosystem, and posing a severe threat to human well-being [75,76]. These damages and impacts are difficult to predict and may even be irreversible [22]. Therefore, greater efforts, such as the implementation of arable land and natural forest protection measures, ecological restoration, and ecological compensation, should be made in the process of urban development in the GBA to compensate for the adverse impacts of human activities on the NPPa.
4.3. Limitations
In this study, the NPPa simulation results were validated by observing the NPP in the GBA, which demonstrated that the results were reliable. In addition, using the six possible scenarios based on the slopes of the NPPp, NPPa, and NPPh, this study revealed the relative impacts of climate variability and human activities on the NPPa across the GBA. However, some uncertainties and limitations remained in this study. The application of the CASA model for estimating the NPPa involved key influencing factors and parameters, and the precision and effectiveness of such models are often biased by the accuracy of the input data [77]. For example, a limited number of meteorological stations were employed in this study, especially in areas with elevations greater than 1 km, and this may have biased the NPPa estimations and the relationships between the climatic factors and NPP. In addition, there were differences in spatial resolution between the land cover data, meteorological data, and the MODIS products used, which resulted in matching errors between the land surface and atmospheric conditions [78]. This required further data processing and more consistent spatial and temporal resolutions for the data. Moreover, the NPPp values used in this study were estimated based on the comprehensive model, which can more effectively reflect the relationship between a plant’s physiological and ecological characteristics and hydrothermal balance [45]. However, we did not validate the model’s accuracy due to a lack of actual NPPp measurement data in the study area, which needs to be further considered in future studies. Furthermore, there were complicated interactions between climate variability and human activities, and this study only considered the separate impacts of climatic variability and human activities on the NPPa and ignored their interactions, such as between greenhouse gas emissions and aerosols. The heat island effect caused by human activities may also amplify or moderate the impacts of climate variability on the NPPa, [79,80], which we did not consider in this study. The complex impacts of human–climate interactions on vegetation dynamics will be further analyzed in future studies.
Additionally, only three climate variables (i.e., temperature, precipitation, and solar radiation) and land cover change were considered as the main climatic factors and human activities patterns to analyze the effects of climate variability and human activities on the NPPa, while other factors were not considered in this study that may also affect NPPa variability, such as the CO2 concentration, soil moisture and types, topography, biological conditions, time lag effect, droughts, pests, plant diseases, vegetation phenology, vegetation aging, species competition, and so on. Although previous studies have suggested that the impacts of the above factors on NPPa variability were weaker than climatic factors and human activities [61,81], the influence of human activities on the NPPa was more complicated, especially in the GBA, which has a complex natural regional structure and high-intensity human interference. Therefore, some factors such as the economy, population, transportation, and even the heat island effect may affect NPPa changes [6,63], and the comprehensive impact of multiple human activities on NPPa in highly urbanized areas should be further studied.
5. Conclusions
In this study, NPPp and NPPa values were estimated using the comprehensive model and CASA model, respectively, and the different impacts of climate variability and human activities on NPPa variability were distinguished according to six possible scenarios across the GBA from 2000 to 2020. Our results showed that the spatial pattern of annual NPPp, NPPa, and NPPh values displayed significant spatial heterogeneity: the NPPp increased from northwest to south with a slope of 3.63 gC·m−2·yr−1, the NPPa increased from the center to the edges with a slope of 6.94 gC·m−2·yr−1, while the NPPh increased from the edges to the center with a slope of −4.43 gC·m−2·yr−1. The LULC profile changed dramatically from 2000 to 2020, resulting in a significant reduction in total NPPa over the different periods due to land cover conversions, except from 2010 to 2015. Moreover, cropland and forest areas suffered the greatest losses in different periods and were responsible for the considerable decreases in NPPa.
The combined impacts of climate variability and human activities were the primary driving forces for the changes in NPPa and the increase of 49.51% of the pixel’s values, of which 22.86% were solely dominated by climate variability, whereas the remaining 17.18% were affected solely by human activities and mainly with negative effects, mostly in the central areas. Over the study period, the NPPa increases across 11 cities and four vegetation types primarily benefited from the combined effects of climate variability and human activities, whereas human activities were detrimental to the NPPa, and the variability in the NPPa was significantly greater than climate variability in the central cities of the GBA. Therefore, although climate variability was overall favorable for NPPa increases due to the high forest coverage, ecological construction approaches and efficient natural resource protection measures should be emphasized and conducted to mitigate NPPa decreases during urban development.
Author Contributions
Conceptualization, writing—original draft preparation and editing, methodology, Y.W.; data collection, validation, Z.L.; revision, funding acquisition, Z.W. All authors have read and agreed to the published version of the manuscript.
Funding
This research was funded by the National Natural Science Foundation of China (No. 61806059), the Key Special project for Introduced Talents Team of the Southern Marine Science and Engineering Guangdong Laboratory (No. GML2019ZD0301), NSFC-Guangdong Joint Foundation Key Project (No. U1901219), Central Fund Supporting Nonprofit Scientific Institutes for Basic Research and Development (No. PM-zx703-202111-313), and the Science and Technology Program of Guangzhou, China (No. 201904010288).
Data Availability Statement
The MODIS images are available from the National Aeronautics and Space Administration (NASA, https://ladsweb.modaps.eosdis.nasa.gov/search (accessed on 30 December 2021)), land cover data are available from the Aerospace Information Research Institute, Chinese Academy of Sciences (http://www.aircas.cas.cn/ (accessed on 30 December 2021)), the meteorological data are available from China Meteorological Science Data Center (http://data.cma.cn/ (accessed on 30 December 2021)), and the field-observed biomass data are available from Dinghushan (http://dhf.cern.ac.cn/listpic?id=dhf66 (accessed on 30 December 2021)) and Heshan Forest Ecosystem State Field Observation and Research Station (http://hsf.cern.ac.cn/ (accessed on 30 December 2021)).
Conflicts of Interest
The authors declare no conflict of interest.
Appendix A
Figure A1.
Temporal variability of (a) temperature, (b) precipitation, and (c) total solar radiation data in the GBA from 2000 to 2020.
Figure A1.
Temporal variability of (a) temperature, (b) precipitation, and (c) total solar radiation data in the GBA from 2000 to 2020.
References
- Li, X.; Li, Y.; Chen, A.; Gao, M.; Slette, I.J.; Piao, S. The impact of the 2009/2010 drought on vegetation growth and terrestrial carbon balance in Southwest China. Agric. For. Meteorol. 2019, 269–270, 239–248. [Google Scholar] [CrossRef]
- Field, C.B.; Behrenfeld, M.J.; Randerson, J.T.; Falkowski, P. Primary production of the biosphere: Integrating terrestrial and oceanic components. Science 1998, 281, 237–240. [Google Scholar] [CrossRef] [PubMed] [Green Version]
- Yin, S.; Wu, W.; Zhao, X.; Gong, C.; Li, X.; Zhang, L. Understanding spatiotemporal patterns of global forest NPP using a data-driven method based on GEE. PLoS ONE 2020, 15, e0230098. [Google Scholar] [CrossRef] [PubMed]
- Wang, D.; Qin, W.; Jia, G.; Shan, Z.; Hao, M. Assessing the effects of climate variability and vegetation conversion on variations of net primary productivity in the mountainous area of North China. For. Ecol. Manag. 2022, 506, 119957. [Google Scholar] [CrossRef]
- Qi, X.; Jia, J.; Liu, H.; Lin, Z. Relative importance of climate change and human activities for vegetation changes on China’s silk road economic belt over multiple timescales. Catena 2019, 180, 224–237. [Google Scholar] [CrossRef]
- Pei, F.; Li, X.; Liu, X.; Wang, S.; He, Z. Assessing the differences in net primary productivity between pre- and post-urban land development in China. Agric. For. Meteorol. 2013, 171–172, 174–186. [Google Scholar] [CrossRef]
- Woodward, F.I. Climate and Plant Distribution; Cambridge University Press: Cambridge, UK, 1987. [Google Scholar]
- Zhu, W.Q.; Pan, Y.Z.; Yang, X.Q.; Song, G.B. Comprehensive analysis of the impact of climatic changes on Chinese terrestrial net primary productivity. Chin. Sci. Bull. 2007, 52, 3253–3260. [Google Scholar] [CrossRef]
- Nemani, R.R.; Keeling, C.D.; Hashimoto, H.; Jolly, W.M.; Piper, S.C.; Tucker, C.J.; Myneni, R.B.; Running, S.W. Climate-driven increases in global terrestrial net primary production from 1982 to 1999. Science 2003, 300, 1560–1563. [Google Scholar] [CrossRef] [Green Version]
- Sullivan, P.F.; Arens, S.J.T.; Chimner, R.A.; Welker, J.M. Temperature and microtopography interact to control carbon cycling in a high arctic Fen. Ecosystems 2008, 11, 61–76. [Google Scholar] [CrossRef]
- Xu, X.; Sherry, R.A.; Niu, S.; Li, D.; Luo, Y. Net primary productivity and rain-use efficiency as affected by warming, altered precipitation, and clipping in a mixed-grass prairie. Glob. Chang. Biol. 2013, 19, 2753–2764. [Google Scholar] [CrossRef]
- Gu, F.X.; Zhang, Y.D.; Huang, M.; Tao, B.; Liu, Z.J.; Hao, M.; Guo, R.; Guo, R. Climate-driven uncertainties in modeling terrestrial ecosystem net primary productivity in China. Agric. For. Meteorol. 2017, 246, 123–132. [Google Scholar] [CrossRef]
- Wen, Z.; Wu, S.; Chen, J.; Lü, M. NDVI indicated long-term interannual changes in vegetation activities and their responses to climatic and anthropogenic factors in the Three Gorges Reservoir Region, China. Sci. Total Environ. 2017, 574, 947–959. [Google Scholar] [CrossRef] [PubMed]
- Wu, Y.Y.; Wu, Z.F. Quantitative assessment of human-induced impacts based on net primary productivity in Guangzhou, China. Environ. Sci. Pollut. Res. 2018, 25, 11384–11399. [Google Scholar] [CrossRef] [PubMed]
- Zhang, P.; Li, Y.; Jing, W.; Yang, D.; Zhang, Y.; Liu, Y.; Geng, W.; Rong, T.; Shao, J.; Yang, J.; et al. Comprehensive assessment of the effect of urban built-up land expansion and climate change on net primary productivity. Complexity 2020, 2020, 8489025. [Google Scholar] [CrossRef]
- Li, H.; Ding, J.; Zhang, J.; Yang, Z.; Yang, B.; Zhu, Q.; Peng, C. Effects of land cover changes on net primary productivity in the terrestrial ecosystems of China from 2001 to 2012. Land 2020, 9, 480. [Google Scholar] [CrossRef]
- Jiang, C.; Wu, Z.F.; Cheng, J.; Yu, Q.; Rao, X.Q. Impacts of urbanization on net primary productivity in the pearl river delta, China. Int. J. Plant Prod. 2015, 9, 581–598. [Google Scholar]
- Wu, Y.Y.; Wu, Z.F.; Liu, X.N. Dynamic changes of net primary productivity and associated urban growth driving forces in Guangzhou City, China. Environ. Manag. 2020, 65, 758–773. [Google Scholar] [CrossRef] [PubMed]
- Yao, R.; Wang, L.; Gui, X.; Zheng, Y.; Zhang, H.; Huang, X. Urbanization effects on vegetation and surface urban heat islands in China’s Yangtze River Basin. Remote Sens. 2017, 9, 540. [Google Scholar] [CrossRef] [Green Version]
- DeFries, R.S.; Field, C.B.; Fung, I.; Collatz, G.J.; Bounoua, L. Combining satellite data and biogeochemical models to estimate global effects of human-induced land cover change on carbon emissions and primary productivity. Glob. Biogeochem. Cycles 1999, 13, 803–815. [Google Scholar] [CrossRef]
- Houghton, R.A. Changes in the storage of terrestrial carbon since 1850. In Soils and Global Change; CRC Press: Boca Raton, FL, USA, 2010. [Google Scholar]
- Wang, X.; Yan, F.; Su, F. Impacts of urbanization on the ecosystem services in the Guangdong-Hong Kong-Macao greater bay area, China. Remote Sens. 2020, 12, 3269. [Google Scholar] [CrossRef]
- Teng, M.J.; Zeng, L.X.; Hu, W.J.; Wang, P.C.; Yan, Z.G.; He, W.; Zhang, Y.; Huang, Z.L.; Xiao, W.F. The impacts of climate changes and human activities on net primary productivity vary across an ecotone zone in Northwest China. Sci. Total Environ. 2020, 714, 136691. [Google Scholar] [CrossRef]
- Qu, S.; Wang, L.C.; Lin, A.W.; Zhu, H.J.; Yuan, M.X. What drives the vegetation restoration in Yangtze River basin, China: Climate change or anthropogenic factors? Ecol. Indic. 2018, 90, 438–450. [Google Scholar] [CrossRef]
- Huang, J.; Zhang, G.; Zhang, Y.; Guan, X.; Wei, Y.; Guo, R. Global desertification vulnerability to climate change and human activities. L. Degrad. Dev. 2020, 31, 1380–1391. [Google Scholar] [CrossRef]
- Haq, M.A.; Baral, P.; Yaragal, S.; Pradhan, B. Bulk Processing of Multi-Temporal Modis Data, Statistical Analyses and Machine Learning Algorithms to Understand Climate Variables in the Indian Himalayan Region. Sensors 2021, 21, 7416. [Google Scholar] [CrossRef] [PubMed]
- Huang, K.; Zhang, Y.; Zhu, J.; Liu, Y.; Zu, J.; Zhang, J. The Influences of Climate Change and Human Activities on Vegetation Dynamics in the Qinghai-Tibet Plateau. Remote Sens. 2016, 8, 876. [Google Scholar] [CrossRef] [Green Version]
- Chen, T.; Tang, G.; Yuan, Y.; Guo, H.; Xu, Z.; Jiang, G.; Chen, X. Unraveling the relative impacts of climate change and human activities on grassland productivity in Central Asia over last three decades. Sci. Total Environ. 2020, 743, 140649. [Google Scholar] [CrossRef] [PubMed]
- Yin, L.; Dai, E.; Zheng, D.; Wang, Y.; Ma, L.; Tong, M. What drives the vegetation dynamics in the Hengduan Mountain region, southwest China: Climate change or human activity? Ecol. Indic. 2020, 112, 106013. [Google Scholar] [CrossRef]
- Andela, N.; Morton, D.C.; Giglio, L.; Chen, Y.; van der Werf, G.R.; Kasibhatla, P.S.; DeFries, R.S.; Collatz, G.J.; Hantson, S.; Kloster, S.; et al. A human-driven decline in global burned area. Science 2017, 356, 1356–1362. [Google Scholar] [CrossRef] [Green Version]
- Liu, W.; Zhan, J.; Zhao, F.; Yan, H.; Zhang, F.; Wei, X. Impacts of urbanization-induced land-use changes on ecosystem services: A case study of the Pearl River Delta Metropolitan Region, China. Ecol. Indic. 2019, 98, 228–238. [Google Scholar] [CrossRef]
- Zhao, J.; Zhang, S.; Yin, X.; Zhu, Y.; Duan, G. Changes in vegetation coverage and its influencing factors across the Guangdong-Hong Kong-Macao Greater Bay Area. Sci. Surv. Mapp. 2022, 47, 75–84. (In Chinese) [Google Scholar]
- Li, L.; Chan, P.W.; Deng, T.; Yang, H.-L.; Luo, H.-Y.; Xia, D.; He, Y.-Q. Review of advances in urban climate study in the Guangdong-Hong Kong-Macau Greater Bay Area, China. Atmos. Res. 2021, 261, 105759. [Google Scholar] [CrossRef]
- Olofsson, P.; Eklundh, L.; Lagergren, F.; Jönsson, P.; Lindroth, A. Estimating net primary production for Scandinavian forests using data from Terra/MODIS. Adv. Sp. Res. 2007, 39, 125–130. [Google Scholar] [CrossRef]
- Jiang, H.; Xu, X.; Guan, M.; Wang, L.; Huang, Y.; Jiang, Y. Determining the contributions of climate change and human activities to vegetation dynamics in agro-pastural transitional zone of northern China from 2000 to 2015. Sci. Total Environ. 2020, 718, 134871. [Google Scholar] [CrossRef]
- Hao, F.; Zhang, X.; Ouyang, W.; Skidmore, A.K.; Toxopeus, A.G. Vegetation NDVI Linked to Temperature and Precipitation in the Upper Catchments of Yellow River. Environ. Model. Assess. 2012, 17, 389–398. [Google Scholar] [CrossRef] [Green Version]
- Holben, B.N. Characteristics of maximum-value composite images from temporal AVHRR data. Int. J. Remote Sens. 1986, 7, 1417–1434. [Google Scholar] [CrossRef]
- Haq, M.A.; Baral, P.; Yaragal, S.; Rahaman, G. Assessment of trends of land surface vegetation distribution, snow cover and temperature over entire Himachal Pradesh using MODIS datasets. Nat. Resour. Model. 2020, 33, e12262. [Google Scholar] [CrossRef]
- Qu, S.; Wang, L.C.; Lin, A.W.; Yu, D.Q.; Yuan, M.X.; Li, C.A. Distinguishing the impacts of climate change and anthropogenic factors on vegetation dynamics in the Yangtze River Basin, China. Ecol. Indic. 2020, 108, 105724. [Google Scholar] [CrossRef]
- Tucker, C.J.; Newcomb, W.W.; Dregne, H.E. AVHRR data sets for determination of desert spatial extent. Int. J. Remote Sens. 1994, 15, 3547–3565. [Google Scholar] [CrossRef]
- Zhang, X.; Liu, L.Y.; Chen, X.D.; Gao, Y.; Xie, S.; Mi, J. GLC_FCS30: Global land-cover product with fine classification system at 30 m using time-series Landsat imagery. Earth Syst. Sci. Data 2021, 13, 2753–2776. [Google Scholar] [CrossRef]
- Zhang, X.; Liu, L.Y.; Wu, C.S.; Chen, X.D.; Gao, Y.; Xie, S.; Zhang, B. Development of a global 30 m impervious surface map using multisource and multitemporal remote sensing datasets with the Google Earth Engine platform. Earth Syst. Sci. Data 2020, 12, 1625–1648. [Google Scholar] [CrossRef]
- Glover, J.; McCulloch, J.S.G. The empirical relation between solar radiation and hours of bright sunshine in the high-altitude tropics. Q. J. R. Meteorol. Soc. 1958, 84, 56–60. [Google Scholar] [CrossRef]
- Jeffrey, S.J.; Carter, J.O.; Moodie, K.B.; Beswick, A.R. Using spatial interpolation to construct a comprehensive archive of Australian climate data. Environ. Model. Softw. 2001, 16, 309–330. [Google Scholar] [CrossRef]
- Zhou, G.S.; Zhang, X.S. Study on NPP of natural vegetation in China under global climate change. Acta Phytoecol. Sin. 1996, 20, 11–19. (In Chinese) [Google Scholar]
- Potter, C.S.; Randerson, J.T.; Field, C.B.; Matson, P.A.; Vitousek, P.M.; Mooney, H.A.; Klooster, S.A. Terrestrial ecosystem production: A process model based on global satellite and surface data. Glob. Biogeochem. Cycles 1993, 7, 811–841. [Google Scholar] [CrossRef]
- Ruimy, A.; Saugier, B.; Dedieu, G. Methodology for the estimation of terrestrial net primary production from remotely sensed data. J. Geophys. Res. 1994, 99, 5263. [Google Scholar] [CrossRef]
- Zhu, W.Q.; Pan, Y.Z.; He, H.; Yu, D.Y.; Hu, H.B. Simulation of maximum light use efficiency for some typical vegetation types in China. Chin. Sci. Bull. 2006, 51, 457–463. [Google Scholar] [CrossRef]
- Prince, S.D. A model of regional primary production for use with coarse resolution satellite data. Int. J. Remote Sens. 1991, 12, 1313–1330. [Google Scholar] [CrossRef]
- Bao, G.; Bao, Y.; Qin, Z.; Xin, X.; Bao, Y.; Bayarsaikan, S.; Zhou, Y.; Chuntai, B. Modeling net primary productivity of terrestrial ecosystems in the semi-arid climate of the Mongolian Plateau using LSWI-based CASA ecosystem model. Int. J. Appl. Earth Obs. Geoinf. 2016, 46, 84–93. [Google Scholar] [CrossRef]
- Jiang, C.; Mu, X.; Wang, F.; Zhao, G. Analysis of extreme temperature events in the Qinling Mountains and surrounding area during 1960–2012. Quat. Int. 2016, 392, 155–167. [Google Scholar] [CrossRef]
- Li, X.; Luo, Y.; Wu, J. Decoupling Relationship between Urbanization and Carbon Sequestration in the Pearl River Delta from 2000 to 2020. Remote Sens. 2022, 14, 526. [Google Scholar] [CrossRef]
- Zhang, Y. A time-series approach to detect urbanized areas using biophysical indicators and Landsat satellite imagery. IEEE J. Sel. Top. Appl. Earth Obs. Remote Sens. 2021, 14, 9210–9222. [Google Scholar] [CrossRef]
- Neeti, N.; Eastman, J.R. A contextual Mann-Kendall approach for the assessment of trend significance in image time series. Trans. GIS 2011, 15, 599–611. [Google Scholar] [CrossRef]
- Kendall, M.G. Rank Correlation Methods; Griffin: London, UK, 1975. [Google Scholar]
- Luedeling, E.; Gassner, A. Partial Least Squares Regression for analyzing walnut phenology in California. Agric. For. Meteorol. 2012, 158–159, 43–52. [Google Scholar] [CrossRef]
- Li, G.; Han, H.; Du, Y.; Hui, D.; Xia, J.; Niu, S.; Li, X.; Wan, S. Effects of warming and increased precipitation on net ecosystem productivity: A long-term manipulative experiment in a semiarid grassland. Agric. For. Meteorol. 2017, 232, 359–366. [Google Scholar] [CrossRef]
- Li, S.; Liang, W.; Fu, B.; Lü, Y.; Fu, S.; Wang, S.; Su, H. Vegetation changes in recent large-scale ecological restoration projects and subsequent impact on water resources in China’s Loess Plateau. Sci. Total Environ. 2016, 569–570, 1032–1039. [Google Scholar] [CrossRef]
- Gill, R.A.; Kelly, R.H.; Parton, W.J.; Day, K.A.; Jackson, R.B.; Morgan, J.A.; Scurlock, J.M.O.; Tieszen, L.L.; Castle, J.V.; Ojima, D.S. Using simple environmental variables to estimate below-ground productivity in grasslands. Glob. Ecol. Biogeogr. 2002, 11, 79–86. [Google Scholar] [CrossRef]
- Richardson, A.D.; Keenan, T.F.; Migliavacca, M.; Ryu, Y.; Sonnentag, O.; Toomey, M. Climate change, phenology, and phenological control of vegetation feedbacks to the climate system. Agric. For. Meteorol. 2013, 169, 156–173. [Google Scholar] [CrossRef]
- Luo, Z.H.; Wu, W.C.; Yu, X.J.; Song, Q.M.; Yang, J.; Wu, J.H.; Zhang, H.J. Variation of net primary production and its correlation with climate change and anthropogenic activities over the Tibetan Plateau. Remote Sens. 2018, 10, 1352. [Google Scholar] [CrossRef]
- Wen, X.D.; Luo, Z.H.; Fu, L.G. Effects of climate and land use change on npp in Guangdong- Hong Kong-Macao Greater Bay area. Guangxi Sci. 2021, 28, 290–300. (In Chinese) [Google Scholar]
- Peng, J.; Shen, H.; Wu, W.; Liu, Y.; Wang, Y. Net primary productivity (NPP) dynamics and associated urbanization driving forces in metropolitan areas: A case study in Beijing City, China. Landsc. Ecol. 2016, 31, 1077–1092. [Google Scholar] [CrossRef]
- Yang, J.; Zhang, H.; Yan, Y. Dynamic analysis of plantation resources in Guangdong Province based on continuous forest inventory. For. Environ. Sci. 2019, 35, 95–99. (In Chinese) [Google Scholar]
- Wang, S.Q.; Zhou, L.; Chen, J.M.; Ju, W.M.; Feng, X.F.; Wu, W.X. Relationships between net primary productivity and stand age for several forest types and their influence on China’s carbon balance. J. Environ. Manag. 2011, 92, 1651–1662. [Google Scholar] [CrossRef] [PubMed]
- O’Neill, D.W.; Tyedmers, P.H.; Beazley, K.F. Human appropriation of net primary production (HANPP) in Nova Scotia, Canada. Reg. Environ. Chang. 2007, 7, 1–14. [Google Scholar] [CrossRef]
- Bradford, J.B.; Lauenroth, W.K.; Burke, I.C. The impact of cropping on primary production in the U.S. Great Plains. Ecology 2005, 86, 1863–1872. [Google Scholar] [CrossRef]
- Liu, Q.; Fu, Y.S.; Zhu, Z.C.; Liu, Y.W.; Liu, Z.; Huang, M.T.; Janssens, I.A.; Piao, S.L. Delayed autumn phenology in the Northern Hemisphere is related to change in both climate and spring phenology. Glob. Chang. Biol. 2016, 22, 3702–3711. [Google Scholar] [CrossRef]
- Eisfelder, C.; Klein, I.; Niklaus, M.; Kuenzer, C. Net primary productivity in Kazakhstan, its spatio-temporal patterns and relation to meteorological variables. J. Arid Environ. 2014, 103, 17–30. [Google Scholar] [CrossRef] [Green Version]
- Ge, W.Y.; Deng, L.Q.; Wang, F.; Han, J.Q. Quantifying the contributions of human activities and climate change to vegetation net primary productivity dynamics in China from 2001 to 2016. Sci. Total Environ. 2021, 773, 145648. [Google Scholar] [CrossRef]
- Piao, S.L.; Fang, J.Y.; Chen, A.P. Seasonal dynamics of terrestrial net primary production in response to climate changes in China. Acta Bot. Sin. 2003, 45, 269–275. [Google Scholar]
- Piao, S.L.; Yin, G.D.; Tan, J.G.; Cheng, L.; Huang, M.T.; Li, Y.; Liu, R.G.; Mao, J.F.; Myneni, R.B.; Peng, S.S.; et al. Detection and attribution of vegetation greening trend in China over the last 30 years. Glob. Chang. Biol. 2015, 21, 1601–1609. [Google Scholar] [CrossRef]
- Zheng, S. Has “the outline of the plan for the reform and development of the Pearl River Delta” promoted to the coordination of Guangdong-Hong Kong-Macao Greater Bay Area. Mod. Econ. 2019, 10, 1348–1367. [Google Scholar] [CrossRef] [Green Version]
- Wang, X.; Yan, F.; Zeng, Y.; Chen, M.; Su, F.; Cui, Y. Changes in ecosystems and ecosystem services in the guangdong-hong kong-macao greater bay area since the reform and opening up in china. Remote Sens. 2021, 13, 1611. [Google Scholar] [CrossRef]
- Xu, Q.; Yang, R.; Dong, Y.-X.; Liu, Y.-X.; Qiu, L.-R. The influence of rapid urbanization and land use changes on terrestrial carbon sources/sinks in Guangzhou, China. Ecol. Indic. 2016, 70, 304–316. [Google Scholar] [CrossRef]
- Narducci, J.; Quintas-Soriano, C.; Castro, A.; Som-Castellano, R.; Brandt, J.S. Implications of urban growth and farmland loss for ecosystem services in the western United States. Land Use Policy 2019, 86, 1–11. [Google Scholar] [CrossRef]
- Zhu, W.Q.; Pan, Y.Z.; Zhang, J.S. Estimation of net primary productivity of Chinese terrestrial vegetation based on remote sensing. Chin. J. Plant Ecol. 2007, 31, 413–424. [Google Scholar] [CrossRef] [Green Version]
- Garbulsky, M.F.; Peñuelas, J.; Papale, D.; Ardö, J.; Goulden, M.L.; Kiely, G.; Richardson, A.D.; Rotenberg, E.; Veenendaal, E.M.; Filella, I. Patterns and controls of the variability of radiation use efficiency and primary productivity across terrestrial ecosystems. Glob. Ecol. Biogeogr. 2010, 19, 253–267. [Google Scholar] [CrossRef]
- Kalnay, E.; Cai, M. Impact of urbanization and land-use change on climate. Nature 2003, 423, 528–531. [Google Scholar] [CrossRef]
- Oldfield, F.; Dearing, J.A. The role of human activities in past environmental change. In Paleoclimate, Global Change and the Future; Springer: Berlin/Heidelberg, Germany, 2003; pp. 143–162. [Google Scholar]
- Zhao, F.; Zhang, J.Y.; Liu, S.Y.; Wang, Z.Y.; Wang, L.H.; Gu, H.T.; Li, W.L. Assessing the dividing line between warm temperate and subtropical zones based on the zonality discussion on multi-dimensional response of Net Primary Productivity to climate change in the Qinling-Daba Mountains. Acta Ecol. Sin. 2021, 41, 57–68. [Google Scholar]
Figure 1.
The location of the GBA, with a DEM and land covers in 2020 for the study area.

Figure 2.
Identification of the relative impacts of climate variability and human activities on the NPPa according to the slopes of the NPPa, NPPp, and NPPh. Six scenarios are represented in (a) slope NPPa > 0 and (b) slope NPPa < 0.
Figure 2.
Identification of the relative impacts of climate variability and human activities on the NPPa according to the slopes of the NPPa, NPPp, and NPPh. Six scenarios are represented in (a) slope NPPa > 0 and (b) slope NPPa < 0.

Figure 3.
Validation of the CASA-modeled NPP results for the GBA. Note that the 95% confidence intervals of slopes for the CASA model range from 0.79 to 1.33.
Figure 3.
Validation of the CASA-modeled NPP results for the GBA. Note that the 95% confidence intervals of slopes for the CASA model range from 0.79 to 1.33.
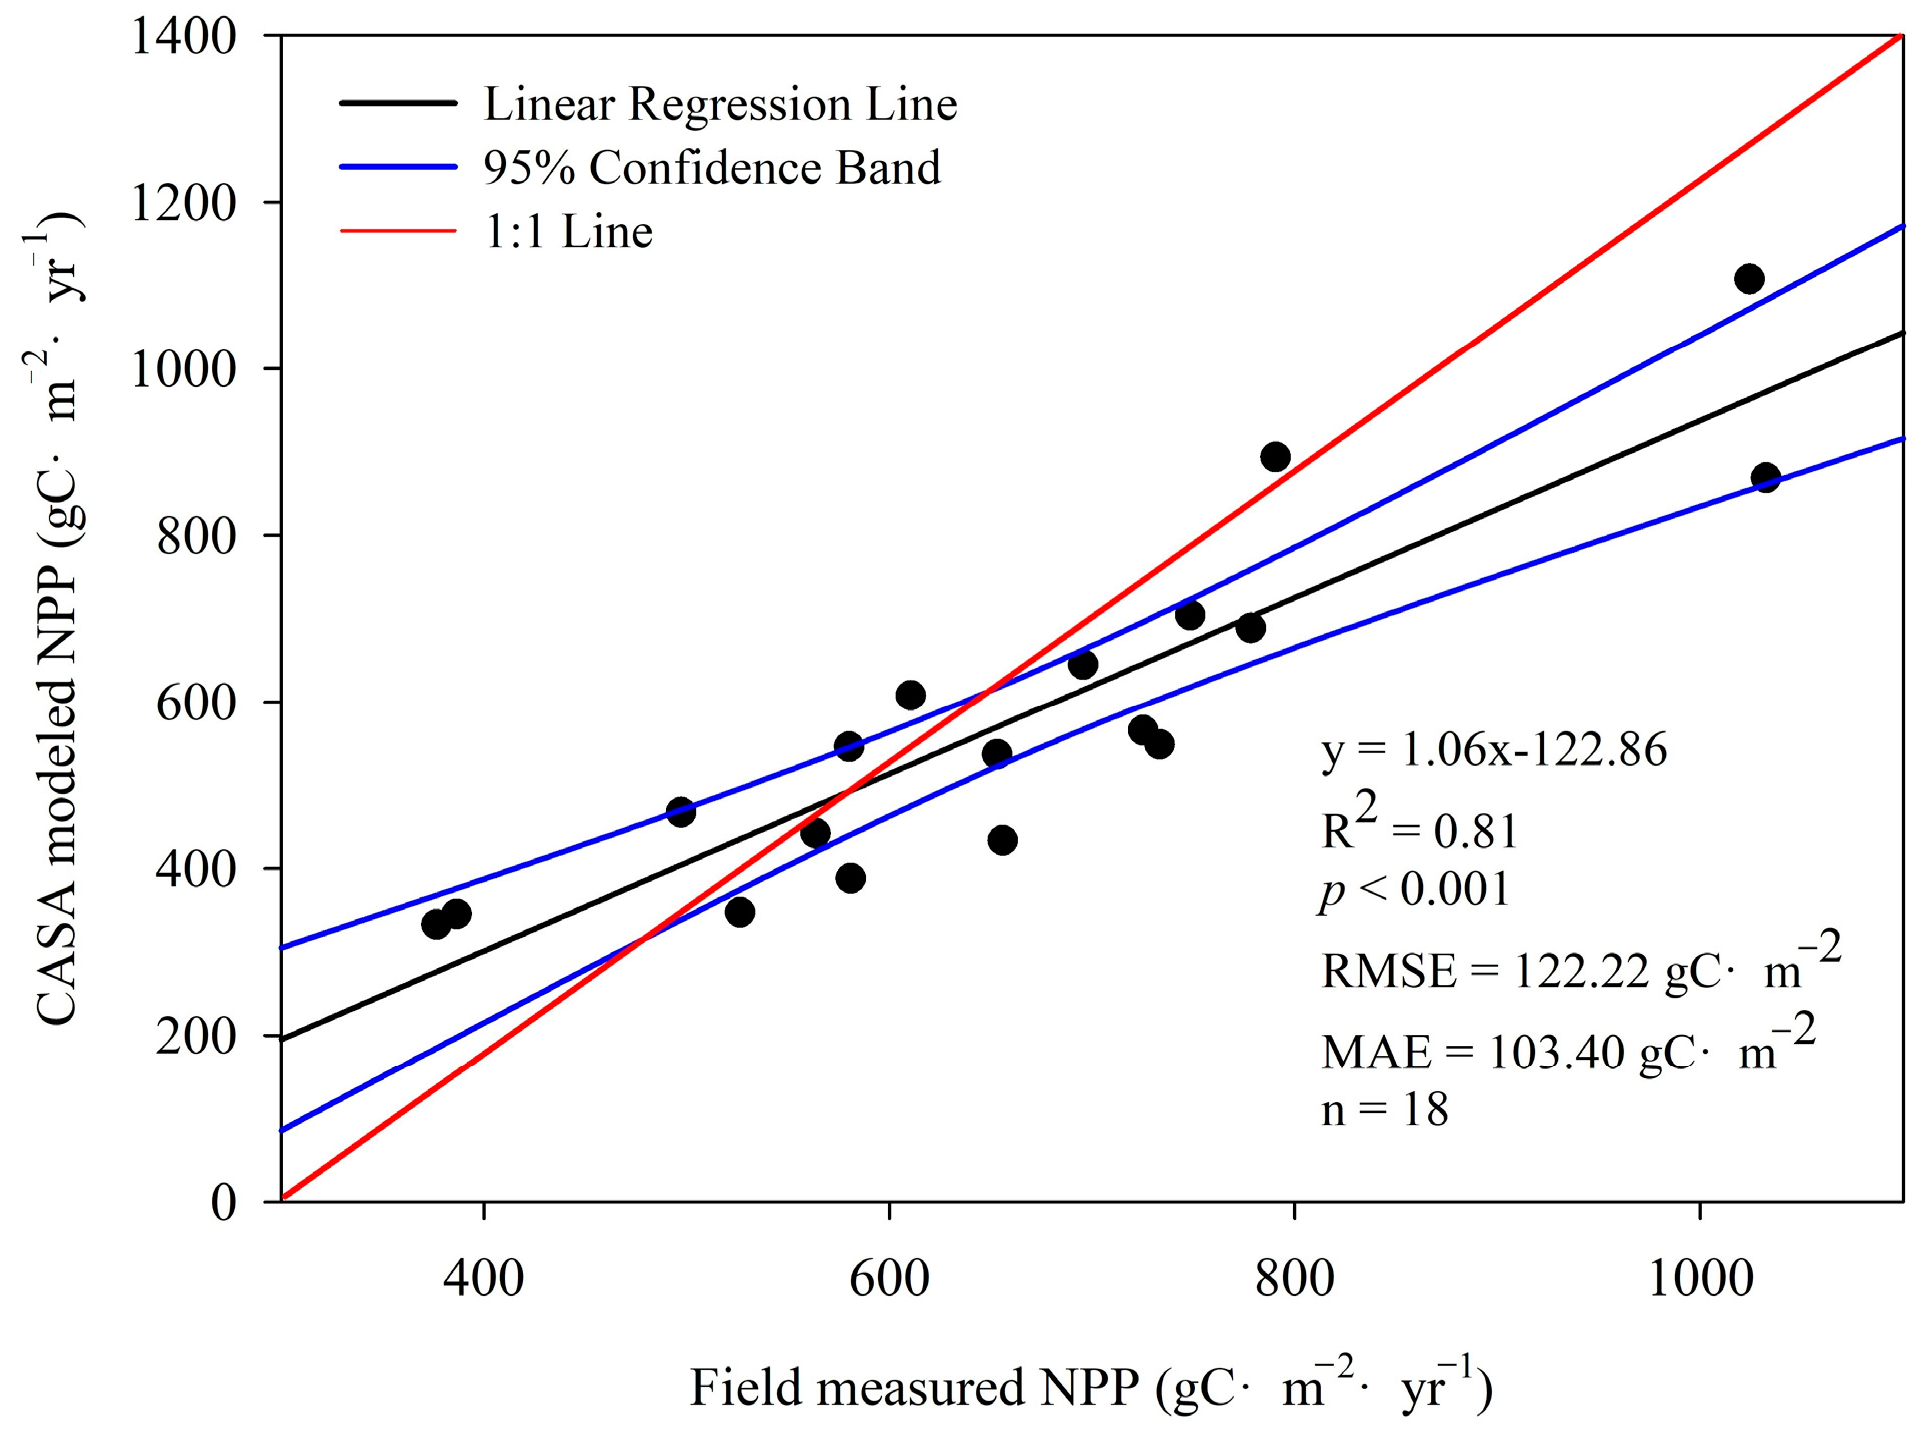
Figure 4.
Spatial patterns of mean annual (a) NPPp, (b) NPPa, and (c) NPPh from 2000 to 2020.

Figure 5.
Trends in annual (a) NPPp, (b) NPPa, and (c) NPPh from 2000 to 2020, and slope significance tests for (d) NPPp, (e) NPPa, and (f) NPPh in the study area. DS, decreased significantly (0.01< p ≤ 0.05); IS, increased significantly (0.01 < p ≤ 0.05); DVS, decreased very significantly (p ≤ 0.01); IVS, increased very significantly (p ≤ 0.01); D_NS, decreased or non-significantly (p > 0.05); I_NS, increased non-significantly (p > 0.05).
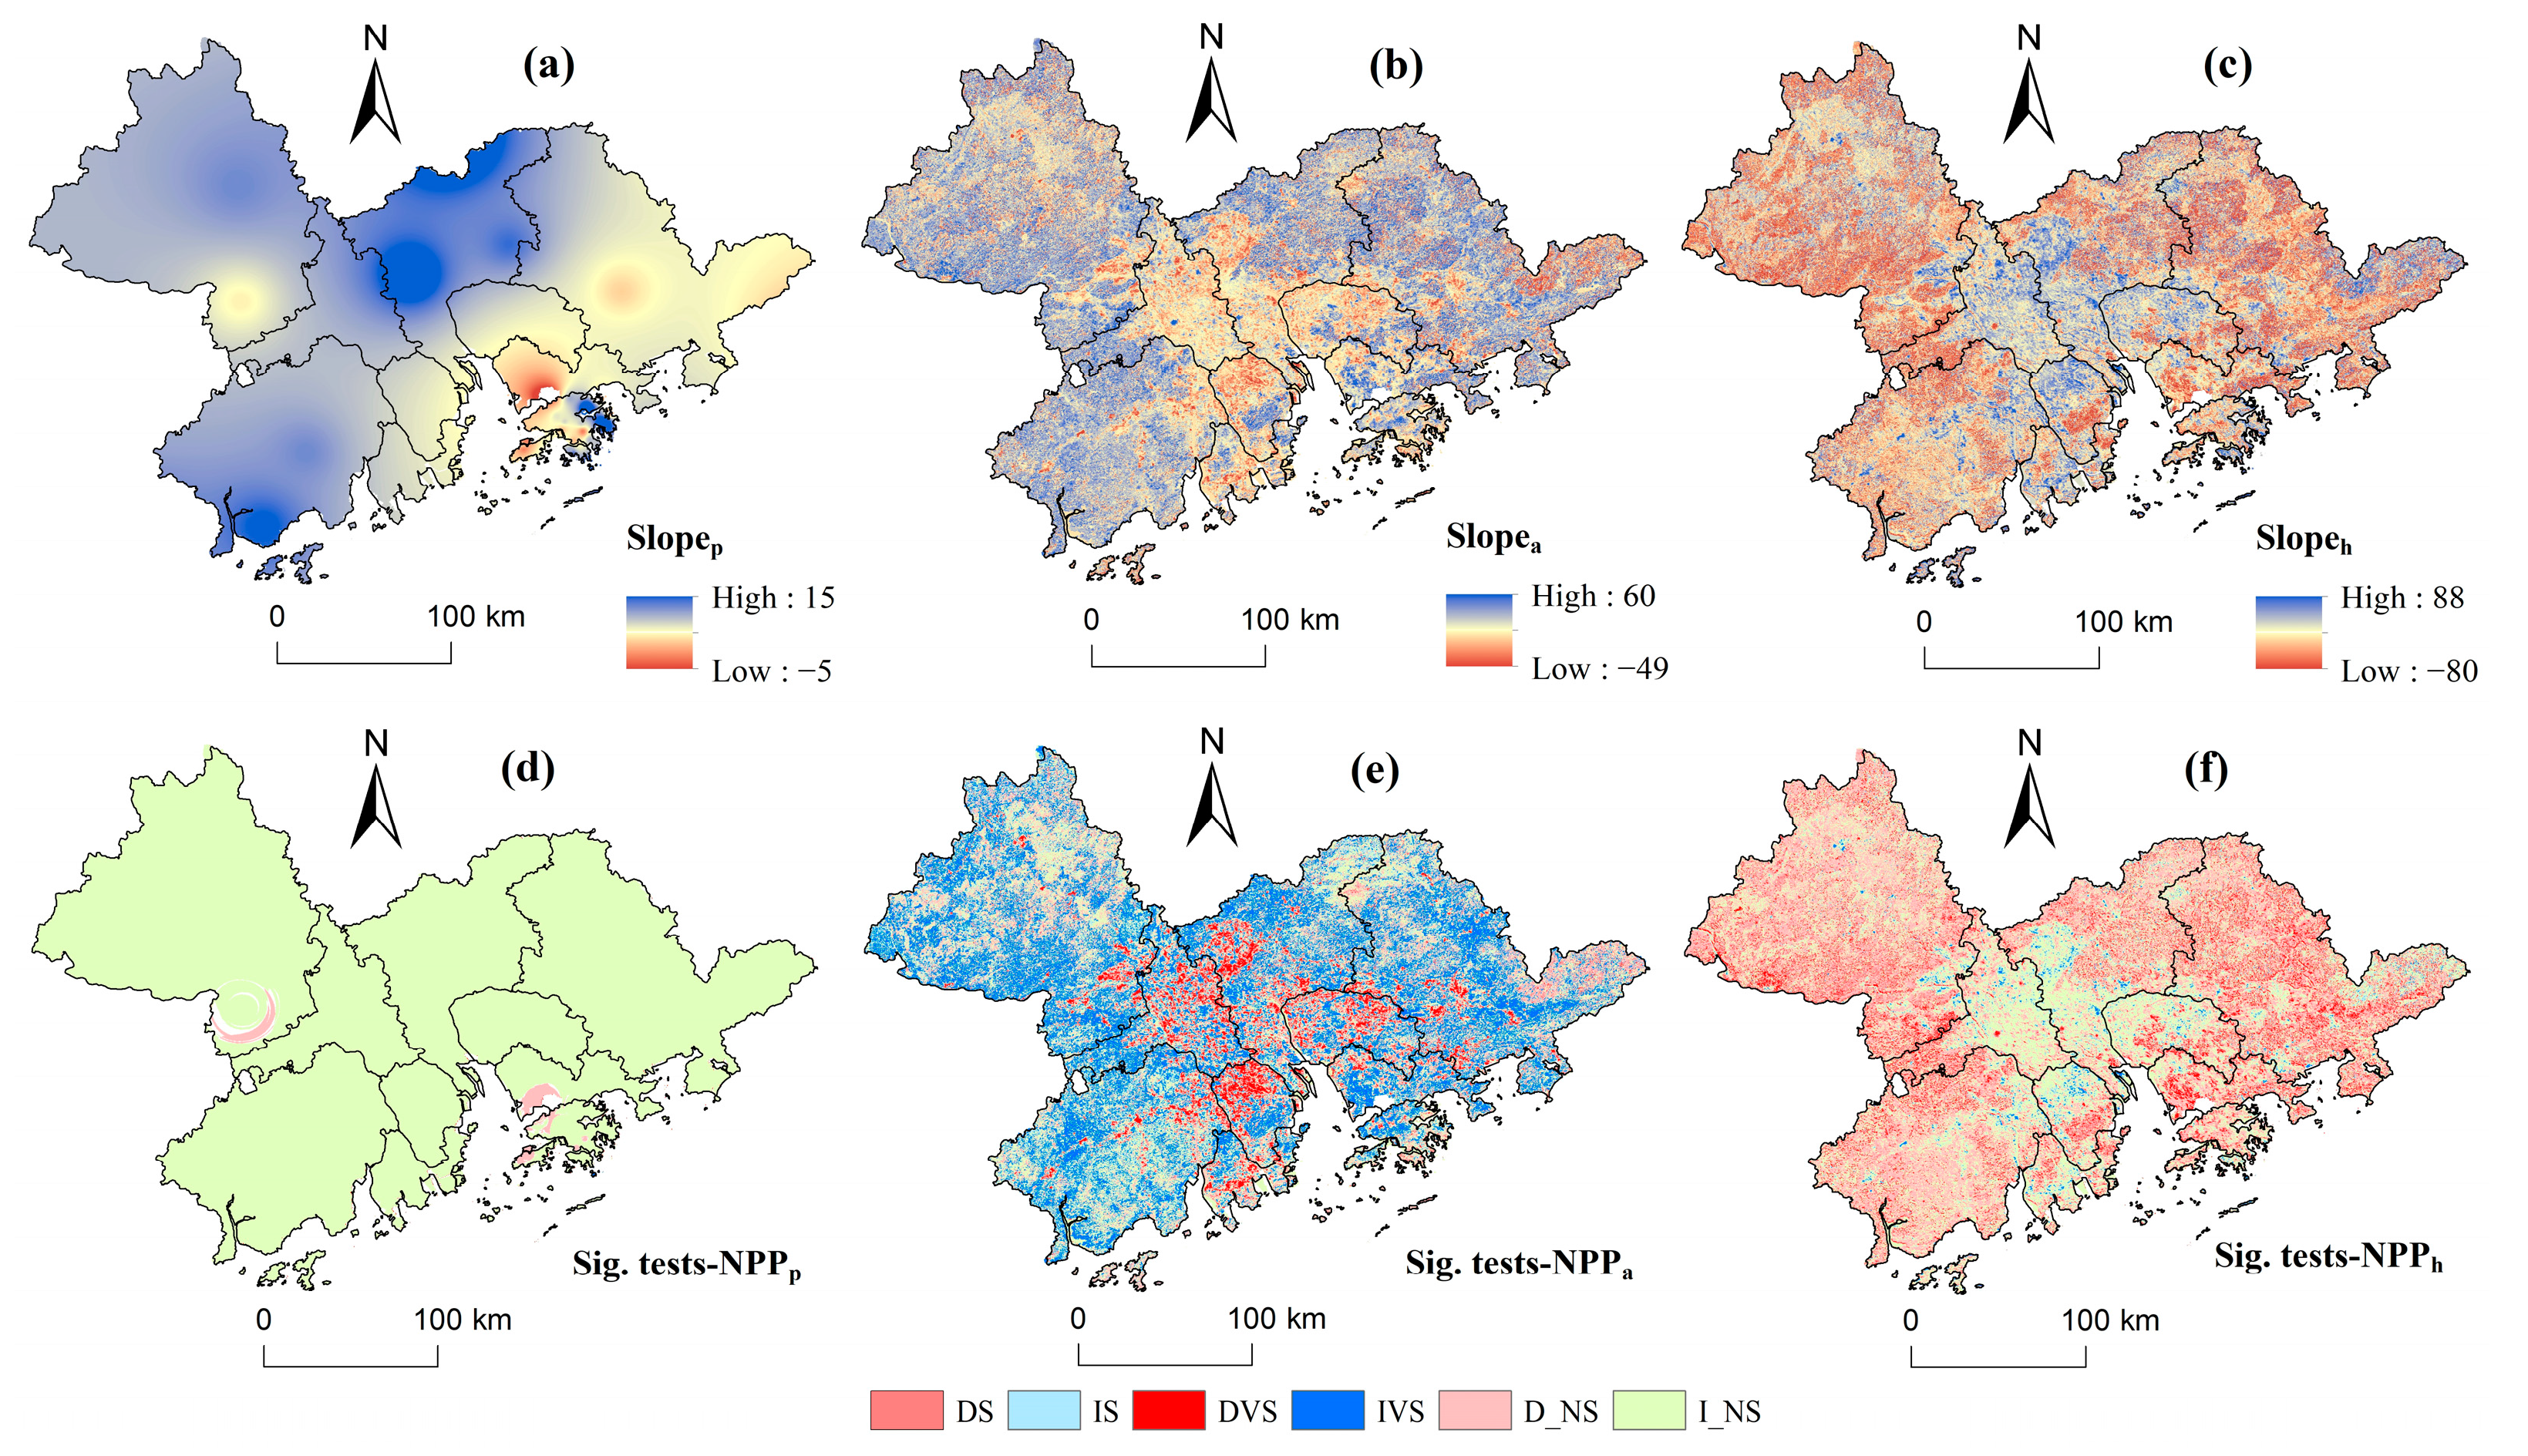
Figure 6.
Partial correlations between NPPa and (a,d) temperature, (b,e) precipitation, and (c,f) solar radiation in the GBA from 2000 to 2020, with corresponding frequency distributions.
Figure 6.
Partial correlations between NPPa and (a,d) temperature, (b,e) precipitation, and (c,f) solar radiation in the GBA from 2000 to 2020, with corresponding frequency distributions.
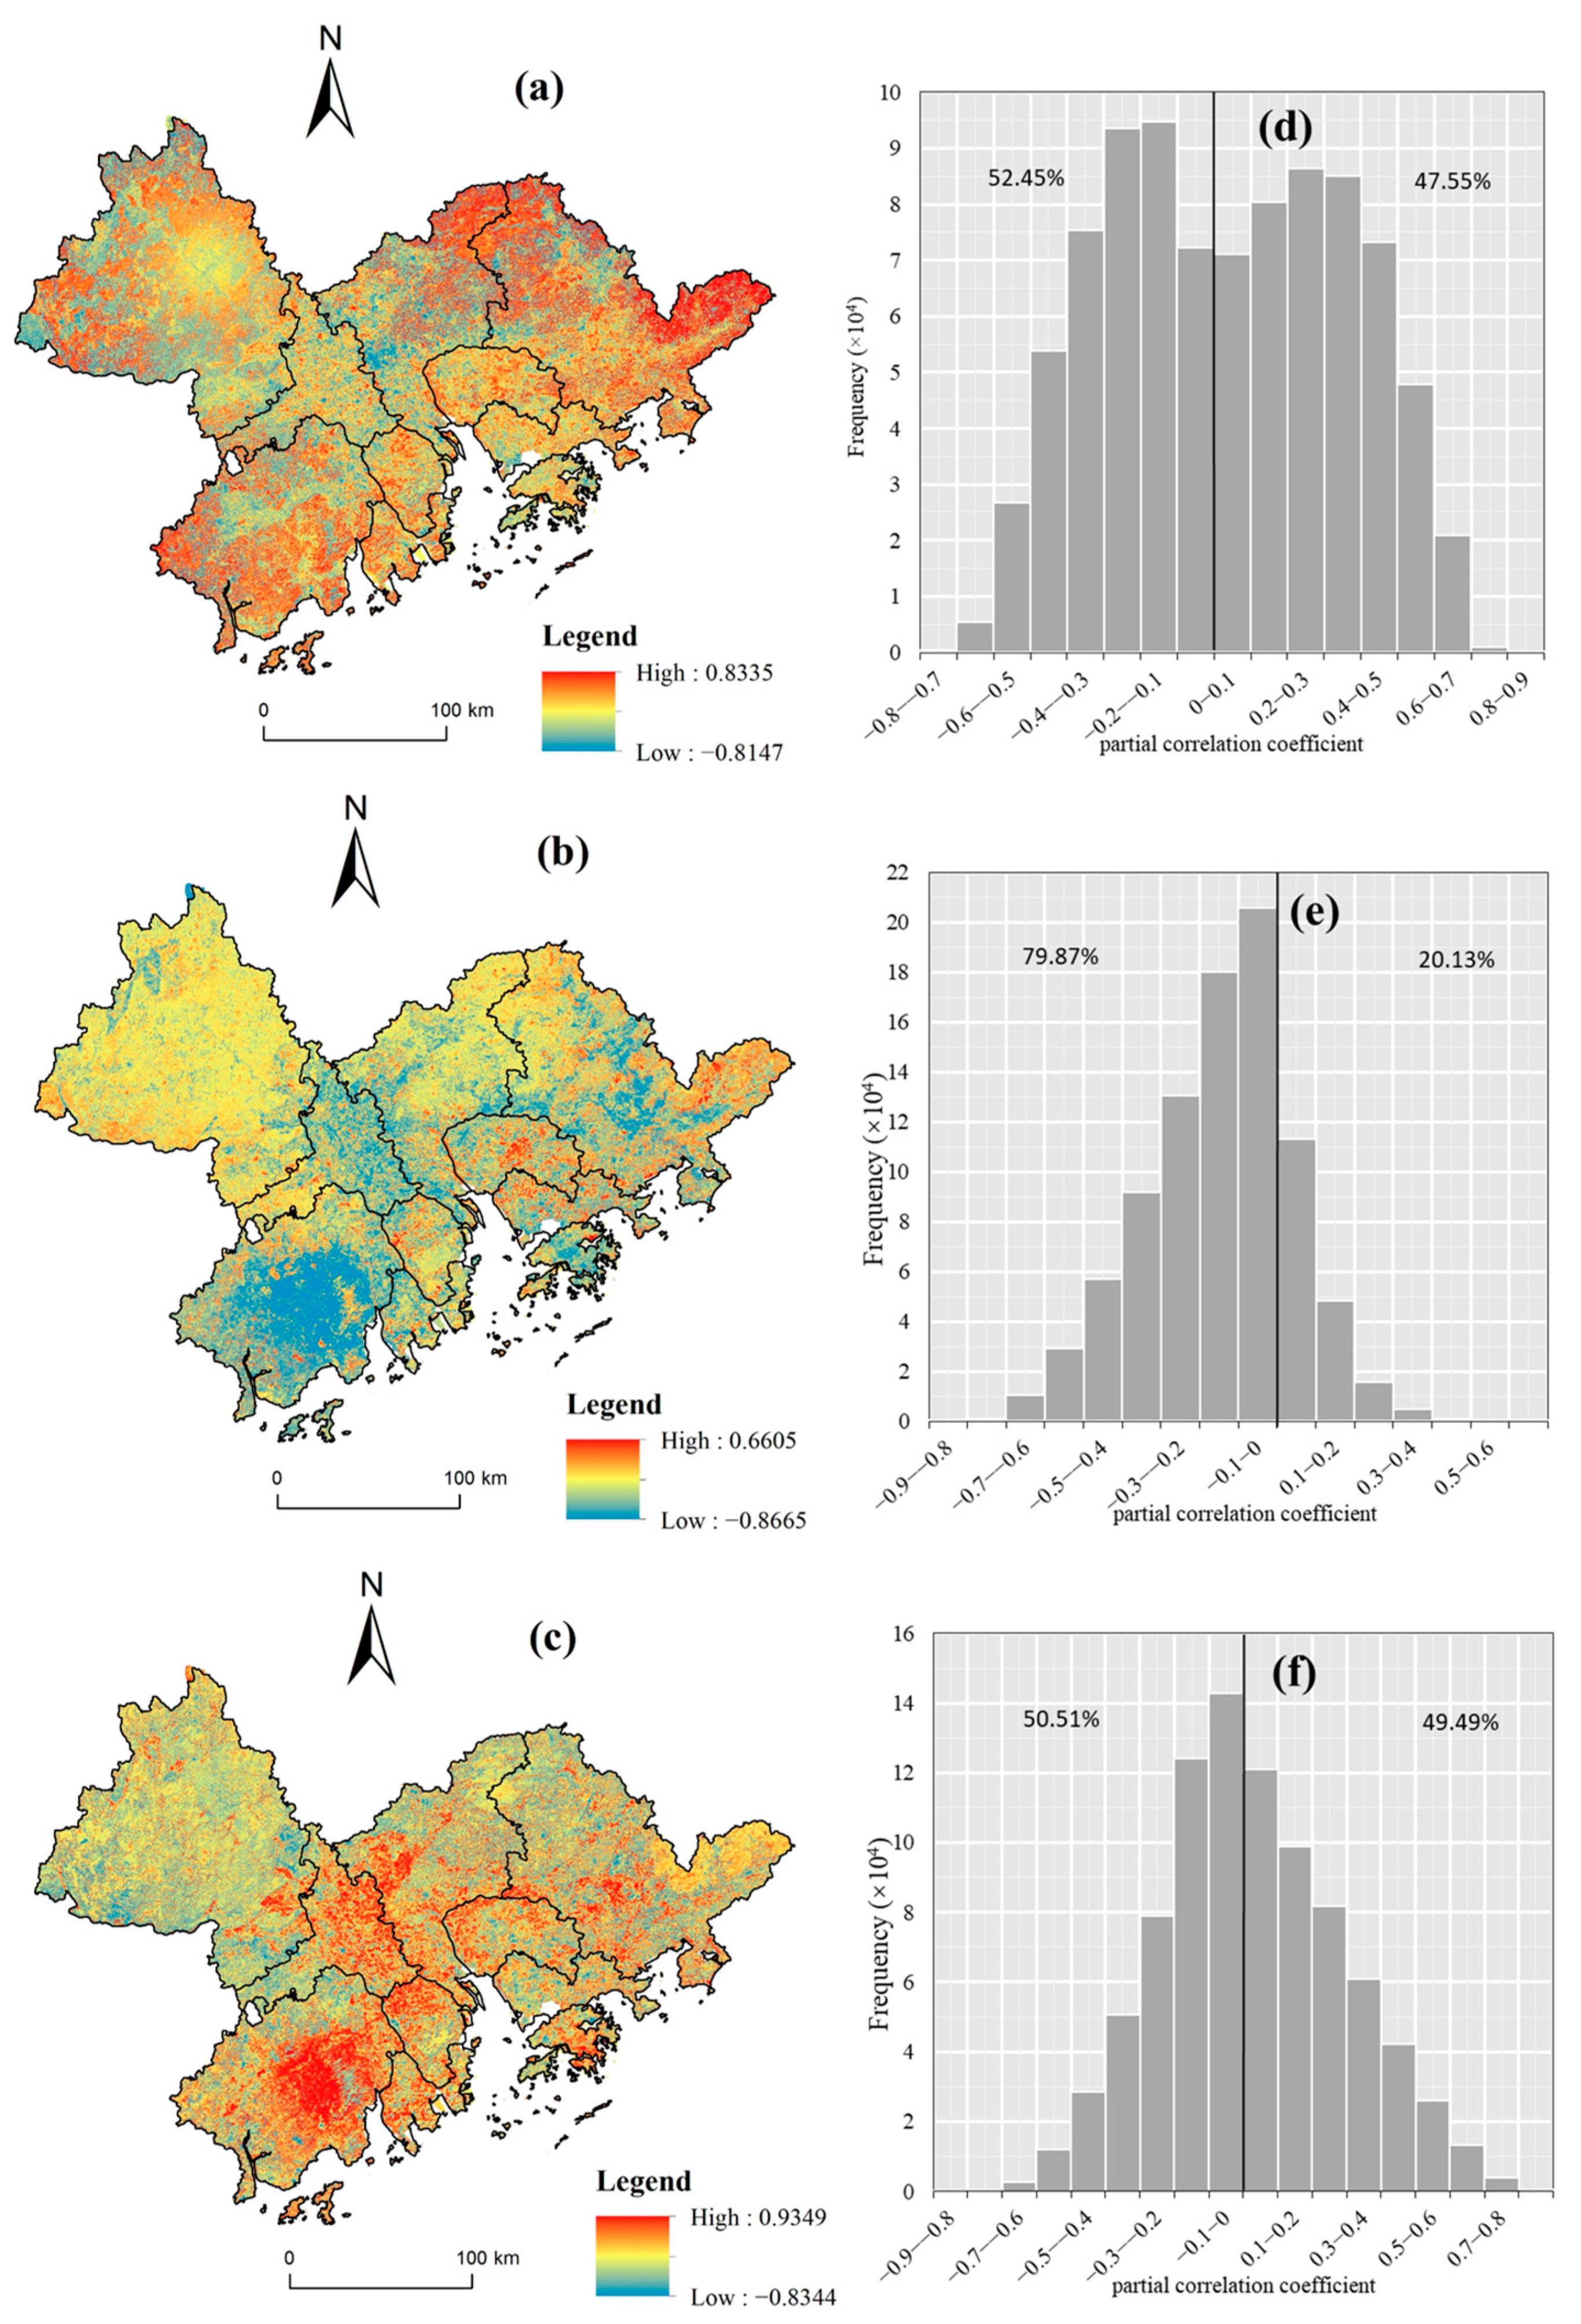
Figure 7.
Sankey diagram for conversion between different land cover types in the GBA from 2000 to 2020. Note that different color lines represent the direction of land type transfer, and the width of the line represents the area transferred.
Figure 7.
Sankey diagram for conversion between different land cover types in the GBA from 2000 to 2020. Note that different color lines represent the direction of land type transfer, and the width of the line represents the area transferred.

Figure 8.
Spatial patterns of (a) six driving forces of NPPa changes from 2000 to 2020 and (b) area proportion. Definitions of the driving forces are given in Figure 2.
Figure 8.
Spatial patterns of (a) six driving forces of NPPa changes from 2000 to 2020 and (b) area proportion. Definitions of the driving forces are given in Figure 2.
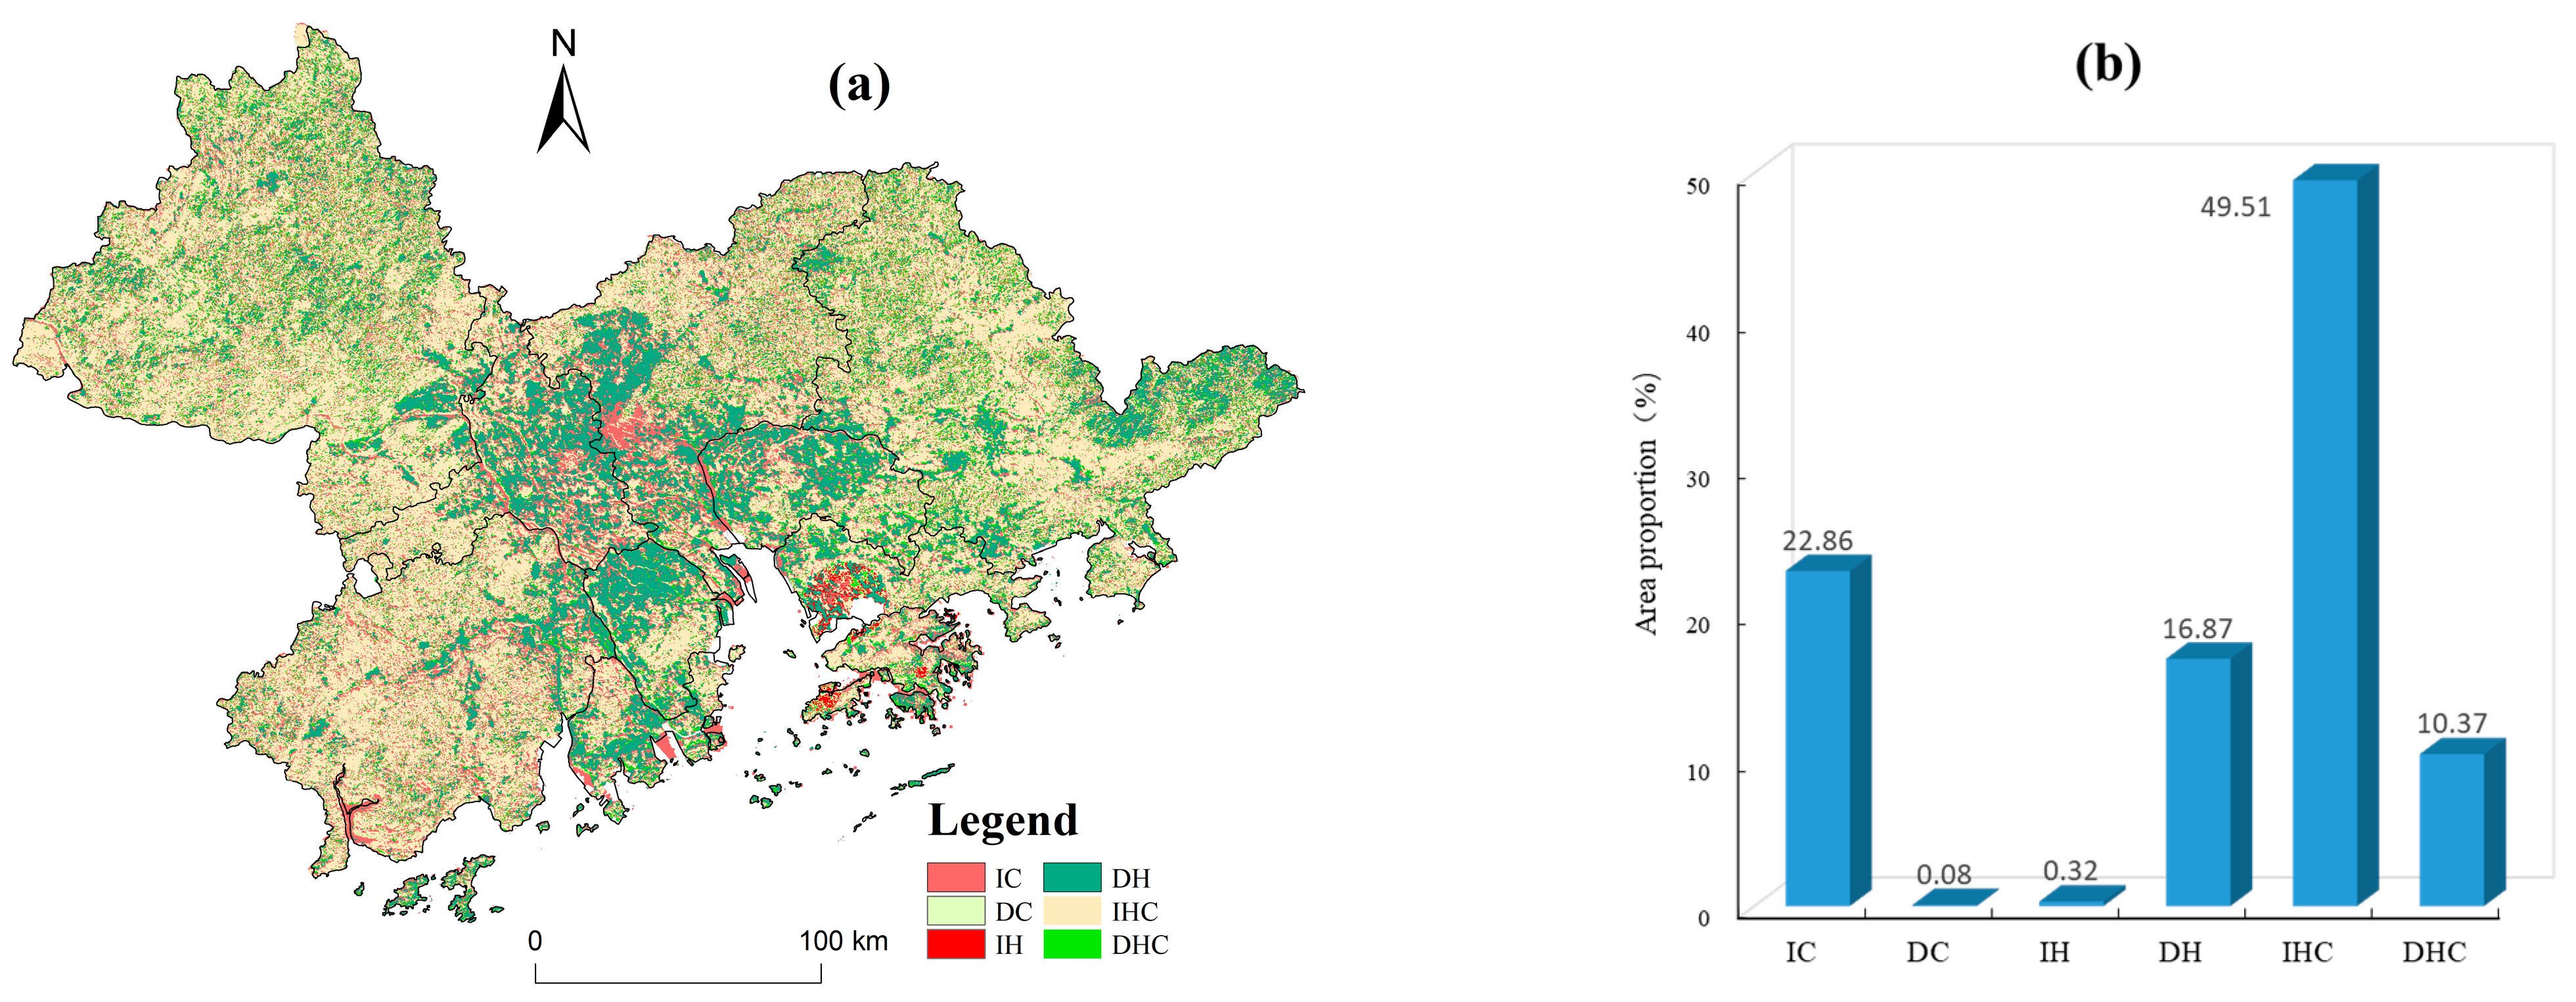
Figure 9.
The area of NPPa changes due to different driving forces in the 11 cities (a) and land cover types (b) from 2000 to 2020. Definitions of the driving forces are given in Figure 2.
Figure 9.
The area of NPPa changes due to different driving forces in the 11 cities (a) and land cover types (b) from 2000 to 2020. Definitions of the driving forces are given in Figure 2.
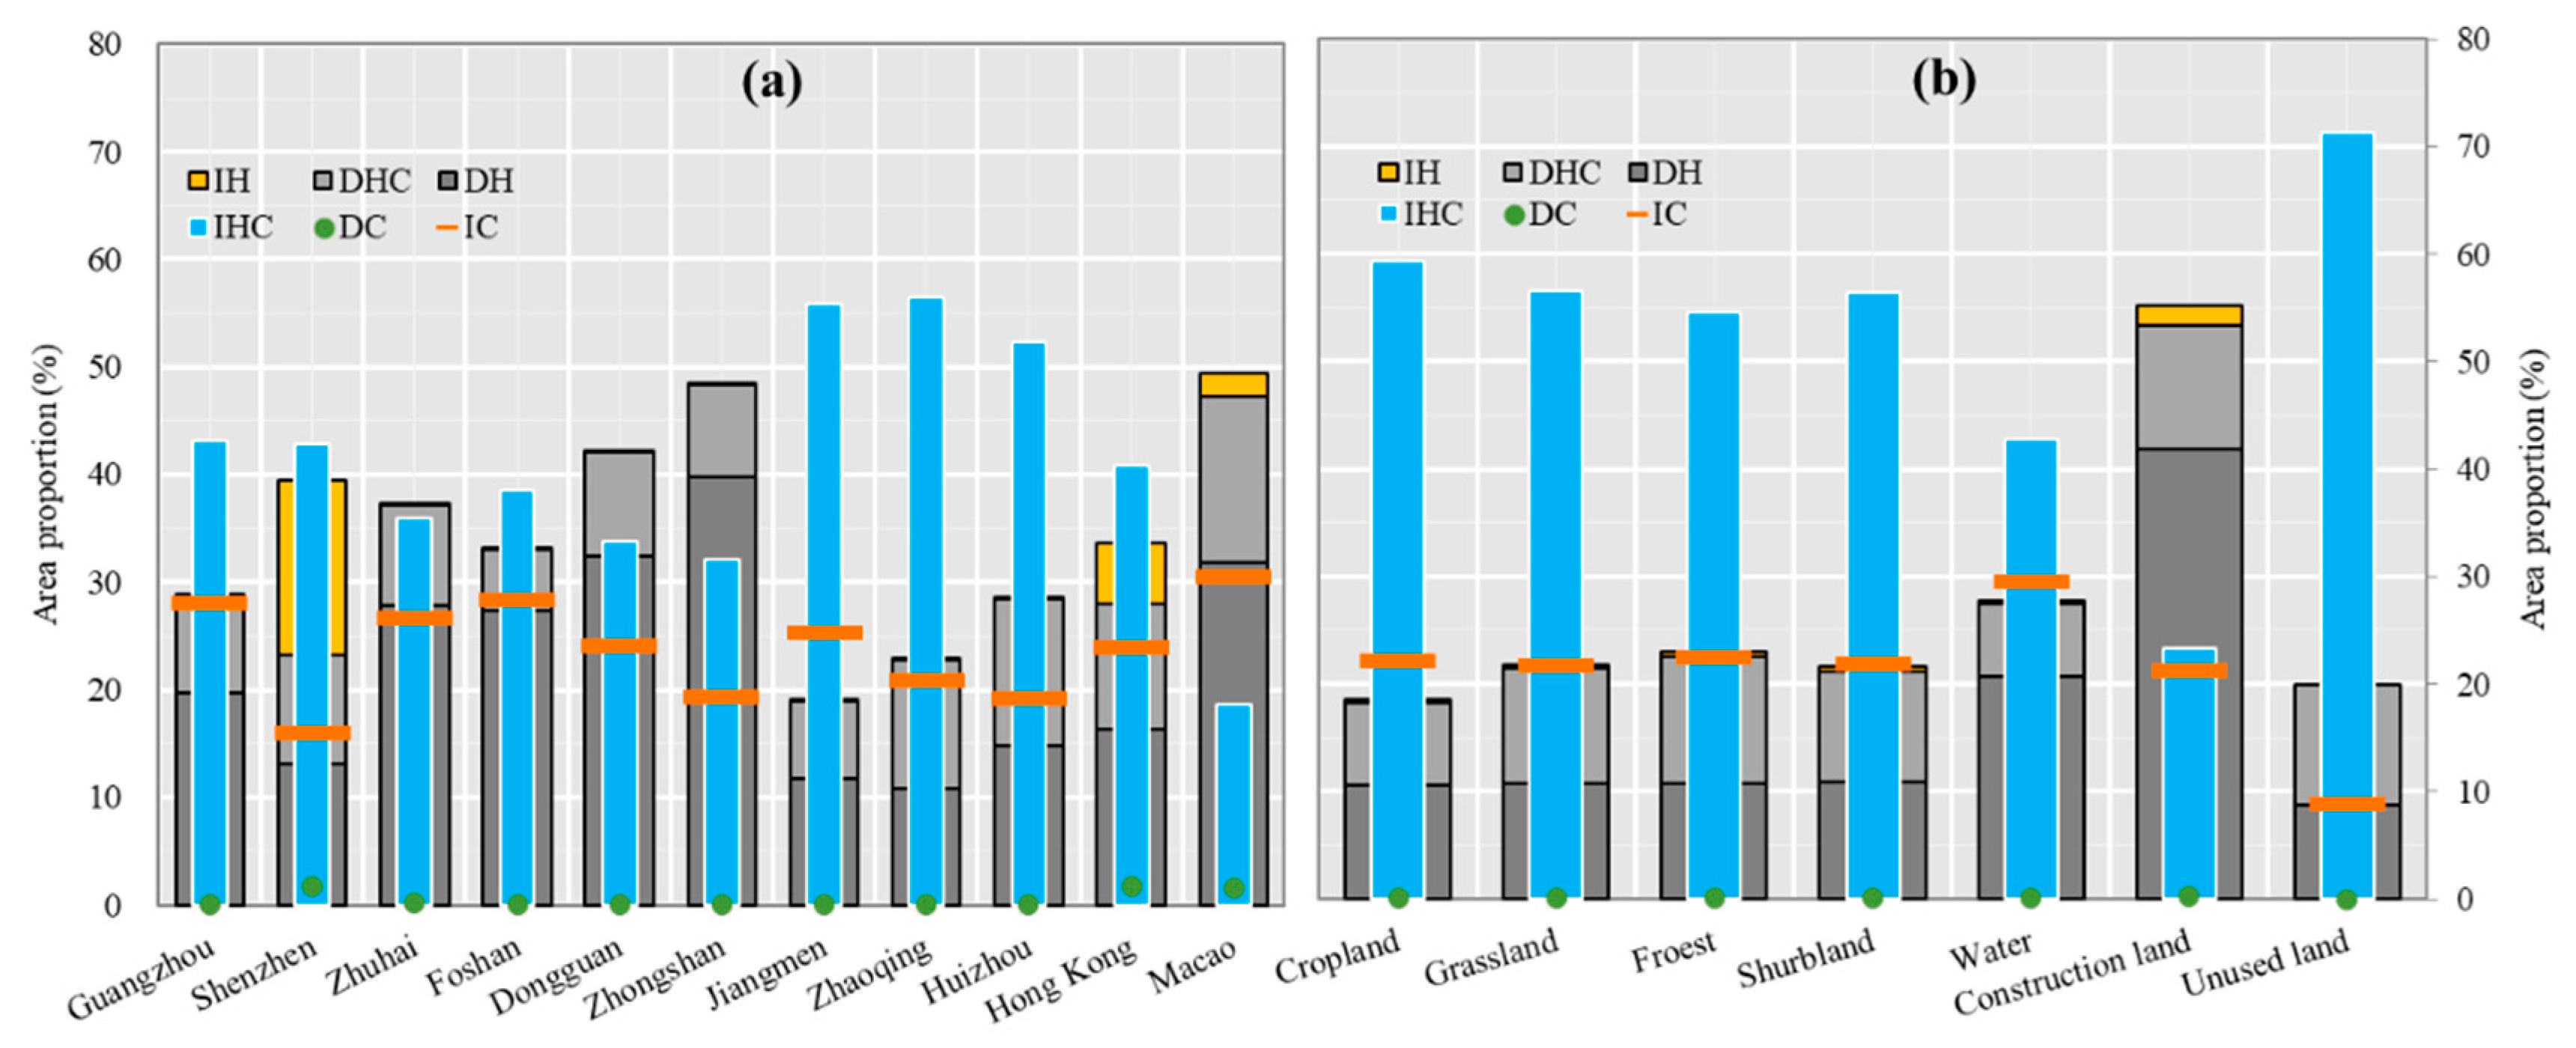
Figure 10.
Trends in annual (a) NPPa, (b) NPPh, and (c) EVI from 2000 to 2020 in the areas where NPPa was negatively influenced by human activities (ADH), and corresponding frequencies of (d) slope NPPa, (e) slope NPPh, and (f) slope EVI values.
Figure 10.
Trends in annual (a) NPPa, (b) NPPh, and (c) EVI from 2000 to 2020 in the areas where NPPa was negatively influenced by human activities (ADH), and corresponding frequencies of (d) slope NPPa, (e) slope NPPh, and (f) slope EVI values.
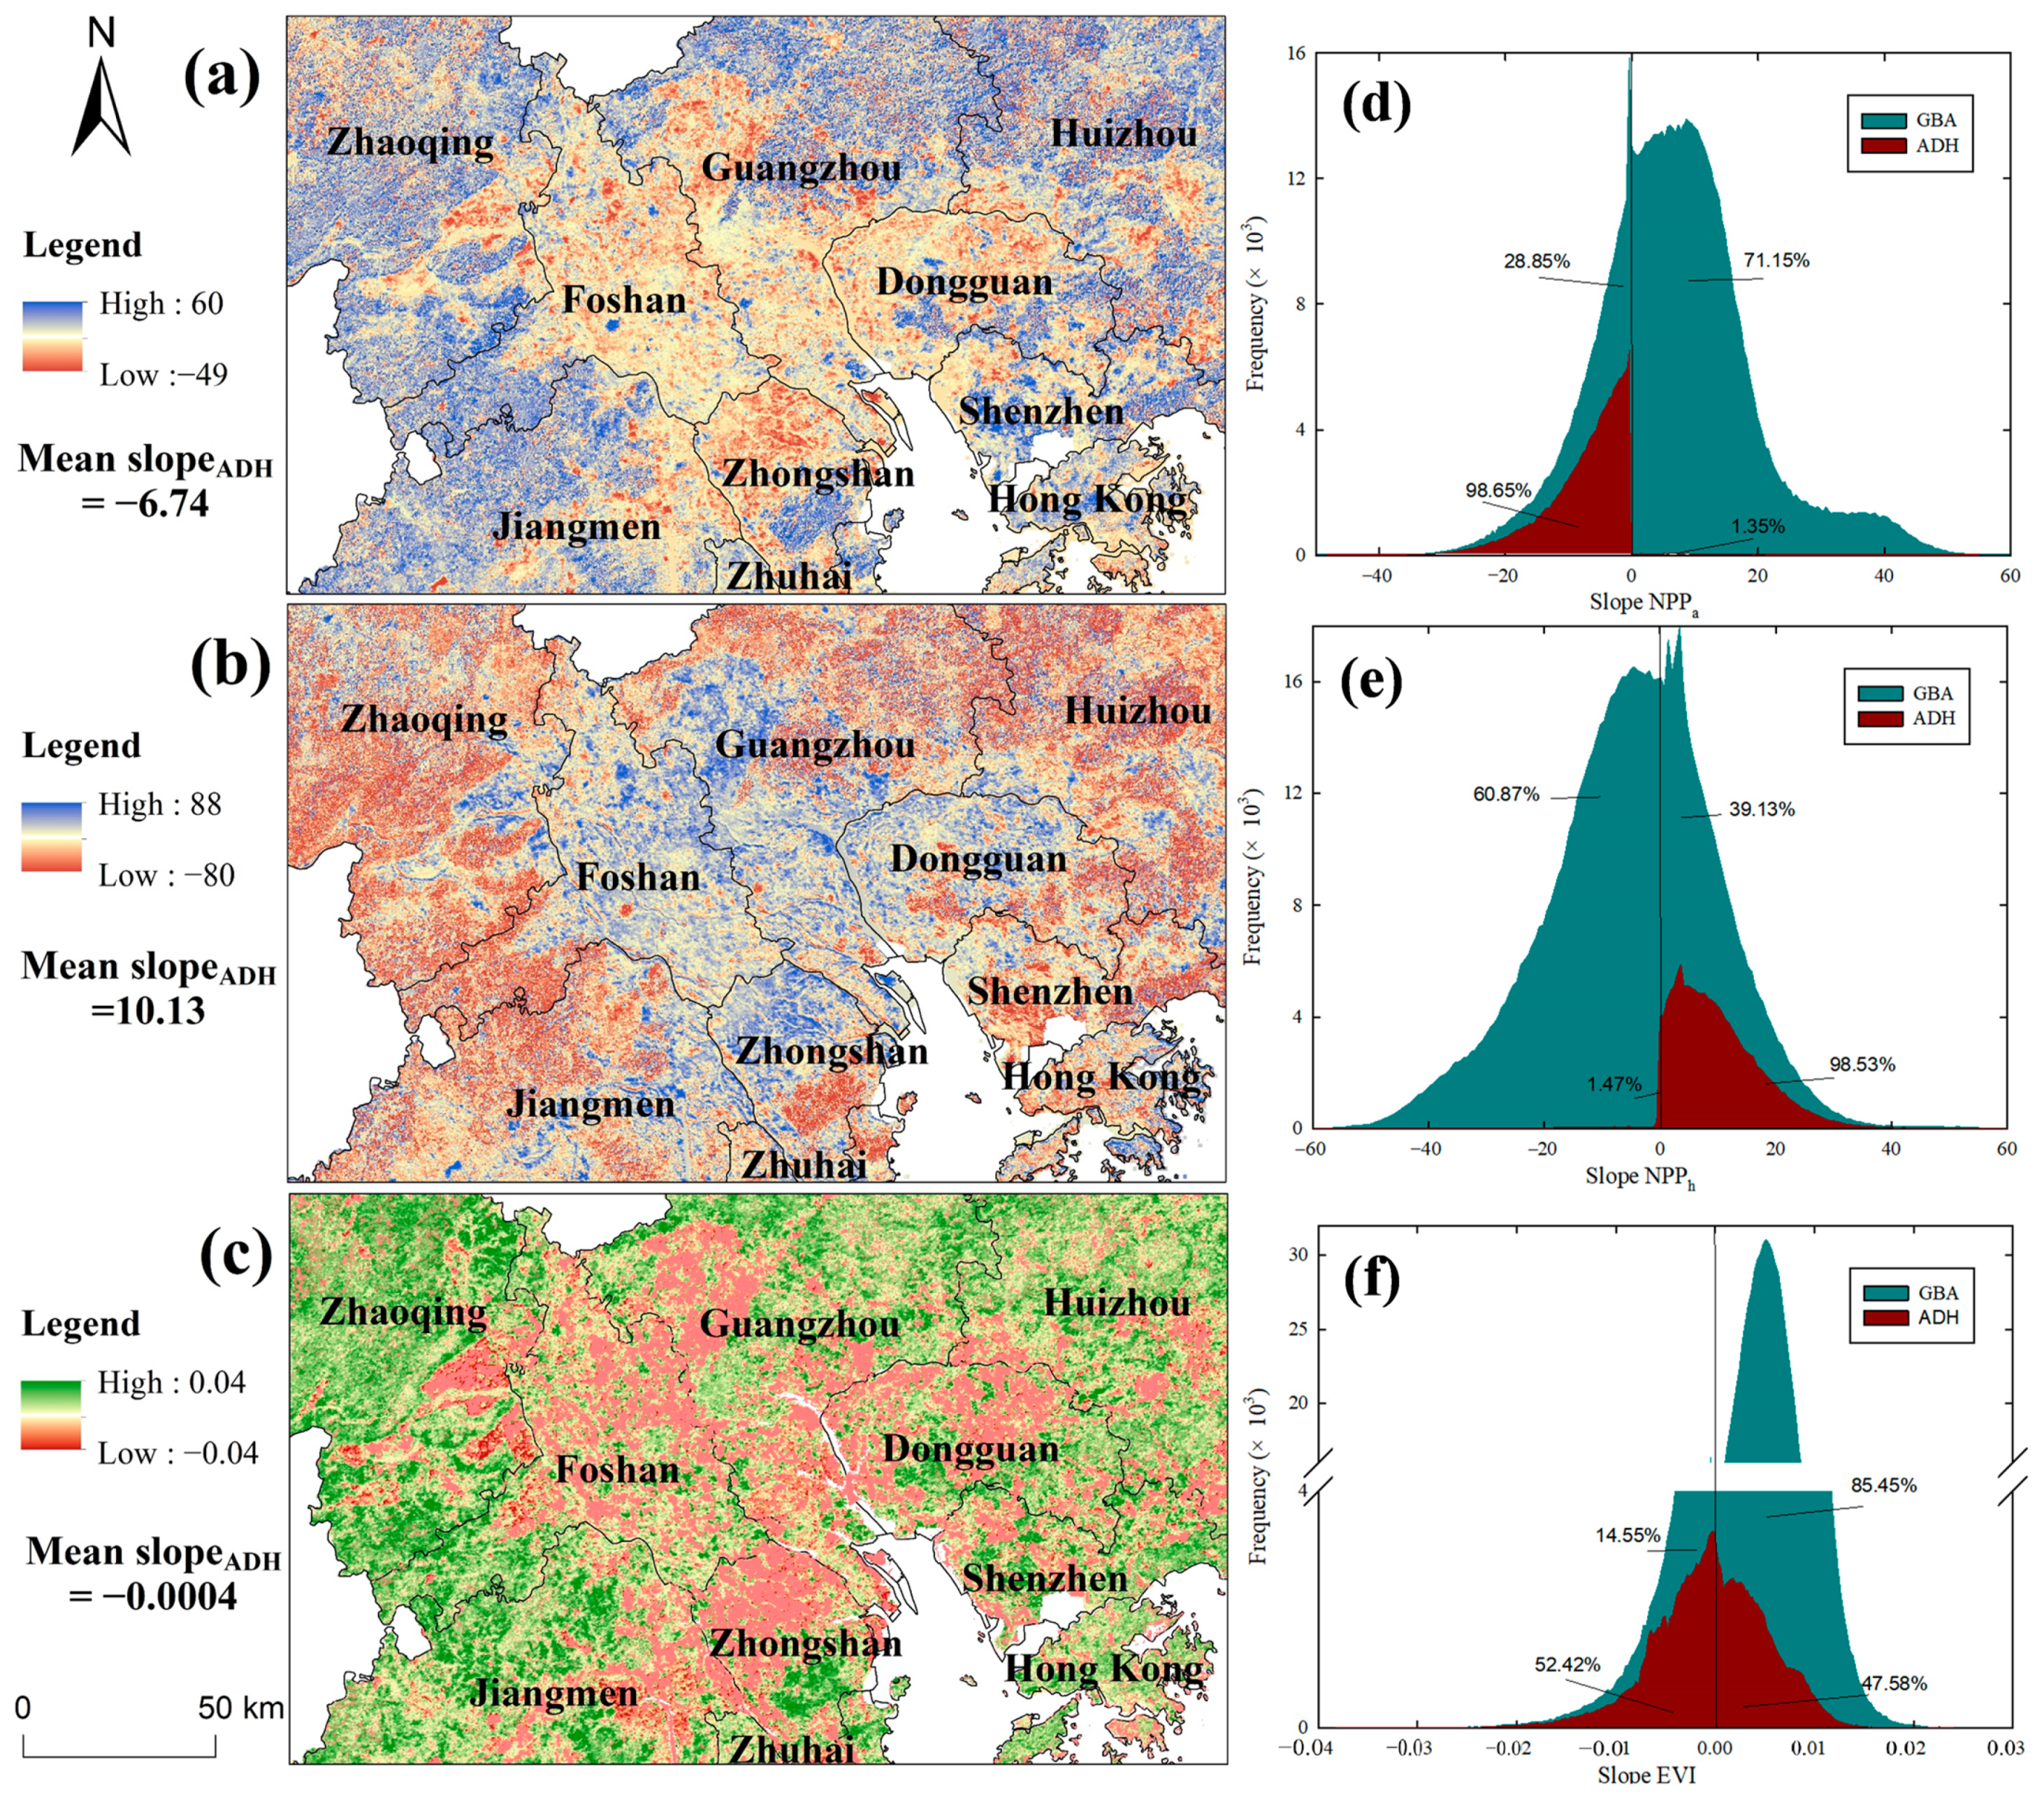
Publisher’s Note: MDPI stays neutral with regard to jurisdictional claims in published maps and institutional affiliations. |
© 2022 by the authors. Licensee MDPI, Basel, Switzerland. This article is an open access article distributed under the terms and conditions of the Creative Commons Attribution (CC BY) license (https://creativecommons.org/licenses/by/4.0/).
Share and Cite
MDPI and ACS Style
Wu, Y.; Luo, Z.; Wu, Z. The Different Impacts of Climate Variability and Human Activities on NPP in the Guangdong–Hong Kong–Macao Greater Bay Area. Remote Sens. 2022, 14, 2929. https://doi.org/10.3390/rs14122929
AMA Style
Wu Y, Luo Z, Wu Z. The Different Impacts of Climate Variability and Human Activities on NPP in the Guangdong–Hong Kong–Macao Greater Bay Area. Remote Sensing. 2022; 14(12):2929. https://doi.org/10.3390/rs14122929
Chicago/Turabian StyleWu, Yanyan, Zhaohui Luo, and Zhifeng Wu. 2022. "The Different Impacts of Climate Variability and Human Activities on NPP in the Guangdong–Hong Kong–Macao Greater Bay Area" Remote Sensing 14, no. 12: 2929. https://doi.org/10.3390/rs14122929
Note that from the first issue of 2016, this journal uses article numbers instead of page numbers. See further details here.