
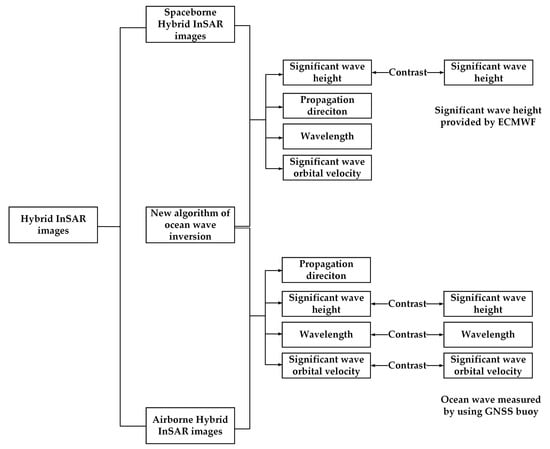
Ocean Wave Inversion Based on Hybrid Along- and Cross-Track Interferometry
by
 , ,
, ,
Daozhong Sun
1,†, 
Yunhua Wang
1,2,†,
Zhichao Xu
1,
Yanmin Zhang
1,*,
Yubin Zhang
1,3,
Junmin Meng
3,
Hanwei Sun
4 and
Lei Yang
3 1
Faculty of Information Science and Engineering, Ocean University of China, Qingdao 266100, China
2
Pilot National Laboratory for Marine Science and Technology, Qingdao 266237, China
3
First Institute of Oceanography, Ministry of Natural Resources, Qingdao 266061, China
4
Beijing Institute of Radio Measurement, Beijing 100854, China
*
Author to whom correspondence should be addressed.
†
These authors contributed equally to this work.
Remote Sens. 2022, 14(12), 2793; https://doi.org/10.3390/rs14122793
Submission received: 17 May 2022
/
Revised: 6 June 2022
/
Accepted: 8 June 2022
/
Published: 10 June 2022
(This article belongs to the Special Issue Advances in Ocean Remote Sensing through Data and Algorithm Fusion)
Abstract
:The hybrid interferometric synthetic aperture radar system is a combination of an along-track configuration and cross-track configuration. Based on linear ocean wave theory, an ocean wave inversion algorithm for a hybrid interferometric synthetic aperture radar system is proposed in this work. Using the interferometric synthetic aperture radar images acquired by the TerraSAR-X and TanDEM-X satellites and the interferometric synthetic aperture radar images acquired by an airborne interferometric radar altimeter with a certain degree of squint, the profile of ocean waves and the corresponding orbital velocities were retrieved by combining the new inversion algorithm with the cross-spectra. Meanwhile, key parameters of ocean waves, such as the significant wave height, significant wave orbital velocity, propagation direction, and wavelength of the dominant waves, were also extracted from the ocean wave spectra retrieved in this study. In order to evaluate the reliability of the new inversion algorithm, the retrieved significant wave heights were compared with those provided by the European Centre for Medium-Range Weather Forecasts and measured by a Global Navigation Satellite System buoy. The results showed that for the ocean waves retrieved from the spaceborne hybrid interferometric synthetic aperture radar images, the differences between the retrieved significant wave heights of the four subareas selected in this paper and those provided by European Centre for Medium-Range Weather Forecasts were approximately 0.01, –0.17, –0.55, and –0.37 m, respectively, and for the ocean waves retrieved from the airborne interferometric radar altimeter images, the differences between the retrieved significant wave heights corresponding to the M920 and M3120 images used in this paper and those measured by the Global Navigation Satellite System buoy were approximately –0.05 and –0.09, respectively. Therefore, the method proposed in this work could retrieve the ocean wave spectra well when the velocity bunching had a small influence; however, as the nonlinear influence of the velocity bunching increased, the difference between the significant wave heights retrieved using this method and provided by the European Centre for Medium-Range Weather Forecasts also increased.
1. Introduction
As one of the most common phenomena on sea surfaces, ocean waves have an important influence on ocean energy exchange and ocean–atmosphere interaction. Therefore, theoretical research and experimental observations of ocean waves have always been an important research topic in the marine sciences. Ocean waves can be measured in many ways such as in situ measurement with buoys and remote measurement with different microwave radars. In 1996 and 2018, Hasselmann et al. and Yu et al. improved existing algorithms of ocean wave information retrieval based on synthetic aperture radar (SAR) image spectra and traditional altimeter data, respectively [1,2]. In 2021, on the basis of emerging interferometric radar altimeter (IRA) images, Jiang et al. retrieved two-dimensional ocean wave spectra, and the wind wave information was also effectively extracted [3]. In addition, in 1991 and 2022, Shemer et al. and Li et al. introduced sea surface simulation methods corresponding to an interferometric synthetic aperture radar (InSAR) system and an SAR system, respectively [4,5]. For in situ measurements, it has the advantage of high accuracy; however, its applicability to extensively measure ocean waves is seriously hampered due to the limited measurement space and high cost.
SAR images can be used for ocean wave inversion due to the fact of their high resolution [6,7]. In 1991, on the basis of hydrodynamic modulation, tilt modulation and velocity bunching modulation, Hasselmann et al. derived a nonlinear mapping that can be used to transform ocean wave spectra into SAR image spectra [8]. In 1995 and 2005, on the basis of the cross-spectra of SAR images, Engen et al. and Schulz-Stellenfleth et al. successfully retrieved ocean waves using different methods [9,10]. In 2002 and 2015, Marghany et al. and Ren et al. retrieved the significant wave height (SWH) using the azimuth cutoff of ERS-1 images and the azimuth cutoff of RADARSAT-2 images, respectively [11,12]. In 2004 and 2006, based on polarimetric SAR images, Schuler et al. and He et al. used two different methods to effectively retrieve the sea surface slope, respectively [13,14]. In 2004, He et al. successfully retrieved ocean wave spectra based on a linear polarimetric SAR image [15], and Zhang et al. validated the measurement of ocean waves with RADARSAT-2 fully polarimetric SAR images in 2010 [16]. Moreover, Wang et al. evaluated the observation of swell height of the Sentinel-1A/B wave mode in combination with buoy in situ measurement data in 2022 [17]. Unfortunately, currently, the hydrodynamic modulation and relaxation rate of the hydrodynamic modulation are not well understood [18]. In 2020, on the basis of polarized SAR (PolSAR) images, Yanmin Zhang et al. [19] derived a new nonlinear mapping that can be used to map ocean wave spectra into polarimetric SAR image spectra.
Compared with conventional SAR, InSAR has unique advantages in measuring ocean waves. When the InSAR system was originally applied in the marine technology field, it was used to measure surface currents. Since the phase obtained by the along-track InSAR (ATI-SAR) is proportional to the orbital radial velocity of the corresponding sea surface scatterer, Goldstein et al. proposed that the images of ATI-SAR can be used to retrieve the surface currents [20,21]. Marom et al. carried out two airborne ATI-SAR experiments in the Marina Beach region in 1990 and the Gulf of California in 1991. The two-dimensional ocean wave spectra retrieved based on the phase images of these two experiments were consistent with the buoy in situ measurement results [22,23]. In 1991, Lyzenga et al. pointed out that the dual or multi-antenna ATI-SAR could be used to solve the disadvantages of the azimuth wavenumber cutoff due to the velocity bunching [24]. Lyzenga and Malinas further verified this conclusion based on the measured ATI-SAR phase images in 1996 and showed that the azimuth wavenumber was directly proportional to the baseline length between two antennas [25]. In order to study the ocean wave imaging mechanism of ATI-SAR, Bao et al. derived a two-dimensional ocean wave imaging model of ATI-SAR that included the modulation of normalized radar cross-sections (NRCS) by long waves, velocity bunching modulation, and azimuth image smear caused by orbital acceleration of long waves and orbital velocity spread within the resolution unit [26]. Meanwhile, the intensity and the phase image spectra of ATI-SAR at different sea state conditions and radar configurations were also calculated based on the Monte Carlo method. Due to the large number of calculations used in the Monte Carlo method, Bao et al. derived a new nonlinear integral transform between ATI-SAR phase image spectra and ocean wave spectra in 1999 that could be used to simulate the corresponding phase image spectra from ocean wave spectra [27]. In 1999, Vachon et al. validated the nonlinear integral transform between ATI-SAR phase image spectra and ocean wave spectra derived by Bao et al. by using C-band horizontally polarized airborne ATI-SAR phase images, and they further obtained two quasi-linear integral transforms using Taylor series expansion [28]. However, the δ function was omitted in the expression of the ATI-SAR phase image established by Bao et al., resulting in the loss of the derivative term of the wave orbital radial velocity in the established nonlinear integral transform. In order to solve this problem, based on the expression of the ATI-SAR phase image, He et al. added the δ function omitted when Bao et al. established the nonlinear integral transform and established a more precise nonlinear integral transform between ATI-SAR phase image spectra and ocean wave spectra, in 2003 [29]. Based on the nonlinear mapping relationship between ATI-SAR phase spectra and ocean wave spectra, Zhang et al. developed a parametric inversion model for retrieving ocean wave direction spectra from ATI-SAR phase images in 2009, and they successfully retrieved ocean wave wavelengths, ocean wave directions, and SWHs [30].
On the basis of a cross-track InSAR (XTI-SAR) imaging mechanism of ocean waves, Bao derived a nonlinear integral transform that can be used to map ocean wave spectra into phase image spectra, in 1999 [31]. In order to simulate the traditional SAR intensity image spectra and phase image spectra, Schulz-Stellenfleth et al. established a wave imaging model on the basis of a cross-track interference mechanism in 2001 [32]. In addition, Schulz-Stellenfleth et al. also estimated the distorted (bunched) variance spectra of digital elevation models (DEMs) on the basis of the Monte Carlo method and forward simulations. It was shown that a straightforward estimation of sea surface elevation using the distorted InSAR elevation model was well consistent with the true sea surface elevation for low-amplitude swells, and the error depended on the water wave propagation direction and the coherence time of the echoes. Schulz-Stellenfleth et al. retrieved the bunched DEMs using airborne X-band horizontal polarization XTI-SAR wind wave phase images near the North Sea in the same year [33]. The results showed that when the nonlinearity caused by velocity bunching was small, the SWH and one-dimensional wavenumber spectra retrieved from the models were consistent with the in situ measurements with buoys. However, the difference between the propagation direction of the retrieved dominant waves and the buoy measurements was up to 30°, which depended on the flight direction and the flight level. In addition, since XTI-SAR images can simultaneously provide information on sea surface height and normalized radar cross-sections (NRCS), Schulz-Stellenfleth et al. proposed a new approach to measure the modulation transfer function (MTF) of real aperture radar (RAR) using cross-correlating bunched DEMs and registered SAR intensity images.
However, due to the technical limitations, most baselines of real InSAR systems contain both the cross-track and along-track configurations, which was defined as a hybrid InSAR system in this paper, and the shuttle radar topography mission (SRTM) is a typical case of a hybrid InSAR system [34]. In addition, most airborne InSAR systems use hybrid geometry which introduces squint angles to solve the effect of crosswind. Lehner et al. observed waves using an airborne hybrid InSAR system consisting of three antennas and successfully retrieved the corresponding ocean wave spectra, in 2001 [35]. Siegmund et al. successfully measured sea surface currents using an airborne hybrid InSAR system. However, since the inertial navigation data error will introduce a systematic error into the interferometric data, and the data accuracy of the different inertial navigation systems may be different, therefore, the accuracy of the measured currents is related to the accuracy of the navigation data of the platform [36,37]. In addition, in 2001, Bao et al. briefly summarized ocean wave spectra measurements using SRTM images, which mainly demonstrated the possibility of observing large-scale swell features. However, the wind waves could not be observed due to the low spatial resolutions of the SRTM images [38]. In addition, Bao et al. did not describe in detail the method for ocean wave inversion using the hybrid interferometry system.
In this paper, a spaceborne hybrid InSAR system, composed of two satellites (i.e., TerraSAR-X and TanDEM-X) and an airborne hybrid InSAR system with a small incidence angle, were used to retrieve ocean wave information including ocean wave spectra, SWH, and radial velocities. In addition, in this paper we took the SWHs provided by the European Centre for Medium-Range Weather Forecasts (ECMWF) and the SWH measured by Global Navigation Satellite System (GNSS) buoys as the reference for evaluating the accuracy of the SWHs measured by the spaceborne hybrid InSAR system and the airborne hybrid InSAR system in the present work [39,40]. In addition, the cross-spectra of ocean waves were also retrieved to determine the propagation directions of ocean waves retrieved by the spaceborne hybrid InSAR system.
This paper is organized as follows: Section 2 introduces the basic theories of sea surface profile and radial velocities of ocean waves measurements by the hybrid InSAR system. In Section 3, the hybrid InSAR images acquired by the TerraSAR-X and TanDEM-X satellites at Pentland Firth, which is north of mainland Scotland, and the hybrid InSAR images acquired by airborne IRA from the Qingdao Xiaomaidao (XMD) sea area are introduced briefly. The data preprocessing of the hybrid InSAR images is presented in Section 4. The retrieved results, such as the ocean wave spectra, cross-spectra, and radial velocities of the ocean waves, are presented in Section 5. The conclusions of the present work are given in Section 6.
2. Algorithm of Ocean Wave Inversion
Figure 1 is the geometric schematic of the hybrid interferometry. The x-axis is the along-track (azimuth) direction, which is also the direction of the platform velocity, V. The y-axis is the cross-track (range) direction. P1 and P2 denote the positions of the two antennas. B is the baseline length, which needs to be decomposed into a cross-track baseline component (Bv) and an along-track baseline component (Bp) in the present work. α denotes the roll angle of Bv relative to the y-axis, and T is the scattering element on the sea surface.
2.1. Inversion Algorithm of the Sea Surface Profile
We can retrieve the sea surface profile using XTI-SAR images and ocean wave velocity using ATI-SAR images. The sea surface profile inversion and the radar line-of-sight velocity induced by the orbital velocity of long waves inversion based on InSAR images are given by [41,42]:
where h denotes the profile of the simulated ocean waves; v denotes the radar line-of-sight velocity induced by the ocean waves; θ denotes the incidence angle; λ denotes the wavelength of the incidence microwave wave; BXTI denotes the cross-track baseline; BATI denotes the along-track baseline; φelevation and φvelocity are the interference phases caused by sea surface elevation and ocean wave radial velocity, respectively.
However, when the baselines of InSAR systems contain both along-track and cross-track components, we must use another method to acquire the ocean wave information.
Based on linear sea wave theory, the profile of ocean waves can be expressed as the superposition of a series of traveling harmonic waves:
where is the Fourier transform coefficient of the sea surface profile; denotes the angular frequency of the gravity waves; g and k denote the gravitational acceleration constant and the wavenumber, respectively; c.c stands for the complex conjugate. Using Equation (3), the radar line-of-sight velocity induced by the ocean waves can be expressed as:
where denotes the range velocity transfer function, which can be expressed as:
where kr denotes the wavenumber component in the cross-track direction.
The interference phase acquired by the hybrid InSAR system contains both a cross-track interference phase component and an along-track interference phase component [35,36,37,38], which can be expressed as:
where φ is interference phase acquired by the hybrid InSAR system; φv and φp are the cross-track interference phase component and along-track interference phase component, respectively. a0 and b0 in Equation (6) can be given by:
where R is the slant range from antenna to the scattering element on the sea surface. Inserting Equations (3) and (4) into Equation (6) yields:
According to Equation (9), we can derive that:
where F(φ) is the Fourier transform of interference phase. Then, the Fourier transform coefficient of the sea surface profile (i.e., ) and the sea wave-height spectrum can be obtained as:
Using Equation (11), the sea surface profile is retrieved by taking the inverse Fourier transform of :
2.2. Orbital Velocity of Long Waves Inversion Algorithm
Using Equations (6) and (13), the along-track interference phase can be calculated by:
Then, the radar line-of-sight velocity induced by the ocean waves is obtained as:
Meanwhile, the spectrum of the radar line-or-sight velocity is also obtained as:
3. Experimental Data
3.1. Hybrid InSAR Images
Germany launched an earth observation satellite (EOS), TerraSAR-X, in June 2007. The main payload of the satellite is an X-band radar sensor with various operation modes, which allows it to record images with different swath widths, resolutions, and polarization modes, and it provides high-quality X-band SAR images. Another satellite, TanDEM-X, was launched in June 2010, the configuration of which is almost identical to that of TerraSAR-X. The spiral formation flight of TerraSAR-X and TanDEM-X form a configurable spaceborne binary InSAR system. These two satellites cooperate with each other to perform earth topography missions to obtain high-precision global DEMs.
The two satellites, TerraSAR-X and TanDEM-X, simultaneously passed over Pentland Firth at 06:41 on 19 March 2012, which formed a spaceborne hybrid InSAR system, and we could carry out interference processing with SAR images obtained in this sea area to retrieve various marine phenomena such as sea surface current field and ocean waves. Romeiser et al. successfully retrieved the sea surface current field [43] with the SAR images acquired by TerraSAR-X and TanDEM-X, and the purpose of this paper was to use the SAR images to retrieve the ocean waves.
Figure 2a is the geographic position of Pentland Firth, where the red box is the specific location of all of the SAR images used in this paper. In the present work, we selected four subareas in the images for ocean wave inversion. The positions of the four subareas are marked with boxes in different colors in Figure 2b, and the red, yellow, green, and purple boxes represent Area 1 (A1), Area 2 (A2), Area 3 (A3), and Area 4 (A4), respectively. The detailed parameters of the SAR images are given in Table 1. Figure 3a,b show the SAR intensity images obtained by TerraSAR-X and TanDEM-X, i.e., the master image and the slave image. It can be seen from Figure 3a,b that there is a lot of speckle noise in the original SAR images. In order to retrieve high-quality ocean waves, noise reduction is needed in the process of ocean wave inversion.

Table 1.
SAR image parameters of the TerraSAR-X and TanDEM-X satellites and airborne IRA.
| Parameters | Spaceborne InSAR System | Airborne IRA |
|---|---|---|
| Center frequency | 9.65 GHz | 35 GHz |
| B | 301.92 m | 0.30 m |
| Bv | 290.06 m | 0.299 m |
| Bp | 83.78 m | 0.021 m |
| Azimuth resolution | 3.30 m | 0.30 m |
| Ground range resolution | 2.26 m | 0.30 m |
| θ | 29.83–32.78° | 1–15° |
In addition, the “Guanlan” ocean science satellite project was proposed by the National Laboratory for Marine Science and Technology of China in 2018, the aim of which is to more effectively observe submesoscale ocean phenomena and ocean waves. In the project, IRA is the main payload to be used to retrieve sea surface height (SSH) by means of the interferometric imaging technology. To evaluate the feasibility of the air prototype and the effectiveness of IRA in ocean wave observation, two Ka-band airborne IRA experiments were carried out by the No. 23 Research Institute of the Second Academy of the China Aerospace Science and Industry Corporation (CASIC 23) in the Qingdao XMD sea area in March 2019 and in the Rizhao sea area in November 2020.
Two sets of airborne hybrid InSAR images (labeled as M920 and M3120) used to retrieve ocean waves in this work were provided by CASIC 23, which was carried out in the Qingdao XMD sea area in March 2019, and it has a certain degree of squint. The location of the airborne IRA experimental area can be seen in Figure 2c. The IRA images’ geographical locations in the airborne IRA experiment are given in Figure 2d, and the parameters of the airborne IRA experiment are listed in Table 1. In addition, Figure 3a,b show the SAR intensity images of M920, which are taken as an example.
It should be noted that the InSAR images of M920 and M3120 were applied to another paper on ocean wave inversion based on pure XTI-SAR images with a small incident angle [41]. We found that the squint angle has a certain influence on ocean wave inversion. Therefore, we propose a new ocean wave inversion algorithm for hybrid InSAR images with a certain degree of squint.
3.2. Reference Data
The reference data used in this present work include the fifth-generation reanalysis data ERA5 of ECMWF and the GNSS buoy measurement data. ERA5 is the latest reanalysis data of ECMWF, which can provide global data related to ocean waves. ERA5 can provide a variety of reference SWHs for this work such as the SWH composed of wind waves and swells, SWH of total wind waves, and SWH of total swells. Due to the effects of the orbital velocity and the acceleration of the water waves, only swells can be well retrieved from TerraSAR-X and TanDEM-X images, so the validation data of SWH used in this paper is the significant height of the total swells, which can be represented by SWHEC in this paper. Without special instructions, hereinafter, the SWHEC denotes the significant height of total swells provided by ECMWF. Figure 4 shows the SWHEC at the sea area around Britain at 06:41 on 19 March 2012. The data were obtained by interpolating the SWHEC at 06:00 and 07:00 on 19 March 2012 obtained from ECMWF. We can intuitively observe the variations in SWHEC around the sea area from Figure 4. The detailed parameters of the SWHEC provided by ECMWF are given in Table 2. Moreover, we selected several resolution cells of SWHEC around the TerraSAR-X and TanDEM-X images for spatial interpolation to obtain the SWHEC corresponding to each subarea (i.e., A1, A2, A3, and A4), which can be used as a references for SWH retrieved in the four subareas.
Table 2.
The detailed parameters of the SWHEC provided by ECMWF.
| Parameters | Parameter Values |
|---|---|
| Spatial range | Global scale |
| Spatial resolution | 0.5 × 0.5° |
| Time range | 1979– |
| Temporal resolution | 1 h |
In addition, a GNSS buoy was deployed in the Qingdao XMD sea area to measure the ocean wave spectrum during the IRA experiment, which can be used as the reference for IRA measurements. The location of the GNSS buoy can be seen in Figure 2d, and the wind direction (WD) is also shown in Figure 2d, which can be used to determine the propagation direction of the wind waves. The GNSS buoy measurement data can provide the ocean wave parameters of the sea area during the IRA experiment such as the SWH, the significant wave orbital velocity (SWV), and the dominant ocean wave wavelength (λp). The in situ sea surface elevation data measured by the GNSS buoy is shown in Figure 4b, and the ocean wave spectra and orbital velocity spectra measured by the GNSS buoy are shown in Figure 4c–f. It can be seen from Figure 4c,d that there are two wave modes in the airborne IRA experiment sea area, and the two wave modes correspond to the wind waves and swells, respectively.
4. Images Preprocessing
Image preprocessing includes images registration, random phase noise suppression, and flat earth effect removal. This paper took TerraSAR-X and TanDEM-X image preprocessing as an example, and IRA image preprocessing can be referred to in [41].
4.1. Images Registration
In order to retrieve high-quality ocean waves, the registration between master and slave SAR images must be performed first. There are many existing image registration methods, and the popular methods used for SAR image registration can refer to the related literatures [44,45,46]. Among the SAR image registration methods, the correlation function method is the most basic statistical method and the basis of many registration algorithms, which is widely used in various types of image registration. In addition, it also has the characteristics of simple operation and strong robustness. At present, the registration algorithms of the only two global interference mapping tasks, SRTM and TanDEM-X interference data processing modules, were all based on the correlation measure function [47,48]. Therefore, the correlation function method was selected for SAR image registration in this paper.
Figure 5a shows the correlation coefficients after performing the registration between the TerraSAR-X image and the TanDEM-X image. Here, we took the correlation coefficients of A4 as an example. We can see from Figure 5a that the correlation coefficient between the TerraSAR image and the TanDEM image was mainly in the range of 0.4–0.7, which is basically consistent with the correlation coefficient calculated by Romeiser [43]. In addition, Figure 5b shows the interferogram after registration. We can see from Figure 5b that the fringes of the interferogram were very sharp.
4.2. Random Phase Noise Suppression
Due to the existence of random phase noise (as shown in Figure 5b), caused by various decorrelation factors, such as baseline decorrelation, system thermal decorrelation, registration decorrelation, the correlation between the SAR master and slave images were reduced, and the accuracy of the retrieved sea surface profile and ocean wave velocity were also seriously reduced. Therefore, it was necessary to suppress the influence of phase noise first when we retrieved ocean waves, and we used multilook processing to reduce the effect of phase noise in this work. The detailed process of random phase noise suppression can be referred to in the literature [41].
In order to discuss the effect of random phase noise, we calculated the theoretical and the measured root mean square error (RMSE) of the random phase noise, which are denoted by σTN and σSAR, using Equations (17) and (18), respectively.
where denotes the mean value of the random phase, ; is the phase measured by SAR; is the probability density distribution of the random phase, ; the expression of can be referred to the in literature [41].
The variations in σSAR with the looknumber (NL) are shown as the blue lines in Figure 6. In addition, the σTN is also shown in Figure 6 with red lines as a contrast. To remove the flat earth effect along the range direction on the interference phase, here, the spaceborne interferogram was only smoothed along the extension direction of the interference fringes. We can find from Figure 6 that with the increase in the NL, the decrease rate of the σSAR value was significantly slower than that of σTN, which was just as expected. In addition, the relative difference between σSAR and σTN increased with the NL, which means that the effect of the phase noise on the spaceborne interferogram became weaker with the increase in the NL. Moreover, we can also use Equation (19) to evaluate the relative error caused by the phase noise when we retrieved the ocean waves.
Two columns of the interference phase were selected along the extension direction of interferogram, which were used to evaluate the relative errors with Equation (19) for different NLs, and the relative errors are given in Table 3. In order to maintain the relative error below 10% in the present work, we chose NL = 6 × 10 (NL = 6 × 10 means that there were 6 pixels and 10 pixels along azimuth and range directions, respectively) for random phase noise suppression.
4.3. The Flat Earth Effect Removal
In order to retrieve ocean waves, the flat earth phase, which will increase the difficulty in inverting the sea surface profile and sea surface velocity, needs to be removed. We can use Equation (20) to calculate the flat earth phase, which is based on the spaceborne platforms’ positions and the ground geographical positions of the TerraSAR-X and TanDEM-X images.
where φf denotes the flat earth phase; P1 and P2 are the antenna locations of TerraSAR-X and TanDEM-X; T is the geographical location of each resolution cell of the TerraSAR-X and TanDEM-X images.
Figure 7a,b show the interferogram after multilook processing and the flat earth phase, and we also selected A4 as an example. By removing the flat earth phase from the interferogram, the interference phase caused by sea surface elevation and sea surface velocity was obtained as shown in Figure 7c. To clearly display the interference phase caused by the sea surface profile and the sea surface velocity, the subregion marked as a blue box in Figure 7c was selected for display as shown in Figure 7d.
5. Ocean Wave Inversion and Discussion
5.1. Sea Surface Profile Inversion
On the basis of the interference phase caused by the sea surface profile and sea surface velocity, the sea surface profile can be retrieved using Equation (13). To clearly display the ocean wave inversion results, we selected a subarea from A1, A2, A3, and A4 separately for display, as shown in Figure 8a–f, of the sea surface profiles retrieved using the airborne hybrid InSAR images, which corresponded to M920 and M3120, respectively. According to Figure 8, we can see that the sea surface profiles of ocean waves could be clearly retrieved using the spaceborne hybrid InSAR images and airborne hybrid InSAR images. It can also be seen from Figure 8 that the dominant wavelengths in A3 and A4 were longer than those in A1 and A2. The SWHs (4σh, σh is the root mean square height of the ocean waves) of the retrieved ocean waves in A1, A2, A3, and A4 were 0.79, 1.05, 0.64, and 0.67 m, respectively, which are listed in Table 4. The SWHs of the retrieved ocean waves shown in Figure 8e,f were 0.37 and 0.38 m, respectively, which are listed in Table 5. On the basis of the SWHEC provided by the ECMWF around the SAR images, the SWHEC can linearly be interpolated to acquire the SWHEC at the center of A1, A2, A3, and A4 as a reference, and the interpolated SWHECs in A1, A2, A3, and A4 were 0.74 m, 1.09 m, 0.87, and 0.71 m, respectively. The differences among the SWHs retrieved using the spaceborne hybrid InSAR images and SWHECs in A1, A2, A3, and A4 were 0.05, −0.04, −0.23, and −0.04 m, respectively. Before comparing the retrieved SWHs using airborne hybrid InSAR images with the SWHs measured by the GNSS buoy, it was necessary to use a low-pass filter to process ocean wave spectra measured by the GNSS buoy in order to make the ocean wave spectra measured by the GNSS buoy comparable to the ocean wave spectra retrieved using the airborne hybrid InSAR images. According to the wind direction, as shown in Figure 2d, and the resolutions of the airborne IRA images, the time window (TLF) of the low-pass filter can be calculated by [41]:
and
where Lxf and Lyf are the range and azimuth scales of the two-dimensional filter used in [41], respectively, and γ is the angle between the wind direction and the range direction of the IRA image. Therefore, the calculated L and TLF were approximately 12.21 m and 2.80 s, respectively, and the low-pass filter mainly suppressed wind waves with a wavelength of approximately 12 m and a frequency of approximately 0.36 Hz. After processing the ocean wave spectra measured by the GNSS buoy, the SWHs measured by the GNSS buoy were 0.33 and 0.38 m, respectively, and the differences between the SWHs retrieved using the airborne hybrid InSAR images and the SWHs measured by the GNSS buoy were 0.04 m and 0, respectively.
Moreover, we can also see from Figure 8 that the ocean waves in A1 and A2 propagated almost along the range direction, and the ocean waves in A3 and A4 propagated approximately along the direction of 45° or 225° with respect to the along-track direction. In order to remove the 180° directional ambiguity from the ocean wave spectra, we retrieved the cross-spectra based on the TerraSAR-X intensity images. The inversion of the cross-spectra was based on the split-look processing technique, which divides the azimuth reference signal into multiple subsignals with different center times. Therefore, split-look processing can generate a series of time series subimages, and then the cross-spectra can be obtained by performing a correlation calculation on the subimages. For the specific method of retrieving cross-spectra, please refer to the literature [49]. The cross-spectra of ocean waves in the four subareas are shown in Figure 9, in which Figure 9a–d display the real parts, and Figure 9e–h show the imaginary parts. Here, kr represents the components of the wavenumber in the range direction, and ka represents that in the azimuth direction. The angle of the polar coordinates is in degrees clockwise from true north. It can be seen from Figure 9e–h that the imaginary parts of the TerraSAR-X image cross-spectra had two spectral peaks, one of which was positive and the other which was negative. If the ocean wave spectra were unimodal, the ocean wave spectra were located in those spectral domains, where the imaginary part of the cross-spectra were positive [50].
According to the sea surface profiles in A1, A2, A3, and A4, and combined with the imaginary parts of the SAR images’ cross-spectra, the corresponding two-dimensional ocean wave spectra could be acquired as shown in Figure 10a–d. Based on the corresponding two-dimensional ocean wave spectra shown in Figure 10a–d, the wavelengths of the dominant waves corresponding to the spectral peaks in A1, A2, A3, and A4 could be calculated, which were approximately 210, 209, 292, and 305 m, respectively. The wavelengths of the dominant waves in A1 and A2 were consistent with those retrieved by Romeiser [43]. In addition, the propagation directions of the dominant waves in A1, A2, A3, and A4 are approximately 100°, 100°, 230°, and 230° clockwise versus true north, respectively. For ocean waves retrieved using the airborne hybrid InSAR images, the two-dimensional ocean wave spectra of M920 and M3120 are shown in Figure 10e,f. In order to better compare the retrieved ocean wave spectra with that measured by the GNSS buoy, the retrieved two-dimensional ocean wave spectra were converted to one-dimensional ocean wave spectra, which are shown in Figure 10g,h. It can be seen from Figure 10g,h that the retrieved swell wavelengths of M920 and M3120 were approximately 87.27 and 89.76 m, respectively; the measured swell wavelengths of M920 and M3120 were approximately 70.69 and 100.98 m, respectively; the swell wavelength differences of M920 and M3120 between the retrieved and measured were 16.58 and −11.22 m, respectively. However, due to the wind waves that propagated along the azimuth direction of M920 and M3120, the velocity bunching had a strong nonlinear influence on the wind waves imaging, and the wind waves could not be retrieved well. For the ocean wave propagation directions retrieved using the airborne hybrid InSAR images, the swells propagation directions of M920 and M3120 could be determined by combining with the geographical locations of the experimental areas, and the swells propagation directions of M920 and M3120, shown in Figure 10e,f, were all approximately 270° counterclockwise versus true north, respectively.
It is worth mentioning that there were differences between the SWHs calculated based on the ocean wave spectra (as shown in Figure 10) and those evaluated directly from the sea surface profiles in Figure 8. Here, the retrieved SWHs based on the ocean wave spectra are marked as SWHSP and listed in Table 4 and Table 5. It can be seen from Table 4 that the values of the SWHSP were significantly smaller than the SWHs, especially in sea areas A3 and A4. This was because the nonlinear influence of the velocity bunching in these two areas was more significant than that in A1 and A2. For the airborne hybrid InSAR system, although the velocity bunching also had a significant nonlinear influence on M920 and M3120, the IRA images of M920 and M3120 were acquired at low sea state conditions; therefore, the differences between the SWHSP and those measured by the GNSS buoy were not as significant as that in A3 and A4. For the InSAR systems, the larger the angle between the ocean wave propagation direction and the range direction, the more significant the nonlinear influence of the velocity bunching [28]. We can see from Figure 8 and Figure 10 that the dominant waves in A1 and A2 almost propagated along the range direction, while the angles between the dominant waves’ propagation direction and the range direction in A3 and A4 were approximately 50°. Therefore, the nonlinear influence of the velocity bunching in A3 and A4 was more significant. During the process of ocean wave imaging using the SAR systems, the velocity bunching not only caused nonlinear shifting of the ocean waves but also the superposition of ocean waves at different positions. In addition, the imaging results caused by velocity bunching were different between the SAR systems and the InSAR systems. For the SAR systems, velocity bunching caused a position shift in the sea surface scattering elements along the azimuth of the SAR image, and the echo intensity produced convergence and divergence effects along the azimuth of the radar. The scattering intensities in the convergence region increased and that in the divergence region decreased. However, for the InSAR systems, the ocean waves’ shift caused by velocity bunching caused the superposition of the partial scattering fields, and the corresponding interference phase also changed indeterminately, and based on this analysis, the retrieved SWH based on the InSAR images may be less than the true value of the SWH. In addition, the nonlinear shifting of the ocean waves was caused by velocity bunching because the high-frequency components were mixed with the random noise. Therefore, the speckles in Figure 8 were not all random noise, and some of them were the drift ocean waves. When retrieving the two-dimensional ocean wave spectra, we used a low-pass filter to filter out the high-frequency components and retain only the low-frequency components. The final result is shown in Figure 10. Thus, the retrieved significant wave height based on the InSAR images should be less than the true value of the significant wave height, and the stronger the influence of the velocity bunching, the greater the difference between the retrieved value and the true value.
5.2. The Orbital Velocity of Ocean Waves Inversion
On the basis of the interference phase caused by sea surface elevation and sea surface velocity, the orbital velocity of the ocean waves can be acquired by using Equation (15). To clearly display the orbital velocities of ocean wave inversion results, we selected a subarea from A1, A2, A3, and A4 separately for display as shown in Figure 11a–d. Figure 11e,f are the orbital velocities of the ocean waves retrieved using the airborne hybrid InSAR images, which corresponded to M920 and M3120, respectively. According to the retrieved orbital velocities of the ocean waves and combining with the imaginary parts of the TerraSAR-X image cross-spectra, the corresponding two-dimensional velocity spectra can be obtained, which are shown in Figure 12a–d. Figure 12e,f show the two-dimensional velocity spectra retrieved using the airborne hybrid InSAR images, and Figure 12g,h show the corresponding one-dimensional velocity spectra. We can see from Figure 11 and Figure 12 that the orbital velocity of the ocean waves in A2 were larger than those in A1, A3, and A4. The significant wave orbital velocity (SWV) calculated based on the velocities (as shown in Figure 11) (SWV = 4σv, σv is the root mean square orbital velocity of ocean waves) and calculated based on two-dimensional velocities spectra (as shown in Figure 12a–f) (SWVSP) are also listed in Table 4 and Table 5. We can find from Table 4 and Table 5 that the values of SWVSP were significantly smaller than SWVs, especially in A3, A4, M920, and M3120. The reason for the differences is the same as that for SWH. However, since the ECMWF does not directly provide the radial velocity of ocean waves, there is no available reference orbital velocities of ocean waves to compare with the results retrieved in this paper. For the orbital velocity of ocean waves retrieved using the airborne hybrid InSAR images, the SWVs and the SWVSP were significantly smaller than that measured by the GNSS buoy. From the significant differences, as shown in Figure 12g,h, it can be deduced that the SWVs measured by the GNSS buoy included the SWVs of swells and wind waves, and when using IRA images to retrieve the orbital velocities of ocean waves, due to the strong nonlinear influence of velocity bunching, only the orbital velocity of swells could be retrieved.
6. Conclusions
For the hybrid interferometry systems, which are a combination of along-track and cross-track configurations, we presented a new method for retrieving ocean wave information such as the sea surface profile and the orbital velocity of ocean waves. This method was derived on the basis of the linear modulation theory in which the sea surface profile can be represented as the superposition of a series of traveling wave components. On the basis of the above research, the following conclusions can be drawn:
- (1)
- On the basis of the spaceborne hybrid InSAR images acquired by the TerraSAR-X and TanDEM-X and the hybrid InSAR images acquired by airborne IRA, ocean waves, ocean waves spectra, orbital velocities of ocean waves, and the velocity spectra were retrieved using a new method. For the spaceborne hybrid InSAR images, since the effects of the orbital velocity and the acceleration of the water waves, only swell were well retrieved from the satellite SAR images in the present work. For the airborne hybrid InSAR images used in this paper, due to the nonlinear influence of the velocity bunching along the azimuth direction, only swells could be retrieved well;
- (2)
- Based on the ocean wave spectra and velocity spectra retrieved using this method, we calculated SWHs, peak wavelengths of dominant waves, and SWVs. In addition, we also obtained the propagation direction of the dominant waves in A1, A2, A3, and A4 on the basis of the retrieved cross-spectra. The wavelengths of dominant waves in A1 and A2 were consistent with those mentioned by Romeiser [43], and the differences between the retrieved SWHs in A1 and A2 and that provided by ECMWF were small, while the differences between the retrieved SWHs in A3 and A4 and that provided by ECMWF were large, which was mainly caused by the strong nonlinear influence of velocity bunching in A3 and A4. The differences between the retrieved SWHs using the M920 and M3120 images and that measured by the GNSS buoy were small, while the retrieved SWVs using the M920 and M3120 images were significantly smaller than that measured by the GNSS buoy. The significant differences were because the SWVs measured by the GNSS buoy included the SWVs of swells and wind waves, and for the retrieved SWVs, due to the strong nonlinear influence of velocity bunching, only the orbital velocity of the swells could be retrieved;
- (3)
- There was a close relationship between the accuracy of the retrieved ocean wave spectrum, orbital velocity spectrum, and velocity bunching. When the nonlinear influence of the velocity bunching was strong, the accuracy of the retrieved ocean wave spectrum and orbital velocity spectrum was low, and when the nonlinear influence of the velocity bunching was weak, the accuracy of the retrieved ocean wave spectrum and orbital velocity spectrum was high. Therefore, addressing the nonlinear influence of velocity bunching on ocean wave inversion is still a challenge in future work. Moreover, since the airborne hybrid interferometric images used in this paper all had strong velocity bunching nonlinearity, the accurate evaluation of ocean wave inversion based on the airborne hybrid interference images with small velocity bunching nonlinearity is also an important task in the future.
Author Contributions
Conceptualization, Y.Z. (Yanmin Zhang) and Y.W.; Funding acquisition, Y.Z. (Yanmin Zhang) and Y.W.; Methodology, D.S., Y.W. and Z.X.; Data curation, Y.Z. (Yubin Zhang), J.M. and H.S.; GNSS buoy data preprocessing, L.Y.; Validation, D.S.; Writing—original draft, D.S.; Writing—review and editing, D.S., Y.Z. (Yanmin Zhang), Y.W. and Z.X. All authors have read and agreed to the published version of the manuscript.
Funding
This study was partially supported by the National Natural Science Foundation of China (41976167) and the Key Research and Development Program of Shandong Province (International Science and Technology Cooperation) (2019GHZ023).
Data Availability Statement
ECMWF-ERA5 significant wave height data can download from the website https://cds.climate.copernicus.eu/cdsapp#!/dataset/reanalysis-era5-single-levels?tab=form, accessed on 25 July 2021. The TerraSAR-X and TanDEM-X images were provided by the German Aerospace Center (DLR), the airborne IRA images were provided by the No. 23 Research Institute of the Second Academy of the China Aerospace Science and Industry Corporation, and the GNSS buoy data were provided by the Marine Survey Research Center, First Institute of Oceanography, Ministry of Natural Resources.
Conflicts of Interest
The authors declare no conflict of interest.
References
- Hasselmann, S.; Brüning, C.; Hasselmann, K.; Heimbach, P. An improved algorithm for the retrieval of ocean wave spectra from synthetic aperture radar image spectra. J. Geophys. Res. 1996, 101, 16615–16629. [Google Scholar] [CrossRef]
- Yu, H.M.; Li, J.Y.; Wu, K.J.; Wang, Z.F.; Yua, H.Q.; Zhang, S.Q.; Hou, Y.J.; Kelly, R.M. A global high-resolution ocean wave model improved by assimilating the satellite altimeter significant wave height. Int. J. Appl. Earth Obs. Geoinf. 2018, 70, 43–50. [Google Scholar] [CrossRef]
- Jiang, Q.F.; Xu, Y.S.; Sun, H.W.; Wei, L.D.; Yang, L.; Zheng, Q.; Jiang, H.Y.; Zhang, X.G.; Qian, C.C. Wind-generated gravity waves retrieval from high-resolution 2-D maps of sea surface elevation by airborne interferometric altimeter. IEEE Trans. Geosci. Remote Sens. Lett. 2021, 19, 1–5. [Google Scholar] [CrossRef]
- Shemer, L.; Kit, E. Simulation of an interferometric synthetic aperture radar imagery of an ocean system consisting of a current and a monochromatic wave. J. Geophys. Res. 1991, 96, 22063–22073. [Google Scholar] [CrossRef]
- Li, Q.; Zhang, Y.M.; Wang, Y.H.; Bai, Y.N.; Zhang, Y.S.; Li, X. Numerical Simulation of SAR Image for Sea Surface. Remote Sens. 2022, 14, 439. [Google Scholar] [CrossRef]
- Wei, X.F.; Chong, J.S.; Zhao, Y.W.; Li, Y.; Yao, X.N. Airborne SAR Imaging Algorithm for Ocean Waves Based on Optimum Focus Setting. Remote Sens. 2019, 11, 564. [Google Scholar] [CrossRef] [Green Version]
- Grieco, G.; Lin, W.; Migliaccio, M.; Nirchio, F.; Portabella, M. Dependency of the Sentinel-1 azimuth wavelength cut-off on significant wave height and wind speed. Int. J. Remote Sens. 2016, 37, 5086–5104. [Google Scholar] [CrossRef]
- Hasselmann, K.; Hasselmann, S. On the nonlinear mapping of an ocean wave spectrum into a synthetic aperture radar image spectrum and its inversion. J. Geophys. Res. 1991, 96, 10713–10729. [Google Scholar] [CrossRef]
- Engen, G.; Johnsen, H. SAR-ocean wave inversion using image cross spectra. IEEE Trans. Geosci. Remote Sens. 1995, 33, 1047–1056. [Google Scholar] [CrossRef]
- Schulz-Stellenfleth, J.; Lehner, S.; Hoja, D. A parametric scheme for the retrieval of two-dimensional ocean wave spectra from synthetic aperture radar look cross spectra. J. Geophys. Res. 2005, 110, C05004. [Google Scholar] [CrossRef] [Green Version]
- Marghany, M.; Ibrahim, Z.; Genderen, J.V. Azimuth cut-off model for significant wave height investigation along coastal water of Kuala Terengganu, Malaysia. Int. J. Appl. Earth Obs. Geoinf. 2002, 4, 147–160. [Google Scholar] [CrossRef]
- Ren, L.; Yang, J.S.; Zheng, G.; Wang, J. Significant wave height estimation using azimuth cutoff of C-band RADARSAT-2 single-polarization SAR images. Acta Oceanol. Sin. 2015, 34, 93–101. [Google Scholar] [CrossRef]
- Schuler, D.L.; Lee, J.S.; Kasilingam, D.; Pottier, E. Measurement of ocean surface slopes and wave spectra using polarimetric SAR image data. Remote Sens. Environ. 2004, 91, 198–211. [Google Scholar] [CrossRef]
- He, Y.J.; Shen, H.; Perrie, W. Remote sensing of ocean waves by polarimetric SAR. J. Atmos. Ocean Technol. 2006, 23, 1768–1773. [Google Scholar] [CrossRef]
- He, Y.J.; Perrie, W.; Xie, T.; Zou, Q.P. Ocean wave spectra from a linear polarimetric SAR. IEEE Trans. Geosci. Remote Sens. 2004, 42, 2623–2631. [Google Scholar]
- Zhang, B.; Perrie, W.; He, Y.J. Validation of RADARSAT-2 fully polarimetric SAR measurements of ocean surface waves. J. Geophys. Res. 2010, 115, C06031. [Google Scholar] [CrossRef]
- Wang, H.; Mouche, A.; Husson, R.; Grouaze, A.; Chapron, B.; Yang, J.S. Assessment of Ocean Swell Height Observations from Sentinel-1A/B Wave Mode against Buoy In Situ and Modeling Hindcasts. Remote Sens. 2022, 14, 862. [Google Scholar] [CrossRef]
- Caponi, E.A.; Crawford, D.R.; Yuen, H.C.; Saffman, P.G. Modulation of radar backscatter from the ocean by a variable current. J. Geophys. Res. 1988, 93, 12249–12263. [Google Scholar] [CrossRef]
- Zhang, Y.M.; Wang, Y.H.; Xu, Q.H. On the nonlinear mapping of an ocean wave spectrum into a new polarimetric SAR image spectrum. J. Phys. Oceanogr. 2020, 50, 3109–3122. [Google Scholar] [CrossRef]
- Goldstein, R.M.; Zebker, H.A. Interferometric radar measurement of ocean surface currents. Nature 1987, 328, 707–709. [Google Scholar] [CrossRef]
- Goldstein, R.M.; Barnett, T.P.; Zebker, H.A. Remote sensing of ocean currents. Science 1990, 246, 1282–1285. [Google Scholar] [CrossRef] [PubMed]
- Marom, M.; Goldstein, R.M.; Thornton, E.B.; Shemer, L. Remote sensing of ocean wave spectra by interferometric synthetic aperture radar. Nature 1990, 345, 793–795. [Google Scholar] [CrossRef]
- Marom, M.; Shemer, L.; Thornton, E.B. Energy density directional spectra of a nearshore wave field measured by interferometric synthetic aperture radar. J. Geophys. Res. 1991, 96, 22125–22134. [Google Scholar] [CrossRef]
- Lyzenga, D.R.; Bennett, J.R. Estimation of ocean wave spectra using two-antenna SAR system. IEEE Trans. Geosci. Remote Sens. 1991, 29, 463–465. [Google Scholar] [CrossRef]
- Lyzenga, D.R.; Malinas, P. Azimuth falloff effects in two-antenna SAR measurements of ocean wave spectra. IEEE Trans. Geosci. Remote Sens. 1996, 34, 1020–1027. [Google Scholar] [CrossRef]
- Bao, M.Q.; Bruning, C.; Alpers, W. Simulation of ocean waves imaging by an along-track interferometric synthetic aperture radar. IEEE Trans. Geosci. Remote Sens. 1997, 35, 618–631. [Google Scholar]
- Bao, M.Q.; Alpers, W.; Bruning, C. A new nonlinear integral transform relating ocean wave spectra to phase image spectra of an along track interferometric synthetic aperture radar. IEEE Trans. Geosci. Remote Sens. 1999, 37, 461–466. [Google Scholar]
- Vachon, P.W.; Campbell, J.W.M.; Gray, A.L.; Dobson, F.W. Validation of along-track interferometric SAR measurements of ocean surface waves. IEEE Trans. Geosci. Remote Sens. 1999, 37, 150–162. [Google Scholar] [CrossRef]
- He, Y.J.; Alpers, W. On the nonlinear integral transform of an ocean wave spectrum into an along-track interferometric synthetic aperture radar image spectrum. J. Geophys. Res. 2003, 108, 461–466. [Google Scholar] [CrossRef]
- Zhang, B.; Perrie, W.; He, Y.J. Remote sensing of ocean waves by along-track interferometric synthetic aperture radar. J. Geophys. Res. 2009, 114, C10015. [Google Scholar] [CrossRef] [Green Version]
- Bao, M.Q. A nonlinear integral transform between ocean wave spectra and phase image spectra of a cross-track interferometric SAR. In Proceedings of the IEEE 1999 International Geoscience and Remote Sensing Symposium, Hamburg, Germany, 28 June–2 July 1999; Volume 5, pp. 2619–2621. [Google Scholar]
- Schulz-Stellenfleth, J.; Lehner, S. Ocean wave imaging using an airborne single pass across-track interferometric synthetic aperture radar. IEEE Trans. Geosci. Remote Sens. 2001, 39, 38–45. [Google Scholar] [CrossRef]
- Schulz-Stellenfleth, J.; Horstmann, J.; Lehner, S.; Rosenthal, W. Sea surface imaging with an across track interferometric synthetic aperture radar: The SINEWAVE experiment. IEEE Trans. Geosci. Remote Sens. 2001, 39, 2017–2028. [Google Scholar] [CrossRef]
- Werner, M. Shuttle radar topography mission (SRTM)-mission overview. Frequenz 2001, 55, 3–4. [Google Scholar] [CrossRef]
- Lehner, S.; Gunther, H.; Horstmann, J.; Bao, M.Q.; Schulz-Stellenfleth, J. Joint along-across track interferometry of ocean waves. In Proceedings of the IEEE 2001 International Geoscience and Remote Sensing Symposium, Sydney, NSW, Australia, 9–13 July 2001; Volume 1, pp. 581–583. [Google Scholar]
- Siegmund, R.; Bao, M.Q.; Lehner, S.; Niedermeier, A.; Mayerle, R. Surface currents imaged with hybrid along and cross track interferometry. In Proceedings of the IEEE 2001 International Geoscience and Remote Sensing Symposium, Sydney, NSW, Australia, 9–13 July 2001; Volume 7, pp. 3146–3148. [Google Scholar]
- Siegmund, R.; Bao, M.Q.; Lehner, S.; Mayerle, R. First demonstration of surface currents imaged by hybrid along- and cross-track interferometric SAR. IEEE Trans. Geosci. Remote Sens. 2004, 42, 511–519. [Google Scholar] [CrossRef]
- Bao, M.Q.; Schulz-Stellenfleth, J.; Lehner, S.; Eineder, M. First results on ocean wave imaging from the shuttle radar topography mission. In Proceedings of the IEEE 2001 International Geoscience and Remote Sensing Symposium, Sydney, NSW, Australia, 9–13 July 2001; Volume 1, pp. 584–586. [Google Scholar]
- Gao, D.; Liu, Y.X.; Meng, J.M.; Jia, Y.J.; Fan, C.Q. Estimating significant wave height from SAR imagery based on an SVM regression model. Acta Oceanol. Sin. 2018, 37, 103–110. [Google Scholar] [CrossRef]
- Yang, L.; Xu, Y.S.; Zhou, X.H.; Zhu, L.; Jiang, Q.F.; Sun, H.W.; Chen, G.; Wang, P.L.; Mertikas, S.P.; Fu, Y.G.; et al. Calibration of an Airborne Interferometric Radar Altimeter over the Qingdao Coast Sea, China. Remote Sens. 2020, 12, 1651. [Google Scholar] [CrossRef]
- Sun, D.Z.; Zhang, Y.M.; Wang, Y.H.; Chen, G.; Sun, H.W.; Yang, L.; Bai, Y.N.; Yu, F.J.; Zhao, C.F. Ocean wave inversion based on airborne IRA images. IEEE Trans. Geosci. Remote Sens. 2022, 60, 1001013. [Google Scholar] [CrossRef]
- Romeiser, R. Current Measurements by Airborne Along-Track InSAR: Measuring Technique and Experimental Results. IEEE Trans. Geosci. Remote Sens. 2002, 30, 552–569. [Google Scholar] [CrossRef]
- Romeiser, R.; Runge, H.; Suchandt, S.; Kahle, R.; Rossi, C.; Bell, P.S. Quality assessment of surface current fields from TerraSAR-X and TanDEM-X along-track interferometry and doppler centroid analysis. IEEE Trans. Geosci. Remote Sens. 2013, 52, 2759–2772. [Google Scholar] [CrossRef] [Green Version]
- Gabriel, A.K.; Goldstein, R.M. Crossed orbit interferometry: Theory and experimental results from SIR-B. Int. J. Remote Sens. 1988, 9, 857–872. [Google Scholar] [CrossRef]
- Lin, Q.; Vesecky, J.F.; Zebker, H.A. New approaches in interferometic SAR data processing. IEEE Trans. Geosci. Remote Sens. 1992, 30, 560–567. [Google Scholar] [CrossRef]
- Stone, S.; Orchard, M.T.; Chang, E.C.; Martucci, S.A. A fast direct Fourier-based algorithm for subpixel registration of images. IEEE Trans. Geosci. Remote Sens. 2002, 39, 2235–2243. [Google Scholar] [CrossRef] [Green Version]
- Rabus, B.; Eineder, M.; Roth, A.; Bamler, R. The shuttle radar topography mission—A new class of digital elevation models acquired by spaceborne radar. ISPRS J. Photogramm. 2003, 57, 241–262. [Google Scholar] [CrossRef]
- Fritz, T.; Rossi, C.; Yague-Martinez, N.; Rodriguez, F. Interferometric processing of TanDEM-X data. In Proceedings of the 2011 IEEE International Geoscience and Remote Sensing Symposium, Vancouver, BC, Canada, 24–29 July 2011; pp. 2428–2431. [Google Scholar] [CrossRef]
- Ouchi, K.; Maedoi, S.; Mitsuyasu, H. Determination of ocean wave propagation direction by split-look processing using JERS-1 SAR data. IEEE Trans. Geosci. Remote Sens. 1999, 37, 849–855. [Google Scholar] [CrossRef]
- Bao, M.Q.; Alpers, W. On the cross spectrum between individual-look synthetic aperture radar images of ocean waves. IEEE Trans. Geosci. Remote Sens. 1998, 36, 922–932. [Google Scholar]
Figure 1.
Schematic of the hybrid interferometry geometry.

Figure 2.
(a) The geolocations of the TerraSAR-X and TanDEM-X images used in this paper nearby Pentland Firth, north of mainland Scotland; (b) the four subareas in the images for ocean wave inversion used in this paper, and the red, yellow, green, and purple boxes represent A1, A2, A3, and A4, respectively; (c) the blue dot is the location of the airborne IRA experiment; (d) the SAR image locations of the airborne IRA experiment, and the green arrow denotes the wind direction.

Figure 3.
(a) The intensity of the master image corresponding to TerraSAR-X; (b) the intensity of the slave image corresponding to TanDEM-X; (c) the intensity of the master image corresponding to M920; (d) the intensity of the slave image corresponding to M920.
Figure 3.
(a) The intensity of the master image corresponding to TerraSAR-X; (b) the intensity of the slave image corresponding to TanDEM-X; (c) the intensity of the master image corresponding to M920; (d) the intensity of the slave image corresponding to M920.


Figure 4.
The reference data used in this paper: (a) A map of the SWHEC of the sea area around Britain at 06:41 on 19 March 2012. The purple dot in the figure indicates the location corresponding to the satellites SAR images. (b) The in situ sea surface elevation data measured by a GNSS buoy. (c,d) Ocean wave spectra measured by a GNSS buoy corresponding to M920 and M3120, respectively. (e,f) Orbital velocity spectra measured by a GNSS buoy corresponding to M920 and M3120, respectively.

Figure 5.
The correlation coefficients between the TerraSAR-X image and the TanDEM-X image in A4 (a) and the interferogram in A4 (b).
Figure 5.
The correlation coefficients between the TerraSAR-X image and the TanDEM-X image in A4 (a) and the interferogram in A4 (b).

Figure 6.
The variations in σTN and σSAR with the increasing in the NL: (a) column 700; (b) column 2200.
Figure 6.
The variations in σTN and σSAR with the increasing in the NL: (a) column 700; (b) column 2200.

Figure 7.
(a) The interferogram of the TerraSAR-X and TanDEM-X images; (b) the flat earth phase; (c) the interference phase after removing the flat earth phase, i.e., the interference phase caused by sea surface elevation and sea surface velocity; (d) the interference phase after removing the flat earth phase corresponding to the image in the blue box in (c).

Figure 8.
The retrieved sea surface profiles from the spaceborne hybrid InSAR images and airborne hybrid InSAR images: (a) A1; (b) A2; (c) A3; (d) A4; (e) M920; (f) M3120.
Figure 8.
The retrieved sea surface profiles from the spaceborne hybrid InSAR images and airborne hybrid InSAR images: (a) A1; (b) A2; (c) A3; (d) A4; (e) M920; (f) M3120.

Figure 9.
The cross-spectra of the TerraSAR-X images in A1, A2, A3, and A4: (a–d) the real parts of the TerraSAR-X images cross-spectra in A1, A2, A3, and A4, respectively; (e–h) the imaginary parts of the TerraSAR-X image cross-spectra in A1, A2, A3, and A4, respectively.
Figure 9.
The cross-spectra of the TerraSAR-X images in A1, A2, A3, and A4: (a–d) the real parts of the TerraSAR-X images cross-spectra in A1, A2, A3, and A4, respectively; (e–h) the imaginary parts of the TerraSAR-X image cross-spectra in A1, A2, A3, and A4, respectively.

Figure 10.
The spectra of the sea surface profiles: A1 (a); A2 (b); A3 (c); A4 (d); M920 (e); M3120 (f); (g,h) one-dimensional spectra retrieved and measured, and the blue lines are the one-dimensional spectra of the sea surface profile retrieved by using the airborne hybrid InSAR system and the red line is the one-dimensional ocean wave spectra measured by the GNSS buoy corrected by low-pass filter.

Figure 11.
The retrieved orbital velocities of ocean waves from the spaceborne hybrid InSAR images and airborne hybrid InSAR images: (a) A1; (b) A2; (c) A3; (d) A4; (e) M920; (f) M3120.
Figure 11.
The retrieved orbital velocities of ocean waves from the spaceborne hybrid InSAR images and airborne hybrid InSAR images: (a) A1; (b) A2; (c) A3; (d) A4; (e) M920; (f) M3120.


Figure 12.
The spectra of the orbital velocities of ocean waves: A1 (a); A2 (b); A3 (c); A4 (d); M920 (e); M3120 (f); (g,h) one-dimensional spectra orbital velocities of ocean waves retrieved and measured, and the blue lines are the one-dimensional spectra of the orbital velocities retrieved using the airborne hybrid InSAR system, and the red line is the one-dimensional orbital velocities spectra measured by the GNSS buoy corrected by low-pass filter.

Table 3.
The relative error (%) of the interference phase caused by phase noise with different looknumbers in the 700th and 2200th columns, respectively.
Table 3.
The relative error (%) of the interference phase caused by phase noise with different looknumbers in the 700th and 2200th columns, respectively.
| Column Number | NL = 10 | NL = 20 | NL = 40 | NL = 60 | NL = 80 | NL = 100 | NL = 120 | NL = 140 | NL = 160 |
|---|---|---|---|---|---|---|---|---|---|
| 700th | 25.76 | 13.45 | 9.15 | 7.81 | 6.90 | 6.16 | 5.77 | 5.47 | 5.18 |
| 2200th | 86.74 | 32.25 | 11.62 | 8.84 | 7.48 | 6.58 | 6.07 | 5.74 | 5.27 |
Table 4.
The ocean wave parameters retrieved from the spaceborne hybrid InSAR images and the SWHs provided by ECMWF.
Table 4.
The ocean wave parameters retrieved from the spaceborne hybrid InSAR images and the SWHs provided by ECMWF.
| Areas | A1 | A2 | A3 | A4 |
|---|---|---|---|---|
| λp | 210 m | 209 m | 292 m | 305 m |
| Direction | 100° | 100° | 230° | 230° |
| SWV | 0.57 m/s | 0.80 m/s | 0.56 m/s | 0.58 m/s |
| SWVSP | 0.46 m/s | 0.61 m/s | 0.13 m/s | 0.15 m/s |
| SWH | 0.79 m | 1.05 m | 0.64 m | 0.67 m |
| SWHSP | 0.75 m | 0.92 m | 0.32 m | 0.34 m |
| SWHEC | 0.74 m | 1.09 m | 0.87 m | 0.71 m |
Table 5.
The ocean wave parameters retrieved from the airborne hybrid InSAR images and m-measured by the GNSS buoy.
Table 5.
The ocean wave parameters retrieved from the airborne hybrid InSAR images and m-measured by the GNSS buoy.
| Parameters | M920 | M3120 | |
|---|---|---|---|
| SWV | IRA | 0.31 m/s | 0.32 m/s |
| Buoy | 0.64 m/s | 0.68 m/s | |
| SWVSP | IRA | 0.23 m/s | 0.23 m/s |
| Buoy | 0.64 m/s | 0.68 m/s | |
| SWH | IRA | 0.37 m | 0.38 m |
| Buoy | 0.33 m | 0.38 m | |
| SWHSP | IRA | 0.28 m | 0.29 m |
| Buoy | 0.33 m | 0.38 m | |
| SWHC | IRA | 0.39 m | 0.39 m |
| SWHSPC | IRA | 0.31 m | 0.32 m |
| Direction | IRA | 270° (Swell) | 270° (Swell) |
| Buoy | |||
| λp | IRA | 87.27 m (Swell) | 89.76 m (Swell) |
| Buoy | 70.69 m (Swell) 12.85 m (Wind waves) | 100.98 m (Swell) 17.67 m (Wind waves) | |
SWHC and SWHSPC denote the SWHs retrieved without considering the influence of squint angle.
Publisher’s Note: MDPI stays neutral with regard to jurisdictional claims in published maps and institutional affiliations. |
© 2022 by the authors. Licensee MDPI, Basel, Switzerland. This article is an open access article distributed under the terms and conditions of the Creative Commons Attribution (CC BY) license (https://creativecommons.org/licenses/by/4.0/).
Share and Cite
MDPI and ACS Style
Sun, D.; Wang, Y.; Xu, Z.; Zhang, Y.; Zhang, Y.; Meng, J.; Sun, H.; Yang, L. Ocean Wave Inversion Based on Hybrid Along- and Cross-Track Interferometry. Remote Sens. 2022, 14, 2793. https://doi.org/10.3390/rs14122793
AMA Style
Sun D, Wang Y, Xu Z, Zhang Y, Zhang Y, Meng J, Sun H, Yang L. Ocean Wave Inversion Based on Hybrid Along- and Cross-Track Interferometry. Remote Sensing. 2022; 14(12):2793. https://doi.org/10.3390/rs14122793
Chicago/Turabian StyleSun, Daozhong, Yunhua Wang, Zhichao Xu, Yanmin Zhang, Yubin Zhang, Junmin Meng, Hanwei Sun, and Lei Yang. 2022. "Ocean Wave Inversion Based on Hybrid Along- and Cross-Track Interferometry" Remote Sensing 14, no. 12: 2793. https://doi.org/10.3390/rs14122793
Note that from the first issue of 2016, this journal uses article numbers instead of page numbers. See further details here.